Rethinking Pocahontas: An Introduction to Native American Studies ...

Occupa on Overview
Native American Studies Occupa onsin San Diego-Chula Vista-Carlsbad, CA
Emsi Q3 2021 Data Set | www.economicmodeling.com
Occupa on Overview
Emsi Q3 2021 Data Set | www.economicmodeling.com

. . . . . . . . . . . . . . . . . . . . . . . . . . . . . . . . . . . . . . . . . . . . . . . . . . . . . . . . . . . . . . . . . . . . . . . . . . . . . . . . . . . . . . . . . . . . . . . . . . . . . . . . . . . . . . . . . . . . . . . . . . . . . . . . . . . . . . . . . . . . . . . . . . . . . . . . . . . . . . . . . . . . . .1
. . . . . . . . . . . . . . . . . . . . . . . . . . . . . . . . . . . . . . . . . . . . . . . . . . . . . . . . . . . . . . . . . . . . . . . . . . . . . . . . . . . . . . . . . . . . . . . . . . . . . . . . . . . . . . . . . . . . . . . . . . . . . . . . . . . . . . . . . . . . . . . . . . . . . . . . . . . . . . . . . . . . . .2
. . . . . . . . . . . . . . . . . . . . . . . . . . . . . . . . . . . . . . . . . . . . . . . . . . . . . . . . . . . . . . . . . . . . . . . . . . . . . . . . . . . . . . . . . . . . . . . . . . . . . . . . . . . . . . . . . . . . . . . . . . . . . . . . . . . . . . . . . . . . . . . . . . . . . . . . . . . . . . . . . . . . . .3
. . . . . . . . . . . . . . . . . . . . . . . . . . . . . . . . . . . . . . . . . . . . . . . . . . . . . . . . . . . . . . . . . . . . . . . . . . . . . . . . . . . . . . . . . . . . . . . . . . . . . . . . . . . . . . . . . . . . . . . . . . . . . . . . . . . . . . . . . . . . . . . . . . . . . . . . . . . . . . . . . . . . . .4
. . . . . . . . . . . . . . . . . . . . . . . . . . . . . . . . . . . . . . . . . . . . . . . . . . . . . . . . . . . . . . . . . . . . . . . . . . . . . . . . . . . . . . . . . . . . . . . . . . . . . . . . . . . . . . . . . . . . . . . . . . . . . . . . . . . . . . . . . . . . . . . . . . . . . . . . . . . . . . . . . . . . . .6
. . . . . . . . . . . . . . . . . . . . . . . . . . . . . . . . . . . . . . . . . . . . . . . . . . . . . . . . . . . . . . . . . . . . . . . . . . . . . . . . . . . . . . . . . . . . . . . . . . . . . . . . . . . . . . . . . . . . . . . . . . . . . . . . . . . . . . . . . . . . . . . . . . . . . . . . . . . . . . . . . . . . . .7
. . . . . . . . . . . . . . . . . . . . . . . . . . . . . . . . . . . . . . . . . . . . . . . . . . . . . . . . . . . . . . . . . . . . . . . . . . . . . . . . . . . . . . . . . . . . . . . . . . . . . . . . . . . . . . . . . . . . . . . . . . . . . . . . . . . . . . . . . . . . . . . . . . . . . . . . . . . . . . . . . . . . . .11
. . . . . . . . . . . . . . . . . . . . . . . . . . . . . . . . . . . . . . . . . . . . . . . . . . . . . . . . . . . . . . . . . . . . . . . . . . . . . . . . . . . . . . . . . . . . . . . . . . . . . . . . . . . . . . . . . . . . . . . . . . . . . . . . . . . . . . . . . . . . . . . . . . . . . . . . . . . . . . . . . . . . . .13
Contents
What is Emsi Data?
Report Parameters
Execu ve Summary
Jobs
Compensa on
Job Pos ng Ac vity
Demographics
Occupa onal Programs
Occupa on Overview
Emsi Q3 2021 Data Set | www.economicmodeling.com

What is Emsi Data?
Emsi data is a hybrid dataset derived from official government sources such as the US Census Bureau, Bureau of
Economic Analysis, and Bureau of Labor Sta s cs. Leveraging the unique strengths of each source, our data
modeling team creates an authorita ve dataset that captures more than 99% of all workers in the United States.
This core offering is then enriched with data from online social profiles, resumés, and job pos ngs to give you a
complete view of the workforce.
Emsi data is frequently cited in major publica ons such as The Atlan c, Forbes, Harvard Business Review, The New
York Times, The Wall Street Journal, and USA Today .
Occupa on Overview
Emsi Q3 2021 Data Set | www.economicmodeling.com 1

3 Occupa ons
1 MSA
Class of Worker
QCEW Employees, Non-QCEW Employees, and Self-Employed
The informa on in this report pertains to the chosen occupa ons and geographical area.
Report Parameters
19-3091 Anthropologists and Archeologists
25-4012 Curators
25-4013 Museum Technicians and Conservators
41740 San Diego-Chula Vista-Carlsbad, CA
Occupa on Overview
Emsi Q3 2021 Data Set | www.economicmodeling.com 2

San Diego-Chula Vista-Carlsbad,
CA is a hotspot for this kind of job.
The na onal average for an area
this size is 384* employees, while
there are 465 here.
Earnings are high in San Diego-
Chula Vista-Carlsbad, CA. The
na onal median salary for your
occupa ons is $54,085, compared
to $64,634 here.
Job pos ng ac vity is high in San
Diego-Chula Vista-Carlsbad, CA.
The na onal average for an area
this size is 12* job pos ngs/mo,
while there are 16 here.
Execu ve Summary
Aggressive Job Pos ng Demand Over a Deep Supply of Regional Jobs
*Na onal average values are derived by taking the na onal value for your occupa ons and scaling it down to account for the difference in
overall workforce size between the na on and San Diego-Chula Vista-Carlsbad, CA. In other words, the values represent the na onal average
adjusted for region size.
465
Jobs (2020)
$64,634
Compensa on
16
Job Pos ng Demand
Occupa on Overview
Emsi Q3 2021 Data Set | www.economicmodeling.com 3

Jobs
Regional Employment Is Higher Than the Na onal Average
An average area of this size typically has 384* jobs, while there are 465 here. This higher than average supply of jobs may make it
easier for workers in this field to find employment in your area.
*Na onal average values are derived by taking the na onal value for your occupa ons and scaling it down to account for the difference in
overall workforce size between the na on and San Diego-Chula Vista-Carlsbad, CA. In other words, the values represent the na onal average
adjusted for region size.
ASan Diego-ChulaVista-Carlsbad, CA
465 511 47 10.0%
A Na onal Average 384 420 36 9.4%
Region 2020 Jobs 2030 Jobs Change % Change
Occupa on Overview
Emsi Q3 2021 Data Set | www.economicmodeling.com 4

Regional Breakdown
Most Jobs are Found in the Museums, Historical Sites, and Similar Ins tu onsIndustry Sector
San Diego County, CA 465
County 2020 Jobs
Industry% of Occupa on in Industry
(2020)
A Museums, Historical Sites, and Similar Ins tu ons 33.6%
AManagement, Scien fic, and Technical Consul ngServices
19.9%
A Federal Government, Civilian 16.3%
A Scien fic Research and Development Services 10.0%
A Architectural, Engineering, and Related Services 4.7%
A Educa on and Hospitals (State Government) 4.3%
A Other 11.2%
Occupa on Overview
Emsi Q3 2021 Data Set | www.economicmodeling.com 5

Compensa on
Regional Compensa on Is 20% Higher Than Na onal Compensa on
For your occupa ons, the 2020 median wage in San Diego-Chula Vista-Carlsbad, CA is $64,634, while the na onal median wage
is $54,085.
Occupa on Overview
Emsi Q3 2021 Data Set | www.economicmodeling.com 6

Job Pos ng Ac vity
109 Unique Job Pos ngs
The number of unique pos ngs for this job
from Jan 2020 to Sep 2021.
41 Employers Compe ng
All employers in the region who posted for
this job from Jan 2020 to Sep 2021.
36 Day Median Dura on
Pos ng dura on is 5 days longer than what's
typical in the region.
*A hire is reported by the Quarterly Workforce Indicators when an individual's Social Security Number appears on a company's payroll and was
not there the quarter before. Emsi hires are calculated using a combina on of Emsi jobs data, informa on on separa on rates from the Bureau
of Labor Sta s cs (BLS), and industry-based hires data from the Census Bureau.
Anthropologists and Archeologists 12 10
Curators 2 3
Museum Technicians andConservators
1 5
Occupa onAvg Monthly Pos ngs (Jan 2020 - Sep
2021)Avg Monthly Hires (Jan 2020 - Sep
2021)
Occupa on Overview
Emsi Q3 2021 Data Set | www.economicmodeling.com 7
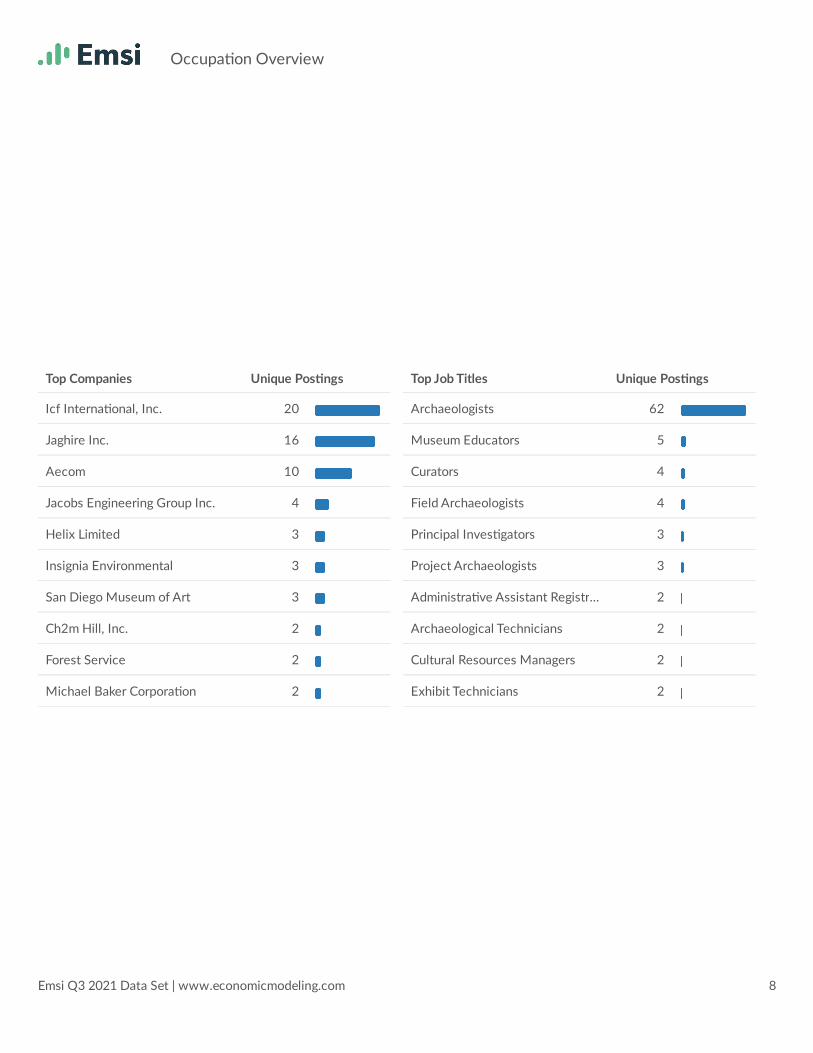
Icf Interna onal, Inc. 20
Jaghire Inc. 16
Aecom 10
Jacobs Engineering Group Inc. 4
Helix Limited 3
Insignia Environmental 3
San Diego Museum of Art 3
Ch2m Hill, Inc. 2
Forest Service 2
Michael Baker Corpora on 2
Top Companies Unique Pos ngs
Archaeologists 62
Museum Educators 5
Curators 4
Field Archaeologists 4
Principal Inves gators 3
Project Archaeologists 3
Administra ve Assistant Registrars… 2
Archaeological Technicians 2
Cultural Resources Managers 2
Exhibit Technicians 2
Top Job Titles Unique Pos ngs
Occupa on Overview
Emsi Q3 2021 Data Set | www.economicmodeling.com 8

Top Hard Skills
Frequency in Job Pos ngs Frequency in Profiles
0% 10% 20% 30% 40% 50% 60% 70%
Archaeology
Anthropology
Data Recovery
Na onal Historic Preserva on Act (NHPA)
Cultural Resource Management
Construc on
Historic Preserva on
Excava on
Environmental Planning
Adobe Photoshop
Archaeology 77 71% 122 38%
Anthropology 60 55% 33 10%
Data Recovery 46 42% 6 2%
Na onal Historic Preserva onAct (NHPA)
39 36% 8 2%
Cultural Resource Management 35 32% 37 11%
Construc on 27 25% 8 2%
Historic Preserva on 27 25% 24 7%
Excava on 23 21% 37 11%
Environmental Planning 21 19% 10 3%
Adobe Photoshop 20 18% 24 7%
Skills Pos ngs % of Total Pos ngs Profiles % of Total Profiles
Occupa on Overview
Emsi Q3 2021 Data Set | www.economicmodeling.com 9

Top Common Skills
Frequency in Job Pos ngs Frequency in Profiles
0% 10% 20% 30% 40% 50%
Wri en Communica on
Communica ons
Research
Valid Driver's License
Management
Planning
Wri ng
Microso Excel
Microso PowerPoint
Presenta ons
Wri en Communica on 62 57% 1 0%
Communica ons 61 56% 21 6%
Research 52 48% 95 29%
Valid Driver's License 45 41% 0 0%
Management 43 39% 48 15%
Planning 42 39% 11 3%
Wri ng 38 35% 45 14%
Microso Excel 27 25% 30 9%
Microso PowerPoint 26 24% 29 9%
Presenta ons 26 24% 13 4%
Skills Pos ngs % of Total Pos ngs Profiles % of Total Profiles
Occupa on Overview
Emsi Q3 2021 Data Set | www.economicmodeling.com 10

Re rement risk is low in San
Diego-Chula Vista-Carlsbad, CA.
The na onal average for an area
this size is 143* employees 55 or
older, while there are 117 here.
Racial diversity is high in San
Diego-Chula Vista-Carlsbad, CA.
The na onal average for an area
this size is 92* racially diverse
employees, while there are 156
here.
Gender diversity is about average
in San Diego-Chula Vista-Carlsbad,
CA. The na onal average for an
area this size is 279* female
employees, while there are 258
here.
Demographics
Re rement Risk Is Low, While Overall Diversity Is High
*Na onal average values are derived by taking the na onal value for your occupa ons and scaling it down to account for the difference in
overall workforce size between the na on and San Diego-Chula Vista-Carlsbad, CA. In other words, the values represent the na onal average
adjusted for region size.
Occupa on Age Breakdown
117
Re ring Soon
156
Racial Diversity
258
Gender Diversity
% of Jobs Jobs
A 14-18 0.3% 1
A 19-24 7.0% 33
A 25-34 28.7% 133
A 35-44 22.5% 104
A 45-54 16.3% 76
A 55-64 15.9% 74
A 65+ 9.4% 44
Occupa on Overview
Emsi Q3 2021 Data Set | www.economicmodeling.com 11

Occupa on Race/Ethnicity Breakdown
Occupa on Gender Breakdown
% of Jobs Jobs
A White 66.4% 309
A Hispanic or La no 16.2% 75
A Asian 9.5% 44
A Two or More Races 3.5% 16
A Black or African American 3.1% 15
A American Indian or Alaska Na ve 0.7% 3
A Na ve Hawaiian or Other Pacific Islander 0.4% 2
% of Jobs Jobs
A Males 44.4% 206
A Females 55.6% 258
Occupa on Overview
Emsi Q3 2021 Data Set | www.economicmodeling.com 12

Occupa onal Programs
30 Programs
Of the programs that can train for this job, 30
have produced comple ons in the last 5 years.
2,652 Comple ons (2020)
The comple ons from all regional ins tu ons
for all degree types.
50 Openings (2020)
The average number of openings for an
occupa on in the region is 247.
45.0101 Social Sciences, General 699
54.0101 History, General 561
50.0701 Art/Art Studies, General 394
40.0501 Chemistry, General 382
45.0201 Anthropology, General 249
45.0701 Geography 70
05.0299 Ethnic, Cultural Minority, Gender, and Group Studies, Other 57
05.0200 Ethnic Studies 38
05.0207 Women's Studies 38
50.0702 Fine/Studio Arts, General 31
CIP Code Top Programs Comple ons (2020)
Occupa on Overview
Emsi Q3 2021 Data Set | www.economicmodeling.com 13

San Diego State University 632
Palomar College 579
University of California-San Diego 474
California State University-San Marcos 165
San Diego Miramar College 143
Ashford University 120
Grossmont College 108
San Diego Mesa College 103
University of San Diego 76
MiraCosta College 60
Top Schools Comple ons (2020)
Occupa on Overview
Emsi Q3 2021 Data Set | www.economicmodeling.com 14

Appendix A - Data Sources and Calcula ons
Loca on Quo ent
Loca on quo ent (LQ) is a way of quan fying how concentrated a par cular industry, cluster, occupa on, or demographic group is
in a region as compared to the na on. It can reveal what makes a par cular region unique in comparison to the na onal average.
Occupa on Data
Emsi occupa on employment data are based on final Emsi industry data and final Emsi staffing pa erns. Wage es mates are based
on Occupa onal Employment Sta s cs (QCEW and Non-QCEW Employees classes of worker) and the American Community
Survey (Self-Employed and Extended Proprietors). Occupa onal wage es mates are also affected by county-level Emsi earnings
by industry.
Staffing Pa erns Data
The staffing pa ern data in this report are compiled from several sources using a specialized process. For QCEW and Non-QCEW
Employees classes of worker, sources include Occupa onal Employment Sta s cs, the Na onal Industry-Occupa on Employment
Matrix, and the American Community Survey. For the Self-Employed and Extended Proprietors classes of worker, the primary
source is the American Community Survey, with a small amount of informa on from Occupa onal Employment Sta s cs.
Cost of Living Data
Emsi's cost of living data is based on the Cost of Living Index published by the Council for Community and Economic Research
(C2ER).
Emsi Job Pos ngs
Job pos ngs are collected from various sources and processed/enriched to provide informa on such as standardized company
name, occupa on, skills, and geography.
Ins tu on Data
The ins tu on data in this report is taken directly from the na onal IPEDS database published by the U.S. Department of
Educa on's Na onal Center for Educa on Sta s cs.
Occupa on Overview
Emsi Q3 2021 Data Set | www.economicmodeling.com 15