National Waste Overview 2009
28
National Waste Overview 2009
Transcript of National Waste Overview 2009

National Waste Overview 2009


National Waste Overview 2009
National Waste Overview 2009 (November 2009)
© Copyright vests in the Commonwealth of Australia and each Australian State and Territory.
ISBN-10 (Print) 1-921173-50-5 ISBN-13 (Print) 978-1-921173-50-9
ISBN-10 (Electronic) 1-921173-51-3 ISBN-13 (Electronic) 978-1-921173-51-6
This work is copyright. It has been produced by the Environment Protection and Heritage Council (EPHC). Apart from any use as permitted under the Copyright Act 1968, no part may be reproduced by any process without prior permission from the NEPC Service Corporation. Requests and enquiries concerning reproduction and rights should be addressed to the Executive Officer, NEPC Service Corporation, Level 5, 81 Flinders Street, Adelaide SA 5000.
While reasonable efforts have been made to ensure that the contents of this publication are factually correct, the Environment Protection and Heritage Council does not accept responsibility for the accuracy or completeness of the contents, and shall not be liable for any loss or damage that may be occasioned directly or indirectly through the use of, or reliance on, the contents of this publication.
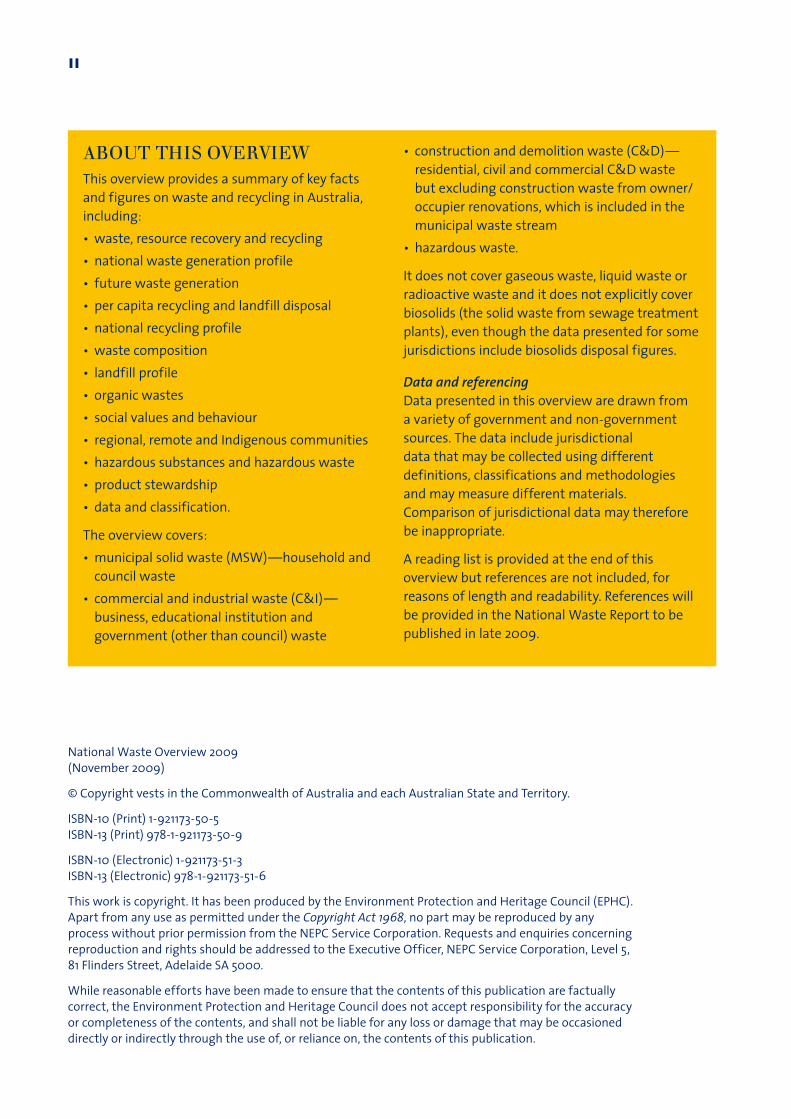
About this overviewThis overview provides a summary of key facts and figures on waste and recycling in Australia, including:• waste, resource recovery and recycling• national waste generation profile• future waste generation• per capita recycling and landfill disposal• national recycling profile• waste composition• landfill profile• organic wastes• social values and behaviour• regional, remote and Indigenous communities• hazardous substances and hazardous waste• product stewardship• data and classification.
The overview covers:• municipal solid waste (MSW)—household and
council waste• commercial and industrial waste (C&I)—
business, educational institution and government (other than council) waste
• construction and demolition waste (C&D)—residential, civil and commercial C&D waste but excluding construction waste from owner/occupier renovations, which is included in the municipal waste stream
• hazardous waste.
It does not cover gaseous waste, liquid waste or radioactive waste and it does not explicitly cover biosolids (the solid waste from sewage treatment plants), even though the data presented for some jurisdictions include biosolids disposal figures.
Data and referencingData presented in this overview are drawn from a variety of government and non-government sources. The data include jurisdictional data that may be collected using different definitions, classifications and methodologies and may measure different materials. Comparison of jurisdictional data may therefore be inappropriate.
A reading list is provided at the end of this overview but references are not included, for reasons of length and readability. References will be provided in the National Waste Report to be published in late 2009.
ii
iii
About this overview iiWaste, resource recovery and recycling in Australia 1National waste generation profile 2Projected waste generation 4Per capita recycling and landfill disposal 5National recycling profile 7Waste composition 9Landfill disposal profile 10Organic waste 12Social: values and behaviour 13Regional, remote and Indigenous communities 14Hazardous substances and hazardous waste 15Product stewardship 16Data and classification 17For further reading 19
Contents


1
wAste, resource recovery And recycling in AustrAliA
Key points• There have been major changes to the way society manages waste in the last two decades.• Recycling and waste generation have both increased in the last two decades.• The recycling and waste sector is valued at between $7 and $11.5 billion.
Waste generation, a combined measure of landfill disposal of waste plus recycling activity, is an indicator of the overall level of waste activity within the economy. Waste generation, resource recovery and landfill activity are commonly discussed in terms of the three main waste streams:• municipal solid waste (MSW)—mainly household
and council waste and some construction waste from owner/occupier renovations delivered directly to landfill
• commercial and industrial (C&I) waste—business, educational institution and government (other than council) waste
• construction and demolition (C&D) waste—residential, civil and commercial demolition waste.
There have been major changes in the amount of waste generated and the way waste has been managed since the last national waste strategy was agreed in 1992. Recycling has increased over the period from 1996–97, when around six per cent of solid waste was diverted from landfill, to 2002–03 with around 46 per cent diverted. By 2006–07, around 52 per cent of solid waste was diverted from landfill. Total waste generation has also increased by around 31 per cent from 2002–03 to 2006–07, while over the same period the population grew by 5.6 per cent. Recycling is thus a major waste management strategy and landfill continues to be important. More broadly, waste and how we manage it play a key role in the economy as well as in achieving environmental objectives, including on climate change.
The nature of waste in the three main waste streams has also changed. Waste is now more complex and includes more products and materials which contain hazardous substances. Strategies are needed to enable society to reduce contamination, improve recycling and increase the value obtained from waste.
The recycling and waste sector in Australia in 2006 was valued at between $7 billion and $11.5 billion.
This was about 1.2 per cent of the total Gross Domestic Product of Australia in 2006–07. Data indicate that there is a concentration in the market with 82 per cent being serviced by 50 companies.
Waste disposal and recycling contribute to jobs growth. In 2008, waste management and recycling directly employed almost 29 000 people (22 243 in recycling and 6695 in landfilling) and indirectly 24 308 (18 684 in recycling and 5624 in landfilling). Recycling provides 9.2 jobs per 10 000 tonnes of waste recycled, whereas landfill disposal provides 2.8 jobs per 10 000 tonnes of waste landfilled.
Recycling and waste management services are provided in most parts of Australia. However, there are some challenges and inefficiencies in the markets:• the number of approaches to the definition and
classification of waste, in particular hazardous and clinical waste, which affects how waste is regulated, managed, moved and tracked
• a lack of information and assurance in some jurisdictions relating to quality and quantity of supply of recycled and reprocessed materials and products
• a lack of agreed national specifications and guidance relating to acceptable levels of contamination for recovered resources to provide certainty to the market that the product is of a consistent, recognised standard
• procurement requirements that preclude the use of recovered materials
• issues of economies of scale and long distances for access to services and markets for regional areas
• the lack of opportunity for regional and remote communities to participate in recycling.
Addressing these challenges may improve investment, increase business opportunities, create jobs and help protect the environment while growing the economy.

2 national waste overview 2009
A range of factors can influence the quantity of waste generated and whether it is landfilled or recycled, including:• growth in the economy• increasing population levels, changing
demographics and size of households• changing patterns of consumption and whether
choices are made to minimise the generation of waste
• the potentially hazardous and increasingly complex nature of the waste stream which can increase the amount of contaminated waste that has to be treated or landfilled
• changing community expectations and aspirations• regulation and policy• availability of options for recycling and disposal.
Table 1 shows how much waste is generated and then how much is recycled and disposed to landfill, and is based on measured and estimated data. It also shows the different populations and areas of each jurisdiction.
There was a substantial increase of 11.4 million tonnes or 35 per cent over the amount of waste generated between 2002–03 (32.4 million tonnes) and 2006–07 (43.8 million tonnes). Some of that increase can be attributed to better and more extensive data collection. Correcting for those factors, waste generation in Australia increased by 31 per cent between 2002–03 and 2006–07.
nAtionAl wAste generAtion profile
Key point• 43 777 000 tonnes of waste were generated in Australia in 2006–07.
Table 1: Estimated waste diversion and disposal rates, 2006–07
State/ territory
Total generated (tonnes)
Disposed (tonnes)
Recycled (tonnes)
Diversion rate (tonnes)
Population and % of total population
Land area (square kms)
NSW 15 360 000 7 365 000 7 995 000 52% 6 888 000 (37%) 800 642Vic 10 285 000 3 925 000 6 360 000 62% 5 205 000 (28%) 227 416Qld 8 081 000 4 302 000 3 779 000 47% 4 181 000 (20%) 1 730 648WA 5 247 000 3 539 000 1 708 000 33% 2 106 000 (10%) 2 529 875SA 3 318 000 1 144 000 2 173 000 66% 1 584 000 (8%) 983 482Tas 521 000 446 000 75 000 – 493 000 (2%) 68 401ACT 784 000 197 000 587 000 75% 340 000 (2%) 2 358NT 181 000 151 000 30 000 – 215 000 (1%) 1 349 129Total 43 777 000 21 069 000 22 707 000 52% 21 015 000 7 692 024
Note 1: There are differences between jurisdictional definitions, classifications and methodologies for measuring waste data which may also cover different materials. Comparative use of these data may therefore be inappropriate and should only be done with caution.Note 2: Gaps in the Tasmanian and Northern Territory recycling data for MSW, C&I and C&D waste mean it is not possible to provide diversion rates for these jurisdictions. NT data are for Darwin City Council’s MSW and the 30 000 recycling figure is the quantity of green waste generated in cubic metres.Note 3: New data for the Northern Territory for the period 2006–07 were identified in November 2009 but time did not allow these data to be incorporated into this document. The new data show that total waste generated in the NT was 374 000 tonnes, waste disposed was 361 000 tonnes and waste recycled was 13 000 tonnes (all of which was derived from MSW and excludes listed wastes).Note 4: Figures for Victoria represent the amount of waste accepted at licensed Victorian landfills, excluding material used as cover. These figures from Victoria were calculated by taking the tonnes of material received at landfills (including cover material sourced off site) and reducing this by 15 per cent to allow for cover material. Likewise, figures for cover material are excluded from figures for Tasmania.

3
Figure 1 summarises the contribution of each of the three main waste streams (MSW, C&I and C&D) to the 43 777 000 tonnes of waste generated in Australia in 2006–07. The C&I and C&D waste streams together account for 2.4 times the amount of waste as MSW.
Figure 1: National waste generation by source, 2006–07

4 national waste overview 2009
Simple projections of growth in waste generation, recycling and landfill disposal to 2020–21, based on characteristics in 2006–07, show Australia:• generating 81 072 593 tonnes of waste—an
increase of over 85 per cent on 2006–07 levels• recycling 52 per cent of that waste
(42 157 748 tonnes)• sending 48 per cent to landfill (38 914 845 tonnes).
Comparative waste generation trends from 2006–07 to 2020–21 are shown in Figure 2. These simple projections are used to illustrate the possible magnitude of increasing volumes of generated waste which will increase demands on recycling and landfilling infrastructure.
Projections in Figure 2 are based on growth in waste generation of 4.5 per cent per year (including the contribution from 1.5 per cent a year population growth), and maintenance of 2006–07 recycling rates (52 per cent recycling). The simple projections
assume recycling rates will remain unchanged over this period; however, most jurisdictions have policies which aim to increase recovery rates. The projections also do not factor in potential variations in economic growth over the period, nor do they allow for an increase in waste avoidance through green design, cleaner production or other methods.
The top line in Figure 2, which represents 7 per cent growth in waste generation per year, can be considered a high-end estimate of waste growth trends. However, it is in line with the actual trend line between 2002–03 and 2006–07. A growth rate of 4.5 per cent per year would represent a slowing in the growth trend of waste generation.
Recycling rates may rise above 52 per cent, including as a result of the uptake of alternative waste treatment facilities, but strong growth in generation makes large improvements in recycling rates challenging.
projected wAste generAtion
Key point• If waste generation grows at 4.5 per cent per year Australia will generate 81 072 593 tonnes of waste
in 2020–21.
Figure 2: Comparative waste generation 2006–07 to 2020–21

5
Different populations, patterns of settlement, mixes of industry and economic activity mean that each state and territory has a range of factors which influence waste generation and recycling.
Table 2 shows the per capita amounts of waste generated, recycled and disposed of to landfill, for each jurisdiction.
Based on these data, Figure 3 shows how much material was recycled per person in NSW, Victoria, Queensland, Western Australia, South Australia
and the Australian Capital Territory for 2006–07, in kilograms, based on measured and estimated data.
Per capita recycling data is presented for each of the three main waste streams (MSW, C&I and C&D) in Figure 4. This shows that nationally, and for NSW, Victoria, and South Australia, the C&D waste stream makes the largest contribution to per capita recycling tonnages. In the ACT the MSW stream is the largest contributor to recycling tonnages.
per cApitA recycling And lAndfill disposAl
Key point• Australia generated around 2080 kg of waste per person (2.08 tonnes) in 2006–07, of which 1080 kg of
material was recycled per person.
Table 2: Per capita waste generation, recycling and landfill disposal, 2006–07
State/territory
Total generated Disposed RecycledDiversion rate
% of total population % of land areaKilograms per person
NSW 2230 1070 1160 52% 37% 10.41%Vic 1980 750 1220 62% 28% 2.96%Qld 1930 1030 900 47% 20% 22.50%WA 2490 1680 810 33% 10% 32.89%SA 2090 720 1370 66% 8% 12.79%ACT 2310 580 1730 75% 2% 0.03%Tas – – – – 2% 0.89%NT – – – – 1% 17.54%Total 2080 1000 1080 52%
Note 1: There are differences between jurisdictional definitions, classifications and methodologies for measuring waste data which may also cover different materials. Comparative use of these data may therefore be inappropriate and should only be done with caution.Note 2: Insufficient data on recycling and generation were available for Tasmania and the Northern Territory (NT) at the time the Hyder Report ‘Waste and Recycling in Australia’ was compiled in 2008 and then revised in 2009. New data for the NT for the period 2006–07 were identified in November 2009 but time did not allow these data to be incorporated into this document. The new data show that per person total waste generated in the NT was 1740 kilograms with 1680 kg disposed to landfill and 60 kg recycled, giving a diversion rate of 3.5 per cent.Note 3: Figures for Victoria represent the amount of waste accepted at licensed Victorian landfills, excluding material used as cover. These figures from Victoria were calculated by taking the tonnes of material received at landfills (including cover material sourced off site) and reducing this by 15 per cent to allow for cover material.

6 national waste overview 2009
Figure 3: Recycling per person (kg), 2006–07
Figure 4: Recycling per person by source (kg), 2006–07

7
Table 3 shows the quantities of materials recycled from each waste stream in each state and territory.
Recycled materials collected through kerbside recycling can be contaminated by hazardous and non-hazardous articles and materials. The extent of contamination lies between 3 and 11 per cent. Each year, this results in recyclable material being landfilled.
Recycling can provide a range of environmental benefits such as reducing greenhouse gas emissions, water and energy use. For example, in 2006 recycling in Australia was estimated to
reduce greenhouse emissions (8.8 Mt CO2-e), save energy (202 TJ), reduce water use (134 GL), and conserve resources (e.g. 4 Mt of iron ore). Table 4 summarises the benefits of recycling different types of waste materials.
For recycling to be environmentally beneficial on a whole-of-life cycle basis, the impacts associated with materials collection and reprocessing need to be offset by the benefits associated with material recovery and avoided consumption of landfill capacity.
nAtionAl recycling profile
Key points• In 2006–07, 22 707 000 tonnes of Australia’s waste or 52 per cent was recycled.• Of the 22 707 000 tonnes recycled in 2006–07:
– 42 per cent was from the construction and demolition waste stream– 36 per cent was from the commercial and industrial waste stream, and– 22 per cent was from the municipal waste stream.
Table 3: Recycling by jurisdiction and stream, 2006–07
State/ territory
Recycled (tonnes)Municipal C&I C&D Total
NSW 1 483 000 2 297 000 4 216 000 7 995 000Vic 1 056 000 2 357 000 2 946 000 6 360 000Qld 1 365 000 1 797 000 617 000 3 779 000WA 408 000 891 000 409 000 1 708 000SA 408 000 610 000 1 155 000 2 173 000ACT 278 000 102 000 206 000 587 000Tas 53 000 22 000 – 75 000NT 30 000 – – 30 000Australia 5 082 000 8 076 000 9 549 000 22 707 000
Note 1: There are differences between jurisdictional definitions, classifications and methodologies for measuring waste data which may also cover different materials. Comparative use of these data may therefore be inappropriate and should only be done with caution.Note 2: NT data are for Darwin City Council’s MSW and the 30 000 recycling figure is the quantity of green waste generated in cubic metres. A revised figure of 13 000 tonnes for recycled municipal waste for the NT as a whole was provided in November 2009.

8 national waste overview 2009
Table 4: Net benefit of recycling 1 tonne of waste material (positive values are benefits, negative values are impacts)
MaterialsGlobal warming tonnes
CO2-eEnergy gigajoules
(low heating value) Water in kilolitresAluminium 15.85 171.10 181.77Concrete 0.02 0.28 1.28Cardboard/paper recycling 0.06 9.32 25.41Food and garden organics 0.25 0.18 0.44Glass 0.56 6.07 2.30Mixed Plastics 1.53 58.24 –11.37

9
A range of organic and inorganic materials is found in waste. Table 5 presents Victorian data as an example of the materials that are found in one of the three waste streams—MSW.
The materials in waste streams differ between states and territories because of factors such as different mixes of industry. In 2006–07, Western Australia diverted 78 per cent of MSW metals by recycling 78 000 tonnes and sent 22 000 tonnes
to landfill. Data for several jurisdictions across the three waste streams (MSW, C&I and C&D) indicate that recycling rates are highest for paper and cardboard, glass and some metals.
Table 6 shows that nationally, 72 per cent of MSW disposed to landfill in Australia is organic material, which generates methane (a potent greenhouse gas) as it decomposes under anaerobic conditions.
wAste composition
Key point• Organic material made up 72 per cent of the municipal solid waste sent to landfill in Australia
in 2006–07.
Table 5: Victoria, materials in municipal waste, 2006–07 (tonnes)
Material Disposed Recycled Generated Recycling ratePaper/cardboard 171 000 230 000 401 000 57%Plastic (codes 1–3) 50 000
39 000 165 000 31%Other plastic 76 000Glass 117 000 168 000 285 000 59%Metals 123 000 190 000 313 000 61%Food waste 658 000 2000 660 000 0%Garden waste 307 000 278 000 585 000 47%Wood/timber 111 000 5000 116 000 4%Other organic 55 000 1000 56 000 3%Clean excavated materials 20 000 UnknownConcrete, bricks, asphalt 20 000 138 000 158 000 88%Textiles <1000 7000Other 20 000 <1000Total 1 727 000 1 056 000 2 783 000 38
Table 6: Materials composition of Australian waste to landfill, by stream (%)
MaterialMunicipal
solid waste %Commercial &
industrial waste %Construction &
demolition waste %Food 35 21.5 0Paper and paper board 13 15.5 3Garden and park 16.5 4 2Wood and wood waste 1 12.5 6Textiles 1.5 4 0Sludge 0 1.5 0Nappies 4 0 0Rubber and leather 1 3.5 0Inert waste (including concrete, metal, plastic and glass) 28 37.5 89

10 national waste overview 2009
In 2006–07, 21 069 000 tonnes of waste went to landfill, which was 48 per cent of all waste generated. The contribution of each waste stream (MSW, C&I and C&D) to the waste landfilled is shown in Figure 5. It is estimated that there are at least 665 operating landfills in Australia.
Table 7 shows the amounts of waste that was landfilled for each jurisdiction. Based on these data, Figure 6 provides a per capita breakdown of waste to landfill, by stream and jurisdiction.
Landfill is likely to remain a key component of waste management in Australia. Taking into account growth in waste generation and resource recovery, modelling undertaken in 2009 shows that there is likely to be sufficient physical landfill capacity in the future for most of Australia’s major population centres.
lAndfill disposAl profile
Key points• 48 per cent of Australian waste was landfilled in 2006–07.• Australia has sufficient, unused physical landfill capacity in most of the larger urban centres but this
may be constrained by social and environmental factors.• Landfill standards in Australia have improved in the past 20 years, but controls could be further
improved, particularly for small-to-medium sized landfills.
Table 7: Waste landfilled by jurisdiction and stream, 2006–07
JurisdictionLandfill (tonnes)
MSW C&I C&D TotalNSW 2 408 000 2 921 000 2 036 000 7 365 000Vic 1 727 000 1 060 000 1 138 000 3 925 000Qld 1 735 000 1 101 000 1 466 000 4 302 000WA 1 015 000 585 000 1 939 000 3 539 000SA 344 000 496 000 304 000 1 144 000ACT 85 000 91 000 21 000 197 000Tas 287 000 145 000 14 000 446 000NT 44 000 57 000 51 000 151 000Australia 7 645 000 6 456 000 6 968 000 21 069 000
Note 1: There are differences between jurisdictional definitions, classifications and methodologies for measuring waste data which may also cover different materials. Comparative use of these data may therefore be inappropriate and should only be done with caution.Note 2: NT data are for Darwin City Council’s MSW and recent data for the Territory indicate a total generation rate of 361 000 tonnes or 1679 kg per person.Note 3: Figures for Victoria represent the amount of waste accepted at licensed Victorian landfills, excluding material used as cover. These figures from Victoria were calculated by taking the tonnes of material received at landfills (including cover material sourced off site) and reducing this by 15 per cent to allow for cover material. Likewise, cover materials are excluded from figures for Tasmania.
Figure 5: Total waste to landfill by waste stream, 2006–07

11
The main constraints on landfill capacity, especially for those wastes which contain hazardous substances, are social (community acceptance), environmental and institutional. This may be the case in areas where physical landfill space is also constrained.
There have been major improvements since 1992 in the standards applied to landfills. Most large, modern landfills have in place a range of measures to protect health and the environment. Around 73 per cent of Australia’s landfilled waste goes to large landfills which are generally located close to the major urban centres and which mostly have good controls.
Approximately 27 per cent of all landfilled waste is sent to small-to-medium sized landfills. These findings are from the 2009 survey of 665 landfills by the Waste Management Association of Australia (WMAA), to which there were 321 responses. This survey also shows that some of these may be less well equipped to manage the hazardous components of the various waste streams. Figure 7 presents a snapshot of selected indicators for different sized landfills based on results from the WMAA survey. There were at least 14 landfill fires over the last five years, 64 per cent of which were at small-to-medium sized landfills. This survey indicates that many small (remote and regional) landfills may be unlined. Also, in most remote communities the landfills are not managed on a daily basis.
Figure 6: Landfill per capita by stream (kg), 2006–07
Figure 7: Comparison of environmental indicators for small-to-medium (<100 000 tonnes) and larger landfills (>100 000 tonnes)

12 national waste overview 2009
Organic waste can include food waste, cardboard, paper, wood, green waste, sewage sludge and other putrescible waste. In 2006–07, an estimated 20.06 million tonnes of organic waste were generated, of which 6.4 million tonnes were diverted (see Figure 8) and 13.6 million tonnes were sent to landfill. Organic waste comprises 62 per cent of all waste landfilled.
In 2006–07, organic waste represented 7.1 million tonnes of landfilled MSW, 4.9 million tonnes of landfilled C&I waste and 1.6 million tonnes of landfilled C&D waste.
Within the waste streams, 23 per cent of MSW organics are recovered, 46 per cent of C&I organics are recovered and 12 per cent of C&D organics are recovered.
There is considerable scope for further organics recovery from the MSW, C&I and C&D waste streams. An estimated 2.3 million tonnes of paper and cardboard were recovered in 2006–07, mostly from the MSW and C&I streams.
The viability of recovering and recycling organic waste will depend on the establishment of markets for the recycled product, which in turn will require products that meet efficacy and quality standards. Contamination of organic waste by other wastes presents a challenge because it increases the level of waste that has to be disposed, increases processing costs and decreases the market value of products like composts and soil conditioners.
Organic waste decomposes in landfills to produce landfill gas which consists of about 55 per cent methane. Methane has a global warming potential 21–25 times that of carbon dioxide, assessed over a 100 year timeframe. Reducing the amount of organic waste going to landfill will assist in reducing greenhouse emissions.
The solid waste or landfill sector accounted for 11 Mt CO2–e of greenhouse gas emissions in 2008 and is projected to also be at around 11 Mt CO2–e in 2020, assuming the introduction of a national Carbon Pollution Reduction Scheme. The projections are based on increasing diversion of organic waste from landfill and increasing landfill gas capture, which is predicted to grow at a rate of 2.3 per cent per annum.
Most major urban landfills capture landfill gas although many small to medium sized landfills do not. Landfill gas, once captured, can be transferred, flared, or used in energy generation. As at 2007, there were 58 landfill gas generation plants in Australia with a capacity totaling 165.3 MW.
orgAnic wAste
Key points• When MSW, C&I waste and C&D waste are combined, organic waste is 62 per cent of total waste
disposed to landfill.• 33 per cent of available organic waste is recycled.
Figure 8: National organics recovery

13
In 2006, 99 per cent of Australian households engaged in some form of re-use or recycling, compared with 91 per cent in 1996. This increase in engagement is in part a product of an increase in concern about environmental problems during the period between 2004 and 2006, as shown in Figure 9. The items most commonly recycled or re-used at home were paper/cardboard, plastic bottles and glass, all of which were collected through kerbside services available to at least 90 per cent of households (though not all types of these materials, such as some types of plastic, are covered by all these services).
Australian Bureau of Statistics data over several years show that garden waste is recycled by 66 per cent of Australian households and 48 per cent recycle kitchen or food waste.
Hazardous waste items generated in households are generally disposed of through the usual garbage collection especially in those jurisdictions and council areas which do not have household chemical collections. In contrast, batteries, oil and tyres are more likely to be disposed of through a business or shop, while mobile phones are often given away, sold or recycled. Most people, 68 per cent, were
unaware of hazardous waste disposal services and facilities in their area.
A national survey of employees found that only 52 per cent of people have access at their workplace to recycling facilities for plastic, steel/aluminium cans and glass. Around 80 per cent of employees would like to see more recycling bins for plastic packaging and paper in the workplace, and 92 per cent of people want more recycling bins in places like parks and shopping areas.
Litter is a visible consequence of various factors including the inappropriate behaviour of consumers and the mismanagement of waste, and it has a number of potential environmental, social and economic impacts. The National Litter Index Annual Report 2008/09 highlights a decline in national litter levels. Between 2006–07 and 2008–09, the average number of items littered in Australia decreased from 74 to 63 per 1000m2. Similarly the average volume of litter decreased from 9.68 to 7.73 litres per 1000m2.
All levels of government, community organisations and some businesses undertake activities that manage litter, including enforcement, education, awareness raising and clean-up activities.
sociAl: vAlues And behAviour
Key points• 99 per cent of households undertake recycling.• 80 per cent of employees would like to see more recycling in the workplace.• Lack of information, facilities and services present barriers to additional recycling.• National litter levels are trending downwards.
Figure 9: Percentage of Australians concerned about environmental problems, 1992 to 2007–08

14 national waste overview 2009
Almost one third of Australians live outside the major metropolitan areas in regional, remote and Indigenous communities. In most regional areas, responsibility for waste management falls to local government, which must handle waste that is of a similar nature, complexity and hazard to that in urban areas.
Areas with dispersed or low populations cannot obtain the economies of scale necessary for resource recovery and recycling. Equally, funding and maintaining waste management infrastructure and basic equipment can be challenging.
Around 30 per cent of landfills across Australia accept less than 10 000 tonnes per year and only 10 per cent have a capacity greater than 100 000 tonnes per year. Most small-to-medium sized landfills are found in regional and remote areas. Their size, scale, geography and location mean that they may not be suitable for retrofitting with gas capture and often they do not have liners or leachate management. Proper siting and management of landfill facilities in remote communities is particularly important to avoid health, safety, amenity and other environmental problems that can occur if, for example, landfill is sited close to groundwater bores that provide communities’ drinking water.
In remote and very remote communities, service delivery may be difficult and intermittent. The availability of suitable disposal for certain materials, in particular hazardous waste, can be limited. It can therefore be difficult to appropriately dispose of cooking oil, used motor oil, fluorescent lights and tubes, lead-acid batteries, paints, tyres, end-of-life motor vehicles, scrap metals, rainwater tanks, septic tanks, e-waste, and chemical containers.
A 2006 Australian Bureau of Statistics survey identified 1187 discrete Indigenous communities and many of these are remote. Table 8 highlights that over 90 per cent of these communities have organised rubbish collection but there can be particular challenges with waste management services including governance, workforce, planning and tenure.
Small-scale technologies are becoming available that are suitable for local or regional waste streams, in particular for handling C&D waste and organics. Depending on the quantity of waste available, these can include mobile concrete and glass crushing plants, re-use of timber mulch for landfill cover, and waste-to-energy plants that use organic waste as feedstock.
regionAl, remote And indigenous communities
Key points• Almost 33 per cent of Australians live in regional and remote Australia and about 30 per cent of waste
is sent to landfills which service these areas.• There are particular challenges in providing recycling and waste management services to regional,
remote and Indigenous communities.
Table 8: Rubbish disposal in discrete Indigenous communities by State or Territory, 2006
Jurisdiction
Fenced community
tip
Unfenced community
tip
Rubbish tip outside
community land Burnt
Other type of rubbish
disposal
No organised rubbish
disposal* TotalNSW 3 1 13 – 1 4 57Vic/Tas – – 1 1 1 – 3Qld 22 37 31 18 5 – 124SA 29 22 23 1 – 2 91WA 48 138 39 8 – 10 271NT 54 373 106 9 26 13 641Australia 156 571 213 37 32 29 1187
* Data not collected in ‘administered’ communities with a population of less than 50 people.
15
Hazardous substances and hazardous wastes are defined by international instruments and domestic regulation including the United Nations hazard classification system, the Basel Convention, the Stockholm Convention and also by Commonwealth, state and territory regulation. A hazardous waste refers to a substance or object that exhibits hazardous characteristics and is no longer fit for its intended use, requiring disposal.
Hazardous wastes can include:• a chemical by-product of an industrial process• a discarded article such as a battery containing
a hazardous chemical or metal such as lead or mercury
• used oil• discarded household chemicals• biological wastes.
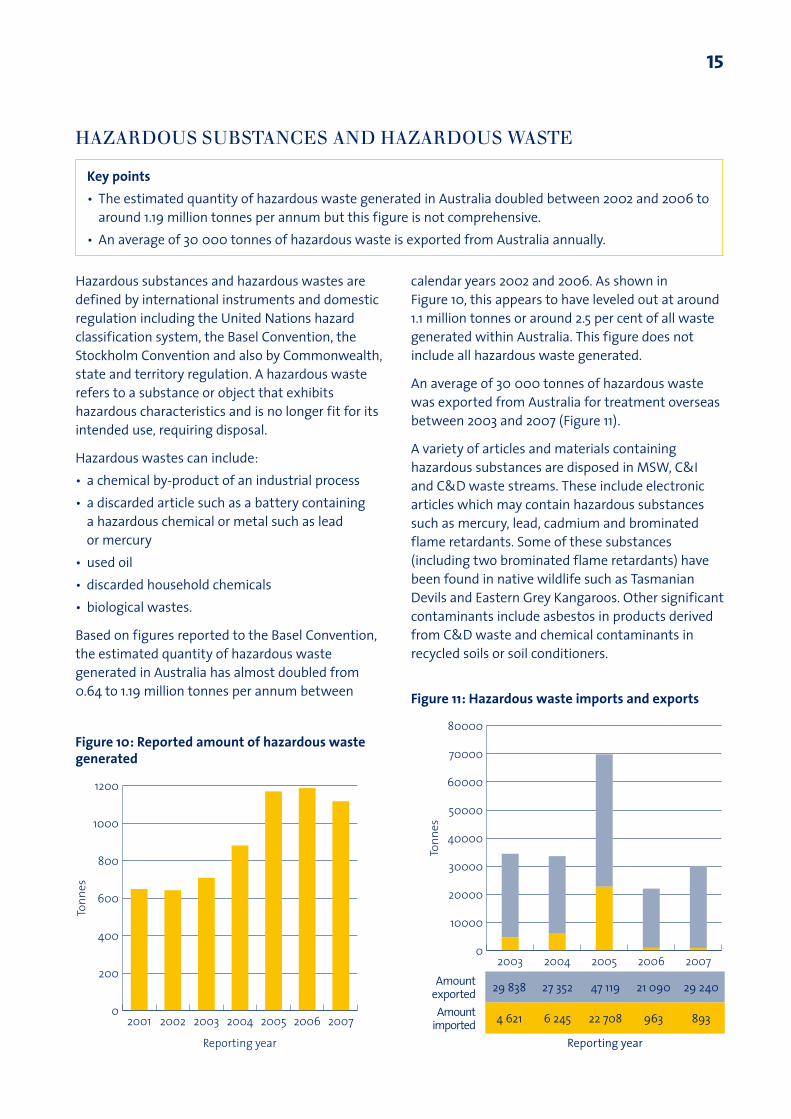
Based on figures reported to the Basel Convention, the estimated quantity of hazardous waste generated in Australia has almost doubled from 0.64 to 1.19 million tonnes per annum between
calendar years 2002 and 2006. As shown in Figure 10, this appears to have leveled out at around 1.1 million tonnes or around 2.5 per cent of all waste generated within Australia. This figure does not include all hazardous waste generated.
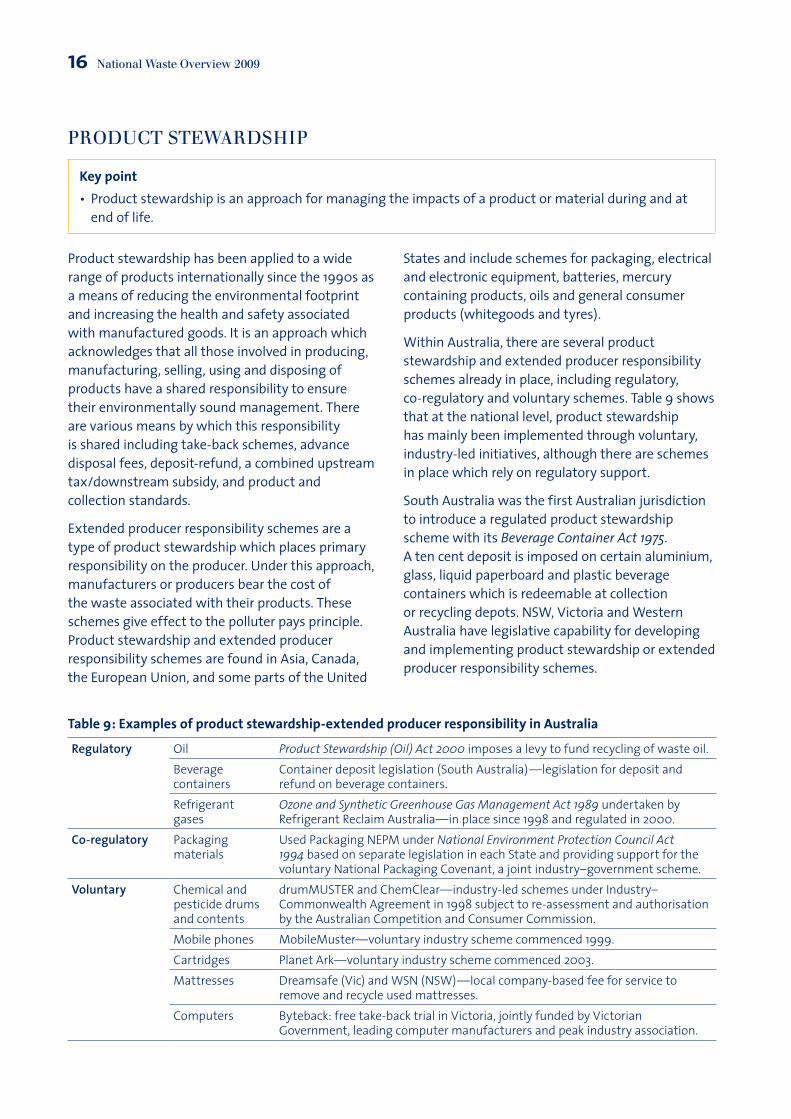
An average of 30 000 tonnes of hazardous waste was exported from Australia for treatment overseas between 2003 and 2007 (Figure 11).
A variety of articles and materials containing hazardous substances are disposed in MSW, C&I and C&D waste streams. These include electronic articles which may contain hazardous substances such as mercury, lead, cadmium and brominated flame retardants. Some of these substances (including two brominated flame retardants) have been found in native wildlife such as Tasmanian Devils and Eastern Grey Kangaroos. Other significant contaminants include asbestos in products derived from C&D waste and chemical contaminants in recycled soils or soil conditioners.
hAzArdous substAnces And hAzArdous wAste
Key points• The estimated quantity of hazardous waste generated in Australia doubled between 2002 and 2006 to
around 1.19 million tonnes per annum but this figure is not comprehensive.• An average of 30 000 tonnes of hazardous waste is exported from Australia annually.
Figure 10: Reported amount of hazardous waste generated
Figure 11: Hazardous waste imports and exports
Amount exported 29 838 27 352 47 119 21 090 29 240
Amount imported 4 621 6 245 22 708 963 893
Reporting year
16 national waste overview 2009
Product stewardship has been applied to a wide range of products internationally since the 1990s as a means of reducing the environmental footprint and increasing the health and safety associated with manufactured goods. It is an approach which acknowledges that all those involved in producing, manufacturing, selling, using and disposing of products have a shared responsibility to ensure their environmentally sound management. There are various means by which this responsibility is shared including take-back schemes, advance disposal fees, deposit-refund, a combined upstream tax/downstream subsidy, and product and collection standards.
Extended producer responsibility schemes are a type of product stewardship which places primary responsibility on the producer. Under this approach, manufacturers or producers bear the cost of the waste associated with their products. These schemes give effect to the polluter pays principle. Product stewardship and extended producer responsibility schemes are found in Asia, Canada, the European Union, and some parts of the United
States and include schemes for packaging, electrical and electronic equipment, batteries, mercury containing products, oils and general consumer products (whitegoods and tyres).
Within Australia, there are several product stewardship and extended producer responsibility schemes already in place, including regulatory, co-regulatory and voluntary schemes. Table 9 shows that at the national level, product stewardship has mainly been implemented through voluntary, industry-led initiatives, although there are schemes in place which rely on regulatory support.
South Australia was the first Australian jurisdiction to introduce a regulated product stewardship scheme with its Beverage Container Act 1975. A ten cent deposit is imposed on certain aluminium, glass, liquid paperboard and plastic beverage containers which is redeemable at collection or recycling depots. NSW, Victoria and Western Australia have legislative capability for developing and implementing product stewardship or extended producer responsibility schemes.
product stewArdship
Key point• Product stewardship is an approach for managing the impacts of a product or material during and at
end of life.
Table 9: Examples of product stewardship-extended producer responsibility in Australia
Regulatory Oil Product Stewardship (Oil) Act 2000 imposes a levy to fund recycling of waste oil.Beverage containers
Container deposit legislation (South Australia)—legislation for deposit and refund on beverage containers.
Refrigerant gases
Ozone and Synthetic Greenhouse Gas Management Act 1989 undertaken by Refrigerant Reclaim Australia—in place since 1998 and regulated in 2000.
Co-regulatory Packaging materials
Used Packaging NEPM under National Environment Protection Council Act 1994 based on separate legislation in each State and providing support for the voluntary National Packaging Covenant, a joint industry–government scheme.
Voluntary Chemical and pesticide drums and contents
drumMUSTER and ChemClear—industry-led schemes under Industry–Commonwealth Agreement in 1998 subject to re-assessment and authorisation by the Australian Competition and Consumer Commission.
Mobile phones MobileMuster—voluntary industry scheme commenced 1999.Cartridges Planet Ark—voluntary industry scheme commenced 2003.Mattresses Dreamsafe (Vic) and WSN (NSW)—local company-based fee for service to
remove and recycle used mattresses.Computers Byteback: free take-back trial in Victoria, jointly funded by Victorian
Government, leading computer manufacturers and peak industry association.

17
Accurate, consistent, transparent and timely data are necessary to support informed and timely decision making by industry, government and the community, and assist tracking progress in areas such as resource recovery. Currently, waste data are collected at all levels of government and by independent bodies. Jurisdictional waste data are collected to meet specific regulatory and policy requirements. While these data are fit for purpose within specific jurisdictions, the data may not be consistent or comparable across jurisdictions and thus does not provide a comprehensive, robust data set at an aggregated national level.
At least 217 separate waste and recycling data collection activities have been identified as taking place in Australia, with 144 of these recurring. The majority of these, 73 per cent, are voluntary surveys or audits, and a further 23 per cent are compulsory. Local government is the target of a quarter of requests for information. Government agencies make a third, and regional authorities half, of the requests.
Current data arrangements are largely reliant on voluntary disclosure, collection and collation of information and use a range of methods and classifications. Duplication of effort across surveys, audits, consultancies, research projects and other data collection activities is a burden on businesses. It has been estimated that the costs to a limited survey of organisations that are members of the WMAA, including some local governments, of participation in the current fragmented and duplicative arrangements run at almost $9 million per year. A more coordinated national approach may be able to reduce the cost to $5.7 million per year to these stakeholders, or a saving of 35 per cent.
A nationally consistent approach provides the following opportunities to:• provide required data for international reporting• improve access to waste data
• support regulatory reform and associated reporting burden on business
• support a consistent, comprehensive data capture process
• provide accurate and reliable data to inform decisions, strategies and business
• support consistent methods, classification and terminology for waste data
• develop common systems for collecting, storing, collating and accessing data
• provide a clear purpose for collecting this data, and
• support state and federal legislation.
Waste classification systems play a vital role in ensuring that specific waste streams are appropriately managed to protect the environment. They are directly linked to regulation in each jurisdiction. Jurisdictions periodically review waste classifications and take into consideration the possible impact of changes on the legislative frameworks they underpin, and the cost to governments and industry that have made long-term investments based on existing systems.
At the same time, submissions to a Productivity Commission Inquiry in 2006 and a Senate Inquiry in 2008, indicate that some stakeholders are concerned with the inconsistent approaches to waste management and recycling data and reporting requirements (almost 90 mentions) and classification and definition of waste (over 30 mentions). This theme was also raised in submissions to the National Waste Policy in 2009.
The above indicates a need to:• develop a nationally consistent classification
system that clarifies when a material or product has ceased to be a waste
• clarify how domestic and international classifications of waste and hazardous waste intersect and simplify domestic classifications to ensure that that all Australians enjoy equivalent
dAtA And clAssificAtion
Key point• Data collection at present does not provide comprehensive national data on waste and recycling.

18 national waste overview 2009
levels of environment protection, to cut red tape for business and governments, to facilitate efficient and effective decision making and to enable Australia to meet its international reporting obligations, and
• explore the development of a nationally consistent classification of biohazardous waste to ensure clarity in the marketplace on how to safely manage these materials and to facilitate the development of sustainable infrastructure.
Further assessment of current classification systems is needed as part of the process of moving towards nationally consistent data and this will build on our understanding of past efforts.

for further reading 19
for further reAding
2008 Year Book, Australian Bureau of Statistics
Environmental views and behaviour, 2007–08 (2nd issue), Australian Bureau of Statistics
Australian Landfill Capacities into the Future, Hyder Consulting, 2009 (publication pending)
Climate Change and the Resource Recovery and Waste Sectors, McLennan Magasanik Associates Pty Ltd (publication pending)
Employment in Waste Management and Recycling, Access Economics, 2009 (publication pending)
Extended Environmental Benefits of Recycling, Royal Melbourne Institute of Technology Centre for Design, 2009
Housing and Infrastructure in Aboriginal and Torres Strait Islander Communities, Australian Bureau of Statistics, 2006 (reissue)
National Landfill Survey 2007–2008, Waste Management Association of Australia, aggregated results, 2009
National Waste Data System Requirements Study, Net Balance, 2009 (publication pending)
National Waste Policy Stakeholder Submissions, Department of the Environment, Water, Heritage and the Environment, http://www.environment.gov.au/wastepolicy/consultation/index.html
Persistent Chemicals in Tasmanian Devils, Tony Ross, February 2008
The Blue Book: Australian Waste Industry 2007/2008, WCS Market Intelligence, WME, 2008
Tracking to Kyoto and 2020: Australia’s Greenhouse Emissions Trends 1990 to 2008–2012 and 2020, Department of Climate Change, 2009
Waste and Recycling in Australia, Hyder Consulting, 2009 (publication pending)
Waste Disposal Services in Australia: Q9634, IBIS World Industry Report, 2009
Full references will be published in the National Waste Report.


National Waste Overview 2009