National Visitor Use Monitoring Results USDA Forest ... · National Visitor Use Monitoring Results...
34
National Visitor Use Monitoring Results USDA Forest Service National Summary Report Data collected FY 2007 through FY 2011 Last updated 22May 2012
Transcript of National Visitor Use Monitoring Results USDA Forest ... · National Visitor Use Monitoring Results...

National Visitor Use Monitoring Results USDA Forest Service
National Summary Report
Data collected FY 2007 through FY 2011 Last updated 22May 2012

EXECUTIVE SUMMARY
The National Visitor Use Monitoring (NVUM) program provides science-based estimates of the volume and characteristics of recreation visitation to the National Forest System, as well as the benefits recreation brings to the American public. Completed in 5-year cycles, the NVUM program helps the Forest Service to manage its recreation resources in such a way that best meets the needs of visitors while maintaining the quality of the natural resource base. It is important to note that the NVUM process is still relatively new. An initial application occurred nationwide from 2000 to 2003. Significant refinements and improvements to the process were instituted in 2004, and implementation of the revised process began in 2005. Trend information regarding recreation visitation is thus not yet available; rather, these data provide a ‘snapshot’ of annual National Forest visitation. Results in this report are compiled from the most recent field data on each National Forest, which includes the period from FY2007 to FY2011. Results from the field data yield an estimate of over 165 million recreation visits to National Forests. That is slightly higher than the visitation estimates for 2005-2009 (164.4 million) and 2006-2010 (164.2 million). In addition, there were an additional 300 million visits to scenic byways and other travel routes near National Forest lands, in which visitors appreciated the beauty of the National Forests from their vehicles. Those who recreate on National Forest lands do so to improve their physical, psychological and/or spiritual sense of wellbeing. Their chosen activities vary widely, both in character and location. Some relax as they view natural features or wildlife from the roadside, whereas others pursue solitude as they hike in the remote backcountry. Some engage in off highway vehicle use. Others enjoy water-based recreation, hunt, or camp. The two most common primary recreational activities are hiking/walking and downhill skiing. Fifty-five percent of visitors engage in a primary activity that is physically active, which contributes significantly to the American public’s efforts to stay healthy. The characteristics of recreation visitors are as diverse as their chosen activities. Over one-third of visitors to National Forest sites and Wilderness areas are females. Children under the age of 16 account for about one out of every six visits. All income classes are represented in the recreating public. Just over half of National Forest visitors live within 50 miles of a forest, while slightly more than twenty percent travel more than 200 miles to recreate. Many visits (fifty-nine percent) are from people who visit fewer than 10 times per year. However, there are a large number of regular users: fifteen percent of visits are by people who visit over 50 times annually. Customer satisfaction with recreation experiences on National Forests and Grasslands is very high: ninety-four percent of visitors are satisfied with their overall experiences, including over seventy-seven percent who report being very satisfied. Visitors also give very high ratings to their perception of safety – over ninety-four percent are satisfied with this aspect of their experience. Further, more than eighty percent of those who visit sites where fees are required are satisfied with the value they receive for fees paid; only seven percent report being at all dissatisfied with fees. Visits to National Forest lands are an important contribution to the economic vitality of rural communities. Spending by recreation visitors in areas surrounding National Forests amounts to nearly $12 billion each year. Visitors who live more than 50 miles from the forest account for the bulk of these contributions; they spend $6 billion annually. As visitor spending ripples through the US economy, it contributes over $13 billion to GDP, and sustains more than 200,000 full and part time jobs. The NVUM data highlight the contribution of forest-based recreation in connecting the American people to their natural and cultural heritage, an important element of the Forest Service Recreation Strategy.

Such connections are critical to the cultivation of a conservation ethic and sense of resource stewardship among Americans. Recreation also directly facilitates the improvement of American health, a priority in both the Recreation Strategy and among Forest Service leadership. This report emphasizes the importance of recreation in the creation of rural wealth, which USDA Secretary Tom Vilsack has championed as one of his central causes. Finally, the management of public lands for recreation is wholly consistent with USDA and Forest Service goals to restore American forests, maintain clean water supplies, and provide ecosystem services.

INTRODUCTION
The National Visitor Use Monitoring (NVUM) program provides science-based estimates of the volume and characteristics of recreation visitation to the National Forest System. Information about the quantity and quality of recreation visits is required for National Forest plans, Executive Order 12862 (Setting Customer Service Standards), and implementation of the National Recreation Agenda. The agency’s Strategic and Annual Performance Plans require the measurement of user satisfaction and use level.
NVUM ensures that all visitor statistics for National Forests and grasslands produced by the Forest Service use a standardized measure. These standards were established by the Forest Service in the 1970’s; however their application is now stricter than in the past. For example, visitors must be physically recreating on Forest Service managed lands for a visit to count. They cannot be passing through, viewing from a non-Forest Service managed road, or just using restroom facilities. Background and Methods Results in this report are derived by summing the results from the most recent NVUM fieldwork for each National Forest and Grassland. The results are from NVUM field work completed from FY2007 through FY2011. Any single forest gets sampled one time in 5 years, so in a given year about two dozen forests are engaged in NVUM field data collection. Those forests that completed their NVUM work in 2011 were updating visitation estimates from about 5 years earlier. Thus, this report does not yet provide any true ‘trend’ measures; it is not a final report. Rather, it represents an iteration of the NVUM process, a ‘snapshot’ of the most current visitation patterns and activities on National Forest land. The NVUM methodology is explained in detail in: Forest Service National Visitor Use Monitoring Process: Research Method Documentation; English, Kocis, Zarnoch, and Arnold; Southern Research Station; May 2002 (http://www.fs.fed.us/recreation/programs/nvum). In essence, visitation is estimated through a combination of traffic counts and surveys of exiting visitors. Both are obtained from a random sample of locations and days distributed over an entire forest for a year. All of the surveyed recreation visitors are asked about their visit duration, activities, demographics, travel distance, and annual usage. About one-third were also asked a series of questions about satisfaction. Another one-third were asked to provide information about their income, spending while on their trip, and the next best substitute for the visit. Satisfaction measures: Survey participants were asked to provide an overall rating of their recreation experiences on a 5-point Likert scale. (A Likert scale is a numerical measurement of a respondent’s level of agreement with a statement.) About one-third of visitors were asked to rate their satisfaction with and the importance of fourteen items related to the recreation facilities and services at the site or area at which they recreated. The Likert scale for importance ranges from not important to very important. The Likert scale for performance (satisfaction) ranges from very dissatisfied to very satisfied. Results are summarized by site type: day use developed (DUDS), overnight use developed (OUDS), undeveloped general forest areas (GFAs), and Wilderness. The satisfaction responses are analyzed and reported in several ways. First, a graph of overall satisfaction is presented in Figure 5. Next, two aggregate measures (detailed below) were calculated from the set of 14 separate satisfaction items. The satisfaction elements most readily controlled by managers were aggregated into four categories: developed facilities, access, services, and visitor safety. The site types sampled were aggregated into three groups: developed sites (includes both day use and overnight developed sites), undeveloped areas, and Wilderness.

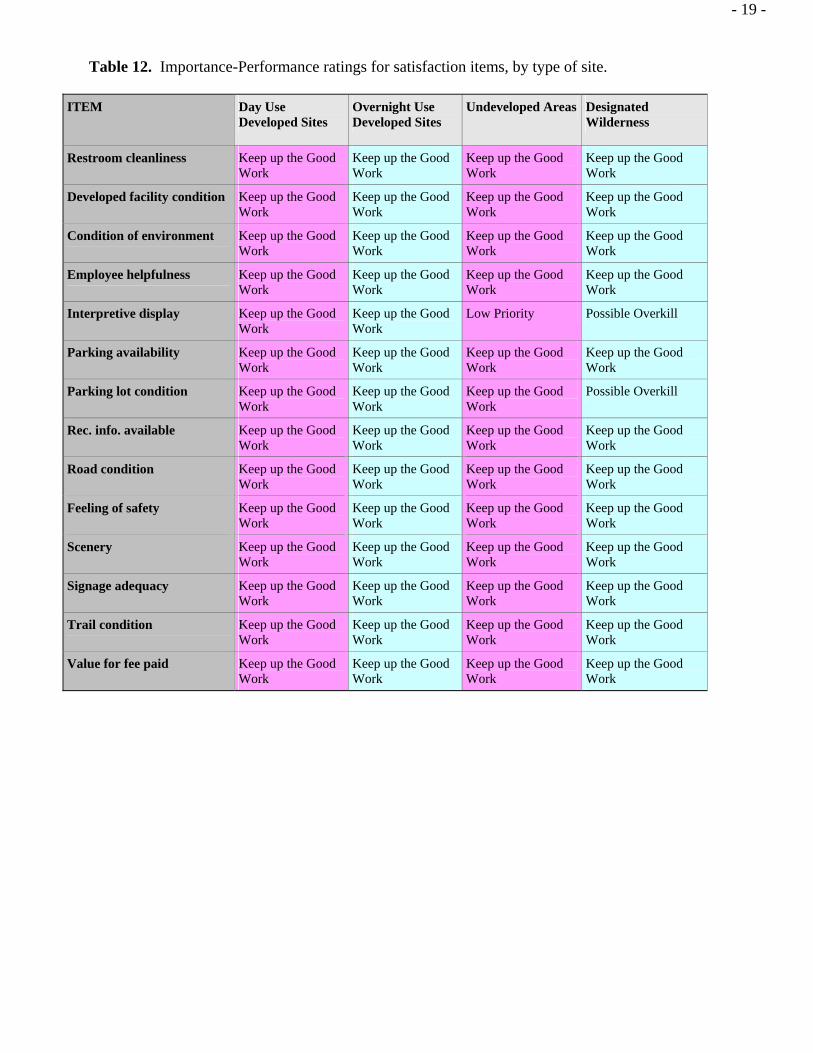
The first aggregate measure is called “Percent Satisfied Index (PSI)”. The PSI is the proportion of all ratings for the 14 items in each category in which the satisfaction was denoted as either ‘Somewhat satisfied’ or ‘Very Satisfied’. Conceptually, the PSI indicator shows the percent of all recreation customers who are satisfied with agency performance. The agency’s national target for this measure is 85%. It is usually difficult to consistently have a satisfaction score higher than 85% due to tradeoffs among user groups and other factors. Table 11 displays the aggregate PSI scores. The second aggregate measure is called “Percent Meet Expectations (PME)”. The PME aggregate measures the proportion of satisfaction ratings that are equal to or greater than the importance rating for a given item. This indicator tracks the congruence between the agency’s performance and customer evaluations of importance. The purpose of the PME measure is to highlight whether those items with higher importance levels also have higher performance levels. Lower PME scores can be interpreted to show ‘gaps’ between desired and actual performance. Figure 6 displays the PME scores. Finally, an Importance-Performance Analysis (IPA) (following Hudson, et al, Feb. 2004) was calculated for the mean values of the importance and satisfaction scores. A target level of importance and performance divides the possible set of score pairs into four quadrants. In the IPA literature, these quadrants are typically called, “Keep up the good work”, “Concentrate here”, “Possible overkill”, and “Low priority”. For those unfamiliar with this literature, the “Concentrate here” and “Possible overkill” quadrants might be interpreted as meaning “Explore how performance can be improved” and “Evaluate for possible savings”, respectively. In the context of the NVUM survey, the target level for each of the 14 satisfaction items was a numerical average score of 4.0. The quadrant titles help to interpret each score, and can provide general guidance for management. The quadrants definitions are: 1. Importance at or above 4.0, Satisfaction at or above 4.0: Keep up the good work. These are
functions that are important to visitors and which the agency is performing quite well; 2. Importance at or above 4.0, Satisfaction under 4.0: Concentrate here. These are functions that are
highly important to the public, but performance is not at a satisfactory level. Increasing effort here is likely to have the greatest payoff in overall customer satisfaction;
3. Importance below 4.0, Satisfaction above 4.0: Possible overkill. These are functions that are not of the highest importance to visitors, but performance is quite good. It may be possible to reduce effort here without greatly harming overall customer satisfaction;
4. Importance below 4.0; Satisfaction below 4.0: Low priority. These are functions where performance is not at high levels, but neither are the importance ratings. Focusing effort here is unlikely to have as great an impact on overall satisfaction as in other areas.
The numerical scores for visitor satisfaction and importance for each of the satisfaction items by site type are presented in Appendix A (Tables A1 – A4). Special attention should be paid to the numeric scores in the Appendix in reviewing and evaluating the IPA results for each item; particular emphasis should be placed on those ratings that are close to but slightly below the 4.0 value, which separates the four quadrants. For these, the distribution of responses as well as the average rating should be reviewed, as the average value could be affected by a relatively small set of very low ratings. Visitors rated their perception of how crowded their recreation site or area felt to them. Perceptions take into account the type of site and visitors’ expectations. Ratings ranged from 1 (Hardly anyone there) to 10 (Overcrowded). Spending and Economics: Spending by visitors has important effects to the health of forest-depended economies. To estimate total spending associated with recreation visits, one needs: an overall visitation

estimate, the proportion of visits in each of a series of visitor types, and the average spending total for each of the respective visitor types. Multiplying these three variables gives the total amount of spending by each type of visitor. Summing over all visitor types gives total spending associated with recreation on National Forest System lands. One-third of the NVUM surveys included questions about trip-related spending made within 50 miles of the site visited. Dr. Daniel Stynes (Michigan State University) and Dr. Eric White (Oregon State University) developed a typology of visitor types and average spending amounts for each. The spending that occurs on a recreation trip is greatly influenced by the type of trip taken. Visitors on overnight trips away from home pay for some form of lodging (e.g., hotel rooms or campground fees); those on day trips do not. Visitors on overnight trips also generally purchase more food during their trip in restaurants or grocery stores than visitors on day trips. Visitors who are close to home usually spend less than visitors traveling longer distances, especially on items such as fuel and food. Analysis of spending patterns has shown that segments of the visitor market with consistent spending patterns are:
1. local visitors on day trips, 2. local visitors on overnight trips staying on the National Forest, 3. local visitors on overnight trips staying off the National Forest, and 4. non-local visitors on day trips, 5. non-local visitors on overnight trips staying on the National Forest, 6. non-local visitors on overnight trips staying off the National Forest, 7. non-primary visitors.
In addition, these surveys included questions about household income and what the individual considered to be the most likely substitute for their visit to the forest. Terms Used in this Report The basic measurements of visitation for the NVUM process are National Forest visits and site visits. A National Forest visit is “one person participating in one or more recreation activities on a National Forest or grassland for an unspecified period of time. A National Forest visit can be composed of multiple site visits.” A Site visit is “one person participating in one or more recreation activities at a particular National Forest or Grassland site or area for an unspecified period of time.” A confidence interval is a range of values that is likely to include an unknown population value, where the range is calculated from a given set of sample data. Confidence intervals are always accompanied by a confidence level, which tells the degree of certainty that the value lies in the interval. Used together these two terms define the reliability of the estimate, by defining the range of values that are needed to reach the given confidence level. For example, the current national visitation estimate is 170.8 million visits, with a 90% confidence interval of 3.0%. In other words, given the NVUM data, our best estimate is 170.8 million visits, and we are 90% certain that the true number is between 165.7 million and 175.9 million. Local visitors travel less than 50 road miles from home to the recreation site; non-local visitors travel greater than 50 road miles. Non-primary visitors have a primary trip purpose that is something other than recreating on the National Forest – it could be to some other recreation destination, or for some reason other than recreation. Average values for visit characteristics are calculated by expanding the sample of recreation contacts to the population of National Forest visits. On some tables median values (the value of the 50th percentile) are also provided, because the averages can be greatly influenced by a few large values.
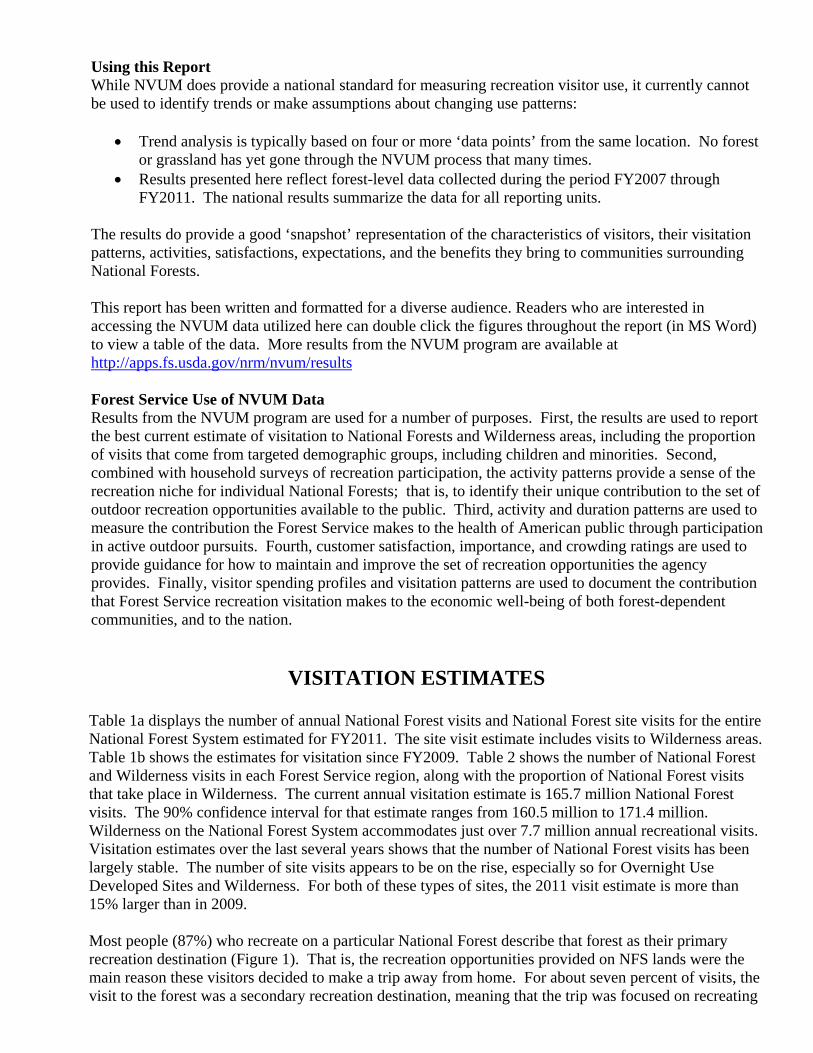
Using this Report While NVUM does provide a national standard for measuring recreation visitor use, it currently cannot be used to identify trends or make assumptions about changing use patterns:
Trend analysis is typically based on four or more ‘data points’ from the same location. No forest or grassland has yet gone through the NVUM process that many times.
Results presented here reflect forest-level data collected during the period FY2007 through FY2011. The national results summarize the data for all reporting units.
The results do provide a good ‘snapshot’ representation of the characteristics of visitors, their visitation patterns, activities, satisfactions, expectations, and the benefits they bring to communities surrounding National Forests. This report has been written and formatted for a diverse audience. Readers who are interested in accessing the NVUM data utilized here can double click the figures throughout the report (in MS Word) to view a table of the data. More results from the NVUM program are available at http://apps.fs.usda.gov/nrm/nvum/results Forest Service Use of NVUM Data Results from the NVUM program are used for a number of purposes. First, the results are used to report the best current estimate of visitation to National Forests and Wilderness areas, including the proportion of visits that come from targeted demographic groups, including children and minorities. Second, combined with household surveys of recreation participation, the activity patterns provide a sense of the recreation niche for individual National Forests; that is, to identify their unique contribution to the set of outdoor recreation opportunities available to the public. Third, activity and duration patterns are used to measure the contribution the Forest Service makes to the health of American public through participation in active outdoor pursuits. Fourth, customer satisfaction, importance, and crowding ratings are used to provide guidance for how to maintain and improve the set of recreation opportunities the agency provides. Finally, visitor spending profiles and visitation patterns are used to document the contribution that Forest Service recreation visitation makes to the economic well-being of both forest-dependent communities, and to the nation.
VISITATION ESTIMATES
Table 1a displays the number of annual National Forest visits and National Forest site visits for the entire National Forest System estimated for FY2011. The site visit estimate includes visits to Wilderness areas. Table 1b shows the estimates for visitation since FY2009. Table 2 shows the number of National Forest and Wilderness visits in each Forest Service region, along with the proportion of National Forest visits that take place in Wilderness. The current annual visitation estimate is 165.7 million National Forest visits. The 90% confidence interval for that estimate ranges from 160.5 million to 171.4 million. Wilderness on the National Forest System accommodates just over 7.7 million annual recreational visits. Visitation estimates over the last several years shows that the number of National Forest visits has been largely stable. The number of site visits appears to be on the rise, especially so for Overnight Use Developed Sites and Wilderness. For both of these types of sites, the 2011 visit estimate is more than 15% larger than in 2009. Most people (87%) who recreate on a particular National Forest describe that forest as their primary recreation destination (Figure 1). That is, the recreation opportunities provided on NFS lands were the main reason these visitors decided to make a trip away from home. For about seven percent of visits, the visit to the forest was a secondary recreation destination, meaning that the trip was focused on recreating

someplace other than the National Forest, but they decided to make a side-trip to the forest. For about six percent it was a side trip during a non-recreation trip away from home.
Table 1a. National annual visitation estimate for the National Forest System, for FY2011.
Visit Type
National Forest Visits
Visits (thousands)
90% confidence
interval width (%)
90% Confidence Interval
range (thousands of visits)
Total Estimated Site Visits
201,550 3.0 195,503 – 207,596
Designated Wilderness Visitsa
7,709 5.8 7,262 – 8,156
Total Estimated National Forest Visits
165,880 3.2 160,571 – 171,188
a Designated Wilderness visits are included in the Site Visits estimate.
Table 1b. National visitation estimate for the National Forest System for the last several years.
Visit Type Visits (thousands)
FY2005-FY2009
FY2006-FY2010
FY2007-FY2011
Day Use Developed Sites
70,653 69,731 70,659
Overnight Use Developed Sites
15,023 16,244 18,335
General Forest Areas
103,802 103,773 104,847
Wilderness 6,533 6,803 7,709
Total Site Visits 196,011 196,551 201,549
National Forest Visits
164,373 164,214 165,880

Table 2. Regional annual visitation estimates for the National Forest System, for FY2007 - FY2011.
Region
National Forest Visits
(1000s)
90% Confidence interval, as % of visits
Wilderness visits
(1000s)
90% Confidence interval, as % of visits
01: Northern 9,378 8.0 412 13.9
02: Rocky Mountain 27,962 8.3 1,193 13.2
03: Southwestern 18,185 8.2 1,612 11.3
04: Intermountain 22,422 9.7 900 31.9
05: Pacific Southwest 26,673 7.9 996 11.7
06: Pacific Northwest 15,428 5.1 1,132 8.1
08: Southern 28,993 9.5 835 20.2
09: Eastern 15,701 9.3 610 15.2
10: Alaska 1,138 12.7 19 41.7
TOTAL 165,880 3.2 7,709 5.8
Figure 1. Purpose of trip in which National Forest visit was made, for FY2007 - FY2011.
7%
6%
87%
Recreation at this Forest
Recreation at some otherdestination
Non‐Recreation trip

DESCRIPTION OF THE RECREATION VISIT
Demographics
Demographic characteristics provide an overall picture of the customer base for National Forest recreation. Recreation on National Forests provides opportunities for a wide array of people to connect with nature. Slightly more than thirty-five percent of the visits to National Forests and are made by females; the percentage for visits to Wilderness areas is slightly higher, at 39 percent (Table 3). Among racial and ethnic groups, Hispanics are the most frequent visitors, accounting for slightly more than five percent of all visits to National Forests (Table 4). About eighteen percent of National Forest visits are children under the age of 16 (Table 5). About a quarter of all visits are made in groups that include children.
A large proportion of National Forest visits come from people who live nearby (Figure 3). Nearly thirty-five percent of National Forest visits and almost a quarter of Wilderness visits are made by people who live within 25 miles of the place that they visited. Another 15 to 16 percent are from people living between 25 and 50 miles away. A little more than half of all visits to National Forests come from people who live within about 50 miles of the forest. A somewhat higher percentage of Wilderness users come from larger distances; just over thirty percent of Wilderness visits are from people who have traveled more than 200 miles, compared to about twenty-one percent of National Forest visits. Foreign visitors are relatively uncommon: they make up only about two percent of all visits (Table 6). Europeans account for about half of all foreign visits, and Canadians about 25 percent of foreign visits.
Table 3. Percent of National Forest and Wilderness visits by gender, for FY2007 - FY2011.
Gender National Forest
Visits (%) Wilderness Visits
(%) Female 35.5 35.4
Male 64.5 64.6
Total 100.0 100.0

- 8 -
Table 4. Percent of National Forest and Wilderness visits by race and ethnicity, for FY2007 - FY2011.
Race/Ethnicitya National Forest
visits (%) Wilderness visits (%)
American Indian/Alaska Native
2.6 1.9
Asian 2.2 3.2
Black/African American
1.2 0.7
Native Hawaiian or other Pacific Islander
1.1 0.7
White 95.1 95.3
Spanish, Hispanic, or Latino
5.5 5.1
a “Spanish, Hispanic or Latino” is presented in a separate question because it is an ethnicity, not a race. Respondents first stated whether they were of this ethnicity, then a separate question asked which of the racial categories applied to them. Respondents could choose more than one racial group.
Table 5. Percent of National Forest and Wilderness visits by age class, for FY2007 - FY2011.
Age National Forest
visits (%) Wilderness visits
(%) Under 16 17.3 14.2
16-19 3.5 3.4
20-29 13.2 15.4
30-39 15.3 16.4
40-49 18.9 17.2
50-59 17.3 19.8
60-69 10.9 10.5
70 and over 3.7 3.1
Total 100.0 100.0

- 9 -
Figure 2. Distribution of National Forest and Wilderness visits by age group.
0
2
4
6
8
10
12
14
16
18
20
% of Visits
Under
16
16‐19 20‐29 30‐39 40‐49 50‐59 60‐69 Over
70
Age group
National Forest Visits
Wilderness Visits
Figure 3. Distribution of National Forest visits by travel distance categories, for FY2007 - FY2011.
0
5
10
15
20
25
30
35
% of Visits
Under 25
mi.
25‐49 mi. 50‐74 mi. 75‐99 mi. 100‐199
mi.
200‐499
mi.
Over 500
mi.
Distance travelled
% NF visits
% Wilderness visits

- 10 -
Table 6. Percent of National Forest Visits by origin for foreign visitors, for FY2007 - FY2011.
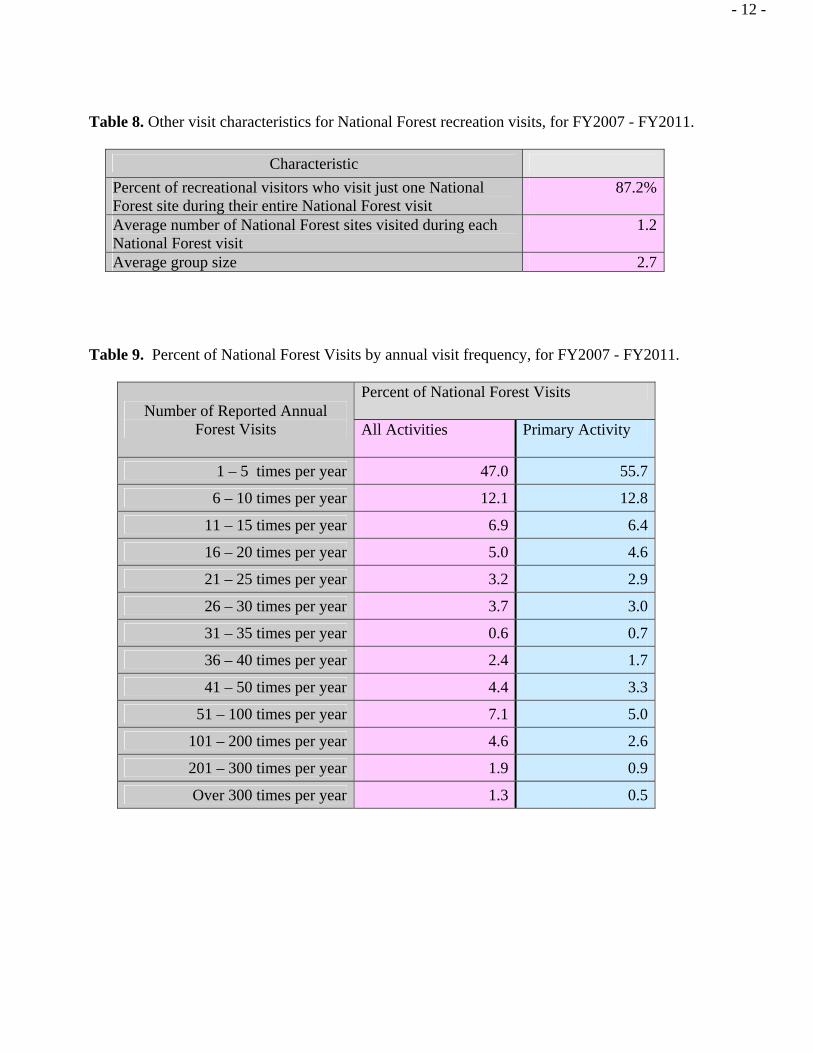
Visit Descriptions Characteristics of the recreation visit such as length of visit, types of sites visited, activity participation and visitor satisfaction with forest facilities are of interest to a variety of stakeholders. Short visits to National Forests and Wilderness areas are typical (Table 7). Although the average National Forest visit lasts nearly 23 hours, about half of them last less than 4.5 hours. Almost 65 percent of all National Forest visits last 6 hours or less. In Wilderness areas, the average visit is just over 15 hours. However, about 40 percent of the Wilderness visits last 3 hours or less, and only about 12 percent of Wilderness visits last more than 36 hours. The great majority of visitors to National Forests only go to one location on the forest during their visit (Table 8). However, some visitors do go to more than one recreation site or area. Often, these are the people who stay for a relatively long time, and visit a large number of different locations. Also displayed is the average number of people per vehicle for those on a recreation visit. Visitors were asked how often they visit a given National Forest for all recreational activities, and how often for their primary activity (Table 9). Most visits are made by people who visit the forest on which they were surveyed only a few times per year. Forty-six percent of visits are made by persons who visited that forest at most 5 times per year. However, people who visit very frequently are not uncommon. Almost 15 percent of visits are made by people who visit this forest more than 50 times per year. As could be expected, most of the frequent visitors are people who live close to the forests they visit.
Origin Percent of NF visits
Asia 0.1
Canada 0.5
Europe 1.0
Mexico <0.1
South America <0.1
Some other origin 0.2

- 11 -
Table 7. Visit duration for National Forest visits, for FY2007 - FY2011.
Visit Type Average Duration (hours)
Median Duration (hours)
Site Visit 11.0 3.0
Day Use Developed
2.7 2.3
Overnight Use Developed
43.9 40.3
Undeveloped Areas
10.5 3.0
Designated Wilderness
11.7 3.4
National Forest Visit 19.4 4.4
Figure 4. Distribution of National Forest and Wilderness visits by duration categories, for FY2007 - FY2011.
0
5
10
15
20
25
30
35
% of Visits
Under 3
hrs
3‐6 hrs 6‐12 hrs12‐36 hrs36‐72 hrsOver 72
hrs
Duration category
NF Visits
Wilderness
- 12 -
Table 8. Other visit characteristics for National Forest recreation visits, for FY2007 - FY2011.
Characteristic
Percent of recreational visitors who visit just one National Forest site during their entire National Forest visit
87.2%
Average number of National Forest sites visited during each National Forest visit
1.2
Average group size 2.7
Table 9. Percent of National Forest Visits by annual visit frequency, for FY2007 - FY2011.
Number of Reported Annual Forest Visits
Percent of National Forest Visits
All Activities Primary Activity
1 – 5 times per year 47.0 55.7
6 – 10 times per year 12.1 12.8
11 – 15 times per year 6.9 6.4
16 – 20 times per year 5.0 4.6
21 – 25 times per year 3.2 2.9
26 – 30 times per year 3.7 3.0
31 – 35 times per year 0.6 0.7
36 – 40 times per year 2.4 1.7
41 – 50 times per year 4.4 3.3
51 – 100 times per year 7.1 5.0
101 – 200 times per year 4.6 2.6
201 – 300 times per year 1.9 0.9
Over 300 times per year 1.3 0.5

- 13 -
Activities Most National Forest visitors participate in several recreation activities during each visit. Nearly all identify a single primary activity for the visit. Visitors were asked how many hours they spent doing their primary activity. Viewing natural features is part of the National Forest experience for almost half of all visits (Table 10), and about 35 percent include viewing wildlife. About 40 percent of visits include participation in hiking/walking, and 36 percent indicate that relaxation is part of their experience. The primary activity most commonly indicated is hiking/walking (18 percent), followed by downhill skiing (16%), viewing natural features (14%), fishing (7%), and hunting (7%). Activities of the greatest duration are camping, backpacking, and resort use. Recreation on National Forests also contributes to the overall health of those who visit. Over 90 million visitors (over 55 percent) come primarily to engage in a physically active pursuit. On average, these people spend about 7 hours per visit participating in their primary activity.

- 14 -
Table 10. Activity participation for National Forest recreation visits, for FY2007 - FY2011.
Activity
% of visitors who participated in this activitya
% indicating as their primary activityb
Average hours spent in primary activityc
Developed Camping 8.7 3.4 41.6
Primitive Camping 3.2 0.5 35.0
Resort Use 2.3 0.2 38.1
Nature Center Activities 6.3 0.3 2.5
Nature Study 6.6 0.2 3.9
Viewing Wildlife 32.7 1.9 4.1
Viewing Natural Features 47.4 13.6 3.3
Visiting Historic Sites 6.5 0.3 2.6
Relaxing 36.1 5.7 17.3
Picnicking 9.9 1.5 5.7
OHV Use 3.8 1.5 4.9
Motorized Trail Activity 4.4 1.6 5.1
Snowmobiling 2.8 2.2 4.7
Driving for Pleasure 23.6 4.7 3.2
Motorized Water Activities 3.1 1.0 7.9
Other Motorized Activity 0.5 0.1 5.1
Fishing* 12.0 7.1 6.2
Hunting* 7.2 6.5 12.4
Gathering Forest Products* 4.3 1.0 3.7
Hiking / Walking* 40.2 17.6 3.7
Backpacking* 2.0 0.7 31.8
Horseback Riding* 1.2 0.6 6.0
Bicycling* 4.1 2.1 2.9
Downhill Skiing* 16.6 15.8 8.2
Cross-country Skiing* 4.4 3.1 2.8
Non-motorized Water* 3.1 1.4 5.9
Other Non-motorized 6.3 2.5 3.4
Some Other Activity 5.8 3.6 3.9
No Activity Reported 0.4 0.7 .
a Survey respondents could select multiple activities so this column may total more than 100%.

- 15 -
b Respondents were asked to select one activity as their main one. Some selected more than one, so this column may total more than 100%. c Computed only for those who indicated the activity was the main activity on their visit.
* Indicates that this activity is considered to be physically active.

- 16 -
CUSTOMER SATISFACTION
A critical element of outdoor recreation program delivery is the evaluation of customer satisfaction with the recreation setting, facilities, and services provided. Overall satisfaction levels for National Forest visits are quite high. In the overall satisfaction rating, only about 3 percent of visitors indicated that they were at all dissatisfied (Figure 5). Seventy-eight percent indicated being very satisfied. The Percent Satisfied Index shows very high satisfaction levels for visitors’ perceptions of safety, over 90 percent in each type of site (Table 11). Satisfaction levels pertaining to access were above the national target for developed sites and Wilderness, but slightly below the target of 85% satisfied for undeveloped areas. Across all types of sites, satisfaction levels with services (signage, information, and employee helpfulness) were between 73 and 83 percent. Comparing these results to the overall satisfaction results indicates that safety and access are likely to be among the most important elements of customer satisfaction. Most places on National Forests do not have any fees associated with recreation use. However for those that do have fees, the majority of visitors are satisfied with the value they receive for the fees they paid. In Day Use Developed Sites, including ski areas, 81 percent are satisfied; in overnight sites, 87 percent are satisfied. The Percent Meets Expectations (PME) measure shows that the congruence between performance and expectations is quite high for the feeling of safety – greater than 85% in each of the three types of sites (Figure 6). Access elements are above 80% for each of the site types. The PME levels for developed facility items are slightly below the 80% goal for two of the three types of sites. Such a gap seems to indicate that focusing additional attention on the condition of developed facilities could have a positive impact on customer satisfaction. National importance-performance results show that there are no elements that fall into the ‘Concentrate here’ quadrant (Table 12). Nearly all were in the ‘Keep up the good work’ quadrant. Parking lot conditions and interpretive displays appear to be of somewhat lesser importance to visitors to Wilderness. The overall ratings of road conditions and adequacy of signage were quite good: for just over half of all visits both the importance and satisfaction for these items were rated as high as possible (Figures 7a and 7b). Feeling that an area is very crowded can diminish recreation satisfaction. Other than in overnight developed sites, very few visitors to National Forests felt that the places they visited were very crowded (Table 13, and Figure 8). For the overnight sites, nearly 20 percent of people felt there were high levels (8 or higher) of crowding. However, in dispersed settings, about half of the visitors felt that the areas were not crowded, giving a rating of 1 - 3.

- 17 -
Figure 5. Percent of National Forest visits by overall satisfaction rating, for FY2007 - FY2011.
78%
2%3%
16%
1%
Very Satisfied
Somewhat Satisfied
Neither
Somewhat Dissatisfied
Very Dissatisfied
Table 11. National Forest visitation Percent Satisfaction Indexa scores for aggregate categories, for FY2007 - FY2011.
Satisfied Survey Respondents (%)
Items Rated
Developed Sitesb
General Forest
Areas
Designated Wilderness
Developed Facilities (includes restroom cleanliness and facility condition)
87.1 78.6 82.0
Access (includes parking availability, parking lot condition, road condition and trail condition)
87.2 83.1 88.4
Services (includes availability of information, signage and employee helpfulness)
83.0 72.8 77.7
Perception of Safety 95.8 92.1 95.3Value received for any Fee Paid at the site 81.7 83.2 92.8a Composite ratings of the proportion of satisfaction ratings scored by visitors as satisfied or very satisfied. The values are computed as the percentages of all ratings for the elements within the groupings that are at or above the target level, and indicate the percent of all visits where the person was satisfied with agency performance. b This category includes both Day Use and Overnight Use Developed Sites.

- 18 -
Figure 6. Percent Meets Expectations results for National Forest visits by type of site, for FY2007 - FY2011.
0
20
40
60
80
100
% of Visits
Developed
Facilities
Access Services Perception of
Safety
Developed Sites
Undeveloped Areas
Designated Wilderness
- 19 -
Table 12. Importance-Performance ratings for satisfaction items, by type of site. ITEM Day Use
Developed Sites Overnight Use Developed Sites
Undeveloped Areas Designated Wilderness
Restroom cleanliness Keep up the Good Work
Keep up the Good Work
Keep up the Good Work
Keep up the Good Work
Developed facility condition Keep up the Good Work
Keep up the Good Work
Keep up the Good Work
Keep up the Good Work
Condition of environment Keep up the Good Work
Keep up the Good Work
Keep up the Good Work
Keep up the Good Work
Employee helpfulness Keep up the Good Work
Keep up the Good Work
Keep up the Good Work
Keep up the Good Work
Interpretive display Keep up the Good Work
Keep up the Good Work
Low Priority Possible Overkill
Parking availability Keep up the Good Work
Keep up the Good Work
Keep up the Good Work
Keep up the Good Work
Parking lot condition Keep up the Good Work
Keep up the Good Work
Keep up the Good Work
Possible Overkill
Rec. info. available Keep up the Good Work
Keep up the Good Work
Keep up the Good Work
Keep up the Good Work
Road condition Keep up the Good Work
Keep up the Good Work
Keep up the Good Work
Keep up the Good Work
Feeling of safety Keep up the Good Work
Keep up the Good Work
Keep up the Good Work
Keep up the Good Work
Scenery Keep up the Good Work
Keep up the Good Work
Keep up the Good Work
Keep up the Good Work
Signage adequacy Keep up the Good Work
Keep up the Good Work
Keep up the Good Work
Keep up the Good Work
Trail condition Keep up the Good Work
Keep up the Good Work
Keep up the Good Work
Keep up the Good Work
Value for fee paid Keep up the Good Work
Keep up the Good Work
Keep up the Good Work
Keep up the Good Work

- 20 -
Figure 7a. Overall Satisfaction with Forest-wide Road Condition and Signage Adequacy, for FY2007 - FY2011.
0%
20%
40%
60%
80%
100%
Roads Signage
% of Visits
Very Dissatisfied
Somewhat Dissatisfied
Neither
Somewhat Satisfied
Very Satisfied
Figure 7b. Overall Importance ratings for Road Condition and Signage Adequacy, for FY2007 - FY2011.
0%
20%
40%
60%
80%
100%
Roads Signage
% of Visits
1 (Low)
2
3
4
5 (High)

- 21 -
Table 13. National Forest visitor perceptions of crowding by site type, for FY2007 - FY2011.
Perception of Crowding by Site Types (Percent site visits %)
Crowding Rating Day Use Developed Sitesc
Overnight Use Developed Sites
General Forest Areas
Designated Wilderness
Areas
10 Overcrowded 1.0 2.6 0.9 0.7
9 3.9 7.3 3.5 2.8
8 6.2 8.2 4.7 3.8
7 6.5 7.3 5.5 4.3
6 20.1 22.6 17.6 16.7
5 12.5 9.0 8.8 12.3
4 17.6 13.1 14.2 18.1
3 14.6 10.4 16.2 16.9
2 15.7 17.9 27.0 22.4
1 Hardly anyone there 2.0 1.8 1.5 1.5
Figure 8. Distribution of National Forest visits into general crowding categories.
0%10%20%30%40%50%60%70%80%90%100%
Day Use Overnight
Use
GFAs Wilderness
Site Type
% of Visits High ( 8 ‐ 10)
Moderate (4 ‐ 7)
Low (1 ‐ 3)

- 22 -
Disabilities The Forest Service is committed to integrating accessibility considerations into its sustainable recreation planning so all people, including those with disabilities, can recreate. The accessibility of recreation facilities is an important part of this policy. Just under eight percent of National Forest visits are made by people in groups where one or more group members have a disability (Table 14). For more than three-fourths of these parties, the facilities they used were rated as accessible. Table 14. Accessibility for National Forest visits by persons with disabilities, for FY2007 - FY2011.
Item Percent Percent of visitors interviewed with group member having a disability
7.9
Of this group, percent who said facilities at site visited were accessible
75.6

- 23 -
VISITOR SPENDING AND ECONOMICS
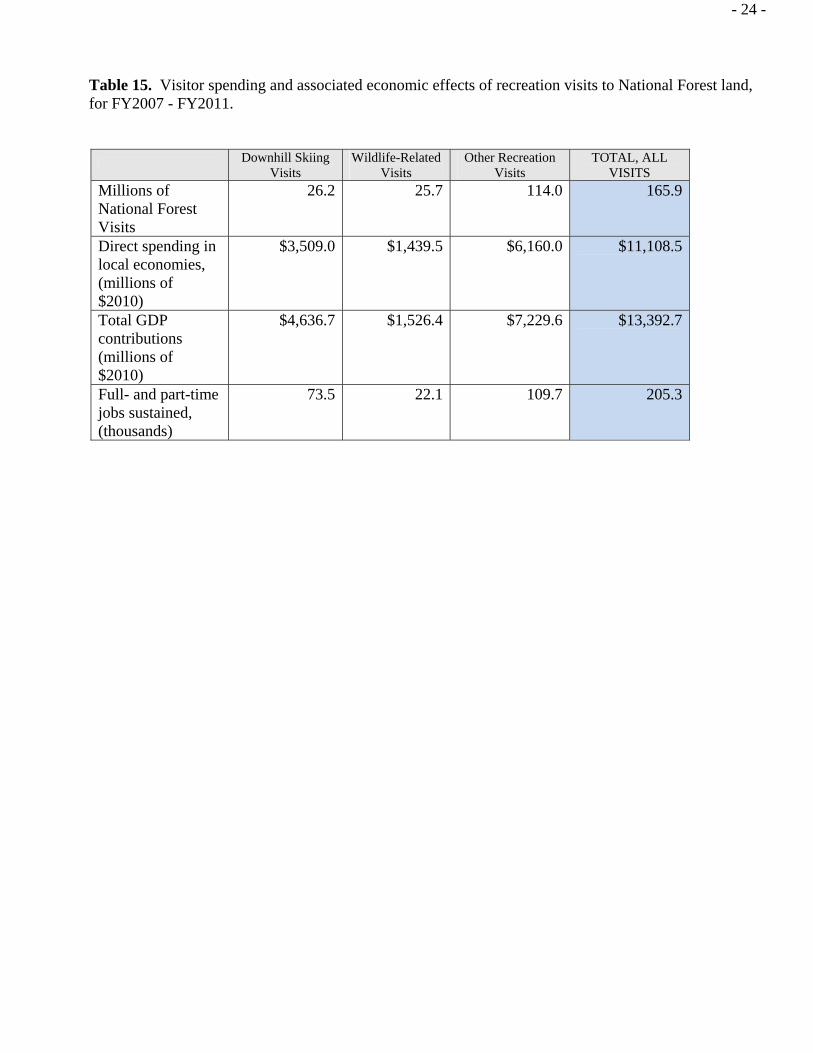
Visitor Spending Visitors to National Forests often spend money in nearby communities during the time they are on their recreation trips. These communities benefit directly from that spending. About 47 percent of visits to National Forests are from residents of the local area who are on day trips. Few local residents stay overnight on or near the forests. About 10 percent of non-local residents make visits while on day trips away from home. More non-locals on overnight trips spend the night in facilities off the forest than on the forest. For 1 out of about every 8 visits, a National Forest was not the primary destination for the trip. Visitors spend money in towns that are near National Forests for things like gasoline, food, lodging, and souvenirs. The spending segments differ markedly in the amount of money per party. In general, visitors who come from outside the local area spend more than do those who are from the local area. Those parties staying overnight off of National Forest lands spend more than those who spend the night on the National Forest. Those coming for the primary purpose of downhill skiing typically spend more per visit than for other types of recreation. Overall, recreating visitors spend a little more than $11 billion per year in areas around National Forest System lands (Table 15). Many downhill skiers are from outside the local area and are staying in off-forest lodging. As a result, downhill skiers account for slightly more than $3.5 billion in local spending. Visitors for wildlife-related recreation spend least as a group, largely because two-thirds of these visits are made by people on day trips away from home. As visitor spending ripples through the economy, further economic activity is created. In total, spending by visitors to National Forests and Grasslands contributes almost $13.4 billion to the US economy and sustains somewhat more than 205,000 full-and part-time jobs.
- 24 -
Table 15. Visitor spending and associated economic effects of recreation visits to National Forest land, for FY2007 - FY2011.
Downhill Skiing
Visits Wildlife-Related
Visits Other Recreation
Visits TOTAL, ALL
VISITS Millions of National Forest Visits
26.2 25.7 114.0 165.9
Direct spending in local economies, (millions of $2010)
$3,509.0 $1,439.5 $6,160.0 $11,108.5
Total GDP contributions (millions of $2010)
$4,636.7 $1,526.4 $7,229.6 $13,392.7
Full- and part-time jobs sustained, (thousands)
73.5 22.1 109.7 205.3

- 25 -
About 37 percent of visits to National Forests are made by people who are spending at least one night away from home (Table 16). For most of them, it includes at least one night spent within 50 miles of the forest they visited. Those spending the night within 50 miles of the forest stay an average of about 5 nights. For those spending one or more nights on or near the forest, about 35 percent stay in hotels or lodges off the forest. About 22 percent camp at developed campgrounds on the National Forest, and about 12 percent camp in undeveloped areas of the forest. Table 16. Visitor Trip Information, for FY2007 - FY2011.
Household Income
The income distribution of visitors to National Forests is varied (Figure 9). About eleven percent of visits are made by individuals whose household income is over $150,000 per year. About the same percentage are made by people in households earning less than $25,000 per year. Almost half of all visits come from people in households earning between $25,000 and $75,000 per year.
Item
Percent of visits that occur on trips with an overnight stay away from home
37.0
Percent of visits that occur on trips with an overnight stay within 50 miles of the visited forest
34.2
For overnight visits, average number of nights within 50 miles of the forest
5.0
For those staying overnight within 50 miles of the forest, percent indicating each type of lodging NF campgrounds ON the National Forest 22.3
Camping in undeveloped areas of the National Forest 11.8
Cabins, lodges, hotels or huts ON the National Forest 7.8
Other public campgrounds (Park Service, BLM, State Park, other)
2.8
Private campgrounds NOT on the National Forest 2.3
Rented home, condo, cabin, lodge or hotel NOT on the NF 34.4
Private home of friend or relative 13.0
Home, cabin, or condo owned by visitor 8.1
Other 1.2

- 26 -
Figure 9. Household income of National Forest recreation visits, for FY2007 - FY2011.
24%
11% 11%
17%
15%
22%
Under $25,000
$25,000 ‐ $49,999
$50,000 ‐ $74,999
$75,000 ‐ $99,999
$100,000 ‐ $149,999
$150,000 plus
Substitute behavior Travel cost models of economic value must include some measure of substitute behavior. Half (50%) indicate that their substitute behavior choice is activity driven – that is, going elsewhere for same activity (Figure 10). A smaller percentage (16%) indicate they would come back later for the same activity. Visitors who said they would have gone somewhere else for recreation also indicated how far from their home this alternate destination was (Figure 11). The distribution of travel distances to alternative locations is very similar to the distribution of travel distances for National Forest visits, which may indicate that a reasonable set of alternative destinations indeed exists for most visits.

- 27 -
Figure 10. Substitute behavior choices of National Forest visitors, for FY2007 - FY2011.
17%
9%
49%
18%
5%2%
Go elsewhere, same activity
Come Later
Go elsewhere, other activity
Stay home
Go to work
Other
Figure 11. Reported distance visitors would travel to alternative recreation locations, for FY2007 - FY2011.
0
5
10
15
20
25
30
35
40
0‐25 mi. 26‐50 mi. 51‐75 mi. 76‐100 mi. 101‐200
mi.
201‐300
mi.
Over 300
mi.
Distance
% of Visits

- 28 -
Appendix A. Detailed Satisfaction Results
Table A-1. Satisfaction of National Forest recreation visitors at Developed Day Use sites, for FY2007 - FY2011.
ITEM Very
Dissatisfied Somewhat Dissatisfied Neither
Somewhat Satisfied
Very Satisfied
Avg. Rating
Mean Importance
Restroom cleanliness 2.7 4.3 10.4 25.1 57.4 4.3 4.5
Developed facility condition
0.5 1.7 7.6 21.4 68.7 4.6 4.4
Condition of environment
0.8 1.4 4.6 22.2 70.9 4.6 4.7
Employee helpfulness 1.0 1.0 4.8 15.5 77.7 4.7 4.5
Interpretive displays 1.2 4.5 17.5 26.6 50.3 4.2 4.0
Parking availability 2.8 4.8 7.1 15.9 69.5 4.4 4.4
Parking lot condition 1.4 3.2 9.5 20.6 65.4 4.5 4.1
Rec. info. availability 1.4 3.9 14.5 25.5 54.8 4.3 4.2
Road condition 1.1 2.6 10.2 26.3 59.9 4.4 4.3
Feeling of safety 0.3 0.8 3.3 14.9 80.7 4.7 4.7
Scenery 0.2 0.4 2.6 11.6 85.1 4.8 4.6
Signage adequacy 1.3 4.4 10.8 25.4 58.0 4.3 4.3
Trail condition 0.5 2.1 9.4 21.9 66.1 4.5 4.4
Value for fee paid 2.8 8.6 9.4 22.8 56.3 4.2 4.6 *Scale is: Very Dissatisfied = 1 Dissatisfied = 2 Neither = 3 Satisfied = 4 Very Satisfied = 5 ** Scale is: 1= Not Important 2= Somewhat Important 3= Moderately Important 4= Important 5 = Very Important

- 29 -
Table A-2. Satisfaction of National Forest recreation visitors at Developed Overnight sites, for FY2007 - FY2011.
ITEM Very
Dissatisfied Somewhat Dissatisfied Neither
Somewhat Satisfied
Very Satisfied
Avg. Rating
Mean Importance
Restroom cleanliness 2.1 3.6 9.2 20.9 64.2 4.4 4.7
Developed facility condition
0.6 1.3 6.2 27.1 64.8 4.5 4.5
Condition of environment
0.6 1.8 3.2 19.6 74.8 4.7 4.8
Employee helpfulness 1.5 1.2 2.9 11.6 82.8 4.7 4.6
Interpretive displays 2.4 4.4 18.6 26.7 47.9 4.1 4.1
Parking availability 1.0 2.9 4.9 17.8 73.4 4.6 4.5
Parking lot condition 0.9 2.4 5.1 18.6 73.0 4.6 4.3
Rec. info. availability 2.3 8.1 12.7 25.5 51.4 4.2 4.4
Road condition 1.8 4.1 7.8 29.4 56.9 4.4 4.4
Feeling of safety 0.4 0.6 2.6 13.7 82.8 4.8 4.8
Scenery 0.4 0.4 2.9 12.1 84.2 4.8 4.7
Signage adequacy 1.5 3.9 9.4 21.2 64.0 4.4 4.5
Trail condition 0.4 1.7 5.8 23.5 68.5 4.6 4.5
Value for fee paid 1.6 3.4 5.4 21.5 68.1 4.5 4.6 *Scale is: Very Dissatisfied = 1 Dissatisfied = 2 Neither = 3 Satisfied = 4 Very Satisfied = 5 ** Scale is: 1= Not Important 2= Somewhat Important 3= Moderately Important 4= Important 5 = Very Important

- 30 -
Table A-3. Satisfaction of National Forest recreation visitors in Dispersed areas, for FY2007 - FY2011.
ITEM Very
Dissatisfied Somewhat Dissatisfied Neither
Somewhat Satisfied
Very Satisfied
Avg. Rating
Mean Importance
Restroom cleanliness 6.5 5.0 17.1 22.3 49.2 4.0 4.3
Developed facility condition
1.8 2.6 10.6 26.7 58.3 4.4 4.1
Condition of environment
1.3 2.4 5.4 24.0 66.8 4.5 4.7
Employee helpfulness 1.9 1.1 15.1 16.7 65.2 4.4 4.2
Interpretive displays 3.6 6.5 21.8 25.0 43.2 4.0 3.7
Parking availability 2.2 4.7 9.6 19.6 64.0 4.4 4.2
Parking lot condition 1.6 4.2 10.2 24.4 59.7 4.4 4.0
Rec. info. availability 3.6 6.9 19.0 26.5 44.1 4.0 4.1
Road condition 3.4 6.7 10.7 31.0 48.2 4.1 4.2
Feeling of safety 0.6 1.9 5.4 16.4 75.6 4.6 4.5
Scenery 0.5 0.8 3.7 13.6 81.5 4.7 4.6
Signage adequacy 4.0 6.3 15.1 25.8 48.7 4.1 4.1
Trail condition 1.6 3.6 8.8 26.6 59.4 4.4 4.4
Value for fee paid 4.7 2.3 9.8 15.4 67.8 4.4 4.3 *Scale is: Very Dissatisfied = 1 Dissatisfied = 2 Neither = 3 Satisfied = 4 Very Satisfied = 5 ** Scale is: 1= Not Important 2= Somewhat Important 3= Moderately Important 4= Important 5 = Very Important

- 31 -
Table A-4. Satisfaction of National Forest Wilderness visitors, for FY2007 - FY2011.
ITEM Very
Dissatisfied Somewhat Dissatisfied Neither
Somewhat Satisfied
Very Satisfied
Avg. Rating
Mean Importance
Restroom cleanliness 7.0 6.8 9.6 23.2 53.5 4.1 4.2
Developed facility condition
0.1 2.7 8.5 17.4 71.4 4.6 4.1
Condition of environment
0.3 1.0 3.4 19.1 76.2 4.7 4.8
Employee helpfulness 1.1 2.9 9.2 8.9 77.9 4.6 4.3
Interpretive displays 4.1 5.1 19.6 27.2 44.0 4.0 3.8
Parking availability 1.1 4.7 7.4 14.9 71.9 4.5 4.1
Parking lot condition 0.6 2.5 7.0 19.5 70.4 4.6 3.9
Rec. info. availability 1.2 5.4 15.5 24.5 53.3 4.2 4.2
Road condition 1.3 4.0 10.9 29.3 54.5 4.3 4.2
Feeling of safety 0.2 0.6 3.9 13.2 82.1 4.8 4.5
Scenery 0.1 0.2 1.8 10.1 87.8 4.9 4.8
Signage adequacy 2.2 6.4 12.6 22.2 56.6 4.2 4.3
Trail condition 0.7 2.3 5.0 23.5 68.5 4.6 4.5
Value for fee paid 1.8 1.6 3.8 10.4 82.5 4.7 4.3 *Scale is: Very Dissatisfied = 1 Dissatisfied = 2 Neither = 3 Satisfied = 4 Very Satisfied = 5 ** Scale is: 1= Not Important 2= Somewhat Important 3= Moderately Important 4= Important 5 = Very Important