National U. S. - Defense Technical Information Center V. Compton Major USAF D L, \!I TECHNICAL...
102
AD-766 891 PROCEDURES FOR CONDUCTING THE AIR FORCE WEAPONS LABORATORY STANDARD SKID RESISTANCE TEST George D. BalIentine, et al Air Force Weapons Laboratory Kirtlard Air Force Base, New Mexico September 1973 -I 1r DISTRIBUTED BY: National Technical Information Service U. S. DEPARTMENT OF COMMERCE 5285 Port Royal Road, Springfield Va. 22151 xi . . . - - . .. : . . . i
Transcript of National U. S. - Defense Technical Information Center V. Compton Major USAF D L, \!I TECHNICAL...

AD-766 891
PROCEDURES FOR CONDUCTING THE AIR FORCEWEAPONS LABORATORY STANDARD SKIDRESISTANCE TEST
George D. BalIentine, et al
Air Force Weapons LaboratoryKirtlard Air Force Base, New Mexico
September 1973
-I
1r
DISTRIBUTED BY:
National Technical Information ServiceU. S. DEPARTMENT OF COMMERCE5285 Port Royal Road, Springfield Va. 22151
xi . . . - - . .. : . . . i

AFW L-TR-73-165 AFWL-TR-73-165
ji- PROCEDURES FOR CONDUCTING
THE AIR FORCE WEAPONS LABORATORY
STANDARD SKID RESISTANCE TEST
George D. Ballentine00 Major USAF
Phil V. ComptonMajor USAF D L, \
!I TECHNICAL REPORT NO. AFWL-TR-73-165
- September 1973
AIR FORCE WEAPONS LABORATORYAir Force Systems Command
Kirtland Air Force Base
New Mexico
NATiONAL TECHNICALINFORMATION SERVICE
S " ,1 *4 ',A "'1 1
Approved for public release; distribution unlimited,
U,. .

AFWL-TR-73-165
AIR FORCE WEAPONS LABORATORYAir Force Systems ComnandKirtland Air Force Base
"v New Mexico 87117
p .
* .
*I
When U; Government drawings, specifications, or other data are used forany purpose other than a definitely related Government procurement operation,the Government thereby incurs no responsibility nor any obligation whatsoever,and the fact that the Government may have formulated, furnished, or in any waysupplied the said drawings, specifications, or other data, is not to beregarded by implication or otherwise, as ;n any manner licensing the holder orany other person or corporation, or conveying any rights or permission tomanufacture, use, or sell any patented invention that may in any way berelated thereto.
DO NOT RETURN THIS COPY. RETAIN OR DESTROY.

UNCLASSI FIEDZ-7--tlv rs( .7|f0,; , 8 t
DOCUMENT CONTROL DATA- R & DSn ,: *Ia .,~ ls., Nfrlc bn4, " .4 afrfa!ai.nrm.. r en. .I he ene-d ahei, lbe r.11f rrp,.i"t5
Ic.,; .A -- aG AC I. fCorpoalr outhor n . LAV :A "
Air Force Weapons Laboratory (DEZ) Unclassified
Kirtland Air Force Base, flew Mexico 87117 2"°"u
3 RECPORT I TLE
PROCEDLRES FOR CONDUCTING THE AIR FORCE ',WEAPONS LABORATORY 'STANDARD SYIDJRESISTANCE TEST
* OC$C IPT, E NOTS Tryp oltepoul and Incluetwe dal ra
5 February 1971 through 30 June 1973s A . TrmORs$ fFIraf name. middle initial. tat namei
George D. Ballentine, Maj, USAF, Phil V. Compton, Maj, USAF
6 RIPORT CATEl ?a TOTAL 'dO P AGES or REFS
September 1973 102 7rta CCl4 TRAC OR GRA~d I N.O 0.ORIGeNA TOWS REPOP - '-.j.4CflISJ
Pb0.) CCOJ P40 73M* AFWL-TR-73-165
c Task 04 o C PORT . 0.,, (Any other n. be that may be , ,"sed
I' 1T.IBUTION STATEMENv hsreat
Approved for public relese: distribution unlimited.
1I SUPPLEU *TARY IJOTES I1. SPOPJSORIPJG MILITARY AC TV T
I AFWL (DEZ)
-Kirtland AFB, 11M 87117
13 AOSTRACT
(Distribution Limitatior Statement ik)
Detailed procedures for conoucting the standard runway skid resistance test areincluded for use in implementing an Air Force-wide Skid resistance testing prograri.Each step in the testing procedure, rangir,,j from calibration of the test equipmentto recording of field data is discussed. Copies of all special forms required forrecording data are included. Use of these forms greatly facilitates the use ofcomputer analysis package, which has been prepared to analyze data gathered ir, thestandard test. When the test is conducted according to procedures in this report,a great deal of information is gained about the hydroplaning potential of the runwaysurface. The test, therefor'e, represent3 a significant advance in the state-of-the-art of measuring runway skid resistance. Results of the test indicate directly ifcorrective action is required to improve runway skid resistance properties, therebgiving information unavailable from any other source.
DDNOV,.1473 UNCLASFiED.SL'____rl_ C__l______,_iln

UfICLASSI FI EDSecurity Clss:z1ication
14 LIN K LINKu*TZ RO :E ! I' ""
Runway skid resistanceAircraft hydroplaning potentialDiagonally braked vehicle.u-:eter
rj I
I
I,
S(
LI
Security Classification
;1I

AFWL-TR-73-165
7
PROCEDURES FOR CONDUCTIUG THEf AIR FORCE WEAPONIS Lf1BORATOPY
STAWYDAPD SKID RESISTAUCE TEST
George D. BallentineMajor UJSAF
Phil VI. LonlptonMajor USAIF
TECHINICAL REPORT HO. Ar-WL-TR-73-165
~1.
Approved for public release; distribution unliwited.

AFWL-TR-73-165
FORE.F.
This research was performed under Prograr Element 637.3F, Project 7'..,Task 04.
Inclusive dates of research were 5 February 1971 throug 3'0 June 1973. Th-ereport was submitted 10 July 1973 by the Air Force '.,'eapors LaLoratrry Pro.jectOfficer, Major Georqe D. Ballentine (DEZ).
This technical report has been reviewed and is approved.
At
GEORG(D. bALLENTINE',Major, USAFProject Officer
(X
OREN G. STROM WILL.Tri B. LIDDICOETLt Col )nel, USAF Colo'.el , USAFChief, Aerospace Facilities Branch Chief, Civil Engineering Research
Division
,
'; J,
* I

AFIL-TR-73-165
ABSTRACT
(Distribution Limitation Statement A)
A
Detailed procedures for conducting the standard runway skid resistance Lest areincluded for ur, in implementing an Air Force-wide skid resistance testingprogram. LEch step in the testing procedure, ranging from calibration of thetest equipment to recording of field datd is discussed. Copies of all specialforms required for recording data are inclided. Use of these forms greatlyfacilitates the use of computer analysis packoqe, which has been prepdred toanalyze data gathered in the standard test. When the test is conducted ac-ord-ing to procedures in this report, a great deal of information is gained abutthe hydroplaning potential of the runway surface. The test, therefore, repre-sents a significant advance in the state-of-the-art of measuring runt-ay skidresistance. Results of the test indicate directly if corrective action isj required to improve runway skid resistance properties, thereby giving informa-tion unavailable from any other source.
J
iii
-
' iii/iv

AFWL-TR-73-165
CONTENTS
Section Page
I INTRODUCTION 1
6 Background 1
Coordination Prior to Testing 2
II SELECTIO, AN1D LAYOUT OF TEST SECTIONS 5
General Requirements 5
Typical Layout 5
III WATER TRUCK CALIBRATION 9
General Requirements for Water Truck 9
Method of Calibration 10
Water Truck Crew Briefing Check List 14
4 IV CALIBRATION OF MU-METER 15
General 15
Steps in Standard Calibration Test 15
Adjustment of the Mu-Meter 16
V SKID DATA COLLECTION 17
General 17
Sequence of Events 20
Dry Runway Tests 23
Application of Water 26
Wet Runway Tests 27
Extraction of Data from Mu-Meter Tapes 32
. VI SLOPE MEASUREMENT 35
General 35I Computation of Average Lateral Slope 36
VII USE OF THE COMPUTER ANALYSIS PACKAGE 38
* General 38
Steps in Use of the Analysis Package 38
APPENDIX I Sample Computer Output 45
APPE1DIX II Blank Forms and Check Lists 75
v

AFWL-TR-73-165
FIGURES
Figure Page
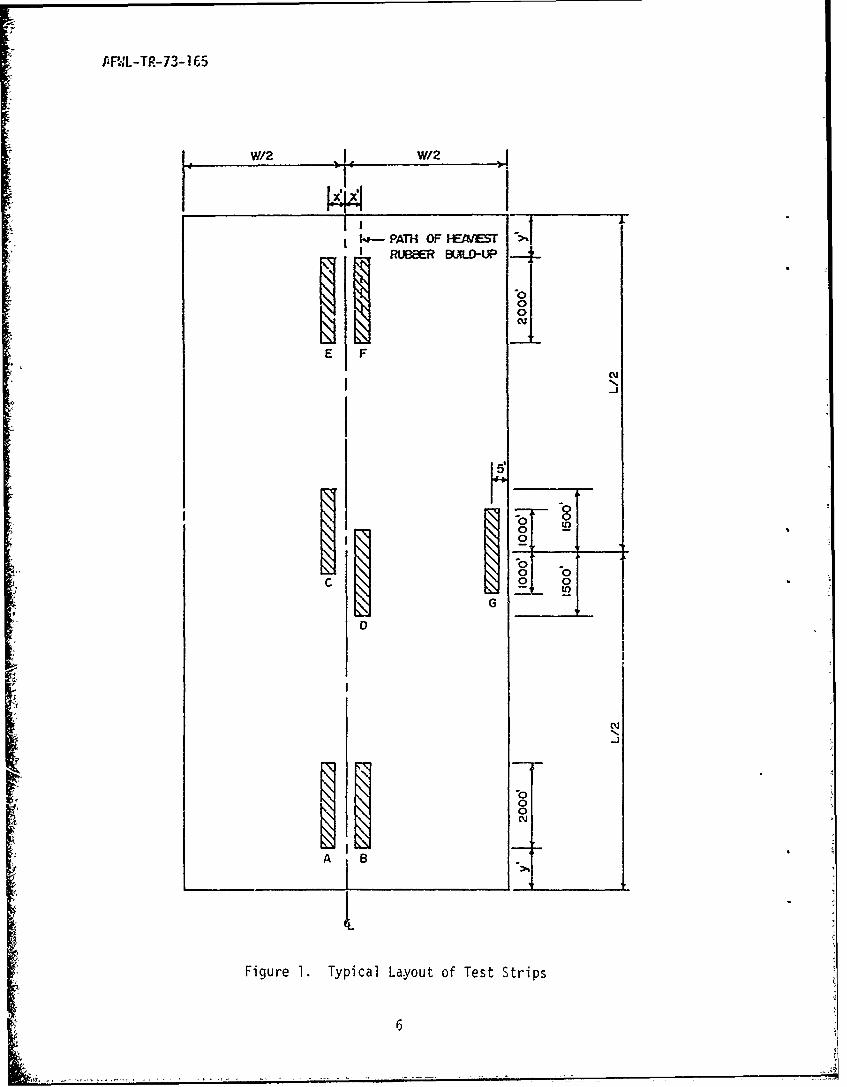
1 Typical Layout of Test Strips 6
2 Typical Test Strip 8
3 Water Discharge Corresponding to Varying Spray BarLengths 11
4 General Information, Weather, and Water Record 18
5 General Information 19
6 Mu-Meter Dry Runs on Entire Pavement Length 22
7 Mu-Meter Runs on Dry Pavement 24
8 DBV Runs on Dry Pavement 25
9 DBV Stopping Time and Distance on Wet Pavement 29
10 Mu-Meter Measurements of Pavement Friction on Wet Pavement 31
11 Mu-Meter Tape Data 34
12 Pavement Cross-Slope Measurements 37
13 Header Card No. 1 39
14 Header Card Group No. 2 40
15 Header Card No. 3 41
TABLE
I Conversion Factors for Stopping Distances 30
L '
. Wn m

AFWL-TR-73-165
SECTION I
INTRODUCTION
1. BACKGROUND
The Air Force Weapons Laboratory's (ARIL) standard skid-resistance test forpotential hydroplaning problems on airfield runways has been under develop-;ent
for some time, research is continuing. The standard test is a major develcpment
that grew out of Project Combat Traction, a joint USAF-NASA program thatinitiated USAF research into the methods for quantifying potential hydroplaning
situations. The test procedure is designed to evaluate the skid resistance and
hydroplaning characteristics of a runway surface.
Research in the skid resistance area was initiated because of the largenumber of skidding/hydroplining accidents involving high-speed jet uircraft.
A 'neans was sought to recognize potential hydroplaning situations prior to lossof a valuable aircraft. The standard skid resistance test developed by AFWLprovides the best available means for classifying runways according to their
• hydroplaning potential. Additionally, it provides a basis from which to reacha decision on the need for rubber removal, and also gives approximate runwdycondition rating (RCR) values for runways tested.
The AFWL standard skid resistance test uses the British-developed "u-Meter
and the diagonally braked vehicle (DBV) to evaluate the skid resistance/hydro-planing characteristics of runway surfaces. The standard test consists of fieldmeasurements of the pavement skid resistance/hydroplaning properties with both
pieces of equipment under dry conditions and under standardized wet conditions.Water is applied to test sections of the pavement using flightline fire depart-
ment water tankers carefully calibrated to discharge known water quantities which
simulate a rainfall rate of 0.6 to 0.8 inch per hour.
Data are gathered on temperature and wind conditions during the test and onboth longitudinal and lateral pavement slopes. These data, along with informa-tion obtained by use of the Mu-Meter and DBV, are recorded on specially preparedforms for entry onto computer cards. The forms are designed in such a way thatthe field data can be keypunched directly without recopying or transcribing in
any way.
" 1

AFIL-TR-73-165
A computer analysis package has been prepared to perform a complete analysis
of all data gathered in the standard test. Input to thils analysis package con-
sists of all field data keypunched onto computer cards. Output Lonsists of a
written report with summary tables showing the skid resistance properties of the
pavement tested and a number of plotted curves showing the relationships between
the significant variables.
Detailed procedures for conducting the AFWL standard skid resistance test
and instructions for recording all necessary data are contained in the sections
that follow. A copy of each specially prepared form necessary for recording data
is contained in appendix I.
Separate publications will be released in the near future describing the
operation of the computer program and, in detail, the instrumentation of the
DBV. For interim purposes, brief instructions on use of the computer program
are included with this publication. An operational check list for use with the
DBV is also included in appendix II; this form can be reproduced for use while
gathering field data.
2. COORDINATION PRIOR TO TESTING
The test program is generally conducted at the request of the major air
command. A letter to the major command establishing the proposed schedule and
listing the support that will be required at each base should be written earlyI in the initial planning.
To secure the best results and to encourage maximum cooperation from base
personnel where a test is being conducted, a thorough briefing before the test
is absolutely essential. This briefing is generally set up the afternoon beforej the day of testing. The following base personnel should be included at such a
briefing.
Base project officer for the test
Base civil engineer
Director of operation (or base ops officer)
Fire chief
Duty chief during test (if possible)Transportation officer

A1.1-TR-73-165
The following items should be covered at the briefing:
a. Purpose of the test and expected results.
o. General outline of how the test will be run.
(1) Specific areas of the runway to be tested (type of test sections
and reasons selected).
(2) Equipment to be used (photographs of DBV and Mu-Meter may be help-
fuil here).
c. Support required from the base to include:
(1) Closure of the runway for a total of 7 daylight hours. The runway
time is broken into a 2-hour and a 5-hour block of uninterrupted time intervals.
A I- to 2-hour period is required between the two time periods to service
vehicles.
(2) A base vehicle for the test conductor to use during the actual
testing.
(3) Flightline vehicle with driver to maintain radio control with the
tower. (This could be the duty fire chief, base ops, etc.)
(4) Water truck(s) and crew. (See section III for specific require-
ments of the trucks.) Driver and pump operator must be furnished with the truck.
(5) A rapid water refill capability near the fliqhtline for water
truck(s) (minimum capacity at 3000 gallons per 15 minutes).
(6) Copies of runway system drawings showing layout, longitudinal and
transverse slopes, and brief construction and maintenance history of the runway(s)
to be tested.
(7) Secure overnight storage space for test equipment (near flightline,
if possible).
(8) Tire changing and mounting facilities for test tires on DBV.
(9) Removal of BAK-9 and BAK-12 runway barriers from the runway while
test is being accomplished.
(10) Premium gasoline and maintenance (if required) capability for DBV
and Mu-Meter truck.
3

AFL-TR-73-165
d. Description and distribution of the report that will be prepared.
A debriefinq may be arranged, time permitting, to give the comandsection a general appraisal of the runway's performance. Ho specific numbershould be provided until the data have been analyzed; however, a qualitativeoverview can be made, such as excellent, good, fair, or poor, and a generalstatement can be made if there appears to be a potential skidding problem.
4
-44

AFWL-TR-73-165
SECTICH II
SELECTIOMJ AND LAYOUT OF TEST SECTIONS6
1. GENERAL REQUIREMENTS
The AFWL standard test is conducted on preselected 2000-foot strips of
pavement surface. To get skid resistance data that is representative of all
areas of the runway, test strips should be laid out in each of the following
areas.
a. Touchdown area, primary end.
b. Touchdown area, secondary end.
c. Central interior areas of runway (traffic area).
d. Runway edge (nontraffic area).
If a combination of surface materials are present on a given runway (e.g.,
portland cement concrete touchdown area at one end or asphaltic concrete cierlays
on portions of the runway), test strips should be laid out in such a way that
I. data will be obtained on each surfacing material present. Likewise, if drainage
conditions differ significantly between sections of the runway test strips should
be selected to give representative data from all extremes.
In touchdown areas, test strips should be selected to give representative
datd from any rubber-coated areas present. On both portland cement and asphaltic
concrete runways, one test strip should be placed at the edge of the runway wherr.
little or no traffic has passed. Data from this test strip are indicative of
the surface texture of the pavement surface without the polishirng effect; of
traffic.
2. TYPICAL LAYOUT
Figure I shows a typical layout of test strips on a runway surfaced th,'ough-
out with the same material. Precise locations of test strips, laterally and
longitudinally, should not be determined exactly from this figure, howe~er; eacr
runway presents a unique case, and test strips must be located on the basis of
an on-site inspection and determination of which areas of the runway are repre-
sentative of conditions that exist. The number of test strips shown in figure I
is considered the minimum necessary to adequately characterize an average runwa).
5
F'P-L-TR-73-165
W/2X XI
PATH OF -ENEST! RUEER BLVDUP
E F
NJ
h'5,
N NN Ix 0 -0
C N 0 0
G
0
A.B
Figure 1. Typical Layout of Test Strips

AFWL-TR-73-165
In some cases, a single test section on the secondary runway end may be adequate
if the rubber buildup is small. A facsimile of figure 1 is reproduced in
appendix 1i; this form can be used to record the actual location of test sections
during the testing sequence.
To establish the location of the test areas to be used, the test conductor
must make a full-length inspection of the runway surface. If possible, it is
advisable to do this the day before testing. The inspection, plus a review of
the runway drawings, will permit selection of test locations prior to actual
,arking of the areas.
The distance test sections are located from the runway centerline is
determined by inspection of the rubber buildup areas. The heaviest rubber
accumulation will occur in the wheel path most comnon to the aircraft u .In,4 tre
specific runway. Once the lateral distance from the centerline is est'.Llished,
the centerline of the 10-foot test sections is estaolished to corresponJ to th.is
location. For example, if the heaviest rubber buildup is located at a point
8 feet from the centerline, the centerline of all test sections selected wi'l
also be 8 feet from the runway centerline (except the edge test section). The
longitudinal location of the rubber area test section is determireo by the lergtm
of the buildup area. It is desirable, whe,, possible, to center the heaviest
buildup area at mid-point of the 2000-foot sectio.
Figure 2 shows in detail a 2000-fot test strip. The pr,ruedure for marking
and laying out the test strips is given below. Generally, the selection ard
marking proc2eds from one end of the runway toward the other end.
a. Locate one end of the test strip, measure the appropriate distance
*' from the centerline, and mark the pavement surface with spray paint (a 3- to A-
inch circular mark). Measure 10 feet perpendicular to the runway centerline and
mark the other corner of the test section.
b. Using the fifth wheel distance readout on the DBV, measure 2000 feet
down the runway and mark the end of test strip in the same manner as before.
c. Locate and mark with spray paint the point at which the DBV will
apply the brakes. This point is normally 300 feet from the test section end at
which the water truck begins discharging water. (The 300-foot dimension is not
and absolute value and can be varied to meet the individual runway conditions.
Sufficient distance must remain within the test section to allow the DBV to stop.)
d. Once testing begins, traffic cones -re used to mark the section being
tested.7

AF-TP-73-1 65
DiRECTIONOF
WATER TRUCK
-o0
----:-STA~R OFDBV AREA
END OF DBV AREA - A(THESE CONES ARE PLACED
WHERE DBV COMES TO ITSFIRST STOP)
! °o
A-LOCATION OFTRAFFIC CONES
A APPROX.
10'
Figure 2. Typical Test Strip

AFWL-TR-73-165
SECT!ON; III
WPTER TRUCK CALIBPATIO,
1. GENERAL REQUIREMENTS FOR WATER TPY":K
The AFVL standard skid resistance test requires evaluation of the pav~erc
under dry conditions and under artifically wet condi-r'r.s simulatirg natural
precipitation. W'ater tank trucks employed by flightline fire departments for
foam applisation h~ve been found quite adequate for use in wetting the paveent
for the standard test.
To adequately wet the test area, the truck used must have a total capacity
in excess of 3000 gallons. If two trucks are used, each should have at least
1500 gallons. The F-6 class tanker, which is available at most bases, works
quite well. Extreme care should be taken to ensure that the water, either in
storage on the truck or during spraying application, does not become contardinated
by a foamirg agent.
The spray must be pump fed and capable of holding a constant discharge
pressure. The pump must operate as a separate unit, independent of the vehicle
drive train, and sufficient instrumentation must be available to enable operation
at a constant cutput. A valve should be located between pump and spray bar so
that the pump can be stabilized at a static pressure before the wetting run is
initiated.
The spray bar width should provide a traffic lane capable of accommodating
the DBV and Mu-Meter test vehicles. The width of water path must be a minimum
of 8 feet and a maximuum of 12 feet. The actual spray width is determined byI measuring the actual lay-down width innediately behind the water truck. Ideal
height for spray nozzles is 12 inches above the pavement surface. This optimizes
the water pdttern and reduces loss due to wind. The spray bar should be centered
on the axis of the truck so that the driver will not have difficulty in correctly
positioning the wetted lane.
The tractor unit for the water truck must be equipped with a tachometer or
a fifth wheel for precise speed determination, thus eliminating inaccuracies
found in vehicle speedometers. Gearing/axle ratio must enable the truck to

AFWL-TR-73-165
aintain a constant low speed under changing load. (Test speed is nomally
between 5 and 10 mph.)
2. METHOD OF CALIBRATION
Exact determination of water quantity applied in the paverent is crucial to
-he accurate analysis of data when simulating natural precipitation. It has
heen determined that the application of 0.2 inch of water within a 15- to 20-
minue period duplicates a heavy rainfall rate in excess of operational minimurrs.
This creates a "worst possible" condition from which a time-dependent change in
the coefficient of friction can be evaluated.
In the AFIL standard test, application of water is made in two passes of the
truck, each applying 0.1 inch of water. For a truck equipped with an 8-foot
spray width, 500 gallons must be evenly applied through 1000 feet to yield 0.1
inch application depth; with larger spray bars output increases in direct oro-
portion to length of the spray bar. This relationship is shotn graphically in
figure 3. To ensure this output, pump speed and truck speed must rerain onstariT..
An iterative procedare for calibrating the water truck has been established and
can be applied to water trucks equipped as previously described.
Basically the iterative procedure consists of dumping a fill tank of water
with the truck traveling at a constant speed and with constant jump output and
measuring the pavement length and time required to dump the full tank. From
these results, the speed required to put down a depth of 0.1 inch of water is
calculated, and this calculaLed soaed is refined by a dry run over a 2000-foot
section. Suggested steps in calibration of the water truck follow.
a. Locate sufficient pavement area to allow uninter-upted operations
For at least 2 hours. Preferably this area should allow for operating the water
-'uck in a straight line only (3000 to 8000 feet long,. A taxiway would be ade-
quate f-cr the calibr-ation of the water truck. The actual length of pavement area
required will depend upon the capacity of the water truck.
b. Select a setting of the tachometer (or fifth wheel indicator meter,
usually reading in ft/mir) for the initial calibration run. All runs miust be
made at constant speed with constant gear/axle setting. From previous experirnce,
the best starting point in calibration is a second-gear, low-range axle with
1800 RP1 tack setting (or 500 ft/min on the fifth wheel indicator meter). The
setting selected should not vary by more than + 25 RPM (or + 10 ft/min, respec-
tively, during any time that the truck is discharging water.
10
_-'U

A NL-TR-73-165
w co
--------------------------------------- C)
LL I I
004a)
0-
I - I~Q
I (Oto
0 in 0 to 0 tC~8I A HiDN 0V Wd

APL-TR-73-165
c. Instruct the pump operator to bring the pump tc a raxirun, stable,
static pressure before water application. Note this pressure reading and be-ore
all future watering operations (calibration or actual test) establish the static
pressure at the same setting. This will ensure a uniforn, known water output
which does not vary. Do not under any circumstances vary purcp fl'ar pressure
once wetting has begun. Ensure that the water truck is filled to capacity at
the start of calibration runs.
d. After static pump pressure has been established, start the truck
moving at prescribed gear/axie/RPM setting, begin discharging water and rrark
the startinn point for water discharge with a traffic cone.
e. If the section of pavement available is too short for a continuous
discharge, establish a convenient cutoff point by setting up traffic cones.
When the truck reaches this location, the pump operator closes the valve and
stops the water discharge. The truck then turns around and establishes a con-
stant speed before reentering the test section. The water is started again at
the traffic cones marking the calibration section.
f. Record to the nearest second on a stopwatch the time required to
empty the truck. In the case of e above, take special care to record only the
actual wetting time.
g. Mark the location at which the truck runs out of water with a traffic
cone. Using the DBV, measure and record the actual distance required to empty
the truck.
h. Once distance and time for complete discharge under controlled condi-
tions have been determined, apply the following relationship to find the approxi-
mate tachometer or fifth wheel setting for the required discharge/lO00 feet of
test strip:aRPMd : - x RPMa
where
RPMd = Tachometer setting in RPM (or fifth wheel meter reading) toyield desired discharge per 1000 feet
Wa = No. gallons of water discharged during calibration (equal tototal capacity of the truck) divided by No. thousands of feettraversed
Wd = No. gallons of water desired per 1000 feet (read from figure 3)
12

APL-TR-73-165
RP a = Tachometer setting RP* (or fifth wheel reter reading) usedduring calibration run
i. Calculate the tire required to place the necessary volume of water
on a 2000-foot test strip using the foliowng relatioship
Td =-x T.W~a
where
Td = Time required to apply desired water ,n 2000 feet
Hd = No. gallons of water desired per 1000 feet (read fror. fir.re 3'
Wa = No. gallons of water discharged divided by No. thousand of feettraversed
T = Measured time to traverse 2000 feet of test section in actuala run = 2 (tot&! time/distance in thousands of feet)
j. Lay out a 2000-foot section to be used in additional calibration
runs. No water need be applied during these check runs. Using the tachometer
i (or fifth wheel setting) calculated above, make another calibration run over the
2000-foot strip and measure the exact time required to wet the strip. if this
actual time differs from the calculated time above, compute again the tachometer
I• (or fifth wheel) setting from this relationship
TaRPMd T x PP1a "
d
k. If T and Td are significantly different from each other, it may be
necessary tu repeat step j to achieve the desired accuracy in RPM (or fifth
wheel ) setting.
1. Example: A 4000-gallon truck discharged its total load through a
1O-foot spray bar over a total distance of 9500 feet in 16.5 minutes. The truck
,ias running at 1800 RPM in second gear/low axle range. At what RP4 should the
second calibration run be made and what is the expected time to wet a 2000-foot
test strip with 0.1 inch of water?
13L4

AFWL-TR-73-165
RPMd = a RP ad jx R
RPMd = (4000/9.5) x 1800630
= 1200 RP1M
Wd TTd = a
a
630(4000/9.5) x 2(*16.5/9.5)
- 5.2 minutes
If a 2000-foot test strip is traversed in 5 minutes while the
tachometer is set at 1200 RPM, what is the final adjusted RP4 for wetting the
test section?
RPd T-a x RPMad
5. x 12005.2
= 1150 RPM
3. WATER TRUCK CREW BRIEFING CHECK LIST
A check list for use -in briefing the crew operating the water truck(s) is
included in appendix II. The items included on this list should assist in
preparing the water truck crew for competent and professional performance of
their assigned tasks. The check list can be reproduced for use while gathering
field data.
14

AFWL-TR-73 165
I: SECTION IV
CALIBRATION OF MU-METER
1. GENERAL
To ensure the M1u-Meter is functioning properly and correct friction values
are being recorded, a standard calibration check is required at the beginning
and at the end of each day of testinq and after each change of tires. Addi-
tionally, if measured friction values should suddenly change unexpectedly, a
calibration check should be made immediately to ensure the validity of data
gathered. Each calibration check is preceded by a check of tire pressure, which
must be kept exactly at 10 psi. As a further precaution that valid data is
being gathered, tire pressure should be checked periodically during the day while
tests are being run. It is suggested these checks be made after completion of a
test section. Any deviation of tire pressure from 10 psi should be immediately
corrected and noted on the data sheet.
* .2. STEPS IN STANDARD CLAIBRATION TEST
* The following steps outline the correct procedure for calibration of the Mu-4 Meter. A minimum of two operators are required.
a. At the beginning of each day's testing the Mu-Meter should be warmed
up before the calibration is checked or corrected. The warm-up should consist
of operating the Mu-Meter in a test mode for 15 minutes.
b. Tire pressure must be set at precisely 10 psi.
c. Select a clean, dry 3rea. Disconnect the Mu-Meter from the towing
vehicle, and position the jockey wheel.
d. Place the standard checking board approximately 3 to 4 feet in front
of the Mu-Meter with the measuring wheels in line with the abrasive surfaces of
the checking board. Avoid walking on the abrasive surfaces while conducting the
test.
e. The calibration board is cleaned by brushing the s-irface. The Mu-
Meter tires are cleaned with a soft cloth to remove any small oirt particles,
moisture, etc. The area between the board and Mu-Meter i also brushed clean.These cleaning procedures are very important to assure accurate calibration
readings.
15

APL-TR-73-165
f. While one operator pulls the machine forward over the checking board,
the second operator follows and oscillates the roll chart as the machine is
moving, thus lessening the friction between the recorder stylus and the roll
chart surface.
g. Check the stylus marking on the roll chart. Repeat this operation
three additional times. The average of the last three readings should be equal
to 0.77. If the stylus marking average differs from 0.77, the Mu-Meter must be
adjusted as described in the following subsection.
3. ADJUSTMENT OF THE MU-METER
If it is found that friction readings are low, the adjustment turnbuckle
should be shortened to increase the foed-out angle of the tires, alternative',
if the readings are high, the turnbuckle should be lengthened to decrease the
toed-out angle. The correct amount of adjustment can be arrived at in both
case only by trial and error. To adjust the wheel toed-out angle, proceed as
follows:
a. Remove the lockwire from the wheel adjustment turnbuckle.
b. Slacken the turnbuckle locknuts one-half turn (one right-hand and
the other left-hand thread).
c. Turn the tension rod by no more than a half-turn to shorten or
lengthen the turnbuckle as appropriate to increase or decrease the toed-out
angle. Temporarily tighten the locknuts.
d. Perform the calibration test outlined in section IV.2, and shorten
or lengthen the tension rod progressively by small increments after each run
until the readings are restored precisely to 0.77.
e. When an average reading of 0.77 is achieved, tighten the turnbuckle
locknuts and lock the turnbuckle with stainless steel wire.
16

AFWL-TR-73-165
I-:.
SECTION V
SKID DATA COLLECTION
1. GENERAL
As part of the standard test, a number of items used in the analysis of
data must be recorded for each test section. These items are listed below
(with examples). The format for recording each item is shown in figures 4 and
5. Note that figure 4 also contains spaces for the watering record (spaces
numbered 47 through 72). The times of water appiications are recorded by the
technician riding with the water truck, as explained in section V.4; the form
in figure 4 must therefore be in the technician's hands when the watering pro-
cedure is started. The remaining data shown below can be recorded at the
convenience of the test conductor.
Base (6 letter abbreviation) L rUITI
Test strip designation I,
Runway identification (small number first' 06/24
Test section description (rubber, center, edge, etc.) RUBBER
Temperature in OF 60
Dew point in OF 48
Wind direction in compass degrees 270
S Wind velocity in knots 20
Gusty wind velocity in knots 2
Watering record (see section V.4)
Type pavement (PCC, ACC, etc.) PCC
Longitudinal slope in percent (From record drawings. -1.5Slope is positive if the elevation is increasingto the north or east.)
Tranverse slope in percent (This is the average -1.2*. slope of the test section as recorded by the
slope measuring device.)
17
gaw - -
Li 6 IM *.;.- I

AF1,L-TR-73-165
RECORDER
BASE ST RUNWAY TEST STRIP26 :7GENERALAaKIfON IDN DESCRPIONGERA
S 4 I 9 Ifl.. M INFORMATION
ILIP14HIrH ,,,/ fi 7" r G/j2j4RjUj~5Ej EXAMPLE
TEM DEW WID WIND GUST.11PV DIR. VEL WINDSNVEL. WEATHER
28 29 30 34 35 ~37 38 39 A 142 144 INFORMATION
EXAMPLE
WATER INTOt STRIP WATER .NDBV STRIP WATER 'OUiTT STRIP
HR. 7jMIN. K/ASEC HR. MIN. // SEC. HR. MIN. SEC. WATER
474 . 1 53 54 .60 6-6 656 6869 772 RECORD
14 41 r______ '01_'11'41_____11'__. EXAMPLE
ZERO WATER TIME
HR. M N. ,EC.
NOTES: 0 - LETTER 00 = ZEROALL DATA IS RIGHT JUSTIFIED. THIS MEANS ANY BLANK
SPACES AFPEAR AT THE LEFT OF THE FIELD.
Figure 4. General Information, Weather, and Water Record
18

AFWL-TR-73-165
BASE RUNWAY
RECORDER DATE
TEST SECTION
TYPE LONG. TRANS- SECTION DIST TO WATER
VERWE EJJ STARTPJrMENT SLOPE SLOPE LENGTH FROM ( OC DEPTH
EXAMPLE
NO NOV /,NO0 NO0 NO()Y' DRY TARE "WET VAWET DATE (S) OF TEST
MU MU B
o NS P/,UNS !3 %rN /RUNS U
eAl44 45 41 48~ 5 5354 15 5? 01656666768 690 TO 72
EXAMPLE
zHI 2 N IZ~ N I1 1 NO, OV 12Izl
NOTES 0- LETTER 00 = ZERO
A4-L DATA IS RIGHT JUSTIFIED. THIS MEANS ANYBLANK SPACES ARE AT LEFT OF FIELD
Figure 5. General Information
19

AFWL-TR-73-165
Length of test section in feet 2000
Distance from centerline in feet 5
Distance to start of DBV section from end of 300total section
Water depth in inches (Leave these spaces blank. This .008value was developed only for research at AFIL.)
Number of dry Miu-Meter runs in section 2
Number of dry DBV runs in section 2
Number of tare runs in section (Leave these spaces 10blank. This value was developed only for researchat ARIL.)
Number of wet DBV runs in section 8
Date(s) of test 11-12 Nov 72
2. SEQUENCE OF EVENTS
The following outline contains an overview of events which must take place
during the testing program.
a. Before testing (afternoon before test day)
(1) Briefing of base personnel.
(2) Arrange with motor pool for tire change and high-test gasoline
for the DBV.
(3) Check storage area provided for the equipment and arrange to
pick up equipment about 2 hours before testing.
(4) Check on availability of a taxiway that could be used for water
truck calibration before testing period.
(5) Test conductor inspects the runway and selects general location
for test sections.
(6) Test conductor conducts a team briefing to go over testing
sequence, test section location, order that test sections will be tested, and
team assignments.
20

AFWL-TR-73-165i,b. Two hours before runway closure
(1) Complete vehicle check lists.
(2) Brief fire truck crew.
(3) Warm up the Mu-eter by driving it with the wheels toed out for
about 15 minutes.
(4) Calibrate Mu-Meter after warmup.
(5) Arrange to have BAK-9/12 removed from both ends of the runway
as soon as runway is closed.
'6) Final check of test sequence with crew.
c. Dry Test (2 hours)
(1) Test conductor selects and marks test sections (DBV provides
measurements).
(2) Mu-Meter personnel make the slope measurements at predetermined
intervals.
(3) Water truck calibration (DBV provides periodic distance measure-
ments). Items a to c occur simultaneously. The water truck may have been cali-
brated earlier and if so this period should be used to check out the driver and
pump operator over a 2000-foot calibration section.
(4) Dry stops--DBV. After each test section has been marked the
DBV can make the dry stops on that section.
(5) Dry test--4u-Meter. Once slope measurements are complete the
Mu-Meter may begin making dry test runs.
(6) It is desirable to make full-length runway Mu-Meter recordings
if time is available. The Mu-Meter tape should be marked using the runway
markers as distance indicators. Figure 6 indicates locations for the full length
Mu-Meter runs.
It must be noted that as soon as the DBV completes the dry test it
should be rweeased to go to the motor pool for the tire change.
d. Wet Test Period
(I Check out fire truck crew.
21

A~:L~IR13A 6S4
z0
4,
ill ILl ~Ci-s~ \ \~ o C
0-
0
2 inC
0
I -4-C.
I 2
U-I ItO
'I
V
w ( z
0 10
z2
~ ~ ~ A-
-~4-' 4,- 2
~ -4"

AFIL-TR-73-165
(2) Test conductor places traffic cones in test section and
positions vehicles.
7 (3) Test conductor starts water truck.
(4) When the water truck is finished it exits the runway and refills.
(5) The DBV is started by the test conductor when the water truc}
reaches a predetermined location.
(6) The test conductor starts the Mu-1,eter when the water truck is
at the correct location.
(7) The DBV makes the return run when the Mu-Meter clears the test
section. The Mu-Meter then makes its return run when the DBV clears. This is
c~ntinued until 6 runs have been made.
(8) After the third run the test conductor begins setting up the
next test section.
(9) Mu-Meter makes a 20-minute run.
(10) Both vehicles make test runs at 30 minutes.
(11) Test conductor then starts the water truck on the wetting
passes of the next te,.t section.
(12) Vehicles complete check list and get into position and repeat
abovt sequence.
(i3) After run number 6 the Mu-Meter returns to the previous test
section and makes two additional runs. This provides 40 to 50 mintte data points.
3. DRY RUNWAY TESTS
Both the DBV and the Mu-Meter are used in testing dry surfaces. Data sheets
have been prepared for recording the data in punch card format as it is gathered
by the technicians riding in the DBV and the Mu-Meter towing vehicle. Figure 7
shows the data sheets for use with the Mu-Meter and figure 8 shows the data
sheets for use with the DBV. The data gathered for each Mu-Meter run include
(with examples shown):
23

AFWL-TR-73-165
BASE RUNWAY
RECORDER DATE
TEST SECTION
FIRST RUN SECOND RUNRUN T E C RUN f TMI,,C 8
DESIGt.ATION |)IAL DEAL DESGNATION IDEAL9 X1 C p 2 2=2 iiiffii
THIRD RUN FOURTH RUNRUN TI/J {~ C~ XX Br RUN~ MEc
DESIGNATON I V//A DIAL // DIAL! DESIGNATION DIAL
Ii i ! -ii1;
NOTES: 0 = LETTER 00= ZEROALL DATA IS RIGHT JUSTFIED. THIS MEANSANY BLANK SPACES ARE AT LEFT OFFIELD.
EXAMPLERUN TMNE c B
DES -NATION D DIAL, 7 8 9 1 0 .1 3 4 ,5 1Y,, , 7o1c~ D 35 IT, z.
Figure 7. Mu-Meter Runs on Dry Pavement
24

AFWL-TR-73-15
BASE RUNWAY_ _
RECORDER. DATE
TEST SECTION
FIRST RUN SECOND RUN
RUN TrAE iVEiSO RN T VE STOP
THIRD RUN FOURTH RUN
DESIGNATION Mph', : ST DESIGNATION T
NOTES. O= LETTER 00= ZEROALL DATA IS RIGHT JUSTIFIED. THIS MEANSANY BLANK SPACES ARE AT LEFT OFFIELD.
EXAMPLEI RUN ITIMEV//VEL JSO1
II I13 14 1-5 1 I8I9IoF F1415 &1718 Is
A 1 1IDE 1359 .3 5
Figure 8. DBV Runs on Dry Pavement
25
'Il "'A,.~ ~~.

AFL-TR-73-165
' Designation of Run A0l1CA
A is the test strip designation
01 means it is the first run rade in that strip
D means the pavement was dry
W means the vehicle was traveling in westerly direction
Time Entering Strip (24-hour clock) 1356
"C" Dial Reading (from instrumentation) 33
"B" Dial Reading (from instrwnentation) 102
(The "C" dial reading divided by "B" dial reading is the integrated
coefficient of friction value over the area traversed.)
The data gathered from each DBV run include (with examples shown):
Designation of Run AOIDE
A is the test strip designation
01 means it is the first run made in that strip
D means the pavement was dry
E me~s the veilicle was traveling in an easterly direction
Time Entering Strip (24-hour clock) 1358
Initial Velocity in mph 61
Stopping Distance in Feet 0355
A minimum of two readings (one in each direction) should be made in each
test strip while the pavement is dry; up to four readings can be processed in
tne coirjuter program.
4. APPLICATION OF WATER
As soon as dry testing has been completed and vehicles serviced, the water
truck(s), DBV, and Mu-Meter should be placed in that order at the end of the
test strip, in preparation for the wet testing sequence. The suggested order
of events for application of water to each test strip is as follows:
a. Water truck makes first wetting pass releasing 0.1 inch of water as
determined in the calibration run. If only one water truck is being used,
driver returns the truck to the starting point as rapidly as possible.
26

1< AFWL-TR-73-165
b. Water truck makes second wetting pass, releasing another 0.1 inch
of water. if two trucks are being used in the wetting operation, the second
truck starts its wetting pass as soon as the first truck has wetted approximately
1000 feet of the test strip. The time the second water truck enters the testsection, the time it enters the OBV portion of the test section, and the time
it exits the total section are recorded in spaces 47 through 72 of the form shown
in figure 4, using the format shown below.
Water Truck "in" Time, Total Section (2nd pass) 14 41 05
(in hours, minutes, seconds on 24-hour clock)
Water Truck "In" Time, DBV Section (2nd pass) 14 41 4;!
Water Truck "Out" Time, Total Section (2nd pass) 14 45 01
As stated earlier, the data sheet shown in figure A should be in the
hands of the technician recorder riding with the water truck, for recording of
the times shown.
c. Technican recorder computes the zero water time (average of the
Water "In" Total Strip and Water "Out" Total Strip), and records it or. the forms
shown in figure 4. This time is relayed by radio to the test conductor for con-
trolling run times of the DBV and Iu-Meter.
d. The water trucks turn sharply out of the way at the end of the test
strip, tanks are refilled to capacity, and the trucks return to the edge rf thE
runway. The test conductor directs the water truck into position at the eppro-
priate time.
5. WFT RUflAY TESTS
As soon as the second water pass is underway and the water truck is a suffi-
cient distance down the test strip to avoid a possible rear-end collision, the
DBV should begin its first run. The following distances can be used as a guide
for determining what a sufficient distance down the test strip is, based on the
DBV section placed 300 feet from the end.
Type of Test Strip Distance, Feet
Rubber coated touchdown area 1400
'Runway center 1100
Runway edge 1 00(
27

AFWL-TR-73-165
The following is the suggested sequence of events for gathering data on the
wetted pavement:
a. DBV makes its first run, applying brakes at the beginning of the DBV
section. Traffic cone is placed at the point of stop by the test conductor.The technican recorder in the DBV records the following data in the format of
figure 9 (with examples shown below):
Designation of Run
AA is the test strip designation
01 means it is the first DBV run made in that strip
W means the pavement was wet
S means the vehicle was traveling in a southerly direction
"Lock" Time of DBV (in hours, minutes, 10 55 21seconds, on 24-hour clock)
"Stop" Time of DBV 10 55 42
Initial Velocity in mph 60
Stopping Distance in Feet 1116
Stopping Distance Adjusted to 60 mph 1116(= stopping distance multiplied byconversion factor shown in table I)
As soon as the DBV has come to a complete stop and the point has been marked
with a cone (on the first run), the driver of the DBV turns sharply out of the
test strip and accelerates around the water truck and out of the way of the
Mu-Meter.
b. The Mu-Meter follows as soon as the water truck is approximately
1800 feet down the test strip (200 feet from completion of the second wetting
pass). Instructions to start are given by the test conductor. "Blips" on the
Mu-Meter tape are used to mark the ends of the test strip and both ends of the
DBV section of the test strip as the equipment passes those points. Two "blips" A
are used to mark each end of the test strip and a single "blip" is used to mark
each end of the DBV section. The technician recorder in the Mu-Meter towing
vehicle records the following information in the format of figure 10 (with
examples following).
28

AFWL-TR- 73-165
AIRFIELD RUNWAY_ _ _
RECORDER DATE
RUN LOCK TIME STOP 1IME ' TEST STOP STOP/I" SPEED DIST DIST
DESIGNATION h M h / h m mph T ADJ.TO 6O1. -- -- - - - MPH
S3 456 9 12 14156 W819 C212224 Z57 33
I/I
*I 4
1. . /
I Izi / /
NOTi ZEO , LETE /-0 AL!AAISRGT1 JSIID
0, /
"TE F
igue9.iVtpin Ti /n Distneo/ etPvn
i~lo,
AIIII n 51 rd '2 1Il 11,I 51 /d23[J& I nt 1-U
.OTNOTES ZERO-{ , LETTER O-O.ALL DATA IS RIGHT- JUSTIFIED).'-: THIS MEANS ANY BLANK SPACES ARE AT LEFT OF FIELD
! Figure 9. DBV Stopping Time and Distance on Viet Pavement
29. -"

AFW4L-TR-73--165
Table I
CONVERSION FACTORS FOR STOPPING DISTANCES
To Convert a Stopping Distance Multiply the SD by(SD) at this MPH this Factor
55 1.190
56 1.148
57 1.108
58 1.070
59 1.034
60 1.000
51 0.967
62 0n.936
63 0.9C7
64 0.879
65 0.852
;q;
30

4F L-TR-73-11"
AIRFIELD RUNWAY
RECORDER DATE
RUN TIME IN TIME OUT c g INTE-- GRATED
DESIGNATION s h m s DIAL DIAL COEF
411Is 0 9 isQ AA. 1798 19 21 2 24 3 2 74± ?A _s41I K
SI----- ,1 -I
4! --- ! -- -
I /
0A1~/ AA 3 (9 ' 35*. ~
8i4>WS I 4- 6 ir .- 54I 9
NOTES ZEO , ETER= . LLC •~I RGTJUSI1
31A
[,A A/ I I/A A! I ; Io' /l / 11/ 1 30
0 . 0 64
/o7514-/I
..... / 4+13 i pI
NOTES.' ZERO" 0, LETTER-O. ALL DATA IS RIGHT- JUSTIFIED.~THIS MEANS ANY BLANK SPACES ARE AT LEFT OF FIELD.
! Figure W0. t,!u-Meter M-easurements of Pavement Friction on I,,;et Pavement
31

AFWL-TR-73-165
Designation of Run
AA is the test strip desiqnation
01 means it is the first Ki-Meter run made in that strip
W means the pavenient w-as wet
N means the vehicle was traveling in a northerly direction
Mu-Meter "In" Time 10 13 19
Mu-eter "Out" Time 10 13 54
. "C" Dial Reading (from ir-trumentation) 32
"B" Dial Reading (from instrumentation) 103
Integrated Coefficient (=C/O. This is a 31calculation to check the accuracy ofdate being gathered.)
c. As soon as the Mu-Meter exits the test strip, the DBV starts its rur,in the opposite direction. Data are recorded as before, using thp next line of
the forrr, shown in figure 9.
d. When the DBV has skidded to a stop and has cleared, the ariver
notifies tfIe test conductor by radio that he is clear; the Mu-eter follows dowrn
the test strip. Data are recorded as before, using the next line of the fo-m
shown in figure 10.
e. Repeating the procedure in 3 and 4 above, four additional runs of
the DBV and Mu-Meter are made (two additional "round-trips" on the test strip).
f. At approximately 20 minutes and 30 minutes after "zero water time"
(a' defined in section V.4), an additional run of the Flu-Meter is made. If the
pavement is not dry, the Mu-Meter run 30 minutes after "zero water time" is
preceded by a run of the DBV. If the pavement is dry to the point that it would
excessively wear the locked wheel tires on the DBV, this run is omitted from the
* standard test. On runway surfaces where the 30-minute DBV run is omitted, both
vehicles make the 20-minute run on the next test section.
6. EXTRACTION OF DATA FROM MU-METER TAPES
While Mu-Meter runs on the wetted surface are being made, d continuous tape
record of the coefficient of friction is being recorded. At the beginning of
each Mu-Meter run, the tape is manually marked with the same run designation used
32

AFWL-TR-73-165
in figure 10. As stated earlier, "blips" are used to show the boundaries of the
test section--two "blips" to mark the beginning and the end of each test strip
and a single "blip" to mark the beginning and the end of the DBY section.
When the Mu-Meter runs for a test section have been completed, the data
shown in figure 11 must be extracted from the tapes and recorded where designated.
These data consist of the following (with examples):
Minimum Mu over Total Test Section 30
Maximum Mu Over Total Test Section 60
Average Mu Over Total Test Section 50 *(This is an "eyeballed" valu2.)
Minimum Mu Over DBV Area 35
MP imum Mu Over DBV Area 40
Average Mu Over DBV Area 45(This is an "eyeballed" value.)
Run Designation (same as in figure 10) AAOiWSI
Note that the columns of the form in figure 11 are numbered beginning with
36. This form is actually a continuation of figure 10 so that the two of them
must be placed together (side by side) when data are keypunched. The run desig-
nations of figure 11 must therefore follow the same order as those of figure 10,
when the data in figure 11 are extracted fror the Mu-Mleter tapes. The actual
extraction of the data from the tapes can, of course, be accomplished at any
time after the testing of a section is completed and at the convenience of the
test conductor.
• This value is used to check the integrated value obtained. If a large varianceis noted, then this section of the Mu-Meter tape must be planimetered to obtainthe average Mu value.
133£ trr, , 2 ~

AFtIL-TR-73-165
AIn ELD RUNWAY
RECORDER DATE
' MU, MAX. U, VG MU, MIN. MU, MAX..MU, I/ G, MU, RUNTOTO IL TOTAL DBV DBV DBV
SECTICN SECTION ECTION AREA AREA AREA DESIGNMI'ION
a 3 3 39401 4 4 44424 1 4 4 5C5Z33 4 3S 57 53 9W6636 65 67 6 69 70 71 7:Tf' T:1 , :55.i .jY
I-,-2
"I0
- I A
-11
EXAMPLES
# !- i/K~Ai~
5. i 5io 42__ 'z -5V' .hI.LL±I
iT, 7 / . -F,,,
NOTES: ZERO -0, LETTER 0 -0 ALL DATA IS RIGHT- JUSTIFIED.THIS MEANS ANY BLANK SIACES ARE AT LEFT OF FiELD.
Figure 11. M-u-M4eter Tape Data
34

AFWL-TR-73-165
SECTIOn VI
SLOPE MEASUREMENT
1. GENERAL
The relative slipperiness of a pavemint and, consequently, its tendency to
encourage hydroplaning are closely related o the depth of the water held on
its surface. Since the amount and depth of water held are directly related to
the slope of the surface, a complete evaluation of surface slope is conducted
as part of the standard AFWL skid resistance test. Longitudinal slope of each
test section (being of lesser importance in draining water away than lateral
slope) is taken from any record drawings which may be available, and is recorded
with the "general information" data shown in figure 5.
Lateral slope measurement is done with a specially constructed straightedge
equipped with leveling bubbles. Measurements are taken on both sides of the
runway centerline at 500- or 1000-foot irtervals throughout the length of the
runway. Normal procedure is to measure the slope at a starting point at the end,
and then to choose subsequent points to coincide with runway distance narers
and/or points halfway between markers. The fifth wheel distance readout on the
DBV is used to determine the location of points, and each point is marked with
spray paint, prior to slope measurement. Two slope measurenents are made on
each side of the centerline at each designated point. If the pavement has been
loaded primarily by one aircraft type (e.g., 0-52 traffic at a SAC base), slope
measurements must be made to include the wheel path areas. This distance has
previously been determined by the examination of the rubber areas. A general
procedure is as follows:
a. Make one slope measurement at each point with the slope measuring
device perpendicular to and touching the runway centertline.
b. Make a second slope measurement with the device located a distance
equal to the length of the straightedge from the centerline.
c. Repeat the above procedure at each point for the area on the opposite
side of the centerline.
35

AFWL-TR-73-165
d. Record all measured slopes (in perc.ent) on the form shown in figure
12, using the sign convention indicated. Note that the for. is designed so that
measurements can begin at either end of the runway, by designating the starting
end in spaces labeled RUNWAY END. Each line rontains slope measurelents made on
both sides of the centerline at a single point; use as many lines as are neces-
sary to record the lateral slope of the entire runway.
2. COMPUTATIGN OF AVERAGE LATERAL SLOPE
The vertical "boxes" at each side of the form in figure 12 are provided for
ease in marking the location of test st ips. Two examples are provided showing
the locations of test strips B and F. (The example provided indicates that test
strip B lies between runway distance markers I and 3.) If the location of any
test strip is on the left of the runway centerline, its location is marked in
the vertical "box" on the left of the form, and similarly for test strips on the
right of the runway centerline. Once the location of a test strip is marked,
the average lateral slope of that strip can be computed by averaging all included
slope measurements on the same side of the centerline. This average number must
then be entered as the transverse slope of that part cular test section 7.n the
form in figure 5.
36
.................

RECORDER RUNWAY _4 rSIGN CONVENTION
CA.SE' CASE I CA~SE~ I
... NO. LINES~1T BASE M"IA 9UEI k1 1--,ASBREV I111311I N F .A ED
o4 SECION STATION NO. SECTIONEXAMPLE 8 (R/W -/ ,,SLOPE % SLOPE %SLOPE %SLOPE ,
IMITS MARi<E LIMITS
o + 10 1 / I I~ v A
6+5100 A
92+J5100 _
3 + (100 o
I 1+0100 ___ - _ _ _
6 + ZER 0 o__r 1 0 0 0
7 071
8A8 30/
I I +
1 2 + 5 04
F' I -3 15 1 OE
RUNWAYNOTES' l END (SO)UTH,ETC)0 -Z E R O l J l l o o l - F z~ l 4 1 "I W / + "I - X M Lo- LETTER 0EXML
' Figure 12. Pavement Cross- p Meaurments

AFWL-TR-73-165
SECTION VII
USE OF THE COYPUTER ANALYSIS PACKAGE
1. GEUIERAL
The computer analysis package developed by AFML for analysis of skid
resistance data is written for use on the CDC 6600 computer system. The output
from the analysis package includes a number of plotted curves; the computer
system used must, therefore, contain plot capability.
The analysis package was developed to eliminate the drudgery of manual cal-
curations and plotting of data points, as well as to increase the accuracy of
such work. As ar added feature, the analysis package produces a written report
which, with only a small amount of individualizing for each airfield tested, can
serve as the written record of evaluation work done.
2. STEPS IN USE OF THE ANALYSIS PACKAGE
A separate AFWL publication with detailed instructions on use of the analysis
package is being prepared and will be released in the near future. The instruc-
tions contained here are intended as supplementary instructions to allow interim
use of the analysis package pending release of the 9ther publication.
Appendix I conLa4 ns a sample report produced by the analysis package. Those
portions of the report which have been individually prepared are obvious;
these sections are held to the minimum number consistent with producing an indi-
vidualized report.
As stated earlier, special forms have been prepared for recording all data
gathered and are shown in appendix 11. These forms, when properly used, are
designed such that minimum effort is required in preparing input information for
the computer analysis package. In addition to the data recording forms already
discussed and shown in previous sections of this report, a group of header cards
are required to provide essential information to the computer analysis package.
Forms for recording information for these header cards are shown in figures 13,
14, and 15 and are provided in appendix II. The information to be recorded on
header card 1 and header card group 2 follows (with examples).
38

AFWL-TR-73-165
I NO. §BASE NAME jSECTIONS /
4TESTED1112131413]61'718901 * 1 51i If s1 2 Z.4?52.
EXAMPLE
AGENCY PERFORMING TEST
272829503154333536 75639 40 4. 42 4 S 647 48 49 50 5-3 5 555555a 96
EXAMPLE
IAIIfR IFO0RkI- JC CIVI LI I£NGI NJEJERIN1G0 jCEN TE 1R1
INO, CARDS USED TOLIST REASONS FOR
TEST (AX -4
EXAMPLE
NOTES: 0 - LETTER 00 -ZERO
'BASE NAMEN AND "AGENCY PERFORMING TEST" SHO(A.D BECENTERED IN THE SPACE PROVIDED.
FIELD FOR "NO. SECTIONS TESTEDO IS RIGHT JJSTiFED. THISMEANS ANY BLANK( SPACES APPEAR AT THE LEFT OFTHE FIELD.
Figure 13. [leader Card No. 1
39

AF'L-TR-73-165
USE ALL OR ANY PORTION OF THE 4 CARDS BELOW TO RECORD REASONSFOR THE TEST (OTHER THAN EIALUATION OF SKID RESM1NE) N1IAEREDBEGINNING WITH (2).
CARD I
1 ?l l415 6I T 0 9 oi i I 21 sI i I i 69 I 1 i I32 52 92 3 2 3 5 7 3 0
i 1 1 1 i l l I ! 1 i !C R 2 1 i
CARD 215 I If."!" I' T I !'9 111. !,+ !"!"!4,51 t 8 Z 21', !12 ' .125l2612.- 29J.3 5!, !-32 33 5 !4 --Z 3 5 4II I ! 1 II~ l ~ i i i ! I I I I .1 1I
It ICARD 3
I L 6 5,,H ,'- m ?] 1 3 s7f389 40o41 41444 44 5i ;55 Illi5il 555I76 6667 697l 77 747 -I
II Iii I I!-I I I'II]CARD 4
L ' I' II I I 1 1I i 1' !1 1I
EXAMPLE[ 13 5 6 7 8 9 C. i 121314 I5 16 iT 18 120 222312425 26 27 2829 3+3152 33 34 M 3637 3 394
41 42[43144 45 46 147 4e 49 51 U2 55 54 155 56 5758e 59~ 60 bi 62636465 66 6 66 69 TO Ti 72 737 576 1771761 7901(Z)AToE0 I'1CIFIMEI :) ,'T-FHE I C TIV E -STZ 11I'
Figure 14. Header Card Group No. 2
40

AR-4-TR-73-165
NO. SECTIONS TO BE COMB INED DESIGNATION OF
101 Y, h33134135 116137138 39420
NO. SECTIONS TO BE COMBINED I DESIGNATION OFFOR OVERALL RATING OF C ENRYCT(
RUN1 (MAXY 4)TR MX.4
%J4~{4J4 30 /32?3 534 5156 357 18 394
NO. SECTIONS TO BE COMBINED DESIGNAT1ON OFFOR~~~~EG SVRL ~rGO EC TIONSY
50 53 545CPP7 8596
WHNDSINTNGTS SECTIONS TO BE COMBINEDDSGAINODESVEALAIGNAON UNESGTE SECTIONS iNTDB
A DOBLE ETXASCMPLE SEEAML ACE
Figure 15. Heade Card o. 3
NOTES O--ET41
0 ZR

AFWL-TR-73-165
Base Name Kirtland AFB
Number of Sections Tested 10
Agency Performing Test Air Force Civil EngineeringCenter
Number of Cards used to List 2
Reaso;is for Test (Max. = 4) (2) To recommend corrective(Other than evaluation of skid action, if indicatedresistance) numbered () To check RCR valuesbeginning with (2) currently in use.
Header card number 3 (figure 15) is provided to give the user some flexi-
bility on how the results are portrayed in the report. Information on this
header card is used to control the data displayed in the top of table I of the
report (see appendix I). This card is used to determine which test section data
are combined to give overall ratings -or the primary touchdown area, the central
protion of the runway, the secondary ttichdown area, and the runway edge. Combi-
nations of data fr'm test sections mus be caefully done to ensure representa-
tive values appear in the data summar . This header card give the user the
flexibility to exclude atypical sections from the summary, while still portraying
all information gathered in the report appendix.
Specific information to be recorded on header card number 3 's listed below,
with examples shown:
Number of Sections to be Combined for Overall Rating ofPrimary Touchdown Area (Max. = 4) 2
Designation of Primary Touchdown Fections to be Combined A B
Number of Sections to be Combincd for Overall Rating of
Runway Center (Max. = 4) 2
Designation of Center Sections to be Combined C D
Number of Sections to be Combined for Overall Rating ofSecondary Touchdown Area (Max. = 4) 2
Designation of Secondary Touchdown Sections to beCombined E F
Number of Edge Sections to be Cembined for OverallRating of Runway Edge (Max = 4) 1
Designation of Edge Sections to be Combined G
42

I AFWL-TR-73-165
Complete input data for the computer program should be keypunched on cards.
Following is the correct order of the cards for proper operation of the analysis
package:
a. Header card number 1
b. Header card group number 2 (may be more than I card)
c. Header card number 3
d. General information, weather, and water record for first section
e. General information for first section
f. Mu-Meter runs on dry pavement for first section
g. DBV runs on dry pavement for first section
h. ;u-Meter measurements of pavement friction on wet pavement and dat&extracted from Mu-Meter tapes for first section. (These two sheets,placed side by side for keypunching, provide a group of cards.)
i. DBV stopping time and distance on wet pavement for first section(group of cards).
j. Repeat of d through i for second section, third section, fourth, section, etc.
k. Pavement cross-slope measurements (group of cards)
S43/44

ARIL-TR-73-165/
APPENDIX I
SAM4PLE COMPUTER OUTPUT REPORT
Ji
44

AFL-TR-73-165
EVALUATION OF RUNWIAY SKID RESISTA/4CE
CHARACTERISTIC AT RAF UPPER HEYFORD
11TRODUCTIO;N
THIS REPORT CONTAIIIS A SUMMARY OF THE SIGNIFICANfT DATA RESULTING FROM SKID
RESISTANCE TESTS CONDUCTED AT RAF UPPER H|EYFORD ON 22 NOV 72. THE TEST PROGRAM4
WAS CONDUCTED BY THE AIR FORCE WEAPONS LAB USING THE STANDARD SKID RESISTANCE
TEST PROCEDURE DEVELOPED BY THE CIVIL ENGINEERING DIVISION OF THE AIR FORCE
WEAPONS LABORATORY. 1HE FIELD TESTS WERE CONDUCTED (1) TO EVALUATE THE SKID
RESISTANCE AND HYDROPLANING CHARACTERISTIC AT THE RUNWAY SURFACE (2) TO DETERIINE
IF RCR VALUES CURRENTLY IN USE ARE APPROPRIATE AND (3) TO PROVIDE USAFE WITH AN
OVERALL RANKING OF THE WET PERFORMANCE OF THE RUNWAYS TESTED TO ASSIST IN
SELECTING RECOVERY BASES DURING INCLEMENT WEATHER.
TEST PROGRAM AND EQUIPMENT
THE SKID RESISTANCE/HYDROPLANING CHARACTERISTICS OF THE RUNWAY SURFACE WERE
EVALUATED BY TWO TYPES OF TEST EQUIPMENT, THE MU-METER AND THE DIAGONALLY-BRAKED
VEHICLE (DBV). THE TEST PROGRAM CONSISTED OF FIELD MEASUREMENTS OF THE PAVEMENT
SKID RESISTANCE/HYDROPLANING POTENTIAL UNDER DRY AND STANDARDIZED ARTIFIC!ALLY
WET CONDITIONS. IN ADDITION, TRANSVERSE SLOPE MEASUREMENTS WERE CONDUCTED FOR
AREAS (APPROXIMATELY 20 FEET) ON EACH SIDE OF THE RUNWAY CENTERLINE TO EVALUATE
THE SURFACE DRAINAGE CHARACTERISTICS.
TEST LOCATIONS
A TOTAL OF 5 TEST SECTIONS (EACH TYPICALLY 2000 FEET IN LENGTH) WERE
SELECTED TO REFLECT A REPRESENTATIVE SAMPLING OF THE SKID RESISTANCE/HYDROPLANING
46

AFWL-TR-73-165
CHARACTERISTICS OF THE ENTIRE SURFACE. THE TEST SECTION4 LAYOUT IS SHOWN IN
FIGURE 1. THE TEST SECTIONS WERE SELECTED TO EXAM4INE THE PAVEMENT TRACTION INI
I (A) THE AIRCRAFT TOUCHDOWN AREAS, (B) THE RUIWdAY INTERIOR IN THE MAJOR TRAFFIC
PATHS WHERE MAXIMUM BRAKING IS NORI.ALLY DEVELOPED, AND (C) THE PAVEMENT EDGE
WHICH IS REPRESENTATIVE OF A NOI-TRAFFIC AREA.
k. WEATHER
THE TEMPERATURE DURING THE PERIOD OF TESTING RANGED BETWEEN 46 CEGREES
AND 48 DEGREES FAHRENHEIT. WIND VELOCITY VARIED BETWEEN 10 AND 13 KNOTS.IEQUIPMENT
Ft THE PRINCIPAL ITEMS OF FIELD TESTING EQUIPMENT CONSISTED OF THE MU-METER,
j THE DIAGONALLY BRAKED VEHICLE, TANK TRUCK FOR WATER APPLICATION, ArD A DEVICE
I FOR THE MEASUREMENT OF THE SLOPE OF THE PAVEMENT SURFACE.
(A) THE MU-METER IS A SMALL TRAILER UNIT DESIGNED AND MANUFACTURED BY
M. L. AVIATION (MAIDENHEAD, BIRKS, ENGLAND) FOR THE SPECIFIC PURPOSE OF EVALUA-
TION OF THE COEFFICIENT OF FRICTION (MU) FOR RUNWAY SURFACES. THE MU-METEP
PHYSICALLY EVALUATES THE SIDE-SLIP FORCE BETWEEN THE TIRES AND PAVEMENT SUPFACE.
IT IS A CONTINUOUS RECORDING DEVICE THAT GRAPHICALLY RECORDS THE COEFFICIE'iT OF
FRICTION (MU) VERSUS DISTANCE ALONG THE PAVEMENT. THIS SYSTEM IS ALSO EQUIPPED7~ WITH INSTRUMENTAIION WHICH INTEGRATES THE MU VERSUS DISTANCE CURVE TO OBTAINI
THE AVERAGE COEFFICIENT OF FRICTION FOR SELECTED AREAS WITHIN A TEST RUN. THE
4. MU-METER WAS OPERATED AT A CONSTANT SPEED OF 40 MPH, WHICH IS THE 1.2 TIMES THE
THEORETICAL HYDROPLANING SPEED OF THIS VEHICLE.
(B) "THE DBV IS A SPECIALLY DESIGNED AND HIGHLY INSTRUMENTED VEHICLE WHICH
WAS DEVELOPED TO EVALUATE THE STOPPING CHARACTERISTICS OF RUNWAY SURFACES. THE
AFWL VERSION IS IN A STATION WAGON CONFIGURATION. THE DBV CONCEPT WAS DEVELOPED
BY NASA IN THE COMBAT TRACTION PROGRAM (NASA TN D-6098, NOVEMBER 1970). THE
47
A . ......... .... .

AFWL-TR-73-165
0-0
>-
CL,MD
'4-
l-J
019
484
oe, C0.

AFL-TR-73-165
DBV PRIMARILY RECORDS THE STOPPING DISTANCE OF THE VEHICLE III A LOCKED WHEEL
MODE UNDER A DIAGONALLY BRAKED CONFIGURATION FROM 60 MPH. INSTRUMENTATIO! II
THE VEHICLE RECORDS SUCH PARAMETERS AS STOPPING DISTANCE, DECELERATION VERSUS
DISTANCE, VELOCITY VERSUS DISTICE, BRAKE PRESSURE, ETC.
(C) THE WATER DISTRIBUTION TRUCK WAS A LOCALLY FURNISHED VEHICLE EQUIPPED
WITH A SPRAY BAR AND A MEANS TO PRECISELY CONTROL THE RATE OF WATER APPLICATION.
THE WATER WAS APPLIED IN TWO PASSES, WITH THE TRUCK CAREFULLY CALIBRATED SO
THAT EACH PASS PLACED 0.1 INCH OF WATER ON THE TEST STRIP. THE FIRST PASS WAS
USED FOR AN INITIAL WETTING, AND TESTING FOLLOWED IMMEDIATELY AFTER THE SECOnD
PASS.
* (D) THE SLOPE MEASURING DEVICE CONSISTED OF A RECTANGULAR SECTION OF
ALUMINUM (10 FEET LONG, 5/8 INCHES THICK, AND 2 1/2 INCHES HIGH) WITH MACHINISTS
LEVELS ATTACHED SO AS TO DEFINE SLOPES FROM 0 TO 2.0 PERCENT, TO THE NEAREST
0.1 PERCENT. THE SLOPE MEASURING DEVICE WAS USED TO MEASURE TRANSVERSE GRADIENTS
IN THE WHEEL PATH AREAS, WITH MEASUREMENTS TAKEN AT TWO PLACES ON EACH SIDE OF
! {THE RUNWAY CENTERLINE.
THE FIELD TEST PROCEDURE USED FOR TIHE EVALUATION OF THE SKID RESISTANCE/
HYDROPLANING CHARACTERISTICS OF THE RUNWAY SURFACE IS OUTLINED BRIEFLY BELOW.
(A) TEST AREAS (EACH TYPICALLY 2000 FEET LONG) WERE DETERMINED TO FUP!iISH
A REPRESENTATIVE SA1iPLING OF THE ENTIRE RUNWAY SURFACE (SEE FIGURE 1).
(B) TRANSVERSE SLOPE MEASUREMENTS WERE CONDUCTED ON EACH ',:DE OF THE PUNWAY
CENTERLINE AT THE INTERVALS SHOWN IN TABLE 2.
(C) THE WATER TRUCK WAS PRECISELY CALIBRATED TO DISCHARGE 0.1 INCH OF IwATEP
EACH TIME IT PASSED OVER A GIVEN AREA.
(D) THE SKID RESISTANCE TEST FOR THE DRY PAVEMENT CONDITION WAS CONDUCTED
USING THE DBV AND MU-METER. THE PAVEMENT SURFACE IN EACH TEST AREA WAS TYPICALLY
EVALUATED IN BOTH DIRECTIONS.
49

AFWL-TR-73-1 65
(E) SKID RESISTANCE TESTS UNDER A STANDARDIZED ARTIFIC'LLY WET CONDITIOhi
WERE CONDUCTED AS FOLLOWS.
(1) WATER WAS APPLIED TO THE TEST AREA iNl TWO PASSES. EACH PASS
PLACED 0.1 IiCH OF WPTER.
(2) DBV AND MU-IETER TESTS WERE COIDUCTED IMMEDIATELY FOLLOWING THE
SECOND PASS OF THE WATER TFUCK. HALF THE TESTS WERE CONDUCTED IN EACH RUNWAY
DIRECTION.
(3) ALL WATER TRUCK, MU-METER, AND DBV OPERATIONS WERE RECORDED VERSUS
TIME TO THE NEAREST SECOND USING STOP WATCHES. THE SEQUENCE OF OPERATIONS WAS
CONTROLLED BY RADIO.
TEST RESULTS
THE PAVEMENT SKID RESISTANCE RESULTS ARE REPORTED IN TER4S OF MU, COEFFICIENT
OF FRICTION AS MEASURED BY THE MU-METER, AND THE SDR, WET TO DRY STOPPING DIS-
TANCE RATIO AS MEASURED BY THE DIAGONALLY BRAKED VEHICLE. A SUI4ARY OF THE TEST
DATA IS PRESENTED IN TABLE 1. THESE RATING CHARTS WERE DEVELOPED FROM THE
RESULTS OF THE AFIL RESEARCH PROGRAM AND THE JOINT NASA/FAA/AF TEST PROGRAM WITH
ACTUAL AIRCRAFT. WHILE THE CURRENT STATE-OF-THE-ART PREVENTS A MORE PRECISE
DELINEATION OF EXACT AIRCRAFT RESPONSES, TABLE 1 PROVIDES A GOOD RULE OF THUMB
FOR INTERPRETATION OF THE DATA.
TABLE 1 PRESENTS THE AVERAGE SKID RESISTANCE VALUES OVER DIFFERENT AREPS OF
THE RUNWAY. THE SIGNIFICANT DATA IS SHOWN FOR PERIODS OF 3, 15, AND 30 MI!lUTES
AFTER WATER WAS APPLIED. THE POINT 3 MINUTES AFTER WATER APPLICATION CORRESPOND"
TO A WET RUNWAY CONDITION AND 15 MINUTES AFTER WATER APPLICATION CORRESPONDS TO
A DAMP RUNWAY CONDITION. TABLE 1 INDICATES HOW FAST THE SKID RESISTANCE PROPER-
TIES RECOVER AFTER THE VARIOUS SECTIONS OF THE RUNWAY SURFACE ARE WETTED. BY
COMPARING THE ACTUAL MEASURED VALUES OF MU AND SDR SHOWN AT THE TOP OF TABLE 1
50

AFWL-TR-73-165
TABLE I
I ,DATA SUI.IMARY
COMBINED SECTIONS 3 MllN. 15 Mill. 30 MIN.LOCATION MU1 SOR MU SDR ,9. SDR
PP .58 2.48 .71 2.43 .77 3.14TOUCHDOWN, PRIMARY
D I P .70 1.64 .81 1.53 .85 1.29CENTER
K .62 1.49 .75 1.49 .83 1.46EDGE
MU-METER AIRCRAFT PAVEMENT RATING
EXPECTED AIRCRAFTMU BRAKING RESPONSE RESPONSE
GREATER THAN 0.50 GOOD NO HYDROPLANING PROBLE4SARE EXPECTED
0.42 - 0.50 FAIR TRANSITIONAL
0.25 - 0.41 MARGINAL POTENTIAL FOR HYDROPLANINGFOR SOME A/C EXISTS UNDERCERTAIN WET CONDITIONS
LESS THAI) 0.25 UNACCEPTABLE VERY HIGH PROBABILITY FORMOST AIRCRAFT TO HYROPLANE
STOPPING DISTANCE RATIO/AIRFIELD PAVEMENT RATING
I SDR HYDRO'LANING POTENTIAL
1.0 - 2.0 NO HYDROPLANING ANTICIPATED.
j 2.0 - 2.5 POTENTIAL NOT WELL DEFINED.1 2.5 - 3.5 POTENTIAL FOR HYDROPLANING.
GREATER THAN 3.5 VERY HIGH HYDROPLANINGPOTENTIAL
51
" W~-14

AFWL-TR-73-165
TO THE EXPECTED AIRCRAFT RESPONSE SHOWN AT TAE BOTTOH OF THE TABLE, IT IS
POSSIBLE T9 JUDGE IF POTENTIAL HYDROPLANING P7OBLEMS EXIST.
FRICTION VARIATION
FIGURE 2 SHOWS THE ACTUAL FRICTION VERSUS DSTANCE TRACE AS RECORDED BY THE
MU-METER DURING THE FIRST TEST RUN AFTER WETTING FOR TYPICAL AREAS OF THE RUNWAY
SURFACE. IT SHOWS THE VARIATION OF FRICTION WITHIN 2000 FEET TEST SECTIONS,
AND COIMPARES THESE RESULTS WITH THE DRY PAVEMENT C91NDITION. SHARP DIPS IN THE
CURVE INDICATE LOWER FRICTION VALUES AT THESE POINIS, AND PROBABLY RESULT FROM
ONE OF SEVERAL CAUSES--PONDING OF WATER, LOCAL SLIC SPO7S, ETC. APPENDIX A
CONTAINS CHART 3 SUMARIZING ALL TEST RESULTS FROM THl" DBV AND THE MU-METER RUNS.
EACH CHART CONTAINS COMPLETE INFORMATION ABOUT A SINGi.E TEST SECTION.
* FRICTION RECOVERY WITH TIME
APPENDIX B CONTAINS GRAPH1 FOR EACH TEST SECTION SHCWING THE EFFECT OF TIME
AFTER WETTING (INVERSE OF WATER DEPTH) TO CHANGES IN SURIACE FRICTION AND Oh
THE STOPPING DISTANCE RATIO OF THE DBV. THESE GRAPHS DEMONSTRATE THE NATURAL
DRAINAGE CHARACTERISTICS OF THE RUNWAY SURFACE AND THE TIME REQUIRED FOR THE
SKID RESISTANCE PROPERTIES OF EACH TEST SECTION TO RETURN TO A DRY PAVEMENT
CONDITION. THESE C,'"VES WERE DERIVED BY PLOTTING THE AVERAGE COEFFICIENT OF
FRICTION OVER THE TOTAL TEST SECTION VERSUS TIME AFTER WETTING AND THE DBV
STOPPING DISTANCE RATIOS OVER THE DBV PORTION OF THE TEST SECTION VERSUS TIME
AFTER WETTING.
TRANSVERSE SURFACE SLOPE
TABLE 2 SHOWS THE MEASURED SURFACE SLOPES ALONG BOTH SIDES OF THE RUNWAY
CENTERLINE. POSITIVE SLOPES INDICATE WATER DRAINS TO THE RUNWAY EDGE (WITHOUT
CROSSING THE CENTERLINE), WHILE NEGATIVE SLOPES INDICATE THE DRAINAGE PATTERN
52

j AFWL-TR-.73-1 65
AVG. FOR 3 SURFACES (DRY) .82 TO .86
4 SECTON P F' SECT END
I LL
.4 (WET)
I-
0
4 0 II I I 200009 END DISTANCE (FT)27N
I SECTION P, RUNWAY CENTER, AVG. Mu - .72A SECTION K, RUNWAY EDGE, AVG. Mu =.71
SECTION PP, RUBBER DEPOSITED AREA, AVG. Mu 11152
Figure 2. Typical Mu-Meter Traces for Test Sectionsof the Pavement Surfaces at RAF Upper Heyford
53
MWA/
0.4,- p > ~

AFIIL.-TR-73-165
TABLE 2
RAF UPPER HEYFORD
DATA FROM CROSS-SLOPE MEASUJREMENTS
CENTERLIIIE
DISTAfICE MARKERS PER PER PER PEPFROM WEST CENT CENT CENT CE!NT
0+000 1.5 1.5 -. 9 -1.10+500 1.5 1.4 -1.8 -1.51+000 1.5 1.5 -1.8 -1.21+500 1.1 1.4 -.8 -1.2L2+000 1.8 1.6 -.6 -1.82+500 1.6 1.1 -1.4 -.93+000 1.4 1.9 -1.1 -.93+500 1.8 1.8 -.9 -1.14+000 1.4 1.5 -1.1 -1.15+000 1.2 1.5 -1.3 -1.35+500 1.3 1.4 -1.4 -1.36+000 .9 2.0 -1.3 -1.66+500 1.7 11-1.2 -1.47+000 1.6 1.4 -.9 -1.97+500 1.6 1.4 -1.4 -.88+000 1.1 1.8 -1.1 -1.18+500 1.3 1.7 -1.8 -1.39+000 1.4 1.4 -1.2 -1.4
54

",. AFWL-TR-73-165
CROSSES THE RUNWAY CENTERLINE BEF.,RE DRAINING TO THE EDGE. IN GENERAL, SURFACE
SLOPES IN EXCESS OF ONE PERCENT PROaVOTE GOOD TO EXCELLENT DRAINAGE CO3ITIONS.
T:E DRAINAGE CHARACTERISTICS OF THE RUNWAY TESTED CAN BE RATED IN TER4S OF THIS
GENERAL STATEMENT.
RCR CONVERSION
IN ORDER TO PROVIDE VALUES EQUIVALENT TO THE RCR ,NOW IN USE FOR RATING
PAVEMENT SURFACES, THE STANDARD AFWL TEST INCORPORATES A CONVERSION ABILITY
FROM DBV SDR TO EQUIVALENT RCR. THIS CONVERSION METHOD WAS REPORTED Ill NASA
REPORT TN D-6098. WHILE THE CONVERSION METHOD HAS NOT BEEN THOROUGHLY VERIFIED
FOR ALL TYPES OF AIRCRAFT, IT IS CURRENTLY USED AS THE BEST METHOD AVAILABLE TO
OBTAIN AN EQUIVALENT RCR FOR A GIVEN RUNWAY.
USING THE METHOD OF CONVERSION REPORTED BY NASA, THE RCR VALUES FOR THE RUN-
WAY DESCRIBED IN THIS REPORT ARE AS FOLLOWS
2 WET CONDITION 14
DAMP CONDITION 16
"' i ' NOTE: Discussions, conclusions, and recommendations must be individually
! prepared for each base.
£ 55/56

AFWL-TR-73-165
APPENDIX A
SUMM4ARY CHARTS
57 x

AFWL-TR-73--15
.-
0p C-1
co (/v Lir %a-4C
a06
r. pal r- 4 1- 4 (1.C... CLO~ f Li'r ~ '
, J L,4 1b. -~4
LL -
CL CII C
4- II f.. C~ j.. LI -4 .'J . f,1-4u
D ii
.3.1-i f~ Ij
(Z .1 -
58- i

AFVIL-TR-73-1 65
MuIv m.s .2 C~ an : i)t )LJci
ILI-C fl0g0 N.. .11 -1
J)-OI .- 4r,j rjv = M
Is) *t 0 CO * * to CO
:3.tL
LL Li'
uj C3
wL I-- wj IV)LL IL Z a) C2 w-tWL\N.-4 w f. r 2
LL 1-4 Inw(1N) ,Nc C)o cC lU
fLL l'- Iii
-1 C)j C3C)oc NO -
UII I~ I f.0 r C )
> LA.
D
Q' rZ ipI-) 0 ' NI O -(%Cz i
3-4
zI ui - -14-14-14-14-14441444~ -
<1 -- >- >-I-F - I-I-- -
U-W T la I- IIti I-IAI L IIti -1159) -oc C0 3 3::Z : :1a 3 7.., 3-X V
D z.s C)'~LS

AFWL-TR-73-165
FCU
e m. . .. . . .
0.- U% G%
K.0oc cu q:O0 u )C
1.1% 1- do, I'. %O U1 (ut .
WI-I-- U% c) AD U..&4 4a
- ~ ~ ~ ~ %D r- 'J t i C i) to' I-
-4 r C~j d% 0ON' -44 caW 2to m
oj c4 j I-L ,v j'u '0 1 -co c co m com m Im l
k04 WZ r- Zl fM o tt.
-0wNV0cc tf)t L ,r 1 I-
lv~~ A, . . .* . . o .A, Ar
sit C~Iq 1 f-ht- 01 rm - D II'mgl.t ~ -
LD 001-4.- :I
ZC
3-4 1-0
1-4 -4-
1. C
06

? AFW4L-TR-73-165p j
-)tL) I-- !Cc Ifl. c C r C
j1 ve p
cu3 CjAscuIN
LL I
11i- u (I" It M. to C.)) 4 C(c (cc ,%I' i-D d)- wil. J,-)NN.
D 0fl 0
>.3
a: I ii
4 .S. Go U% .f s . 2 .U
1-4 .4gCUU C\ I r
Its OU (IN r'- on 1) %1) t P 1) .1 to r, (U
1-- -4 .4()%-- %
> LU
r- IT -0% -MS 0 %L
3--(j -4o1Cut ,v- Aj (J r-4
z~~ I-- U
1- Z3:
z
Ck' a : -Z X : a 2:VD z
DC W- to fl * %V -4 0.- 0D
z 03--4
Us w a a 0~Q- L(LCL 0.m aL0L00 L 4 .
61

r i AFWL-TR-73-1 65
t -1en pe
0 In 0
0 i 0- V) 0i cu . W .'U*& U.
T44 C)- q"0
I, 01 0,*
cc. (1 - P %1CL, In I?1 -)r-4
0V
it. . - r is IJ ILI- -
Of I I LI
F-- -C
-, -1 kO P-( T,2'-.4 =' Cl ". C ' JIt3
-4 4(4
ti C,,
Il ' CVl cli t (,9 I t *Is C. I' ( Ci-
'I--
-- r~.- -X : i
Z ~ ~ ~ ~ ~ : W - 1Is41skDi I
62

AFWL-TR-73-165
APENI B
GRPH
LIAii63

AFWL-TR-73-165
SRRF UPPER H YF ORD
RUNWAY 9/27 ~ C~~
1.0-
mIc rct,1
F O~YCOUFIIEIE
Ccto-
.6'i-

AFWL-TR-73-1 65
RUNWAY 9/27 SECT ION I
4 ~ ~ ~ ~ ~ ~ ~ 4 1t i l i L L L L L I t t I I I I I ... J ... L .. I UL 1 1 t tI~ l i li III i tII *J L .
.4-
.3
2
'65.

AFW~L-TR-73-165
RAF UPPER HEYFORD
'RUNWAY 9/27 SEiCTIOJN pI. IfI t 1 II I J IIIt III I It I I. ...
-07
.9
.7-
'1 .3
0 .frTfT[ T-r7-rr-rTT-rri~ I-I r 7-rr-rrTr-r 1 -rrr- Tri-rTI1rrE0 I1) 20 30 50 810
TIME AFTER WRFER (MINUJTES)
3
66

AFWL-TR-73-165
RAF UPPER HEYFORD
RUNWRY 9/27 SECT ION PP
oi l l ot 0 1..... .. .. .. I .. ...
7- E
;1 L
a - -
E.3 - .
S0 10, 20 30 40 so 60
}-i TIME AFTER WATER (MINUTES)l
67
.2a.2
_ _ _ _ _ _ _ _6 7__ _ _ _

AFWL-TR-73-165
RRF UPPER HEYFORD
RUNWA, RY9/2"7 SECTION K......I l I I ll. t f! i t I f'll- I! to I I II!of I l it|1 Ifl ll i l 't
uQT
opf COEFFICIE,r-°-EI- V
EI
EE
3crr-
-2:2- E.6-~1
0 10 20 30 0 so 60
TIME RFrER WrFER (MINUTES)
68
... ... . .... .. .' * ' " '.. . . ' '" ' ' ' l ". .. - i ' " "..... .. .I : ... . . ... " . ..... . .. .. . .. . .... . .. . ... . . . . . . .-r

AFWL-TR-737165
RA PPRHEFR
RUWY /7IETOI3
I, J
RFJPERHEFR
RUNWR 9,2 SECiON
lo 20 4050
THME RFrER WqrER (MINUrV:"'
69
A~W4~ ~ &~A~aI~ ~~. A

AFWL-TR-73-165
RqF UPPER HE FORD
RUNWAY 9/27 5CION
L
1E
2 '
,702--4I
]d 70

AFWL-TR-73-1 65
RRF UPPER HEXFORD
RUNWAIY 9/27 SECTION p
LEIE 1
0 10 2 0q 06
(171

" AFWL-TR-73-165Li, a!
RRF UPPER HEfFORED
RUNWRY 9/27 SECT ION PP.. I f I i f it
2 E
.-
0- fa-S7
F Lf
a 10 20 30 110 so 60
T[ME AFTER WRTER (MINUTES)
Ll
72

211I AFWL-TR-73-1 65
RAF UPPER HEYFORD
RUN WAY 9/27 SECTION K31 1 1 1 1 o 1 1 1 1 1 1 .1 I I I I I 1 1 1 1 1 1 1 If
* f .
-1
,'I'
', 2-1F
o- N w
SEWEE ,l L
1
~F
i1 I - -I- ,. . .' '"- ' 7 ' " " ' 1 ' '1 1 . ..74 -I L
0 1TTr -- r-Trr r-r o~ - . - 7 -r0o10 20 30 40 50 60
"iME RFFER WArER (MINUTESI
73/74
AFWL-TR-73-1 65
APPENDIX 11
I BLANK FORMS AND CHECK LISTS
75J

AFL-TR-73-165
HEADER CARD NO.1
NO.BASE NAME SECTS
,_ TESTED
EXAMPLE
AGENCY PERFORMIG TEST30 34 325 4 36 57559 403 41 42 43 44 45 46 4T14 49 50 51 52 53 54 5,5 565 5a 5.95 60
EXAMPLE
t NO. CARDS USED TOLIUST REASONS FORTEST (MAX= 4)
EXAMPLE
NOTES: 0- LETTER 00 - ZERO
"BASEP NAME" AND "AGENCY PERFORING TEST" SHOULD BE
CENTERED IN THE SPACE PROVIDED.FIELD FOR "NO. SECTIONS TESTED" IS RIGHT JJSTIFED. THIS
MEANS ANY BLANK SPACES APPEAR AT THE LEFT OFTHE FIELD.
76

AII-R7 -6
HEADER CARD GROUP NO. 2USE ALL OR ANY PORTION OF THE 4 CARDS BELOW TO RECORD REASONSFOR THE T ESTI (OTHER THAN EVALUATION OF SKID RESANCE) 3LJMBEIREDBEGINNINJG WITH (2).
CARDI
CARD2
55215 z 32 5Z2 7 2 7 74357 7 3733 90
CARD 3
57896IH6 H _ __ 1
414241514516 7 849I5C51 4 55 5959 6 626364656667 6970 to 7277417 87
DICATP(3)Q CKC~? EXAMPLESE
77

AFVIL-TR-73-1 65
HEADER CARD NO.3
FOR OVERALL RATING OFPRMY OCWDMNPRIMARY TOUCI-WMVN AREA SCIN
NO. SECTIONS TO BE COMBINED EINn O*FOR OVJERALL RATING OF CNE ET~l
RUNWAY CENTER (MAX.-4)
301 0 134 R35136137138139140,
NO. SECTIONS TO BE COMNED DESIGNATION OFFOR VERLL RrIN OFSECONDARY
SECONDARY TOUCHDOWN AREA TOUCHDOWNN SECTIONS
KIA 501 53 4 555657 5859160
NO. SECTIONS TO BE COMIED DESIGNATION OFFOR OVERALL RArvNG OFEDESCINRUNVAY EDGE (MA.-4)
9170 EH~73741757617778179180
40,
EXAMPLE
31 13B3 ICPIPI
NOTES: O-LETTER0 w ZEROWHEN DESIGNATING TEST SECTIONS TO BE COMBNJED,SKIP A SPACE BEFORE AND AFTER THE LETTERDESIGNATION, UNLESS THE SECTION IS DESIGNATED BYA DOUELE LETTR, SUCH AS NBB' SEE EXAMPLE ABOVE.
78

4 AFL-TR-73-165
GENERAL INFORMATION, WEATHER,AND WATER RECORD
RECORDER
BASE RUWY TEST STRIPBBATON IDENT DESCRIPTION
AR/ GENERALS 0 1 is Io, zz 4 25 26
C, INFORMATION
i I2141 I I 1JRN EXAMPLE
TEMP DEo W IND GUST
DIR. VEL WF OF VEL. WEATHER
INFORMATION
n GJVA 49 NZj~jN?-oN -161EXAMPLE
WATER 'IN'TOT STRIP WATER 'N, DBV STRIP WATER 'OUTTOT STRIP
47 14 W151=' 53l= 15 ' , '~ i l i 57" 60, CZ 6 6 & 6 1 7 RECORD
1 I14 N 4- 1 ,14 '1 4 1 4- 1 jV,1j!, I EXAMPLE
ZERO WATER TIME
HR. MIN. SEC.
NOTES: 0 - LETTER 00 - ZEROALL DATA IS RIGHT JUSTIFIED. THIS MEANS ANY BLANK
SPACES APPEAR AT THE LEFT OF THE FIELD.
[79

AFWL-TR-73-165
GENERAL INFORMATION
BASE RUNWAY
RECORDER DATE
TEST SECTION
TYP LONG. TRANS- SECTIMO DIST 01STTO WATERN VERSE STARTNPAEN , SLOPE SLOPE LENGTH FROM (Q scCT
32 14 1 nr s194j i . 0 2 24 25 72829C 5c -1y3 3 37 3 9 40
EXAMPLE
r'YAIcr1iI II -H oIIR ____________ I 1 a!1
,// NO V NO, NO. NO- NO./, /A DRY 1 DRY 17RE WET VWET DATE (S) OF TESTW,JA MU A WVUVJBVI. L-.1, RUNS JJA r. RNS . .
oil V 44 43 47 40 505. '53~ 54 5656 Z 64 6566 668 69 G Is72EXAMPLE
NOTES: 0 - LETTER 0g = ZEROALL DATA IS RIGHT JUSTIFIED THIS MEANS ANYBLANK SPACES ARE AT LEFT OF FIELD
4
80

ARIL-TR-73-165
MU-METER RUN'S ON DRY PAVEMENT
BASE_________ RUNWAY______
RECORDER DATE
TEST SECTION ______
FIRST RUN SECOND RUNRUN TWV C A8I RUN TINE C
DESIGNATION DAL 4 DAI. OESIGNAT I DIAL DA112 ~I4T5S 7ITIO ,i14 15 ?SI 2 1 22 251IZ41251261271ZS129130 J 34~J5 3J90
THIRD RUN FOUJRTH RUNRUN TI! C 6 RUN ITME r C~ Bj
DESIGNATION DIAL DIAL IDESIGNATIC.N tDOIL A Li~~ 4 5819 6 ' I6L&4 6 66 67 66 9 70 72,13 74 ?74 ~6.8O
, - - -
NOTES: 0 - LETTER 00= ZEROALL DATA IS RIGHT JUSTFIED. THIS MEANSANY BLANK SPACES ARE AT LEFT OFFIELD.
EXAMPLERUN TRUE C B
DESIGNATION IDIALIZ23 4 567T8 910 13 14 15 ris1920o
FIS A I D11315 31.31D
81
-o ~ ~ -. -° , - -~- o / o . --.--- ---. .

AF,.L-TR-73-165
D B V RUNS ON DRY PAVEMENT
BASE RUNWAY_
RECORDER_ DATE
TEST SECTION
FIRST RUN SECOND RUN
RUN TiME V/lVEL~ STOP RUN TIME~ VEL ~jSTOPDESIGNATION mph DST DESIGNATION mph DST
THIRD RUN FOURTH RUNRUN TIME V VEL STOP. RUN TIME 1' VEL. STOP
DESIGNATION mph DIST DESIGNATION o DIST41 4Z 43 44 43 46 47 41 54f55 6'I6I13O64195 1 170 /74 "5 77178171 9
NOTES: 0= LETTER 00= ZEROALL DATA IS RIGHT JUSTIFIED. THIS MEANSANY BLANK SPACES ARE AT LEFT OFFIELD.
EXAMPLERU14 TIME VEL. STOP
DESIGNATION ,! rrh DIST.
-- C
82
-~4

AFWL-TR-73-165
MU-METER MEASUREMENTS OF PAVEMENT FRICION ON VET F)VEMENT
AIRFIELD RUNWAY
RECORDER DATE
RUN TIME IN TIME OUT 'C p' INTE-/- GRATED
DESiGNATION h m / s h m s DIAL DIAL COEF
, 3 4 5 9 11 2 14 tI IS19 22 5 230 35
V,,-- -- , 71,, / " --
OF
IA iii I, i - i 11111--- ---- ---
,i- -- -/SI::-* - ,-q - -/" ----
/ - -- ,
1 41
"/ I!,IWS~ IKIrY23/A IvIG1r/rA 163/A e I w
NOES ZR "0 ETR0 ALL I~ IS RI-TI'D
_,z,
-AA,0 3
A-A I W l 1 / "3
NOES ZER 0 LETTE 0. AL ,/T IS RIHT JUTFID0: THI MEN-- LN SAIsAEATLF FFED
. / I I 83

AFL-TR-73-165
MU -METER TAPE DATA
AFIELD RUNWAY
RECORDER DATE
MIN. MU, MAX. M MIN. MU, MAX .UJAVG. MU, RUNTOTAL TOTAL TOTAL DBV DBV DEV
SECTION SECTION ECTION AREA AREA AREA DESIGNAT1ON56as3940 1 42 43 4445 4 8 49wO,521.W345 57 3 5960o6 62 6364 6567s690To2
I I I 69I I
,/ I i I
00 e
I ,___ _ __ _ _
[A 113IW I I ,
__ 5Z 55 5-4
NOTES: ZERO - 0, LETTER 0 x ALL DATA IS R,'HT- JUSIFIED.THIS MEANS ANY BLANK SPACES ARE AT LEFT OF FIELD.
84
V ,, ,!? ! I:, i-C

AFWIL-TR-73-165
DBV STOPPING TIME AND DISTANCE ON WET PAVEMENT
AIRFIELD RUNWAY _
RECORDER DATE _ __ __
RUN LOCK TIME STOP TIME TEST STOP STOP/ - -- DIST DIST
DESIGNATION h h - FT. ADJ.TO 60 ,/ ... MPH
S213 14 5 6 89 it12 14956 9 021 22 24 25 27 2930 32334
-77
7;7
7 r/ A I r:Ji
I A / i I /I0
I X/ I --
- -,;A- /
AI1011I I"N-1 21r. f'rN W 1 (,"d d 11
NOTS:-----LE TE -- .L -I IS RIGHT--- -- - ----------.
- i - - - -- -- -- -
IS MA AN B A L O FIELD
'85
/"1
II
iWNi4 /c 5I 23i ~NOEZEO0/LTE O-.L A1ISRGTUIIED-
THSMASAYBAKS/AEA ETO IEL
Ar 8 /

AFWL-TR-73-165
Li 0
NN
E F
NNNN
D
N 0.,, 0NN
LAYOUTIJ OF TEST STRIPS
II
86

AFWIL-TR-73-1 65
U')W
-1. I I (i
I I 0
0
I JI to
I U) 0 Io 0 U) o I
HII IV I Vd
I I I87

AFWL-TR-73-165
PAVEMENT CROSS-SLOPE MEASUREMENTS
RECORDER RUNWAY-SIGN CONVENTION
CASE I CASE II CASEIII
=I I"1 E ABBREV. RUNWAYB
S STATION NO.EXAMPLE a (R/W DIST %SLOPE %SLOPE %SLOPE %SLOPE a
LIMITS MARK R) LIMITS
,_1, I4: .. /.=-, -,
6- 4FTI L old45r
5+00/3 1 + 1 o oI / ,
6+ 0100 ----------------- / ~ --
7iW
6 + 0 0 0 - -- I79+00 -----------------
1 '0+5 0 0S0+000
I f o- -----------------
151+5 0 01/
L -i
0-LETTERO1 2 1~ +1. 5 0 0APL
8 8
F ~ ~~ ~ ~ 1 1 0010'41 0i0
J- ~ ~ it151 5 +/
T f 5
RUNWAYNOTES:~~~~ FFTIN SUHE
0- ZRO 110 110 0 10 +11 - SFA41 I , + l 11. , j A i1 .JA XML
0- LETE 0
88

V
AF'4-TR-73-165
I
I III
0-1---- I iii
c~j I I ii* 1 II I
I I I- -I- i I ii I I1~I' I
-J I I II- K'-
III II I
III I
I t I
II I III I ~ItI ~{I
Cz -~ I
0 III I
(I) I I I I 1-
til o~I'I -~ 'IZI I II0 I ''4. IIn II
W I. II p
U I,w Iii
II A
II I
p I I
+ I II Io~t I ii I
wI F'.-I')
LL~
I
- - - -<V

ARL-TR-73-165
COfIVERSIOtl FACTORS
To Convert a Stopping Distance Mjultiply the SD by
(SD) at this IPH this Factor
55 1.1010
56 1.148
57 1.108
58 .1.070
59 1.034
60 1.000
61 0.967
62 0.936
63 0.907
64 0.879
65 0.852
90

AFVIL-TR-73-165
WATER TRUCK CREW BRIEFING CHECK LIST
1. Does driver know proper tachometer setting to follow?
2. Does driver know proper gear/axle range to use, and does heunderstand this cannot be changed during a wetting operation?
3. Do driver and pump operator understand the layout of the testsections so they both know what area is to be wetted?
4. Does driver know to make all wetting passes in the same direction,starting the initial pass from the same end the test vehicles willmake their initial runs?
5. Does driver know that upon completion of the final wetting run ineach test strip, he should turn sharply out of the way of the testvehicles traveling at 40-60 mph? Direction to be turned will begiven by the test conductor.
K 6. Does pump operator know to begin water discharge 50 to 100 feetprior to entering the test strip,, not to vary the discharge ratein any way, and wet 50 to 100 feet after exiting the test strip?
_ 7. Is there sufficient fuel to operate the witerpumping system andtruck so that no refueling is required during testing sequence?
V 91

AFWL-TR-73-165
DBV OPERATION CHECKLIST
BEFORE STARTING ENGINE
1. Check gasoline (use high-test gasoline).
2. Check oil (use 030 multigrade oil).
3. Check battery water.
4. Check radiator water.
5. Mount test tires.
6. Check tires (commercial tires: 32 psi; test tires and fifth-wheel
tire: 24 + 1 psi).
7. Check brake fluid.
8. Check fifth wheel attachment (security) and freedom of movement.
9. Check operation of all lights (roof light, turning lights, headlights,
and tail lights).
10. Turn all instrument switches to OFF.
_ ,1. Start engire.
CAUTION
Do not back up vehicle with fifth wheel in test position.
AFTER STARTING ENGINE
_ 1. Check engine instruments.
__ 2. Check brake pedal action.
3. Check brake switching valve for free movement and leaks. Return
selector valve to four-wheel braking.
CAUT ION
When not testing, operate vehicle in four-wheel braking mode only.
_ 4. Turn inverter power switch to ON; check for current dc voltage on
each channel on control panel meters by turning power switches toON.
92

="; AFWL-TR-73-165
(a) Channel 1: 12 to 15 v
(b) Channel 2, 3, 4: 6 v
5. Press POWER 011 switch to TR-444 recorder. (Light should core or
and motor should start running.)
6. Turn power switches for velocity and distance meters to 0N.
7. Allow 15 minutes for instruments to warm up.
8. Zero all instruments as follows:
(a) Press reset on velocity and distance meters should clear
readout display.
(b) Press test on velocity meter should read 888.
(c) Press test on distance meter should read 8888.
(d) Place AUTO-MAN switch on velocity meter to AUTO-MODE.
(e) Place AUTO-MAN switch on distance meter to AUTO-MODE.
(f) Set amplifier controls to proper setting.
(g) Zero styluses with position control on amplifiers.
9. Set CHART SPEED switch to 1 rm/sec, check JUMP SPEED switch arid set
stylus heat controls for sharply defined black lines at desired
chart speed.
___10. Turn all instruments off; turn two-way radio on and set squelch.
Turn radio charger to TRICKLE.
PROCEEDING TO TEST AREA
_,_ 1. Lower fifth wheel to test position; gently apply brakes and check
operation of velocity and distance meters.
CAUTION
Do not back up vehicle with fifth wheel in test mode.
___ 2. Switch right-front and left-rear brake valve to OUT. (This gives
diagonal braking to left front and right rear.) Gently apply brakes
and check torgue to the left. Switch back to normal four-wheel
braking. Switch left-front and right-rear brake valve to OUT. (This
93

AFWL-TR-73-165
gives diagonal braking to right front and left rear). Gently apply
brakes and check for torque to the right. Switch back to four-wheel
mode.
AT TEST AREA
1. Inform test conductor that vehicle is ready for test.
-2. Follow established vehicle-control procedures.
3. Examine and assess test zone entrance and exit for possible emergency
action.
4. With brakes fully released, close brake valve to road tires. Apply
full brake pressure and check for leakage of brake system.
5. Turn on roof warning light.
6. Proceed to acceleration point.
AT ACCELERATION POINT
1. Lower fifth wheel to test position.
2. Put safety belts and safety helmet on and confirm that all items
are tied down.
__ 3. Turn inverter power on.
4. Turn recorder Fvwer on.S5. Turn gage power on and set at zero.
AM4PLIFIER SETTIGS:
A. Accelerometers at 50 mv/div.
B. Pressure transducer at 20 mv/div.
6. Turn distance and velocity meter power on and reset to zero.
7. Check that valve to pressure gage is on.
8. Check that manifold brake valves are in DBV mode.
9. Start recorder at I nm/sec; apply electric calibrate to all channels.
94

AFWL-TR-73-165
DURING TEST RUN
1. Accelerate test vehicle to 5 mph above test speed.
2. Change recorder speed to 10 mm/sec with JUMP SPEED switch.
NOTE
Steps 2 and 3 should occur at point where vehicle speed
drops to proper speed for testing just as all four wheels
of vehicle enter test zone.
4. Allow vehicle to coast into test zone; when velocity meter indicates
proper speed after entering test zone, stamp on brake pedal and hold
down hard.
NOTE
Test wheels must lock up and remain locked for duration
of test to be of any value. At lock up there will be a
slight torque on the steering in the direction of the
front wheel that is locked, so be prepared for this.
5. Hold pedal down hard until all data are recorded.
AFTER STOPPING VEHICLE
1. Stop recorder.
2. Read and record distance meter reading.
3. Read and record velocity meter reading.
NOTE
This must be done before releasing the brake pedal as this
clears the velocity reading.
4. Take foot off brake pedal.
5. Return brake valve to normal four-wheel mode.
CAUTI ON
Do not operate vehicle in diagonal-brake mode when not in test zone.
6. Clear test zone as instructed.
95