National Trauma Data Bank - American College of Surgeons
66
National Trauma Data Bank © NTDB Research Data Set Admission Year 2010 User Manual October 2011 NTDB American College of Surgeons 633 N. Saint Clair Chicago, IL 60611 www.ntdb.org
Transcript of National Trauma Data Bank - American College of Surgeons
National Trauma Data Bank© NTDB Research Data Set
Admission Year 2010
User Manual
October 2011
NTDB American College of Surgeons
633 N. Saint Clair Chicago, IL 60611
www.ntdb.org

i
ACKNOWLEDGEMENT The American College of Surgeons Committee on Trauma thanks the Centers for Disease Control and Prevention (CDC) for their support of the NTDB.
ii
TERMS OF USE
The American College of Surgeons established the National Trauma Data Bank (NTDB) as a public service to be a repository of trauma related data voluntarily reported by participating trauma centers. Please note that the NTDB is not a population-based dataset. NTDB also provides National Sample Project which is intended for population-based research use.
The American College of Surgeons, Committee on Trauma collects and maintains the National Trauma Data Bank® (NTDB). Therefore, use of any information from the NTDB must include a prominent citation. The citation is to read as follows, filling in the version number and year as:
Committee on Trauma, American College of Surgeons. NTDB Version X. Chicago, IL, 20XX The content reproduced from the NTDB remains the full and exclusive copyrighted property of the American College of Surgeons. The American College of Surgeons is not responsible for any claims arising from works based on the original data, text, tables, or figures.
Specific Terms of Agreement: Limited license is granted to use said information from the NTDB from the American College of Surgeons, Committee on Trauma, provided the Requester agrees to the following provisions:
1. Treat the information received from The American College of Surgeons, Committee on Trauma as non-public health data. The data may never be used by Requester as a basis for legal, administrative or other actions that can directly affect an individual whose medical or personal information is included in a case in the data.
2. Use the information received under the provisions of this Agreement only for the following not-for-profit purposes: research, advocacy, medical education, patient education, or other trauma care-related activities supported by not-for-profit organizations.
3. All Information derived from the NTDB from The American College of Surgeons, Committee on Trauma shall remain the full and copyrighted property of The American College of Surgeons, Committee on Trauma and shall be so noted in educational material, website presentations, and publications.
4. Warrant that The American College of Surgeons, Committee on Trauma is not responsible for any claims arising from works based on the original data, text, tables, or figures.
5. Indemnify the American College of Surgeons, its Committee on Trauma and their employees and agents from any and all liability, loss, or damage suffered as a result of claims, demands, costs, or judgments arising out of use of NTDB information.
6. Requestor may not sublease or permit other parties to use NTDB data without advance written approval of ACSCOT.
The Requester's obligations hereunder shall remain in full force and effect and survive the completion of the Requester's defined project described herein above. The terms of this Agreement shall be binding upon the Requester and the organization through which his/her project is conducted.

iii
Table of Contents
Section Page
ACKNOWLEDGEMENT i
TERMS OF USE ii
1. HISTORY OF NTDB 5
2. NTDB CONFIDENTIALITY POLICY 6
3. CURRENT LIMITATIONS OF NTDB DATA 6
1. Data Quality in NTDB ............................................................................................... 6
2. NTDB is not a population-based dataset ........................................................................... 6
3. Selection and Information Bias in NTDB .......................................................................... 7
4. Missing Data in the NTDB ........................................................................................ 11
4. GETTING STARTED WITH NTDB DATA 12
5. FREQUENTLY ASKED QUESTIONS ABOUT USING NTDB 14
6. RESOURCES FOR EVALUATION OF NTDB DATA 16
1. Background of Injury Severity Scoring ........................................................................... 16
2. Outcomes ........................................................................................................... 18
3. Analytic methods .................................................................................................. 18
4. Inter-hospital comparisons ........................................................................................ 21
7. PUBLICATIONS 22
8. CONTACT INFORMATION 23
9. REFERENCES 25

iv
Appendices
Appendices
Appendix A: Variable Description List ..............................................................................
Appendix B: The Barell Injury Diagnosis Matrix, Classification by Body Region and Nature of Injury ................................................................................................... 52
Appendix C: Grouping for Presenting Injury Mortality and Morbidity Data (Feb 2007) ....... 53
Appendix D: SOURCE CODE FOR SAMPLE PROGRAMS ................................................... 57
5
HISTORY OF NTDB
Injury remains a public health problem of vast proportions, although much has been done to reduce its incidence and mitigate its effects. A recent report from the Institute of Medicine (IOM) has stressed the need for accountability in all phases of emergency care systems, and called for measurements of quality that “evaluate the performance of individual providers within the system, as well as that of the system as a whole.”1 As part of their pioneering work in the development of trauma centers during the 1970’s, Boyd and colleagues developed a hospital trauma registry for research and monitoring.2 As trauma centers and personal computers became more widespread, the use of registries grew to include entire trauma systems,3 and standards were developed at a national level.4 Starting in 1982, the American College of Surgeons Committee on Trauma (ACSCOT) coordinated the Major Trauma Outcome Study (MTOS), which until recently served as a standard reference database of seriously injured patients in the United States, and was the basis for many of the analytic methods that have become familiar to trauma surgeons.5 At the conclusion of MTOS in 1989, the ACSCOT renewed its commitment to trauma research and quality improvement by developing trauma registry software, with the intention that multiple users of this product could combine their results to produce a national database. After several years of slow progress, a recommendation was made to separate the development of a national database from the development of registry software.6 This recommendation was implemented in 1997, and a subcommittee was established to direct the National Trauma Data Bank (NTDB), which would combine data from various trauma registry products. Currently, the NTDB contains detailed data (see Appendix A) on over five million cases from over 900 registered U.S. trauma centers. The data have been shared with hundreds of researchers, and numerous articles have been published based upon the NTDB. The annual NTDB Call for Data (CFD) runs from February to May and all hospitals with trauma registries are encouraged to participate. After the conclusion of the CFD, the data are cleaned and summarized in the NTDB Annual Report and distributed in September. The National Trauma Data Bank has adopted the National Trauma Data Standard (NTDS) as the basis for data collection. The NTDS is a standardized definition of the trauma injury information submitted to the NTDB by participating hospitals (see www.ntdsdictionary.org). Additional information about the NTDB, annual reports, and this user manual is available at www.ntdb.org.

6
NTDB CONFIDENTIALITY POLICY
NTDB data are maintained in a secure database with limited internal access. External users must gain permission to the database and data; users are then supplied data at the aggregate level only. Use of NTDB data is in strict compliance with the Health Insurance Portability and Accountability Act of 1996 (HIPAA).7 The NTDB does not distribute or report hospital information in any manner that allows the reporting hospital to be identified without the express written permission of the hospital. The dataset collected by NTDB is considered a limited dataset under HIPAA, and the research dataset that ACS releases is a de-identified dataset.
CURRENT LIMITATIONS OF NTDB DATA
1. Data quality in NTDB NTDB has worked hard to improve the data quality and introduced a new dataset
in 2008. However, the data quality of NTDB is dependent on how well the NTDS is implemented for the data submitted by the individual hospital. The NTDB is continually cleaning and standardizing the data to improve data quality. Data files received from contributing hospitals are screened upon submission by the Validator, NTDB’s edit check program (see Appendix 3 of the NTDS Data Dictionary, 2010 Admissions). Any files receiving a level 1 or 2 error are rejected, but can be resubmitted after corrections. Other errors are shown on reports generated by the Validator, to provide information about the data submission.
2. NTDB is not a population-based dataset The NTDB is subject to the limitations of all “convenience samples.” It includes a
disproportionate number of larger hospitals with younger and more severely injured patients. The data may not be representative of all trauma hospitals in the nation and thus do not allow statistically valid inferences about national injury incidence and prevalence.
The NTDB National Sample Project (NSP), a nationally representative sample based on NTDB, has been created in a partnership between the Center for Disease Control National Center for Injury Prevention and Control (NCIPC) and the American College of Surgeons Committee on Trauma (ACSCOT). The goal of the NSP is to make statistically valid inferences about patients cared for in Level I-II trauma centers in the US. More specifically, the NSP is used for producing national baseline estimates of variables and indices associated with hospitalized traumatic injuries such as pre-hospital diagnosis and management, trauma outcomes, and other variables that characterize the different dimensions of trauma treatment. The NSP is a stratified sample of 100 hospitals with admission data from years 2003–2010 and can be requested from the NTDB website.

7
3. Selection and information bias in NTDB As a “convenience sample,” NTDB is subject to various forms of bias. The
NTDB data are submitted voluntarily from hospitals that have shown a commitment to monitoring and improving the care of injured patients. These may not be representative of all hospitals, and have not been systematically selected to represent any population base. By definition, cases not admitted to a hospital will not be included in the NTDB, including injury victims who die before they can be transported to a hospital. Hospitals may have differing criteria for including deaths on admission, deaths in the Emergency Department, or other cases, which should be evaluated before making comparisons.
Some of the theoretical issues resulting from the use of trauma registries to assess
institutional performance were discussed as part of the Skamania Symposium on Trauma Systems in 1998.8-10 The most obvious problems are selection bias, the inconsistency with which clinical variables can be measured, and inter-hospital differences other than quality of care. MTOS was limited to selected trauma centers and utilized centralized coding to maximize the consistency of data, while NTDB has become more inclusive and depends on decentralized data entry at contributing hospitals.
The variability in trauma registry inclusion criteria across the country has been
noted, 11 and the ACSCOT has participated in the resulting national effort to standardize data elements for trauma registries. Focused review of “outlier” hospitals is expected to reveal differences in data entry and patient inclusion criteria that could be made more uniform before concluding that outcome differences among hospitals are truly related to differences in care.
Selection bias refers to an apparent difference between two groups that is actually caused by different inclusion criteria. For example, if one trauma center includes isolated hip fractures in its registry and another does not, and if mortality for this injury is lower than for other injuries with the same severity score, the hospital that included isolated hip fractures will appear to have a lower “risk-adjusted” mortality. Any difference in inclusion/exclusion criteria could produce a selection bias.
The NTDB data have been evaluated with respect to several possible sources of
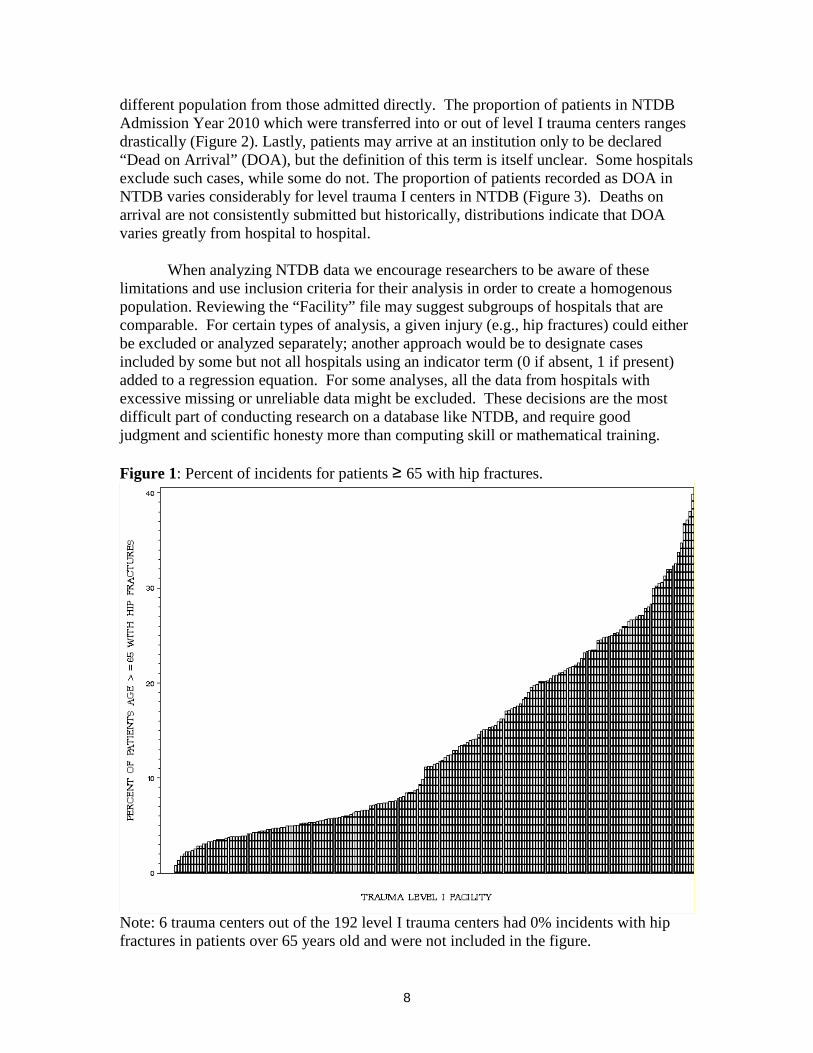
selection bias, including the inclusion of hip fractures, transferred patients, or Dead on Arrival (DOA) patients in submitted data. Hip fractures comprise about 45% of injuries requiring hospitalization in the U.S. population over age 65.12 As mentioned above, a difference in the mortality for this population could produce an apparent difference in overall mortality depending whether or not they were included. Some surgeons consider hip fractures a degenerative disease and "not really trauma," and some believe that the effort to gather data on this population may not be worthwhile for quality improvement by their trauma services. In NTDB Admission Year 2010 the percent of patients over 65 with hip fractures (ICD-9-CM code 820, AIS codes 850699.1, 850606.1, 850610.2, 850614.2, 850618.2) for the 192 trauma level I centers ranges between 0 - 40% (Figure 1). Also, patients transferred from one institution to another have obviously been able to survive an initial resuscitation, but the reason for transfer is often that the injuries are more severe or that other risk factors are present. Transferred patients thus represent a
8
different population from those admitted directly. The proportion of patients in NTDB Admission Year 2010 which were transferred into or out of level I trauma centers ranges drastically (Figure 2). Lastly, patients may arrive at an institution only to be declared “Dead on Arrival” (DOA), but the definition of this term is itself unclear. Some hospitals exclude such cases, while some do not. The proportion of patients recorded as DOA in NTDB varies considerably for level trauma I centers in NTDB (Figure 3). Deaths on arrival are not consistently submitted but historically, distributions indicate that DOA varies greatly from hospital to hospital.
When analyzing NTDB data we encourage researchers to be aware of these
limitations and use inclusion criteria for their analysis in order to create a homogenous population. Reviewing the “Facility” file may suggest subgroups of hospitals that are comparable. For certain types of analysis, a given injury (e.g., hip fractures) could either be excluded or analyzed separately; another approach would be to designate cases included by some but not all hospitals using an indicator term (0 if absent, 1 if present) added to a regression equation. For some analyses, all the data from hospitals with excessive missing or unreliable data might be excluded. These decisions are the most difficult part of conducting research on a database like NTDB, and require good judgment and scientific honesty more than computing skill or mathematical training. Figure 1: Percent of incidents for patients ≥ 65 with hip fractures.
Note: 6 trauma centers out of the 192 level I trauma centers had 0% incidents with hip fractures in patients over 65 years old and were not included in the figure.

9
Figure 2: Percent of patients that were transferred in per facility for level I trauma centers.
Note: 6 trauma centers out of the 224 level I trauma centers had 0% incidents transferred in and were not included in the figure.
Information bias refers to an apparent difference between two groups that is actually caused by a difference in the data available to compare them. With regard to certain fields, differences in the proportion of cases with missing data may be responsible for apparent differences among hospitals. Lucas et al, have found that injury severity scores are calculated differently by different registry programs.13 In an attempt to account for this, NTDB uses an ISS that is derived from the ICDMAP-90 crosswalk based on the ICD-9-CM codes that are required by NTDB. Some centers do provide their own ISS and AIS, but not all submit those data. Nor are all the submitted ISS and AIS calculated in the same way.

10
Figure 3: Percent of incidents that were dead on arrival (DOA) per facility for level I trauma centers.
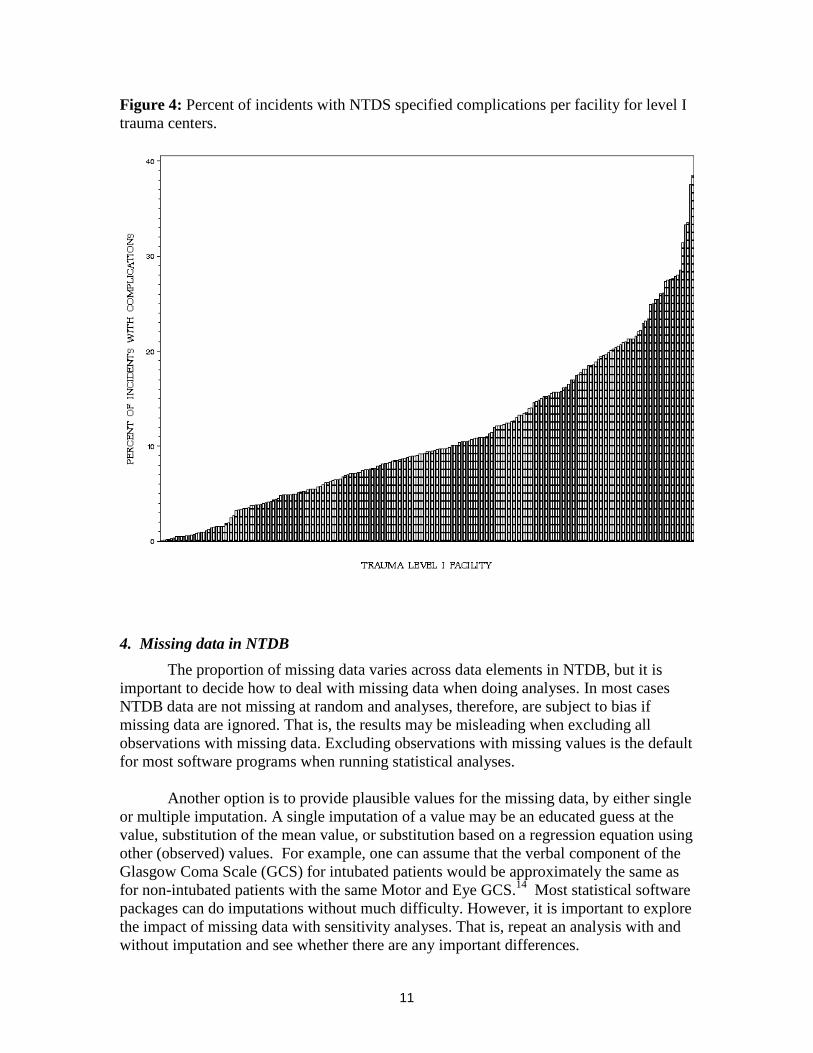
If one hospital has incomplete data on patients with complications, for example, it may falsely appear to be delivering better quality care than a hospital that diligently records every complication. Level I trauma centers had percentages of complications that range from 0 –40% (Figure 4).
11
Figure 4: Percent of incidents with NTDS specified complications per facility for level I trauma centers.
4. Missing data in NTDB The proportion of missing data varies across data elements in NTDB, but it is
important to decide how to deal with missing data when doing analyses. In most cases NTDB data are not missing at random and analyses, therefore, are subject to bias if missing data are ignored. That is, the results may be misleading when excluding all observations with missing data. Excluding observations with missing values is the default for most software programs when running statistical analyses.
Another option is to provide plausible values for the missing data, by either single or multiple imputation. A single imputation of a value may be an educated guess at the value, substitution of the mean value, or substitution based on a regression equation using other (observed) values. For example, one can assume that the verbal component of the Glasgow Coma Scale (GCS) for intubated patients would be approximately the same as for non-intubated patients with the same Motor and Eye GCS.14 Most statistical software packages can do imputations without much difficulty. However, it is important to explore the impact of missing data with sensitivity analyses. That is, repeat an analysis with and without imputation and see whether there are any important differences.
12
GETTING STARTED WITH NTDB DATA
The Research Dataset (RDS) is a set of relational tables and consists of 20 data files. These files are provided in ASCII-CSV format (comma separated value), standard SAS data tables, and DBF format (DBASE version 2.0), which can be easily imported to most statistical software (i.e. SAS, SPSS and Stata). Thirteen of the data files include a unique incident identifier (inc_key) for merging the data files together. One data file (RDS_FACILITY) includes the facility information for the 697 participating hospitals and these data can be merged to RDS_ ED, RDS_DEMO, and RDS_DISCHARGE, by using the unique facility identifier (fac_key). The remaining three data files (RDS_ECODEDES, RDS_DCODEDES, and RDS_PCODEDES) are look-up tables with the description of the AIS code, ICD-9 E-Code, ICD-9 Diagnosis code, and ICD-9 procedure codes, respectively. The look-up tables can be merged with the unique RDS_DCODE, RDS_ECODE, and RDS_PCODE tables.
Included on the downloading website are three sample programs to help researchers get started with merging files and creating statistical output. These sample programs are available for SAS and Stata. A copy of the source codes of these programs can be found in Appendix F. We hope that you will contact us with any concerns or suggestions on how to make these sample programs more useful in the future. Table 1 is a listing of the NTDB files with a short description for each data file. A detailed data dictionary of each variable in the data sets can be found in Appendix A.

13
Table 1: Data files and descriptions
File name Description RDS_AISPCODE The AIS (Abbreviated Injury Scale) code submitted by the
hospital (excluding AIS version 2005) RDS_AISCCODE The AIS (Abbreviated Injury Scale) code globally calculated with
ICDMAP-90.
RDS_AIS98PCODE The AIS (Abbreviated Injury Scale) code globally mapped to AIS
version 1998. If the hospital does not submit AIS98, then ISS is based on AIS derived from ICDMAP-90.
RDS_COMORBID Pre-existing comorbidity information RDS_COMPLIC Any NTDS complications RDS_DEMO Demographic information RDS_DCODE ICD-9-CM Code of Diagnosis Information RDS_DCODEDES Look-up table of the description of the ICD-9-CM diagnosis
codes RDS_DISCHARGE Includes discharge and outcome information RDS_ECODE Includes the ICD-9 external cause of injury code. RDS_ECODEDES Ecode look up table RDS_ED Emergency Department information RDS_FACILITY Facility Information RDS_PCODE Procedure codes RDS_PCODEDES Look-up table for procedures RDS_PROTDEV Protective devices RDS_TRANSPORT Transport information RDS_VITALS Vital signs from EMS and ED
14
FREQUENTLY ASKED QUESTIONS ABOUT USING NTDB
1. What are the system requirements of downloading the NTDB? Minimum of 500MB of disk space for CSV version Minimum of 1GB of disk space for DBF version Minumum of 1GB of disk space for SAS version Minimum of 1GB of RAM strongly recommended 2. Can I estimate the number of patients based on NTDB? The NTDB is an incident database and there are no patient identifiers in the database. If a patient has more than one trauma incident during an admission year, this patient will be in the database twice. 3. How can I merge the data sets in NTDB? The NTDB data files can be merged by using the unique incident key for each incident (inc_key). SAS source code is provided to help you get started. 4. What are the differences between the CSV and DBF files CSV files are comma separated value files and DBF files are from the FoxPro database format. Some statistical packages will handle one file type better than the other. We are aware that SAS handles CSVs inconsistently while using PROC IMPORT. Please use caution and check your datasets prior to analysis, including checking variable values against the variable list. The inconsistencies include: truncation of values, and changing of variable type (numeric to character). We are working to improve these inconsistencies, but strongly recommend the use of DBF files with SAS. 5. What are the patient inclusion criteria for the NTDB? All patients with ICD-9-CM discharge diagnosis 800.00–959.9
• Excluding 905-909 (late effects of injury) • Excluding 910-924 (blisters, contusions, abrasion, and insect bites) • Excluding 930-939 (foreign bodies)
AND who were admitted; or died after receiving any evaluation or treatment; or were dead on arrival. 6. How do I handle the BIU values, i.e., why are there negative values for certain variables when there should not be any? For definition of the BIU values please see Appendix A. The BIU values for numerical values are coded with the numbers -2 and -1. It is recommended to either exclude or set these values to missing before doing any statistical analyses of these values. 7. There are multiple types of Injury Severity Scores (ISS) in the ED file, which one do I use?
There are four different Injury Severity Score (ISS) in NTDB. The ISSLOC is the ISS submitted by the hospital to NTDB and no further changes are made to this value. There

15
are also two ISS scores calculated in the database: ISSAIS is the ISS score that is derived from the AIS scores submitted by the hospitals. ISS98 is the ISS score that has been derived from a mapping of existing AIS codes to AIS98 for consistency. ISSICD is the ISS score that is derived from the AIS score that is calculated from the ICD/AIS map, ICDMAP-90, 1995 update (computer program: ICODERI.DLL, Windows version. Johns Hopkins University, 1997.) Each injury is allocated to one of six body regions based on the Abbreviated Injury Scale (AIS) score according to:
• Head or neck • Face • Chest • Abdominal or pelvic contents • Extremities or pelvic girdle • External
The 3 most severely injured body regions have their AIS severity score squared and added together to produce the ISS score. Only the highest AIS score in each body region is used.
7. There are multiple types of Abbreviated Injury Scale (AIS) score files in the dataset. Which one do I use? Three Abbreviated Injury Scale scores are included in NTDB. RDS_AISPCODE is the AIS score that is submitted to the NTDB for the trauma diagnosis. RDS_AISCCODE is the AIS score that is calculated from the ICDMAP90 crosswalk for the trauma diagnosis and RDS_AIS98PCODE.which contains AIS codes that have been mapped or “crosswalked” to a common AIS 98 code for consistency.
8. There seem to be some inconsistencies between fields, how do I decide what data to include? NTDB has been working to improve the quality of the data and with the new data standard, the quality and consistency has improved, but is of course not perfect. It is always important that the researcher makes sure that the data that are used for analyses are consistent and valid for their purpose. For further information on the valid values for teach variable please see Appendix A. There is very limited cleaning of data when it comes to consistencies between variables, in order to avoid incorrectly deleting values. That is, there are instances where the ICU length of stay (ICUDAYS) is greater than the total hospital length of stay (LOSDAYS) and it is up to the researchers to decide how to use that information. 9. Where can I find the external cause of injury and how many of them are available in the data set? The RDS_ECODE table includes the primary (first-listed) ICD-9 external cause of injury code. There are two ICD-9 external-cause-of-injury codes per incident. Appendix C contains the standard matrix of ICD-9 external-cause-of-injury code groupings used for reporting of injury mortality (defined by ICD-9-CM codes) and morbidity (defined by ICD-9-CM codes) data systems.
16
10. Where can I find the diagnosis? How many diagnoses per incident are available in the data set? The RDS_DCODE table includes all of the ICD-9-CM Codes of Diagnosis for each incident. The AISPCODE and AISCCODE tables include all the AIS codes for each incident. These diagnosis codes are not listed in hierarchical order and there is no way to identify the principal diagnosis. 11. What data cleaning was performed on the dataset before release? Logical inconsistencies and out of range values were corrected in the dataset by replacing the values with the appropriate common null value. Vent days > LOS are set to BIU -2 ICU days > LOS are set to BIU -2 ED or LOS times > 364 days are set to BIU -2. EMS times > 28 days set to BIU -2. YOADMIT or YOPROC >2010 are set to BIU -2. YOINJ < 2009 is set to BIU -2 YOBIRTH ≥2011 is set to BIU -2 YOINJ >2010 is set to BIU -2
RESOURCES FOR EVALUATION OF NTDB DATA
1. Background of injury severity scoring Classifying trauma incidents in terms of injury severity scoring has a long and interesting history, which has been reviewed in numerous publications.15-17 When doing trauma research it is important to classify trauma injuries in order to evaluate the effects of treatment. Some of the most frequently used methods to classify trauma data in the NTDB are described below: A. Classification by anatomy In 1971, the American Medical Association Committee on Medical Aspects of Automotive Safety published the Abbreviated Injury Score (AIS), which divided the body into five regions (head or neck, chest, abdomen, pelvis/extremities, and general) and classified the severity of injuries in each region based on clinical experience (1=minor; 2=moderate; 3=severe, not life-threatening; 4=severe, life-threatening, survival probable; 5=critical, survival uncertain; 6-9=fatal).18 Three years later, Baker and colleagues19 extended the AIS to account for multiple injuries by adding another body region (face), reclassifying each fatal injury to an AIS score less than 6, and squaring the maximum AIS value in each of the six body regions. The Injury Severity Score (ISS) was developed from AIS and is defined as the sum of the squares of the three highest AIS values. The most publicized alternative to AIS and ISS has been the ICD-9 Injury Severity Score (ICISS), proposed in 1996.20 ICISS was almost identical to the Estimated Survival Probability index originally proposed by Levy and colleagues in 1978.21

17
Statewide discharge data from North Carolina were used to predict mortality in patients hospitalized after injury using the observed mortality of patients with the same ICD-9 principal diagnosis code. Osler, Rutledge, and colleagues20 then extended this approach by calculating a “survival risk ratio (SRR)” for each of 2,034 principal or secondary injury diagnoses sustained by 314,402 patients in the 1990-1995 North Carolina data, and assumed that the probability of survival for a given patient could be estimated by the product of their “SRRs.” One difficulty of the ICISS approach is that a reference database for calculation of SRRs must be defined. A table of SRRs (by Meredith, Kilgo, and Osler) has been developed based on a sample of 170,853 cases from a previous version of the NTDB. 22
Sacco, MacKenzie, Champion and colleagues have recently advocated a Modified
Anatomic Profile23 using a new definition of AIS body regions, severity scores within these regions, and coefficients derived from data on 14,392 cases collected by four trauma centers from 1982–1987. Meredith and colleagues have compared this and several others anatomic scoring algorithms using an earlier version of the NTDB (containing 76,871 cases).24 The latter study has stimulated further discussion about comparison of predictive models for trauma outcomes.25
B. Classification by mechanism The Major Trauma Outcomes Study (MTOS)5 considered only blunt versus penetrating injuries for injury classification. Since that time, the use of ICD-9 E-Codes for injury mechanisms has become much more common, and a standard categorization has been provided by the CDC.26 Hannan and colleagues have suggested the use of separate prediction equations for different mechanisms.27 C. Classification by physiology
The Glasgow Coma Scale (GCS) was originally developed as a clinical tool, and is still widely used for this purpose, but has been useful in outcomes research as well.28 This simple scale gives 1 to 6 points for motor activity, 1 to 5 points for verbal activity, and 1 to 4 points for eye-opening. The total GCS is simply the sum of the three components, therefore ranging from 3 (minimal or no neurologic function) to 15 (normal or nearly normal).
The Revised Trauma Score (RTS)29 was based on systolic blood pressure,
respiratory rate (RR), and total GCS on presentation to the ED, with a logistic regression equation derived from MTOS. A principal drawback is that many severely injured patients are intubated and sedated prior to arrival to the ED, so that observations of RR and GCS are of questionable accuracy. Because of the calculation requirements, the RTS has not been used as a clinical tool. D. Classification by comorbidity

18
Charlson and colleagues30 developed the widely-used Charlson Score for general medical patients, adding weights of 6 for the presence of AIDS or metastatic solid tumor, 3 for severe liver disease, 2 for any malignancy, renal failure, or complications of diabetes, and 1 for a history of myocardial infarction, peripheral vascular disease, dementia, chronic lung disease, rheumatic disease, mild liver disease, or uncomplicated diabetes. The Charlson Score has been used in trauma patients.17,31 Morris, Mackenzie et al32,33 developed a similar classification of pre-existing conditions, including coagulopathy, for trauma patients. NTDB records information on multiple comorbidities, most of which could be mapped to the Charlson or Morris/Mackenzie categories. The proper classification and modeling of their effects on injured patients is an important area for future research.34-35
2. Outcomes Mortality is a fundamentally important outcome, and easy to clinically identify.
However, hospital mortality is not necessarily the same as short-term mortality, especially in the older patients who are often discharged to long-term care facilities within a few days of injury.12 Unfortunately, mortality after discharge from a hospital is not as easily determined and is generally not available in registry data. Hospital length of stay has been used as a measure of cost, but is likewise confounded by discharge destination and early mortality. Inter-hospital comparisons using any of these variables should be undertaken with an understanding of their limitations.36 Intermediate outcomes, such as hospital complications, are potential measures of quality; however, they may also be complicated by information bias due to incomplete case ascertainment or occurrence of the complication only after hospital discharge. It may be important to separate the incidence of a given complication from the ultimate outcome attributable to the quality of managing the complication (“rescue”). Functional measurements at the time of discharge or at a specified time after injury are also appealing,37 but currently also have significant limitations; this remains an important area for future research.38
3. Analytic methods Risk Adjustment
In complicated clinical situations, it is rarely appropriate to compare the outcome of two groups using raw data without adjusting for potential differences in their risk factors. Sometimes it is possible to exclude cases from both groups until they are judged to be similar except for the one factor under study; sometimes, the factor of interest can be analyzed for several strata of a potentially confounding factor or factors (e.g., spleen injuries in stable patients with age<55 and ISS<16, age<55 and ISS≥16, age≥55 and ISS<16, and age≥55 and ISS≥16). However, most studies of injured patients have so many factors to analyze that the only practical way is to estimate a mathematical regression model in which the outcome (dependent variable) can be expressed in terms of multiple risk factors (independent variables).

19
For analysis of binary outcomes (e.g., mortality) influenced by multiple factors
(e.g., injury severity, comorbidity, hospital) the standard analytic method is currently logistic regression. Many computer programs are now available to implement this approach, and excellent introductory textbooks have been published.39-40 However, logistic regression does entail certain assumptions and potential misinterpretations, and a formal course and/or statistical consultation are highly desirable before using this methodology.
For certain mathematical reasons, results of logistic regression are generally
expressed in terms of odds rather than probability. Odds are defined as
P(A)1P(A)
)AP(P(A))A(Odds
−==
where P(A) means the probability that A is true, and A)P( means the probability that A is not true. Note that when P(A) is small, there is not much difference between the probability and the odds. Also, note that the above equation can be rearranged as
(A)Odds1(A)OddsP(A)
+=
The effect of a factor (e.g., a given hospital) on the outcome of interest can be
expressed as an odds ratio, that is, the odds when the factor is present divided by the odds when the factor is not present. The odds ratio is generally a reasonable approximation for the risk ratio (the probability of an outcome when the factor is present divided by the probability when the factor is not present), especially when the outcome is relatively infrequent (for example, mortality).
TRISS The Trauma and Injury Severity Score (TRISS) was introduced by Champion and colleagues41 and later described in detail by Boyd and colleagues.42 The method is fundamentally a regression equation predicting the log odds of survival, as bx = b0 + (b1* RTS) + (b2 * ISS) + (b3 * Age≥55). Raising the constant e (the base of natural logarithms, approximately 2.71828) to the power bx gives the predicted odds of survival, since by definition elog odds = odds, and the predicted probability of survival can then be calculated from the predicted odds using
bxbx
bx
e11
e1e
odds1oddsyProbabilit −+
=+
=+
=
TRISS was popularized as a result of MTOS5, and has been a standard calculation by trauma registries since that time. Separate equations have been used for penetrating or blunt injuries. Although the developers of TRISS chose to predict the “probability of

20
survival” rather than the “probability of death” after injury, it is easier to interpret a logistic regression model presented in terms of the less common binary event (e.g., death rather than survival). This results in odds that are nearly the same as the corresponding probabilities, and makes the effects of covariates more apparent. For example, if the probability of death is 5% or 0.05 then the odds of death is 0.05/0.95 = 0.053, whereas if the probability of survival is 90% or 0.90 then the odds of survival is 0.95/0.05 = 19. It may be simpler to consider the RTS categories individually, that is: GCS SBP RR Coded value 13-15 >89 10-29 4 9-12 76-89 >29 3 6-8 50-75 6-9 2 4-5 1-49 1-5 1 3 0 0 0 Similarly, we can categorize ISS (as earlier suggested by MTOS researchers43), or create other groups of maximal AIS scores in different body regions. Using this approach, we can create multiple variables equal to 1 for patients belonging to a given category and 0 for those who do not. Then, logistic regression can be carried out and the coefficients exponentiated to present an odds ratio for each of these categories. This skips the intermediate step of calculating RTS, and the distraction of explaining logarithms and exponentials. It also removes the assumption of a linear effect on the log odds of survival due to stepwise increases in each category. We should hesitate to discard the familiar scoring systems completely unless we can find methods that are significantly better (not just in the statistical sense of “significance,” but in the practical sense). The increased number of data elements available in the NTDB may allow for improvements, and the availability of the data to multiple researchers should encourage progress in this area. Models that account for some of the new patient and institutional variables contained in NTDB need to be explored, as well as approaches based upon outcomes other than simply hospital survival.44,45 It will take some time to reach consensus about whether another mortality model should be considered a standard to succeed TRISS. Modeling may involve different equations for different injury mechanisms, or (equivalently) allowing for interaction terms between these mechanisms and other factors. Other clinically significant interactions could also be explored.46 Approximating the effect of continuous covariates by splines or other polynomial functions has been suggested, but may result in a model that is difficult to interpret.47 A good mathematical model not only predicts an outcome with satisfactory precision, but also helps to explain the factors that affect the outcome. Models must be kept reasonably simple so that they can be accurately interpreted and trusted by clinicians. There is generally more familiarity with ratio measurements (e.g., adjusted mortality rates) rather than difference measurements (e.g., the risk

21
difference or “W statistic”). Computation of confidence intervals is more complicated with ratios, but most clinicians are not concerned with this aspect and the necessary mathematical formulas can be programmed for the computer to calculate.
4. Inter-hospital comparisons MTOS proposed a “Definitive outcome-based evaluation” to compare hospital
trauma mortality to a reference population.5 Z-scores were calculated for individual hospitals by summing the TRISS “Probability of Survival” (p) for each patient to obtain an expected number of survivors, and comparing this to the observed number of survivors. It can be shown48 that if p is known, this difference will theoretically have a normal distribution with variance equal to the sum of ((p)(1-p)) for each patient, and therefore that Z = (observed-expected) / )iance(var will have a normal distribution with mean zero and variance 1. As a consequence, 95% of hospitals would be expected to have a Z-score between -1.96 and +1.96. While there is nothing mathematically wrong with the calculation of a Z-score using the method described by Flora48 and popularized by MTOS, it may be easier to use the logistic regression methods. We can include a variable in the regression equation equal to 1 if the case is identified as coming from a particular hospital and 0 otherwise. The odds ratio and a test for its significance can then be estimated, for example from the equation log odds (died) = b0 + (b1* RTS) + (b2 * ISS) + (b3 * Age≥55) + (b4 * Penetrating) + (b5 * Hospital X). MTOS further proposed a “W statistic”, defined as W = (observed-expected) / (n/100) which may be interpreted as the number of unexpected survivors (or deaths, if negative) per hundred cases, where n is the total number of cases for a given hospital and the “expected” number of survivors has been derived from TRISS. A “test-based” 95% confidence interval can be calculated for each W, consistent with the corresponding Z-scores49,50 as
100
)1(96.1
npp
W ∑ −±
The ad hoc “W statistic” is essentially the same as a standard epidemiologic statistic called the Risk Difference (RD)49 RD = (observed-expected) / n multiplied by a factor of 100. Hollis and colleagues50 have proposed stratifying the W statistic based upon categories of survival probability, in order to give a better estimate of

22
effect if the test population has a distribution of survival probabilities different from that of the reference population. The necessary strata for this adjustment are approximately as follows: 0.68% had 0≤p≤.25, 0.46% had .25<p≤.50, 0.70% had .50<p≤.75, 1.67% had .75<p≤.90, 3.27% had .90<p≤.95, and 93.21% had .95<p≤1. The clustering of individuals within units of observation (e.g., hospitals) also needs to be considered when analyzing the outcomes from a given unit.51 The advantages of multilevel or hierarchical models for this purpose have been increasingly advocated for hospital profiling. Typically, these methods result in fewer outliers and allow the incorporation of smaller centers into the analysis.52-53
PUBLICATIONS
In addition to the studies specifically cited above, we are pleased to note the increasing number of publications utilizing the NTDB, a listing of which we try to keep updated on our website. We recognize that the quality of these studies is variable, and that some of them fail to acknowledge the limitations we have described above. We request that researchers using NTDB notify us of any publications, and hope that the criticism of these studies will also help us find ways to improve the quality of the database. Authors should be aware that the following recommendations have been provided to the editors of journals most likely to publish articles based upon NTDB data:
Recommendations for Peer Review of Studies using the NTDB (from the NTDB Subcommittee, ACS Committee on Trauma, March 2007)
The ACS Committee on Trauma does not presume or desire to involve itself directly in the editorial process by which manuscripts are selected for publication. However, we do wish to inform this process and maximize the quality of these publications by making editors and reviewers aware of the obligations of licensees to the National Trauma Data Bank (NTDB®), as well as some of the technical issues posed by research involving this database. Licensees have agreed to include a statement in their manuscripts acknowledging that “the NTDB remains the full and exclusive copyrighted property of the American College of Surgeons. The American College of Surgeons is not responsible for any claims arising from works based on the original Data, Text, Tables, or Figures.” Licensees have further agreed to include language indicating which version of the NTDB (e.g., Version 6.1 issued in January 2007) they are using. This is important since the database is updated frequently, and other researchers should be provided with sufficient information to allow replication of the findings using the same data set. The NTDB files provide only general information about contributing institutions, such as trauma center verification status and categorical number of beds. We and our licensees are committed to maintaining the confidentiality of contributing institutions and patients as mandated by federal law. Studies claiming to add information about hospitals
23
or patients from sources outside the NTDB should therefore be evaluated with great caution. Reviewers may wish to verify assertions about the characteristics of contributing hospitals against the characteristics actually available in the research data set. Like any large database, the NTDB does not have complete data for all cases; therefore authors should be expected to state how they dealt with missing data (exclusion, imputation, etc.). Similarly, the NTDB is not a population-based dataset; therefore statements about the incidence of specific conditions are inappropriate if based only on NTDB data. A Reference Manual, which describes these and other sources of potential bias inherent to the NTDB, has been provided to all researchers with the database files. Reviewers are advised to look for explicit discussion of these biases and their possible effects on the analysis. Our web site (www.ntdb.org) includes the data use agreements, data dictionaries, a list of prior publications, the Reference Manual, and other related material. Please feel free to contact the NTDB office for further information.
CONTACT INFORMATION
For further assistance in using the NTDB Research Dataset contact:
Melanie Neal, NTDB Manager E-Mail: [email protected] Phone: 312-202-5536
LieLing Wu, NTDB Statistician E-Mail: [email protected] Phone: 312-202-5255
Chrystal Price, NTDB Data Analyst E-Mail: [email protected] Phone: 312-202-5467
Alice Rollins, NTDB Coordinator E-Mail: [email protected] Phone: 312-202-5917
Sandra Goble, Statistical Consultant E-Mail: [email protected]
American College of Surgeons National Trauma Data Bank® 633 N. St. Clair 26th Floor Chicago, IL 60611
24
REFERENCES
1. IOM (Institute of Medicine). Emergency Care at the Crossroads. Washington, DC: National Academy Press, 2007.
2. Boyd DR, Lowe RJ, Baker RJ, Nyhus LM. Trauma registry. New computer method for multifactorial evaluation of a major health problem. JAMA 1973;223:422-428.
3. Cales RH, Bietz DS, Heilig RW Jr. The trauma registry: A method for providing regional system audit using the microcomputer. J Trauma 1985;25:181-186.
4. Report from the 1988 Trauma Registry Workshop, including recommendations for hospital-based trauma registries. J Trauma 1989;29:827-834.
5. Champion HR, Copes WS, Sacco WJ et al. The Major Trauma Outcome Study: establishing national norms for trauma care. J Trauma 1990;30:1356-1365.
6. Eastman AB, Rice CL, Weigelt JA, Hoyt DB. Position Paper, Attachment to Report of the Subcommittee on the Trauma Registry, Annual Report, American College of Surgeons Committee on Trauma, 1994, pp 37-45.
7. Annas GJ. Medical privacy and medical research - judging the new federal regulations. N Engl J Med 2002; 346:216-220.
8. Jurkovich GJ, Mock C. Systematic review of trauma system effectiveness based on registry comparisons. J Trauma 1999;47:S46-S55.
9. Pollock DA. Summary of the discussion: Trauma registry data and TRISS evidence. J Trauma 1999;47:S56-S58.
10. Clark DE. Comparing institutional trauma survival to a standard: Current limitations and suggested alternatives. J Trauma 1999;47:S92-S98.
11. Mann NC, Guice K, Cassidy L, Wright D, Koury J. Are statewide trauma registries comparable? Reaching for a national trauma dataset. Acad Emerg Med 2006;13:946-953.
12. Clark DE, DeLorenzo MA, Lucas FL, Wennberg DE. Epidemiology and short-term outcomes of injured medicare patients. J Am Geriatr Soc 2004; 52:2023-2030.
25
13. Lucas CE, Buechter KJ, Coscia RL, et al. The effect of trauma program registry on reported mortality rates. J Trauma 2001; 51:1122-1126.
14. Meredith W, Rutledge R, Fakhry SM, Emery S, Kromhout-Schiro S. The conundrum of the Glasgow Coma Scale in intubated patients: A linear regression prediction of the Glasgow verbal score from the Glasgow eye and motor scores. J Trauma 1998; 44:839-844.
15. Osler T. Injury severity scoring: perspectives in development and future directions. Am J Surg 1993;165:43S-51S.
16. Senkowski CK, McKenney MG. Trauma scoring systems: A review. J Am Coll Surg 1999;189:491-503.
17. Clark DE, Winchell RJ. Risk adjustment for injured patients using administrative data. J Trauma 2004;57:130-140.
18. Rating the severity of tissue damage. I. The abbreviated scale. JAMA 1971;215:277-280.
19. Baker SP, O'Neill B, Haddon WJ, Long WB. The injury severity score: A method for describing patients with multiple injuries and evaluating emergency care. J Trauma 1974;14:187-196.
20. Osler T, Rutledge R, Deis J, Bedrick E. ICISS: An International Classification of Disease-9 based injury severity score. J Trauma 1996;41:380-386.
21. Levy PS, Mullner R, Goldberg J, Gelfand H. The estimated survival probability index of trauma severity. Health Serv Res 1978;13:28-35.
22. Meredith JW, Kilgo PD, Osler T. A fresh set of survival risk ratios derived from incidents in the National Trauma Data Bank from which the ICISS may be calculated. J Trauma 2003;55:924-932.
23. Sacco WJ, MacKenzie EJ, Champion HR, Davis EG, Buckman RF. Comparison of alternative methods for assessing injury severity based on anatomic descriptors. J Trauma. 1999;47:441-446.
24. Meredith JW, Evans G, Kilgo PD et al. A comparison of the abilities of nine scoring algorithms in predicting mortality. J Trauma 2002;53:621-629.
26
25. Steyerberg EW, Frankema SPG, Harrell FE Jr. Statistical analyses of trauma outcome: When is more too much? J Trauma 2003;54:1256-1257.
26. Recommended framework for presenting injury mortality data. MMWR Morb Mortal Wkly Rep 1997;46:1-30.
27. Hannan EL, Farrell LS, Gorthy SF et al. Predictors of mortality in adult patients with blunt injuries in New York State: a comparison of the Trauma and Injury Severity Score (TRISS) and the International Classification of Disease, Ninth Revision-based Injury Severity Score (ICISS). J Trauma 1999;47:8-14.
28. Teasdale G, Jennett B. Assessment and prognosis of coma after head injury. Acta Neurochir (Wien) 1976;34:45-55.
29. Champion HR, Sacco WJ, Copes WS, Gann DS, Gennarelli TA, Flanagan ME. A revision of the Trauma Score. J Trauma 1989;29:623-629.
30. Charlson ME, Pompei P, Ales KL, MacKenzie CR. A new method of classifying prognostic comorbidity in longitudinal studies: Development and validation. J Chronic Dis 1987;40:373-383.
31. Gubler KD, Davis R, Koepsell T, Soderberg R, Maier RV, Rivara FP. Long-term survival of elderly trauma patients. Arch Surg 1997;132:1010-1014.
32. Morris JA Jr, MacKenzie EJ, Edelstein SL. The effect of preexisting conditions on mortality in trauma patients. JAMA 1990;263:1942-1946.
33. MacKenzie EJ, Morris JA Jr, Edelstein SL. Effect of pre-existing disease on length of hospital stay in trauma patients. J Trauma 1989;29:757-764.
34. Elixhauser A, Steiner C, Harris DR, Coffey RM. Comorbidity measures for use with administrative data. Med Care 1998;36:8-27.
35. Gabbe BJ, Magtengaard K, Hannaford AP, Cameron PA. Is the Charlson comorbidity index useful for predicting trauma outcomes? Acad Emerg Med 2005;12:318-321.
27
36. Clark DE, Lucas FL, Ryan LM. Predicting hospital mortality, length of stay, and transfer to long-term care for injured patients. J Trauma 2007;62:592-600.
37. Glance LG, Dick A, Osler TM, Mukamel D. Judging trauma center quality: Does it depend on the choice of outcomes? J Trauma 2004;56:165-172.
38. Gabbe BJ, Williamson OD, Cameron PA, Dowrick AS. Choosing outcome assessment instruments for trauma registries. Acad Emerg Med 2005;12:751-758.
39. Kleinbaum DG, Klein M. Logistic Regression: A Self-Learning Text, 2nd Edition. New York: Springer-Verlag, 2002.
40. Hosmer DW Jr, Lemeshow S. Applied Logistic Regression, 2nd Edition. New York: John Wiley & Sons, 2000.
41. Champion HR, Sacco WJ, Carnazzo AJ, Copes W, Fouty WJ. Trauma score. Crit Care Med 1981;9:672-676.
42. Boyd CR, Tolson MA, Copes WS. Evaluating trauma care: The TRISS method. Trauma Score and the Injury Severity Score. J Trauma 1987;27:370-378.
43. Copes WS, Champion HR, Sacco WJ, Lawnick MM, Keast SL, Bain LW. The Injury Severity Score revisited. J Trauma 1988;28:69-77.
44. Mullins RJ, Mann NC, Brand DM, Lenfesty BS. Specifications for calculation of risk-adjusted odds of death using trauma registry data. Am J Surg 1997;173:422-425.
45. Mullins RJ, Mann NC, Hedges JR et al. Adequacy of hospital discharge status as a measure of outcome among injured patients. JAMA 1998;279:1727-1731.
46. George RL, McGwin GJ, Metzger J, Chaudry IH, Rue LW 3rd. The association between gender and mortality among trauma patients as modified by age. J Trauma 2003;54:464-471.
47. Royston P, Sauerbrei W. Building multivariable regression models with continuous covariates in clinical epidemiology--with an emphasis on fractional polynomials. Methods Inf Med 2005;44:561-571.

28
48. Flora JD Jr. A method for comparing survival of burn patients to a standard survival curve. J Trauma 1978;18:701-705.
49. Rothman KJ. Modern Epidemiology. Boston: Little, Brown and Co, 1986.
50. Hollis S, Yates DW, Woodford M, Foster P. Standardized comparison of performance indicators in trauma: A new approach to case-mix variation. J Trauma 1995;38:763-766.
51. Roudsari B, Nathens A, Koepsell T, Mock C, Rivara F. Analysis of clustered data in multicentre trauma studies. Injury 2006;37:614-621.
52. Burgess JF Jr, Christiansen CL, Michalak SE, Morris CN. Medical profiling: improving standards and risk adjustments using hierarchical models. J Health Econ 2000;19:291-309.
53. Normand SL, Glickman ME, Gatsonis CA. Statistical methods for profiling providers of medical care: Issues and applications. J Am Statist Assoc 1997;92:803-814.
29
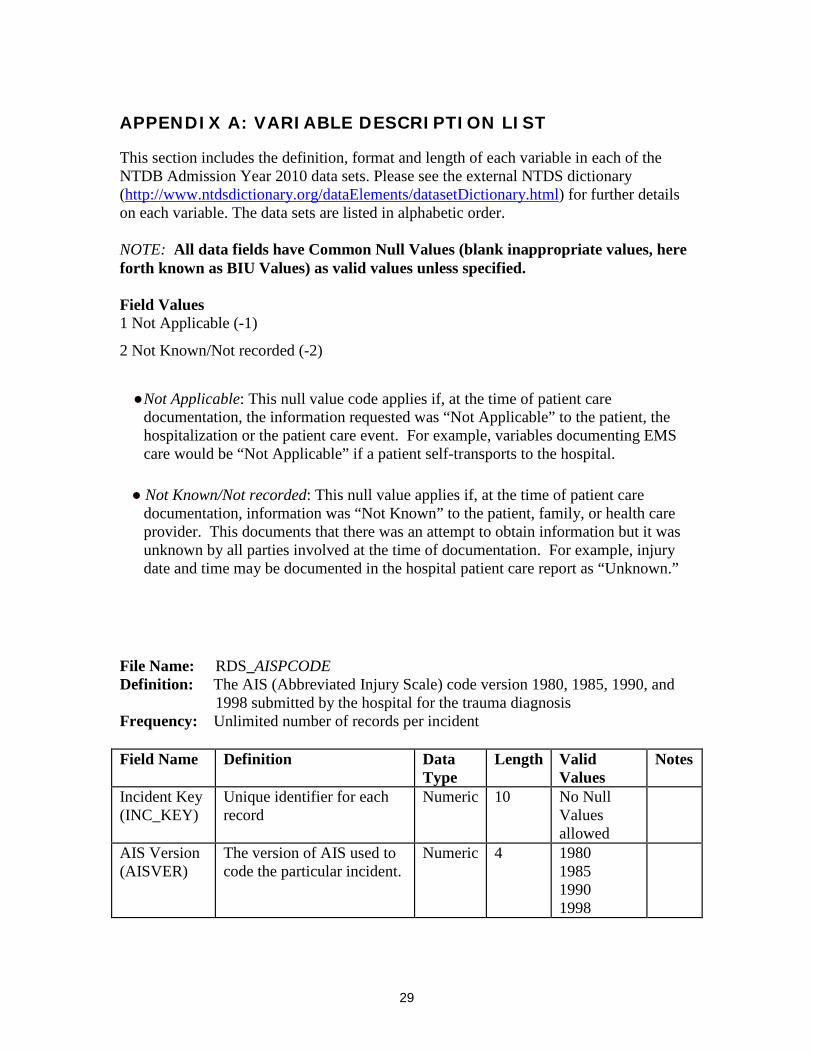
APPENDIX A: VARIABLE DESCRIPTION LIST
This section includes the definition, format and length of each variable in each of the NTDB Admission Year 2010 data sets. Please see the external NTDS dictionary (http://www.ntdsdictionary.org/dataElements/datasetDictionary.html) for further details on each variable. The data sets are listed in alphabetic order. NOTE: All data fields have Common Null Values (blank inappropriate values, here forth known as BIU Values) as valid values unless specified. Field Values 1 Not Applicable (-1)
2 Not Known/Not recorded (-2)
● Not Applicable: This null value code applies if, at the time of patient care
documentation, the information requested was “Not Applicable” to the patient, the hospitalization or the patient care event. For example, variables documenting EMS care would be “Not Applicable” if a patient self-transports to the hospital.
● Not Known/Not recorded: This null value applies if, at the time of patient care
documentation, information was “Not Known” to the patient, family, or health care provider. This documents that there was an attempt to obtain information but it was unknown by all parties involved at the time of documentation. For example, injury date and time may be documented in the hospital patient care report as “Unknown.”
File Name: RDS_AISPCODE Definition: The AIS (Abbreviated Injury Scale) code version 1980, 1985, 1990, and
1998 submitted by the hospital for the trauma diagnosis Frequency: Unlimited number of records per incident Field Name Definition Data
Type Length Valid
Values Notes
Incident Key (INC_KEY)
Unique identifier for each record
Numeric 10 No Null Values allowed
AIS Version (AISVER)
The version of AIS used to code the particular incident.
Numeric 4 1980 1985 1990 1998
30
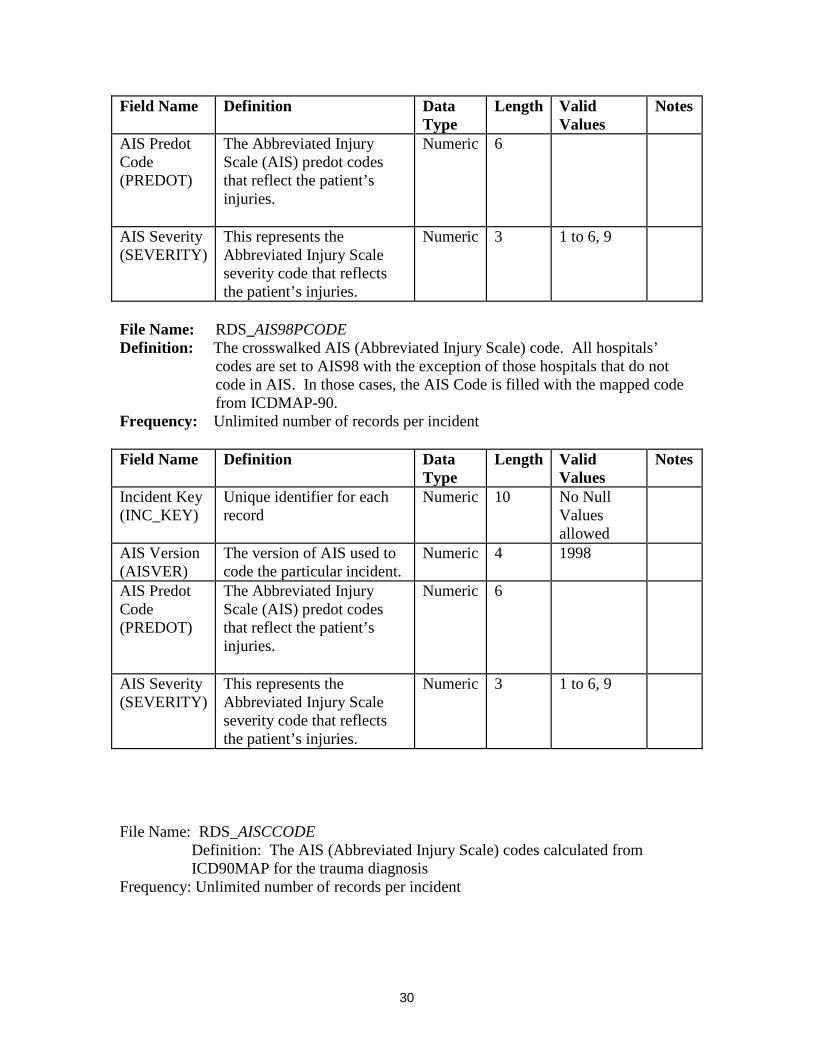
Field Name Definition Data Type
Length Valid Values
Notes
AIS Predot Code (PREDOT)
The Abbreviated Injury Scale (AIS) predot codes that reflect the patient’s injuries.
Numeric 6
AIS Severity (SEVERITY)
This represents the Abbreviated Injury Scale severity code that reflects the patient’s injuries.
Numeric 3 1 to 6, 9
File Name: RDS_AIS98PCODE Definition: The crosswalked AIS (Abbreviated Injury Scale) code. All hospitals’
codes are set to AIS98 with the exception of those hospitals that do not code in AIS. In those cases, the AIS Code is filled with the mapped code from ICDMAP-90.
Frequency: Unlimited number of records per incident Field Name Definition Data
Type Length Valid
Values Notes
Incident Key (INC_KEY)
Unique identifier for each record
Numeric 10 No Null Values allowed
AIS Version (AISVER)
The version of AIS used to code the particular incident.
Numeric 4 1998
AIS Predot Code (PREDOT)
The Abbreviated Injury Scale (AIS) predot codes that reflect the patient’s injuries.
Numeric 6
AIS Severity (SEVERITY)
This represents the Abbreviated Injury Scale severity code that reflects the patient’s injuries.
Numeric 3 1 to 6, 9
File Name: RDS_AISCCODE
Definition: The AIS (Abbreviated Injury Scale) codes calculated from ICD90MAP for the trauma diagnosis
Frequency: Unlimited number of records per incident

31
Field Name Definition Data Type
Length Valid values
Notes
Incident Key (INC_KEY)
Unique identifier for each record
Numeric 10 No Null Values allowed
AIS Version (AISVER)
The version of AIS used to code the particular incident.
Numeric 4 1980 1985 1990 1998
AIS Predot Code (PREDOT)
The Abbreviated Injury Scale (AIS) predot codes that reflect the patient’s injuries.
Numeric 6
AIS Severity (SEVERITY)
This represents the Abbreviated Injury Scale severity code that reflects the patient’s injuries.
Numeric 3 1 to 6, 9
File Name: RDS_COMORBID Definition: Information pertaining to any pre-existing comorbid conditions a patient had upon arrival in the ED/hospital Frequency: Unlimited number of records per incident Field Name Definition Data
Type Length Valid
Values Notes
Incident Key (INC_KEY)
Unique identifier for each record
Numeric 10 No Null Values allowed
Comorbidity Code (COMORKEY)
NTDS comorbid conditions.
String 50 See the NTDS data dictionary
Comorbidity Description (COMORDES)
Description of comorbid conditions.
String 100 See the NTDS data dictionary
File Name: RDS_COMPLIC Definition: Information pertaining to any complications during the course of patient treatment
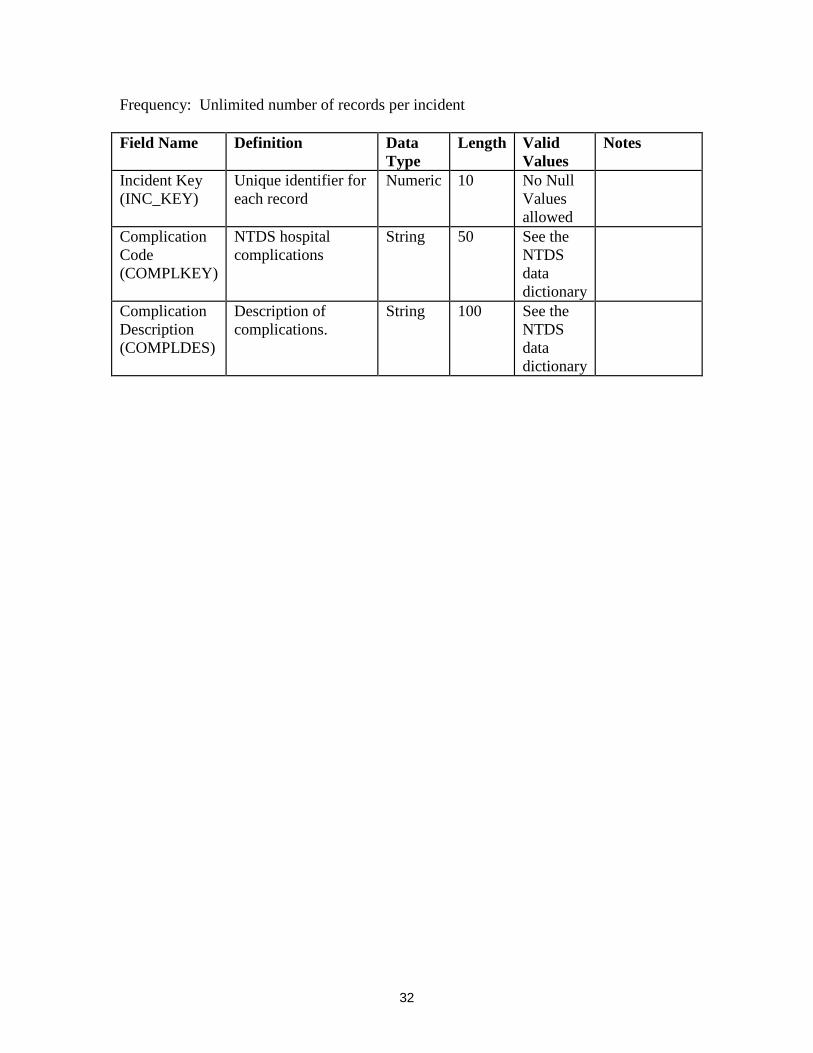
32
Frequency: Unlimited number of records per incident Field Name Definition Data
Type Length Valid
Values Notes
Incident Key (INC_KEY)
Unique identifier for each record
Numeric 10 No Null Values allowed
Complication Code (COMPLKEY)
NTDS hospital complications
String 50 See the NTDS data dictionary
Complication Description (COMPLDES)
Description of complications.
String 100 See the NTDS data dictionary
33
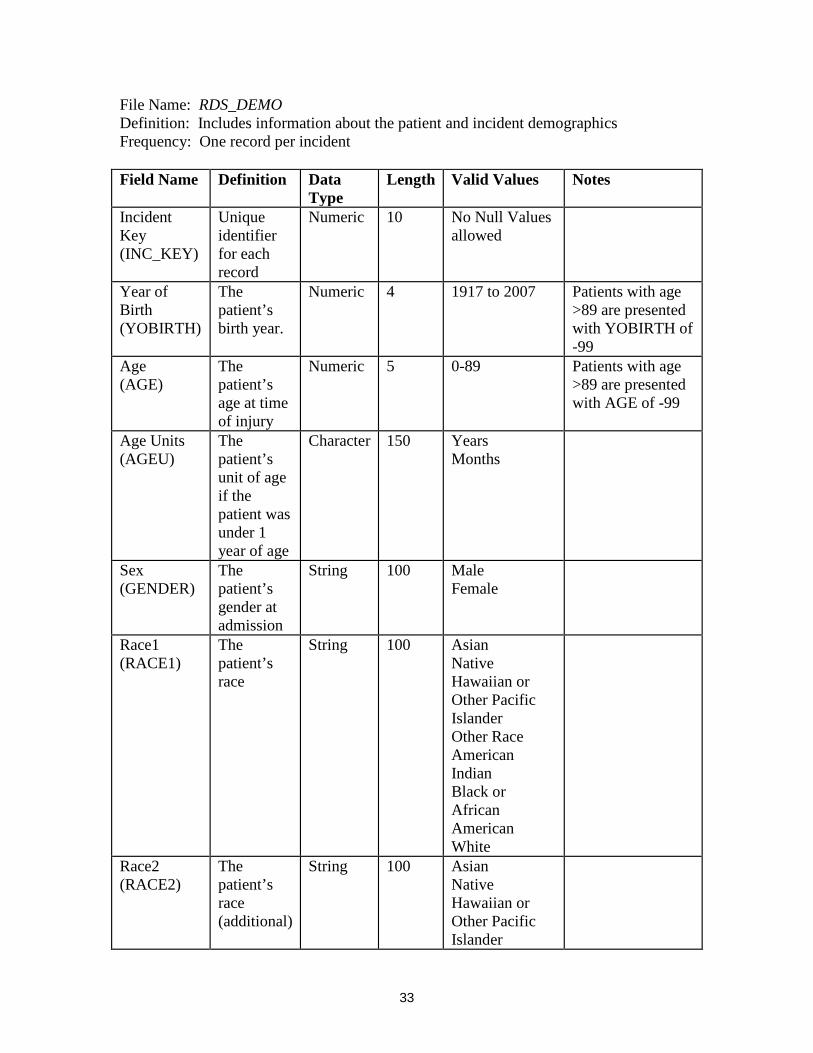
File Name: RDS_DEMO Definition: Includes information about the patient and incident demographics Frequency: One record per incident Field Name Definition Data
Type Length Valid Values Notes
Incident Key (INC_KEY)
Unique identifier for each record
Numeric 10 No Null Values allowed
Year of Birth (YOBIRTH)
The patient’s birth year.
Numeric 4 1917 to 2007 Patients with age >89 are presented with YOBIRTH of -99
Age (AGE)
The patient’s age at time of injury
Numeric 5 0-89
Patients with age >89 are presented with AGE of -99
Age Units (AGEU)
The patient’s unit of age if the patient was under 1 year of age
Character 150 Years Months
Sex (GENDER)
The patient’s gender at admission
String 100 Male Female
Race1 (RACE1)
The patient’s race
String 100 Asian Native Hawaiian or Other Pacific Islander Other Race American Indian Black or African American White
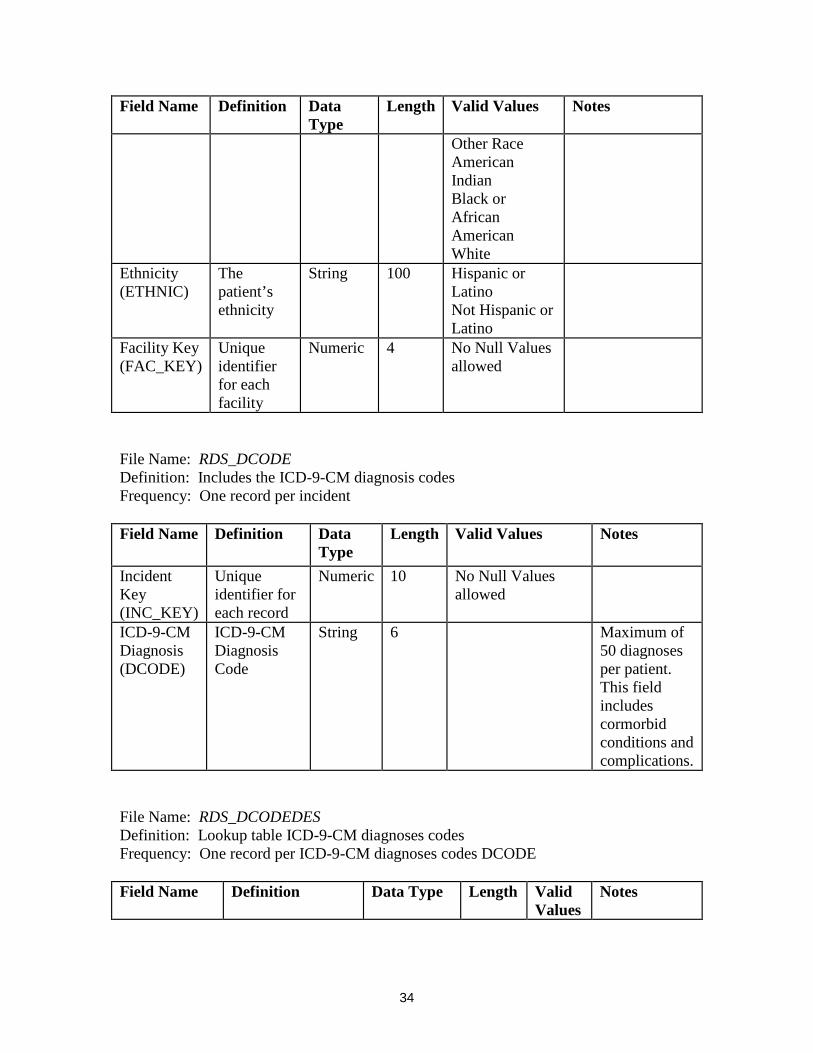
Race2 (RACE2)
The patient’s race (additional)
String 100 Asian Native Hawaiian or Other Pacific Islander
34
Field Name Definition Data Type
Length Valid Values Notes
Other Race American Indian Black or African American White
Ethnicity (ETHNIC)
The patient’s ethnicity
String 100 Hispanic or Latino Not Hispanic or Latino
Facility Key (FAC_KEY)
Unique identifier for each facility
Numeric 4 No Null Values allowed
File Name: RDS_DCODE Definition: Includes the ICD-9-CM diagnosis codes Frequency: One record per incident Field Name Definition Data
Type Length Valid Values Notes
Incident Key (INC_KEY)
Unique identifier for each record
Numeric 10 No Null Values allowed
ICD-9-CM Diagnosis (DCODE)
ICD-9-CM Diagnosis Code
String 6 Maximum of 50 diagnoses per patient. This field includes cormorbid conditions and complications.
File Name: RDS_DCODEDES Definition: Lookup table ICD-9-CM diagnoses codes Frequency: One record per ICD-9-CM diagnoses codes DCODE Field Name Definition Data Type Length Valid
Values Notes

35
Field Name Definition Data Type Length Valid Values
Notes
Diagnosis Code (DCODE)
Unique ICD-9-CM diagnosis code
String 6 This field includes cormorbid conditions and complications.
Diagnosis Code Description (DCODEDES)
Description for ICD-9-CM diagnosis codes
String 100
Nature of Injury (DXTYPE)
Nature of injury as defined by the Barell Injury Diagnosis Matrix
String 50 For full Barell Matrix see Appendix B
Body Region 1 (REGION1)
ICD-9 body region as defined by the Barell Injury Diagnosis Matrix
String 50 For full Barell Matrix see Appendix B
Body Region 2 (REGION2)
Second ICD-9 body region as defined by the Barell Injury Diagnosis Matrix
String 50 For full Barell Matrix see Appendix B
Body Region 3 (REGION3)
Third ICD-9 body region as defined by the Barell Injury Diagnosis Matrix
String
50 For full Barell Matrix see Appendix B
File Name: RDS_DISCHARGE Definition: Includes discharge information Frequency: One record per incident Field Name Definition Data
Type Length Valid
Values Notes
Incident Key (INC_KEY)
Unique identifier for each record
Numeric 10 No Null Values allowed
Discharge Year (YODISCH)
Year the patient was discharged from the facility
Numeric 4 2007, 2008
Hospital Discharge Disposition
The disposition of the patient at hospital
String 100 See the NTDS data dictionary

36
Field Name Definition Data Type
Length Valid Values
Notes
(HOSPDISP) discharge.
Length of Stay (Minutes) (LOSMIN)
Total Length of Stay in minutes
Numeric 5
Length of Stay in Days (LOSDAYS)
Total Length of Stay in days
Numeric 5 1-364
Intensive Care Unit Days (ICUDAYS)
Total number of days spent in the Intensive Care Unit
Numeric 5 1-364
Ventilator Days (VENTDAYS)
Total number of days spent on the Ventilator
Numeric 5 1-364

37
File Name: RDS_ECODE Definition: Includes ICD-9-CM E-Codes (Mechanism of Injury) Frequency: One record per incident Field Name Definition Data Type Length Valid
Values Notes
Incident Key (INC_KEY)
Unique identifier for each record
Numeric 10 No Null Values allowed
Primary E-Code (ECODE)
ICD-9-CM External Cause of Injury Code
String 5
ICD-9-CM Additional E-Code (ECODE2)
Additional ICD-9-CM External Cause of Injury Code
String 5

38
File Name: RDS_ECODEDES Definition: Look-up table for ICD-9-CM E-Codes Frequency: One record per ICD-9-CM E-Code Field Name Definition Data
Type Length Valid Values Notes
E-Code (ECODE)
Unique ICD-9-CM E-Code
String 5 To merge ECODE2 with descriptions, must change this variable name to ECODE2
Primary E-Code Description (ECODEDES)
Description of each ICD-9-CM E-Code
String 100
Trauma Type (INJTYPE)
Indication of the type (nature) of trauma produced by an injury
String 4000 Blunt Burn Penetrating Other/Unspecified
See Appendix C for more information
Injury Intent (INTENT)
Injury Intentionality as defined by the CDC Injury Intentionality Matrix
String 4000 Unintentional Self-inflicted Assault Undetermined Other
See Appendix C for more information
Mechanism of Injury (MECHANISM)
ICD-9-CM Mechanism of Injury E-Code
String 4000 See Appendix C for more information
File Name: RDS_ED Definition: ED and Injury information Frequency: One record per incident Field Name Definition Data
Type Length Valid Values Notes
Incident Key (INC_KEY)
Unique identifier for each record
Numeric 10 No Null Values allowed
Year of Injury (YOINJ)
The year when the patient was injured
Numeric 4 2006, 2007
Admission The year when the Numeric 4
39
Field Name Definition Data Type
Length Valid Values Notes
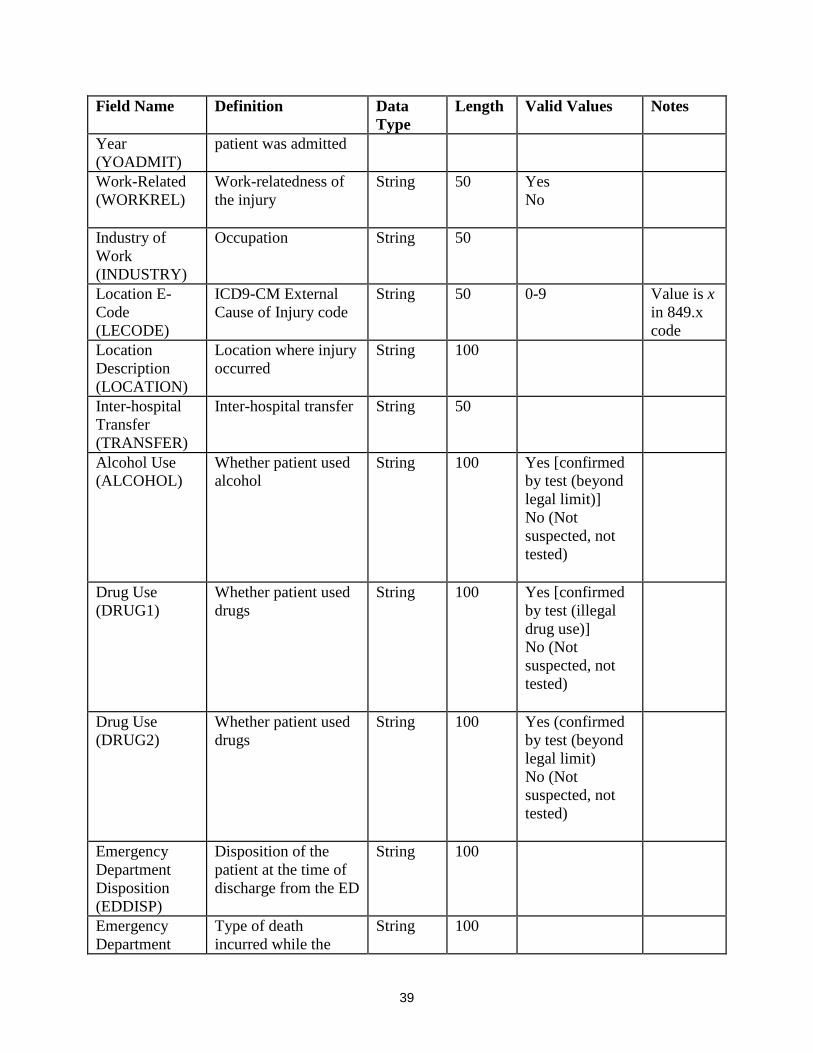
Year (YOADMIT)
patient was admitted
Work-Related (WORKREL)
Work-relatedness of the injury
String 50 Yes No
Industry of Work (INDUSTRY)
Occupation String 50
Location E-Code (LECODE)
ICD9-CM External Cause of Injury code
String 50 0-9
Value is x in 849.x code
Location Description (LOCATION)
Location where injury occurred
String 100
Inter-hospital Transfer (TRANSFER)
Inter-hospital transfer String 50
Alcohol Use (ALCOHOL)
Whether patient used alcohol
String 100 Yes [confirmed by test (beyond legal limit)] No (Not suspected, not tested)
Drug Use (DRUG1)
Whether patient used drugs
String 100 Yes [confirmed by test (illegal drug use)] No (Not suspected, not tested)
Drug Use (DRUG2)
Whether patient used drugs
String 100 Yes (confirmed by test (beyond legal limit) No (Not suspected, not tested)
Emergency Department Disposition (EDDISP)
Disposition of the patient at the time of discharge from the ED
String 100
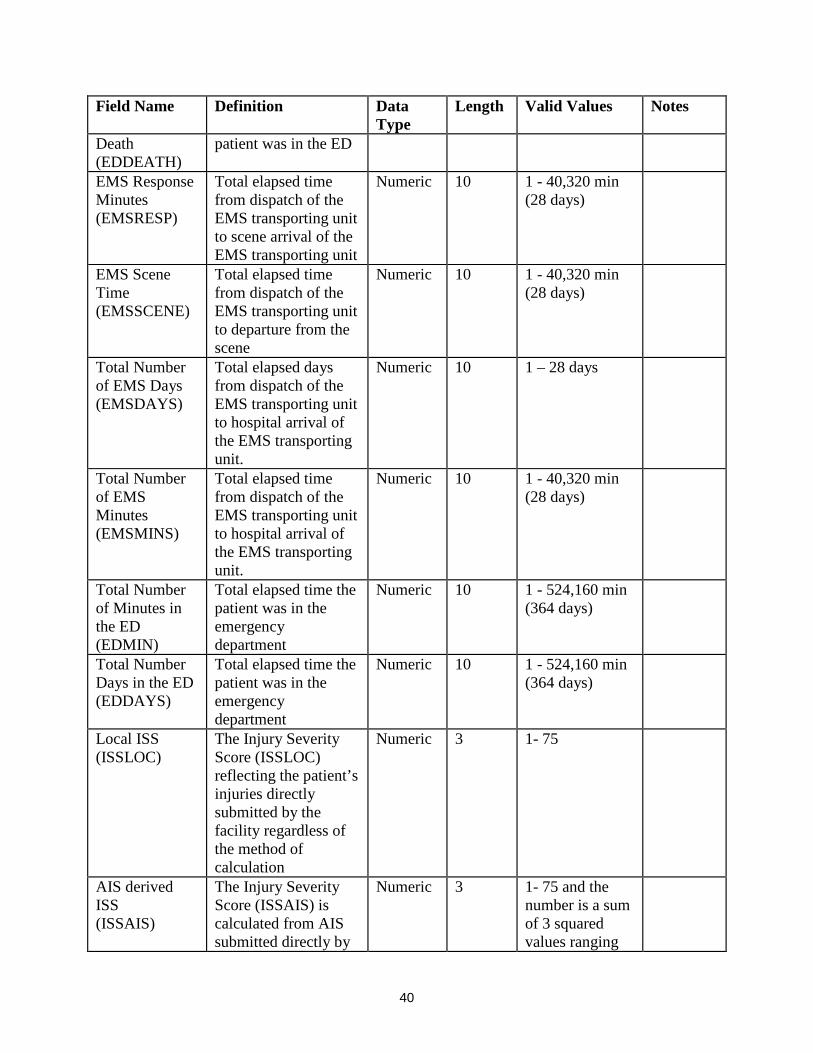
Emergency Department
Type of death incurred while the
String 100
40
Field Name Definition Data Type
Length Valid Values Notes
Death (EDDEATH)
patient was in the ED
EMS Response Minutes (EMSRESP)
Total elapsed time from dispatch of the EMS transporting unit to scene arrival of the EMS transporting unit
Numeric 10 1 - 40,320 min (28 days)
EMS Scene Time (EMSSCENE)
Total elapsed time from dispatch of the EMS transporting unit to departure from the scene
Numeric 10 1 - 40,320 min (28 days)
Total Number of EMS Days (EMSDAYS)
Total elapsed days from dispatch of the EMS transporting unit to hospital arrival of the EMS transporting unit.
Numeric 10 1 – 28 days
Total Number of EMS Minutes (EMSMINS)
Total elapsed time from dispatch of the EMS transporting unit to hospital arrival of the EMS transporting unit.
Numeric 10 1 - 40,320 min (28 days)
Total Number of Minutes in the ED (EDMIN)
Total elapsed time the patient was in the emergency department
Numeric 10 1 - 524,160 min (364 days)
Total Number Days in the ED (EDDAYS)
Total elapsed time the patient was in the emergency department
Numeric 10 1 - 524,160 min (364 days)
Local ISS (ISSLOC)
The Injury Severity Score (ISSLOC) reflecting the patient’s injuries directly submitted by the facility regardless of the method of calculation
Numeric 3 1- 75
AIS derived ISS (ISSAIS)
The Injury Severity Score (ISSAIS) is calculated from AIS submitted directly by
Numeric 3 1- 75 and the number is a sum of 3 squared values ranging
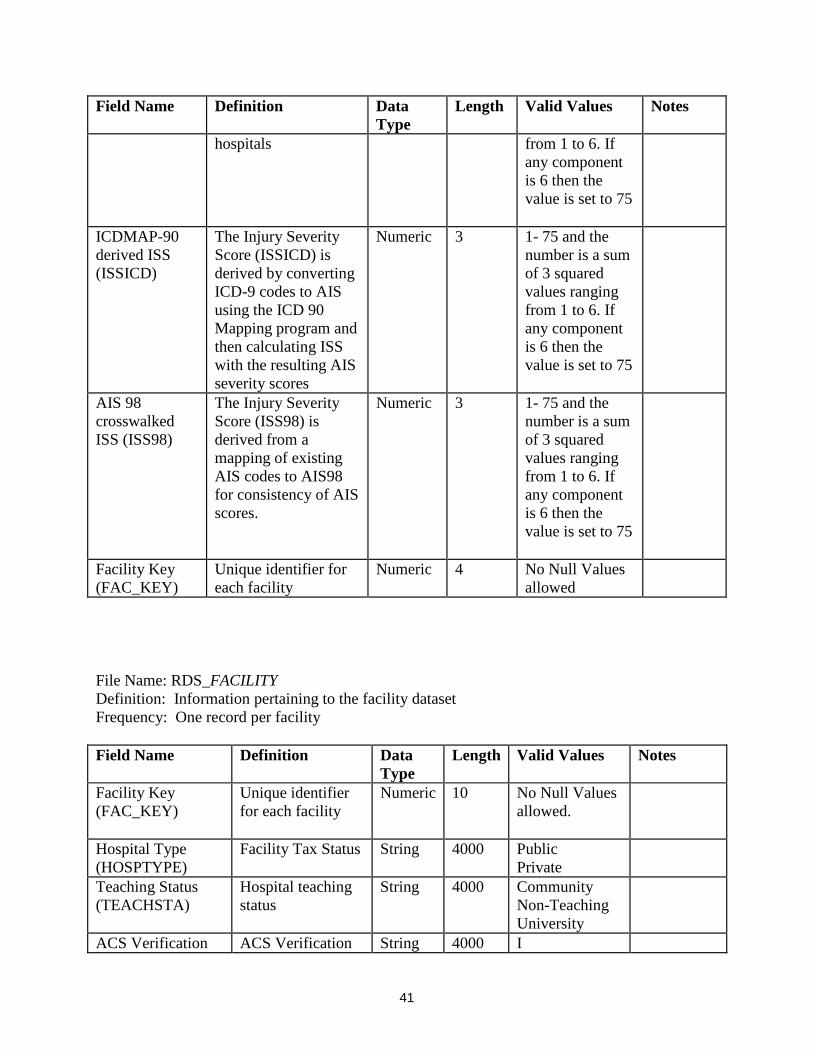
41
Field Name Definition Data Type
Length Valid Values Notes
hospitals from 1 to 6. If any component is 6 then the value is set to 75
ICDMAP-90 derived ISS (ISSICD)
The Injury Severity Score (ISSICD) is derived by converting ICD-9 codes to AIS using the ICD 90 Mapping program and then calculating ISS with the resulting AIS severity scores
Numeric 3 1- 75 and the number is a sum of 3 squared values ranging from 1 to 6. If any component is 6 then the value is set to 75
AIS 98 crosswalked ISS (ISS98)
The Injury Severity Score (ISS98) is derived from a mapping of existing AIS codes to AIS98 for consistency of AIS scores.
Numeric 3 1- 75 and the number is a sum of 3 squared values ranging from 1 to 6. If any component is 6 then the value is set to 75
Facility Key (FAC_KEY)
Unique identifier for each facility
Numeric 4 No Null Values allowed
File Name: RDS_FACILITY Definition: Information pertaining to the facility dataset Frequency: One record per facility Field Name Definition Data
Type Length Valid Values Notes
Facility Key (FAC_KEY)
Unique identifier for each facility
Numeric 10 No Null Values allowed.
Hospital Type (HOSPTYPE)
Facility Tax Status String 4000 Public Private
Teaching Status (TEACHSTA)
Hospital teaching status
String 4000 Community Non-Teaching University
ACS Verification ACS Verification String 4000 I

42
Field Name Definition Data Type
Length Valid Values Notes
Level (ACSLEVEL)
II III IV Not Applicable
ACS Pediatric Verification Level (ACSPEDL)
ACS Pediatric Verification
String 4000 I II Not Applicable
State Designation (STATELEV)
State Designation String 4000 I II III IV V Other Not Applicable
State Pediatric Designation (STATEPL)
State Pediatric Designation
String 4000 I II II IV Other Not Applicable
Bedsize (BEDSIZE)
Number of licensed beds in facility
String 4000 ≤200 200-400 401-600 >600 Not Provided
Comorbidity Recording (COMORCD)
How a facility records comorbidities
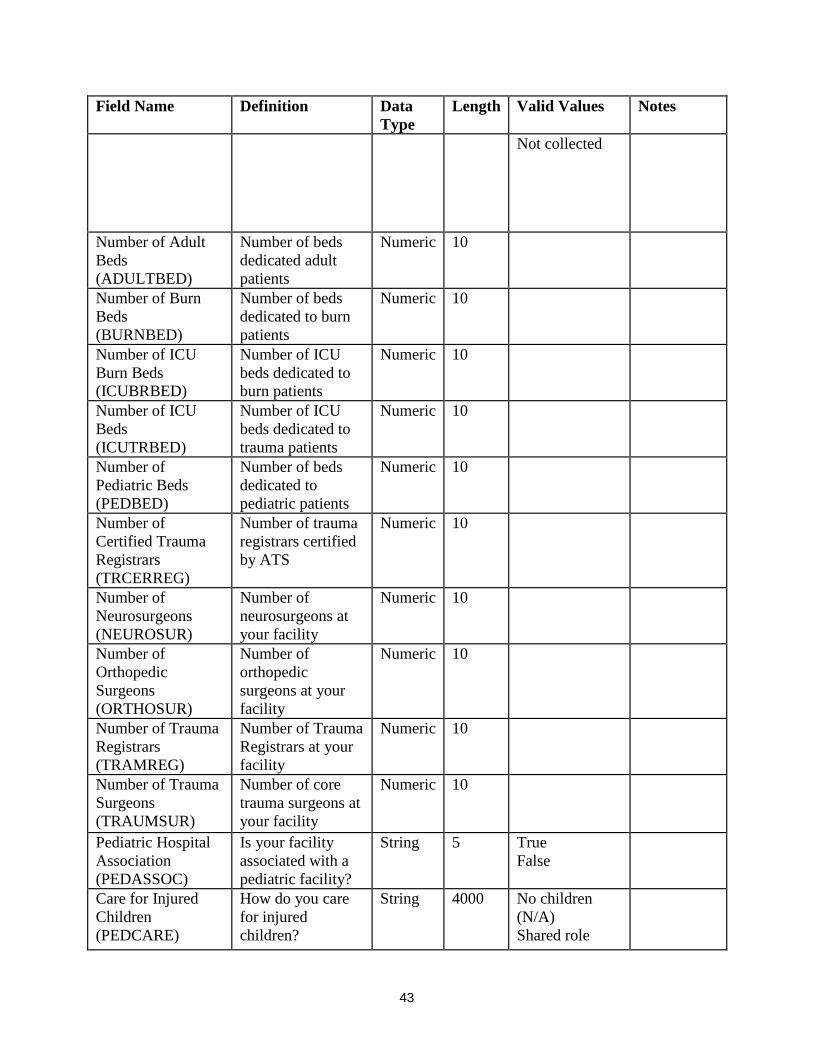
String 4000 Derived from ICD-9 coding Chart abstraction by trauma registrar Calculated by software registry program Not collected
Complication Recording (COMPLCD)
How a facility records complications
String 4000 Derived from ICD-9 coding Chart abstraction by trauma registrar Calculated by software registry program
43
Field Name Definition Data Type
Length Valid Values Notes
Not collected
Number of Adult Beds (ADULTBED)
Number of beds dedicated adult patients
Numeric 10
Number of Burn Beds (BURNBED)
Number of beds dedicated to burn patients
Numeric 10
Number of ICU Burn Beds (ICUBRBED)
Number of ICU beds dedicated to burn patients
Numeric 10
Number of ICU Beds (ICUTRBED)
Number of ICU beds dedicated to trauma patients
Numeric 10
Number of Pediatric Beds (PEDBED)
Number of beds dedicated to pediatric patients
Numeric 10
Number of Certified Trauma Registrars (TRCERREG)
Number of trauma registrars certified by ATS
Numeric 10
Number of Neurosurgeons (NEUROSUR)
Number of neurosurgeons at your facility
Numeric 10
Number of Orthopedic Surgeons (ORTHOSUR)
Number of orthopedic surgeons at your facility
Numeric 10
Number of Trauma Registrars (TRAMREG)
Number of Trauma Registrars at your facility
Numeric 10
Number of Trauma Surgeons (TRAUMSUR)
Number of core trauma surgeons at your facility
Numeric 10
Pediatric Hospital Association (PEDASSOC)
Is your facility associated with a pediatric facility?
String 5 True False
Care for Injured Children (PEDCARE)
How do you care for injured children?
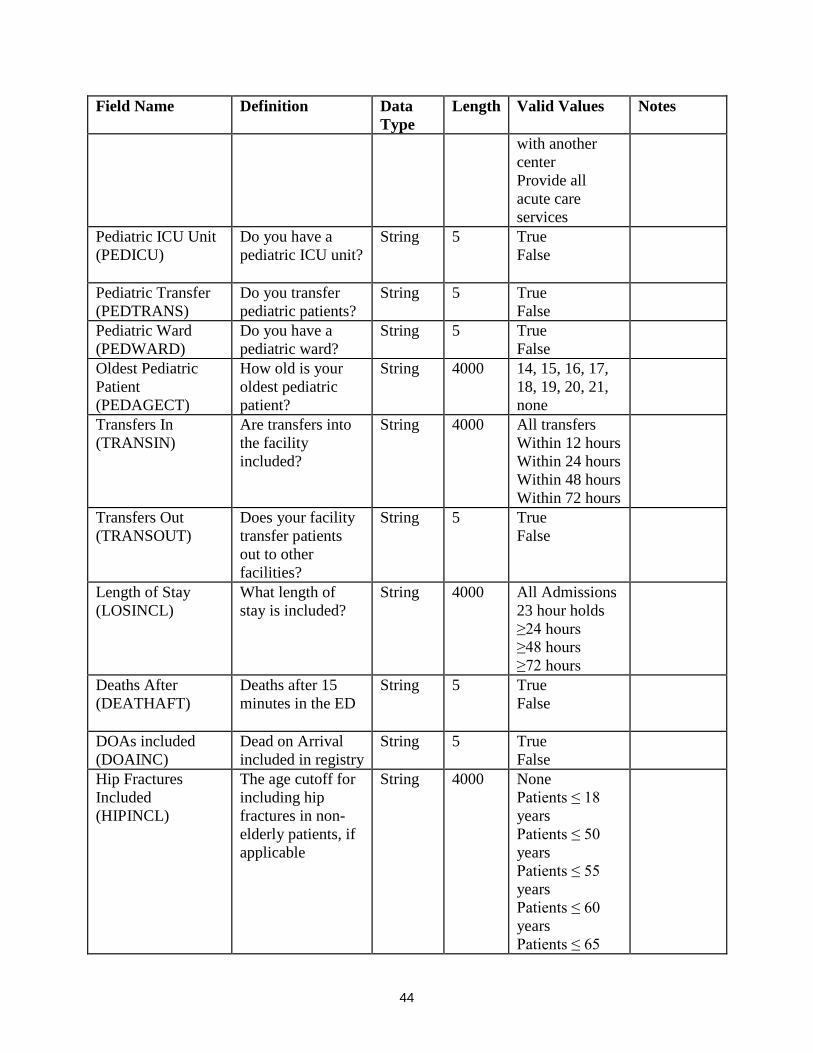
String 4000 No children (N/A) Shared role
44
Field Name Definition Data Type
Length Valid Values Notes
with another center Provide all acute care services
Pediatric ICU Unit (PEDICU)
Do you have a pediatric ICU unit?
String 5 True False
Pediatric Transfer (PEDTRANS)
Do you transfer pediatric patients?
String 5 True False
Pediatric Ward (PEDWARD)
Do you have a pediatric ward?
String 5 True False
Oldest Pediatric Patient (PEDAGECT)
How old is your oldest pediatric patient?
String 4000 14, 15, 16, 17, 18, 19, 20, 21, none
Transfers In (TRANSIN)
Are transfers into the facility included?
String 4000 All transfers Within 12 hours Within 24 hours Within 48 hours Within 72 hours
Transfers Out (TRANSOUT)
Does your facility transfer patients out to other facilities?
String 5 True False
Length of Stay (LOSINCL)
What length of stay is included?
String 4000 All Admissions 23 hour holds ≥24 hours ≥48 hours ≥72 hours
Deaths After (DEATHAFT)
Deaths after 15 minutes in the ED
String 5 True False
DOAs included (DOAINC)
Dead on Arrival included in registry
String 5 True False
Hip Fractures Included (HIPINCL)
The age cutoff for including hip fractures in non-elderly patients, if applicable
String 4000 None Patients ≤ 18 years Patients ≤ 50 years Patients ≤ 55 years Patients ≤ 60 years Patients ≤ 65

45
Field Name Definition Data Type
Length Valid Values Notes
years Patients ≤ 70 years All
Excluded AIS Codes (AISEXCL)
Range of AIS Codes excluded from registry
String 500
Included AIS Codes (AISINCL)
Range of AIS Codes included in registry
String 500
ICD-9 Exclusion Range (ICD9EXCL)
ICD-9-CM codes the facility Excludes in their registry
String 500
ICD-9 Inclusion Range (ICD9INCL)
ICD-9-CM codes the facility includes in their registry
String 500
ICD-9 Inclusion Range the same as NTDB (ICD9NTDB)
ICD-9 Inclusion Criteria is 800-959.9, excluding 905-909, 910-924, and 930-939
String 5 True False
Inclusion/Exclusion Other (OTHERINC)
Does the facility have any other inclusion/exclusion criteria
String 5 True False
Inclusion/Exclusion Other Specify (INCSPEC)
Explanation of other inclusion/exclusion criteria
String 1050 Only present when OTHERINC is ‘True”
Geographic Region (REGION)
Geographic region for the hospital
String 40 "Midwest", "Northeast", "South", "West"
46
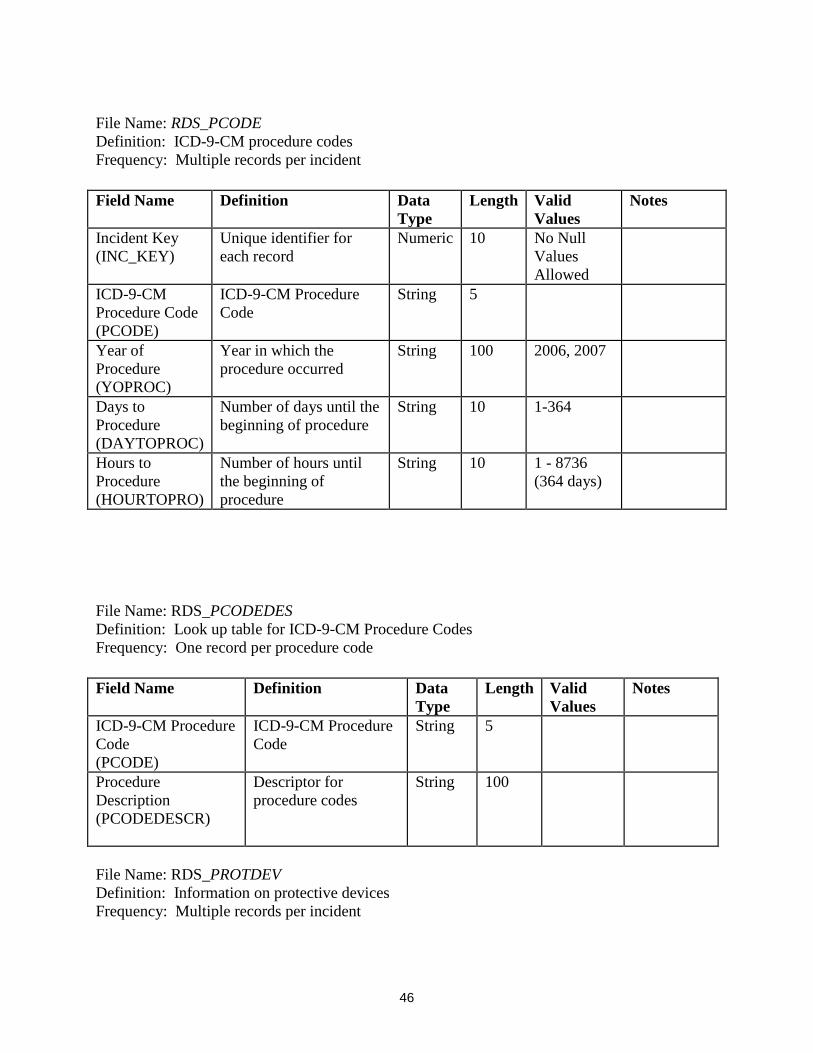
File Name: RDS_PCODE Definition: ICD-9-CM procedure codes Frequency: Multiple records per incident
File Name: RDS_PCODEDES Definition: Look up table for ICD-9-CM Procedure Codes Frequency: One record per procedure code
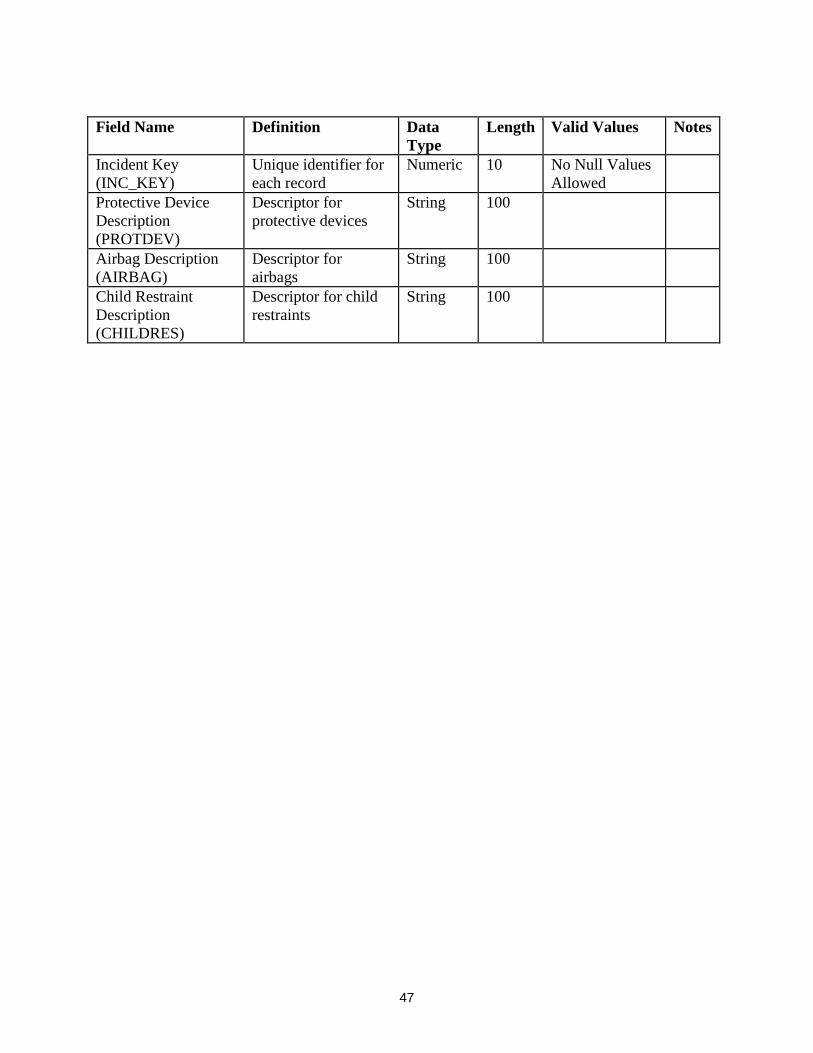
File Name: RDS_PROTDEV Definition: Information on protective devices Frequency: Multiple records per incident
Field Name Definition Data Type
Length Valid Values
Notes
Incident Key (INC_KEY)
Unique identifier for each record
Numeric 10 No Null Values Allowed
ICD-9-CM Procedure Code (PCODE)
ICD-9-CM Procedure Code
String 5
Year of Procedure (YOPROC)
Year in which the procedure occurred
String 100 2006, 2007
Days to Procedure (DAYTOPROC)
Number of days until the beginning of procedure
String 10 1-364
Hours to Procedure (HOURTOPRO)
Number of hours until the beginning of procedure
String 10 1 - 8736 (364 days)
Field Name Definition Data Type
Length Valid Values
Notes
ICD-9-CM Procedure Code (PCODE)
ICD-9-CM Procedure Code
String 5
Procedure Description (PCODEDESCR)
Descriptor for procedure codes
String 100
47
Field Name Definition Data Type
Length Valid Values Notes
Incident Key (INC_KEY)
Unique identifier for each record
Numeric 10 No Null Values Allowed
Protective Device Description (PROTDEV)
Descriptor for protective devices
String 100
Airbag Description (AIRBAG)
Descriptor for airbags
String 100
Child Restraint Description (CHILDRES)
Descriptor for child restraints
String 100
48
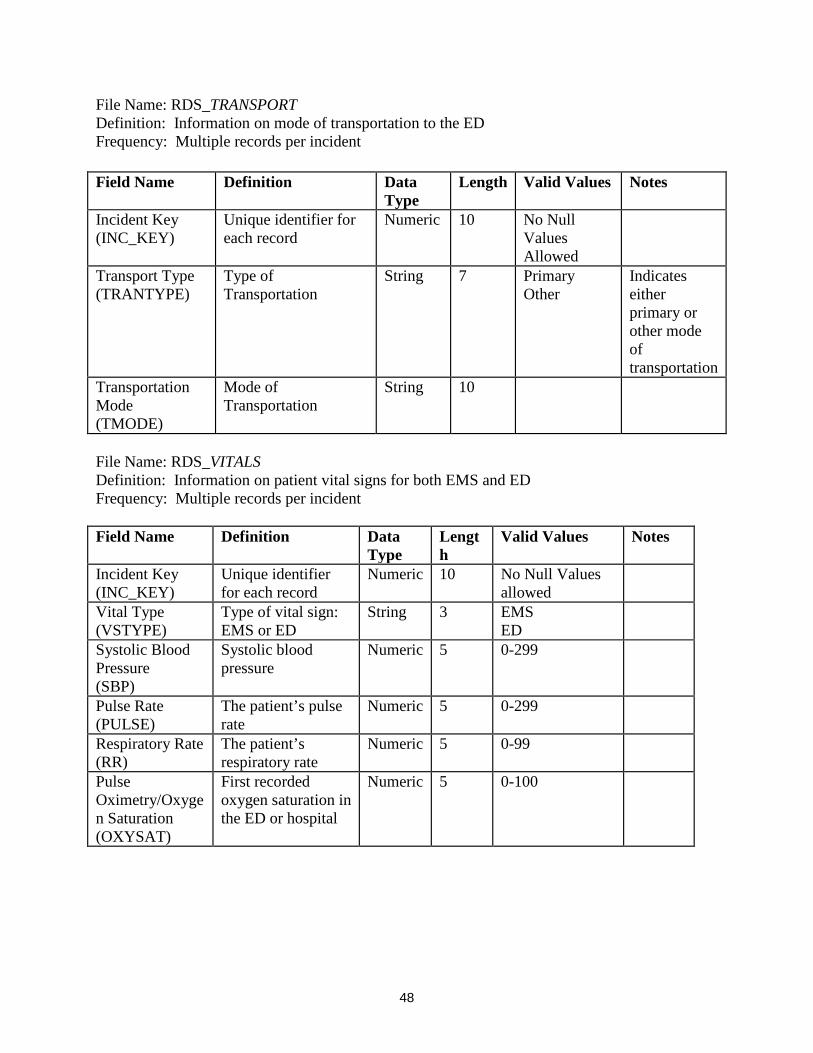
File Name: RDS_TRANSPORT Definition: Information on mode of transportation to the ED Frequency: Multiple records per incident
File Name: RDS_VITALS Definition: Information on patient vital signs for both EMS and ED Frequency: Multiple records per incident Field Name Definition Data
Type Length
Valid Values Notes
Incident Key (INC_KEY)
Unique identifier for each record
Numeric 10 No Null Values allowed
Vital Type (VSTYPE)
Type of vital sign: EMS or ED
String 3 EMS ED
Systolic Blood Pressure (SBP)
Systolic blood pressure
Numeric 5 0-299
Pulse Rate (PULSE)
The patient’s pulse rate
Numeric 5 0-299
Respiratory Rate (RR)
The patient’s respiratory rate
Numeric 5 0-99
Pulse Oximetry/Oxygen Saturation (OXYSAT)
First recorded oxygen saturation in the ED or hospital
Numeric 5 0-100
Field Name Definition Data Type
Length Valid Values Notes
Incident Key (INC_KEY)
Unique identifier for each record
Numeric 10 No Null Values Allowed
Transport Type (TRANTYPE)
Type of Transportation
String 7 Primary Other
Indicates either primary or other mode of transportation
Transportation Mode (TMODE)
Mode of Transportation
String 10
49
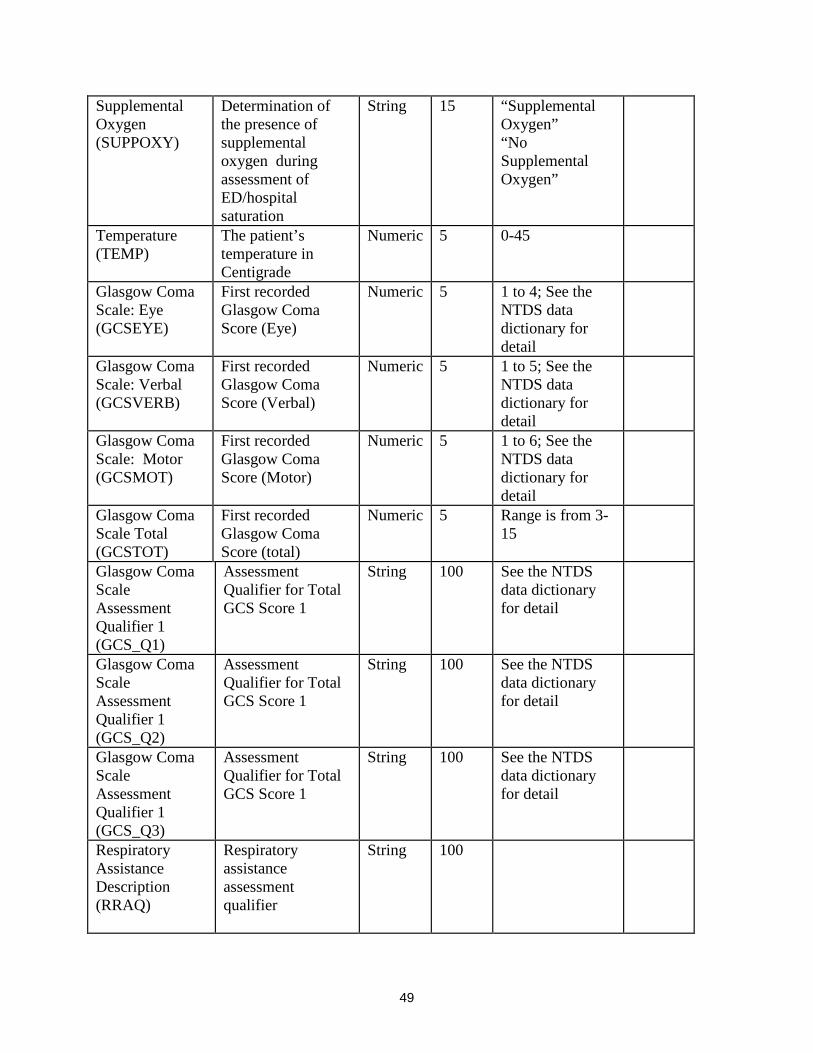
Supplemental Oxygen (SUPPOXY)
Determination of the presence of supplemental oxygen during assessment of ED/hospital saturation
String 15 “Supplemental Oxygen” “No Supplemental Oxygen”
Temperature (TEMP)
The patient’s temperature in Centigrade
Numeric 5 0-45
Glasgow Coma Scale: Eye (GCSEYE)
First recorded Glasgow Coma Score (Eye)
Numeric 5 1 to 4; See the NTDS data dictionary for detail
Glasgow Coma Scale: Verbal (GCSVERB)
First recorded Glasgow Coma Score (Verbal)
Numeric 5 1 to 5; See the NTDS data dictionary for detail
Glasgow Coma Scale: Motor (GCSMOT)
First recorded Glasgow Coma Score (Motor)
Numeric 5 1 to 6; See the NTDS data dictionary for detail
Glasgow Coma Scale Total (GCSTOT)
First recorded Glasgow Coma Score (total)
Numeric 5 Range is from 3-15
Glasgow Coma Scale Assessment Qualifier 1 (GCS_Q1)
Assessment Qualifier for Total GCS Score 1
String 100 See the NTDS data dictionary for detail
Glasgow Coma Scale Assessment Qualifier 1 (GCS_Q2)
Assessment Qualifier for Total GCS Score 1
String 100 See the NTDS data dictionary for detail
Glasgow Coma Scale Assessment Qualifier 1 (GCS_Q3)
Assessment Qualifier for Total GCS Score 1
String 100 See the NTDS data dictionary for detail
Respiratory Assistance Description (RRAQ)
Respiratory assistance assessment qualifier
String 100

50
Supplemental Oxygen Description (OXYGAQ)
Supplemental oxygen (intubation) qualifier
String 100

51
APPENDIX B: THE BARELL INJURY DIAGNOSIS MATRIX, CLASSIFICATION BY BODY REGION AND NATURE OF INJURY
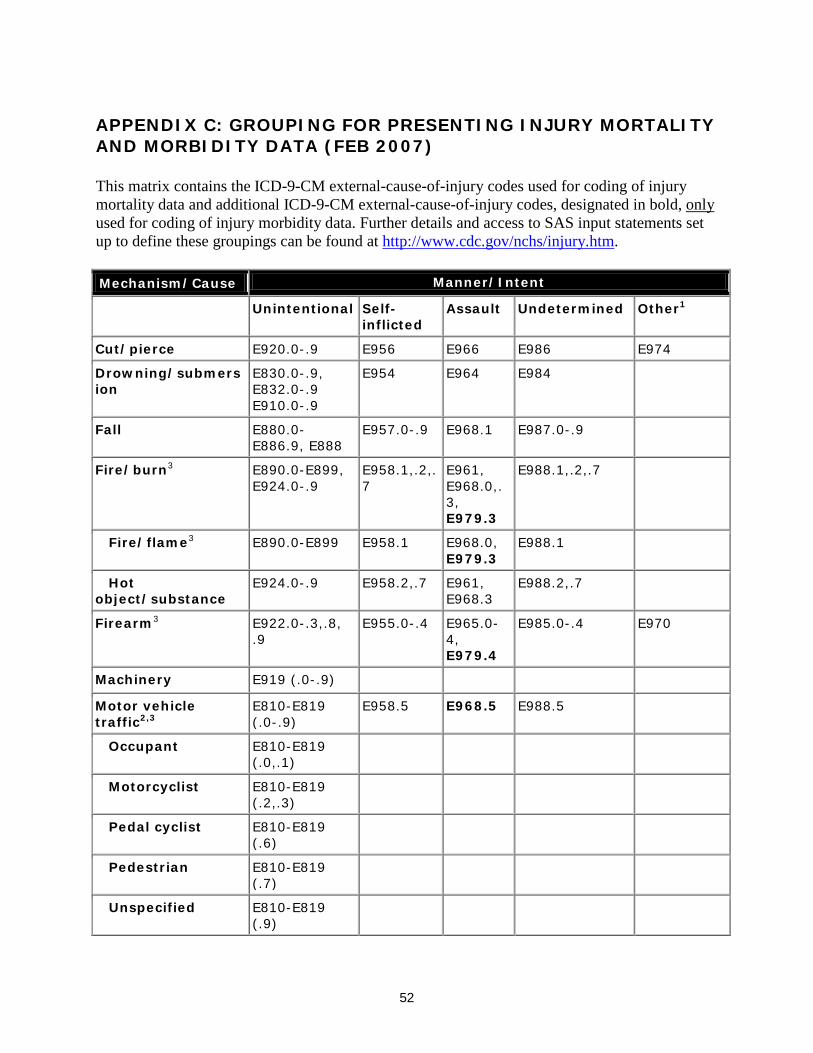
52
APPENDIX C: GROUPING FOR PRESENTING INJURY MORTALITY AND MORBIDITY DATA (FEB 2007) This matrix contains the ICD-9-CM external-cause-of-injury codes used for coding of injury mortality data and additional ICD-9-CM external-cause-of-injury codes, designated in bold, only used for coding of injury morbidity data. Further details and access to SAS input statements set up to define these groupings can be found at http://www.cdc.gov/nchs/injury.htm. Mechanism/Cause Manner/Intent
Unintentional Self-inflicted
Assault Undetermined Other1
Cut/pierce E920.0-.9 E956 E966 E986 E974 Drowning/submersion
E830.0-.9, E832.0-.9 E910.0-.9
E954 E964 E984
Fall E880.0-E886.9, E888
E957.0-.9 E968.1 E987.0-.9
Fire/burn3 E890.0-E899, E924.0-.9
E958.1,.2,.7
E961, E968.0,.3, E979.3
E988.1,.2,.7
Fire/flame3 E890.0-E899 E958.1 E968.0, E979.3
E988.1
Hot object/substance
E924.0-.9 E958.2,.7 E961, E968.3
E988.2,.7
Firearm3 E922.0-.3,.8, .9
E955.0-.4 E965.0-4, E979.4
E985.0-.4 E970
Machinery E919 (.0-.9) Motor vehicle traffic2,3
E810-E819 (.0-.9)
E958.5 E968.5 E988.5
Occupant E810-E819 (.0,.1)
Motorcyclist E810-E819 (.2,.3)
Pedal cyclist E810-E819 (.6)
Pedestrian E810-E819 (.7)
Unspecified E810-E819 (.9)

53
Mechanism/Cause Manner/Intent
Unintentional Self-inflicted Assault Undetermined Other1
Pedal cyclist, other
E800-E807 (.3) E820-E825 (.6), E826.1,.9 E827-E829(.1)
Pedestrian, other E800-807(.2) E820-E825(.7) E826-E829(.0)
Transport, other
E800-E807 (.0,.1,.8,.9) E820-E825 (.0-.5,.8,.9) E826.2-.8 E827-E829 (.2-.9), E831.0-.9, E833.0-E845.9
E958.6 E988.6
Natural/environmental
E900.0-E909, E928.0-.2 E958.3 E988.3
Bites and stings3 E905.0-.6,.9 E906.0-.4,.5,.9
Overexertion E927
Poisoning E850.0-E869.9 E950.0-E952.9
E962.0-.9, E979.6,.7
E980.0-E982.9 E972
Struck by, against E916-E917.9 E960.0; E968.2 E973, E975
Suffocation E911-E913.9 E953.0-.9 E963 E983.0-.9
Other specified and classifiable3,4
E846-E848, E914-E915 E918, E921.0-.9, E922.4,.5 E923.0-.9, E925.0-E926.9 E928(.3-.5), E929.0-.5
E955.5,.6,.7,.9 E958.0,.4
E960.1, E965.5-.9 E967.0-.9, E968.4,.6, .7 E979 (.0-.2,.5,.8,.9)
E985.5,.6,.7 E988.0,.4
E971, E978, E990-E994, E996 E997.0-.2
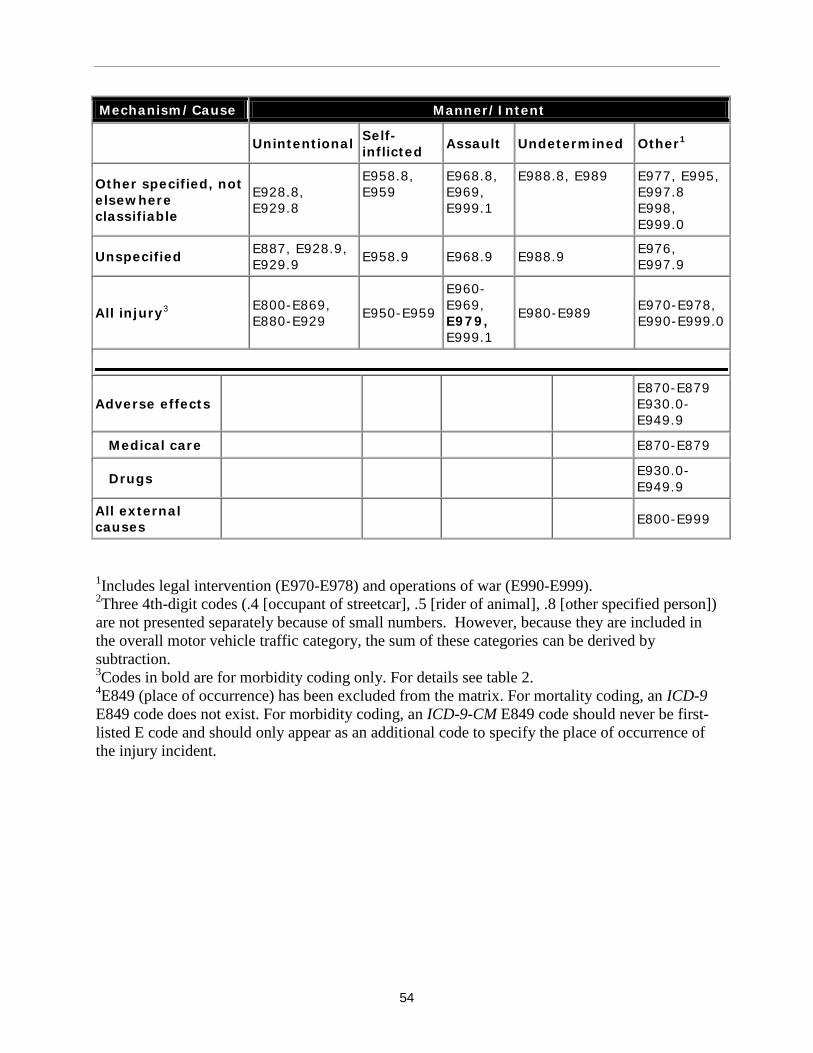
54
Mechanism/Cause Manner/Intent
Unintentional Self-inflicted Assault Undetermined Other1
Other specified, not elsewhere classifiable
E928.8, E929.8
E958.8, E959
E968.8, E969, E999.1
E988.8, E989 E977, E995, E997.8 E998, E999.0
Unspecified E887, E928.9, E929.9 E958.9 E968.9 E988.9 E976,
E997.9
All injury3 E800-E869, E880-E929 E950-E959
E960-E969, E979, E999.1
E980-E989 E970-E978, E990-E999.0
Adverse effects E870-E879 E930.0-E949.9
Medical care E870-E879
Drugs E930.0-E949.9
All external causes E800-E999
1Includes legal intervention (E970-E978) and operations of war (E990-E999). 2Three 4th-digit codes (.4 [occupant of streetcar], .5 [rider of animal], .8 [other specified person]) are not presented separately because of small numbers. However, because they are included in the overall motor vehicle traffic category, the sum of these categories can be derived by subtraction. 3Codes in bold are for morbidity coding only. For details see table 2. 4E849 (place of occurrence) has been excluded from the matrix. For mortality coding, an ICD-9 E849 code does not exist. For morbidity coding, an ICD-9-CM E849 code should never be first-listed E code and should only appear as an additional code to specify the place of occurrence of the injury incident.
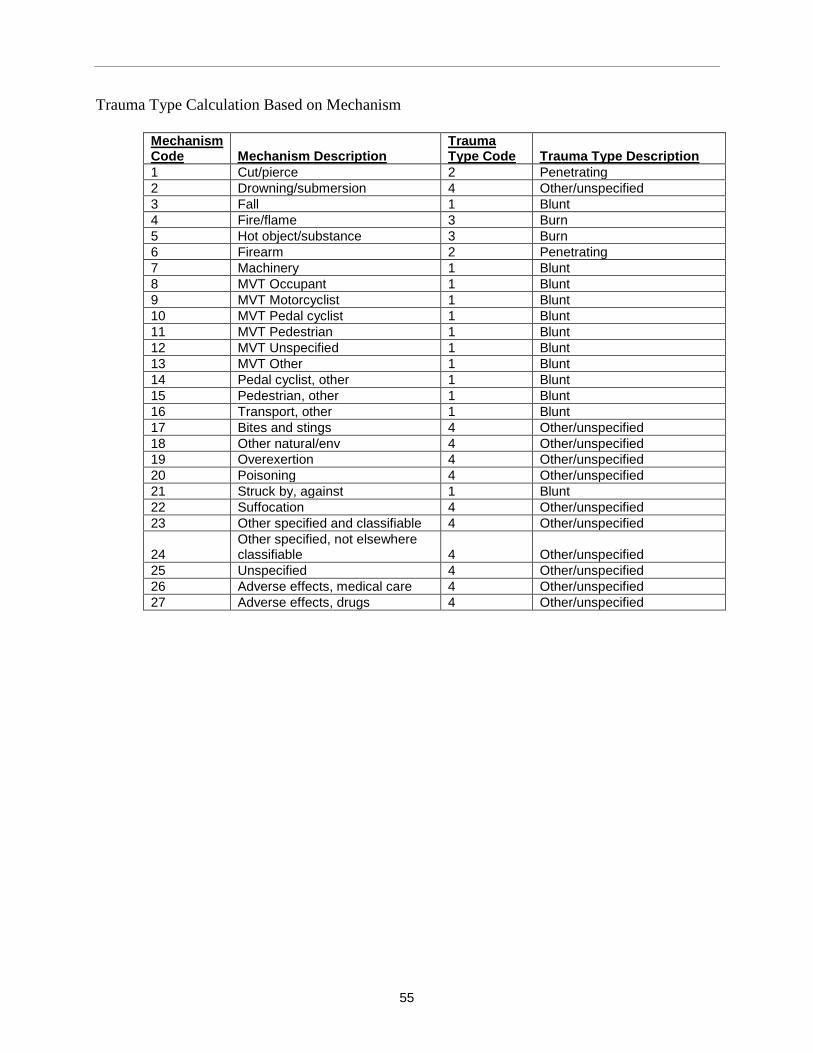
55
Trauma Type Calculation Based on Mechanism
Mechanism Code Mechanism Description
Trauma Type Code Trauma Type Description
1 Cut/pierce 2 Penetrating 2 Drowning/submersion 4 Other/unspecified 3 Fall 1 Blunt 4 Fire/flame 3 Burn 5 Hot object/substance 3 Burn 6 Firearm 2 Penetrating 7 Machinery 1 Blunt 8 MVT Occupant 1 Blunt 9 MVT Motorcyclist 1 Blunt 10 MVT Pedal cyclist 1 Blunt 11 MVT Pedestrian 1 Blunt 12 MVT Unspecified 1 Blunt 13 MVT Other 1 Blunt 14 Pedal cyclist, other 1 Blunt 15 Pedestrian, other 1 Blunt 16 Transport, other 1 Blunt 17 Bites and stings 4 Other/unspecified 18 Other natural/env 4 Other/unspecified 19 Overexertion 4 Other/unspecified 20 Poisoning 4 Other/unspecified 21 Struck by, against 1 Blunt 22 Suffocation 4 Other/unspecified 23 Other specified and classifiable 4 Other/unspecified
24 Other specified, not elsewhere classifiable 4 Other/unspecified
25 Unspecified 4 Other/unspecified 26 Adverse effects, medical care 4 Other/unspecified 27 Adverse effects, drugs 4 Other/unspecified

56
APPENDIX D: SOURCE CODE FOR SAMPLE PROGRAMS
NTDB has created two sample programs to help researchers get started with merging files and creating statistical output. These sample programs are available for both SAS and Stata. A description of the three sample programs can be found in the table below:
Sample Program Name Description
ISS_gender This program calculates the ISS frequency by Gender. The program merges the RDS_ED table with RDS_DEMO table and creates a frequency table of the ISS by Gender.
Spinal_cord_demo This program will create summary statistics for demographics (age, gender) for all spinal cord incidents. The program selects all the spine injuries from the RDS_AISCODE and RDS_DCODE table and the corresponding demographics is merged into that file by using the RDS_DEMO table. Frequency table of the demographic variables are created for these incidents.
A copy of the source code for both the SAS and Stata version of these programs are included in this appendix. We hope that you will contact us with any concerns or suggestions on how to make these sample programs more useful in the future

57
SAS Source Code
2) ISS_gender.sas
/************************************************************************/ /* */ /* Title: ISS_gender.sas */ /* Author: S. Goble, Statistician NTDB */ /* */ /* Purpose: This program calculates the ISS frequency by Gender */ /* */ /* Input data: 1. Data set with the ED data and edit flags per incident */ /* Name: RDS_ED */ /* Variables needed: Name: */ /* Incident ID INC_KEY */ /* ISS score ISS */ /* */ /* 2. Data set with demographics for each incident */ /* Name: DEMO */ /* Variables needed: Name: */ /* Incident ID INC_KEY */ /* Gender GENDER */ /* */ /* Output: Frequency count of the ISS by Gender */ /* */ /* Modified: December 2008 */ /* */ /************************************************************************/ * Change the following: 'D:\data\RDS\NTDB8.1' to '\yourpathname\'; /*folder for saving input data sets*/; LIBNAME DAT 'D:\data\RDS\NTDB8.1'; *** Import data set with ed data (ISS) ***; PROC IMPORT FILE="D:\data\RDS\NTDB8.1\RDS_ED.dbf" OUT=ED DBMS=dbf REPLACE; RUN; PROC SORT DATA=ED; BY INC_KEY; RUN; **** Import the demographic data (Gender) *****;
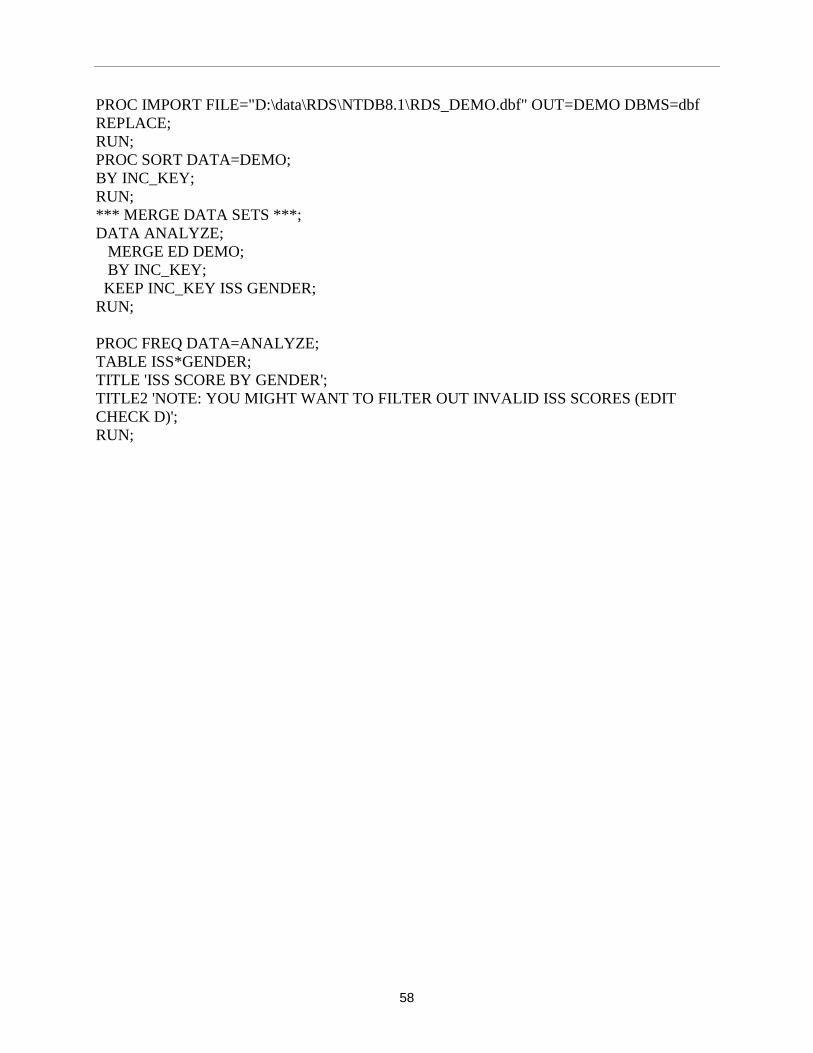
58
PROC IMPORT FILE="D:\data\RDS\NTDB8.1\RDS_DEMO.dbf" OUT=DEMO DBMS=dbf REPLACE; RUN; PROC SORT DATA=DEMO; BY INC_KEY; RUN; *** MERGE DATA SETS ***; DATA ANALYZE; MERGE ED DEMO; BY INC_KEY; KEEP INC_KEY ISS GENDER; RUN; PROC FREQ DATA=ANALYZE; TABLE ISS*GENDER; TITLE 'ISS SCORE BY GENDER'; TITLE2 'NOTE: YOU MIGHT WANT TO FILTER OUT INVALID ISS SCORES (EDIT CHECK D)'; RUN;
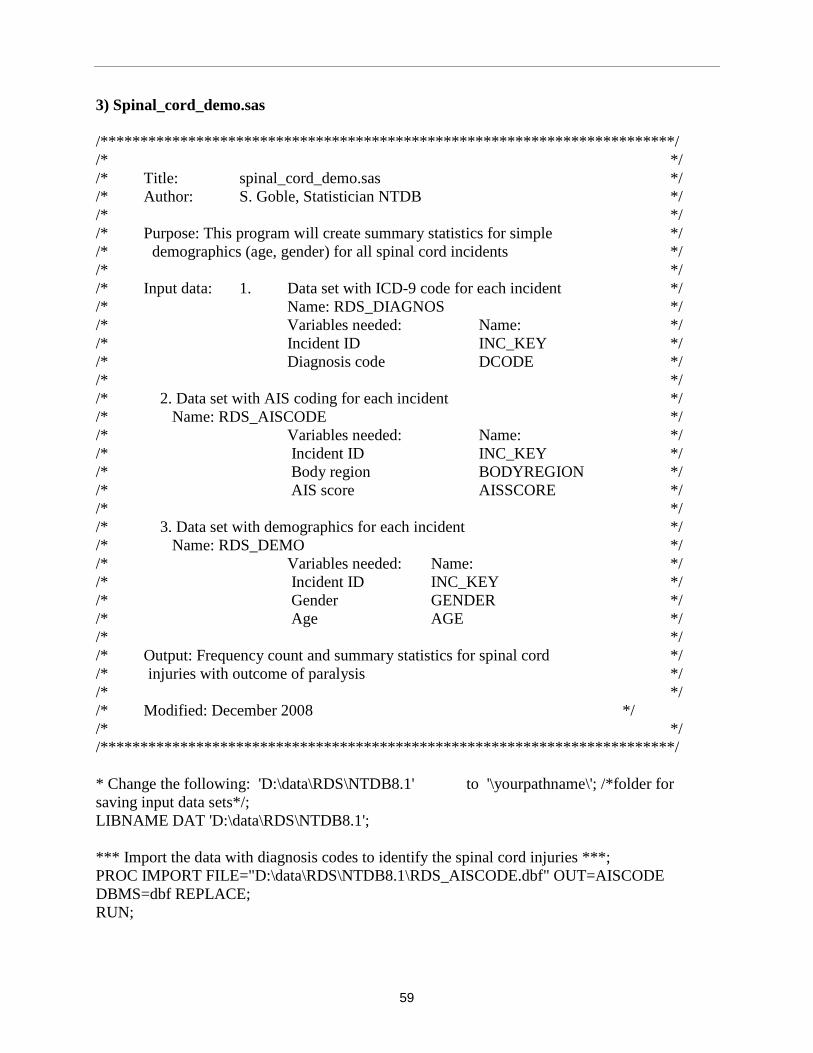
59
3) Spinal_cord_demo.sas /************************************************************************/ /* */ /* Title: spinal_cord_demo.sas */ /* Author: S. Goble, Statistician NTDB */ /* */ /* Purpose: This program will create summary statistics for simple */ /* demographics (age, gender) for all spinal cord incidents */ /* */ /* Input data: 1. Data set with ICD-9 code for each incident */ /* Name: RDS_DIAGNOS */ /* Variables needed: Name: */ /* Incident ID INC_KEY */ /* Diagnosis code DCODE */ /* */ /* 2. Data set with AIS coding for each incident */ /* Name: RDS_AISCODE */ /* Variables needed: Name: */ /* Incident ID INC_KEY */ /* Body region BODYREGION */ /* AIS score AISSCORE */ /* */ /* 3. Data set with demographics for each incident */ /* Name: RDS_DEMO */ /* Variables needed: Name: */ /* Incident ID INC_KEY */ /* Gender GENDER */ /* Age AGE */ /* */ /* Output: Frequency count and summary statistics for spinal cord */ /* injuries with outcome of paralysis */ /* */ /* Modified: December 2008 */ /* */ /************************************************************************/ * Change the following: 'D:\data\RDS\NTDB8.1' to '\yourpathname\'; /*folder for saving input data sets*/; LIBNAME DAT 'D:\data\RDS\NTDB8.1'; *** Import the data with diagnosis codes to identify the spinal cord injuries ***; PROC IMPORT FILE="D:\data\RDS\NTDB8.1\RDS_AISCODE.dbf" OUT=AISCODE DBMS=dbf REPLACE; RUN;
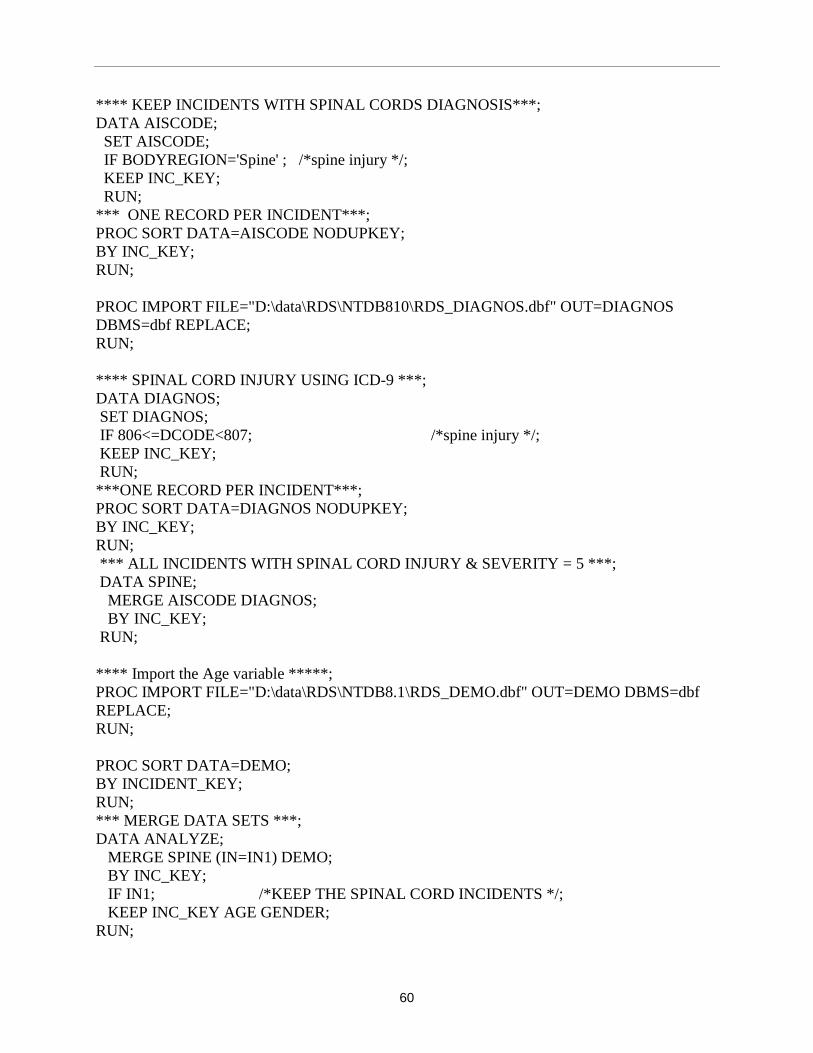
60
**** KEEP INCIDENTS WITH SPINAL CORDS DIAGNOSIS***; DATA AISCODE; SET AISCODE; IF BODYREGION='Spine' ; /*spine injury */; KEEP INC_KEY; RUN; *** ONE RECORD PER INCIDENT***; PROC SORT DATA=AISCODE NODUPKEY; BY INC_KEY; RUN; PROC IMPORT FILE="D:\data\RDS\NTDB810\RDS_DIAGNOS.dbf" OUT=DIAGNOS DBMS=dbf REPLACE; RUN; **** SPINAL CORD INJURY USING ICD-9 ***; DATA DIAGNOS; SET DIAGNOS; IF 806<=DCODE<807; /*spine injury */; KEEP INC_KEY; RUN; ***ONE RECORD PER INCIDENT***; PROC SORT DATA=DIAGNOS NODUPKEY; BY INC_KEY; RUN; *** ALL INCIDENTS WITH SPINAL CORD INJURY & SEVERITY = 5 ***; DATA SPINE; MERGE AISCODE DIAGNOS; BY INC_KEY; RUN; **** Import the Age variable *****; PROC IMPORT FILE="D:\data\RDS\NTDB8.1\RDS_DEMO.dbf" OUT=DEMO DBMS=dbf REPLACE; RUN; PROC SORT DATA=DEMO; BY INCIDENT_KEY; RUN; *** MERGE DATA SETS ***; DATA ANALYZE; MERGE SPINE (IN=IN1) DEMO; BY INC_KEY; IF IN1; /*KEEP THE SPINAL CORD INCIDENTS */; KEEP INC_KEY AGE GENDER; RUN;

61
PROC FREQ DATA=ANALYZE; TABLE AGE GENDER; TITLE 'AGE AND GENDER FOR SPINAL CORD INJURIES'; RUN; PROC UNIVARIATE DATA=ANALYZE; VAR AGE ; TITLE 'SUMMARY STATISTICS FOR AGE FOR SPINAL CORD INJURIES'; RUN;

62
Stata Source code: 2) ISS_gender.do
/************************************************************************/ /* Title: ISS_gender.do */ /* Author: S. Goble, Statitician NTDB */ /* Purpose: This program calculates the ISS frequency by Gender */ /* */ /* Input data: 1. Data set with the ED data and edit flags per incident */ /* Name: RDS_ED */ /* Variables needed: Name: */ /* Incident ID INC_KEY */ /* ISS score ISS */ /* */ /* 2. Data set with demographics for each incident */ /* Name: DEMO */ /* Variables needed: Name: */ /* Incident ID INC_KEY */ /* Gender GENDER */ /* */ /* Output: Frequency count of the ISS by Gender */ /* */ /* Modified: December 2008 */ /* */ /************************************************************************/ clear set memory 700000 set debug on * Change the following:'D:\data\RDS\NTDB8.1\' to '\yourpathname\' /*folder for saving input data sets*/ * Change the following:'D:\data\Stata\RDS7.0\Sample_programs' to '\yourpathname\'/*folder for saving output data set*/ *Import data set with ed data (ISS) insheet using D:\data\RDS\NTDB8.1\RDS_ED.csv sort inc_key save D:\data\Stata\RDS7.0\Sample_programs\ed.dta, replace clear *Import Demo data insheet using D:\data\RDS\NTDB8.1\RDS_DEMO.csv sort inc_key *MERGE FILES

63
* KEEP ONLY RECORDS FROM BOTH DATA SETS merge inc_key using D:\data\Stata\RDS8.1\Sample_programs\ed.dta keep if _merge==3 drop _merge * ISS SCORE BY GENDER tab iss gender

64
3) Spinal_cord_demo.do /************************************************************************/ /* */ /* Title: spinal_cord_demo.do */ /* Author: S. Goble, Statitician NTDB */ /* */ /* Purpose: This program will create summary statistics for simple */ /* demographics (age, gender) for all spinal cord incidents */ /* */ /* Input data: 1. Data set with ICD-9 code for each incident */ /* Name: RDS_DIAGNOS */ /* Variables needed: Name: */ /* Incident ID INC_KEY */ /* Diagnosis code DCODE */ /* */ /* 2. Data set with AIS coding for each incident */ /* Name: RDS_AISCODE */ /* Variables needed: Name: */ /* Incident ID INC_KEY */ /* Body region BODYREGION */ /* AIS score AISSCORE */ /* */ /* 3. Data set with demographics for each incident */ /* Name: RDS_DEMO */ /* Variables needed: Name: */ /* Incident ID INC_KEY */ /* Gender GENDER */ /* Age AGE */ /* */ /* Output: Frequency count and summary statistics for spinal cord */ /* injuries with outcome of paralysis */ /* */ /* Created: NOVEMBER, 2007 */ /* */ /************************************************************************/ clear set memory 700000 set debug on * Change the following:'D:\data\RDS\NTDB7.0\' to '\yourpathname\' /*folder for saving input data sets*/ * Change the following:'D:\data\Stata\RDS7.0\Sample_programs' to '\yourpathname\'/*folder for saving output data set*/ *** Import the data with diagnosis codes to identify the spinal cord injuries insheet using D:\data\RDS\NTDB7.0\RDS_AISCODE.csv
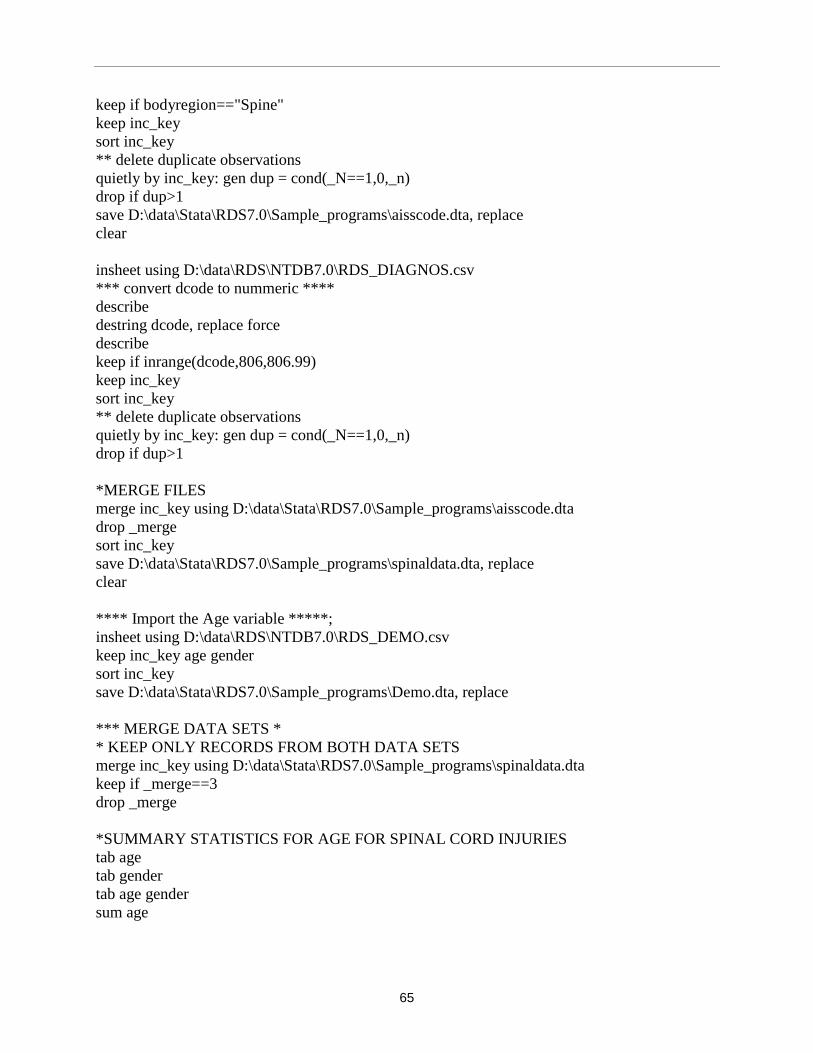
65
keep if bodyregion=="Spine" keep inc_key sort inc_key ** delete duplicate observations quietly by inc_key: gen dup = cond(_N==1,0,_n) drop if dup>1 save D:\data\Stata\RDS7.0\Sample_programs\aisscode.dta, replace clear insheet using D:\data\RDS\NTDB7.0\RDS_DIAGNOS.csv *** convert dcode to nummeric **** describe destring dcode, replace force describe keep if inrange(dcode,806,806.99) keep inc_key sort inc_key ** delete duplicate observations quietly by inc_key: gen dup = cond(_N==1,0,_n) drop if dup>1 *MERGE FILES merge inc_key using D:\data\Stata\RDS7.0\Sample_programs\aisscode.dta drop _merge sort inc_key save D:\data\Stata\RDS7.0\Sample_programs\spinaldata.dta, replace clear **** Import the Age variable *****; insheet using D:\data\RDS\NTDB7.0\RDS_DEMO.csv keep inc_key age gender sort inc_key save D:\data\Stata\RDS7.0\Sample_programs\Demo.dta, replace *** MERGE DATA SETS * * KEEP ONLY RECORDS FROM BOTH DATA SETS merge inc_key using D:\data\Stata\RDS7.0\Sample_programs\spinaldata.dta keep if _merge==3 drop _merge *SUMMARY STATISTICS FOR AGE FOR SPINAL CORD INJURIES tab age tab gender tab age gender sum age