National survey of attitudes and barriers to walking in ... › mediaLibrary › other › ... ·...
54
National survey of attitudes and barriers to walking in Scotland August 2019 Undertaken by 56 Degree Insight for Paths for All
Transcript of National survey of attitudes and barriers to walking in ... › mediaLibrary › other › ... ·...

National survey of attitudes and
barriers to walking in Scotland
August 2019
Undertaken by 56 Degree
Insight for Paths for All

2National survey of attitudes and barriers to walking in Scotland
Contents
Introduction Page 3
Executive summary Page 6
Full results Page 9
• Walking participation Page 9
• Attitudes to walking Page 16
• Increasing participation Page 19
• Active travel Page 25
• Local paths and access Page 31
• Communicating the benefits Page 36
• Segmenting the Scottish population Page 40
• Insights, implications and actions Page 47

Introduction

4National survey of attitudes and barriers to walking in Scotland
Introduction
Everyone…
• How does walking participation vary across the population?
• What motivates different population groups to walk?
• Do the barriers that reduce participation vary across the population?
• How to increase levels of walking participation amongst target groups?
• In general how do behaviours and attitudes vary by demographic and
geography? (age, gender, ethnicity, employment status, car ownership,
household income, SIMD, rurality)
Everyday…
• To what extent is walking included in everyday routines?
⁻ Going to work
⁻ Going to school
⁻ Shopping
⁻ Using public transport
⁻ Visiting friends or family
⁻ Dog walking
• What is the relationship between walking and other modes of transport?
Everywhere…
• What types of place/ environment do the Scottish population walk in?
• How accessible to home are the places that could be walked to
• To what extent is convenience a factor when deciding to walk or drive?
Paths for All work with a number of partner organisations to
deliver the Scottish Government’s National Walking Strategy –
Let’s get Walking. Their vision is for Scotland to become one of
the world’s most walking friendly countries with everyone
benefitting from walking, everyday in welcoming and safe
environments.
Paths for All’s work is central to the delivery of the strategy:
promoting everyday walking through a wide range of activities
from supporting community path and active travel projects to the
promotion of places for recreational walking.
Paths for All commissioned 56 Degree Insight to undertake their
2019 National Survey. The survey has provided an updated
picture of the Scottish adult population’s participation and
attitudes to walking, updating information last collected in 2014
and complementing other sources of information such as the
Scottish Household Survey and Scotland’s People and Nature.
Specifically the study sought to answer the questions listed on the
right.

5National survey of attitudes and barriers to walking in Scotland
The survey fieldwork was undertaken using Kantar’s monthly
online omnibus survey Onlinebus Scotland.
Onlinebus Scotland provides a fast and cost-effective way to
reach the Scottish population. Backed up by Kantar’s quality
assured data collection methods, Onlinebus Scotland focuses
on delivering quick, accurate and affordable insights. Features
include:
• A monthly quick turnaround survey of a representative
sample of 1,000 online Scottish adults aged 16+
• Representative of online adults aged 16+.
• Sample is drawn from Kantar’s panel of c.30,000 adults in
Scotland who have agreed to take part in regular online
surveys in different topics.
• Quota controls are used to obtain a representative sample
distribution.
• The data is weighted to match Scottish population profile
estimates.
• The online approach allows for respondents to provide vox
pop responses, an approach used in this study.
Fieldwork was undertaken from 14th to 21st June 2019 with a
total of 1,001 interviews completed.
Survey method Please note the following points when using the survey results:
• Any trends or variations between results highlighted in the text
are statistically significant unless stated otherwise.
• Responses to all questions are reported as claimed by the
nationally representative sample. However it should be noted
that in some cases respondents may claim to have walked at a
level of frequency which is higher or lower than reality. For
example a social-desirability bias may lead some respondents
to claim higher levels of walking participation than reality or an
effect called telescoping may lead to respondents recalling
walking during the last month when the walk actually took place
longer ago.
• The wording of the questionnaire means that the majority of
survey results focus on walking. However many of the findings
also have wider implications for those people who use a
wheelchair or mobility scooter – for example opinions on the
accessibility of local areas.
• In some places in the report the results have been analysed by
geography, splitting Scotland into 3 areas as follows:
o Northern Scotland (Grampian, Highland, Perth/Tayside,
Western Isles, Orkney, Shetland)
o Central Scotland (Glasgow, Ayrshire, Lanarkshire, Argyll,
Edinburgh & Lothians, Fife, Central)
o Southern Scotland (Borders/Dumfries & Galloway)

Executive summary

7National survey of attitudes and barriers to walking in Scotland
Executive summary
Walking participation
• 55% of Scottish adults walk every day
and 26% walk several times a week.
• The largest proportions walk most
frequently for leisure or exercise (59%
daily or several times a week), to get to
local shops (47% daily or several times
a week) or to reach a public transport
link (32% daily or several times a week).
• During the previous month the vast
majority walked in urban places (87%),
in particular roadside pavements (71%)
while just over half had walked in more
rural places (55%).
• Levels of participation were lower
amongst those aged 55 and over,
people who were not working, and
people with no children. Levels were
also slightly lower amongst residents of
rural areas and residents of the 10%
most deprived areas.
Attitudes to walking
• The majority of Scottish adults either
‘strongly agree’ or ‘tend to agree’ that
they like to walk because of its benefits
to their health, because it helps them to
relax or because it is good for the
environment (78%, 72% and 62%
respectively).
Increasing participation
• Just over 2 in 5 Scottish adults (42%)
think that they walk more often now than
5 years ago. A smaller proportion (24%)
walk less often while the remaining third
walk the same amount.
• Comparing the net change across
different population groups suggests that
frequency of walking increased most
amongst younger age groups (aged 16-
24 and 25-34), people with children and
people who are working.
• 40% of those who were walking more
often said this was due to a change in
personal circumstances, while 37% were
walking more to gain health benefits.
Other motivations related to socialising
(12%), saving money (3%) and
protecting the environment (2%).
• Nearly half of those who walked less
than 5 years ago said this was due to
reasons related to health or old age
(45%).
• A number of factors could encourage
further increases in walking, especially
amongst women. Having someone to
walk with, feeling safer at night and
improved local paths would have most
impact.
8National survey of attitudes and barriers to walking in Scotland
Executive summary
Local paths and walking opportunities
• Attitudes to the condition of paths and
opportunities to walk locally were
extremely varied.
• While 41% of Scots agree that
pavements in their local area are in a
good condition, almost as many (37%)
disagree. Only a quarter feel that the
condition of paths in their local area has
improved in the last 5 years (25%) and
while 35% agree that the number of
services in their local area within walking
distance had decreased, almost as
many (31%) felt that they had increased.
• The majority of Scots (63%) have
recently experienced problems that
forced them to change their walking
route or made them less likely to walk in
the same place in future. The most
common issues were cars parked on
pavements, cyclists on pavements and
poor pavement maintenance.
• If they were moving house, having local
shops & facilities and a regular bus
service within walking distance would be
important to the majority of Scottish
adults (74% and 64% respectively). In
contrast, far fewer stated that
convenience of routes to drive to the
nearest town centre (33%) or to retail
parks (26%) would be important.
Communicating the benefits
• 43% of Scottish adults had recently seen
or heard any advertising or other
communications regarding the benefits
of walking and cycling.
• Recall was highest amongst the
youngest age groups, those with
children at home and people living in
Central Scotland.
• The largest proportions had seen or
heard something regarding the health
benefits of walking or cycling (27%) or
the environmental benefits (22%).
Active travel
• Around two thirds of Scottish adults
would be prepared to walk to their local
shop or public transport (64% and 63%
respectively) but only around half would
walk to their nearest urban green space
(50%) and fewer would walk to their
place of work (44%).
• In the previous month 55% of Scottish
adults had walked to a public transport
link as part of a longer journey. This
proportion was higher amongst those
aged 16-24 (74%), those in the ABC1
social class (59%), those who were
working (59%), residents of urban area
(60%) and Central Scotland (62%).

Walking participation How often, why and where Scots walk

10National survey of attitudes and barriers to walking in Scotland
55%
26%
10%7%
2%
Every day Several times aweek
Once a week Less often Never
Most Scottish adults walk on a regular basis, over half on a daily basis
FIGURE 1 – General frequency of walking for any reason
Overall just over half of Scottish adults normally
take part in walking every day (55%) while a
further 26% walk several times a week.
This total includes walking for any duration, for
any purpose and to any type of place.
Includes:
- Walking for leisure and exercise
- Dog walking
- Visiting family and friends
- Getting to a station or bus/tram stop terminal
- Travel to and from work
- Travel to and from school
- Travel to and from shops
- Visiting local greenspaces
Q001. How frequently, if ever, do you walk for the following purposes?
Q002. How frequently, if ever, do you walk to each of the following places?
NET combing all reasons and types of place (All respondents N=1,001)

11National survey of attitudes and barriers to walking in Scotland
29%
12%
23%
7%
13%
7%
30%
20%
8%
21%
13%
6%
14%
10%
4%
17%
5%
2%
19%
39%
6%
31%
12%
10%
8%
20%
59%
23%
58%
75%
Walking for leisure orexercise
Walking to a railwaystation, bus/tram stop or
other transport…
Walking the dog
Walking to visit family orfriends
Walking to work
Walking children toschool
Every day Several times a week Once a week Less often Never
Scots walk regularly for many reasons but leisure and exercise is the most common motivation
FIGURE 2 – Frequency of walking by reason (ranked by % walking at least
several times a week)
39% of
working
population
walked
several times
a week or
more.
45% of those
with children
walked
several times
a week or
more.
Frequency of walking varied significantly by
reason with the highest proportions walking
most regularly for leisure or exercise.
Participation for other reasons was more varied
between population groups.
39% of those people who work walk there daily
or several times a week (26% of the adult
population overall).
45% of people with children walk them to school
daily or several times a week (13% of the adult
population overall).
Q001. How frequently, if ever, do you walk for the following purposes? (All respondents N=1,001)

12National survey of attitudes and barriers to walking in Scotland
17%
15%
11%
7%
30%
21%
24%
20%
19%
17%
12%
21%
22%
34%
36%
32%
12%
14%
17%
19%
The nearest shop that sells everyday ‘necessities’ like
milk and bread
The nearest park, woodland or other ‘green
space’
The nearest publictransport link, for example,a bus stop or train station
Other clusters of shops andretailers nearby
Every day Several times a week Once a week Less often Never
Local shops are the most common walking ‘destination’
FIGURE 3 – Frequency of walking by destination (ranked by % walking at least
several times a week)Just under half of Scottish adults walk to their
local shop to obtain necessities on several
occasions per week or every day (47%).
Smaller proportions walked this often to other
places including their local parks, public
transport links and other shops.
Q002. How frequently, if ever, do you walk to each of the following places? (All respondents N=1,001)

13National survey of attitudes and barriers to walking in Scotland
Frequency of walking varies by a number of demographics but most significantly by age
FIGURE 4 –Walk every day, for any purpose by demographic group
63%
60%
61%
56%
48%
46%
60%
47%
65%
51%
16-24
25-34
35-44
45-54
55-64
65+
Working
Not working
Children in household
No children in household
51%
54%
53%
59%
Rural
Urban
Bottom 10%IMD
Top 10% IMD
AGE
WORKING STATUS
CHILDREN
PLACE OF
RESIDENCE
Q001. How frequently, if ever, do you walk for the following purposes? - NET result for all purposes (All respondents N=1,001)
While 55% of Scottish adults normally take part
in walking every day, this proportion varies
significantly across different demographic
groups.
Most notably, levels of participation in walking at
this most frequent level were somewhat lower
for those aged 55 or over, people who were not
working and people with no children in their
household.
Also people living in rural areas and in the 10%
most deprived areas were slightly less likely to
walk every day.
INDEX OF MULTIPLE DEPRIVATION

14National survey of attitudes and barriers to walking in Scotland
Reasons for walking also vary significantly by demographic
FIGURE 5 – Walking in the last month amongst all adults and by key
demographics 63% 61%
40%30%
21%12%
To local shopsor services
For leisure orexercise
To visit family orfriends
Dog walking To work Walked childrento school
16-24 64% 64% 57% 40% 32% 9%
25-44 60% 58% 42% 32% 29% 24%
45-64 65% 64% 37% 30% 19% 7%
65+ 61% 57% 29% 23% 3% 5%
Working 62% 64% 41% 33% 32% 14%
Not working 64% 57% 37% 27% 4% 10%
Children 63% 60% 45% 39% 26% 38%
No children 63% 61% 38% 28% 19% 4%
Rural 52% 66% 32% 32% 13% 10%
Urban 67% 61% 41% 29% 22% 12%Q009? Which of the following, if any, have you done in the last month, where walking was the main part of the journey? (Respondents who ever walk N=970)
Reflecting general levels walking for different
purposes and to different types of place, when
respondents were asked about walking
undertaken in the last month, the largest
proportions had walked to get to local shops or
services or taken walks for leisure or exercise.
However, as shown in Figure 5 levels of
participation in walking for different reasons
varied by demographic (significant differences
highlighted in green).
Differences included a higher share of younger
people dog walking or walking to work and
higher levels of walking to local shops and to
visit friends and family amongst residents of
urban areas.
Overall 95% of Scottish adults had walked for
one or more of the purposes asked about during
the previous month, 65% for leisure or exercise
purposes.
By comparison the Scottish Household Survey
recorded that during 2018 some 68% of adults
had walked for at least 30 minutes for recreation
purposes.

15National survey of attitudes and barriers to walking in Scotland
Most walking takes place in urban places such as roadside pavements and parks
FIGURE 6 – Places walked to in the last month
ROADSIDE
PAVEMENTS
71%
URBAN
GREEN
SPACES
53%
PATHS
AWAY FROM
ROADS
44%
WOODLAND
& FORESTS
30%
BEACHES &
COASTLINE
25%
RIVERS &
CANALS
17%
FARMLAND &
FIELDS
14%
MOUNTAINS
&
MOORLAND
8%
OTHER
PLACES IN
TOWNS &
CITIES
19%
PLACES IN TOWNS AND CITIES – 87% OVERALL INCLUDING:
OTHER PLACES
IN COUNTRYSIDE
OR BY THE SEA
11%
PLACES IN COUNTYSIDE AND COAST – 55% OVERALL INCLUDING:
Overall 87% of respondents had walked in one
or more places within towns and cities during
the previous month with the largest proportions
walking on roadside pavements and in urban
greenspaces such as parks or woodland.
A much smaller proportion (55%) had walked in
any rural locations with the highest proportions
walking in woodland and forests or beaches and
the coastline.
Variations in the types of place walked in by
demographic groups included a higher
proportion of people aged 16-24 using urban
green spaces and paths away from roads while
people with children were more likely to visit
rural woodland and forests.
Q009? In which, if any, of the following places have you walked during the past month? (All respondents N=1,001)

Attitudes to walkingHow we feel about walking

17National survey of attitudes and barriers to walking in Scotland
Most Scottish adults enjoy walking because of the health and wellbeing benefits
FIGURE 7 – Attitudes to walking
20%
23%
29%
28%
35%
42%
12%
28%
29%
34%
37%
36%
12%
23%
26%
23%
17%
13%
55%
24%
16%
13%
10%
7%
I walk because I don’t have access to a car
Where possible, I prefer to walkbecause it is more convenient than
taking the car
Where possible, I prefer to walkbecause it is more affordable
Where possible, I prefer to walkbecause it is good for the
environment
I enjoy walking because it helps merelax
I enjoy walking because it is goodfor my health
Strongly agree Tend to agree
Neither agree nor disagree Tend to or strongly disagree
Q012. To what extent do you agree or disagree with each of the following statements about walking? (All respondents
N=1,001)
Respondents were shown a series of
statements and asked to what extent they
agreed or disagreed with each.
Levels of agreement were strongest for the
statements related to the health and wellbeing
benefits of walking, closely followed by the
environmental benefits and saving money by
walking.

18National survey of attitudes and barriers to walking in Scotland
“It’s good for
my health”
78%
“It helps me
relax”
72%
“It’s good for
the
environment”
62%
“It’s more
affordable”
58%
“It’s more
convenient”
51%
Stronger
agreement
amongst:
• Increased
walking in last 5
years (92%)
• Live in least
deprived 10% of
SIMD (88%)
• Working (82%)
• Increased
walking in last 5
years (87%)
• Live in least
deprived 10% of
SIMD (79%)
• Working (77%)
• Increased
walking in last 5
years (77%)
• Live in least
deprived 10% of
SIMD (73%)
• Aged 16-24
(70%)
• Working (67%)
• ABC1 socio-
economic group
(66%)
• Increased
walking in last 5
years (67%)
• Live in least
deprived 10% of
SIMD (66%)
• Aged 16-24
(57%)
• No car access
(56%)
• Working (55%)
• Aged 16-24
(76%)
• Increased
walking in last 5
years (71%)
• No car access
(69%)
• Live in least
deprived 10% of
SIMD (67%)
• Live in urban
area (59%)
Q012. To what extent do you agree or disagree with each of the following statements about walking? (All respondents
N=1,001)
FIGURE 8 – Attitudes to walking – strongly agree or tend to agreeAttitudes to walking varied across the
population with higher levels of agreement
with the statements amongst certain
population groups.
Notably, people who walked more
frequently than 5 years ago were much
more likely to agree with all of the
statements, suggesting that these positive
attitudes may have motivated increased
participation. People living in the least
deprived areas and people who were
working were also more likely to agree with
all of the statements.
Comparing levels of agreement by age, it is
notable that younger people (16-24) were
more likely to agree with the benefits of
walking in terms of the environment,
affordability and convenience.
Recognising the benefits of walking and increasing participation are closely related

Increasing participationEmerging trends and opportunity for growth
20National survey of attitudes and barriers to walking in Scotland
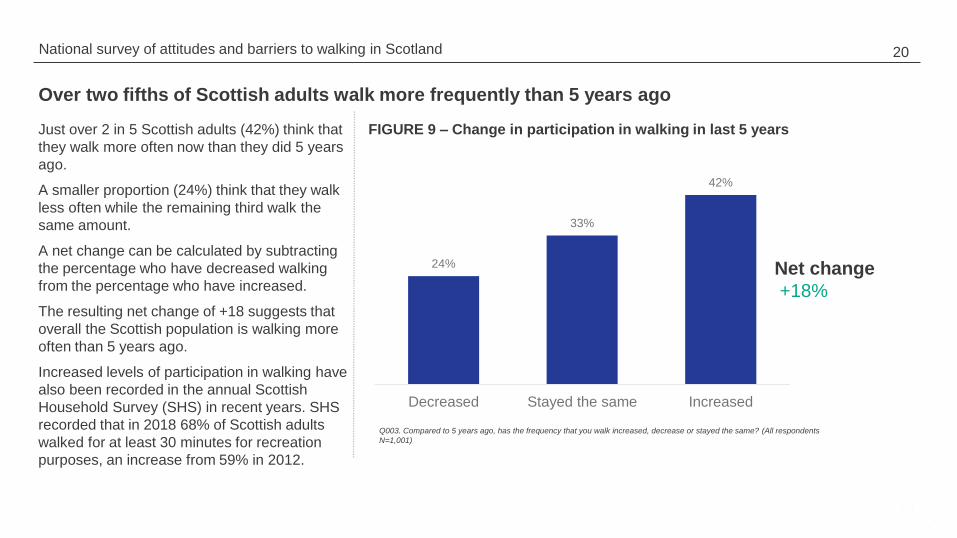
Over two fifths of Scottish adults walk more frequently than 5 years ago
24%
33%
42%
Decreased Stayed the same Increased
Net change
+18%
FIGURE 9 – Change in participation in walking in last 5 years
Q003. Compared to 5 years ago, has the frequency that you walk increased, decrease or stayed the same? (All respondents
N=1,001)
Just over 2 in 5 Scottish adults (42%) think that
they walk more often now than they did 5 years
ago.
A smaller proportion (24%) think that they walk
less often while the remaining third walk the
same amount.
A net change can be calculated by subtracting
the percentage who have decreased walking
from the percentage who have increased.
The resulting net change of +18 suggests that
overall the Scottish population is walking more
often than 5 years ago.
Increased levels of participation in walking have
also been recorded in the annual Scottish
Household Survey (SHS) in recent years. SHS
recorded that in 2018 68% of Scottish adults
walked for at least 30 minutes for recreation
purposes, an increase from 59% in 2012.

21National survey of attitudes and barriers to walking in Scotland
Younger age groups and people with children were most likely to report increasing their participation levels
-3% 0%
5%
12%14% 14% 14% 15% 15% 16% 17% 18% 18% 18% 19% 20% 21%
23% 23%
28% 29%
35%38%Above average
net increaseBelow average
net increase
Comparing the net change across different
population groups suggests that frequency of
walking increased most amongst younger age
groups (aged 16-24 and 25-34), people with
children at home and those who were working.
In contrast, the 65+ age group reported a net
decrease in walking frequency over the last 5
years.
FIGURE 10 – Net change in participation in walking in last 5 years by demographic
Q003. Compared to 5 years ago, has the frequency that you walk increased, decrease or stayed the same? (All respondents
N=1,001)
Average
net increase

22National survey of attitudes and barriers to walking in Scotland
A change in personal circumstance or desire to get healthier was the most common reason for walking more often
Health &
exercise
37%
Social &
enjoyment
12%
Saving
money
3%
Better for the
environment
2%
A change in
circumstances
40%
15%
8%
6%
5%
5%
3%
1%
1%
Got/have a dog
More time
Less car access
Retired
Moved house
Changed job
New commute
Walk more atwork
13%
11%
10%
5%
5%
3%
2%
1%
Trying to bemore active
Trying to bemore healthy
Trying to get fit
Trying to loseweight
More aware ofhealth benefits
Have healthissues
Got a fitnesstracker
To reduce stress
6%
4%
2%
1%
I enjoy walking
To be active withchildren
To be withfriends
Getting fresh air
2%
1%
Cheaper
Less thanpublic
transport
FIGURE 11 – Reasons for walking more often than 5 years ago
(unprompted responses)
'Q004. You stated that the amount you walk has changed in the last 5 years - Why do you think this is? (Respondent taking more
visits N=374)
Those respondents who stated that they walked
more often than 5 years ago were asked to say
why this was the case.
Overall 40% indicated that their increased
frequency of walking was related to a change of
personal circumstances with the most frequently
provided responses relating to getting a dog,
having more time or reduced access to a car.
37% stated that they were walking more often
due to a reason related to health and exercise
with responses ranging from those who were
trying to be more active and healthy to those
who were seeking to reduce stress.
Other motivations were mentioned less often
but included spending time with family and
friends and enjoyment. A very small proportion
referenced environmental concerns as a factor
in their increased walking levels (2%).

23National survey of attitudes and barriers to walking in Scotland
Almost half of those decreasing walking frequency reported health related issues
Health or
age issues
45%
19%
14%
7%
7%
3%
3%
Issues withmy health
Disability
Arthritis
Old age
Issues withfamily health
Have lessenergy
Change in
circumstances
27%
13%
7%
5%
4%
2%
I have a car now
Moved house
Changed job
No longer havedog
Lost job
Other
reasons
3%
2%
2%
2%
Use publictransport more
Become lazy
Generally lessactive
Too busy
FIGURE 12 – Reasons for walking less often than 5 years ago (unprompted
responses)
'Q004. You stated that the amount you walk has changed in the last 5 years - Why do you think this is? (Respondent taking fewer
visits N=222
Respondents who walked less than 5 years ago
were also asked to say why this was the case.
Nearly half mentioned reasons related to health
or old age (45%) including personal health
issues and those of a family member.
Around a quarter (27%) of those walking less
often stated that this was due to a change in
personal circumstances such as getting a car,
moving house or changing job.

24National survey of attitudes and barriers to walking in Scotland
A range of factors would encourage increased participation especially amongst women
35%
28%
27%
25%
23%
20%
19%
18%
17%
16%
14%
12%
23%
Having someone to walk with
Feeling safer when walking at night
Having better paths in my local area
More public toilets
Having better lighting on paths in my localarea
Having shops and facilities closer to whereI live
More seating along paths in my local area
Having more information about placeswhere I could walk
Having less traffic in my local area
Having more safe places to cross the roadin my local area
Having more signposted paths in my localarea
Limiting vehicle speeds to 20 mph in mylocal area
None of the above/ don't know
Men Women
28% 41%
21% 35%
25% 29%
22% 29%
19% 27%
18% 21%
17% 19%
17% 18%
12% 20%
13% 16%
13% 12%
25% 20%
Q013. Which of the following, if any, would encourage you to walk more often? (All respondents N=1,001)
FIGURE 13 – What would encourage increased walking participationLooking to the future, respondents were shown
a list of options and asked which, if any, would
encourage them to walk more often.
Overall 77% selected one or more of the options
provided, with women and people aged 16 to 34
the most likely to do so.
The most frequently selected answers were
having someone else to walk with and feeling
safer when walking at night. Both of these
responses were selected by a significantly
higher proportion of women than men.

Active travelHow we walk on journeys to shops, services, work and study

26National survey of attitudes and barriers to walking in Scotland
Most Scots would not walk for more than 20 minutes to reach shops, schools and other local services
55%
57%
45%
35%
27%
30%
28%
21%
30%
25%
34%
32%
40%
37%
33%
25%
9%
10%
15%
20%
20%
20%
23%
25%
6%
8%
6%
12%
12%
13%
16%
29%
The nearest shop that sells everyday ‘necessities’
The nearest public transport link
The nearest primary school
The nearest park, woodland or other ‘green space’
Other clusters of shops
The nearest GP surgery
The nearest secondary school
The place where you work
Less than 10 minutes 11-20 minutes 21 minutes to half an hour More than half an hour Average
minutes:
11
11
12
17
18
18
20
28
Q010. Personally, how long would you be prepared to walk for to get to each of the following places? (All respondents excluding Don’t
Know/Not applicable responses)
FIGURE 14 – Durations would be prepared to walkRespondents were asked how long they
would be prepared to walk for to reach a
number of different types of place.
Figure 14 illustrates the responses
provided, excluding those respondents who
provided an answer of ‘don’t know’ or ‘not
applicable’ (for example if they did not have
a workplace or child at school). The chart
also includes an average duration based on
the mid points of each of the answer
options provided.
With the exception of workplaces, the
majority of Scots would not be prepared to
walk for more than 20 minutes to reach any
of the places asked about.
The shortest durations would be walked to
reach shops that sell necessities and public
transport links.

27National survey of attitudes and barriers to walking in Scotland
67%
62%
53%
52%
30%
28%
22%
18%
18%
24%
28%
25%
33%
29%
28%
15%
7%
6%
9%
13%
20%
19%
20%
13%
8%
8%
10%
10%
17%
24%
31%
54%
The nearest public transport link
The nearest shop that sells everyday ‘necessities’
The nearest primary school
The nearest park, woodland or other ‘green space’
Other clusters of shops
The nearest GP surgery
The nearest secondary school
The place where you work
Less than 10 minutes 11-20 minutes
21 minutes to half an hour More than half an hour
Average minutes:
13
13
15
16
23
26
31
48
On average the time to walk to local services is longer than
the time people are prepared to walk for
It would
take:
11
11
12
17
18
18
20
28
Prepared
to walk
Respondents were asked how long it would
actually take for them to walk to the same places
in their local area.
Figure 15 illustrates the responses provided,
excluding respondents who provided a response
of ‘don’t know’ or ‘not applicable’ The chart also
shows the average number of minutes it would
take to walk and, for comparison, the average
number of visits they would be prepared to walk
for (see Figure 14).
The largest gap between the time people would
be prepared to walk and the time it would take
was recorded for secondary schools and
workplaces.
The Scottish Household Survey also asked
respondents to indicate how long it would take to
walk to their nearest greenspace. In the SHS in
2018 65% of adults reported living within a 5
minute walk while a further 21% lived within 6 to
10 minutes. These figures are somewhat higher
than recorded in this study, potentially due to the
longer list of types of place used in the definition
of greenspace offered to respondents (parks, play
areas, canal paths, riversides and beaches).
Q011. Roughly how long would it actually take you to walk from home to each of the following places? (All respondents excluding Don’t
Know/Not applicable responses)
FIGURE 15 – Duration it would actually take to walk

28National survey of attitudes and barriers to walking in Scotland
Shops and public transport links are the places most likely to be within reach of walking
64%
63%
58%
54%
53%
51%
50%
44%
Shop that sells neccessities
Public transport link
Primary school
GP surgery
Clusters of shops
Secondary school
Urban green space
Place where you work
Q011. Roughly how long would it actually take you to walk from home to each of the following places? (All respondents excluding Don’t
Know/Not applicable responses)
FIGURE 16 – Proportion of population prepared to walk to reach their local
services
Q010. Personally, how long would you be prepared to walk for to get to each of the following places? (All respondents excluding Don’t
Know/Not applicable responses)
Figure 16 illustrates the proportion of the
population who indicated that they would be
prepared to walk the duration required to reach
each of the services asked about.
While almost two thirds would be prepared to
walk to their local shops that sell necessities or
to public transport links (64% and 63%), only
half would be prepared to walk for the time
required to get to their nearest green space
while significantly fewer would be prepared to
walk to work.

29National survey of attitudes and barriers to walking in Scotland
Just over half of Scottish adults walk to public transport links
55% of Scots had walked to a railway station, bus/tram stop or other public transport terminal as part of a longer journey.
74%
61%
57%
45%
53%
47%
59%
51%
59%
49%
56%
55%
16-24
25-34
35-44
45-54
55-64
65+
ABC1
C2DE
Working
Not working
Children in household
No children in…
70%
47%
35%
60%
39%
62%
32%
57%
62%
No car access
Car access
Rural
Urban
North
Central
South
Bottom 10%IMD
Top 10% IMD
AGE
WORKING STATUS
CHILDREN
CAR ACCESS
PLACE OF RESIDENCE
INDEX OF MULTIPLE DEPRIVATION
Just over half of Scottish adults had
walked to a railway station, bus stop or
other public transport terminal in the
month prior to the survey.
However, as illustrated below, this
proportion was higher amongst younger
people, those in the ABC1 social class,
those who were working and residents of
urban areas, particularly in Central
Scotland.
FIGURE 17 – Proportion of population who walked to a public transport link in
last month in total and by demographic
SOCIAL CLASS
Q006. And during the last month, have you walked to a railway station, bus/tram stop or other transport terminal as part of a longer journey? (All respondents N=1,001)

30National survey of attitudes and barriers to walking in Scotland
47%44%
14% 12% 11%
5% 5% 4% 4%
Scheduledbus
service
Train Other bus/coach
Taxi Private car(own)
Private car (someone
else’s)
Tram Ferry Plane
Mixed mode journeys
An average of 1.8 stages per journey
FIGURE 18 – Modes used on last journey which involved walking to a public
transport link
Q007. Thinking of the last occasion you did this, which of the following modes of transport did you use on this journey? (Respondents who walked to public
transport
Q008. How many stages did this journey include in total? N=552)
Figure 18 illustrates the transport modes used
by those Scots who had walked to a public
transport link (based on most recent journey).
The highest proportions had travelled on a
scheduled bus service or by train on their
most recent journey.
On average journeys involved 1.8 stages
(e.g. different modes or bus routes requiring
changes).

Local paths and accessExperiences and expectations for walking in local areas

32National survey of attitudes and barriers to walking in Scotland
Scots have a wide range of opinions on their local paths and opportunities to walk to local services
FIGURE 19 – Levels of agreement with attitude statement relating to
walking in local area
22%
19%
31%
13%
6%
10%
19%
20%
24%
12%
8%
13%Pavements in my local area are in good
condition and well managed:
The number of local services in my area within
walking distance has decreased in the last 5 years:
The condition of paths and other places for
walking in my local area has improved in the last
5 years:
Strongly agreeTend to agreeTend to disagreeStrongly disagree
Q016. The next few questions are related to your local area, by this we mean the town or village you live in, your city neighbourhood, etc. To what extent do
you agree or disagree with each of the following statements about walking in your local area?(All respondents N=1,001)
Respondents were presented with a series
of attitude statements and asked to rate to
what extent they agreed or disagreed with
each.
As shown in Figure 19, each of the
statements received a wide range of
responses.
While 41% agreed that pavements in their
local area were in a good condition, almost
as many (37%) disagreed.
Only a quarter felt that the condition of
paths in their local area had improved in the
last 5 years (25%) slightly less than the
proportion who disagreed with this
statement (28%).
Similarly, while 35% agreed that the
number of services in their local area within
walking distance had decreased, almost as
many (31%) disagreed with this statement.
Note: proportions neither agreeing or disagreeing not shown.

33National survey of attitudes and barriers to walking in Scotland
Concerns over the condition of paths and pavements increase with age
FIGURE 20 – Agreement with statements (‘strong’ or ‘tend to’) by age,
children at home and place of residence
63%
53%
39%
28%
38%33%36% 33%
29%21% 20% 23%
16-24 25-34 35-44 45-54 55-64 65+
Pavements in my local area are in good condition and well managed
The condition of paths and other places for walking in my local area has improved in the last 5 years:
47%39% 40% 42%
36%
23% 24% 27%
Children No children Urban Rural
Levels of agreement with the statements varied
across different population groups.
As illustrated in Figure 20, attitudes toward the
condition of local paths and pavements and the
extent to which these had improved tended to
be highest amongst younger age groups but
declined with age.
Potentially related to these age variations,
people with children living at home were also
more likely to have positive attitudes. However
there were no significant differences in the
responses from people living in urban and rural
locations.
Q016. The next few questions are related to your local area, by this we mean the town or village you live in, your city neighbourhood, etc. To what extent do
you agree or disagree with each of the following statements about walking in your local area?(All respondents N=1,001)

34National survey of attitudes and barriers to walking in Scotland
Respondents were shown a list of potential issues and asked if
they encountered any of these recently while walking locally and
whether these issues had caused them to change their route or
not walk in this place again.
The majority (85%) reported experiencing one or more of the
issues and almost two thirds (63%) had been forced to change
where they walked.
Possibly reflecting the high frequency of walking in urban areas,
the most common issues related to experiences on roadside
pavements including cars parked on pavements, cyclists on
pavements and poor pavement maintenance.
A similar question regarding difficulties encountered on visits is
included in the 2017-18 Scotland’s People and Nature Survey
(SPANS) undertaken by SNH. This survey relates to outdoor
recreation visits taken in green spaces such as parks,
countryside or coast.
SPANS found that on these types of visit less than a third of
visitors experienced any difficulties (31%) with very small
proportions facing issues such as annoying dogs (3%),
unwelcoming signs (2%) or man made obstructions (2%).
48%
40%
38%
30%
27%
24%
18%
13%
7%
4%
20%
13%
19%
15%
12%
10%
7%
8%
3%
2%
Cars parked on pavements
Cyclists on the pavement
Poorly maintained pavements
Roads that are difficult to cross
High levels of traffic, including noise andpollution
Overgrown path
Waiting too long at pedestrian crossings
An aggressive or intimidating animal
A restrictive sign - for example 'Private'
A locked gate across path\route
Experienced
Forced to changewhere walked
Cars parked on pavements are the most common issue encountered by people when walking
FIGURE 21 – Issues encountered when walking in local area
Q017. While walking in your local area recently which, if any, of the following have you experienced?
Q018. And which of these, if any, caused you to change where you walked (e.g. take a different route) or make you less likely to
walk in this place again?
(All respondents N=1,001)
35National survey of attitudes and barriers to walking in Scotland
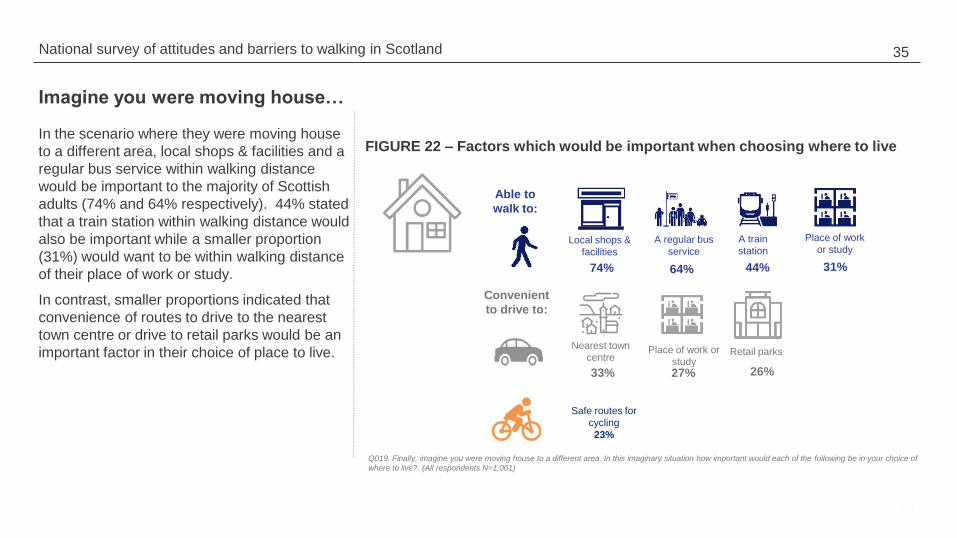
Imagine you were moving house…
Local shops &
facilities
A regular bus
service
A train
station
Place of work
or study
Able to
walk to:
74% 64% 44% 31%
Convenient
to drive to:
Nearest town
centrePlace of work or
studyRetail parks
27% 26%33%
Safe routes for
cycling
23%
Q019. Finally, imagine you were moving house to a different area. In this imaginary situation how important would each of the following be in your choice of
where to live?. (All respondents N=1,001)
In the scenario where they were moving house
to a different area, local shops & facilities and a
regular bus service within walking distance
would be important to the majority of Scottish
adults (74% and 64% respectively). 44% stated
that a train station within walking distance would
also be important while a smaller proportion
(31%) would want to be within walking distance
of their place of work or study.
In contrast, smaller proportions indicated that
convenience of routes to drive to the nearest
town centre or drive to retail parks would be an
important factor in their choice of place to live.
FIGURE 22 – Factors which would be important when choosing where to live

Communicating the benefitsHow to optimise marketing efforts

37National survey of attitudes and barriers to walking in Scotland
31%35%35%
39%39%40%40%40%42%42%43%43%44%45%45%45%45%
51%51%
62%
Live in South of Scotland45-54
65+55-64
No access to a carNot working
No children in householdLive in North of Scotland
FemaleC2DE socio economic group
TOTAL POPULATIONAged 35-44
ABC1 socio economic groupMale
WorkingLive in Central Scotland
Access to a carAged 25-34
Children in householdAged 16-24
The health benefits of
walking or cycling
27%
The environmental benefits
of walking or cycling
22%
Opportunities to get more
active walking or cycling at
or to work
13%
New or improved paths in
your local area
8%
New options for travelling
to work by public
transport
8%
Communications promoting the benefits of walking reached around two fifths of Scottish adults
FIGURE 23 – Recall of advertising, news or other communications regarding
walking or cycling or paths and routes by demographic group
Q014. In the last few months, have you seen or heard any advertisements, news, discussions or other commentary regarding the following topics?(All
respondents N=1,001)
Overall 43% of Scottish adults stated that
they had seen or heard any advertising,
news, discussion or other commentary
regarding the walking and cycling related
topics shown in the right.
Highest levels of recall were reported by the
youngest age groups, those with children at
home and people living in Central Scotland.
The largest proportions had seen or heard
something regarding the health benefits of
walking or cycling (27%) or the
environmental benefits (22%).

38National survey of attitudes and barriers to walking in Scotland
Frequent walkers were the most likely to have noticed adverts and other communications
49%
44%
32%
15%
54%
37%
Walk everyday
Walk severaltimes a week
Walk once aweek
Walk lessoften or never
Increasedwalking
Decreasedwalking
Frequency of walking Changed frequency
in last 5 years
FIGURE 24 – Recall of advertising, news or other communications regarding
walking or cycling or paths and routes by frequency of walking
While 43% of all Scottish adults had seen or
heard any advertising, news, discussion or
other commentary regarding walking and
cycling, this proportion was significantly higher
amongst those who walked most often and
amongst those who had increased their walking
frequency in the last 5 years.
This correlation could be explained by a number
of factors including those demographic groups
who walk (or cycle) most often having a greater
responsiveness to communications on this
topic.
Q014. In the last few months, have you seen or heard any advertisements, news, discussions or other commentary regarding the following topics?(All
respondents N=1,001)

39National survey of attitudes and barriers to walking in Scotland
A mix of communication channels reaches audiences in every age group
33%
23%
17%
16%
15%
14%
14%
12%
10%
9%
8%
7%
6%
TV advertising
TV programmes/ news
On Facebook
From friends/ relatives/ colleagues
Article on the internet
Newspaper/ magazine articles
Radio advertising
Newspaper/ magazine advertising
Billboards/ outdoor posters
Advertising on the internet
Radio programmes/ news
On Twitter
Leaflets
16-24 25-44 45-64 65+
27% 35% 37% 26%
9% 23% 28% 29%
25% 19% 17% 6%
15% 10% 18% 23%
17% 12% 18% 13%
11% 8% 17% 24%
14% 22% 11% 3%
11% 8% 17% 24%
21% 11% 6% 3%
22% 11% 4% 1%
9% 9% 7% 10%
9% 6% 9% 1%
3% 7% 7% 7%
'Q015. Where did you see this? (All respondents aware of advertising/communications (N=429)
Respondents were asked to specify where they
had seen the advertising or other
communications regarding walking and cycling.
Overall the most frequently mentioned channels
were television adverts and programmes.
However responses varied somewhat by age
group:
• 16-24 - more likely to notice communications
on Facebook, outdoor advertising or the
internet.
• 25-44 – more likely to recall radio advertising.
• 45-64 – the most likely to recall TV
advertising
• 65 and over – the most likely to recall TV
programmes, press advertising or to gave
had a conversation with friends relatives.
FIGURE 25 – Where saw or heard communications

Segmenting the Scottish population by walking participation and attitudes

41National survey of attitudes and barriers to walking in Scotland
A segmentation based on walking behaviours and attitudes
Budding
enthusiasts
Needs
must
Looking to
change
Reluctant
rejectors
Age and health
restricted
24% of
population
15% of
population26% of
population
11% of
population
23% of
population
Very regular and enthusiastic,
conscious of benefits of walking
and increasing participation for
these reasons – especially
health. Walk in many places
including town, countryside and
coast.
Would like to be able to walk
more and supportive of
improvements which make it
easier and safer.
Found across a range of
demographics but more likely
than norm to be under 65, fairly
affluent, older families living in
urban areas.
Walk regularly especially to
reach work or study, for
shopping and dog walking. Most
often on roadside pavements
and to public transport. Not
particularly positive towards the
health, & environmental benefits
of walking but most aware of
communications.
Would like to be able to more
easily walk to the local places
they need to reach.
Often younger (GenZ or
Millennials), pre family or with
young kids, living in urban areas.
Walk fairly routinely, for leisure
or shopping but positive attitudes
suggest a demand to do more
especially for health benefits. A
larger than norm share have not
changed participation in last 5
years.
Would like to be able to walk to
local shops and services. Would
like someone to walk with, better
signage and to feel safer.
Found across a range of
demographics but have the
highest level of car ownership of
all the segments
Unlikely to walk regularly, only
doing so if they have to. Hold the
most negative attitudes to the
potential benefits of walking.
Nothing would encourage many
in this group to walk more while
many would like to see more
convenient car access to retail
parks. Half decreased walking in
last 5 years. Unlikely to have
seen communications.
More likely to be found amongst
older (55+, baby boomer) age
groups and lower socio
economic groups and IMD.
The least likely to walk regularly,
often limited by health and age
related issues. Attitudes to
walking suggest a lack of
interest/relevance.
Some might walk to a local shop
for necessities but they would
prefer to be able to drive in town.
Limited use of public transport.
The least likely to have changed
walking frequency in last 5 years
and unlikely to have seen any
communications.
Largely older, retired people.

42National survey of attitudes and barriers to walking in Scotland
Budding Enthusiasts
Total population
Budding enthusiasts
24% of Scottish
population
Participation in walking (last month) Attitudes to walking
Members of this segment are very regular walkers for a wide range of reasons and enthusiastic participants. They are
conscious and motivated by the benefits of walking especially health. They walk in many places including town,
countryside and coast.
Whilst they walk regularly members of this group would like to be able to walk more often and they support improvements
which would make it easier and safer.
This segment is found across a range of demographics but more likely than norm to be aged under 65, fairly affluent,
older families living and living in urban areas.
Potential opportunities: Given this group’s enthusiasm, their support for walking and its benefits could be used to spread
positive word of mouth (traditional and online) to encourage others to walk more. They may also be open to volunteering
to support local walking initiatives (e.g. to become Paths for All walk leaders).
Change in walking
participation in last 5 years
Most likely to be found
amongst…78%
77%
76%
57%
33%
36%
20%
63%
61%
55%
40%
30%
21%
12%
Walked to local shops orservices
Walked for leisure orexercise
Walked to public transporthub
Walked to visit family orfriends
Walked the dog
Walked to work
Walked children to school
BuddingEnthusiasts
Total population
Budding Enthusiasts
Total population
Tend to agree Strongly agreeEnjoy as good for
health100%
78%
Prefer as good for environment
Budding Enthusiasts
Total population
Prefer as more convenient than car
95%
62%
85%
58%
7%
24%
69%
24%
33%
42%
Decreased Stayed thesame
Increased
Budding Enthusiasts Total population • Aged under 65
• Working
• Fairly affluent
• Older families
• Residents of urban areas
• Do not drive a car

43National survey of attitudes and barriers to walking in Scotland
Needs must
Total population
Needs must
15% of Scottish
population
Attitudes to walking
Members of this segment walk on a regular basis and are more likely than the population average to walk to reach
public transport, visit friends or family or get to work. The main place they walk on is roadside pavements.
Despite high levels of participation, this group’s attitudes to walking are less positive than the population average with
relatively small proportions strongly agreeing with the statements regarding the health and environmental benefits of
walking.
However during the last 5 years most of this group have increased their walking and many would like it to be easier to
be able to walk to local places like shops. They are the most likely to have seen or heard any communications
promoting walking.
This segment tends to be younger, pre family or with young kids and living and working in urban areas. A large
proportion do not drive a car.
Potential opportunities: Compared to the average, members of this segment walk more due to necessity than
preference. Actions could focus on making walking a longer term habit (e.g. into later life or if a car is acquired) by
raising appreciation of the benefits and improving the experience so that it becomes a preferred choice over the car.
Change in walking
participation in last 5 yearsMost likely to be found
amongst…61%
62%
72%
55%
36%
36%
20%
63%
61%
55%
40%
30%
21%
12%
Walked to local shops orservices
Walked for leisure orexercise
Walked to public transporthub
Walked to visit family orfriends
Walked the dog
Walked to work
Walked children to school
Needs must
Total population
Needs must
Total population
Tend to agree Strongly agreeEnjoy as good for health
72%
78%
Prefer as good for environment
Needs must
Total population
Prefer as more convenient than car
52%
62%
47%
58%
11%
24%
63%
24%
33%
42%
Decreased Stayed thesame
Increased
Needs must Total population• Gen Z and Millennials (aged 16 to 24 or 25 to
34)
• Working
• Pre children or young families
• Residents of urban areas
• Men
• Do not drive a car
Participation in walking (last month)

44National survey of attitudes and barriers to walking in Scotland
Looking to change
Total population
Looking to change
26% of Scottish
population
Attitudes to walking
While members of this group walk fairly routinely, especially for leisure or shopping, the frequency that they take part
is not as high as the Budding Enthusiast or Needs Must segments. Also a larger than average share of this group
have not changed their levels of walking participation in the last 5 years.
However the positive attitudes to walking amongst this groups, especially in relation to health benefits and preferring
to walk than drive are notable and suggest that many in this group would like to walk more if they could.
Furthermore although this segment has the highest levels of car access, they are also the group most likely to state
that they would walk more often if they had someone to walk with, better signage and felt safer.
This segment is present across a range of demographics but are marginally more likely to be found amongst people
who are working, more affluent socio economic groups, women and residents of urban areas.
Potential opportunities: This group could be targeted with initiatives which communicate how they can change
their behaviour by making more frequent journeys on foot and fewer by car. This could include raising awareness of
local path networks and public transport options and emphasising health benefits of walking over of driving.
Change in walking
participation in last 5 years
Most likely to be found
amongst…69%
77%
56%
39%
31%
17%
10%
63%
61%
55%
40%
30%
21%
12%
Walked to local shops orservices
Walked for leisure orexercise
Walked to public transporthub
Walked to visit family orfriends
Walked the dog
Walked to work
Walked children to school
Needs must
Total population
Looking to change
Total population
Tend to agree Strongly agreeEnjoy as good for health
100%
78%
Looking to change
Total population
Prefer as good for environment
Prefer as more convenient than car
85%
62%
66%
58%
17%
36%
46%
24%
33%
42%
Decreased Stayed thesame
Increased
Looking to change Total population • People who drive a car
• Working
• More affluent social classes
• Women
• Residents of urban areas
Participation in walking (last month)

45National survey of attitudes and barriers to walking in Scotland
Reluctant rejectors
11% of Scottish
population
Attitudes to walking
This segment are unlikely to walk regularly for either leisure or other purposes such as getting to shops, work or to
visit family or friends. They also have the most negative attitudes to walking of all of the segments especially in
relation to the potential environmental benefits or the convenience of walking over driving.
Around half have decreased their frequency of walking in the last 5 years. Nothing would encourage many in this
group to walk more often while a larger than average proportion would like to see more convenient car access to retail
parks. This group are also the least likely to have seen or heard any marketing regarding walking.
Members of this segment are more likely to be found amongst older age groups (55+, baby boomers), members of the
lower socio economic groups and residents of rural areas. Car ownership levels are around average for this segment.
Potential opportunities: Given their negative views towards the benefits of walking and potential to walk more,
increasing levels of participation could be harder amongst this group than others. However potential still exists, such
as raising awareness of community path networks and opportunities to walk to local facilities and the health benefits
this could bring for this slightly older group.
Change in walking
participation in last 5 yearsMost likely to be found
amongst…46%
40%
28%
23%
25%
7%
6%
63%
61%
55%
40%
30%
21%
12%
Walked to local shops orservices
Walked for leisure orexercise
Walked to public transporthub
Walked to visit family orfriends
Walked the dog
Walked to work
Walked children to school
Reluctantrejectors
Total population
Reluctant rejectors
Total population
Tend to agree Strongly agreeEnjoy as good for health
61%
78%
Reluctant rejectors
Total population
Prefer as good for environment
Reluctant rejectors
Total population
Prefer as more convenient than car
33%
62%
29%
58%
51%
31%
15%
24%
33%
42%
Decreased Stayed thesame
Increased
Reluctant rejectors Total population • Baby boomer generation (in 50s and 60s)
• People who are not working
• People with no children at home
• Less affluent social classes
• Residents of rural areas.
Participation in walking (last month)

46National survey of attitudes and barriers to walking in Scotland
Age and health restricted
23% of Scottish
population
Attitudes to walking
Members of this segment are the least likely to walk regularly, often limited by health and age related issues while
their attitudes to walking suggest a lack of interest/relevance.
While members of this segment might walk to a local shop for necessities they would generally prefer to be able to
live somewhere where it is convenient to drive to town. This group also makes fairly limited use of public transport
compared to other segments.
During the last 5 years members of this segment were the least likely to have changed walking frequency suggesting
that many have longer term health issues impacting on their ability to walk frequently. Most of the rest of the group
are walking less than before.
Members of this segment are more likely to be found amongst the oldest age groups.
Potential opportunities: While members of this segment walk infrequently and are likely to be walking less than
previously, support could help them to gain confidence to be able to take part in organised health walks and other
‘gentle’ walking which could provide health and social benefits.
Change in walking
participation in last 5 yearsMost likely to be found
amongst…48%
34%
36%
17%
25%
5%
4%
63%
61%
55%
40%
30%
21%
12%
Walked to local shops orservices
Walked for leisure orexercise
Walked to public transporthub
Walked to visit family orfriends
Walked the dog
Walked to work
Walked children to school
Age & healthrestricted
Total population
Age & health restricted
Total population
Tend to agree Strongly agreeEnjoy as good for health
47%
78%
Age & health restricted
Total population
Prefer as good for environment
Age & health restricted
Total population
Prefer as more convenient than car
25%
62%
15%
58%
44% 44%
11%
24%
33%
42%
Decreased Stayed thesame
Increased
Age and health restricted
Total population• Oldest age groups
• People who are not working (including
retired)
• People with no children at home
Participation in walking (last month)

Insights, implications
and actions

48National survey of attitudes and barriers to walking in Scotland
Insights, implications and actions
Insight Implications and actions
Most Scot walk on a regular basis for a variety of reasons. However levels of
participation and reasons for walking vary across the population and tend to
be lower amongst older people, residents of rural areas, people who can drive
and residents of the most deprived areas. The population segmentation
included in this report provides a possible new perspective to add
understanding to these variations and how to target messages that reflect
attitudes as well as behaviours.
Initiatives which aim to increase walking need to be targeted appropriately taking account of both
demographics and attitudes. For example, this could involve more focused communications to the
least active groups who feel unable to walk to highlight opportunities to join organised health walks.
However those people who would like to walk more yet don’t due to their habit of ‘jumping in the
car’ could benefit from more information on their local path and public transport options allowing
them to see how active travel is a viable and simple alternative.
Most Scots have a positive view towards walking, in particular the health and
wellbeing benefits it can bring. However appreciation of the environmental
benefits is lower and appears to be an ‘after thought’ or secondary benefit
when people are choosing whether to walk.
With increasing levels of concern for the environment, rising coverage of the climate change crisis
and changing government policy to make Scotland carbon neutral, there is an opportunity to make
Scots more aware of the environmental benefits of walking. The focus of communications could be
made more relevant and personal by combining messaging about global benefits with local benefits
(e.g. air quality, noise, safety and wildlife in their local area).
With two in five Scots claiming that they walk more often than 5 years ago,
overall levels of walking in Scotland are increasing. The Sottish Household
Survey shows a corresponding upward trend in recreational walking over the
last 10 years. The upward trend is strongest amongst younger age groups,
men and more affluent social classes. Seeking health benefits is one of the
biggest drivers.
While the increase in good news it has some implications. The greatest increases tend to be
amongst those who already walk most often while there is less change for groups such as those
aged 65+ and less affluent people. This could lead to increasing health inequalities, especially
given the ageing population. These results reinforce the need to target public sector initiatives at
the groups who feel least able to walk due to age, illness or a lack of opportunities.
Many of the population agree that changes such as having someone to walk
with, feeling safer when walking at night and improved pavements and paths
would increase their likelihood of walking more often. Women are particularly
likely to state that this is the case.
These findings suggests that there is a latent demand to walk more often if these types of change
were made and/or if awareness of opportunities can be increased. The greatest opportunities exist
amongst women and the segment identified as ‘Looking to change’.

49National survey of attitudes and barriers to walking in Scotland
Insight Implications and actions
Most of the population are unwilling to walk for more than around 10 minutes to reach
local shops that sell necessities or public transport links but on average would walk
slightly further to get to their local greenspaces or their children’s primary school.
In promoting walking we need to be conscious of the short distances that people are
willing to walk for. While we may walk for longer for recreation purposes (Scottish
Household Survey data suggests that many of us do), for many people to walking as part
of a busy routine, as part of a journey to and from work or study or to buy everyday
essentials ‘needs’ to take up less time.
When asked about their priorities if they were moving house, being able to walk to local
shops and other amenities was more important for most people than convenience by car.
Yet many people say that that where they currently live the places that they would like to
walk to such as shops, public transport and schools are out of reach.
Ratings of local walking ‘conditions’ and the accessibility of facilities vary greatly across
the population suggesting significant differences by local area.
There are a number of potential implications and actions. In some cases the proximity of
local facilities may in reality be closer than people know so action is needed to raise
awareness of path networks, public transport networks etc. If information is combined
with messages on health and environmental benefits this may encourage some people
to ‘make the effort’ to switch to walking for some journeys or to walk for a little bit longer.
In other situations there may be a need to improve the opportunities for walking in local
areas by addressing issues relating to the condition of existing paths and pavements,
continuing to support the provision of new path networks and public transport links and
working with developers to ensure that they recognise the importance of active travel in
the design of new developments.
Just over half of Scots had walked to a public transport link in the last month as part of a
longer journey. This was much higher amongst younger people, those with no access to
a car and those likely to be commuting regularly in urban areas.
There may be opportunities to work with transport operators to increase the appeal of
public transport amongst older age groups, those who don’t commute to work and those
people who will get access to car in the near future. This could relate to both routine
journeys such as commuting and journeys for leisure at off peak times. To outweigh the
perceived benefits of ‘jumping in the car’ public transport options must be seen as
equally or more convenient.
Around two in five Scots have recently seen or heard any marketing or other
communications regarding walking and cycling. Messages regarding health benefits were
most likely to be seen or heard and a wide range of communications channels were
recalled, varying by age.
As referenced above more targeted communications would be beneficial with messaging
continuing to emphasise the health benefits but also the ease and environmental
importance of travelling less by car. A multi channel approach is needed to reach the
different audiences and to reinforce messaging.
Insights, implications and actions

Our Proposed ApproachAppendix – additional analysis of
results by SIMD decile

51National survey of attitudes and barriers to walking in Scotland
Key results by Scottish Index of Multiple Deprivation
FIGURE 26 Frequency walk for any purpose by SIMD
53% 50% 58% 54% 51% 54% 51% 52% 52%
59%
29% 33% 22%
26% 26% 26% 29% 29% 31%
26%
12% 12% 6% 10% 11% 8% 8%
13% 8%10%
6% 4% 10% 7% 10% 7% 11%
5% 9% 5%1% 3% 3% 2%
5% 1% 1%
Bottom 10%SIMD
2 3 4 5 6 7 8 9 Top 10% SIMD
Never
Less often
Once a week
Several times aweekEvery day
Unweighted Base 96 76 99 89 93 93 85 99 80 88

52National survey of attitudes and barriers to walking in Scotland
Key results by Scottish Index of Multiple Deprivation
FIGURE 27 – Walking in the last month by key SIMD
Bottom 10%
SIMD2 3 4 5 6 7 8 9
Top
10% SIMD
Walked to
local
shops or
services
72% 67% 71% 62% 62% 56% 67% 63% 60% 58%
Walked for
leisure or
exercise
58% 55% 63% 55% 61% 63% 62% 59% 72% 70%
Walked to
visit family
or friends
40% 49% 51% 34% 42% 37% 39% 38% 30% 36%
Walked the
dog
33% 30% 21% 25% 25% 33% 29% 35% 33% 33%
Walked to
work
16% 19% 26% 25% 19% 17% 18% 22% 19% 27%
Walked
children to
school
14% 17% 8% 9% 12% 10% 12% 12% 12% 14%
ANY OF
THE
ABOVE
97% 99% 92% 91% 91% 94% 94% 95% 99% 93%
Unweighte
d Base
96 76 99 89 93 93 85 99 80 88

53National survey of attitudes and barriers to walking in Scotland
Key results by Scottish Index of Multiple Deprivation
57%
67%
56%51%
67%
49% 48% 51%47%
62%
Bottom 10%SIMD
2 3 4 5 6 7 8 9 Top 10% SIMD
Unweighted Base 96 76 99 89 93 93 85 99 80 88
FIGURE 26 – Proportion of population who walked to public transport link in last month in total and by SIMD

Our Proposed Approach
This research was undertaken by 56 Degree Insight on behalf of Paths for All.
Paths for All is a partnership organisation; for a full list of our current partners
please visit our website http://www.pathsforall.org.uk
Paths for All Partnership is a recognised Scottish Charity No: SC025535 and a
Company Limited by Guarantee No: 168554 incorporated 19 September 1996 at
Companies House, Edinburgh
Registered Office: Kintail House, Forthside Way, Stirling, FK8 1QZ
+44 (0) 771 786 8770