AUBERGE DE CASTILLE VALLETTA RESTORATION OF EXTERNAL FACADES

National Statistics Office, Malta, 2006

Published by the National Statistics Office
Lascaris Valletta Malta
Tel.: (+356) 25 99 70 00 Fax:(+356) 25 99 72 05
e-mail: [email protected] website: http://www.nso.gov.mt
CIP Data Malta in Figures 2005. – Valletta: National Statistics Office, 2006. xvii, 61p.; 21 cm. ISBN-13: 978-99909-73-39-6 ISBN-10: 99909-73-39-3 ISSN 1726-1392 For further information, please contact: Library and Information Unit National Statistics Office Lascaris Valletta Malta Tel: (+356) 25 99 72 19 Our publications are available from: The Data Shop Department of Information National Statistics Office 3 Castille Place Lascaris Valletta Valletta Tel.: (+356) 25 99 72 19 Tel.: (+356) 21 25 05 50 Fax: (+356) 25 99 72 05 Fax: (+356) 21 23 71 70 Printed in Malta by the Government Printing Press Cover design by Maltese artist, Eman Grima
Cut-off date for data included in this publication: 12 April 2006.

iii
MMAALLTTAA:: AA PPRROOFFIILLEE
Situated in the Central Mediterranean Sea, Malta is a small archipelago of five islands –
Malta (the largest), Gozo, Comino, Comminotto (Maltese, Kemmunett), and Filfla. The latter two are uninhabited. The Maltese Islands lie some 93 kilometres south of Sicily and 290 kilometres north of Libya. The capital city of Malta is Valletta.
The climate is a typically Mediterranean one with hot, dry summers, warm autumns and short, cool winters with adequate rainfall. Temperatures are stable, the annual mean being 18°C and monthly averages ranging from 12°C to 31°C. Winds are strong and frequent, the most common being the cool northwesterly known locally as il-majjistral, the dry northeasterly known as il-grigal, and the hot, humid southeasterly known as ix-xlokk.
Malta attained independence in 1964. Under the 1964 Independence Constitution, Malta was a constitutional monarchy and parliamentary state. This constitution was amended in 1974 to make Malta a republic within the Commonwealth. Its head of state is a president appointed by the Maltese Parliament which, in its turn, is elected by Universal Suffrage for a term of five years.
Maltese culture stems largely from the Islands’ history of domination by Arab, Norman, European and English influences, as well as from the widespread prevalence of the Roman Catholic Church. Folk traditions have grown mainly around the festas, held in honour of the patron saints of towns and villages; these are marked by religious ceremonies, processions and celebrations of a more mondaine nature. The Easter period also gives rise to a spate of Good Friday biblical character pageants in several parts of the Islands. These are populist and devotional at the same time. Folk festivals are also popular. The principal one is l-Imnarja, an agrarian feast held on 29 June, the joint feastday of St. Peter and St. Paul, and highlighted by l-g ana, a type of folksinging peculiar to the Maltese Islands.
Carnival in Malta dates back to at least the middle of the 15th Century. Balls and dance
competitions featuring il-Maltija, the national dance, il-Parata, a sword dance, as well as contemporary dances and défilés of floats are the order of this 3-day festival.
Malta is a country of bastions and belfries. No other country in the world has so many walled
cities, churches and chapels in so small an area. The walled cities are Valletta (il-Belt), Mdina (l-Imdina), Floriana (il-Furjana), Cospicua (Bormla), Senglea (l-Isla), and Vittoriosa (il-Birgu). Mdina ranks amongst the world’s oldest mediaeval cities. St. John’s Co-Cathedral, in the heart of Valletta, is characterised by beautiful Flemish tapestries and houses many famous paintings by Caravaggio and Mattia Preti.
Malta owes its rich architectural heritage to the rule of the Knights Hospitallers of the Order of
St. John of Jerusalem (1530-1798). Under the Knights, the Maltese discomfited the Turks of the Ottoman Empire in the Great Siege of 1565. They also built their capital city, a gem of Baroque architecture.
iv
About the Artist
Eman Grima was born in 1951. He studied art first under George Fenech, and later attended the Malta School of Arts under the tutorship of Esprit Barthet. In 1980 he was awarded an Italian Government Scholarship at the Accademia di Belle Arti in Perugia. Apart from holding twelve personal exhibitions, four of which abroad, he has participated in collective exhibitions in Malta, England, Italy, France and the USA. His work is represented in the National Museum of Fine Arts, the Cathedral Museum and, in various private collections in Malta and abroad.
v
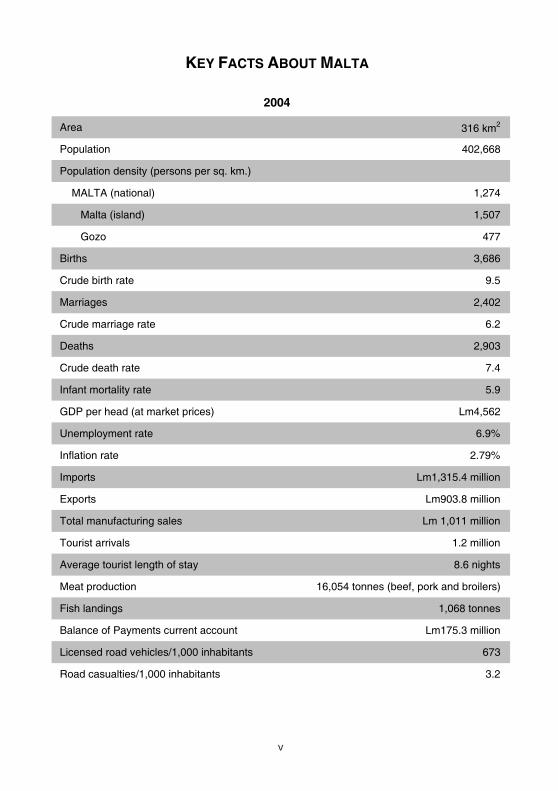
Area 316 km2
Population 402,668
Population density (persons per sq. km.)
MALTA (national) 1,274
Malta (island) 1,507
Gozo 477
Births 3,686
Crude birth rate 9.5
Marriages 2,402
Crude marriage rate 6.2
Deaths 2,903
Crude death rate 7.4
Infant mortality rate 5.9
GDP per head (at market prices) Lm4,562
Unemployment rate 6.9%
Inflation rate 2.79%
Imports Lm1,315.4 million
Exports Lm903.8 million
Total manufacturing sales Lm 1,011 million
Tourist arrivals 1.2 million
Average tourist length of stay 8.6 nights
Meat production 16,054 tonnes (beef, pork and broilers)
Fish landings 1,068 tonnes
Balance of Payments current account Lm175.3 million
Licensed road vehicles/1,000 inhabitants 673
Road casualties/1,000 inhabitants 3.2
2004
KEY FACTS ABOUT MALTA

vi

vii
Attard Balzan Birgu (Vittoriosa)
Birkirkara Birzebbugia Bormla (Cospicua)
Dingli Fgura Floriana
G arg ur G axaq Gudja
G ira amrun Iklin
Isla (Senglea) Kalkara Kirkop
Lija Luqa Marsa
Marsascala Marsaxlokk Mdina
Mellie a M arr (Malta) Mosta
Mqabba Msida Mtarfa
Naxxar Paola Pembroke
Pieta' Qormi Qrendi
Rabat (Malta) Safi San iljan
San Gwann San Pawl il-Ba ar Santa Lu ija
Santa Venera Si iewi Sliema
Swieqi Ta' Xbiex Tarxien
Valletta Xg ajra abbar
ebbu (Malta) ejtun urrieq
Fontana G ajnsielem G arb
G asri Ker em Munxar
Nadur Qala Rabat (Victoria-Gozo)
San Lawrenz Sannat Xag ra
Xewkija ebbu (Gozo)
LOCAL COUNCILS
Malta
Gozo

viii
Austria AT
Belgium BE
Cyprus CY
Czech Republic CZ
Denmark DK
Estonia EE
Finland FI
France FR
Germany DE
Greece EL
Hungary HU
Ireland IE
Italy IT
Latvia LV
Lithuania LT
Luxembourg LU
Malta MT
Netherlands NL
Poland PL
Portugal PT
Slovak Republic SK
Slovenia SI
Spain ES
Sweden SE
United Kingdom UK
Bulgaria BG
Romania RO
Turkey TR
List of country codes for EU member and candidate countries.

ix
Code Category
A Agriculture, hunting and forestry
B Fishing
C Mining and quarrying
D Manufacturing
E Electricity, gas and water supply
F Construction
G Wholesale and retail trade; repair of motor vehicles, motorcycles and
personal and household goods
H Hotels and restaurants
I Transport, storage and communication
J Financial intermediation
K Real estate, renting and business activities
L Public administration and defence; compulsory social security
M Education
N Health and social work
O Other community, social and personal service activities
P Private households with employed persons
Explanatory notes on NACE categories


Page
Malta: A Profile iii
Key Facts About Malta v
Map: Malta vi
Local Councils vii
GEOGRAPHICAL DATA AND LAND COVER 1
ENVIRONMENT 4
POPULATION AND MAIN CAUSES OF DEATH 8
EDUCATION AND CULTURE 11
HEALTHCARE 19
SOCIAL SECURITY 21
QUALITY OF LIFE 23
THE ECONOMY 25
GOVERNMENT FINANCE 30
BALANCE OF PAYMENTS 33
INTERNATIONAL TRADE 35
AGRICULTURE AND FISHERIES 38
TOURISM 41
MANUFACTURING 45
EMPLOYMENT 49
ACCIDENTS AT WORK 53
CONSUMER PRICES 57
MONEY 59
CONTENTS
Page
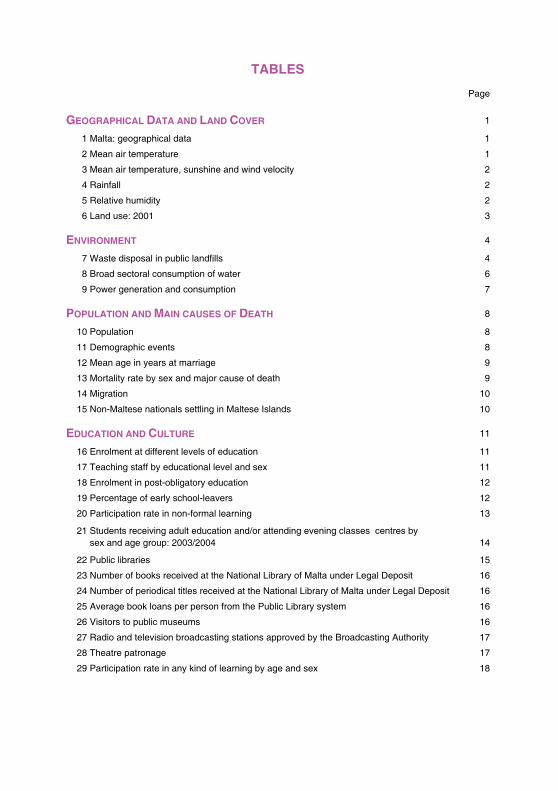
1
1 Malta: geographical data 1
2 Mean air temperature 1
3 Mean air temperature, sunshine and wind velocity 2
4 Rainfall 2
5 Relative humidity 2
6 Land use: 2001 3
4
7 Waste disposal in public landfills 4
8 Broad sectoral consumption of water 6
9 Power generation and consumption 7
8
10 Population 8
11 Demographic events 8
12 Mean age in years at marriage 9
13 Mortality rate by sex and major cause of death 9
14 Migration 10
15 Non-Maltese nationals settling in Maltese Islands 10
11
16 Enrolment at different levels of education 11
17 Teaching staff by educational level and sex 11
18 Enrolment in post-obligatory education 12
19 Percentage of early school-leavers 12
20 Participation rate in non-formal learning 13
21 Students receiving adult education and/or attending evening classes centres bysex and age group: 2003/2004 14
22 Public libraries 15
23 Number of books received at the National Library of Malta under Legal Deposit 16
24 Number of periodical titles received at the National Library of Malta under Legal Deposit 16
25 Average book loans per person from the Public Library system 16
26 Visitors to public museums 16
27 Radio and television broadcasting stations approved by the Broadcasting Authority 17
28 Theatre patronage 17
29 Participation rate in any kind of learning by age and sex 18
GEOGRAPHICAL DATA AND LAND COVER
ENVIRONMENT
POPULATION AND MAIN CAUSES OF DEATH
EDUCATION AND CULTURE
TABLES

Page
19
30 Healthcare facilities 19
31 Healthcare professionals 19
32 Infant and child vaccinations 19
33 Expenditure on public health 20
21
34 Claims for short-term benefits 21
35 Families receiving children/family benefits 21
36 Persons receiving pensions/assistance 21
37 Social benefits payable under the Social Security Act (Cap. 318) 22
23
38 Information society: selected indicators 23
39 Licensed motor vehicles 23
40 Road traffic accidents, cases by region 23
41 Road traffic accidents, casualties by region 24
42 Road equipment and accidents 24
43 Trends in human development 24
25
44 GDP and GNI (ESA 1995) 25
45 Production and generation of income accounts 26
46 GDP by category of expenditure at constant 2000 prices 27
47 Percentage contribution to Gross Value Added (at basic prices) 27
48 Gross Domestic Product per capita in Purchasing Power Standards 29
30
49 Consolidated Fund Data 30
50 Government debt 31
33
51 Balance of payments 33
52 Direct investment 34
35
53 Imports by broad economic category 35
54 Imports by sector 35
55 Exports by sector 35
56 Direction of trade 36
BALANCE OF PAYMENTS
INTERNATIONAL TRADE
HEALTHCARE
SOCIAL SECURITY
QUALITY OF LIFE
THE ECONOMY
GOVERNMENT FINANCE

Page
38
57 Land under cultivation 38
58 Marketed vegetables and fruit 38
59 Meat, milk and egg production 38
60 Fish landings 38
61 Fish price index 38
62 Fish volume index 39
63 Agriculture and fishing: contribution to GDP 39
64 Agricultural price indices based on economic accounts for agriculture (2000=100) 40
65 Agricultural volume indices based on economic accounts for agriculture (2000=100) 40
66 Agricultural value indices based on economic accounts for agriculture (2000=100) 40
41
67 Departing tourists from Malta, by country of origin 41
68 Average length of stay of tourists by type of accommodation 41
69 Collective accommodation and bed-places 42
70 Travel account in the Balance of Payments 43
71 Employment in hotels and catering 44
72 Maltese travelling abroad by air 44
45
73 Average annual employment and wages and salaries in manufacturing industry 45
74 Average annual earnings and sales per employee in manufacturing industry 46
75 Total sales and investment in manufacturing industry 47
49
76 Labour status 49
77 Activity, employment and unemployment rate 49
78 Total employed persons by age distribution 50
79 Total employed persons by main occupation 51
80 Total employed persons by economic activity 51
81 Unemployed persons by age group 52
82 Unemployed persons by duration of job search 52
83 Inactive persons by age group 52
53
84 Accidents at work by sex of victim 53
85 Accidents at work by occupation of victim 53
86 Accidents at work by age group of victim 54
87 Accidents at work by economic activity 55
88 Fatal accidents at work 56
ACCIDENTS AT WORK
AGRICULTURE AND FISHERIES
TOURISM
MANUFACTURING
EMPLOYMENT

Page
57
89 Retail Prices Index 57
90 Monthly inflation rates 57
59
91 Average exchange rates of major selected currencies against the Maltese Lira 59
92 Average exchange rates of the Maltese Lira against major selected currencies 59
93 Monetary aggregates 60
94 Counterparts of M3 60
95 Deposits 61
96 Selected interest rates in Malta 61
1 Land use in Malta: 2001 3
2 Waste disposal in public landfills 4
3 Bathing water quality in the Maltese Islands: 2004 4
4 Bathing water quality in Malta (Island of): 2004 5
5 Bathing water quality in Gozo and Comino: 2004 5
6 Public water consumption 6
7 Total population vs private cars 6
8 Use of generated power: 2003/2004 7
9 Live births 8
10 Infant mortality rate 9
11 Children born outside marriage as a percentage of total live births 9
12 Major causes of death: 2003 9
13 Major causes of death: 2004 9
14 Deaths from cancers 10
15 Emigrants and returning emigrants 10
16 Non-Maltese nationals 10
17 Enrolment at different levels of education: 2002-2004 11
18 Percentage distribution of foreign languages learned at lower secondary level: 2003-2004 12
19 Foreign-language learning among lower secondary schools by type of school: 2003/2004 13
20 Distribution of persons attending the adult literacy classes: 1999/2000 - 2003/2004 14
21 Students attending evening classes as a percentage of the total population in the respective age group 15
22 Preferred type of theatre performance 17
23 Expenditure on public health 20
24 Benefits payable under the Social Security Act 22
CHARTS
CONSUMER PRICES
MONEY

Page
25 Percentage contribution to GVA: 2001 28
26 Percentage contribution to GVA: 2004 28
27 Revenue (net of loans and sale of shares) by main category: 2004 31
28 Total expenditure (less contribution to Sinking Fund) by main category: 2004 32
29 Total government expenditure (less contribution to Sinking fund and less direct loan repayment) and Recurrent revenue as a percentage of GDP 32
30 Central Government deficit and debt as a percentage of GDP 32
31 Current Account balance 34
32 Direct investment 34
33 Import and export unit value indices (1995=100) 36
34 Import and export volume indices (1995=100) 36
35 Imports 37
36 Exports 37
37 Total imports: 2004 37
38 Total exports: 2004 37
39 Agriculture and fishing: contribution to GDP 39
40 Agricultural indices based on economic accounts for agriculture 40
41 Seasonal pattern of tourist departures 41
42 Cruise passengers and cruise ships visiting Malta 42
43 Employment in hotels and catering 44
44 Average annual employment in manufacturing 45
45 Annual wages and salaries in manufacturing 45
46 Average annual earnings per employee in manufacturing 46
47 Average annual sales per employee in manufacturing 46
48 Total sales in manufacturing 47
49 Annual investment 47
50 Labour status: males 49
51 Labour status: females 49
52 Persons employed on a full-time basis by age group: 2004 50
53 Persons employed on a part-time basis by age group: 2004 50
54 Fatal accidents at work 55
55 Accidents at work by age bracket of victim 56
56 Monthly inflation rates 58
57 Annual inflation rates 58
58 Average exchange rates of major selected currencies against the Maltese Lira 59
59 Average exchange rates of the Maltese Lira against major selected currencies 60

FOREWORD
Malta in Figures 2005 is a concise collection of statistics that presents social and economic data from National Statistics Office sources as well as from various government organisations and departments and other authoritative sources. It comprises information on a wide range of statistical topics: the economy; population; education; culture; the environment; health; the labour market; industry; agriculture and fisheries; and tourism and travel. This publication is designed to give a brief but informative insight into Maltese society and the economy. It is not comprehensive and does not by any means purport to represent the sum of the National Statistics Office’s activities and projects. The latter are contained in a substantial body of NSO published output that takes the form of print, CD-ROM and internet publications, which run into several issues a year. Additional and complementary information is available through the NSO homepage and electronic databases, which can be accessed for free twenty-four hours a day, seven days a week. Having said this, Malta in Figures 2005 is an invaluable guide to individuals and organisations who would like to acquire a handy and general outlook on life in Malta today. Many of the sections in this booklet are enriched by explanatory notes which should be read in conjunction with the tables and charts. We trust that you will enjoy this compact data book and hope that it will arouse enough of your interest as to lead you to consult the more detailed statistical collections and studies which emanate from this Office. Alfred Camilleri Director-General


1
Situation Area
Northern latitude 36º 00' 00'' Malta 245.728 square kilometres
Southern latitude 35º 48' 00'' Gozo 67.078 square kilometres
Eastern longitude 14º 35' 00'' Comino 2.784 square kilometres
Western longitude 14º 10' 30'' Total 315.590 square kilometres
Extension maximum length Malta 27.359 kilometres
Gozo 14.484 kilometres
maximum width Malta 14.480 kilometres
Gozo 7.242 kilometres
shoreline Malta 196.80 kilometres
Gozo 56.01 kilometres
GEOGRAPHICAL DATA AND LAND COVER
Table 1. Malta: geographical data
Month 2002 2003 2004
January 11.5 13.4 12.2
February 13.8 10.4 13.0
March 15.5 12.7 13.7
April 16.9 15.5 16.1
May 19.5 20.4 18.2
June 24.6 26.1 23.1
July 27.1 28.8 26.3
August 26.4 28.7 26.7
September 24.0 24.5 23.4
October 21.3 22.1 22.2
November 18.3 18.0 16.8
December 14.2 13.9 15.0
Table 2. Mean air temperature
Mean temperature (ºC)
2
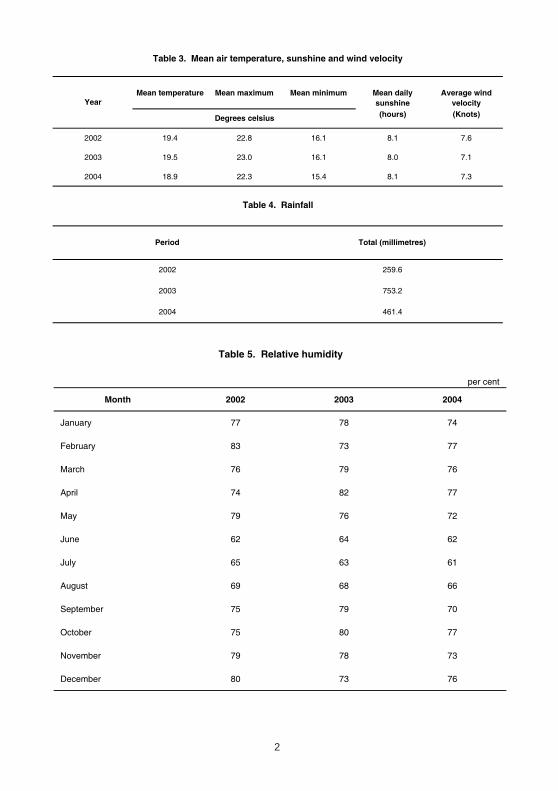
Mean temperature Mean maximum Mean minimum Mean daily sunshine
Average wind velocity
(hours) (Knots)
2002 19.4 22.8 16.1 8.1 7.6
2003 19.5 23.0 16.1 8.0 7.1
2004 18.9 22.3 15.4 8.1 7.3
2002
2003
2004
Total (millimetres)
259.6
753.2
461.4
Period
Table 3. Mean air temperature, sunshine and wind velocity
Degrees celsius
Year
Table 4. Rainfall
Month 2002 2003 2004
January 77 78 74
February 83 73 77
March 76 79 76
April 74 82 77
May 79 76 72
June 62 64 62
July 65 63 61
August 69 68 66
September 75 79 70
October 75 80 77
November 79 78 73
December 80 73 76
per cent
Table 5. Relative humidity

3
Km2 % total area
Total agricultural land 107.06 33.88
Land under forest and other wooded land * 13.37 4.23
Built-up and related land (excl. scattered farm buildings) 73.38 23.22
Of which:
Industrial land 5.63 1.78
Land use for quarries etc. 2.56 0.81
Land of mixed use ** 65.19 20.63
Wet open land 1.60 0.50
Dry open land *** 119.59 37.84
Inland waters 1.00 0.33
Total land area 316.00 100.00
*** includes coastal areas, cliffs, garigue and other open land which is not earmarked for development
Table 6. Land use: 2001
* (used for recreational purposes), Public-owned
** includes residential, commercial and technical infrastructure
Chart 1. Land use in Malta: 2001
Dry open lands38%
Built-up and related land23%
Forest & other wooded land4%
Agricultural land34%
Inland waters0%
Wet open lands1%

4
Municipal solid wasteConstruction and demolition
wasteIndustrial and other waste
2002 187,066 1,289,248 40,115
2003 201,835 538,069 41,351
2004 211,718 30,897 31,909
Source: Waste Management Strategy Implementation Department.
ENVIRONMENT
Table 7. Waste disposal in public landfills
tonnes
Chart 2. Waste disposal in public landfills
0 500 1000 1500 2000 2500
1995
1996
1997
1998
1999
2000
2001
2002
2003
2004
'000 tonnes
Industrial and other waste
Construction and demolition waste
Municipal solid waste
Chart 3. Bathing water quality in the Maltese Islands: 2004
Class 183%
Class 217%

5
Note: 1st Class Area: Faecal Coliforms < 100 per 100ml in at least 95% of total samples collected during the bathing season.
2nd Class Area: Faecal Coliforms < 100 per 100ml in at least 50% of samples and< 1000 per 100ml in at least 90% of total samples collected during the bathing season.
3rd Class Area: Faecal Coliforms ³ 100 per 100ml in 50% or more of samples and /or ³ 1000 per 100ml in 10% or more of total number of samples collected during the bathing season.
Chart 5. Bathing water quality in Gozo and Comino: 2004
Class 20%
Class 1100%
Chart 4. Bathing water quality in Malta (Island of): 2004
Class 177%
Class 223%

6
Domestic sector Industrial sectorCommercial/
Government/ Other sectors
1999 65.0 6.6 28.4 17,415
1999/2000 63.5 7.4 29.0 18,001
2000 61.9 9.3 28.8 18,731
2001 63.5 7.4 29.1 18,002
2002 67.0 6.0 27.0 18,613
2003 66.5 6.0 27.5 18,968
2004 692.0 4.5 26.0 18,552
^ Excluding loss in network * August 1998 to July 1999
Table 8. Broad sectoral consumption of water
Year All uses^ (‘000 m3)
(% of all users)
Chart 7. Total population vs private cars
0
50000
100000
150000
200000
250000
300000
350000
400000
450000
2001 2002 2003 2004
num
ber
Total population Private cars
Chart 6. Public water consumption
0
5
10
15
20
25
2000 2001 2002 2003 2004
cubi
c m
etre
s
Groundwater abstraction Desalinated water

7
‘000 kilowatt hour
Industrial Commercial Domestic Street lighting
2000/2001 1,943,350 117,661 482,908 503,660 540,265 42,733 256,123
2001/2002 2,055,073 123,987 504,760 501,582 561,907 44,901 317,936
2002/2003 2,208,015 125,093 499,230 553,804 623,679 35,220 370,989
2003/2004 2,214,892 127,777 505,535 563,090 623,672 29,068 365,750
Table 9. Power generation and consumption
Other
Source: Enemalta Corporation.
YearTotal
generatedUsed in station
Consumed
Chart 8. Use of generated power: 2003/2004
Other18%
Street lighting1%
Domestic30%
Industrial24%
Commercial27%
8
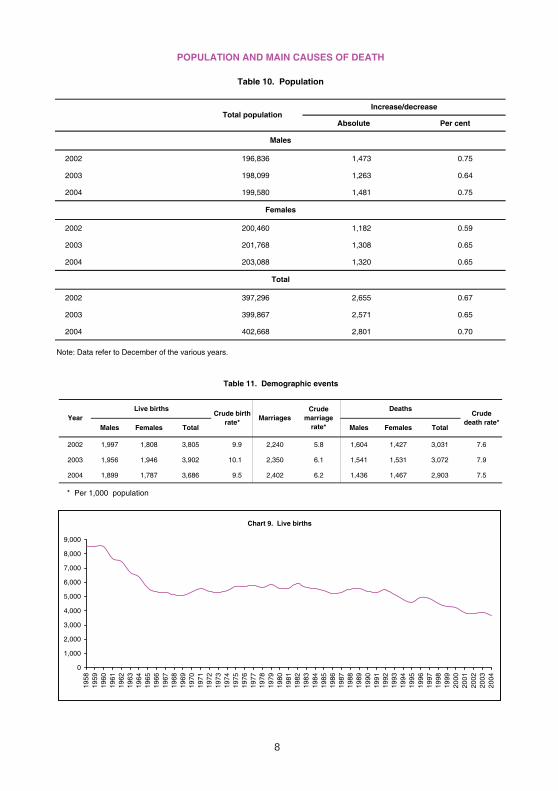
Absolute Per cent
2002 196,836 1,473 0.75
2003 198,099 1,263 0.64
2004 199,580 1,481 0.75
2002 200,460 1,182 0.59
2003 201,768 1,308 0.65
2004 203,088 1,320 0.65
2002 397,296 2,655 0.67
2003 399,867 2,571 0.65
2004 402,668 2,801 0.70
Note: Data refer to December of the various years.
Females
Total
Table 10. Population
POPULATION AND MAIN CAUSES OF DEATH
Total populationIncrease/decrease
Males
Males Females Total Males Females Total
2002 1,997 1,808 3,805 9.9 2,240 5.8 1,604 1,427 3,031 7.6
2003 1,956 1,946 3,902 10.1 2,350 6.1 1,541 1,531 3,072 7.9
2004 1,899 1,787 3,686 9.5 2,402 6.2 1,436 1,467 2,903 7.5
* Per 1,000 population
Table 11. Demographic events
Crude marriage
rate*
Crude death rate*
YearCrude birth
rate*Marriages
Live births Deaths
Chart 9. Live births
0
1,000
2,000
3,000
4,000
5,000
6,000
7,000
8,000
9,000
1958
1959
1960
1961
1962
1963
1964
1965
1966
1967
1968
1969
1970
1971
1972
1973
1974
1975
1976
1977
1978
1979
1980
1981
1982
1983
1984
1985
1986
1987
1988
1989
1990
1991
1992
1993
1994
1995
1996
1997
1998
1999
2000
2001
2002
2003
2004

9
Males Females Males Females Males Females
First marriage 26.9 25.4 28.5 26.0 28.9 26.6
Other marriage 44.2 38.9 45.4 41.1 45.9 41.9
Note: The 'Other Marriage' category includes persons whose previous marital status was that of widowed or divorced or annulled.
Table 12. Mean age in years at marriage
200420032002
Chart 10. Infant mortality rate
0
10
20
30
40
50
60
70
80
90
100
1950 1960 1970 1980 1990 1998 1999 2000 2001 2002 2003 2004
Chart 11. Children born outside marriage as apercentage of total live births
19.1
14.6
16.8
13
14
15
16
17
18
19
20
2002 2003 2004
Males Females Males Females Males Females
Neoplasms 26.2 22.4 24.4 21.9 26.6 21.8
Diseases of the circulatory system 40.8 47.8 42.3 44.6 39.5 44.2
Diseases of the respiratory system 13.8 9.0 12.0 9.3 12.3 9.3
External causes of morbidity and mortality 4.5 3.6 5.2 3.6 4.5 3.9
Other causes 14.7 17.2 16.1 20.6 17.1 20.8
Source: Department of Health Information.
2004
Table 13. Mortality rate by sex and major cause of death
Major cause of death
20032002
Chart 12. Major causes of death: 2003
Neoplasms23.2%
Diseases of the circulatory system
43.5%
Diseases of the respiratory system
10.7%
Other causes18.4%
External causes of morbidity and mortality
4.4%
Chart 13. Major causes of death: 2004
Diseases of the respiratory system
10.8%
External causes of morbidity and mortality
4.2%
Other causes19.1% Neoplasms
24.1%
Diseases of the circulatory system
41.8%

10
Emigrants from Emigrants returning to Year Number
1999 369
1990 160 858 2000 515
2001 73 472 2001 530
2002 96 382 2002 533
2003 40 518 2003 721
2004* 70 459 2004* 593
* estimated * estimated
Maltese Islands
Table 15. Non-Maltese nationals settling in Maltese IslandsTable 14. Migration
Year
Chart 14. Deaths from cancers
200
300
400
500
600
700
8001976
1980
1984
1988
1992
1996
2000
2004
num
ber
Chart 15. Emigrants and returning emigrants
0
200
400
600
800
1,000
1990 2001 2002 2003 2004
Emigrants
Returning emigrants
Chart 16. Non-Maltese nationals
0
100
200
300
400
500
600
700
800
2000 2001 2002 2003 2004

11
Level Primary Secondary Post-secondary Tertiary Vocational 1
2002 Total 32,717 28,126 4,973 6,362 4,262
Males 16,946 14,302 2,705 3,159 2,764
Females 15,771 13,824 2,268 4,173 1,026
2003 Total 31,708 28,560 5,169 9,006 4,635
Males 16,454 14,443 2,298 3,888 3,168
Females 15,254 14,117 2,871 5,118 1,467
2004 Total 31,064 29,540 5,479 7,955 7,041
Males 16,084 14,988 2,318 3,515 5,063
Females 14,980 14,552 3,161 4,440 1,978
1 including post-secondary vocational courses
Table 16. Enrolment at different levels of education
EDUCATION AND CULTURE
Chart 17. Enrolment at different levels of education: 2002-2004
0
5,000
10,000
15,000
20,000
25,000
30,000
35,000
Primary Secondary Post-secondary Tertiary Vocational
2002
2003
2004
Males Females Males Females Males Females
Pre-Primary 12 31 17 902 10 966
Primary 384 2,015 372 2,013 363 2,006
Secondary & Post-Secondary 1,344 1,848 1,376 2,069 1,622 2,332
Vocational 2 398 109 366 103 349 144
Tertiary 599 201 595 208 518 166
Special 20 103 20 112 20 124
Total 2,757 4,307 2,746 5,407 2,882 5,738
1 includes staff not directly engaged in teaching
2 Vocational education comprises technical institutes, trade schools, the Institute of Tourism Studies, the Kindergarten Assistants'Training Centre and MCAST from (2001)
2003/2004
Table 17. Teaching staff1 by educational level and sex
2002/20032001/2002Level
12
Males Females Males Females Males Females Males Females
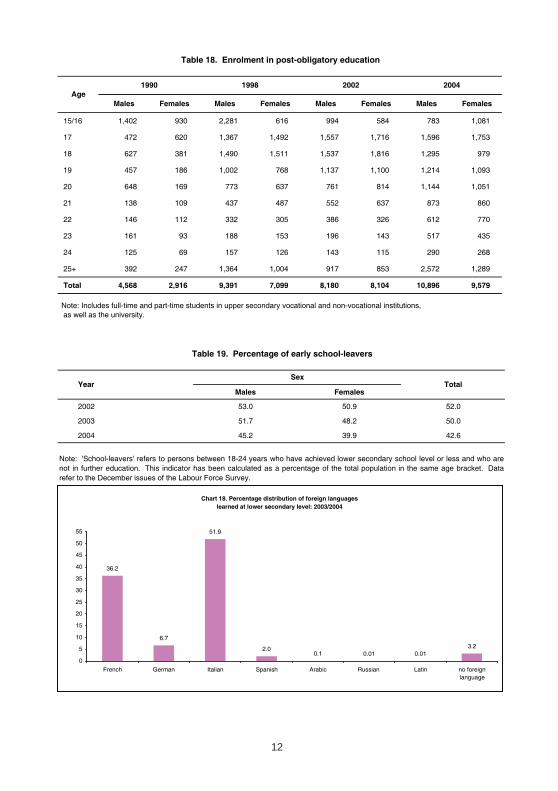
15/16 1,402 930 2,281 616 994 584 783 1,081
17 472 620 1,367 1,492 1,557 1,716 1,596 1,753
18 627 381 1,490 1,511 1,537 1,816 1,295 979
19 457 186 1,002 768 1,137 1,100 1,214 1,093
20 648 169 773 637 761 814 1,144 1,051
21 138 109 437 487 552 637 873 860
22 146 112 332 305 386 326 612 770
23 161 93 188 153 196 143 517 435
24 125 69 157 126 143 115 290 268
25+ 392 247 1,364 1,004 917 853 2,572 1,289
Total 4,568 2,916 9,391 7,099 8,180 8,104 10,896 9,579
Note: Includes full-time and part-time students in upper secondary vocational and non-vocational institutions, as well as the university.
2004
Table 18. Enrolment in post-obligatory education
1990 1998 2002Age
Males Females
2002 53.0 50.9 52.0
2003 51.7 48.2 50.0
2004 45.2 39.9 42.6
Note: 'School-leavers' refers to persons between 18-24 years who have achieved lower secondary school level or less and who arenot in further education. This indicator has been calculated as a percentage of the total population in the same age bracket. Datarefer to the December issues of the Labour Force Survey.
Table 19. Percentage of early school-leavers
YearSex
Total
Chart 18. Percentage distribution of foreign languages learned at lower secondary level: 2003/2004
36.2
6.7
51.9
2.00.1
3.20.01 0.01
0
5
10
15
20
25
30
35
40
45
50
55
French German Italian Spanish Arabic Russian Latin no foreignlanguage

13
High Medium Low Employed Unemployed Inactive
EU25 31 16 7 21 14 6
Belgium 35 19 9 26 13 5
Czech Republic 27 12 4 17 6 2
Denmark 61 44 31 53 41 23
Germany 25 11 4 16 12 4
Estonia 27 11 : 19 13 :
Greece 13 5 1 6 7 2
Spain 21 13 5 12 16 5
France 35 20 11 25 20 6
Italy 14 7 2 7 2 1
Ireland 24 14 7 17 12 6
Cyprus 45 17 4 25 13 4
Latvia 33 11 3 17 8 4
Lithuania 20 5 : 10 4 :
Luxembourg 36 16 5 20 20 6
Hungary 10 5 2 6 5 2
Malta 25 23 6 14 : 4
Netherlands 15 12 6 13 9 5
Austria 45 26 9 30 25 11
Poland 32 8 2 15 4 1
Portugal 30 18 5 11 9 4
Slovenia 49 22 7 31 13 5
Slovak Republic 41 20 7 29 7 2
Finland 60 37 24 50 25 16
Sweden 64 45 30 53 24 23
United Kingdom 56 34 11 42 26 14
target population: 25-64 year olds.
Table 20. Participation rate in non-formal learning
Education level Working status
When determining the highest level of educational attainment, both general and vocational education/training should be considered. Three levels are distinguished in table 20: low corresponds to pre-primary, primary and lower secondary education (ISCED levels 0, 1, 2); medium: corresponds to upper secondary and post-secondary education (ISCED levels 3, 4); high corresponds to tertiary education (ISCED levels 5, 6).
Chart 19. Foreign-language learning among lower secondary schools by type of school: 2003/2004
28.4
8.2
54.9
3.5 5.
0
24.2
3.7
49.0
1.1 4.
1
46.7
5.0
47.9
0.0
0.4
0
10
20
30
40
50
60
French Germany Italian Spanish Other
State
Independent
Government dependent
14
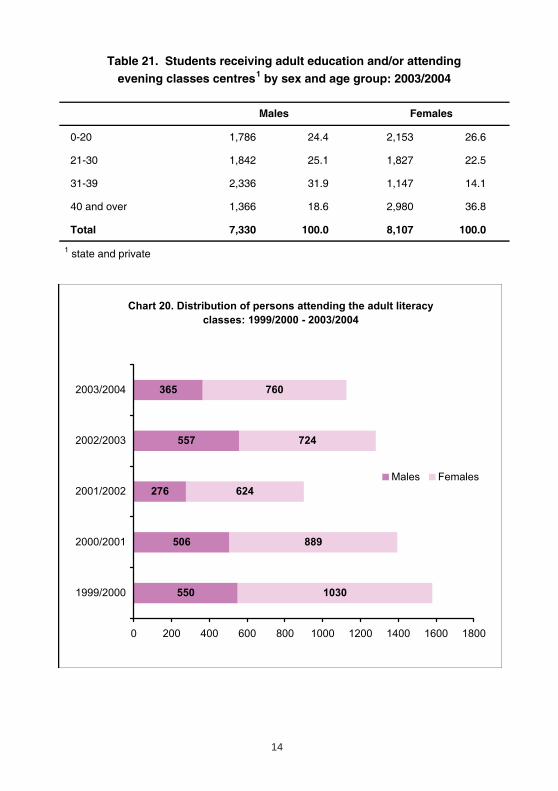
0-20 1,786 24.4 2,153 26.6
21-30 1,842 25.1 1,827 22.5
31-39 2,336 31.9 1,147 14.1
40 and over 1,366 18.6 2,980 36.8
Total 7,330 100.0 8,107 100.0
1 state and private
Table 21. Students receiving adult education and/or attending
Males Females
evening classes centres1 by sex and age group: 2003/2004
Chart 20. Distribution of persons attending the adult literacy
classes: 1999/2000 - 2003/2004
1030
889
624
724
550
506
276
557
365 760
0 200 400 600 800 1000 1200 1400 1600 1800
1999/2000
2000/2001
2001/2002
2002/2003
2003/2004
Males Females

15
Acquisitions / Loans 2002 2003 2004
Book purchases 6,936 4,412 4,290
Book donations 1 8,324 11,404 15,379
New library members 6,327 6,149 6,671
Book loans 757,166 807,650 816,230
of which:
Central Public Library 281,886 282,996 295,686
Regional libraries 218,246 228,789 202,563
Branch libraries (Malta) 222,766 247,572 267,276
Branch libraries (Gozo) 34,268 48,293 50,705
1 includes book items which were either donated to branch libraries or purchased by local councils for their respective branch librarie
p provisional
Table 22. Public libraries
Chart 21 . Students attending evening classes as a percentage of the total population in the respective age group
0.0
1.0
2.0
3.0
4.0
5.0
6.0
7.0
8.0
9.0
10.0
males females males females males females males females
0-20 21-30 31-39 40+

16
2002 2003 2004
Number of books 289 599 426
p provisional
Source: National Library of Malta.
2002 2003 2004
Number of periodical titles 548 699 723
1 includes: parish news letters; festa programme; and ephemera
p provisionalSource: National Library of Malta.
2002 2003 2004
Total book loans 757,166 807,650 816,230
Total population 397,296 399,867 402,668
Average loans per person 1.9 2.0 2.0
Visitors 2002 2003 2004
On payment 980,075 916,535 1,166,284
For free 220,885 167,370 90,618
Total visitors 1,200,960 1,083,905 1,256,902
Group tickets sold 498,335 482,225 508,525
Table 26. Visitors to public museums
Table 23. Number of books received at the National Library of Malta under Legal Deposit
Table 24. Number of periodical titles1 received at the National Library of Malta under Legal Deposit
Table 25. Average book loans per person from the Public Library system
17
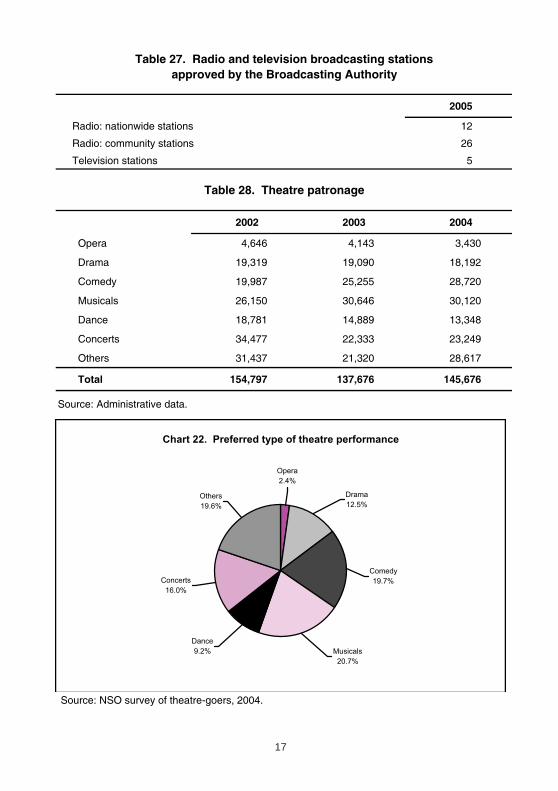
2005
Radio: nationwide stations 12
Radio: community stations 26
Television stations 5
2002 2003 2004
Opera 4,646 4,143 3,430
Drama 19,319 19,090 18,192
Comedy 19,987 25,255 28,720
Musicals 26,150 30,646 30,120
Dance 18,781 14,889 13,348
Concerts 34,477 22,333 23,249
Others 31,437 21,320 28,617
Total 154,797 137,676 145,676
Source: Administrative data.
Note: 'Other' includes concert and dance performances.
Source: NSO survey of theatre-goers, 2004.
approved by the Broadcasting Authority
Table 28. Theatre patronage
Table 27. Radio and television broadcasting stations
Chart 22. Preferred type of theatre performance
Others
19.6%
Concerts
16.0%
Dance
9.2% Musicals
20.7%
Comedy
19.7%
Drama
12.5%
Opera
2.4%
18
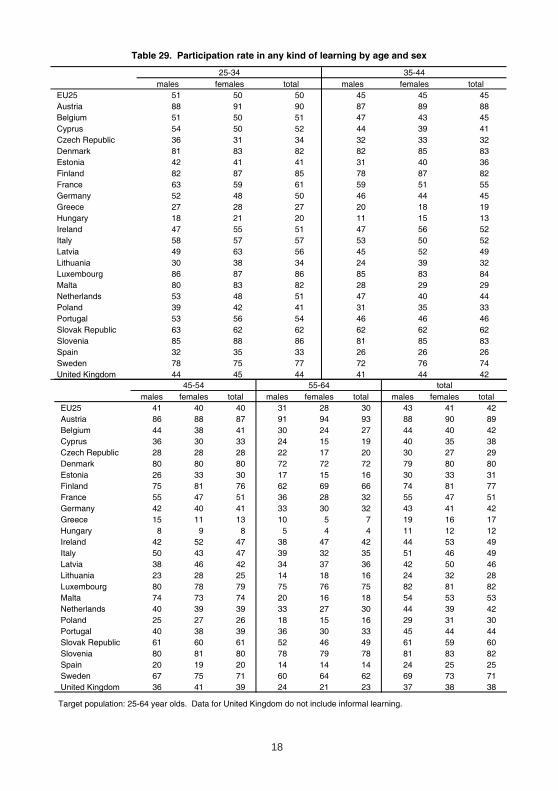
males females total males females total EU25 51 50 50 45 45 45 Austria 88 91 90 87 89 88 Belgium 51 50 51 47 43 45 Cyprus 54 50 52 44 39 41 Czech Republic 36 31 34 32 33 32 Denmark 81 83 82 82 85 83 Estonia 42 41 41 31 40 36 Finland 82 87 85 78 87 82 France 63 59 61 59 51 55 Germany 52 48 50 46 44 45 Greece 27 28 27 20 18 19 Hungary 18 21 20 11 15 13 Ireland 47 55 51 47 56 52 Italy 58 57 57 53 50 52 Latvia 49 63 56 45 52 49 Lithuania 30 38 34 24 39 32 Luxembourg 86 87 86 85 83 84 Malta 80 83 82 28 29 29 Netherlands 53 48 51 47 40 44 Poland 39 42 41 31 35 33 Portugal 53 56 54 46 46 46 Slovak Republic 63 62 62 62 62 62 Slovenia 85 88 86 81 85 83 Spain 32 35 33 26 26 26 Sweden 78 75 77 72 76 74 United Kingdom 44 45 44 41 44 42
Table 29. Participation rate in any kind of learning by age and sex
25-34 35-44
males females total males females total males females total EU25 41 40 40 31 28 30 43 41 42 Austria 86 88 87 91 94 93 88 90 89 Belgium 44 38 41 30 24 27 44 40 42 Cyprus 36 30 33 24 15 19 40 35 38 Czech Republic 28 28 28 22 17 20 30 27 29 Denmark 80 80 80 72 72 72 79 80 80 Estonia 26 33 30 17 15 16 30 33 31 Finland 75 81 76 62 69 66 74 81 77 France 55 47 51 36 28 32 55 47 51 Germany 42 40 41 33 30 32 43 41 42 Greece 15 11 13 10 5 7 19 16 17 Hungary 8 9 8 5 4 4 11 12 12 Ireland 42 52 47 38 47 42 44 53 49 Italy 50 43 47 39 32 35 51 46 49 Latvia 38 46 42 34 37 36 42 50 46 Lithuania 23 28 25 14 18 16 24 32 28 Luxembourg 80 78 79 75 76 75 82 81 82 Malta 74 73 74 20 16 18 54 53 53 Netherlands 40 39 39 33 27 30 44 39 42 Poland 25 27 26 18 15 16 29 31 30 Portugal 40 38 39 36 30 33 45 44 44 Slovak Republic 61 60 61 52 46 49 61 59 60 Slovenia 80 81 80 78 79 78 81 83 82 Spain 20 19 20 14 14 14 24 25 25 Sweden 67 75 71 60 64 62 69 73 71 United Kingdom 36 41 39 24 21 23 37 38 38
Target population: 25-64 year olds. Data for United Kingdom do not include informal learning.
45-54 55-64 total

19
2002 2003 2004
Acute care hospitals 9 9 9
Average acute care length of stay 4.32 4.62 4.64
Note: Acute care refers to short stay.
Source: Department of Health Information.
2002 2003 2004
Registered medical practitioners 1,058 1,254 1,302
per 1000 population 2.7 3.1 3.2
Registered dentists 159 168 181
per 1000 population 0.4 0.4 0.4
Registered pharmacists 809 800 837
per 1000 population 2.0 2.0 2.1
Registered nurses and midwives 2,307 2,423 2,150
per 1000 population 5.8 6.1 5.3
Source: Department of Health Information.
2003 2004/2005 1
Per cent Per cent
Diphtheria 93.3 93.6
Tetanus 93.3 93.6
Pertussis 93.3 92.8
Poliomyelitis 93.3 93.6
HIB 91.1 92.7
MMR 87.8 87.4
Notes:
1. Infants refer to persons who have completed 1 year of life.
2. Children refer to persons who have completed 2 years of life.
3. HIB - Haemophilus Influenze B.
4. MMR - Measles, Mumps and Rubella.
1 beginning of year
Source: National Immunisation Service.
Table 30. Healthcare facilities
HEALTHCARE
Table 31. Healthcare professionals
Table 32. Infant and child vaccinations
20
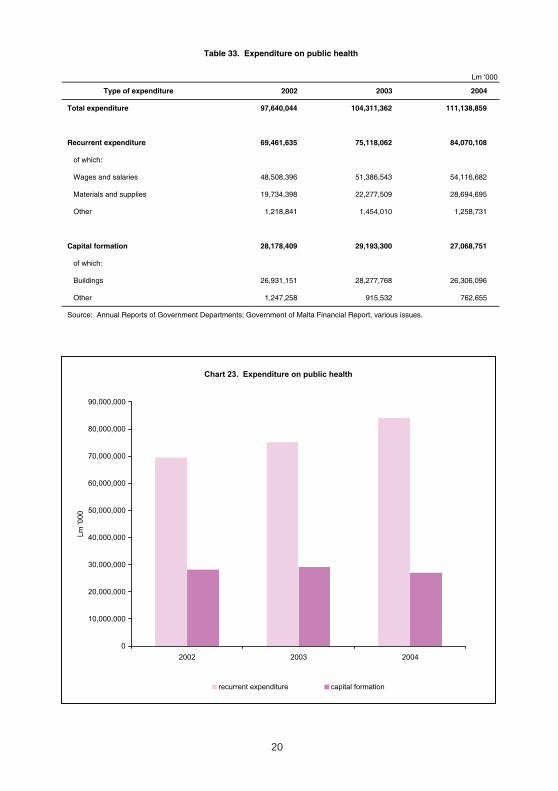
Type of expenditure 2002 2003 2004
Total expenditure 97,640,044 104,311,362 111,138,859
Recurrent expenditure 69,461,635 75,118,062 84,070,108
of which:
Wages and salaries 48,508,396 51,386,543 54,116,682
Materials and supplies 19,734,398 22,277,509 28,694,695
Other 1,218,841 1,454,010 1,258,731
Capital formation 28,178,409 29,193,300 27,068,751
of which:
Buildings 26,931,151 28,277,768 26,306,096
Other 1,247,258 915,532 762,655
Source: Annual Reports of Government Departments; Government of Malta Financial Report, various issues.
Table 33. Expenditure on public health
Lm ‘000
Chart 23. Expenditure on public health
0
10,000,000
20,000,000
30,000,000
40,000,000
50,000,000
60,000,000
70,000,000
80,000,000
90,000,000
2002 2003 2004
Lm
'000
recurrent expenditure capital formation

21
Type of benefit 2002 2003 2004
Sickness benefit 127,436 138,145 128,991
Unemployment benefit 11,239 15,763 19,564
Special unemployment benefit 637 1,427 1,389
Injury benefit 4,654 4,602 3,997
Marriage grant 3,323 3,197 3,378
Gratuity on re-marriage 3 7 10
Total 147,292 163,141 157,329
Type of benefit 2002 2003 2004
Child allowance 37,141 36,481 37,809
Disabled child allowance 597 660 673
Maternity benefit 3,243 2,839 2,774
Type of benefit 2002 2003 2004
Contributory pension 57,732 59,405 61,264
of which:
Retirement pension 7,392 7,507 7,744
Nat. min. retirement pension 7,963 7,899 7,911
Two-thirds pension 16,211 16,882 18,129
Nat. min. invalidity pension 5,582 6,348 6,745
Nat. min. widow's pension 7,905 7,860 7,742
Other 12,679 12,909 12,993
Non-contributory pension 7,073 6,983 6,928
of which:
Old age 4,224 4,098 4,409
Mentally/severely handicapped 1,956 2,047 2,092
Other 893 838 427
Non-contributory assistance 58,215 57,004 61,378
of which:
Social assistance 14,209 12,768 16,227
Sickness assistance 14,467 14,553 14,520
Supplementary allowance 29,274 29,425 30,390
Other 265 258 241
Note: all figures have been rounded
Source: Department of Social Security
SOCIAL SECURITY
Table 34. Claims for short-term benefits
Table 35. Families receiving children/family benefits
Table 36. Persons receiving pensions/assistance

22
Lm'000
Type of benefit 2002 2003 2004
Total contributory benefits 154,621 161,697 165,553
Retirement pension 80,887 84,132 86,447
Invalidity pension 12,073 14,196 15,426
Widow's pension 30,611 32,453 33,244
Children's allowance 15,850 14,859 14,285
Sickness benefit 2,070 2,273 1,890
Bonus 10,126 10,733 11,200
Other 3,003 3,052 3,061
Total non-contributory benefits 36,128 39,225 41,905
Age/Pension for the visually impaired 5,830 5,887 6,268
Disability pension 2,849 3,099 3,292
Social assistance 17,210 18,949 20,769
Medical assistance 5,204 5,703 5,788
Bonus 2,940 3,049 3,175
Supplementary assistance 1,927 2,414 2,528
Other 167 123 86
Total benefits 190,749 200,922 207,458
Note: all figures have been rounded
Source: Department of Social Security
Table 37. Social benefits payable under the Social Security Act (Cap. 318)
Chart 24. Benefits payable under the Social Security Act
0
50,000
100,000
150,000
200,000
250,000
2002 2003 2004
num
ber
total contributory benefits total non-contributory benefits total benefits

23
Total Per 100 Total Per 100 Total Per 100December 2002 Population 1 December 2003 Population 1 December 2004 Population 1
Telephone lines 207,269 52.2 208,271 52.1 210,706 52.4
Mobile telephone subscriptions 276,859 69.7 289,992 72.5 308,401 76.8
Pagers subscriptions 4,645 1.2 4,383 1.1 4,300 1.1
Two-way radio licences 1,130 0.3 999 0.2 912 0.2
Cable TV subscriptions 95,107 23.9 99,434 24.9 101,000 25.1
Internet subscriptions 67,001 16.9 76,814 19.2 87,870 21.9
VOIP (minutes consumed) : : 4,352,767 1,088.6 6,308,017 1,577.5
1 average figures have been rounded
Type of indicator
QUALITY OF LIFE
Table 38. Information society: selected indicators
Type of vehicle 2002 2003 2004
Private Cars 195,055 201,924 204,702
Commercial Vehicles 43,852 44,657 44,575
Motorcycles 13,097 13,420 12,639
Other 9,325 9,451 9,221
Total 261,329 269,452 271,137
Region 2002 2003 2004
Malta (Island of) 13,383 13,304 14,917
Gozo and Comino 679 675 726
Total 14,062 13,979 15,643
Table 40. Road traffic accidents, cases by region
Table 39. Licensed motor vehicles
24
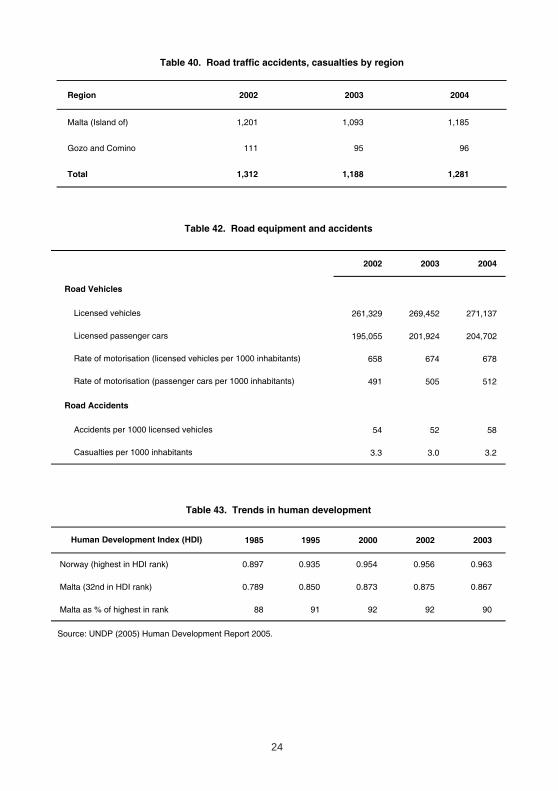
Region 2002 2003 2004
Malta (Island of) 1,201 1,093 1,185
Gozo and Comino 111 95 96
Total 1,312 1,188 1,281
Table 40. Road traffic accidents, casualties by region
2002 2003 2004
261,329 269,452 271,137
195,055 201,924 204,702
658 674 678
491 505 512
54 52 58
3.3 3.0 3.2
1985 1995 2000 2002 2003
Norway (highest in HDI rank) 0.897 0.935 0.954 0.956 0.963
Malta (32nd in HDI rank) 0.789 0.850 0.873 0.875 0.867
Malta as % of highest in rank 88 91 92 92 90
Source: UNDP (2005) Human Development Report 2005.
Human Development Index (HDI)
Table 43. Trends in human development
Licensed vehicles
Licensed passenger cars
Table 42. Road equipment and accidents
Rate of motorisation (licensed vehicles per 1000 inhabitants)
Road Vehicles
Accidents per 1000 licensed vehicles
Casualties per 1000 inhabitants
Rate of motorisation (passenger cars per 1000 inhabitants)
Road Accidents

25
2001 2002 2003 2004
ESA 95 Lm'000 Lm'000 Lm'000 Lm'000
Code
PRODUCTION APPROACH
P.1 Output of goods and services (at basic prices) 3,140,113 3,188,412 3,320,717 3,380,318
P.2 Intermediate consumption (at purchasers' prices) 1,612,326 1,624,812 1,715,142 1,801,109
B.1g Gross value added (at basic prices) 1,527,787 1,563,600 1,605,575 1,579,209
D.21 Taxes on products 223,468 242,512 234,685 264,871
D.31 Subsidies on products 13,560 9,291 11,192 13,674
B.1*g Gross Domestic Product (ESA 95) 1,737,695 1,796,821 1,829,068 1,830,406
EXPENDITURE APPROACH
P.3 Total final consumption expenditure 1,494,402 1,526,592 1,584,452 1,630,550
P.3 Household final consumption expenditure 1,108,963 1,118,916 1,155,236 1,180,417
P.3 NPISH final consumption expenditure 26,808 29,573 30,962 31,912
P.3 General government final consumption expenditure 358,631 378,103 398,254 418,221
P.5 Gross capital formation 321,794 251,239 319,403 332,463
P.51 Gross fixed capital formation 332,797 280,363 363,062 380,802
P.52 Changes in inventories -23,301 -34,550 -47,059 -54,339
P.53 Acquisitions less disposals of valuables 12,298 5,426 3,400 6,000
P.6 Exports of goods and services 1,409,132 1,492,598 1,447,776 1,393,428
P.7 Imports of goods and services 1,487,633 1,473,608 1,522,563 1,526,035
B.1*g Gross Domestic Product (ESA 95) 1,737,695 1,796,821 1,829,068 1,830,406
INCOME APPROACH
D.1 Compensation of employees 797,558 819,909 852,385 857,542
B.2g+B.3g Gross operating surplus and mixed income 737,662 764,362 773,468 728,153
D.2 Taxes on production and imports 229,799 249,881 242,886 280,225
D.3 Subsidies 27,323 37,328 39,667 35,517
B.1*g Gross Domestic Product (ESA 95) 1,737,695 1,796,821 1,829,068 1,830,406
D.1 Compensation of employees received from the
rest of the world 2,443 3,459 4,714 5,470
D.1 Compensation of employees paid to the rest of the world 3,078 3,463 3,774 4,137
D.2 Taxes on production and imports paid to the Institutions of the EU 0 0 0 5,988
D.3 Subsidies received from the Institutions of the EU 0 0 0 1,290
D.4 Property income received from the rest of the world 370,463 357,682 326,663 322,264
D.4 Property income paid to the rest of the world 358,721 355,124 338,946 345,121
B.5*g Gross National Income (ESA 95) 1,748,802 1,799,375 1,817,725 1,804,184
THE ECONOMY
Table 44. GDP and GNI (ESA 1995)

26
ESA 95 2001 2002 2003 2004Code Lm'000 Lm'000 Lm'000 Lm'000
P.1 Output 3,140,113 3,188,412 3,320,717 3,380,318
P.2 Intermediate consumption 1,612,326 1,624,812 1,715,142 1,801,109
B.1g Value added, gross 1,527,787 1,563,600 1,605,575 1,579,209
K.1 Consumption of fixed capital 249,347 252,197 261,762 288,177
B.1n Value added, net 1,278,440 1,311,403 1,343,813 1,291,032
B.1n Value added, net 1,278,440 1,311,403 1,343,813 1,291,032
D.1 Compensation of employees 797,558 819,909 852,385 857,542
D.29 Other taxes on production 6,328 7,365 8,196 15,354
D.39 Other subsidies on production ( - ) 13,761 28,036 28,474 21,840
B.2 Operating surplus 488,315 512,165 511,706 439,976
ESA 95 2001 2002 2003 2004 Code Lm'000 Lm'000 Lm'000 Lm'000
B.1g Value added, gross (at basic prices) 1,527,787 1,563,600 1,605,575 1,579,209
D.21 add Taxes on products 223,468 242,511 234,686 264,872
D.31 less Subsidies on products 13,560 9,293 11,193 13,674
B.1*g GDP at market prices 1,737,695 1,796,821 1,829,068 1,830,407
Rate of growth 2.4% 3.4% 1.8% 0.1%
Table 45. Production and generation of income accounts
Total economy
Gross Domestic Product
Generation of income account
Production account

27
2001 2002 2003 2004
ESA 95 Lm'000 Lm'000 Lm'000 Lm'000Code
P.3 Total final consumption expenditure 1,443,967 1,453,541 1,490,774 1,482,980
P.3 Household final consumption expenditure 1,090,075 1,085,287 1,111,681 1,097,957
P.3 NPISH final consumption expenditure 25,417 26,669 27,360 27,042
P.3 General government final consumption expenditure 328,476 341,586 351,733 357,981
P.5 Gross capital formation 310,915 233,646 295,557 304,768
P.51 Gross fixed capital formation 321,306 261,188 335,941 348,558
P.52 Changes in inventories -22,380 -32,671 -43,515 -49,225
P.53 Acquisitions less disposals of valuables 11,989 5,130 3,131 5,435
P.6 Exports of goods and services 1,537,989 1,593,210 1,559,676 1,566,307
P.7 Imports of goods and services 1,590,363 1,553,005 1,661,717 1,694,669
B.1*g Gross Domestic Product (ESA 95) 1,702,508 1,727,393 1,684,290 1,659,386
Rate of Growth 0.4% 1.5% -2.5% -1.5%
Table 46. GDP by category of expenditure at constant 2000 prices
2001 2002 2003 2004
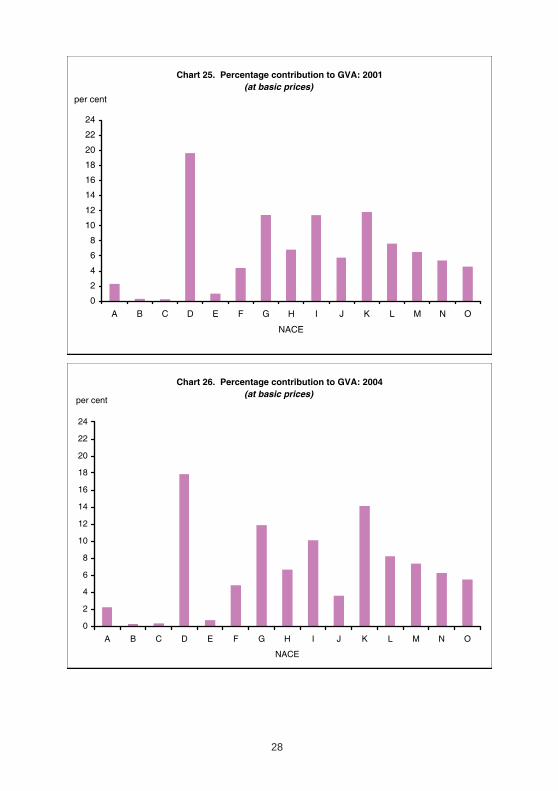
A Agriculture, hunting and forestry 2.29 2.25 2.27 2.24
B Fishing 0.29 0.31 0.29 0.27
C Mining and quarrying 0.24 0.28 0.32 0.35
D Manufacturing 19.62 19.64 19.50 17.87
E Electricity, gas and water supply 1.83 1.87 1.39 0.72
F Construction 4.39 4.47 4.52 4.84
G Wholesale and retail trade; repair of motor vehicles, motorcycles and personal and household goods 11.42 11.38 11.47 11.89
H Hotels and restaurants 6.83 6.86 6.78 6.65
I Transport, storage and communication 11.39 10.34 9.69 10.11
J Financial intermediation 5.77 5.22 4.82 3.59
K Real estate, renting and business activities 11.81 12.31 13.14 14.16
L Public administration and defence; compulsory social security 7.62 7.62 7.87 8.22
M Education 6.51 6.76 6.92 7.36
N Health and social work 5.39 5.65 5.77 6.26
O Other community, social and personal service activities** 4.57 5.05 5.24 5.49
Gross Value Added 100.00 100.00 100.00 100.00
** Including private households with employed persons (NACE P)
NACE
Table 47. Percentage contribution to Gross Value Added (at basic prices)
28
Chart 25. Percentage contribution to GVA: 2001 (at basic prices)
0
2
4
6
8
10
12
14
16
18
20
22
24
A B C D E F G H I J K L M N O
NACE
per cent
Chart 26. Percentage contribution to GVA: 2004 (at basic prices)
0
2
4
6
8
10
12
14
16
18
20
22
24
A B C D E F G H I J K L M N O
NACE
per cent

29
2001 2002 2003 2004 2001 2002 2003 2004
EU Member States
Austria (AT) 25,400 25,800 26,300 27,800 122.1 120.0 120.9 122.7
Belgium (BE) 24,400 25,300 25,700 26,800 117.3 117.6 118.1 118.4
Cyprus (CY) 17,300 17,700 17,400 18,700 82.9 82.0 79.9 82.8
Czech Republic (CZ) 13,500 14,300 14,700 15,900 64.9 66.4 67.9 70.3
Denmark (DK) 26,000 26,100 26,300 27,600 125.0 121.4 121.1 121.8
Estonia (EE) 8,800 9,700 10,500 11,600 42.2 45.1 48.3 51.2
Finland (FI) 23,500 24,200 24,200 25,400 112.8 112.2 111.2 112.3
France (FR) 23,800 24,200 24,200 24,800 114.1 112.2 111.4 109.3
Germany (DE) 22,900 23,400 23,600 24,600 110.0 108.7 108.4 108.7
Greece (EL) 15,300 16,600 17,600 18,600 73.3 77.2 81.1 82.0
Hungary (HU) 11,600 12,500 12,900 13,600 55.8 58.1 59.3 60.1
Ireland (IE) 26,900 28,600 29,100 31,000 129.0 132.9 134.2 137.1
Italy (IT) 23,300 e 23,700 e 23,400 24,000 112.0 e 110.1 e 107.9 105.8
Latvia (LV) 7,700 8,300 8,900 9,700 37.1 38.7 40.9 42.8
Lithuania (LT) 8,400 9,000 9,800 10,800 40.2 41.9 45.3 47.8
Luxembourg (LU) 44,700 47,400 50,800 54,000 214.8 220.3 233.9 238.6
Malta (MT) 15,400 16,000 15,800 15,700 74.0 74.2 72.7 69.2
Netherlands (NL) 26,500 27,000 27,100 28,200 127.1 125.3 124.8 124.4
Poland (PL) 9,600 10,000 10,200 11,100 46.1 46.3 47.0 48.8
Portugal (PT) 16,600 17,100 15,800 16,400 79.9 79.5 72.9 72.4
Slovak Republic (SK) 10,000 10,900 11,200 11,700 48.0 50.5 51.5 51.9
Slovenia (SI) 15,400 16,000 16,500 17,900 73.9 74.5 76.0 79.1
Spain (ES) 19,400 20,500 21,200 22,100 93.2 95.2 97.4 97.6
Sweden (SE) 24,000 24,500 25,200 26,600 115.3 113.7 115.9 117.4
United Kingdom (UK) 23,600 25,000 25,300 26,300 113.2 116.1 116.2 116.2
Candidate Countries
Bulgaria (BG) 5,800 6,100 6,500 6,900 28.0 28.3 29.8 30.6
Romania (RO) 5,500 6,100 6,500 7,300 f 26.2 28.1 30.0 32.2 f
Turkey (TR) 5,300 5,600 f 5,800 f 6,500 f 25.7 26.1 f 26.5 f 28.5 f
Average GDP per head in PPS for EU-15
22,800 23,500 23,700 f 24,600 f 109.6 109.3 109.0 f 108.6 f
Average GDP per head in PPS for EU-25
20,800 21,500 21,700 22,700 100.0 100.0 100.0 100.0
f forecaste estimated value
Source: Eurostat database (indicators)
Table 48. Gross Domestic Product per capita
in Purchasing Power Standards 1
1 PPS is the artificial common reference currency unit used in the EU to express the volume of economic aggregates for the purpose of spatial comparisons
3 This is the volume index of GDP per capita in Purchasing Power Standards (PPS), expressed in relation to the European Union (EU-25)average set equal 100; the per capita volume index represents the real volume of GDP in per capita terms in relation to the EuropeanUnion (EU-25) average set equal 100; the per capita volume index represents the real volume of GDP in per capita terms.
2 GDP in terms of current prices, expressed in millions of PPS (Purchasing Power Standard)
Country(EU25=100) 3GDP per head in PPS 2

30
Lm'000
Aggregates 2002 2003 2004
Total revenue 770,957 873,487 921,875
less loans (Treasury) 10,563 132,129 99,948
less sale of shares (Finance) 27,341 0 0
less other extraordinary receipts (Finance) 13,250 2,137 8,899
Revenue (net of loans, sale of shares and other
extraordinary receipts) 719,802 739,221 813,027
of which:
Grants 2,721 2,517 30,310
Customs & Excise 59,813 61,576 62,309
Consumption tax 117,503 123,910 141,570
Income tax 190,175 205,218 211,177
Social security 181,142 188,427 189,657
Others 168,449 157,573 178,004
Total expenditure (Treasury)
819,324 857,405 933,909
less contribution to Sinking Fund in respect of
local and foreign loans 10,900 12,288 12,445
less direct loan repayment 947 451 14,419
Total expenditure (less contribution to Sinking Fund
and less direct loan repayment) 807,477 844,666 907,045
consisting of:
Recurrent expenditure 645,995 677,655 732,846
of which
Education 47,502 48,998 50,212
Social security (benefits) 190,749 200,922 207,458
Others 407,744 427,735 475,175
Public debt servicing (excluding contribution to the
Sinking Fund and direct loan repayment) 63,811 63,042 69,580
Capital programme 97,672 103,969 104,620
Productive investment 31,526 28,372 27,036
Infrastructure 27,391 34,095 41,693
Social 38,754 41,501 35,891
Fiscal position (Lm million)
GDP at current market prices 1,797 p 1,829 p 1,830 p
Government deficit (-) (a) -88 -105 -94
As a percentage of GDP 4.9 5.8 5.1
p provisional
Figures may not add up exactly due to rounding.
Source: The Treasury
GOVERNMENT FINANCE
(a) Made up of total expenditure (less contribution to Sinking Fund and less direct loan repayment) minus revenue (net of loans and sale of shares, and other extraordinary receipts).
Table 49. Consolidated Fund Data
Note 1: The deficit figure is exclusive to Central Government data, and is not strictly comparable to the Maastricht Criteria (which includes also the extended Government ie. Local councils and extra budgetary untis).
31
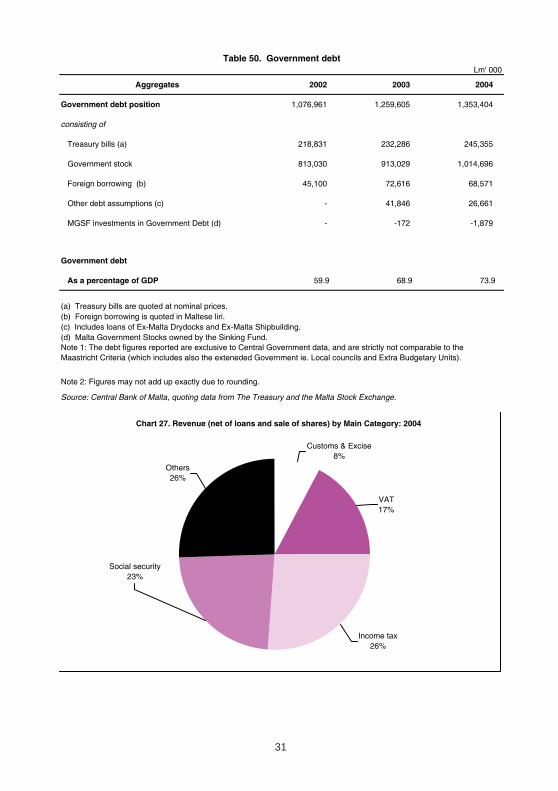
Lm' 000
Aggregates 2002 2003 2004
Government debt position 1,076,961 1,259,605 1,353,404
consisting of
Treasury bills (a) 218,831 232,286 245,355
Government stock 813,030 913,029 1,014,696
Foreign borrowing (b) 45,100 72,616 68,571
Other debt assumptions (c) - 41,846 26,661
MGSF investments in Government Debt (d) - -172 -1,879
Government debt
As a percentage of GDP 59.9 68.9 73.9
(a) Treasury bills are quoted at nominal prices.(b) Foreign borrowing is quoted in Maltese liri.(c) Includes loans of Ex-Malta Drydocks and Ex-Malta Shipbuilding.(d) Malta Government Stocks owned by the Sinking Fund.
Note 2: Figures may not add up exactly due to rounding.
Source: Central Bank of Malta, quoting data from The Treasury and the Malta Stock Exchange.
Note 1: The debt figures reported are exclusive to Central Government data, and are strictly not comparable to the Maastricht Criteria (which includes also the exteneded Government ie. Local councils and Extra Budgetary Units).
Table 50. Government debt
Chart 27. Revenue (net of loans and sale of shares) by Main Category: 2004
Social security23%
Income tax26%
VAT17%
Customs & Excise8%
Others26%

32
Chart 29. Total government expenditure (less contribution to Sinking fund and less direct loan repayment) and Recurrent revenue as a percentage of GDP
0.0
10.0
20.0
30.0
40.0
50.0
60.0
70.0
80.0
90.0
100.0
2002 2003 2004
Total expenditure Recurrent revenue GDP
Chart 30. Central Government deficit and debt as a percentage of GDP
0.0
10.0
20.0
30.0
40.0
50.0
60.0
70.0
80.0
90.0
100.0
2002 2003 2004
Central Government deficit Central Government debt GDP
Chart 28. Total expenditure (less contribution to Sinking Fund and repayment of loans)by Main Category 2004
Other recurrent57%
Capital Programme15%
Social security benefits23%
Public debt servicing8%
33
Lm '000
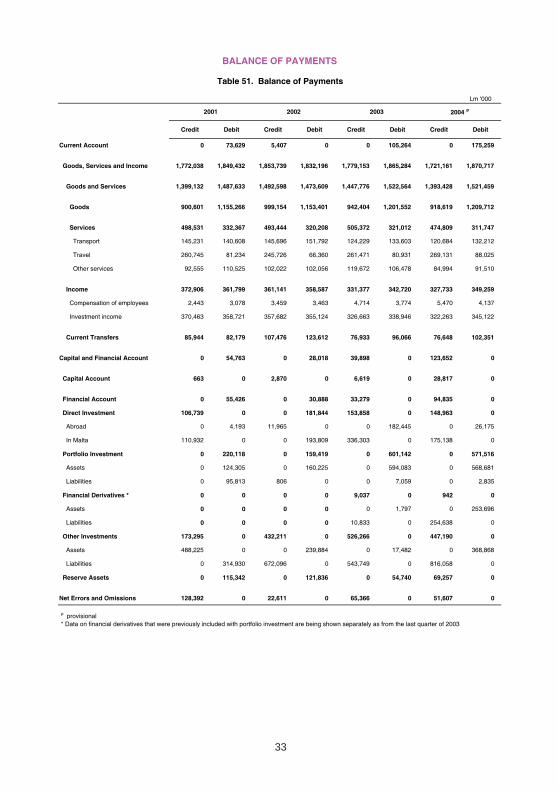
Credit Debit Credit Debit Credit Debit Credit Debit
Current Account 0 73,629 5,407 0 0 105,264 0 175,259
Goods, Services and Income 1,772,038 1,849,432 1,853,739 1,832,196 1,779,153 1,865,284 1,721,161 1,870,717
Goods and Services 1,399,132 1,487,633 1,492,598 1,473,609 1,447,776 1,522,564 1,393,428 1,521,459
Goods 900,601 1,155,266 999,154 1,153,401 942,404 1,201,552 918,619 1,209,712
Services 498,531 332,367 493,444 320,208 505,372 321,012 474,809 311,747
Transport 145,231 140,608 145,696 151,792 124,229 133,603 120,684 132,212
Travel 260,745 81,234 245,726 66,360 261,471 80,931 269,131 88,025
Other services 92,555 110,525 102,022 102,056 119,672 106,478 84,994 91,510
Income 372,906 361,799 361,141 358,587 331,377 342,720 327,733 349,259
Compensation of employees 2,443 3,078 3,459 3,463 4,714 3,774 5,470 4,137
Investment income 370,463 358,721 357,682 355,124 326,663 338,946 322,263 345,122
Current Transfers 85,944 82,179 107,476 123,612 76,933 96,066 76,648 102,351
Capital and Financial Account 0 54,763 0 28,018 39,898 0 123,652 0
Capital Account 663 0 2,870 0 6,619 0 28,817 0
Financial Account 0 55,426 0 30,888 33,279 0 94,835 0
Direct Investment 106,739 0 0 181,844 153,858 0 148,963 0
Abroad 0 4,193 11,965 0 0 182,445 0 26,175
In Malta 110,932 0 0 193,809 336,303 0 175,138 0
Portfolio Investment 0 220,118 0 159,419 0 601,142 0 571,516
Assets 0 124,305 0 160,225 0 594,083 0 568,681
Liabilities 0 95,813 806 0 0 7,059 0 2,835
Financial Derivatives * 0 0 0 0 9,037 0 942 0
Assets 0 0 0 0 0 1,797 0 253,696
Liabilities 0 0 0 0 10,833 0 254,638 0
Other Investments 173,295 0 432,211 0 526,266 0 447,190 0
Assets 488,225 0 0 239,884 0 17,482 0 368,868
Liabilities 0 314,930 672,096 0 543,749 0 816,058 0
Reserve Assets 0 115,342 0 121,836 0 54,740 69,257 0
Net Errors and Omissions 128,392 0 22,611 0 65,366 0 51,607 0
p provisional * Data on financial derivatives that were previously included with portfolio investment are being shown separately as from the last quarter of 2003
2004 p
BALANCE OF PAYMENTS
Table 51. Balance of Payments
20032001 2002

34
Lm million
2001 2002 2003 2004 p
In Malta 110.9 -193.9 336.3 175.1
Abroad -4.2 12.0 -182.4 -26.2
p provisional
Table 52. Direct investment
Chart 31. Current Account balance
-400
-300
-200
-100
0
100
200
300
2002 2003 2004
Lm m
illio
n
Trade balance Travel (net) Current Account balance
Chart 32. Direct investment
-300.0
-200.0
-100.0
0.0
100.0
200.0
300.0
400.0
2002 2003 2004
Lm m
illio
n
-200
-150
-100
-50
0
50Lm
mill
ion
Malta Abroad (refer to right axis)
35
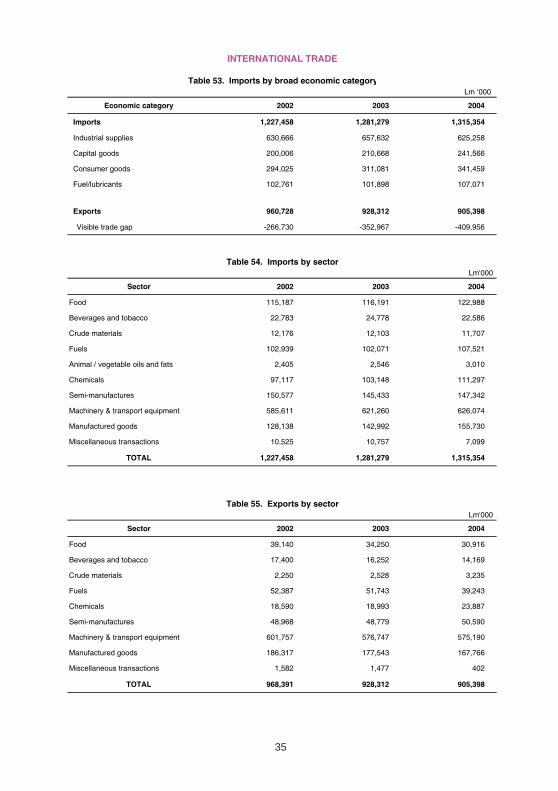
Lm ‘000
Economic category 2002 2003 2004
Imports 1,227,458 1,281,279 1,315,354
Industrial supplies 630,666 657,632 625,258
Capital goods 200,006 210,668 241,566
Consumer goods 294,025 311,081 341,459
Fuel/lubricants 102,761 101,898 107,071
Exports 960,728 928,312 905,398
Visible trade gap -266,730 -352,967 -409,956
Lm'000
Sector 2002 2003 2004
Food 115,187 116,191 122,988
Beverages and tobacco 22,783 24,778 22,586
Crude materials 12,176 12,103 11,707
Fuels 102,939 102,071 107,521
Animal / vegetable oils and fats 2,405 2,546 3,010
Chemicals 97,117 103,148 111,297
Semi-manufactures 150,577 145,433 147,342
Machinery & transport equipment 585,611 621,260 626,074
Manufactured goods 128,138 142,992 155,730
Miscellaneous transactions 10,525 10,757 7,099
TOTAL 1,227,458 1,281,279 1,315,354
Lm'000
Sector 2002 2003 2004
Food 39,140 34,250 30,916
Beverages and tobacco 17,400 16,252 14,169
Crude materials 2,250 2,528 3,235
Fuels 52,387 51,743 39,243
Chemicals 18,590 18,993 23,887
Semi-manufactures 48,968 48,779 50,590
Machinery & transport equipment 601,757 576,747 575,190
Manufactured goods 186,317 177,543 167,766
Miscellaneous transactions 1,582 1,477 402
TOTAL 968,391 928,312 905,398
INTERNATIONAL TRADE
Table 55. Exports by sector
Table 54. Imports by sector
Table 53. Imports by broad economic category
36
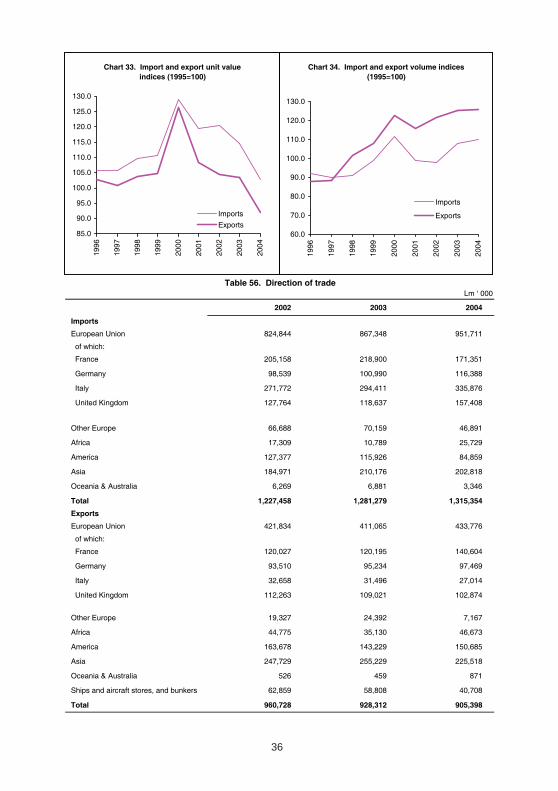
2002 2003 2004
Imports
European Union 824,844 867,348 951,711
of which:
France 205,158 218,900 171,351
Germany 98,539 100,990 116,388
Italy 271,772 294,411 335,876
United Kingdom 127,764 118,637 157,408
Other Europe 66,688 70,159 46,891
Africa 17,309 10,789 25,729
America 127,377 115,926 84,859
Asia 184,971 210,176 202,818
Oceania & Australia 6,269 6,881 3,346
Total 1,227,458 1,281,279 1,315,354
Exports
European Union 421,834 411,065 433,776
of which:
France 120,027 120,195 140,604
Germany 93,510 95,234 97,469
Italy 32,658 31,496 27,014
United Kingdom 112,263 109,021 102,874
Other Europe 19,327 24,392 7,167
Africa 44,775 35,130 46,673
America 163,678 143,229 150,685
Asia 247,729 255,229 225,518
Oceania & Australia 526 459 871
Ships and aircraft stores, and bunkers 62,859 58,808 40,708
Total 960,728 928,312 905,398
Lm ‘ 000Table 56. Direction of trade
Chart 33. Import and export unit value indices (1995=100)
85.0
90.0
95.0
100.0
105.0
110.0
115.0
120.0
125.0
130.019
96
1997
1998
1999
2000
2001
2002
2003
2004
Imports
Exports
Chart 34. Import and export volume indices (1995=100)
60.0
70.0
80.0
90.0
100.0
110.0
120.0
130.0
1996
1997
1998
1999
2000
2001
2002
2003
2004
Imports
Exports

37
Chart 37. Total imports: 2004
European Union73%
Africa2%
Other Europe
4%
America6%
Asia15%
Oceania & Australia
0%
Chart 38. Total exports: 2004
European Union51%
Other Europe
1%
America17%
Africa5%
Other0%Asia
26%
Chart 36. Exports
0.0
200.0
400.0
600.0
800.0
1000.0
1200.0
1960
1961
1962
1963
1964
1965
1966
1967
1968
1969
1970
1971
1972
1973
1974
1975
1976
1977
1978
1979
1980
1981
1982
1983
1984
1985
1986
1987
1988
1989
1990
1991
1992
1993
1994
1995
1996
1997
1998
1999
2000
2001
2002
2003
2004
Lm m
illio
nChart 35. Imports
0.0
200.0
400.0
600.0
800.0
1000.0
1200.0
1400.0
1600.0
1960
1962
1964
1966
1968
1970
1972
1974
1976
1978
1980
1982
1984
1986
1988
1990
1992
1994
1996
1998
2000
2002
2004
Lm m
illio
n

38
Irrigated land % Dry land %
Malta 1,374 91.05 6,826 79.00
Gozo 135 8.95 1,814 21.00
Total 1,509 100.00 8,640 100.00
Source: Census of Agriculture 2001
AGRICULTURE AND FISHERIES
Table 57. Land under cultivation
RegionTotal agricultural land (Ha)
Produce 2002 2003 2004
Vegetables 39.8 38.1 41.9
Potato exports 6.1 4.1 7.9
Fruit* 2.1 2.1 2.6
* revised
Produce 2002 2003 2004
Beef (tonnes) 1,636 1,408 1,290
Pork (tonnes) 10,405 9,822 8,470
Broilers (tonnes) 6,661 7,405 6,294
Milk producer sales ('000 litres) 41,435 38,854 39,924
Estimated egg products (‘000 eggs) 99,248 98,355 99,600
tonnes
Quantity 2002 2003 2004
Swordfish 190 134 174
Dorado 347 507 473
Blue-fin Tuna 176 220 228
Other 228 145 193
2002 2003 2004
Fish price index 1995 = 100 137.89 129.52 118.98
Table 61. Fish price index
Table 59. Meat, milk and egg production
Table 58. Marketed vegetables and fruit‘000 tonnes
Table 60. Fish landings
39
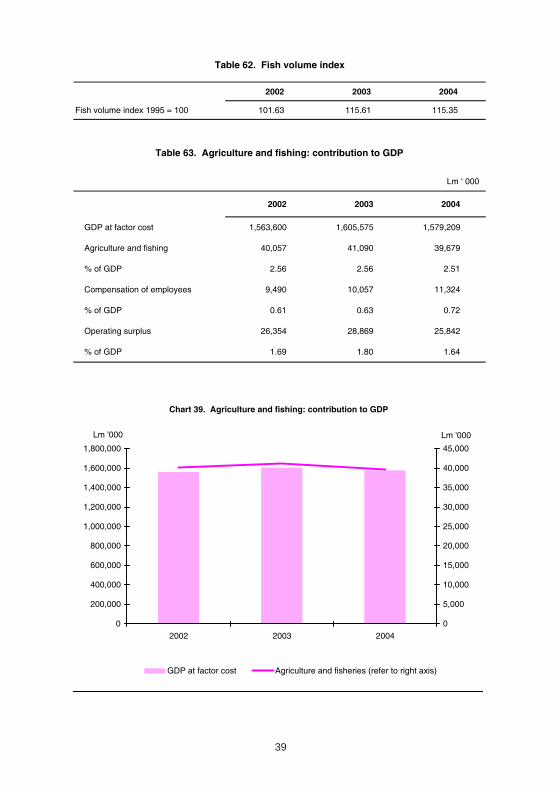
2002 2003 2004
Fish volume index 1995 = 100 101.63 115.61 115.35
2002 2003 2004
GDP at factor cost 1,563,600 1,605,575 1,579,209
Agriculture and fishing 40,057 41,090 39,679
% of GDP 2.56 2.56 2.51
Compensation of employees 9,490 10,057 11,324
% of GDP 0.61 0.63 0.72
Operating surplus 26,354 28,869 25,842
% of GDP 1.69 1.80 1.64
Table 63. Agriculture and fishing: contribution to GDP
Lm ‘ 000
Table 62. Fish volume index
Chart 39. Agriculture and fishing: contribution to GDP
0
200,000
400,000
600,000
800,000
1,000,000
1,200,000
1,400,000
1,600,000
1,800,000
2002 2003 2004
Lm '000
0
5,000
10,000
15,000
20,000
25,000
30,000
35,000
40,000
45,000
Lm '000
GDP at factor cost Agriculture and fisheries (refer to right axis)

40
2002 2003 2004
Agricultural output * 105.76 102.93 102.03
Vegetables 111.85 98.00 100.30
Potatoes 117.52 118.97 106.69
Fruit 111.62 116.97 100.65
Animals 102.78 101.76 105.01
Animal products 103.65 114.91 109.67
2002 2003 2004
Agricultural output * 99.74 98.63 100.47
Vegetables 93.23 97.49 102.35
Potatoes 92.33 78.16 119.71
Fruit 89.76 93.18 118.33
Animals 106.50 104.33 96.03
Animal products 95.42 91.17 90.66
2002 2003 2004
Agricultural output * 105.49 101.52 102.51
Vegetables 104.28 95.54 102.66
Potatoes 108.51 92.99 127.72
Fruit 100.19 108.99 119.10
Animals 109.46 106.17 100.84
Animal products 98.90 104.76 99.43
* excluding secondary activities and nursery plants
Table 64. Agricultural price indices based on economic accounts for agriculture (2000 = 100)
Table 65. Agricultural volume indices based on economic accounts for agriculture (2000 = 100)
Table 66. Agricultural value indices based on economic accounts for agriculture (2000 = 100)
Chart 40. Agricultural indices based on economic accounts for agriculture
85
90
95
100
105
110
2002 2003 2004
indi
ces
Chained volume index (2000=100) Chained price index (2000=100)
Chained value index (2000=100)

41
Country of origin 2002 2003 2004
United Kingdom 467,405 473,097 452,979
Germany 148,471 125,415 135,160
Italy 88,230 92,680 102,641
France 80,273 77,382 87,146
Netherlands 42,375 40,044 38,460
Libya 25,046 17,463 12,832
Other 280,477 292,153 328,466
Total 1,132,277 1,118,234 1,157,684Source: Tourstat and embarkation cards
Accommodation categories 2002 2003 2004
TOTAL 8.9 9.0 8.6
Hotel and similar accommodation 8.8 9.0 8.6
5-star 7.0 6.8 6.4
4-star 8.7 8.9 8.7
3-star 9.7 9.8 9.4
2-star 8.2 8.9 8.2
Guesthouse 11.6 10.6 11.2
Tourist Village 8.5 9.9 8.7
Holiday complex / Aparthotel 9.7 10.5 11.0
Other Collective accommodation 18.4 14.6 15.9Sources: Tourstat
TOURISM
Table 68. Average length of stay of tourists by type of accommodation
Table 67. Departing Tourists from Malta, by country of origin
(in nights)
Chart 41. Seasonal pattern of tourist departures
38.1%36.8% 37.6%
43.8%43.8%44.2%
18.1%18.6%19.0%
0
200,000
400,000
600,000
800,000
1,000,000
1,200,000
1,400,000
2002 2003 2004
Summer Shoulder Winter

42
No. of hotelsNo. of bed-
placesNo. of hotels
No. of bed-places
No. of hotelsNo. of bed-
places
5-star hotel 11 3,738 13 5,040 13 5,040
4-star hotel 45 15,341 47 15,908 44 15,315
3-star hotel 51 11,548 53 11,668 45 10,272
2-star hotel 19 1,258 18 1,174 16 1,059
Holiday complex / Apart-hotel 35 6,949 36 7,053 33 6,617
Guesthouse 36 940 40 1,044 38 979
Hostel 2 166 3 236 5 488
Total 189 39,940 210 42,123 194 39,770
Source: Malta Tourism Authority
2004
Table 69. Collective accommodation and bed-places
2003
Accommodation
2002
Chart 42. Cruise passengers and cruise ships visiting Malta .
0
20,000
40,000
60,000
80,000
100,000
120,000
140,000
160,000
180,000
Q1 Q2 Q3 Q4 Q1 Q2 Q3 Q4 Q1 Q2 Q3 Q4
2002 2003 2004
no. o
f pas
seng
ers
0
20
40
60
80
100
120
140
160
180
no. o
f ves
selsPassenges
Vessels

43
Lm ‘000
2002 2003p 2004p
Travel receipts 245,726 261,471 269,131
Travel expenditures 66,360 80,931 88,025
Net travel account 179,366 180,540 181,106
Net amount for all economic sectors (current account)
5,407 -108,021 -186,828
Travel receipts 245,726 261,471 269,131
of which:
accommodation expenses
(includes hotels, guesthouses, complexes and private residences) 173,491 183,603 199,317
Accommodation as a percentage of travel receipts 70.6 70.2 74.1
Services receipts from abroad 493,444 504,290 472,080
Travel receipts as a percentage of services receipts 49.8 51.8 57.0
Travel ratio 1 3.70 3.23 3.06
Normalised travel ratio 2 0.57 0.53 0.51
p provisional
Table 70. Travel account in the Balance of Payments
1 measured by dividing credits by debits. A ratio greater than 1 indicates a country is a net exporter of tourism (receipts are greater than expenditures)
2 measured as follows: (credits - debits/credits + debits). A ratio equal to +1 indicates a country exporting only tourism services
44
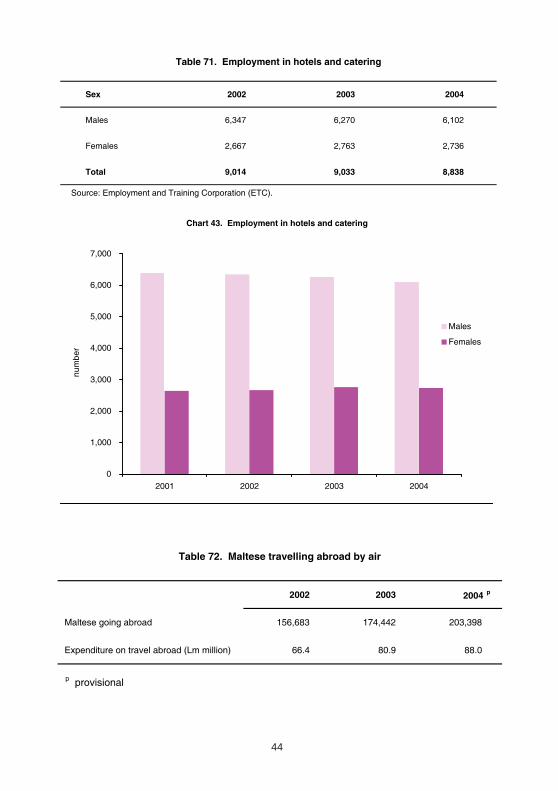
Sex 2002 2003 2004
Males 6,347 6,270 6,102
Females 2,667 2,763 2,736
Total 9,014 9,033 8,838
Source: Employment and Training Corporation (ETC).
Table 71. Employment in hotels and catering
Chart 43. Employment in hotels and catering
0
1,000
2,000
3,000
4,000
5,000
6,000
7,000
2001 2002 2003 2004
num
ber
Males
Females
2002 2003 2004 p
Maltese going abroad 156,683 174,442 203,398
Expenditure on travel abroad (Lm million) 66.4 80.9 88.0
p provisional
Table 72. Maltese travelling abroad by air

45
2002 2003 2004 2002 2003 2004
Food and Beverages 3,118 3,146 3,046 16,124 17,242 16,934
Tobacco products 150 160 158 1,080 1,204 1,215
Textiles and textile products 795 796 1,058 3,261 3,295 5,346
Wearing apparel and clothes 3,027 2,164 1,637 13,230 10,155 7,864
Leather and leather products 696 527 421 2,804 2,367 1,878
Wood and wood products 46 46 31 160 165 112
Paper and paper products 311 282 285 1,711 1,798 1,820
Publishing and printing 1,547 1,640 1,625 9,556 10,888 11,592
Chemicals and chemical products 1,051 1,059 802 6,624 6,871 5,346
Rubber and plastic products 1,928 1,718 1,818 10,706 10,677 11,107
Other non-metallic mineral products 658 685 669 2,861 3,100 3,094
Basic metals products 56 48 295 266
Fabricated metal products 684 666 649 3,721 3,803 3,930
Machinery and equipment n.e.c. 389 384 427 2,096 2,187 2,443
Office machinery and computers 20 19 102 90
Electrical machinery and apparatus 1,220 1,183 1,148 7,281 7,660 7,424
Radio, TV and Communication equipment 3,133 3,277 3,048 20,762 22,891 21,866
Medical, precision and optical instruments 1,004 992 1,180 5,512 6,343 7,199
Motor vehicles, trailers and semi-trailers 55 48 54 197 182 213
Other transport equipment 163 218 233 955 1,840 1,807
Furniture and Manufacturing n.e.c. 1,748 1,720 1,560 9,680 10,307 9,699
Totals 21,797 20,776 19,848 118,718 123,331 120,891
Note: Totals may not add up due to rounding.
MANUFACTURING
Table 73. Average annual employment and wages and salaries
Average annual employment Wages & salaries ( Lm'000 )
in manufacturing industry
Sector
Chart 44. Average annual employment in manufacturing
18,000
19,000
20,000
21,000
22,000
2002 2003 2004
num
ber
Chart 45. Annual wages and salaries in manufacturing
100,000
105,000
110,000
115,000
120,000
125,000
2002 2003 2004
Lm'0
00

46
( Lm )
2002 2003 2004 2002 2003 2004
Food and Beverages 5,171 5,480 5,560 38,059 39,535 38,089
Tobacco products 7,200 7,528 7,680 199,753 188,507 212,869
Textiles and textile products 4,102 4,140 5,052 22,167 19,461 25,441
Wearing apparel and clothes 4,371 4,692 4,803 20,196 24,629 23,116
Leather and leather products 4,029 4,496 4,459 19,892 20,705 18,686
Wood and wood products 3,478 3,585 3,644 10,261 10,807 12,362
Paper and paper products 5,502 6,371 6,382 23,466 26,365 26,299
Publishing and printing 6,177 6,640 7,135 27,684 30,083 29,909
Chemicals and chemical products 6,303 6,488 6,664 33,174 35,066 36,029
Rubber and plastic products 5,553 6,216 6,110 20,470 22,124 21,405
Other non-metallic mineral products 4,348 4,528 4,625 21,014 20,839 21,951
Basic metals products 5,268 5,579 7,000 5,825
Fabricated metal products 5,440 5,708 6,058 23,232 23,559 21,764
Machinery and equipment n.e.c. 5,388 5,699 5,724 27,784 33,678 29,301
Office machinery and computers 5,100 4,861 58,050 44,354
Electrical machinery and apparatus 5,968 6,473 6,467 33,181 32,182 39,677
Radio, TV and Communication equipment 6,627 6,985 7,173 146,581 148,524 158,806
Medical, precision and optical instruments 5,490 6,394 6,102 22,731 27,205 30,055
Motor vehicles, trailers and semi-trailers 3,582 3,767 3,966 12,927 15,074 11,863
Other transport equipment 5,859 8,461 7,770 44,742 73,801 56,137
Furniture and Manufacturing n.e.c. 5,538 5,994 6,218 30,245 28,605 28,881
Totals 5,446 5,936 6,091 45,495 49,498 50,975
Note: Totals may not add up due to rounding.
Sector
in manufacturing industryTable 74. Average annual earnings and sales per employee
Average annual sales
per employee
Average annual earnings
per employee
Chart 46. Average annual earnings per employee in manufacturing
5,000
5,200
5,400
5,600
5,800
6,000
6,200
2002 2003 2004
Lm
Chart 47. Average annual sales per employee in manufacturing
40000
42000
44000
46000
48000
50000
52000
2002 2003 2004
Lm
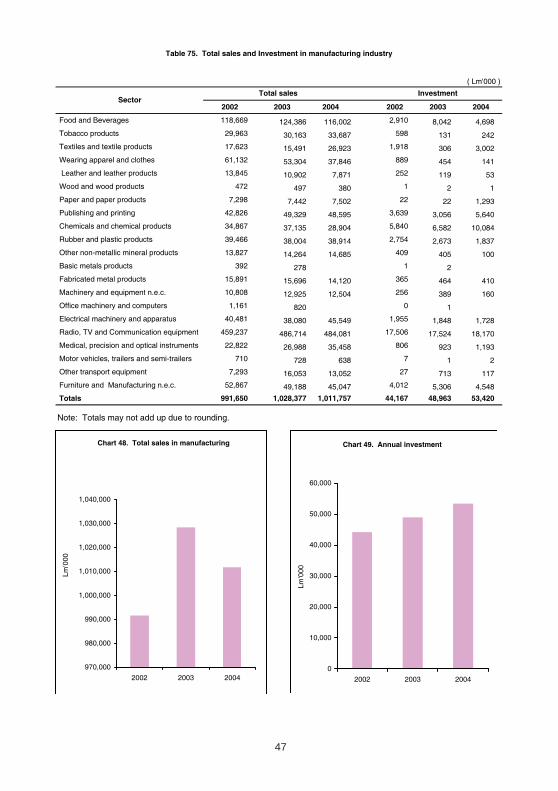
47
( Lm'000 )
2002 2003 2004 2002 2003 2004
Food and Beverages 118,669 124,386 116,002 2,910 8,042 4,698
Tobacco products 29,963 30,163 33,687 598 131 242
Textiles and textile products 17,623 15,491 26,923 1,918 306 3,002
Wearing apparel and clothes 61,132 53,304 37,846 889 454 141
Leather and leather products 13,845 10,902 7,871 252 119 53
Wood and wood products 472 497 380 1 2 1
Paper and paper products 7,298 7,442 7,502 22 22 1,293
Publishing and printing 42,826 49,329 48,595 3,639 3,056 5,640
Chemicals and chemical products 34,867 37,135 28,904 5,840 6,582 10,084
Rubber and plastic products 39,466 38,004 38,914 2,754 2,673 1,837
Other non-metallic mineral products 13,827 14,264 14,685 409 405 100
Basic metals products 392 278 1 2
Fabricated metal products 15,891 15,696 14,120 365 464 410
Machinery and equipment n.e.c. 10,808 12,925 12,504 256 389 160
Office machinery and computers 1,161 820 0 1
Electrical machinery and apparatus 40,481 38,080 45,549 1,955 1,848 1,728
Radio, TV and Communication equipment 459,237 486,714 484,081 17,506 17,524 18,170
Medical, precision and optical instruments 22,822 26,988 35,458 806 923 1,193
Motor vehicles, trailers and semi-trailers 710 728 638 7 1 2
Other transport equipment 7,293 16,053 13,052 27 713 117
Furniture and Manufacturing n.e.c. 52,867 49,188 45,047 4,012 5,306 4,548
Totals 991,650 1,028,377 1,011,757 44,167 48,963 53,420
Note: Totals may not add up due to rounding.
Table 75. Total sales and Investment in manufacturing industry
Total sales InvestmentSector
Chart 48. Total sales in manufacturing
970,000
980,000
990,000
1,000,000
1,010,000
1,020,000
1,030,000
1,040,000
2002 2003 2004
Lm'0
00
Chart 49. Annual investment
0
10,000
20,000
30,000
40,000
50,000
60,000
2002 2003 2004
Lm'0
00

48
Methodological Notes:
1. For 2002 all enterprises are classified in accordance with NACE Rev. 1
(Nomenclature des Activités Economiques dans les Communatées Européennes),
and with NACE Rev 1.1 from 2003 onwards. Few changes were carried out and their
effect on the sectors in manufacturing industry was minimal.
2. Employment is inclusive of all part-time employees and outworkers. As regards to
Tables. 73 & 74: Average annual employment, is worked out on average taken on the
total employment in manufacturing sectors at the end-of-month figures marking the
end of every quarter, i.e. March, June, September and December.
3. Gross wages and salaries are inclusive of all basic wages and salaries payable at
regular intervals, overtime, night shift and other allowances, bonuses and
commissions. Employers’ social security contributions are excluded.
4. Total Sales are made up of all local sales, which are exclusive of VAT and exports on
an FOB basis.
5. Investment refers to new investment during the reference period. These are tangible
capital goods for own company use but not for speculative use. They have a useful
life of more than one year. Any additions, alterations, improvements or renovations
prolonging the service life or to increase the productive capacity of capital goods are
taken into account. Excluded from the definition are current maintenance costs as well
as investment in capital goods used under rental and lease contracts, intangible
goods (patents, trade marks), financial assets and goods acquired through mergers.
Computer software is regarded as investment if its life is over one year and if it is of a
relatively considerable value.
Data for 2004 are provisional.

49
Males Females Total Males Females Total Males Females Total
Employed 102,120 46,283 148,403 101,159 45,883 147,042 102,801 45,301 148,102
Unemployed 6,715 4,160 10,875 8,502 4,094 12,596 6,297 4,739 11,036
Inactive 48,085 111,659 159,744 47,766 113,210 160,976 48,311 113,552 161,863
Total 156,920 162,102 319,022 157,427 163,187 320,614 157,409 163,592 321,001
Employed 65.08 28.55 46.52 64.26 28.12 45.86 65.31 27.69 46.14
Unemployed 4.28 2.57 3.41 5.40 2.51 3.93 4.00 2.90 3.44
Inactive 30.64 68.88 50.07 30.34 69.37 50.21 30.69 69.41 50.42
Total 100.00 100.00 100.00 100.00 100.00 100.00 100.00 100.00 100.00
Males Females Total Males Females Total Males Females Total
2002 79.1 37.6 58.5 74.2 34.5 54.5 6.2 8.2 6.8
2003 79.5 36.7 58.3 73.3 33.7 53.7 7.8 8.2 7.9
2004 78.9 37.0 58.1 74.3 33.5 54.0 5.8 9.5 6.9
Note: Data refer to the December issues of the Labour Force Survey.
EMPLOYMENT
2003Labour Status
2002
percentage
Table 76. Labour status
2004
Table 77. Activity, employment and unemployment rate
MonthActivity rate Employment rate Unemployment rate
Chart 50. Labour status: males
0
20,000
40,000
60,000
80,000
100,000
120,000
2002 2003 2004
Employed Unemployed Inactive
Chart 51. Labour status: females
0
20,000
40,000
60,000
80,000
100,000
120,000
2002 2003 2004
Employed Unemployed Inactive

50
Males Females Total Males Females Total Males Females Total
15-24 16,069 13,955 30,024 14,471 13,298 27,769 15,450 12,530 27,980
25-34 23,488 12,325 35,813 23,985 12,931 36,916 24,132 13,861 37,993
35-44 24,142 9,566 33,708 23,494 8,520 32,014 26,389 7,968 34,357
45-54 27,103 8,039 35,142 27,683 7,593 35,276 25,372 8,414 33,786
55-64 10,338 2,222 12,560 10,620 3,045 13,665 10,255 2,389 12,644
65+ 980u 176u 1,156u 906u 496u 1,402u 1203
u139
u1342
u
Total 102,120 46,283 148,403 101,159 45,883 147,042 102,801 45,301 148,102
15-24 15.7 30.2 20.2 14.3 29.0 18.9 15.0 27.6 18.9
25-34 23.0 26.6 24.1 23.7 28.2 25.1 23.5 30.6 25.7
35-44 23.6 20.7 22.7 23.2 18.6 21.8 25.6 17.6 23.2
45-54 26.5 17.4 23.7 27.4 16.5 24.0 24.7 18.6 22.8
55-64 10.1 4.8 8.5 10.5 6.6 9.3 10.0 5.3 8.5
65+ 1.0 0.4 0.8 0.9 1.1 1.0 1.2 0.3 0.9
Total 100.0 100.0 100.0 100.0 100.0 100.0 100.0 100.0 100.0
u under-represented
2003 2004
percentage
Table 78. Total employed persons by age distribution
Age group2002
Chart 52. Persons employed on a full-time basis by age group: 2004 .
0
5000
10000
15000
20000
25000
30000
15 - 24 25 - 34 35 - 44 45 - 54 55 -64 65 +
persons
Males
Females
Chart 53. Persons employed on a part-time basis by age group: 2004 .
0
500
1000
1500
2000
2500
3000
15 - 24 25 - 34 35 - 44 45 - 54 55 -64 65 +
persons
Males
Females

51
Males Females Males Females Males Females
Armed forces 1,058u - 1,368u - 1,641u -
Legislators, senior officials and managers 11,457 2,322 11,248 2,536 10,642 2,225
Professionals 7,544 6,604 8,002 6,769 9,532 7,034
Technicians and associate professionals 13,174 7,450 13,741 6,957 12,418 8,392
Clerks 7,547 9,550 7,523 9,563 8,416 7,696
Service workers and shop and market sales workers 13,443 7,579 12,475 10,401 13,284 8,707
Skilled agricultural and fishery workers 1,552u 75u 2,427 62u 1,866
u 148
u
Craft and related trades workers 19,701 615u 18,879 733u 20,759 647u
Plant and machine operators and assemblers
11,051 6,846 11,245 4,546 10,370 5,421
Elementary occupations 15,593 5,242 14,251 4,316 13,873 5,031
Total 102,120 46,283 101,159 45,883 102,801 45,301
u under-represented
Males Females Males Females Males Females
Agriculture, hunting and forestry 2,409 182u 2,303 185u 1,833
u 203
u
Fishing 284u 69u 560u - 494u -
Mining and quarrying 730u - 956u 79u 992
u -
Manufacturing 18,983 9,323 20,639 7,478 20,203 7,829
Electricity, gas and water supply 3,321 427u 3,818 298u 2,734 214u
Construction 11,575 501u 10,826 388u 11,170 276u
Wholesale and retail trade; repairs of household goods and vehicles 15,020 5,798 14,330 7,820 15,909 5,667
Hotels and restaurants 8,968 4,099 7,397 4,443 8,361 4,824
Transport, storage and communication 9,967 2,785 8,661 2,648 8,840 2,147
Financial intermediation 2,891 2,866 2,670 2,649 2,633 1,462u
Real estate, renting and business activities 5,433 1,879 5,153 2,140 6,045 2,483
Public administration and defence; compulsory social security 9,304 3,203 9,908 3,340 11,356 3,903
Education 4,638 7,130 4,095 6,753 4,040 8,024
Health and social work 5,081 5,618 5,071 5,440 5,008 6,069
Other community, social and personal service activities 3,462 2,143 4,772 1,668u 2,944 1,807
u
Private households with employed persons - 191u - 417u - 161u
Extra-territorial organisations and bodies 54u 69u - 137u 239
u 232
u
Total 102,120 46,283 101,159 45,883 102,801 45,301
u under-represented
Table 79. Total employed persons by main occupation
Table 80. Total employed persons by economic activity
(Main occupation)
Occupation20042002 2003
2004Occupation
2002 2003
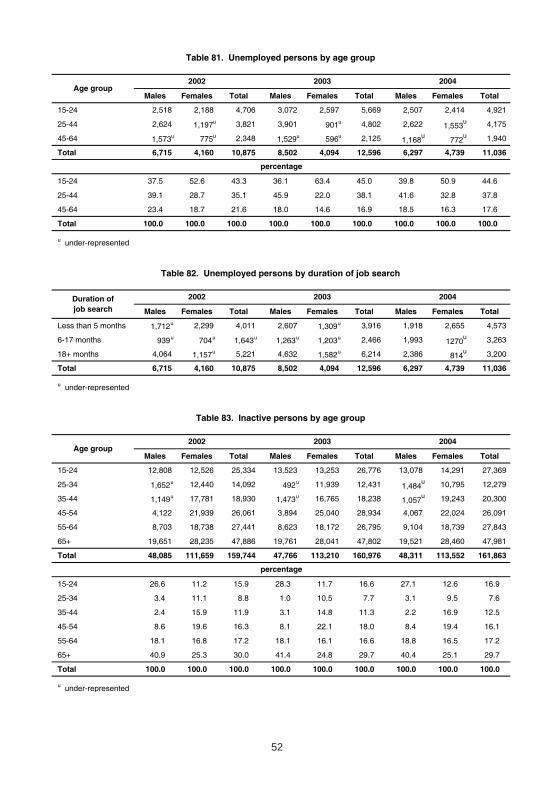
52
Males Females Total Males Females Total Males Females Total
15-24 2,518 2,188 4,706 3,072 2,597 5,669 2,507 2,414 4,921
25-44 2,624 1,197u 3,821 3,901 901u 4,802 2,622 1,553u 4,175
45-64 1,573u 775u 2,348 1,529u 596u 2,125 1,168u
772u 1,940
Total 6,715 4,160 10,875 8,502 4,094 12,596 6,297 4,739 11,036
15-24 37.5 52.6 43.3 36.1 63.4 45.0 39.8 50.9 44.6
25-44 39.1 28.7 35.1 45.9 22.0 38.1 41.6 32.8 37.8
45-64 23.4 18.7 21.6 18.0 14.6 16.9 18.5 16.3 17.6
Total 100.0 100.0 100.0 100.0 100.0 100.0 100.0 100.0 100.0
u under-represented
Males Females Total Males Females Total Males Females Total
Less than 5 months 1,712u 2,299 4,011 2,607 1,309u 3,916 1,918 2,655 4,573
6-17 months 939u 704u 1,643u 1,263u 1,203u 2,466 1,993 1270u 3,263
18+ months 4,064 1,157u 5,221 4,632 1,582u 6,214 2,386 814u 3,200
Total 6,715 4,160 10,875 8,502 4,094 12,596 6,297 4,739 11,036
u under-represented
Males Females Total Males Females Total Males Females Total
15-24 12,808 12,526 25,334 13,523 13,253 26,776 13,078 14,291 27,369
25-34 1,652u 12,440 14,092 492u 11,939 12,431 1,484u 10,795 12,279
35-44 1,149u 17,781 18,930 1,473u 16,765 18,238 1,057u 19,243 20,300
45-54 4,122 21,939 26,061 3,894 25,040 28,934 4,067 22,024 26,091
55-64 8,703 18,738 27,441 8,623 18,172 26,795 9,104 18,739 27,843
65+ 19,651 28,235 47,886 19,761 28,041 47,802 19,521 28,460 47,981
Total 48,085 111,659 159,744 47,766 113,210 160,976 48,311 113,552 161,863
15-24 26.6 11.2 15.9 28.3 11.7 16.6 27.1 12.6 16.9
25-34 3.4 11.1 8.8 1.0 10.5 7.7 3.1 9.5 7.6
35-44 2.4 15.9 11.9 3.1 14.8 11.3 2.2 16.9 12.5
45-54 8.6 19.6 16.3 8.1 22.1 18.0 8.4 19.4 16.1
55-64 18.1 16.8 17.2 18.1 16.1 16.6 18.8 16.5 17.2
65+ 40.9 25.3 30.0 41.4 24.8 29.7 40.4 25.1 29.7
Total 100.0 100.0 100.0 100.0 100.0 100.0 100.0 100.0 100.0
u under-represented
percentage
Table 82. Unemployed persons by duration of job search
Duration of job search
2002 2003 2004
Table 81. Unemployed persons by age group
Age group2002 2003 2004
percentage
Table 83. Inactive persons by age group
Age group2002 2003 2004
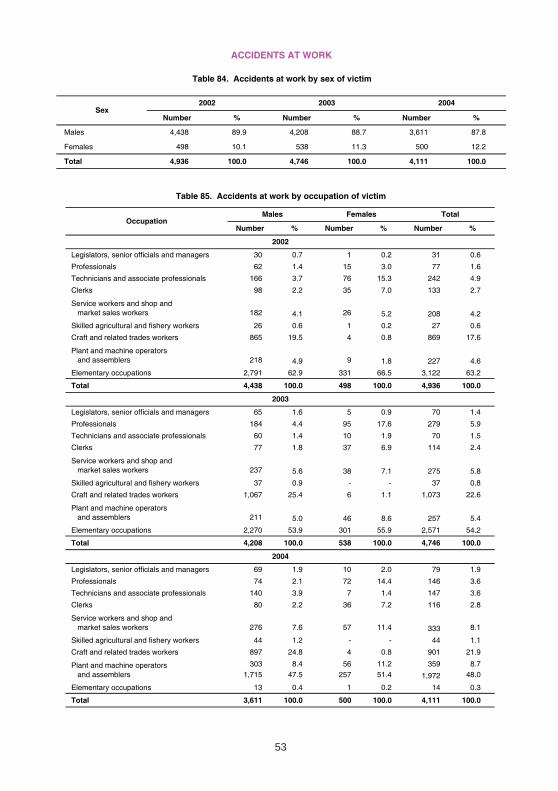
53
Number % Number % Number %
Males 4,438 89.9 4,208 88.7 3,611 87.8
Females 498 10.1 538 11.3 500 12.2
Total 4,936 100.0 4,746 100.0 4,111 100.0
ACCIDENTS AT WORK
Table 84. Accidents at work by sex of victim
2002 2003 2004Sex
Number % Number % Number %
Legislators, senior officials and managers 30 0.7 1 0.2 31 0.6
Professionals 62 1.4 15 3.0 77 1.6
Technicians and associate professionals 166 3.7 76 15.3 242 4.9
Clerks 98 2.2 35 7.0 133 2.7
Service workers and shop and market sales workers 182 4.1 26 5.2 208 4.2
Skilled agricultural and fishery workers 26 0.6 1 0.2 27 0.6
Craft and related trades workers 865 19.5 4 0.8 869 17.6
Plant and machine operators and assemblers 218 4.9 9 1.8 227 4.6
Elementary occupations 2,791 62.9 331 66.5 3,122 63.2
Total 4,438 100.0 498 100.0 4,936 100.0
Legislators, senior officials and managers 65 1.6 5 0.9 70 1.4
Professionals 184 4.4 95 17.6 279 5.9
Technicians and associate professionals 60 1.4 10 1.9 70 1.5
Clerks 77 1.8 37 6.9 114 2.4
Service workers and shop and market sales workers 237 5.6 38 7.1 275 5.8
Skilled agricultural and fishery workers 37 0.9 - - 37 0.8
Craft and related trades workers 1,067 25.4 6 1.1 1,073 22.6
Plant and machine operators and assemblers 211 5.0 46 8.6 257 5.4
Elementary occupations 2,270 53.9 301 55.9 2,571 54.2
Total 4,208 100.0 538 100.0 4,746 100.0
Legislators, senior officials and managers 69 1.9 10 2.0 79 1.9
Professionals 74 2.1 72 14.4 146 3.6
Technicians and associate professionals 140 3.9 7 1.4 147 3.6
Clerks 80 2.2 36 7.2 116 2.8
Service workers and shop and market sales workers 276 7.6 57 11.4 333 8.1
Skilled agricultural and fishery workers 44 1.2 - - 44 1.1
Craft and related trades workers 897 24.8 4 0.8 901 21.9
Plant and machine operators 303 8.4 56 11.2 359 8.7 and assemblers 1,715 47.5 257 51.4 1,972 48.0
Elementary occupations 13 0.4 1 0.2 14 0.3
Total 3,611 100.0 500 100.0 4,111 100.0
2002
2003
2004
Males Females Total
Table 85. Accidents at work by occupation of victim
Occupation
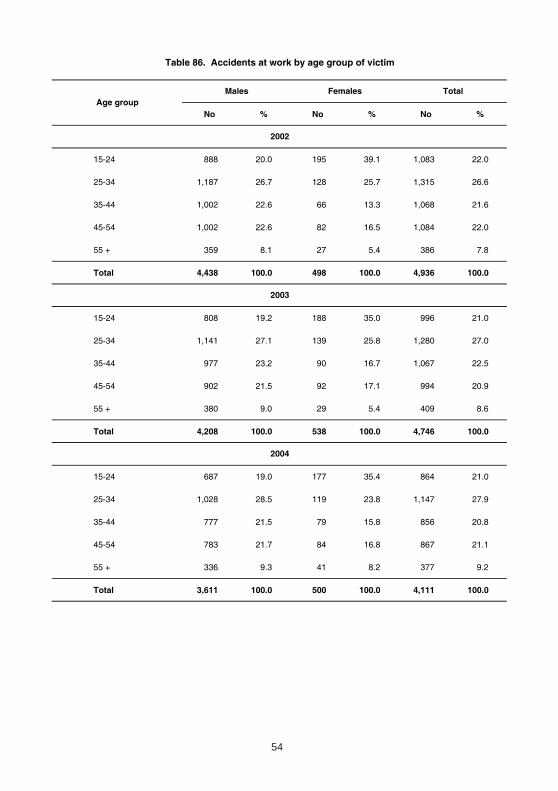
54
No % No % No %
15-24 888 20.0 195 39.1 1,083 22.0
25-34 1,187 26.7 128 25.7 1,315 26.6
35-44 1,002 22.6 66 13.3 1,068 21.6
45-54 1,002 22.6 82 16.5 1,084 22.0
55 + 359 8.1 27 5.4 386 7.8
Total 4,438 100.0 498 100.0 4,936 100.0
15-24 808 19.2 188 35.0 996 21.0
25-34 1,141 27.1 139 25.8 1,280 27.0
35-44 977 23.2 90 16.7 1,067 22.5
45-54 902 21.5 92 17.1 994 20.9
55 + 380 9.0 29 5.4 409 8.6
Total 4,208 100.0 538 100.0 4,746 100.0
15-24 687 19.0 177 35.4 864 21.0
25-34 1,028 28.5 119 23.8 1,147 27.9
35-44 777 21.5 79 15.8 856 20.8
45-54 783 21.7 84 16.8 867 21.1
55 + 336 9.3 41 8.2 377 9.2
Total 3,611 100.0 500 100.0 4,111 100.0
2002
2003
2004
Age group
Table 86. Accidents at work by age group of victim
Males Females Total
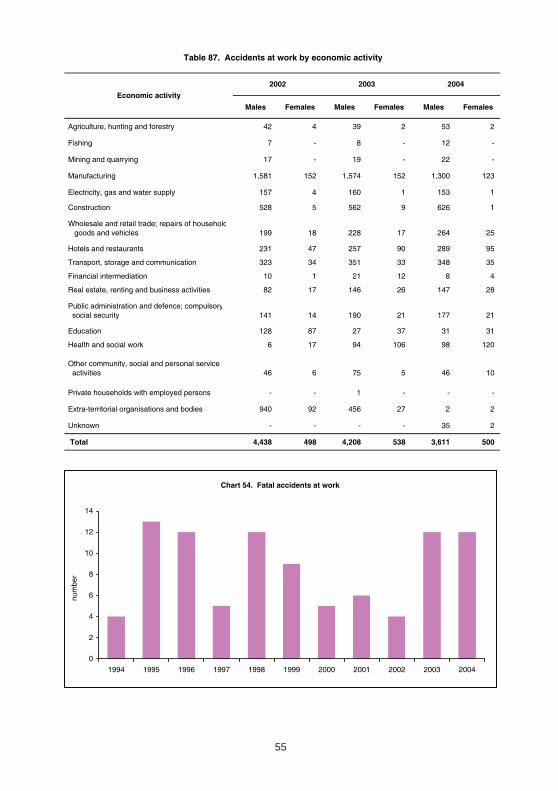
55
Males Females Males Females Males Females
Agriculture, hunting and forestry 42 4 39 2 53 2
Fishing 7 - 8 - 12 -
Mining and quarrying 17 - 19 - 22 -
Manufacturing 1,581 152 1,574 152 1,300 123
Electricity, gas and water supply 157 4 160 1 153 1
Construction 528 5 562 9 626 1
Wholesale and retail trade; repairs of household goods and vehicles 199 18 228 17 264 25
Hotels and restaurants 231 47 257 90 289 95
Transport, storage and communication 323 34 351 33 348 35
Financial intermediation 10 1 21 12 8 4
Real estate, renting and business activities 82 17 146 26 147 28
Public administration and defence; compulsory social security 141 14 190 21 177 21
Education 128 87 27 37 31 31
Health and social work 6 17 94 106 98 120
Other community, social and personal service activities 46 6 75 5 46 10
Private households with employed persons - - 1 - - -
Extra-territorial organisations and bodies 940 92 456 27 2 2
Unknown - - - - 35 2
Total 4,438 498 4,208 538 3,611 500
Table 87. Accidents at work by economic activity
Economic activity
2002 2003 2004
Chart 54. Fatal accidents at work
0
2
4
6
8
10
12
14
1994 1995 1996 1997 1998 1999 2000 2001 2002 2003 2004
num
ber
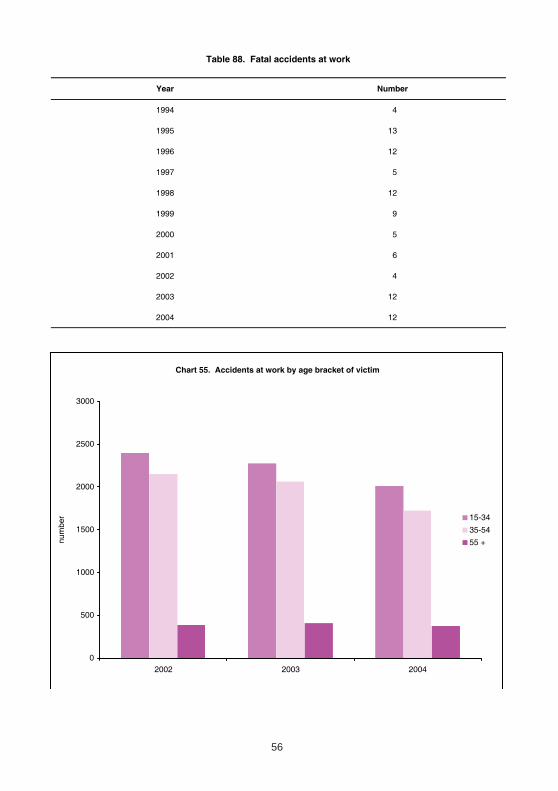
56
Year Number
1994 4
1995 13
1996 12
1997 5
1998 12
1999 9
2000 5
2001 6
2002 4
2003 12
2004 12
Table 88. Fatal accidents at work
Chart 55. Accidents at work by age bracket of victim
0
500
1000
1500
2000
2500
3000
2002 2003 2004
num
ber 15-34
35-54
55 +

57
Weight Weight1995 = 100 2002 = 100
Food 29.92 117.96 23.82 102.30 102.53
Beverages and tobacco 7.34 150.01 6.11 102.40 111.80
Clothing and footwear 10.14 91.89 8.24 92.33 90.05
Housing 5.27 122.57 7.57 102.11 105.96
Fuel, light and power 2.53 110.00 2.25 100.00 101.29
Durable household goods 9.31 105.69 7.65 99.12 101.31
Transport and communications 16.00 128.35 23.13 101.27 105.35
Personal care and health 6.47 124.25 6.22 102.62 107.86
Education, entertainment and recreation 8.31 121.24 8.84 99.27 100.44
Other goods and services 4.71 108.93 6.17 103.25 111.51
All items 100.00 118.49 100.00 100.75 103.56
CONSUMER PRICES
Table 89. Retail Prices Index
2004 2003 2002 Section
Month 2002 2003 2004
January 3.27 1.79 1.57
February 3.48 1.58 1.71
March 3.62 1.46 1.75
April 3.65 1.36 1.86
May 3.64 1.26 1.95
June 3.54 1.25 2.03
July 3.39 1.19 2.23
August 3.14 1.14 2.41
September 2.89 1.09 2.57
October 2.82 1.05 2.63
November 2.55 1.13 2.75
December 2.19 1.30 2.79
Table 90. Monthly inflation rates(12-month moving average )
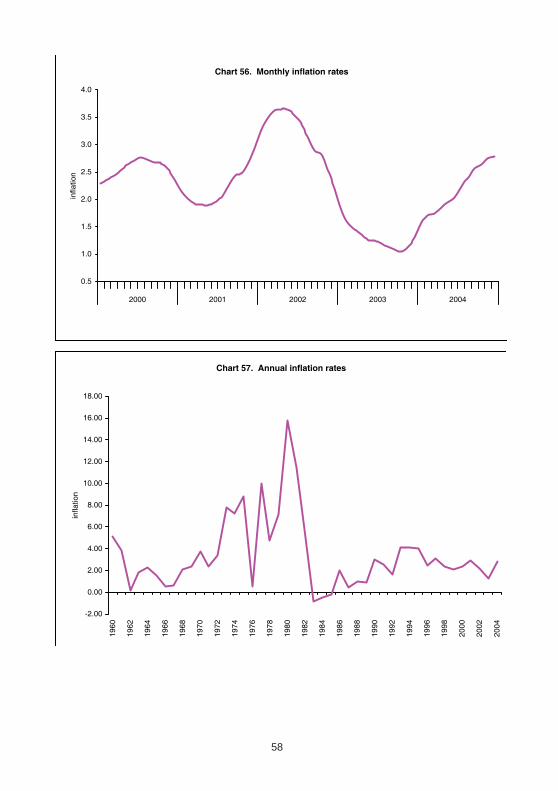
58
Chart 56. Monthly inflation rates
0.5
1.0
1.5
2.0
2.5
3.0
3.5
4.0
2000 2001 2002 2003 2004
infla
tion
Chart 57. Annual inflation rates
-2.00
0.00
2.00
4.00
6.00
8.00
10.00
12.00
14.00
16.00
18.00
1960
1962
1964
1966
1968
1970
1972
1974
1976
1978
1980
1982
1984
1986
1988
1990
1992
1994
1996
1998
2000
2002
2004
infla
tion

59
Currency 2002 2003 2004
US $ 0.4329 0.3767 0.3441
Stg £ 0.6503 0.6159 0.6308
Euro 0.4087 0.4261 0.4279
Yen 0.0035 0.0033 0.0032
Currency 2002 2003 2004
US $ 2.3100 2.6543 2.9061
Stg £ 1.5378 1.6237 1.5853
Euro 2.4468 2.3470 2.3368
Yen 288.88 307.38 314.19
Source: Central Bank of Malta.
Table 91. Average exchange rates of major selected currencies against the Maltese Lira
MONEY
Table 92. Average exchange rates of the Maltese Lira against major selected currencies
Chart 58. Average exchange rates of major selected currencies against the Maltese Lira
0.0000
0.1000
0.2000
0.3000
0.4000
0.5000
0.6000
0.7000
2000 2001 2002 2003 2004
exch
ange
rat
e
0.0000
0.0005
0.0010
0.0015
0.0020
0.0025
0.0030
0.0035
0.0040
0.0045
exch
ange
rat
e
US Stg Euro Yen (refer to right axis)
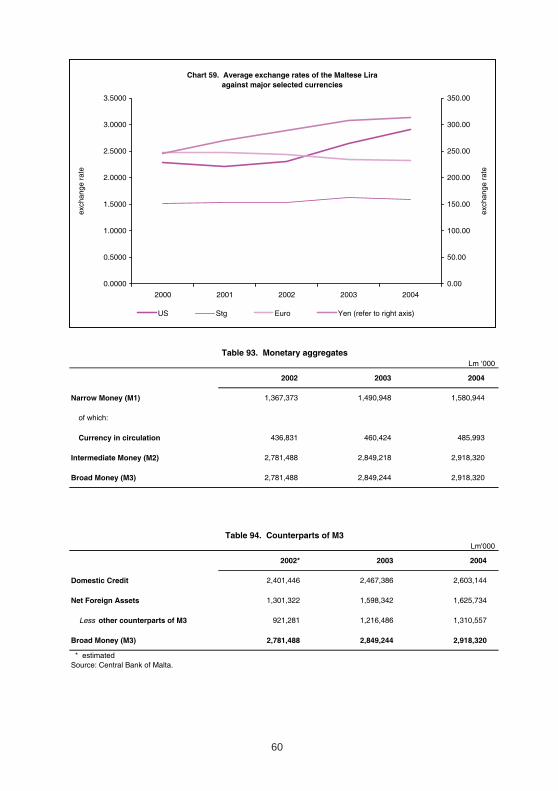
60
Lm ‘000
2002 2003 2004
Narrow Money (M1) 1,367,373 1,490,948 1,580,944
of which:
Currency in circulation 436,831 460,424 485,993
Intermediate Money (M2) 2,781,488 2,849,218 2,918,320
Broad Money (M3) 2,781,488 2,849,244 2,918,320
Lm'000
2002* 2003 2004
Domestic Credit 2,401,446 2,467,386 2,603,144
Net Foreign Assets 1,301,322 1,598,342 1,625,734
Less other counterparts of M3 921,281 1,216,486 1,310,557
Broad Money (M3) 2,781,488 2,849,244 2,918,320
* estimatedSource: Central Bank of Malta.
Table 93. Monetary aggregates
Table 94. Counterparts of M3
Chart 59. Average exchange rates of the Maltese Lira against major selected currencies
0.0000
0.5000
1.0000
1.5000
2.0000
2.5000
3.0000
3.5000
2000 2001 2002 2003 2004
exch
ange
rat
e
0.00
50.00
100.00
150.00
200.00
250.00
300.00
350.00
exch
ange
rat
e
US Stg Euro Yen (refer to right axis)

61
Lm ‘000
2002 2003 2004
Resident 2,620,801 Resident 2,676,727 2,730,560
of which: of which:
Personal 2,121,567 Central Government 19,216 21,367
Business 426,933 Other general Government 6,852 7,191
Other 72,301 Financial intermediaries and financial auxiliaries 51,299 55,223
Non-financial companies 419,019 414,530
Households and non-profit institutions 2,180,340 2,232,250
Non-Resident 908,426 Non-Resident 850,927 1,077,942
Total 3,529,227 Total 3,527,654 3,808,503
Note: As from 2003 there has been a re-classification of the data shown above.
Source: Central Bank of Malta.
Table 95. Deposits(analysis by ownership)
2002 2003 2004
Central Bank
Discount Rate 3.75 3.00 3.00
Deposit Money Banks
Current 1.12 0.44 0.47
Savings 1.80 1.01 0.95
Time 4.39 3.45 2.87
Average Weighted Lending Rate 6.07 5.31 5.33
Government Securities
Treasury Bills
1 month - - 2.96
3 month 3.67 2.94 2.96
6 month 3.80 2.93 2.97
1 year - - 2.97
Government Stocks
2 year - 3.39 3.21
5 year 5.15 4.37 4.26
10 year 5.43 4.71 4.70
15 year 5.86 4.96 4.97
Source: Central Bank of Malta.Note: "-" sign implies that no transaction occurred during the preceding quarter.
Per cent per annum
Table 96. Selected interest rates in Malta