National Statistics Conference 2012 (MyStats 2012) · National Statistics Conference 2012 (MyStats...
13
National Statistics Conference 2012 (MyStats 2012) “Enhancing National Statistics to Meet Public and Private Sector Needs During a Period of Transformation” Session 2: Promoting Data Sharing and Communication of Statistics Maximising the Value of Data Through Greater Data Sharing Between Public and Private Sectors Suhaimi Ilias Chief Economist Maybank Investment Bank Tel: +603-2297 8682 Email: [email protected]
Transcript of National Statistics Conference 2012 (MyStats 2012) · National Statistics Conference 2012 (MyStats...

National Statistics Conference 2012 (MyStats 2012)
“Enhancing National Statistics to Meet Public and Private Sector Needs During a Period of Transformation”
Session 2: Promoting Data Sharing and Communication of Statistics
Maximising the Value of Data Through Greater Data Sharing Between Public and Private Sectors
Suhaimi Ilias Chief Economist
Maybank Investment Bank Tel: +603-2297 8682
Email: [email protected]

2
Malaysia’s Transformation Decade, 2011-2020 – “Quantitative Targets”
GNI Per Capita, 2010-2020 (USD)
Real GDP: Actual & Official Forecasts, 2011-2013 (%)
7,000
8,000
9,000
10,000
11,000
12,000
13,000
14,000
15,000
2010 2011 2012 2013 2014 2015 2016 2017 2018 2019 2020
Targeted GNI per capita (2012-2020) Actual GNI per capita (2010-1H 2012)
Source 2011 2012 2013Econ Report 2010/2012, Oct 2010 5.0 - 6.0BNM Annual Report 2010, Mar 2011 5.0 - 6.0Econ Report 2011/2012, Oct 2011 5.0 - 5.5 5.0 - 6.0BNM Annual Report 2011, Mar 2012 5.1 4.0 - 5.0Econ Report 2012/2013, Oct 2012 5.1 4.5 - 5.0 4.5 - 5.5Legend:ActualOfficial Forecast
2011-2020: 6% p.a. growth in GNI per capita i.e.
USD15,000 in 2020 from USD8,348 in 2010
5% p.a. real GDP growth
Investment requirement of MYR1.4tr 92% Private/Corporate
73% DDI 43% NFPEs/GLCs/GLICs 57% Others
27% FDI 8% Government
3.3m new jobs in 2011-2020
Sources: PEMANDU (ETP Roadmap, Oct 2010), DoS, Maybank IB

3
Malaysia’s Transformation Decade, 2011-2020 – “Qualitative Targets”
High Income
Sustainable Inclusive
Narrowing disparities; raising equality in income/wealth distribution; enhancing economic opportunities among Malaysians (with special attention to the bottom 40% of the households).
Private sector-led growth, underpinned by productivity, efficiency & innovation; well-managed public finance; preserving environment & natural resources.
Sources: PEMANDU (ETP Roadmap, Oct 2010), DoS, Maybank IB

4
Need to keep track whether we are on track on this transformation journey
Key role of statistics is to present evidence whether Malaysia is on track to achieve “Vision 2020”.
Enable us to gauge and analyse whether the transformation is yielding the intended results and producing the desired outcomes
Provide policymakers with the information that facilitate policy recalibration and realignment – if necessary – particularly in relation to the formulation of 11th Malaysia Plan (2016-2020).
Timely, adequate, reliable and accurate statistics to monitor the country’s evolution into a high-
income economy where growth is investment-driven, inclusive and sustainable.
Consequently and immediately, we see the key statistical issues revolving around investment, labour market, income distribution and productivity.

5
Enhancing information on investment
Issues
Investments by NFPEs, GLCs &
GLICs “Big Block” but “Black Box” in
GFCF
MIDA Approved Investment vs
Realised Investment
Status & Breakdown of
EPP / ETP Investment –
sporadic rather periodic updates
Numerous sources of
investment data & news
ONE-STOP INFORMATION & DATABASE
Ministries
DoS
BNM
MITI / MIDA;
PEMANDU
EPU
NFPEs; GLICs; GLICs
Regional
Development Authorities
States’ EPUs,
Economic Development Corporations
and/or Investment Promotion Agencies

6
More comprehensive database on labour market, income and distribution – including GDP by Income
Enable us to determine whether Malaysia’s economic transformation is resulting in the desired shift in the labour market and income structures e.g. higher income jobs; more demand and supply of skilled and knowledge workers; improvements in household income level and general income distribution.
Jadual Penunjuk Pasaran BuruhTable Labour Market Indicators3.5.12

7
Raising the frequency of – and “mainstreaming” – productivity statistics
Of particular interest is total factor productivity (TFP).
In the 10-year period between 2002 and 2011, TFP was 1.68% or almost a third of the 5.12% GDP growth during the period (Source: MPC Annual Report 2012).
In its 18th Annual Productivity Report 2010/2011, MPC estimated that TFP need grow by an average of 2.3% p.a. until 2020. Against the implied official real GDP growth target of 5% p.a. stated earlier, this means TFP must account for at least 45% of economic growth.
8
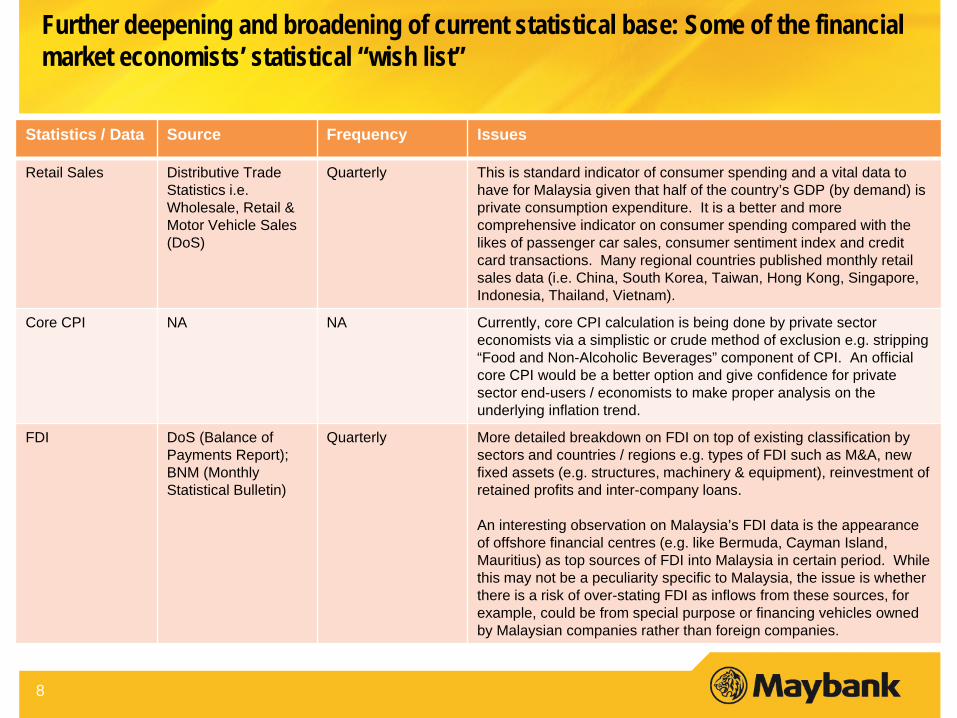
Further deepening and broadening of current statistical base: Some of the financial market economists’ statistical “wish list”
Statistics / Data Source Frequency Issues
Retail Sales Distributive Trade Statistics i.e. Wholesale, Retail & Motor Vehicle Sales (DoS)
Quarterly This is standard indicator of consumer spending and a vital data to have for Malaysia given that half of the country’s GDP (by demand) is private consumption expenditure. It is a better and more comprehensive indicator on consumer spending compared with the likes of passenger car sales, consumer sentiment index and credit card transactions. Many regional countries published monthly retail sales data (i.e. China, South Korea, Taiwan, Hong Kong, Singapore, Indonesia, Thailand, Vietnam).
Core CPI NA NA Currently, core CPI calculation is being done by private sector economists via a simplistic or crude method of exclusion e.g. stripping “Food and Non-Alcoholic Beverages” component of CPI. An official core CPI would be a better option and give confidence for private sector end-users / economists to make proper analysis on the underlying inflation trend.
FDI DoS (Balance of Payments Report); BNM (Monthly Statistical Bulletin)
Quarterly
More detailed breakdown on FDI on top of existing classification by sectors and countries / regions e.g. types of FDI such as M&A, new fixed assets (e.g. structures, machinery & equipment), reinvestment of retained profits and inter-company loans. An interesting observation on Malaysia’s FDI data is the appearance of offshore financial centres (e.g. like Bermuda, Cayman Island, Mauritius) as top sources of FDI into Malaysia in certain period. While this may not be a peculiarity specific to Malaysia, the issue is whether there is a risk of over-stating FDI as inflows from these sources, for example, could be from special purpose or financing vehicles owned by Malaysian companies rather than foreign companies.

9
Further deepening and broadening of current statistical base: Some of the financial market economists’ statistical “wish list”
Statistics / Data Source Frequency Issues
Portfolio Capital Flows
DoS (Balance of Payments Report); BNM (Monthly Statistical Bulletin)
Quarterly More micro or disaggregated data e.g. classification of foreign ownership of domestic equities and bonds/sukuks by types of investors e.g. pension funds, central banks, insurance companies, fund/asset management companies, hedge funds etc in addition to the current macro or aggregated data on foreign holdings of domestic equities and bonds/sukuks.
Government Finance (Revenue, Expenditure, Budget Balance, Debts)
BNM Monthly Statistical Bulletin; MoF Economic Report
Quarterly Request for data on monthly basis as well as more details and regular updates on the Government’s asset-liability position, including contingent liability.
Minutes of BNM’s Monetary Policy Committee (MPC) Meetings
NA NA Currently, BNM issues Monetary Policy Statement (MPS) after the MPC meetings. Release of minutes of MPC meetings can help private sector economists to analyze the dynamics of how monetary policy is being discussed among the committee members, and provides more guidance on the economic conditions and outlook as well as the issues and risks.

10
Further deepening and broadening of current statistical base: Some of the financial market economists’ statistical “wish list”
Statistics / Data Source Frequency Issues
Household Debt (including Debt Service and Asset-Liability Ratios)
BNM Annual Report; BNM Financial Stability & Payment Systems Report
Annual Given the high-profile issue of household indebtedness, there is demand for these statistics to be made available on a more regular basis or at a higher frequency – at least quarterly – for close monitoring of the situation.
National Property / House Price Index; Property Market Report (Stocks, Incoming Supplies, Transactions)
NAPIC/ Department of Valuation and Property Services
Quarterly; Half-Yearly
Increase data frequency to monthly and reduce time lag, especially for large cities / urban areas like Klang Valley, Penang and JB. A more frequent and timely database is deemed critical in monitoring and analyzing the property/real estate market amid policy issues such as rising property prices, supply of affordable housing, and major property/real estate developments in Government lands.
11
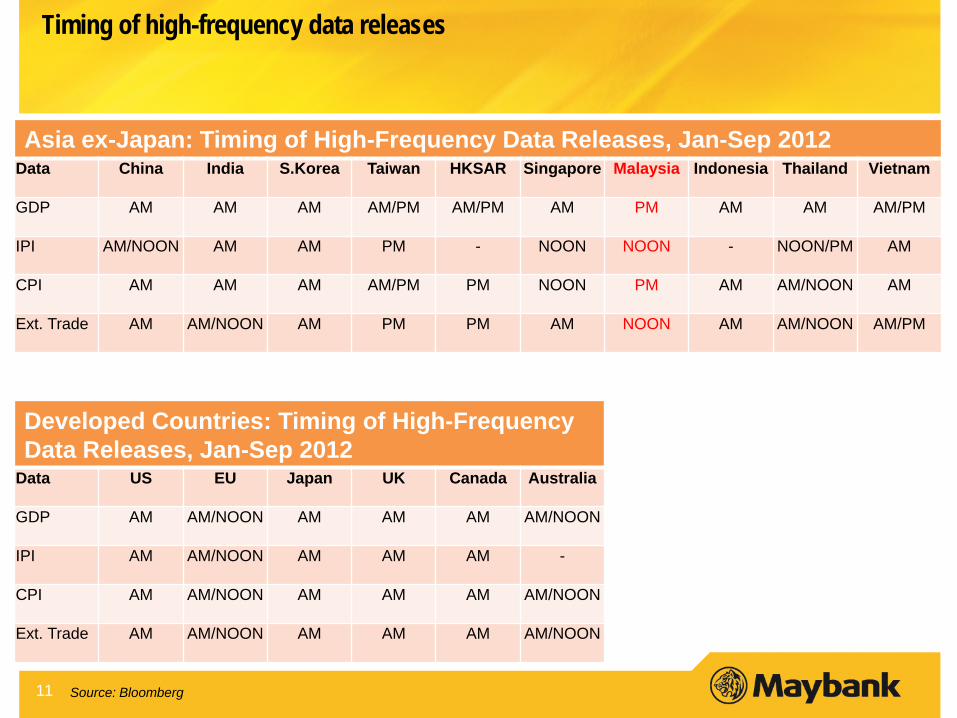
Timing of high-frequency data releases
Asia ex-Japan: Timing of High-Frequency Data Releases, Jan-Sep 2012 Data China India S.Korea Taiwan HKSAR Singapore Malaysia Indonesia Thailand Vietnam
GDP AM AM AM AM/PM AM/PM AM PM AM AM AM/PM
IPI AM/NOON AM AM PM - NOON NOON - NOON/PM AM
CPI AM AM AM AM/PM PM NOON PM AM AM/NOON AM
Ext. Trade AM AM/NOON AM PM PM AM NOON AM AM/NOON AM/PM
Source: Bloomberg
Developed Countries: Timing of High-Frequency Data Releases, Jan-Sep 2012
Data US EU Japan UK Canada Australia
GDP AM AM/NOON AM AM AM AM/NOON
IPI AM AM/NOON AM AM AM -
CPI AM AM/NOON AM AM AM AM/NOON
Ext. Trade AM AM/NOON AM AM AM AM/NOON

12
Raise or elevate the status of DoS…?
Currently a Department under Prime Minister’s Office
Explore the possibility of becoming statutory body or national agency e.g. National Statistical Agency Bigger budget especially for human capital and ICT
Greater discretion & flexibility to publish and “monetise” products/services
More “independent” – real or perceived

Disclaimer
This presentation is for information purposes only and is not intended to provide personal investment advice and does not take into account the specific investment objectives, the financial situation and the particular needs of persons who may receive or read this presentation. Investors should therefore seek financial, legal and other advice regarding the appropriateness of investing in any securities or the investment strategies mentioned in this presentation.
The information contained herein has been obtained from sources believed to be reliable but such sources have not been independently verified by Maybank Investment Bank Bhd and consequently no representation is made as to the accuracy or completeness of this presentation by Maybank Investment Bank Bhd and it should not be relied upon as such. Accordingly, no liability can be accepted for any direct, indirect or consequential losses or damages that may arise from the use or reliance of this presentation.
This presentation may contain forward looking statements which are often but not always identified by the use of words such as “anticipate”, “believe”, “estimate”, “intend”, “plan”, “expect”, “forecast”, “predict” and “project” and statements that an event or result “may”, “will”, “can”, “should”, “could” or “might” occur or be achieved and other similar expressions. Such forward looking statements are based on assumptions made and information currently available to us and are subject to certain risks and uncertainties that could cause the actual results to differ materially from those expressed in any forward looking statements. Readers are cautioned not to place undue relevance on these forward-looking statements. Maybank Investment Bank Bhd expressly disclaims any obligation to update or revise any such forward looking statements to reflect new information, events or circumstances after the date of this publication or to reflect the occurrence of unanticipated events.
This presentation copy may not be reproduced, altered in any way, transmitted to, copied or distributed to any other party in whole or in part in any form or manner without the prior express written consent of Maybank Investment Bank Bhd and Maybank Investment Bank Bhd accepts no liability whatsoever for the actions of third parties in this respect.
This presentation is not directed to or intended for distribution to or use by any person or entity who is a citizen or resident of or located in any locality, state, country or other jurisdiction where such distribution, publication, availability or use would be contrary to law or regulation.