National Rail Plan
27
National Rail Plan MOVING FORWARD A PROGRESS REPORT | SEPTEMBER 2010
Transcript of National Rail Plan

National Rail PlanMoving Forward
A Progress rePort | sePtember 2010

Dear Members of Congress:
I am pleased to submit the enclosed Progress Report, another important step toward advancing a new plan
for U.S. passenger and freight rail. This report reflects 15 months of study, consultations with States and
freight rail partners, conversations with focus groups of transportation experts, and public outreach events
held with communities across America. It reaffirms the commitment of the Congress and President Obama
to build a nation-wide high-speed and intercity passenger rail system while preserving the Nation’s premier
freight rail network.
A half-century ago, President Eisenhower signed legislation implementing another bold and ambitious idea:
the interstate highway system. He envisioned it as a vast system of inter-connected roadways crisscrossing
the nation, and for decades our interstates have moved agricultural and industrial goods to market and
connected millions of people to affordable homes and quality jobs.
Today, the Administration is working to achieve a vision of similar scope and scale. With America’s rail
system, as with the interstates during the 1950s, we haven’t yet drawn all the lines on the map, nor solved
all the financing mechanisms. But we are on track to creating a modern, high-speed and interconnected
rail system that will support sustained economic growth, move people and goods with greater speed and
efficiency, relieve growing congestion, and provide another choice for the public’s mobility needs. This report
expands and elaborates on what we have learned so far and illuminates the path ahead.
I look forward to working with Congress on a long-term plan that re-imagines and renews America’s
transportation infrastructure – railroads foremost among it – for a new generation of possibility. Thank you for
your continued leadership and partnership in this exciting and important effort.
Sincerely yours,
Ray LaHood

INTRODUCTION
The United States and world economies are experiencing an increased demand for rail. Expanding U.S.
passenger and freight mobility will require a networked railroad system that is able to modernize and
increase capacity. With an estimated U.S. population growth of 70 million people over the next 25 years,
mostly centered in metropolitan regions, a national rail plan is needed to ensure a coordinated and intelligent
system that provides safe, reliable, and efficient passenger and freight rail service.
At pivotal times in our country’s history, the United States has faced similar challenges and opportunities.
Consider: In the mid-1800s, President Abraham Lincoln made possible the first transcontinental railroad to
accommodate the inexorable westward movement of people and goods. Nearly a century later, President
Dwight Eisenhower launched construction of the interstate highway system to take advantage of a sweeping
restructuring of the American economy, transport a booming population, and maximize the use of a
technological innovation widely affordable after the war: the automobile.
The United States now faces new challenges spurred by unprecedented population growth, economic
transformations, and technological innovations. High-speed rail, now established in many developed
nations, is positioned to benefit the United States as the States’ plans mature and projects are implemented.
With FY 2009 kick starting U.S. high-speed rail investment and planning, follow-on funding and strategic
investment will bring us closer to realizing the vision outlined by Congress and the Administration.
The next American transformation will require an interconnected and balanced transportation network
that maximizes the benefits of every mode. A key to integrating these systems is higher-performing rail,
including the full spectrum of high-speed and intercity passenger rail, commuter rail, and freight rail. These
interconnected rail systems will relieve congestion, promote livable communities, facilitate economic
expansion, respect environmental sustainability and provide choices for the American public. This investment
will set the stage for job creation, sustainable economic competitiveness, a more resilient infrastructure and
a lasting prosperity.
EXPLANATION OF PROGRESS REPORT
This Progress Report details the interplay of factors that demonstrate the importance of efficient and
effective rail infrastructure to the Nation’s economy. These include a dramatic increase in population,
particularly in high-growth areas, and the concomitant need for transporting more freight and improving
safety. Such an infrastructure will also reduce fuel consumption, which, in turn, will enhance our national
security by diminishing our reliance on foreign oil.
This report will then describe the different yet complementary visions for the two rail systems, a high-speed
and intercity passenger rail system and a high-performing freight rail system. These systems will use many
3
National Rail PlanM o v i n g F o r w a r d A P r o g r e s s r e P o r t
of the same resources and much of the same infrastructure. Working in tandem, they will connect people
and goods in a seamless and efficient manner.
Finally, the report will describe the Federal railroad Administration’s (FrA) outreach program to develop the
National rail Plan, and its synergy with the U.s. Department of transportation’s (Dot) strategic goals.
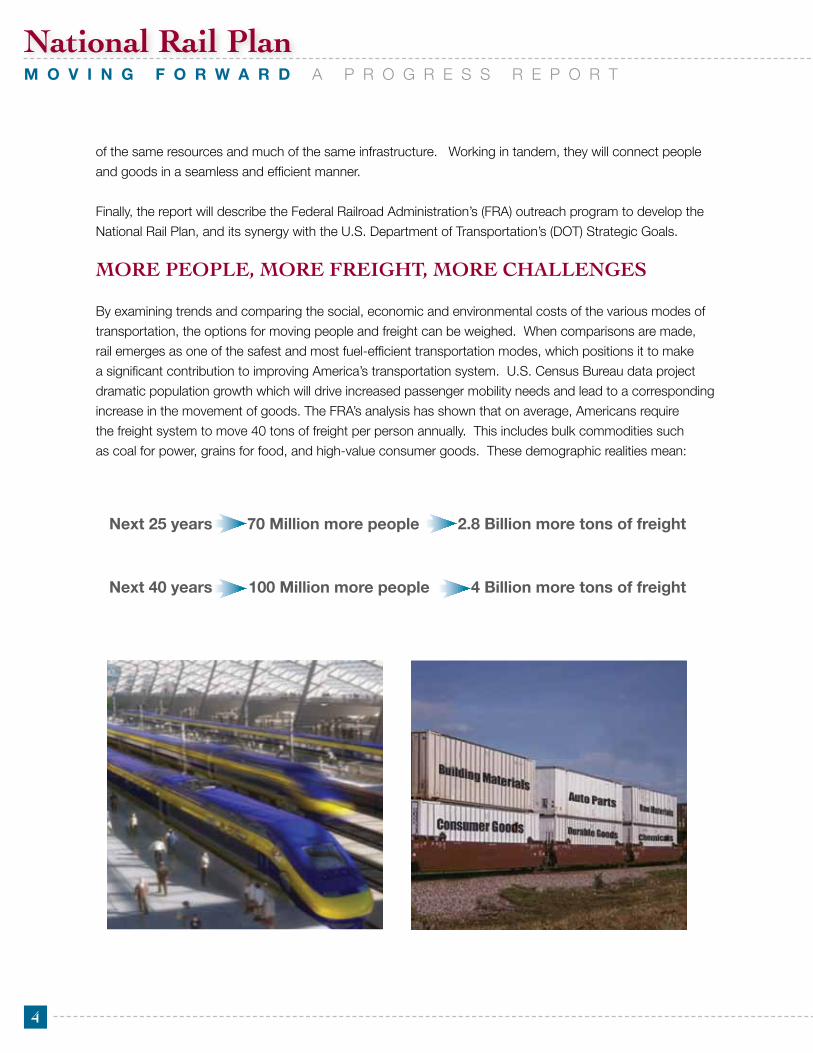
MORE PEOPLE, MORE FREIGHT, MORE CHALLENGES
By examining trends and comparing the social, economic and environmental costs of the various modes of
transportation, the options for moving people and freight can be weighed. When comparisons are made,
rail emerges as one of the safest and most fuel-efficient transportation modes, which positions it to make
a significant contribution to improving America’s transportation system. U.S. Census Bureau data project
dramatic population growth which will drive increased passenger mobility needs and lead to a corresponding
increase in the movement of goods. the FrA’s analysis has shown that on average, Americans require
the freight system to move 40 tons of freight per person annually. this includes bulk commodities such
as coal for power, grains for food, and high-value consumer goods. these demographic realities mean:
2.8 Billion more tons of freightnext 25 years 70 Million more people
4 Billion more tons of freightnext 40 years 100 Million more people
4
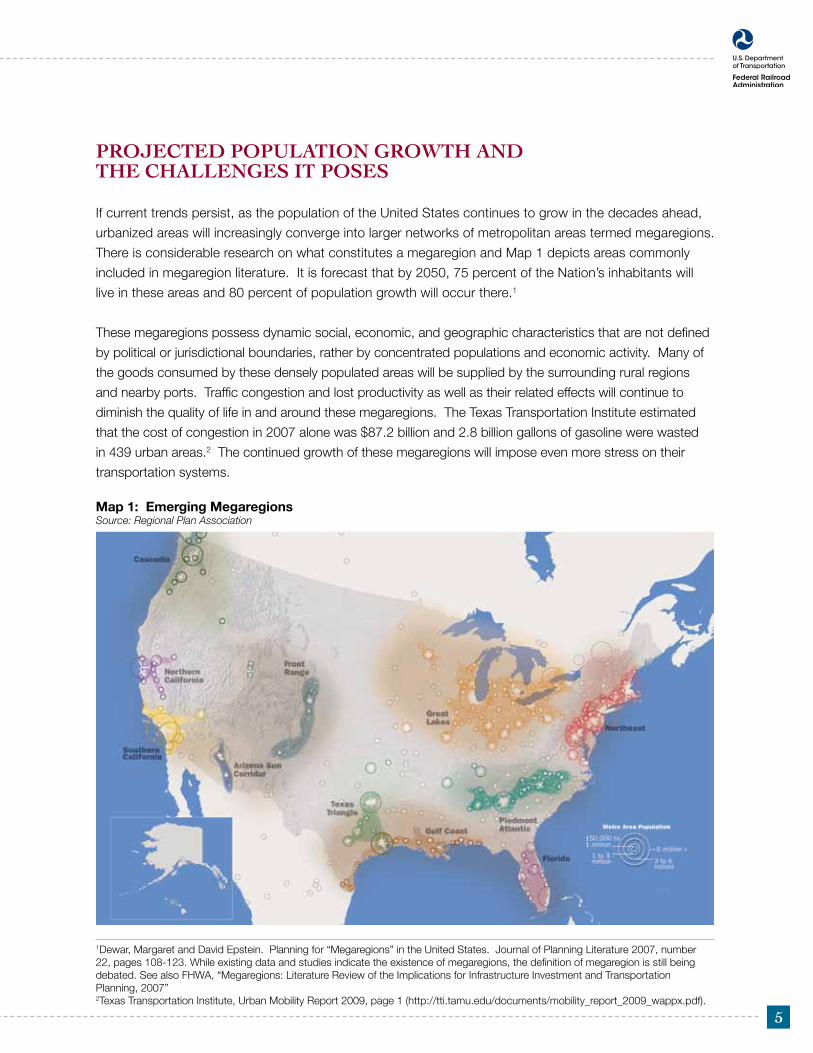
PROJECTED POPULATION GROWTH AND THE CHALLENGES IT POSES
If current trends persist, as the population of the United States continues to grow in the decades ahead,
urbanized areas will increasingly converge into larger networks of metropolitan areas termed megaregions.
There is considerable research on what constitutes a megaregion and Map 1 depicts areas commonly
included in megaregion literature. It is forecast that by 2050, 75 percent of the Nation’s inhabitants will
live in these areas and 80 percent of population growth will occur there.1
These megaregions possess dynamic social, economic, and geographic characteristics that are not defined
by political or jurisdictional boundaries, rather by concentrated populations and economic activity. Many of
the goods consumed by these densely populated areas will be supplied by the surrounding rural regions
and nearby ports. Traffic congestion and lost productivity as well as their related effects will continue to
diminish the quality of life in and around these megaregions. The Texas Transportation Institute estimated
that the cost of congestion in 2007 alone was $87.2 billion and 2.8 billion gallons of gasoline were wasted
in 439 urban areas.2 The continued growth of these megaregions will impose even more stress on their
transportation systems.
Map 1: Emerging MegaregionsSource: Regional Plan Association
5
1Dewar, Margaret and David Epstein. Planning for “Megaregions” in the United States. Journal of Planning Literature 2007, number 22, pages 108-123. While existing data and studies indicate the existence of megaregions, the definition of megaregion is still being debated. See also FHWA, “Megaregions: Literature Review of the Implications for Infrastructure Investment and Transportation Planning, 2007”2Texas Transportation Institute, Urban Mobility Report 2009, page 1 (http://tti.tamu.edu/documents/mobility_report_2009_wappx.pdf).

National Rail PlanM O V I N G F O R W A R D A P R O G R E S S R E P O R T
These demographic trends are unavoidable, and their effect on our current transportation infrastructure will
pose enormous challenges. If the Nation is to compete in a global marketplace, more effective investments
in transportation infrastructure must be made, and new options considered. More specifically, our
transportation network must be rebalanced, and legacy funding and governance models must be modified
and improved to accommodate more people and freight.
NEED FOR MORE CAPACITY
America’s population and freight volume are directly
related as illustrated in Table 1. Beginning in 2015,
America’s transportation system will move 13
billion tons of freight. By 2035, it will move 15.3
billion tons. And by 2050, it will move 16.9 billion
tons. Between 2010 and 2035, the transportation
system will experience a 22 percent increase in the
total amount of tonnage it moves. When looking
forward to 2050, the increase is 35 percent, based
upon a total population estimate of 420 million.
In addition to the economic benefits of investment
in passenger and freight rail, significant public
benefits, including reduced fuel consumption
and improved safety, also will be realized.
Table 1: U.S. Freight Movement (e=estimates)
YEAR Population (millions)
Tonnage (billions)
Tons per Capita
1993 258 9.7 37.6
1997 268 11.1 41.4
2002 288 11.7 40.6
2007 301 12.5 41.6
2010 e 310 12.5 40.3
2015 e 322 13 40.3
2020 e 337 13.6 40.3
2025 e 351 14.1 40.3
2030 e 366 14.7 40.3
2035 e 380 15.3 40.3
2050 e 420 16.9 40.3
Source: Population estimates are from the U.S. Census Bureau, Population Division (December, 2009). Tonnage from 1993 through 2007 is from the US DOT/US Census Bureau Commodity Flow Survey. Population for the same years is from U.S. Census Bureau.
6
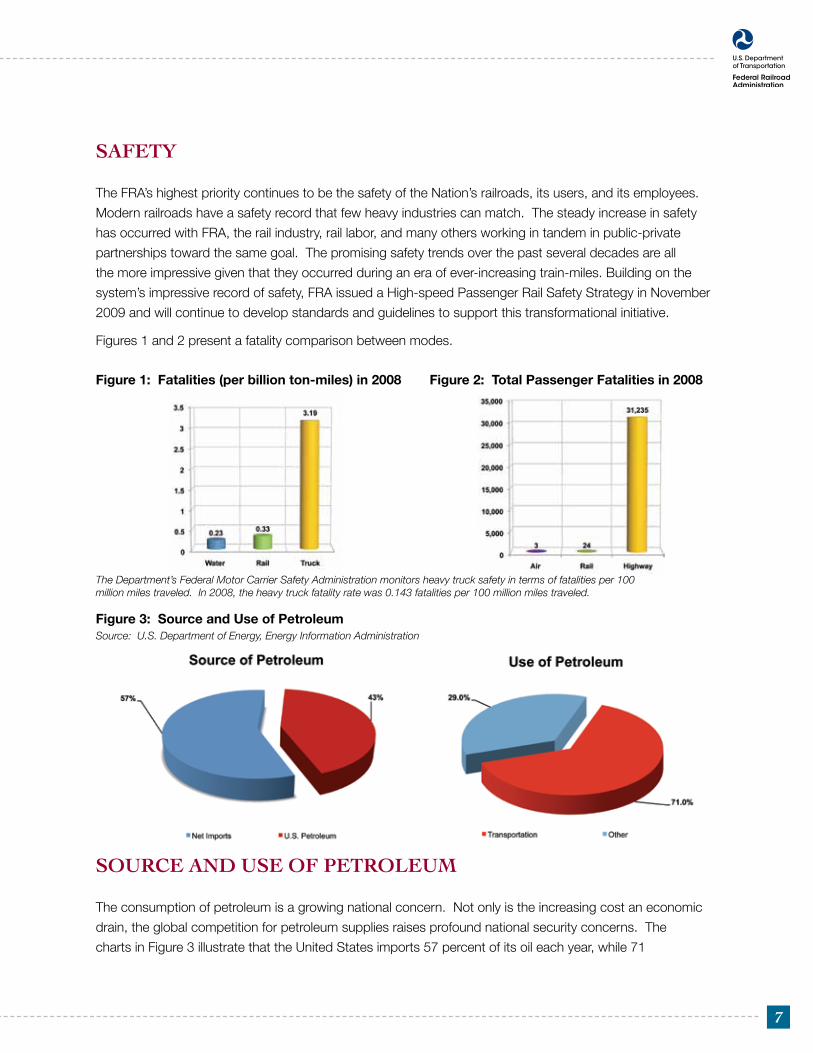
Safety
The FRA’s highest priority continues to be the safety of the Nation’s railroads, its users, and its employees.
Modern railroads have a safety record that few heavy industries can match. The steady increase in safety
has occurred with FRA, the rail industry, rail labor, and many others working in tandem in public-private
partnerships toward the same goal. The promising safety trends over the past several decades are all
the more impressive given that they occurred during an era of ever-increasing train-miles. Building on the
system’s impressive record of safety, FRA issued a High-speed Passenger Rail Safety Strategy in November
2009 and will continue to develop standards and guidelines to support this transformational initiative.
Figures 1 and 2 present a fatality comparison between modes.
Figure 1: Fatalities (per billion ton-miles) in 2008 Figure 2: Total Passenger Fatalities in 2008
The Department’s Federal Motor Carrier Safety Administration monitors heavy truck safety in terms of fatalities per 100 million miles traveled. In 2008, the heavy truck fatality rate was 0.143 fatalities per 100 million miles traveled.
Figure 3: Source and Use of PetroleumSource: U.S. Department of Energy, Energy Information Administration
7
Source and uSe of Petroleum
The consumption of petroleum is a growing national concern. Not only is the increasing cost an economic
drain, the global competition for petroleum supplies raises profound national security concerns. The
charts in Figure 3 illustrate that the United States imports 57 percent of its oil each year, while 71

National Rail PlanM o v i n g F o r w a r d A P r o g r e s s r e P o r t
percent of all petroleum is refined into transportation fuel (jet fuel, gasoline, and diesel fuel). Equally
important, a global consensus is emerging about the generation of greenhouse gases (GHG) and their
effect on climate change. When petroleum is consumed in transportation, GHGs are released into
the atmosphere. While other forms of non-transportation-related diesel emissions may be mitigated,
there is a more direct correlation between diesel fuel consumed in transport and GHG emissions.
More efficient methods of transportation, therefore, will reduce GHG and other harmful emissions.
Figures 4 and 5 present an energy comparison between modes.
Figure 4: Ton Miles per gallon
Notes: These are aggregate data. Further research is needed for a complete comparison of fuel efficiencies for passenger transportation. Rail and truck efficiency is based on FRA’s 2009 Study of Comparative Evaluation of Rail and Truck Fuel Efficiency on Competitive Corridors. Fuel efficiency is based on doublestack rail moves and comparable truck moves. For water, see Texas Transportation Institute, Center for Ports and Waterways, A Modal Comparison of Domestic Freight Transportation Effects on the General Public, prepared for USDOT, Maritime Administration and National Waterways Foundation, (December 2007), p.42.
Figure 5: BTUs per Passenger Miles
Rail’s PoteNtial
An infrastructure program that significantly improves and balances America’s transportation network will take
decades of sustained commitment. Figures 6 and 7 show a comparison between the United States and the
rest of the world in the passenger and freight rail markets. The charts indicate that while the US leads the
world in freight rail tonnage, the Nation has limited passenger rail service, reflecting the historical emphasis
on highway and aviation investment. Many nations are trying to improve the balance between passenger
rail and freight rail, just as we are trying to improve passenger rail choices and create additional freight rail
opportunities. We cannot afford to fall further behind in our transportation needs.
Rail passengers and freight often travel between locations on the same corridors. Many regions have
pursued commuter rail as a low-cost way to improve transportation capacity, from suburban and exurban
areas to central business districts using existing railroad corridors. The primary issue facing all three systems
(intercity, commuter, and freight) is that limited capacity in existing corridors makes maintaining both reliability
and safety a challenge. A high-performance freight system will require modernized corridors that have the
8

Figure 6: Passenger (billion passenger-miles) Figure 7: Freight (billion ton-miles)
capacity to allow both passenger and freight trains to operate without interfering with each other. Delays
to passengers or freight cannot be tolerated if rail is to be relied upon to deliver competitive services to
its passengers and freight customers alike. Time-sensitive rail freight, exemplified by growing high-value
intermodal traffic, requires investment in upgraded tracks, reduced curvature, improved signal and control
systems, and operating capabilities to facilitate the expeditious movement of freight. A high-performing
freight system will share characteristics and resources with its higher-speed passenger counterpart, and
finding investments that benefit both types of service creates opportunities to optimize the entire rail network.
VISION FOR HIGH-SPEED INTERCITY PASSENGER RAIL
Goal: Connect communities with High-speed and Intercity Passenger Rail where population densities and competitive trip times create markets for success.
Transportation solutions have always responded to the unique economic, social, and technological
contexts of their time, and our era requires the same bold spirit that impelled previous innovations.
This Progress Report is another step in further refining the President’s vision for improving high-
speed passenger rail service in the United States. When submitted, the National Rail Plan
will offer more detail with strategies and recommendations to accomplish the vision.
Success will require a long-term commitment to passenger rail at the Federal, State, and local
levels, similar to the dedication shown to the interstate highway network in the latter half of the
20th century. It will also require the participation of a number of private entities, from equipment
manufacturers to service operators. We believe that it is an achievable and realistic vision, and one
that responds to the new era of challenges and opportunities confronting the United States.
9

National Rail PlanM O V I N G F O R W A R D A P R O G R E S S R E P O R T
10
OVERVIEW
FRA’s vision for a national high-speed rail program is to develop tiered passenger rail corridors that take into
account the different markets and geographic contexts found throughout the United States. This approach
builds on the legislative framework established in the Passenger Rail Investment and Improvement Act of
2008 (PRIIA) and $8 billion provided in the American Recovery and Reinvestment Act of 2009.
This vision includes the following tiers:
• Core Express Corridors: These routes would connect large urban areas up to 500 miles apart
with 2-3 hour travel time and train speeds would be between 125 and 250 mph. Service will be
frequent and will operate on electrified, dedicated track that is publicly owned. Based on their
operation in and between large, dense metropolitan regions, the Core Express corridors will form the
“backbone” of the national passenger rail system.
• Regional Corridors: This network would connect mid-sized urban areas, and smaller
communities in between, with convenient, frequent 90-125 mph service on a mix of dedicated
and shared track, depending on the particular corridor. In some areas, these corridors could
connect to Core Express corridors, with many potential passenger services operating over both
the Core Express and Regional routes.
• Emerging/Feeder Routes: Emerging routes would connect regional urban areas at speeds up
to 90 mph on shared track. In some areas, the Emerging/Feeder routes could connect to the
Core Express or Regional corridors, allowing residents of these smaller or more distant areas to
have efficient access to the national system.
• Community Connections: For this vision of 21st century passenger rail to be successful, it
must be integrated with existing and future policies and investments in public transportation,
airports, and other modes to provide convenient options for accessing the passenger rail network.
This access is critical to ensuring that passenger rail is a viable alternative to other methods of
intercity travel.
The U.S. Department of Transportation is developing criteria to identify regions of the country where Core
Express, Regional, and Emerging/Feeder corridors could be feasible. This criteria will include variables such
as estimated trip times, highway and airport congestion, ridership estimates, distance, and other key cost
and benefit measures. In part, the goal of this criteria will be to ascertain how high-speed passenger rail can
serve the increasing mobility needs between megaregions.

11
Costs and Benefits
The total capital investment needed to develop the future high-speed and intercity passenger rail network is
significant, like other major infrastructure programs and projects. Investment must include all costs associated
with developing the system, including planning and engineering, right-of-way acquisition, and the construction
of track, stations, and other facilities and equipment.
While passenger rail systems are capital intensive, the benefits are expected to be significant. In addition to
addressing major transportation challenges such as population growth, energy consumption, environmental
protection, and congestion, this passenger rail vision will also:
• Balance the transportation network and provide complementary service between
modes. In some cities, there is simply no room to expand airports or highways,
regardless of whether financing is available to accomplish these projects. A high-
speed and intercity passenger rail network will complement existing transportation
choices and, in many cases, relieve some of the increased demand.
A recent analysis by the U.S. Conference of Mayors showed that the introduction of
high-speed rail service could have a substantial impact on how people make intercity trips.
The report examined four potential high-speed rail hubs (Los Angeles, Albany, Orlando, and
Chicago) and found that high-speed rail could reduce intercity car trips to these cities by 27
percent on average, and eliminate the need for 900,000 annual short-haul flights—just to
these four hubs.3 The resulting congestion decreases for both air and highways will result in
significant and measurable savings that accrue to the local economies in which they occur.
Table 2 illustrates the comparative advantage of different modes based on market factors.
Table 2: Potential Modal Comparative Advantage by Market
Po
pul
atio
n D
ensi
ty
Intercity Distance in Miles0-100 100-600 600-3000
Light Auto and Bus Auto and Bus Auto and BusConventional Rail Air
Moderate Auto and Bus High-speed Rail Auto and BusCommuter Rail Auto and Bus Air
High Auto and Bus High-speed Rail AirCommuter Rail Air
3U.S. Conference of Mayors, “The Economic Impact of High-Speed Rail on Cities and Their Metropolitan Areas,” 2010, page 26.
National Rail PlanM O V I N G F O R W A R D A P R O G R E S S R E P O R T
12
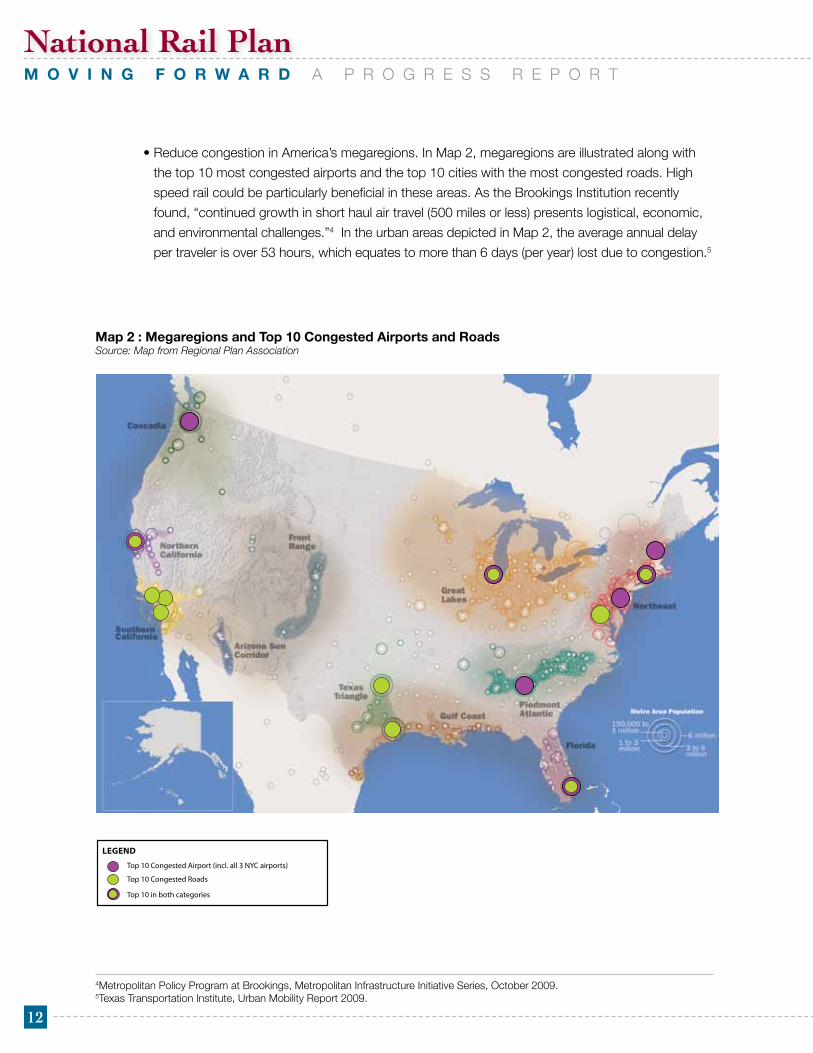
• Reduce congestion in America’s megaregions. In Map 2, megaregions are illustrated along with
the top 10 most congested airports and the top 10 cities with the most congested roads. High
speed rail could be particularly beneficial in these areas. As the Brookings Institution recently
found, “continued growth in short haul air travel (500 miles or less) presents logistical, economic,
and environmental challenges.”4 In the urban areas depicted in Map 2, the average annual delay
per traveler is over 53 hours, which equates to more than 6 days (per year) lost due to congestion.5
Map 2 : Megaregions and Top 10 Congested Airports and RoadsSource: Map from Regional Plan Association
LEGEND
Top 10 Congested Airport (incl. all 3 NYC airports)
Top 10 Congested Roads
Top 10 in both categories
4Metropolitan Policy Program at Brookings, Metropolitan Infrastructure Initiative Series, October 2009.5Texas Transportation Institute, Urban Mobility Report 2009.
13
• Boost manufacturing and economic activity. According to a report by the Center on
Globalization, Governance and Competitiveness, the U.S. rail market is the most open
market in the world.6 A commitment to developing a 21st century long-term passenger rail
network will provide a significant boost to the manufacturing sector, creating green, high-
wage jobs for thousands of people. Additionally, well over a million people could be employed
in constructing the network, and thousands more in operations and maintenance.
Beyond these direct economic effects, high-speed rail could also have a significant influence on the
nature of many regional economies. These benefits will come from: (1) added economic output;
(2) earnings associated with new jobs; and (3) efficiency gains (including land use efficiencies).
Los Angeles County estimates that the total financial payback of California’s high-speed rail
network, over the life of the system, will account for 2-4 percent of its annual gross regional
product.7 Indeed, the annual benefits for Los Angeles alone are expected to be greater than the
total value of State bonds that will be used to initiate California’s entire high-speed rail network.
• Maximize the identified HSR corridors and stations as centers for new or revitalized economic
and community development. In particular, passenger related rail Infrastructure investments
must be accompanied by strategic and bold companion plans for housing, employment and
services in proximity to this infrastructure, in order to ensure maximum use of the system,
and reap the full benefits of environmental sustainability and energy conservation.
The FRA is continuing to evaluate and develop cost/benefit analyses and will include updated information in the final plan.
6Center on Globalization, Governance and Competitiveness, U.S. Manufacture of Rail Vehicles for Intercity Passenger Rail and Urban Transit, June 24, 2010. 7Philip J. Romero, PhD, “Unlocking the Gridlock in Los Angeles County’s Transportation System: The Local Economic Benefits of High-Speed Rail,” October 8, 2008.

National Rail PlanM O V I N G F O R W A R D A P R O G R E S S R E P O R T
14
HIGH PERFORMANCE FREIGHT RAIL Goal: Support the current freight rail market share and growth.Goal: Develop strategies to attract 50 percent of all shipments 500 miles or greater to intermodal rail.
The U.S. economy depends on freight transportation to link businesses with consumers, suppliers, and
markets across the Nation and around the world. Freight transportation connects population centers,
economic activity, production, and consumption. The national transportation system’s capacity to make
these connections and perform these services is essential to American businesses, households, and
communities. Moreover, the performance and costs of our freight transportation systems are important
ingredients in the comparative advantage of the United States when competing with other economies.
Although speed and reliability are important measures of our freight system’s performance, other measures,
such as safety, security, fuel efficiency, and external costs such as GHG emissions, are also important public
concerns.
Rail is efficient at moving heavy freight over long distances, as are water and pipeline freight services. Trucks
excel in providing time-sensitive delivery services for high-value goods being transported over medium-
and short-haul distances. Raw materials and heavy freight going long distances are likely to continue
their journey by rail, or some combination of truck, rail, and water. With the future growth in freight, it is
anticipated that freight rail will continue to make investments in the capacity required to move heavy and
long-distance shipments.
HOW FREIGHT MOVES
Rail is used by shippers to transport many types of commodities comparatively shorter distances as well,
but profits are often more easily realized by railroads on long-haul shipments. Rail has the largest share of
freight on a ton-mile basis, handling nearly 40 percent of ton-miles in the United States. The mode share by
tons and by ton-miles is shown in Figure 8.
Figure 8: Freight Transportation Mode ShareSource: Commodity Flow Survey

15
Figure 9: Index of Railroad Rates After InflationSources: U.S. Dept. of Labor, Bureau of Labor Statistics, Producer Price Index of Line-Haul Operating Railroad U.S. Dept. of Commerce, Bureau of Economic Analysis, Implicit Price Deflator for Gross Domestic Product
Note: The period of declining rates ended in 2000. Through late 2007, due to increased demand and little excess capacity, freightrates began to move higher. Much of the increase in 2008 was due to the increase in fuel prices.
The Staggers Rail Act of 1980 partially deregulated the freight rail industry which led to dramatic productivity
gains and improved efficiency in the freight rail network. The railroads focused on making their operations
more efficient by shedding non-profitable lines to regional and short-line railroads, removing antiquated
track and facilities, and fostering labor productivity gains. These efficiency gains resulted in reduced prices
as shown in Figure 9. For the first 15 years of this period, the railroad industry reduced costs by over $17
billion. Railroads have passed on to shippers approximately 80 percent of that cost savings.8 After this
initial period, however, these productivity improvements were slower because the easy efficiencies were
already implemented.
Compared with other major industries, today’s freight railroads invest one of the highest percentages of
revenues to maintain and add capacity to their system. The majority of this investment is for maintenance
to ensure the state of good repair with approximately 15-20 percent of capital expenditures, on average,
used to enhance capacity. The capacity enhancements made during the recent economic downturn has
positioned the railroads to meet the short-term, but not long-term capacity concerns. Key investments will
be needed to meet future growth in freight demand.
The performance of the freight system can be greatly improved by enhancing the connections between
individual modes of transportation in order to make the best use of the inherent efficiencies of each mode.
8Carl Martland, “Sources of Financial Improvement in the U.S. Railroad Industry, 1966 to 1995.” Proceedings of the 39th Annual Meeting of the Transportation Research Forum, Vol.1, 1997.
Inde
x
Year

National Rail PlanM O V I N G F O R W A R D A P R O G R E S S R E P O R T
16
Figure 10: Freight Transportation Mode Share by DistanceSource: Commodity Flow Survey
The growth in freight in future years is an estimate; however, there is no doubt that freight demands will
increase and the need to safely and efficiently move freight will grow significantly.
Based on freight projections and using the current market share, in 2035 trucks would carry an additional 2.1
billion tons. This equates to 131.3 million more truck trips each year representing an increase of 20 billion
more truck vehicle miles travelled and 315 billion more ton-miles. Freight rail would carry an additional 450
million tons. This represents a 23 percent increase in tonnage from 2007 levels.
ROLES OF OTHER MODES
All modes have their own strengths and, therefore, have an important place in the transportation marketplace.
Figure 10 illustrates the effect of distance on the relative share of freight in billions of ton-miles between water,
truck, and rail.
Ton-
mile
s (b
illion
s)
Mileage Segment

17
Pipelines: Pipelines are a unique mode of transport in that they can carry a relatively limited type of
commodity to a limited number of destinations. Pipelines safely and efficiently move about 19.6 percent of
total freight ton-miles.9
Airfreight: Airfreight is fast, but very fuel-intensive. Most freight can be flown, but size and weight
greatly influence cost. Airfreight is a specialized transportation function used when industry depends
on receiving an item that they cannot wait for, or when consumers choose to ship by air because
they desire a product quickly. Airfreight accounts for just 0.3 percent of all freight ton-miles.10
Waterways: Shipping by water is a safe and energy-efficient method of freight transportation. Water-
borne freight has little contact with the public, whether moving along coastal routes or on inland waterways.
Although river transportation has long been associated with slow shipments of bulk freight, recent
governmental activities have aided the development of the Marine Highway System to offer transportation
services to move intermodal freight along coastal corridors.
Trucking: Probably the most visible form of freight transportation is provided by the trucking industry.
Trucking provides a vital service in and of itself, but it is also a key link as the beginning or ending stages
of loads that are transported by other modes. When the transportation services of air, barge, rail, and
pipeline do not deliver to the door of the final customer, it is the trucking industry that performs this service.
When compared to other forms of surface transportation, moving freight by truck is the most fuel-intensive
mode. On a ton-mile basis, trucks handle about 28.6 percent of the freight transportation market share.11
Table 3 illustrates the potential advantage of different modes with respect to weight and distance. The
various modes of transport are ranked in each of the cells by the comparative efficiency of each.
Table 3: Potential Modal Comparative Advantage by Market
WE
IGH
T
Intercity Distance in Miles
0-250 250-500 500-1000 1000-2000 >2000
Retail Goods/Light
Truck Truck TruckRail Intermodal
TruckRail Intermodal
TruckRail Intermodal
Consumer Durables and Other Manufactured Goods/Moderate
TruckRail
TruckRailRail Intermodal
TruckRailRail Intermodal
TruckRailRail Intermodal
TruckRailRail Intermodal
Bulk Goods/Heavy
TruckRailWater
RailWaterTruck
RailWater
RailWater
RailWater
9Bureau of Transportation Statistics, U.S. Department of Transportation, Pocket Guide to Transportation, 2010, p. 20. 10Id., p. 20.11Id., p. 20.
National Rail PlanM O V I N G F O R W A R D A P R O G R E S S R E P O R T
IMPROVED CORRIDORS AND CONNECTIONS WILL ENHANCE NATIONAL ECONOMIC COMPETITIVENESS
The rail system is part of a transportation network in which shippers choose the most cost-effective mode
for moving goods. This may be a single mode for door-to-door service or a combination of modes where
the goods move by rail for the long-haul and by truck at the origin, destination, or both. Generally, rail
competes favorably with trucks at hauls beginning at around 500 to 700 miles, but has more success in the
longer haul markets.
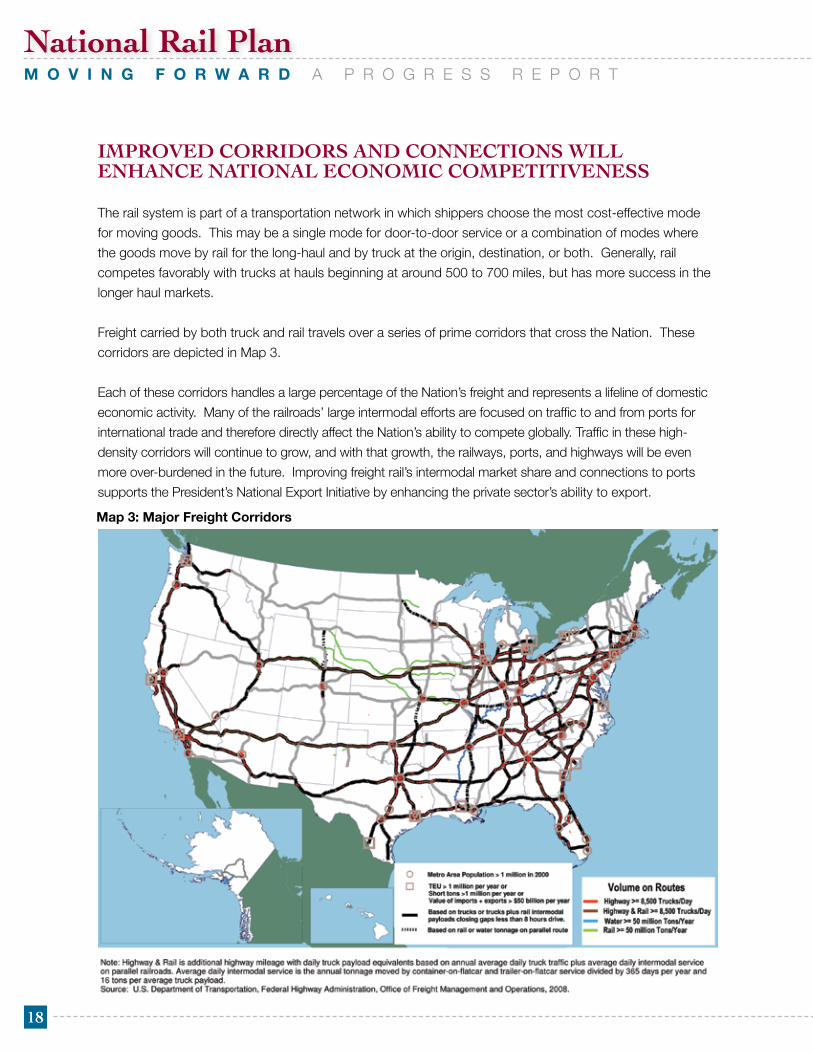
Freight carried by both truck and rail travels over a series of prime corridors that cross the Nation. These
corridors are depicted in Map 3.
Each of these corridors handles a large percentage of the Nation’s freight and represents a lifeline of domestic
economic activity. Many of the railroads’ large intermodal efforts are focused on traffic to and from ports for
international trade and therefore directly affect the Nation’s ability to compete globally. Traffic in these high-
density corridors will continue to grow, and with that growth, the railways, ports, and highways will be even
more over-burdened in the future. Improving freight rail’s intermodal market share and connections to ports
supports the President’s National Export Initiative by enhancing the private sector’s ability to export.
Map 3: Major Freight Corridors
18

19
THE GROWTH IN INTERMODAL FREIGHT WILL BE ON ALL SURFACE MODES
The intermodal market has been the fastest growing segment of the freight rail industry since 1980, as shown
in Figure 11. The combination of population growth and the growth of the intermodal movement of goods will
continue to drive this trend in the future. The growth of intermodal shipments has occurred primarily in the
longer distance corridors (over 700 miles). With improvements in service and facilities, rail intermodal can be
competitive in shorter distances, thereby absorbing some of the projected growth in freight.
Figure 11: Intermodal Growth for Eastern and Western Carriers (1990-2008)(Data for early years are combined to reflect merged carriers)
Milli
ons
of U
nits
Orig
inat
ed
Years
National Rail PlanM o v i n g F o r w a r d A P r o g r e s s r e P o r t
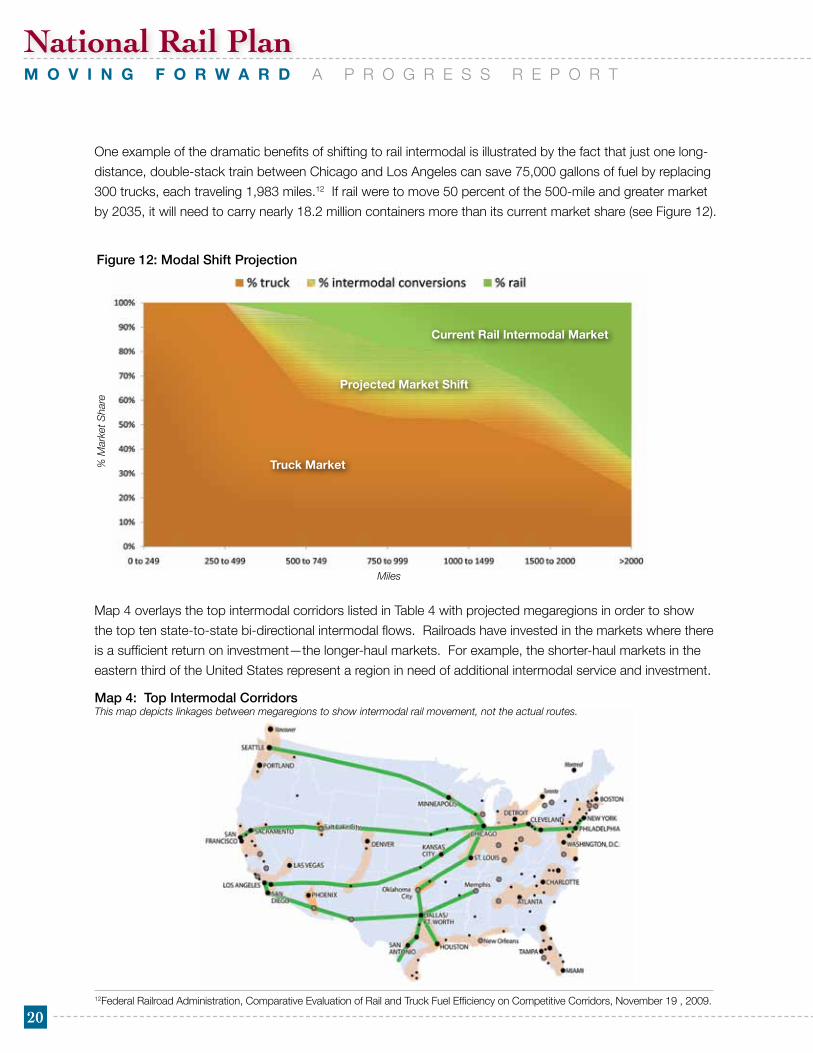
One example of the dramatic benefits of shifting to rail intermodal is illustrated by the fact that just one long-
distance, double-stack train between Chicago and Los Angeles can save 75,000 gallons of fuel by replacing
300 trucks, each traveling 1,983 miles.12 If rail were to move 50 percent of the 500-mile and greater market
by 2035, it will need to carry nearly 18.2 million containers more than its current market share (see Figure 12).
Figure 12: Modal Shift Projection
Map 4 overlays the top intermodal corridors listed in Table 4 with projected megaregions in order to show
the top ten state-to-state bi-directional intermodal flows. Railroads have invested in the markets where there
is a sufficient return on investment—the longer-haul markets. For example, the shorter-haul markets in the
eastern third of the United States represent a region in need of additional intermodal service and investment.
Map 4: Top Intermodal CorridorsThis map depicts linkages between megaregions to show intermodal rail movement, not the actual routes.
2012Federal Railroad Administration, Comparative Evaluation of Rail and Truck Fuel Efficiency on Competitive Corridors, November 19 , 2009.
% M
arke
t Sha
re
Miles
Truck Market
Projected Market Shift
Current rail intermodal Market

21
Table 4: Top Ten State-to-State Bi-directional Intermodal FlowsSource: STB Carload Waybill Sample (2007)
Corridor Trailers/Containers Average Length of Haul
California/Illinois 2,485,880 2,220
California/Texas 1,383,520 1,550
Washington/Illinois 797,480 2,230
New Jersey/Illinois 544,840 950
Pennsylvania/Illinois 498,920 750
Ohio/Illinois 457,240 360
Texas/Illinois 448,000 1,170
California/Tennessee 382,000 2,100
California/Kansas 312,320 1,775
California/Arkansas 297,080 2,025
The FRA is continuing to analyze data and recommendations for growing the freight intermodal market to
support DOT’s strategic goals.
Outreach PrOcess
Understanding rail’s role in meeting freight and passenger demands has been the subject of an extensive
outreach process in different forums that have provided information that was crucial to preparing this Progress
Report and ensuring the quality of the final plan.
President Obama outlined his vision for high-speed rail in America, and in April 2009 the FRA published the
Vision for High-Speed Rail in America. The FRA submitted the Preliminary National Rail Plan to Congress on
October 14, 2009. On October 15, FRA began developing the National Rail Plan. While these may seem like
separate events, they constituted a continuous and collaborative process over the last 15 months that served
to inform and educate FRA and our diverse stakeholders about the challenges, immense potential, and
renewed commitment to rail in America.
• April 16, 2009 — Vision for High-speed Rail in America released
• May/June 2009 — High-speed Intercity Passenger Rail (HSIPR) regional outreach meetings
• October 15, 2009 — Preliminary National Rail Plan released
• March/April 2010 — National Rail Plan focus groups
• May/June2010 - National Rail Plan regional outreach meetings
National Rail PlanM o v i n g F o r w a r d A P r o g r e s s r e P o r t
22
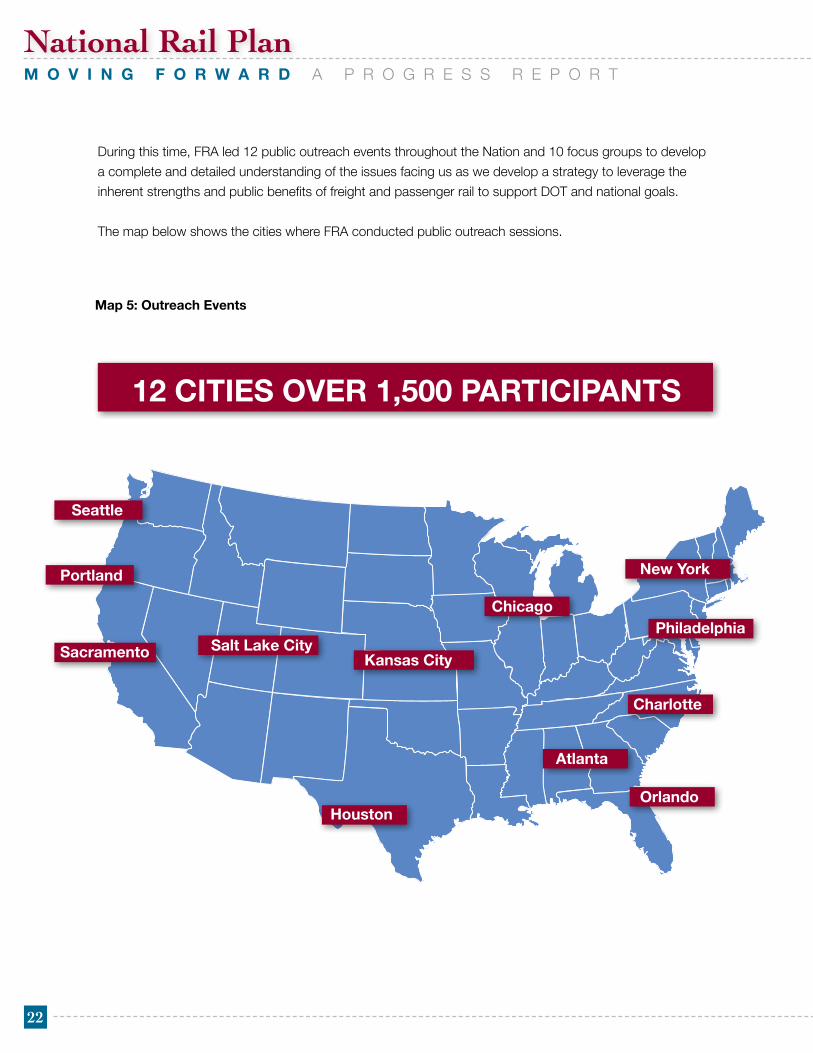
During this time, FrA led 12 public outreach events throughout the Nation and 10 focus groups to develop
a complete and detailed understanding of the issues facing us as we develop a strategy to leverage the
inherent strengths and public benefits of freight and passenger rail to support DOT and national goals.
The map below shows the cities where FRA conducted public outreach sessions.

23
Hundreds of respected subject matter experts participated in the focus groups. These experts represented
a diverse collection of professionals who participated in an open and collaborative process to identify the
issues and challenges that the National Rail Plan should address and to recommend strategies to resolve
them. Figure 13 illustrates the diverse affiliations of people who participated in focus groups.
Figure 13: Focus Group Participants
During FRA’s outreach meetings, the following common themes emerged:
• This is a unique period. We must collaborate to advance both passenger and freight rail.
• Federal leadership is needed to set transportation priorities to rebalance the transportation
network and benefit the public.
• High-speed rail needs to supplement air travel in 100 to 600 mile distances.
• The freight rail system must not be harmed and the market share of freight rail should grow.
• The FRA should focus on corridors, establish performance measures, and publicize definitive
information about public benefits and costs.
• Dedicated and sustained passenger rail funding sources are imperative.
• The National Rail Plan should take advantage of U.S. manufacturing capabilities.
In addition to the face-to-face meetings, FRA’s outreach included numerous regularly scheduled conference
calls and webinars with participation by senior government leaders. A proactive presence at industry
meetings and events by senior leaders also provided a way for FRA to inform and receive feedback
from stakeholders. Some of the key organizations who have supported this effort include Amtrak,
American Association of State Highway and Transportation Officials (AASHTO), Association of American
Railroads (AAR), American Public Transportation Association (APTA), The OneRail Coalition, The Railway
Supply Institute (RSI), National Association of Railroad Passengers (NARP), Regional Plan Association,
environmental associations and groups ranging from labor leadership to railroad CEOs.
The FRA Web site has been used to post presentations and other outreach information that was available
for download. A Federal docket was available for anyone to post comments and offer their contribution to
the National Rail Plan.

National Rail PlanM O V I N G F O R W A R D A P R O G R E S S R E P O R T
24
STRATEGIC GOALS AND OUTCOMES
A strong rail component can complement our national transportation system, giving us additional choices
for the movement of people and goods. The prosperity of the 20th century was built, in part, on the
rail investments of the 19th century. Similarly, the 20th century investments in our interstate highways,
waterways, and aviation facilities have enabled us to produce unprecedented wealth and to compete
globally. Building infrastructure that will enable a more prominent rail component will ensure that our
transportation system will be better able to meet the challenges of a growing population, increasing energy
and environmental concerns, and a highly competitive global economy.
The U.S. DOT Strategic Plan FY 2010-FY 2015: Transportation for a New Generation offers transformation
in U.S. transportation policy.13 The goals of this plan are to increase accountability and maximize the
public’s investment in a new, multimodal, performance-based environment. This section summarizes the
Department’s strategic goals and rail’s ability to meet the stated challenges through its inherent advantages.
The Department’s strategic goals are:
• Safety
• State of Good Repair
• Economic Competitiveness
• Livable Communities
• Environmental Sustainability
With an emphasis on performance-based, multimodal investments, DOT’s strategic goals promote the
implementation of the best transportation choices. It is expected that the railroad industry’s ability to offer
solutions to each of DOT’s five strategic goals will result in a larger role for rail in the U.S. transportation
mix. The strategic goals, desired outcomes, and the ability of FRA and the rail industry to achieve them are
described below.
Safety
Secretary LaHood has reinforced U.S. DOT’s dedication to safety and has identified and addressed new
concerns such as “distracted driving.” Improving public health and safety by reducing transportation-related
fatalities and injuries is DOT’s top priority, and transportation safety has made steady gains over the years.
The FRA is also dedicated to improving railroad safety by developing and enforcing safety regulations,
along with research and development of railroad safety technologies. Railroad safety has improved steadily
over time and rail often has a safety advantage compared with other modes for both passenger and freight
transportation. With this safety advantage, increasing the market share of both passenger and freight rail
provides a measurable public benefit in reduced fatalities and injuries. It will also enhance the security and
resilience of transportation.
13U.S. DOT Strategic Plan FY 2010-FY 2015, “Transportation for a New Generation.” http://www.dot.gov/stratplan/dot_strategic_plan_10-15.pdf

25
The “High-speed Passenger Rail Safety Strategy,” published by FRA in November 2009, was the result of
extensive outreach and collaboration between FRA and the Rail Safety Advisory Committee. This strategy will:
• Support a very high level of safety for new passenger rail service;
• Focus on safety results and flexibility to meet service needs while achieving those results; and,
• Ensure alignment between safety requirements and passenger rail funding policies.
State of Good Repair
The United States has the world’s most extensive and productive transportation system, representing
trillions of dollars of public and private investment. It is vital to the Nation’s economic competitiveness that
this critical infrastructure be actively maintained. Transportation infrastructure requires some level of public
investment to ensure that the public benefits from a safe, secure, and reliable system. Railroad owners
invest billions of dollars each year in funds generated from revenues and private capital markets to maintain
and improve their bridges, tunnels, tracks, signals, dispatching centers, communication systems, and
shops.
Economic Competitiveness
Moving the U.S. workforce and its products in a quick and productive manner increases economic
competitiveness. Traffic congestion wastes time, money, and petroleum. Freight rail can ease congestion
by moving freight off highways, while commuter trains will give commuters a non-highway option. Rail can
be an attractive choice, particularly for intermodal trips over 500 miles. For the 100 to 600 mile trip between
city centers, passenger rail travel, without lost time at airports for security checks and queuing in gate areas,
can provide a competitive option that offers business travelers minimum loss of productive time when travelling
between city centers. Moreover, as stated earlier, significant investment in a high-performing rail network will
have far-reaching job-creation and economic benefits that improves America’s manufacturing base.
Livable Communities
A focus on livable communities—places where transportation, housing, and commercial development
investments have been coordinated so that people have access to adequate, affordable, and
environmentally sustainable travel options—represents a transformational policy shift for DOT. Having
direct connections between intercity and high-speed passenger rail, commuter rail, and local transit options
changes how users of the transportation network move and live.
In many communities, rail service can be the center of economic revitalization efforts. Passenger rail can
prompt both the physical and the economic rebuilding of city centers. Increased foot traffic around stations
has revitalized city centers and encouraged commercial and residential growth as businesses move in to
serve commuters and other passengers. Local roadway congestion is reduced as passengers and freight
move through the area by rail instead of the roads.

National Rail PlanM O V I N G F O R W A R D A P R O G R E S S R E P O R T
26
Grade-crossing safety improvements or grade separation, in combination with quiet zones, can also raise the
quality of life in urban areas.
Environmental Sustainability
The DOT is committed to advancing environmentally sustainable policies and investments that reduce
carbon and other harmful emissions from transportation sources while protecting our natural resources and
reducing our dependence on foreign oil. The DOT will promote the reduction of carbon-intensive travel on
highways and airways and the substitution of more energy efficient transportation systems, including rail,
where feasible. With its comparative energy advantage, rail serves a vital role in helping to reduce the need
for foreign oil and to increase environmental sustainability.
High-performance freight rail is more fuel efficient than trucks, and state-of-the-art, high-speed passenger
rail can provide an environmentally friendly alternative to air travel. Rail can thus contribute to DOT’s goal of
reducing emissions from freight transportation by improving the fuel efficiency of freight vehicles, as well as
by reducing transportation’s petroleum consumption.
CONCLUSION AND NEXT STEPS
The prosperity of the 20th century was built, in part, on the rail investments of the 19th century. Similarly,
the 20th century investments in our interstate highways, waterways, and aviation facilities have enabled us
to produce unprecedented wealth and to compete in the global marketplace. When completed, the first-
ever National Rail Plan will establish the framework necessary to begin laying a foundation that will improve
our transportation network for future generations. The necessary improvements in passenger and freight
mobility will lead to economic, environmental, and societal benefits for all Americans.
This transformational vision can only be accomplished by collaboration and partnerships between Federal,
State, local, and tribal governments, along with private sector investment. During the past year, FRA has
conducted exhaustive research and detailed analysis to develop the recommendations to accomplish
this vision. The next steps to complete the National Rail Plan include identifying regions of the country
where Core/Express, Regional, and Emerging/Feeder corridors could be feasible for a tiered passenger rail
network; estimate investments to develop the passenger rail network and improve freight rail intermodal
corridors (with a comparison to other major infrastructure programs); and, the return on investment,
including public benefits, from such investments. Finally, there will be a comprehensive strategy to
implement the Plan with legislative, policy and administrative recommendations.
National Rail PlanM o v i n g F o r w a r d A P r o g r e s s r e P o r t
National Rail PlanMoving Forward
A P r o g r e s s r e P o r t