National Oceanic and Atmospheric Administration National ...

NATIONAL OCEANIC AND ATMOSPHERIC ADMINISTRATION NATIONAL MARINE FISHERIES SERVICE
COST ANALYSIS OF APPLYING THE LONGSHORE AND HARBOR WORKERS ACT TO FISHERIES OBSERVERS
Preferred Insurance Capital Consultants, LLC 55 NE Fifth Avenue, Suite 502
Boca Raton, FL 33432
October 14, 2005
COST ANALYSIS OF APPLYING THE LONGSHORE AND HARBOR WORKERS ACT TO FISHERIES OBSERVERS
TOC
Preferred Insurance Capital Consultants, LLC
TABLE OF CONTENTS
I. SUMMARY OF CONCLUSIONS.......................................................................... 1
A. Current Program ........................................................................................ 1 B. Projected Costs ......................................................................................... 2 C. Important Issues to Consider in Implementation........................................ 7 D. Recommendations..................................................................................... 9
II. BACKGROUND AND SCOPE OF WORK.......................................................... 10 A. Background.............................................................................................. 10 B. Scope of Work ......................................................................................... 10
III. METHODOLOGY ............................................................................................... 12 A. Introduction .............................................................................................. 12 B. Overview of Loss Rating .......................................................................... 12 C. Data Available for Loss Rating................................................................. 13 D. Variation in Frequency and Severity among LHWC Exposures............... 15 E. Observer Payroll ...................................................................................... 15 F. Observer Expected Claim Frequency Based on Selected “F” Classes.... 16 G. Expected Average Cost per Claim........................................................... 16 H. Expected Losses for Observers Based on LHWC Data........................... 17 I. Expected Annual Number of Observer Claims ........................................ 17 J. Expected Insurance Company Expenses ................................................ 18 K. Loss Adjustment Expense ....................................................................... 18 L. Size of Loss Distribution .......................................................................... 18 M. LHWC Assessments................................................................................ 19 N. Expected Losses by Observer Program, and in Total.............................. 19 O. Estimated Premium by Program, and for All Programs ........................... 19 P. Premium Credits for Accepting a “Deductible” ......................................... 20 Q. Self-Insurance.......................................................................................... 20
IV. ACKNOWLEDGMENTS ..................................................................................... 21 V. CONDITIONS AND LIMITATIONS..................................................................... 22 VI. EXHIBITS ........................................................................................................... 25

COST ANALYSIS OF APPLYING THE LONGSHORE AND HARBOR WORKERS ACT TO FISHERIES OBSERVERS
Page 1
Preferred Insurance Capital Consultants, LLC
I. SUMMARY OF CONCLUSIONS A. Current Program
The National Oceanic and Atmospheric Administration (NOAA), Fisheries Service (NOAA-FS) deploys approximately five hundred fisheries observers to more then twenty fisheries nationwide. These observers work independently on commercial fishing vessels for up to three months without direct supervision. The work can be difficult at times due to unpredictable working and weather conditions. There are two main service models for the fisheries observers (a third model is a cooperative agreement). The first model is for companies under contract to the NOAA-FS. The second model uses NOAA-FS certified observer provider companies which contracts directly with vessel owners. It is the responsibility of the observer provider company to obtain adequate insurance coverage for fisheries observers. Reimbursement of the costs of insurance is made either by the government (such as in the case where there is a contract between the observer provider and the NOAA) or by the commercial vessel owner. We understand there are no standard coverage provisions or minimum legal requirements for insurance. At first pass, state workers compensation laws seem appropriate. Most states have extra-territorial provisions. However, there are significant differences by state in coverage provisions and benefit levels. Plus, some states exclude benefits to workers injured at sea or covered by federal law. It is impractical to amend all state laws to be consistent. Some observer providers purchase Longshore and Harbor Workers Compensation (LHWC) coverage, but this coverage is problematic as it is designed for other types of employees and can be denied by insurers following strict coverage definitions to fisheries observers. Injured fisheries observers have occasionally sought compensation from the Merchant Marine Act of 1920 (commonly called the Jones Act). Indemnity under the Jones Act requires the fisheries observers to be labeled as “seaman” under the definition of the Act. This has resulted in lawsuits with inconclusive outcomes. Observer provider companies have responded to the lack of clear direction by purchasing insurance coverages that may respond to each situation. It is probable that some (perhaps all) contractor providers have
COST ANALYSIS OF APPLYING THE LONGSHORE AND HARBOR WORKERS ACT TO FISHERIES OBSERVERS
Page 2
Preferred Insurance Capital Consultants, LLC
purchased coverages that overlap or are redundant. It has also added reluctance upon vessel owners to take on observers for insurance liability reasons Fisheries observers are not federal employees, but Congress attempted to resolve the issue by amending the Manguson-Stevens Fisheries Conservation and Management Act and extending the Federal Employees Compensation Act (FECA) to observers in 1996. This has been inadequate as FECA does not include overtime pay, does not cover observers in certain work situations and does not prohibit observers from seeking additional damages. In response to the situation, the observer provider industry and NOAA-FS are considering the feasibility and costs of plainly defining fisheries observers as within the scope of LHWC. In fact, this approach has been recommended by independent study (Plan to Manage Risks and Minimize Liabilities Associated with the Deployment of Contracted Fisheries Observers, by David Cox and Roy Goldberg). One of the benefits to observer providers of being under workers compensation is that in almost all instances it is the exclusive remedy and that the observer providers will not be subject to liability litigation. Injured observers will have the certainty that if a work related injury occurs the observer will be compensated regardless of who caused the injury. The broad goals of this study are to analyze the costs and implementation issues of applying the proposed Marine Fisheries Observer Compensation Act (FOCA) as shown in Appendix A of the Plan to Manage Risks and Minimize Liabilities Associated with the Deployment of Contracted Fisheries Observers prepared by NOAA-FS in March, 2003. FOCA is essentially the extension of LHWC to fisheries observers.
B. Projected Costs
1. Brief Discussion of Options
There are two basic ways that the observer providers can manage the projected costs of FOCA. These are a self-insurance program and commercial insurance. a. Self-Insurance
Self-insurance is an arrangement where contract providers fund the costs of claims. It could be on an individual basis or in some type of pooling, captive or risk retention group

COST ANALYSIS OF APPLYING THE LONGSHORE AND HARBOR WORKERS ACT TO FISHERIES OBSERVERS
Page 3
Preferred Insurance Capital Consultants, LLC
organization. The commonality is that the contract providers pay an annual contribution that is designed to pay the projected claims and administer the program. If costs are less then contributions, equity accumulates. If costs are greater the contributions, there is a shortfall that will need to be funded. As a practical matter, most self-insurance programs purchase some type of insurance. The purpose of the insurance is to limit risk. When insurance is purchased for large individual claims it is known as specific excess insurance. Almost all public entities, industry associations and corporations opt for this approach. A minority of self-insurance programs also purchase insurance above a total loss amount. This is called aggregate or stop loss insurance. Self-insurance has been used before in similar situations for federal government agencies. Fisheries observers are different in that they are often working for private contractors. The advantages of self-insurance are usually costs (over the long term) and independent decision making. The key disadvantage is the assumption of risk and the possibility that costs will emerge greater than projected. There is also the task of administration. This requires an understanding of insurance and an appreciation for the financial risks involved.
b. Commercial Insurance
Commercial insurance is where contract providers purchase insurance. The contract providers pay a fixed premium to a commercial insurance company. The insurer pays claims and administers the program. Commercial insurance could be on an individual contractor provider basis or some type of group purchase plan. It has been used before in similar situations for federal government agencies. Fisheries observers are different in that they are often working for private contractors. The advantages of commercial insurance are that costs are set and risk is minimized. It is a “turn-key” decision completely managed by external professionals. The

COST ANALYSIS OF APPLYING THE LONGSHORE AND HARBOR WORKERS ACT TO FISHERIES OBSERVERS
Page 4
Preferred Insurance Capital Consultants, LLC
disadvantage is that costs (over the long term) are usually greater and a degree of independence is lost.
2. Discussion of Self Insurance
Self-insurance includes the projected ultimate losses (indemnity, medical), loss adjustment expense, administration and specific excess insurance. The projected ultimate losses are the accrual value of losses with accident dates in 2006, regardless of report or payment date. Administration includes claims handling, general overhead and taxes/fees. We project the cost of self-insurance to be:
Table I-1
Projected Cost of Self-Insurance 2006
(1) Cost Item
(2) Projected Cost
(A) Projected ultimate losses $739,676(B) Loss adjusting expense 103,555(C) Administration 147,935(D) Specific excess insurance 411,905(E) Assessments 229,878(F) Total (Sum of (A) thru (E)) $1,632,949
Notes: (A) is from Exhibit M.
(B) is 14% of (A) per Exhibit L. (C) is from 20% of (A) based on other similar programs with
which we are familiar. (D) is based on Exhibit M ((b-g) x 125%), per actuarial
judgment. (E) is 21.5% of Exhibit L Total (b).
It is important to understand caveats regarding the projected costs of self-insurance: • The projected ultimate losses are usually based on an
actuarial analysis of historical losses, payroll and changes in operations. In this analysis the actual loss experience, payroll and operations for all observers were not readily

COST ANALYSIS OF APPLYING THE LONGSHORE AND HARBOR WORKERS ACT TO FISHERIES OBSERVERS
Page 5
Preferred Insurance Capital Consultants, LLC
available (A sample of actual data for some observers was provided to PICC). The actuarial work was based in large part on informed judgment and insurance industry statistics. While we believe the projections to be reasonable based on the data available, we emphasize that actual losses may emerge different from projections. They may be higher or lower.
• We have assumed the observer providers will purchase
specific excess insurance for losses that exceed $250,000. • We have projected administrative costs as a rough guide
based on other programs with which we are familiar. Actual costs will vary based on the types of services purchased and other economic factors. The observer providers will need to ascertain actual costs if it moves forward with self-insurance.
• We have estimated the cost of specific excess insurance.
The actual costs will depend upon negations with insurance brokers and providers. Also, the $250,000 self insured retention is only an example. The observer providers may be presented with many options and will need to select the optimal retention based on cost and its willingness to accept risk.
• The amounts in Table I-1 do not consider investment income
as a revenue source. This may reduce costs by approximately 5% to 7%.
• The amounts in Table I-1 are for all contractor providers
combined. We have not calculated costs by individual contract provider.
• The contractor providers will need to consult with insurance
and tax experts before initiating a self-insurance program. • There are additional start-up costs to be considered. • Capitalization is not addressed. The actuarial analysis is detailed in Chapter III, Methodology.

COST ANALYSIS OF APPLYING THE LONGSHORE AND HARBOR WORKERS ACT TO FISHERIES OBSERVERS
Page 6
Preferred Insurance Capital Consultants, LLC
3. Commercial Insurance Commercial insurance is typically priced as payroll (in hundreds of dollars) times a rate per $100 of payroll. We project the cost of commercial insurance to be:
Table I-2 Projected Cost of Commercial Insurance
2006 (1)
Cost Item (2)
Projected Cost
(A) Projected payroll $14,887,862(B) Rate per $100 of payroll $11.46(C) Total ((A)/100X(B)) $1,706,140
Notes: (A) is from Exhibit B
(B) is based on Exhibit L divided by payroll. It is important to understand caveats regarding the projected costs of commercial insurance. • Actual payroll information for all observers was not readily
available. The amount is an approximation based in large part on informed judgment. While we believe the projections to be reasonable based on the data available, we emphasize that actual payroll may be different. Should the observer providers proceed with commercial insurance it will need accurate payroll information.
• We have assumed insurance will be available at rates as
promulgated by the National Council on Compensation Insurance (NCCI). There is no assurance that it will be available at these rates. Insurers charge rates that vary on their own analysis of exposure to loss and risk. The observer providers will need to negotiate carefully for insurance. The rate is intended as a rough guide based on other programs with which we are familiar. The observer providers and NOAA-FS will need to ascertain actual rates if it moves forward with commercial insurance.

COST ANALYSIS OF APPLYING THE LONGSHORE AND HARBOR WORKERS ACT TO FISHERIES OBSERVERS
Page 7
Preferred Insurance Capital Consultants, LLC
• The amounts in Table I-2 are for all observer providers combined. We have not calculated costs by individual observer provider. They may be slightly more as most commercial insurers offer modest discounts based on premium volume.
• We have assumed that investment income and insurer profit
are roughly equal. The commercial insurance analysis is detailed in Chapter III, Methodology.
C. Important Issues to Consider in Implementation
There are many other important issues to consider. Legality New legislation is required for LHWC to be applicable to fisheries observers. As we understand the current situation, there is no legal mechanism for NOAA-FS to initiate or administer a program for the contract providers. It is unclear whether NOAA-FS could even serve as an advisor. When FOCA is enacted, each of the current contract providers would individually need to purchase commercial insurance for LHWC or become a qualified individual self-insured in all the jurisdictions in which they operate (assuming this is allowed under FOCA). If NOAA-FS desires to initiate a self-insurance pool, captive or risk retention group, it will need the legal authority. Of course, the contractor providers could organize a program independent of NOAA-FS. We understand NOAA-FS is not researching the legality issues at the present time since under FOCA and all options described in this analysis would be undertaken by observer providers. Cost Changes Currently, the contract providers purchase many different types of insurance coverage for fisheries observers. This is because there is no clear statutory guidance on the indemnification of injured fisheries observers. In some cases, workers compensation has applied. We have been informed that sometimes claims are made through general liability or the Jones Act. Observers have sought relief through the Federal
COST ANALYSIS OF APPLYING THE LONGSHORE AND HARBOR WORKERS ACT TO FISHERIES OBSERVERS
Page 8
Preferred Insurance Capital Consultants, LLC
Employees Compensation Act (FECA). We have learned of instances in which specialized state programs (Alaska Fishermen’s Fund) has been used. It is probable that some (perhaps all) contractor providers have purchased coverages that overlap or are redundant. It was not possible to obtain information sufficient to determine a dollar amount that is currently being spent on insuring fisheries observers. The cost of initiating benefits payable under LHWC will differ from the current situation. From a pure comparison with workers compensation premiums, contractor provider cost will likely experience an increase. This is especially true for non-Alaska based contractor providers. LHWC benefits are more generous then most states (Alaska being an exception). Some contractor providers, especially those in low benefit states may experience significant increases. The cost increases will be much more moderate or there may even be savings if the myriad of insurance products for indemnifying injured fisheries observers is coordinated. This will depend on each contractor provider’s knowledge and efforts. Coverage Changes There may be some coverage changes. For example, most fisheries observers have some sort of 24 hour coverage for injuries. We believe there have been claims for incidents that appear not to be work related injuries as defined by traditional workers compensation. It is not certain that LHWC will cover all these injuries. Coordination and Data Sharing If there is to be a group self-insurance (such as pooling) or a group commercial insurance program, the contractor providers will almost certainly need to coordinate and share data. This includes employee counts, payroll and loss experience data. One of the smaller contract providers is already self-insured as it is a division of a large corporation. It will probably be able to qualify as a self-insured. Most others will likely need to purchase commercial insurance at least in the short term. Some are simply too small to ever be self-insured as they cannot bear the risk of self-insurance, start up costs and manage the complexities of an individual self-insurance program.

COST ANALYSIS OF APPLYING THE LONGSHORE AND HARBOR WORKERS ACT TO FISHERIES OBSERVERS
Page 9
Preferred Insurance Capital Consultants, LLC
D. Recommendations The cost of self-insurance is approximately $1,632,949 (less about 5% to 7% for investment income) and the cost of commercial insurance is $1,706,140. Therefore, from a pure expected cost perspective, self-insurance is slightly less expensive. Never-the-less, we strongly recommend an insured program at least in the first few years. There is a paucity of reliable loss experience and exposure data from which to project losses. As such we relied on insurance industry data. The observer provider industry may not be an exact fit to the data. There is significant variance inherent in our projections. By being commercially insured, the observer providers will be able to begin a program to collect statistically reliable data from which to develop projections in the future. We are concerned about the contractor providers having relatively modest knowledge of workers compensation issues. Again, a few years of commercial insurance coverage will enable them to establish the requisite industry familiarity to manage a self-insurance program. Capitalization is another bottleneck. A self-insurance program almost always requires capitalization in the event losses emerge worse than expected. The contract providers will need to work out a plan for accumulating capital. At this point, we recommend interested parties work with the industry to seek to expand the LHWC to include fisheries observers. We recommend the contractor providers pool their efforts and premiums to obtain the lowest cost for commercial insurance coverage. They should begin to collect accurate insurance information and become knowledgeable in the requirements of managing a self-insurance program.

COST ANALYSIS OF APPLYING THE LONGSHORE AND HARBOR WORKERS ACT TO FISHERIES OBSERVERS
Page 10
Preferred Insurance Capital Consultants, LLC
II. BACKGROUND AND SCOPE OF WORK A. Background
NOAA-FS deploys approximately five hundred fisheries observers to more then twenty fisheries nationwide. These observers work independently on commercial fishing vessels for up to three months without direct supervision. The working can be difficult at times due to unpredictable working and weather conditions. Currently, it is the responsibility of the observer provider company to obtain adequate insurance coverage for observers. Reimbursement of the costs of insurance is made either by the government (such as in the case where there is a contract between the observer provider and the NOAA-FS) or by the commercial vessel owner. There are no standard coverage provisions or minimum legal requirements for insurance. In the course of our work, we found several complications when trying to compile loss experience data. As mentioned before observers are not consistently considered seaman. We understand some courts have ruled fisheries observers as seaman and others have not. So, the source of compensating injured observers is tangled. It is not just one source and often a mixture of several. These include regular workers compensation, LHWC, contractor providers (out-of-pocket), vessel owners (under general liability), Jones Act and FECA funds. There is no standardization of injury forms or reporting. In fact, there appears to be no uniform coverage or compensable injury definitions.
B. Scope of Work The specific scope of work is: 1. Current Program. Review the features and costs of the current
program by which observers are compensated for work related injuries.
2. Projected Costs.
a. Self Insurance. Project the annual costs of self insurance
under coverage similar to that provided to employees with LHWC coverage.
COST ANALYSIS OF APPLYING THE LONGSHORE AND HARBOR WORKERS ACT TO FISHERIES OBSERVERS
Page 11
Preferred Insurance Capital Consultants, LLC
b. Commercial Insurance. Project the annual premiums for commercial insurance under coverage similar to that provided to employees with LHWC coverage.
3. Implementation. Discuss the costs, feasibility and procedures for
implementation.

COST ANALYSIS OF APPLYING THE LONGSHORE AND HARBOR WORKERS ACT TO FISHERIES OBSERVERS
Page 12
Preferred Insurance Capital Consultants, LLC
III. METHODOLOGY Our methodology follows: A. Introduction
Insurance costs have three basic cost components: • The expected cost of claims • The “overhead” costs • Provision for profit and/or actual claims costs exceeding expected
claims costs. For most types of insurance and for workers compensation in particular, the largest component of insurance cost is the expected cost of claims (called expected “losses” in insurance industry jargon). Expected losses are determined using one or both of two fundamental approaches: • Loss rating approach • Exposure rating approach
B. Overview of Loss Rating
In loss rating, the insurer bases its calculation of a loss rate on the historical loss experience of the accounts, individually for large accounts, and by group of similar accounts for smaller accounts. A comparison is made of historical losses and historical units of exposure to loss. For workers compensation, a unit of exposure in the vast majority of instances is payroll (in units of $100, or payroll in hundreds). Occasionally, hours worked, or employee count, may be an acceptable substitute for payroll data. After applying a variety of actuarial adjustments to historical data, the adjusted losses divided by payroll results in an expected cost per $100 of payroll, called an “expected loss rate.” Multiplying the expected loss rate by expected future exposure produces estimated expected losses for the coming period (upcoming year). The addition of provisions for overhead and profit results in a premium to be charged.

COST ANALYSIS OF APPLYING THE LONGSHORE AND HARBOR WORKERS ACT TO FISHERIES OBSERVERS
Page 13
Preferred Insurance Capital Consultants, LLC
C. Data Available for Loss Rating PICC’s initial approach at loss rating started with data collection. PICC sent a detailed data request to each observer provider. The data requested sought from each Observer Provider was its historical data on payrolls and claims costs for observers in their employ. Only one of the observer providers responded with data that appeared suitable for actuarial loss rating (though we did have some questions regarding claims that seemed outside the traditional definition of workers compensation). In the remaining many instances, corresponding payroll and complete loss experience data was not provided. Given the absence of both payroll and complete loss data obtained directly from many observer providers, PICC then elected to substitute relevant data from external sources in order to implement an exposure rating analysis. PICC analyzed the sample of data provided by observer providers to test the reasonableness of actuarial judgments made in this analysis. Exhibit K-2 WC PP displays the pure premium (PP), the losses per unit of exposure, calculated from the sample data, where PICC removed claims that it believed (based on claims descriptions) are not covered by traditional workers compensation. Exhibit K-3 (PP Incl. Non-WC) displays the same calculation based on all claims in the sample, including claims that may not be covered by traditional workers compensation. The pure premium used in this analysis is displayed in Exhibit K-1 EL Prog, and it falls between the pure premiums calculated in Exhibits K-2 and K-3. Thus, PICC concluded that the industry data used in this analysis is a reasonable proxy for actual observer provider data that could not be obtained. An expected loss rate implicitly has two components: an expected frequency of claims (e.g., claim count / payroll), and an expected severity of claims (e.g., total losses / claim count). Multiplying an expected claim frequency by and expected claim severity provides an estimated expected loss rate.
(Claim count / payroll) x (losses / claim count) = losses / payroll = expected loss rate
The National Council on Compensation Insurance (NCCI) is a workers compensation statistical agent and rate service organization funded by the insurance industry, and licensed by the states in which it provides statistical and rating services. PICC has found that it is a reliable source

COST ANALYSIS OF APPLYING THE LONGSHORE AND HARBOR WORKERS ACT TO FISHERIES OBSERVERS
Page 14
Preferred Insurance Capital Consultants, LLC
of data and provides the widest geographic range of services. Services that NCCI provides include: • Organization of workers compensation data into classification
codes (classification codes includes both four digit code numbers, and phraseology that describes the activities of employers whose data is included within each of the approximately five hundred separate classification codes).
• Calculation and publication of expected loss rates by class code, by
state. Included in NCCI’s analysis of expected loss rates by class code for individual states are expected loss rates by class code based on “National” data (NCCI’s national database includes 35 of the 50 states).
• Compilation and publication of data underlying determination of
expected loss rates by class code, including standard actuarial adjustments).
There is a subset of NCCI class codes, called “F” (or Federal) classes that reflect the experience of employers who come under LHWC. Exhibit A displays a list of the “F” classes. PICC has reviewed the phraseologies associated with the full list of “F” classes, and has concluded that there are three classes that seem more likely than others to contain exposures to work place injury similar to that presented by observers. Those classes are: Class Code Phraseology 6826 Marinas and Drivers: Coverage Under US Act 8709 Stevedoring: Talliers and Checking Clerks Engaged in
Connection with Stevedore Work 8726 Steamship Line or Agency – Port Employees:
Superintendents, Captains, Engineers, Stewards or Their Assistants, Pay Clerks
In reviewing the above list of class codes, it must be kept in mind that for PICC’s purposes in this report, it is not relevant whether observers are actually conducting the same activities as employees included under these classes. It is relevant that the expected frequency of job related injuries for employees within these class codes be approximately the same as the expected frequency of job related injuries for observers.

COST ANALYSIS OF APPLYING THE LONGSHORE AND HARBOR WORKERS ACT TO FISHERIES OBSERVERS
Page 15
Preferred Insurance Capital Consultants, LLC
D. Variation in Frequency and Severity among LHWC Exposures By reviewing separately the claim frequency, and the claim severity, of experience under LHWC, PICC has concluded that for employees under LHWC, while claim frequency varies significantly among groups of class codes within the “F” classes, there is much less variation in cost per claim among groups of class codes within the “F” classes. Row (18), column (h) of Exhibit A displays the frequency of claims per $1,000,000 of employee payroll. We see that for all types of claims where the worker suffered an injury that required missing work, the claim frequency for selected class codes is approximately 60% of the claim frequency for all “F” classes. Row (18), columns (f) and (g), display the fact that for both serious injuries, and for non-serious injuries, the relative frequency of claims for selected class codes to all “F” classes is approximately the same as for all types of injuries combined (i.e., 65% and 59% vs. 60%). PICC then reviewed the relationship of the expected loss rates for selected class codes to the expected loss rates for all “F” classes combined. Exhibit A, row (18), column (j) demonstrates that on a national basis the average expected loss rate for the selected class codes is approximately 65% of the average expected loss rates for all “F” classes combined. Since the difference between selected class codes and all “F” classes as respects frequency is almost identical to the difference as respects expected loss rates (60% vs. 65%), PICC concludes that the major component necessary to evaluate expected costs if observers are covered under the LHWC Act is the expected claim frequency for observers. Based on the selected class codes, PICC expects, per $1,000,000 of payroll, 1.24 claims where the injured worker is out at least 7 days (Exhibit A, col. (h). row (17)).
E. Observer Payroll As noted earlier, PICC’s data requests to observer program managers did not produce data suitable for an actuarial analysis. PICC research identified a publication, “Plan to Manage Risks and Minimize Liabilities Associated with the Deployment of Contracted Fisheries Observers” that was useful in estimating annual Observer payroll. PICC estimates that total annual observer program payroll is in the range of $15 million, as derived in Exhibit B. The implication is that there are roughly 500 observers. This is consistent with our understanding of the program.

COST ANALYSIS OF APPLYING THE LONGSHORE AND HARBOR WORKERS ACT TO FISHERIES OBSERVERS
Page 16
Preferred Insurance Capital Consultants, LLC
F. Observer Expected Claim Frequency Based on Selected “F” Classes
NCCI in a separate publication displays average frequency of claims per year per 100,000 workers for workers under LHWC. NCCI data for all “F” classes combined indicates 5 injuries where the injured worker is out at least 7 days per 100 workers each year (Exhibit C, row (1)). Adjusting this rate to be reflective of selected class codes indicates an average frequency rate of 3 injuries per 100 observers per year (60% x 5). PICC estimates an average annual payroll per observer of $35,000, and an annual payroll for the “F” class employees of $50,000. Because the average wage level of observers is lower than that of the average wage level in “F” classes, an adjustment is required to recognize the same frequency of injury per employee will produce a higher claim frequency per $1,000,000 of payroll, and vice versa. PICC estimates that claim frequency for observers during “sea-days” will be comparable to claim frequency for “F” classes, while claim frequency for observers during “land-days” will be approximately 10% of the claim frequency for “F” classes as most land days is for class room instruction. Combining these adjustments, PICC estimates an expected claim frequency of 2.7 claims per 100 observer work years (Exhibit C, row (9)). Converting the expected claim frequency from a per 100 observers basis to per $1,000,000 of payroll basis results in an expected frequency of 0.78 claims per $1,000,000 of payroll (Exhibit C, row (11)).
G. Expected Average Cost per Claim Exhibit D displays PICC’s analysis of expected average claim severity. The reported LHWC average cost per claim of approximately $54,500 trended to January 1, 2006 at an annual increase of 4% results in a trended average cost of approximately $66,500 (row (7)). Because indemnity benefits are typically set at 2/3s of wages, and because observer wage levels are generally below the wage that sets the maximum weekly benefit under LHWC, it is necessary to adjust the LHWC average severity to reflect the lower observer wage level. The observer wage level is estimated to be 70% of the LHWC wage level, and indemnity benefits are reported to be 52% of total LHWC losses (an 80% factor was applied to recognize that adjusting severity for relative wage levels may overstate the difference in maximum weekly benefits when higher LHWC wage levels produce a maximum benefit that is capped), resulting in a

COST ANALYSIS OF APPLYING THE LONGSHORE AND HARBOR WORKERS ACT TO FISHERIES OBSERVERS
Page 17
Preferred Insurance Capital Consultants, LLC
12% reduction in expected severity for observers as compared to LHWC claims (Exhibit D, row (11)). There are some claims under LHWC where medical benefits are provided, but no lost time indemnity benefits are required. The cost of “medical only” claims is 2.0% of total LHWC benefits. Given the small dollar value, PICC did not separately analyze the frequency and severity of “medical only claims. Rather, PICC has increased the average severity to include the cost of medical only claims, resulting in a final estimated cost per claim of $59,400 (Exhibit D, row (14)) for observers based on LHWC data.
H. Expected Losses for Observers Based on LHWC Data Expected losses are the product of expected cost per claim, and expected number of claims. The expected cost per observer lost time claim based on LHWC data is $59,400. The expected number of observer claims is calculated as 0.78 claims per $1,000,000 of observer payroll based on all LHWC data adjusted to observer levels (Exhibit C, row (11)). Combining the expected claim frequency 0.78 per $1,000,000 of payroll with the expected claim severity of $59,400 produces PICC’s estimate of annual expected losses for fisheries observers approximately $690,000 if covered under LHWC (see Exhibit E). Thus, losses are approximately 4.6% of payroll. In the immediately following section of this report PICC modifies its estimate of the expected number of observer claims to incorporate claim counts reported for the North Pacific Groundfish program.
I. Expected Annual Number of Observer Claims Exhibit F, Section A displays PICC’s calculation of the annual expected number of observer lost time claims (23 claims) that would be covered under LHWC based on data from the North Pacific Groundfish program. Exhibit F, Section B displays PICC’s calculation of the annual expected number of observer lost time claims (12 claims) that would be covered under LHWC based on “F” Class data. Exhibit F, Section C displays PICC’s final selection of the expected number of lost time claims for observers if they are covered under the LHWC Act (18 claims annually).

COST ANALYSIS OF APPLYING THE LONGSHORE AND HARBOR WORKERS ACT TO FISHERIES OBSERVERS
Page 18
Preferred Insurance Capital Consultants, LLC
J. Expected Insurance Company Expenses The product of expected number of claims and expected cost per claim produces expected losses. To arrive at an expected insurance premium, expected losses must be increased to reflect insurance company overhead, and the cost of adjusting claims. Exhibit G-1 displays PICC’s analysis of expected insurance company overhead. As a percentage of premium, insurance company overhead decreases as premium increases due to economies of scale. For premiums under $5,000 per year, production on average is 17% of premium, and general expense is 6% of premium. For the largest size premiums, production decreases to 8% of premium, and general expense decreases to 1.6% of premium (Exhibit G-1, Section A). Exhibit G-1, Section B, row (1) displays annual premiums for selected premium sizes. Section B, rows (7) and (8) displays estimated insurance company expense provisions by size of premium as a percent of premium on a “standard basis” and on a “direct basis,” respectively. Standard premium is prior to reflection of economies of scale, and direct premium is what the employer pays.
K. Loss Adjustment Expense Exhibit G-2 displays a ten year history of countrywide workers compensation loss adjustment expenses (LAE) as a percentage of losses (i.e., as a percentage of the sum of indemnity and medical benefits), on a countrywide basis. Row (14) displays PICC’s selected provisions for allocated loss adjustment expense (ALAE), and for unallocated loss adjustment expense (ULAE). PICC’s selected provisions for ALAE, and for ULAE, are lower than the countrywide average because the average cost per claim for claims under LHWC is substantially higher than the countrywide average cost per claim, and LAE expenses are not proportionately higher.
L. Size of Loss Distribution It is important for purchasers of insurance to have some degree of understanding of the likelihood of large claims. NCCI segregates the approximately 500 classifications into four “hazard groups” where hazard group one has the lowest average severity, and hazard group 4 has the highest average severity. The countrywide average hazard group is 2.5, and the average hazard group for observers is estimated to be 3.5 as calculated in Exhibit H.

COST ANALYSIS OF APPLYING THE LONGSHORE AND HARBOR WORKERS ACT TO FISHERIES OBSERVERS
Page 19
Preferred Insurance Capital Consultants, LLC
Exhibit I displays the expected distribution of observer losses by size of claim. As can be seen in column (h), approximately 32% of all observer losses under the LHWC Act would be attributable to the first $25,000 per claim. Conversely, 68% of all losses would be attributable to dollars in excess of $25,000 on any claim. 14% of all losses would be attributable to dollars in excess of $1,000,000 per claim. These are long-range estimates, and given the relatively small volume of observer data, from year to year one would expect substantial differences in the distribution of losses by size of claim.
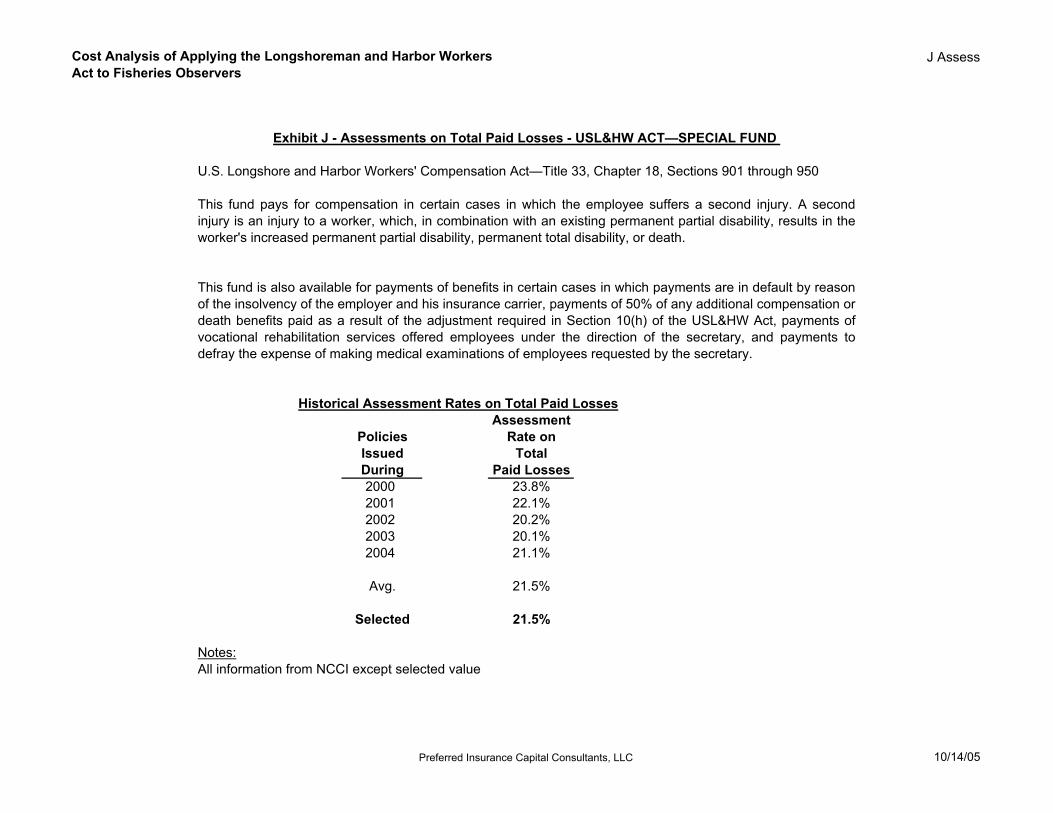
M. LHWC Assessments LHWC compensation payments are subject to assessments. Exhibit J provides a description of the assessments and a history of assessment rates. PICC estimates that one should expect an average long-term assessment rate equal to 21.5% of losses.
N. Expected Losses by Observer Program, and in Total As explained earlier, expected losses are the product of the expected number of claims, and the expected cost per claim. Exhibit K displays PICC’s calculation of expected losses if observers are covered under LHWC. Note that expected losses are allocated proportionately among observer programs based on estimated payrolls. To the extent that actual exposure to claims is not proportional to payroll, these estimates would require adjustment.
O. Estimated Premium by Program, and for All Programs Exhibit L displays PICC’s estimate of required premium if observers are covered under LHWC. Col. (e) displays expected losses increased to include provision for loss adjustment expense, and for the LHWC assessment on paid losses. Col. (f) displays expenses prior to adjustment for economies of scale, excluding premium taxes. Similarly, col. (g) displays estimated premium prior to adjustment for economies of scale, excluding premium taxes. Col. (h) displays provision for insurance company expenses including reductions for economies of scale. Col. (h) also includes a 5% provision for premium taxes, based on the countrywide average for this component of cost. Col. (i) displays estimated premium by program, and the sum for all eight programs. Row (8) displays the “consolidated” result. That is, the cost if all observer programs were insured as a single program (i.e., increased economy of scale). The savings from a consolidated program is expected to be about 1.5%.

COST ANALYSIS OF APPLYING THE LONGSHORE AND HARBOR WORKERS ACT TO FISHERIES OBSERVERS
Page 20
Preferred Insurance Capital Consultants, LLC
P. Premium Credits for Accepting a “Deductible” In workers compensation true deductibles do not exist. Rather, there are loss reimbursement programs wherein the insured employer reimburses the insurer for the dollars under the “deductible.” Exhibit M, columns (c) through (g) display expected premium credits if the employer accepts a deductible per claim in one of the amounts listed above row (1). Note that for several programs and deductible amounts, “n/a” (or not applicable) is listed. This is because PICC would strongly recommend that no employer accept a deductible greater than approximately 25% of expected losses. Rows (i) through (m) display estimated premium net of deductible credits. The “consolidated program” (rows (7) and (14)) assumes that the bserver providers join together in a single insurance program.
Q. Self-Insurance It is PICC’s conclusion that the size of risk for the observer provider, whether viewed on a provider-by-provider basis, or as a single consolidated provider, should not be self-insured for a number of reasons (including, but not limited to the following). 1. Adequate historical observer program data does not presently exist. 2. There is substantial uncertainty as to the expected frequency and
severity of claims if observers are covered under LHWC, 3. There is no information as to whether observer providers have the
financial wherewithal to provide sufficient start up capital to operate a self-insurance program
4. There is no indication that individual observer providers are willing
to operate under a pooled self-insurance mechanism.
COST ANALYSIS OF APPLYING THE LONGSHORE AND HARBOR WORKERS ACT TO FISHERIES OBSERVERS
Page 21
Preferred Insurance Capital Consultants, LLC
IV. ACKNOWLEDGMENTS In the course of work we relied upon the work of others. In particular, we acknowledge the following: 1. Review and Evaluation of NOAA-FS Observer Training Alaska Marine
Safety Education Association (AMSEA), by Deb Ajango, Paula Cullenberg, and Jerry Dzugan.
2. Plan to Manage Risks and Minimize Liabilities Associated with the
Deployment of Contracted Fisheries Observers, by David Cox and Roy Goldberg.

COST ANALYSIS OF APPLYING THE LONGSHORE AND HARBOR WORKERS ACT TO FISHERIES OBSERVERS
Page 22
Preferred Insurance Capital Consultants, LLC
V. CONDITIONS AND LIMITATIONS Actual Costs This study is intended as a summary of key cost components. Actual costs will necessitate solicited bids for coverage and services. Best Estimate These caveats and limitations notwithstanding, the conclusions represent our best estimate of the actuarial status and funding requirements of the program as of the date of this report. Capitalization Capitalization is a buffer in the event loss experience emerges worse than expected. The amount varies by retention, size of program and other factors. Some jurisdictions of domicile may require statutory minimums. Nothing in this report addresses the amount of recommended capitalization or methods of accumulation. As insurance is an inherently risky venture, individuals or entities contributing capital need to understand the possibility of loss of capital. Consistency The conclusions are predicated on the assumptions that the selected reporting, reserving, and payment patterns, frequency and severity trends, and claim distributions apply, and will continue to apply, to the program. The risk exposure covered by the program as well as the claim reserving, management, and settlement practices are assumed to be consistent over time, except as noted. Data Reliance The data for this study was obtained from a variety of external sources. In the study, we relied on the accuracy and completeness of this data without independent audit. If the data is inaccurate or incomplete, our findings and conclusions may need to be revised. Distribution The report was prepared for the sole use of NOAA. Distribution to others without our prior written consent is unauthorized. With our consent, the report may be distributed only in its entirety.

COST ANALYSIS OF APPLYING THE LONGSHORE AND HARBOR WORKERS ACT TO FISHERIES OBSERVERS
Page 23
Preferred Insurance Capital Consultants, LLC
Effective Period The rating plan features in this actuarial study are intended to be effective January 1, 2006 for one year policies. The data supplied to PICC includes data valued at a variety of other dates. Rates and insurance industry conditions are dynamic and change over time. Nothing in this actuarial study addresses the likelihood or timing of rating revisions. We recommend periodic reviews (one year maximum). We do not assume responsibility to inform NOAA of events that may warrant a revision. Entire Document The conclusions within this study are developed in the accompanying text and exhibits, which together comprise the report. Experience Rating Under some conditions, experience rating may apply to contractor providers. We have not reviewed this feature. Investment Income There has been no consideration of investment income earned on funds held to pay losses or capitalization. Investment income is a supplemental revenue source that varies by interest rate assumption and payout schedule. It is reasonable to assume approximately a 5% to 10% discount from the base rates due to investment income under self-insurance. This will vary by coverage. Management Reliance Information concerning the Observer program structure and risk exposure was provided by the client. In the study, we relied on the accuracy and completeness of this information without independent verification. If the information is inaccurate or incomplete, our findings and conclusions may need to be revised. Significant Digits Numbers in the exhibits generally display more significant digits than their accuracy suggests. This purpose is to simplify review of the calculations. Study Foundations The study conclusions were based on analysis of the available data and on the estimation of many contingent events. Future costs were developed from the

COST ANALYSIS OF APPLYING THE LONGSHORE AND HARBOR WORKERS ACT TO FISHERIES OBSERVERS
Page 24
Preferred Insurance Capital Consultants, LLC
historical claim experience and covered exposure, with adjustments for anticipated changes. Unanticipated Changes Unanticipated changes in factors such as judicial decisions, legislation actions, claim consciousness, claim management, claim settlement practices, and economic conditions may significantly alter the conclusions. Uncertainty Due to the uncertainties inherent in the estimation of future costs, it cannot be guaranteed that the estimates set forth in the report will not prove to be inadequate or excessive and that actual costs may vary significantly from our estimates. Underlying Assumptions In addition to the assumptions stated in the report, numerous other assumptions underlie the calculations and results presented herein.
COST ANALYSIS OF APPLYING THE LONGSHORE AND HARBOR WORKERS ACT TO FISHERIES OBSERVERS
Page 25
Preferred Insurance Capital Consultants, LLC
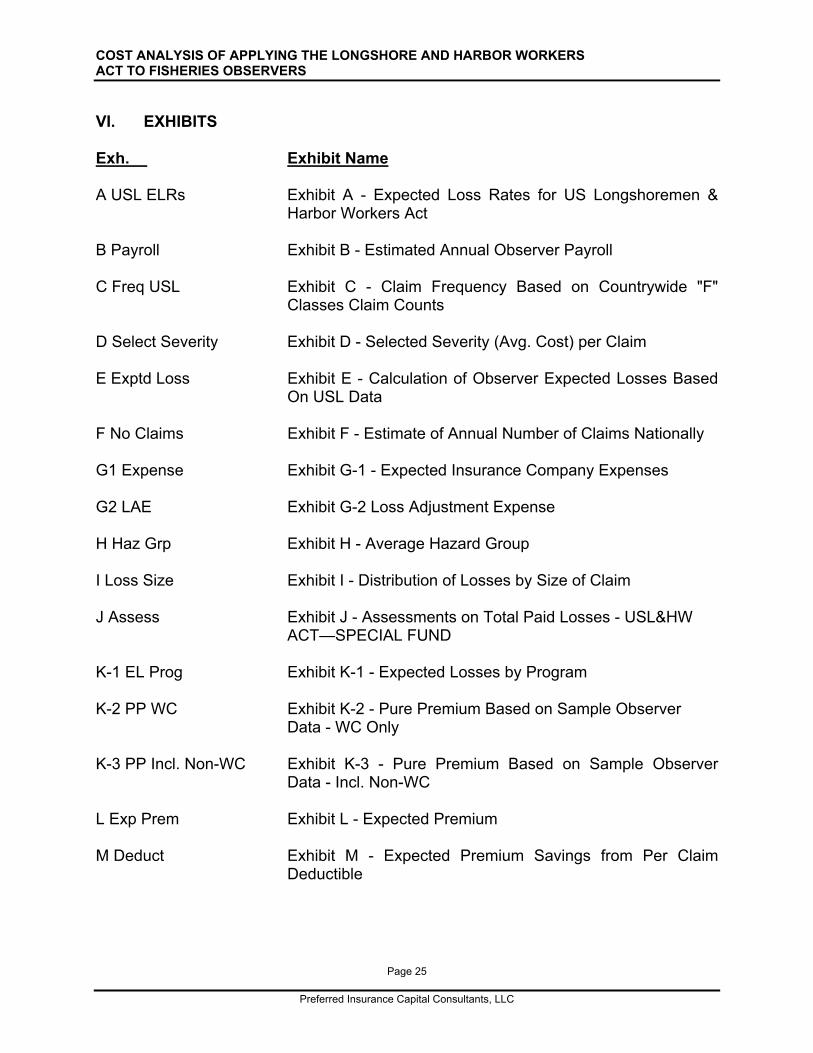
VI. EXHIBITS Exh. Exhibit Name A USL ELRs Exhibit A - Expected Loss Rates for US Longshoremen &
Harbor Workers Act B Payroll Exhibit B - Estimated Annual Observer Payroll C Freq USL Exhibit C - Claim Frequency Based on Countrywide "F"
Classes Claim Counts D Select Severity Exhibit D - Selected Severity (Avg. Cost) per Claim E Exptd Loss Exhibit E - Calculation of Observer Expected Losses Based
On USL Data F No Claims Exhibit F - Estimate of Annual Number of Claims Nationally G1 Expense Exhibit G-1 - Expected Insurance Company Expenses G2 LAE Exhibit G-2 Loss Adjustment Expense H Haz Grp Exhibit H - Average Hazard Group I Loss Size Exhibit I - Distribution of Losses by Size of Claim J Assess Exhibit J - Assessments on Total Paid Losses - USL&HW
ACT—SPECIAL FUND K-1 EL Prog Exhibit K-1 - Expected Losses by Program K-2 PP WC Exhibit K-2 - Pure Premium Based on Sample Observer
Data - WC Only K-3 PP Incl. Non-WC Exhibit K-3 - Pure Premium Based on Sample Observer
Data - Incl. Non-WC L Exp Prem Exhibit L - Expected Premium M Deduct Exhibit M - Expected Premium Savings from Per Claim
Deductible

Cost Analysis of Applying the Longshoreman and Harbor WorkersAct to Fisheries Observers
A USL ELRs
Exhibit A - Expected Loss Rates for US Longshoremen & Harbor Workers Act
(a) (b) (c) (d) (e) (f) (g) (h) (i)NationalExpected
Claim Frequency per Loss RateClass Claim Count $1,000,000 of Payroll per $100Code Payroll Ser. Non-Ser. Total Ser. Non-Ser. Total of Payroll
(1) 6801 1,786,275 0 3 3 0.00 1.68 1.68 1.13(2) 6824 74,437,810 14 104 118 0.19 1.40 1.59 6.48(3) 6826 42,286,518 14 81 95 0.33 1.92 2.25 9.48(4) 6828 39,888,993 4 61 65 0.10 1.53 1.63 7.30(5) 6843 37,846,068 14 137 151 0.37 3.62 3.99 11.22(6) 6845 1,690,248 1 10 11 0.59 5.92 6.51 7.81(7) 6872 65,132,913 15 190 205 0.23 2.92 3.15 13.63(8) 6874 6,154,883 6 11 17 0.97 1.79 2.76 17.67(9) 7309 10,204,351 3 28 31 0.29 2.74 3.04 19.42
(10) 7313 2,121,786 0 0 0 0.00 0.00 0.00 4.00(11) 7317 39,098,814 9 47 56 0.23 1.20 1.43 9.31(12) 7327 12,029,838 4 23 27 0.33 1.91 2.24 13.59(13) 7380 14,629,928 4 37 41 0.27 2.53 2.80 16.53(14) 8709 24,938,487 2 11 13 0.08 0.44 0.52 4.57(15) 8726 46,527,542 0 33 33 0.00 0.71 0.71 3.65
Tot. or Avg.(16) of All Codes 418,774,454 90 776 866 0.21 1.85 2.07 9.24
(17) Tot. or Avg.of Codesin Bold 113,752,547 16 125 141 0.14 1.10 1.24 6.02
(18) Ratio:Bold / All 27% 18% 16% 16% 65% 59% 60% 65%
Notes:Col. (a) - (i), rows (1) - (15), from NCCI rate filing in Florida effective 4/1/03.
Preferred Insurance Capital Consultants, LLC 10/14/05

Cost Analysis of Applying the Longshoreman and Harbor WorkersAct to Fisheries Observers
B Payroll
Exhibit B - Estimated Annual Observer Payroll
(a) (b) (c) (d) (e) (f) (g)Sea-Daysas Pct. ofSea-Days Est. Annual
and Est. No. ObserverEst. Pay / Est. Pay / Land-Days Land-Days Payroll
Observer Programs Sea-Days Sea-Day Land-Day Combined (b)/(e) - (b) (b)x(c)+(d)x(f)(1) North Pacific Groundfish 37,000 $140 $80 60% 24,667 $7,153,333(2) West Coast 5,660 135 90 60% 3,773 1,103,700(3) Northeast Groundfish 10,682 200 100 60% 7,121 2,848,533(4) Southeast 2,993 250 110 60% 1,995 967,737(5) Southwest 1,180 200 110 60% 787 322,533(6) Pacific Islands 11,175 165 87 60% 7,450 2,492,025
Total 68,690 45,793 $14,887,862
Notes:Col. (a), (b), (c), and (d) provided by ClientCol. (e) based on limited sample
Preferred Insurance Capital Consultants, LLC 10/14/05

Cost Analysis of Applying the Longshoreman and Harbor WorkersAct to Fisheries Observers
C Freq USL
Exhibit C - Claim Frequency Based on Countrywide "F" Classes Claim Counts
(1) Frequency per 100 workers - all "F" classes 5.0(2) Relative frequency for selected class codes 60%(3) Estimated annual payroll per worker - all "F" classes 50,000(4) Estimated annual payroll per Observer 35,000(5) Factor to adjust frequency to Observer annual payroll level = (3) / (4) 1.43(6) Expected frequency per 100 Observers for Sea-Days = (1) x (2) x (5) 4.3(7) Sea-Days as % of Sea-Days and Land-Days Combined 60%(8) Expected % of lost-time claims for Land-Days as compared to Sea-Days 10%(9) Expected total frequency per 100 Observers = ((7) x (6)) + ([1.0 - (7)] x (6) x (8)) 2.7
(10) Estimated annual payroll per 100 Observers = (4) x 100 3,500,000(11) Expected claim frequency per $1,000,000 of payroll = (9) / (10) x 1,000,000 0.78
Notes:Row (1) from Annual Statistical Bulletin, 2004 Ed., published by NCCIRow (2) based on Exhibit A, row (18)Row (4) based on report to NOAA Contract No. 50-DGNF-1-90089Row (7) from Exh. B, col. (e)Row (8) based on PICC judgment
Preferred Insurance Capital Consultants, LLC 10/14/05

Cost Analysis of Applying the Longshoreman and Harbor WorkersAct to Fisheries Observers
D Select Severity
Exhibit D - Selected Severity (Avg. Cost) per Claim
(1) Avg. cost per indemnity claim - USL 54,482(2) Avg. date of accident for row (1) 1/1/2001(3) Assumed avg. date of accident for analysis 1/1/2006(4) Annual severity trend 4%(5) No. of years between avg. accident date and analysis date = (3) - (2) 5(6) Severity trend factor 1.22(7) Trended avg. cost per indemnity claim - USL = (1) x (6) 66,468(8) Estimated annual payroll per worker - all "F" classes 50,000(9) Estimated annual payroll per Observer 35,000
(10) Indemnity losses as a percentage of total losses for "F" classes 52%(11) Adjustment to average severity to reflect Observer wage level = (100% - (9)/(8)) x (10) x 80% 12%(12) Trended avg. cost per indemnity claim - Observer = (7) x (100% - (11)) 58,173(13) Cost of medical only claims as percent of total losses - USL 2.0%(14) Average severity adjusted to include provision for medical only claims = (12) / (100% - (13)) 59,400
Notes:Rows (1), (2), and (13) from Annual Statistical Bulletin, 2004 Ed., published by NCCI
Preferred Insurance Capital Consultants, LLC 10/14/05

Cost Analysis of Applying the Longshoreman and Harbor WorkersAct to Fisheries Observers
E Exptd Loss
Exhibit E - Calculation of Observer Expected Losses Based On USL Data
(a) (b) (c) (d) (e) (f)Selected
Claim Annual ExpectedFrequency Expected Losses as
Est. Annual Per Selected Losses Pct. ofObserver $1,000,000 Claim (b)x(c)x(d) / Payroll
Observer Programs Payroll of Payroll Severity $1,000,000 (e) / (b)(1) North Pacific Groundfish $7,153,333 0.78 59,400 $331,428 4.6%(2) West Coast 1,103,700 0.78 59,400 51,137 4.6%(3) Northeast Groundfish 2,848,533 0.78 59,400 131,978 4.6%(4) Southeast 967,737 0.78 59,400 44,837 4.6%(5) Southwest 322,533 0.78 59,400 14,944 4.6%(6) Pacific Islands 2,492,025 0.78 59,400 115,461 4.6%
Total $14,887,862 $689,784 4.6%
Notes:Col. (b) from Exhibit B, col. (g)Col. (c) = Exhibit C, row (11)Col. (d) = Exhibit D, row (14)
Preferred Insurance Capital Consultants, LLC 10/14/05

Cost Analysis of Applying the Longshoreman and Harbor WorkersAct to Fisheries Observers
F No Claims
Exhibit F - Estimate of Annual Number of Claims Nationally
Section A - Observer Data - Jurisdiction: North Pacific Groundfish
(1) Percentage of national exposure in jurisdiction 65%(2) No. of claims in jurisdiction 246(3) Est. number of claims for all jurisdictions = (2) / (1) 378(4) No. of years in which claims incurred (6/28/99 - 12/15/02) 3.5(5) Est. annual number of claims for all jurisdictions = (3) / (4) 108(6) No. of non-workers compensation claims in jurisdiction 68(7) Percentage of non-workers compensation claims in jurisdiction = (6) / (2) 28%(8) Estimated annual number of workers compensation (WC) claims for all jurisdictions = (5) x (100% - (7)) 78(9) Percentage of "F" classes claims requiring lost time benefits 29%
(10) Estimated annual number of Observer lost time WC claims on sea-days for all jurisdictions = (8) x (9) 23
Section B - "F" Class Data
(11) Est. claim frequency, national, per $1,000,000 of payroll 0.78(12) Est. annual Observer payroll $14,887,862(13) Est. annual number of claims for all jurisdictions (11) x (12) / $1,000,000 12
Section C - Selected Annual Number of Lost Time Workers Compensation Claims for Observers
(14) Selected estimate of annual number of lost time workers compensation claims for Observers = ((10)+(13))/2 18
Notes:Rows (1), (2), (4) and (6) from "REVIEW AND EVALUATION OF NMFS OBSERVER SAFETY TRAINING FINAL REPORT"Row (9) from NCCI Annual Statistical BulletinRow (11) from Exhibit E, col. (c)Row (12) from Exhibit E, col. (b)
Preferred Insurance Capital Consultants, LLC 10/14/05

Cost Analysis of Applying the Longshoreman and Harbor WorkersAct to Fisheries Observers
G1 Expense
Exhibit G-1 - Expected Insurance Company Expenses
Section A - Expense Provisions
(a) (b) (c) (d) (e) (f)Premium in IntervalFrom To Production General Sum Discount
0 5,000 17.0% 6.0% 23.0% 0.0%5,001 100,000 9.5% 3.4% 12.9% 10.9%
100,001 500,000 8.0% 3.2% 11.2% 12.6%Over 500,000 8.0% 1.6% 9.6% 14.4%
Section B - Expected Insurance Company Expenses by Premium Size(g) (h) (i) (j) (k) (l) (m) (n) (o)
(1) Est. Annual Standard Prem.: 10,000 20,000 30,000 100,000 150,000 250,000 1,000,000 1,500,000 2,000,000Premium in IntervalFrom To
(2) 0 5,000 5,000 5,000 5,000 5,000 5,000 5,000 5,000 5,000 5,000(3) 5,001 100,000 5,000 15,000 25,000 95,000 95,000 95,000 95,000 95,000 95,000(4) 100,001 500,000 0 0 0 0 50,000 150,000 400,000 400,000 400,000(5) Over 500,000 0 0 0 0 0 0 500,000 1,000,000 1,500,000(6) Provision for Ins. Co. Expense 1,795 3,085 4,375 13,405 19,005 30,205 106,205 154,205 202,205(7) Expense as % of Std. Prem. 18.0% 15.4% 14.6% 13.4% 12.7% 12.1% 10.6% 10.3% 10.1%(8) Expense as % of Direct Prem. 19.0% 16.8% 16.0% 15.0% 14.3% 13.7% 12.2% 11.9% 11.7%
Notes:Section A from NCCI rate filing, col. (e) = cols. (c)+(d)Row (6) = provisions from col. (e) x premium in rows (2) thru (5)Row (7) = row (6) / row (1)Row (8) = row (6) / ((100% - provisions from col. (f)) x premium in rows (2) thru (5)]
Provision for Ins. Co. Expenses
Preferred Insurance Capital Consultants, LLC 10/14/05

Cost Analysis of Applying the Longshoreman and Harbor WorkersAct to Fisheries Observers
G2 LAE
Exhibit G-2 Loss Adjustment Expense
(a) (b) (c)Allocated Unallocated
Loss Loss LossAdjustment Adjustment Adjustment
Expense Expense ExpenseYear (ALAE) (ULAE) (LAE)
(1) 1994 7.8% 7.6% 15.4%(2) 1995 8.0% 8.0% 16.0%(3) 1996 8.4% 7.4% 15.8%(4) 1997 9.0% 7.2% 16.2%(5) 1998 9.1% 6.7% 15.8%(6) 1999 9.1% 6.3% 15.4%(7) 2000 9.4% 6.4% 15.8%(8) 2001 9.4% 6.9% 16.3%(9) 2002 9.8% 6.8% 16.6%
(10) 2003 9.8% 7.3% 17.1%
(11) Avg. - All Years 9.0% 7.1% 16.0%
(12) Avg. - Latest 5 Years 9.5% 6.7% 16.2%
(13) Avg. Latest 2 Years 9.8% 7.1% 16.9%
(14) Selected 8.0% 6.0% 14.0%
Notes:Columns (a), (b), and (c) are Expressed asa Percentage of Losses Excluding Loss Adjustment ExpenseRows (1) - (10) from NCCI rate filing.Row (14) based on PICC judgment
Preferred Insurance Capital Consultants, LLC 10/14/05

Cost Analysis of Applying the Longshoreman and Harbor WorkersAct to Fisheries Observers
H Haz Grp
Exhibit H - Average Hazard Group
(a) (b) (c) (d) (e)NationalExpectedLoss Rate Expected NCCI
Class per $100 Losses HazardCode Payroll of Payroll =(b)x(c)/$100 Group
(1) 6801 1,786,275 1.13 20,185 3(2) 6824 74,437,810 6.48 4,823,570 3(3) 6826 42,286,518 9.48 4,008,762 3(4) 6828 39,888,993 7.30 2,911,896 3(5) 6843 37,846,068 11.22 4,246,329 4(6) 6845 1,690,248 7.81 132,008 3(7) 6872 65,132,913 13.63 8,877,616 4(8) 6874 6,154,883 17.67 1,087,568 3(9) 7309 10,204,351 19.42 1,981,685 4
(10) 7313 2,121,786 4.00 84,871 4(11) 7317 39,098,814 9.31 3,640,100 4(12) 7327 12,029,838 13.59 1,634,855 4(13) 7380 14,629,928 16.53 2,418,327 3(14) 8709 24,938,487 4.57 1,139,689 4(15) 8726 46,527,542 3.65 1,698,255 3
Tot. or Avg.(16) of All Codes 418,774,454 38,705,717 3.6
Tot. or Avg.of Codes
(17) in Bold 113,752,547 3.2
Ratio:(18) Bold / All 27%
(19) Selected Average Hazard Group 3.5
Notes:Cols. (a) thru (c) from Exhibit ACol. (e) from NCCI Exhibit HRows (16) and (17) are weighted averages where weights are from col. (d)
Preferred Insurance Capital Consultants, LLC 10/14/05

Cost Analysis of Applying the Longshoreman and Harbor WorkersAct to Fisheries Observers
I Loss Size
Exhibit I - Distribution of Losses by Size of Claim
(a) (b) (c) (d)Excess Loss Factors (ELFs) by Hazard Group (HG)
Accident Published ELFs SelectedLimitation HG 3 HG 4 =((b)+(c))/2
25,000 0.397 0.426 0.41230,000 0.383 0.415 0.39935,000 0.369 0.403 0.38640,000 0.358 0.393 0.37650,000 0.337 0.376 0.35775,000 0.299 0.335 0.317
100,000 0.267 0.306 0.287125,000 0.243 0.280 0.262150,000 0.225 0.260 0.243175,000 0.207 0.242 0.225200,000 0.194 0.227 0.211250,000 0.172 0.203 0.188300,000 0.155 0.185 0.170500,000 0.116 0.139 0.128
1,000,000 0.076 0.090 0.083
(e) (f) (g) (h)Expected CumulativePercent Distribution
Range of Losses by Size of Losses of Losses byFrom To Within Range Size of ClaimUnder 25,000 32% 32%25,000 30,000 2% 35%30,000 35,000 2% 37%35,000 40,000 2% 38%40,000 50,000 3% 41%50,000 75,000 7% 48%75,000 100,000 5% 53%
100,000 125,000 4% 57%125,000 150,000 3% 60%150,000 175,000 3% 63%175,000 200,000 2% 65%200,000 250,000 4% 69%250,000 300,000 3% 72%300,000 500,000 7% 79%500,000 1,000,000 7% 86%Over 1,000,000 14% 100%
100%
Notes:Cols. (b) and (c) from NCCICol. (g) = subtraction of successive factors / 61%
Preferred Insurance Capital Consultants, LLC 10/14/05
Cost Analysis of Applying the Longshoreman and Harbor WorkersAct to Fisheries Observers
J Assess
Exhibit J - Assessments on Total Paid Losses - USL&HW ACT—SPECIAL FUND
U.S. Longshore and Harbor Workers' Compensation Act—Title 33, Chapter 18, Sections 901 through 950
Historical Assessment Rates on Total Paid LossesAssessment
Policies Rate onIssued TotalDuring Paid Losses2000 23.8%2001 22.1%2002 20.2%2003 20.1%2004 21.1%
Avg. 21.5%
Selected 21.5%
Notes:All information from NCCI except selected value
This fund is also available for payments of benefits in certain cases in which payments are in default by reasonof the insolvency of the employer and his insurance carrier, payments of 50% of any additional compensation ordeath benefits paid as a result of the adjustment required in Section 10(h) of the USL&HW Act, payments ofvocational rehabilitation services offered employees under the direction of the secretary, and payments todefray the expense of making medical examinations of employees requested by the secretary.
This fund pays for compensation in certain cases in which the employee suffers a second injury. A secondinjury is an injury to a worker, which, in combination with an existing permanent partial disability, results in theworker's increased permanent partial disability, permanent total disability, or death.
Preferred Insurance Capital Consultants, LLC 10/14/05

Cost Analysis of Applying the Longshoreman and Harbor WorkersAct to Fisheries Observers
K-1 EL Prog
Exhibit K-1 - Expected Losses by Program
(a) (b) (c) (d) (e) (f)Selected
Claim ExpectedFrequency No. of
Est. Annual Per Selected Claims ExpectedObserver $1,000,000 Claim (b)x(c)/ Losses
Observer Programs Payroll of Payroll Severity $1,000,000 (d) x (e)(1) North Pacific Groundfish 7,153,333 1.2 59,400 8.6 513,730(2) West Coast 1,103,700 1.2 59,400 1.3 79,264(3) Northeast Groundfish 2,848,533 1.2 59,400 3.4 204,573(4) Southeast 967,737 1.2 59,400 1.2 69,500(5) Southwest 322,533 1.2 59,400 0.4 23,163(6) Pacific Islands 2,492,025 1.2 59,400 3.0 178,969(7) Total 14,887,862 18.0 1,069,200
(8) Indicated Pure Premium 7.18Total (f) / (Total (b) / 100)
Notes:(b) from Exhibit E, col. (a)(c) = sum of col. (e) / sum of col. (b) / $1,000,000(d) from Exhibit D, row (14)
Preferred Insurance Capital Consultants, LLC 10/14/05

Cost Analysis of Applying the Longshoreman and Harbor WorkersAct to Fisheries Observers
K-2 PP WC
(a) (b) (c) (d) (e) (f) (g) (h) (i) (j)DevelopedTrended
Est. Annual Exposure Loss Benefit Losses ProjectedObserver Trend Trended Trend On-Level at Current Pure
Policy Period Payroll Factor Exposures Losses LDF Factor Factor Benefit Level Premium(1) 08/16/1994 to 08/16/1995 1,203,557 1.409 1,695,633 136,660 1.000 1.532 1.116 233,704 13.78 (2) 08/16/1995 to 08/16/1996 1,096,742 1.365 1,497,235 63,310 1.000 1.473 1.105 103,077 6.88 (3) 08/16/1996 to 08/16/1997 930,994 1.323 1,231,445 35,026 1.000 1.417 1.105 54,828 4.45 (4) 08/16/1997 to 08/16/1998 1,408,502 1.282 1,805,286 3,512 1.000 1.362 1.105 5,286 0.29 (5) 08/16/1998 to 08/16/1999 2,042,254 1.242 2,536,405 27,989 1.000 1.310 1.105 40,507 1.60 (6) 08/16/1999 to 08/16/2000 2,053,867 1.203 2,471,732 219,614 1.000 1.259 1.094 302,569 12.24 (7) 08/16/2000 to 08/16/2001 2,587,587 1.166 3,017,220 118,948 1.000 1.211 1.015 146,181 4.84 (8) 08/16/2001 to 01/01/2002 1,296,931 1.141 1,480,119 21,919 1.000 1.179 1.004 25,942 1.75 (9) 01/01/2002 to 01/01/2003 3,884,441 1.117 4,338,116 241,985 1.164 1.147 1.002 323,849 7.47
(10) Total 16,504,875 20,073,190 868,963 1,235,941 6.16
Notes:(b) Data from Client (c) based on Bureau of Labor Statistics Current Employment Statistics(d) = (b) x (c)(e) Data from Client(f) from 2004 ASB - Alaska 2 Year Average(g) = factor to trend losses to 1/1/2006 based on 4% annual severity trend(h) based on benefit changes in 2004 NCCI Annual Statistical Bulletin for AK(i) = (e) x (f) x (g) x (h)(j) = (i) / ((d) / 100)
Exhibit K-2 - Pure Premium Based on Sample Observer Data - WC Only
Preferred Insurance Capital Consultants, LLC 10/14/05

Cost Analysis of Applying the Longshoreman and Harbor WorkersAct to Fisheries Observers
K-3 PP Incl. Non-WC
(a) (b) (c) (d) (e) (f) (g) (h) (i) (j)DevelopedTrended
Est. Annual Exposure Loss Benefit Losses ProjectedObserver Trend Trended Trend On-Level at Current Pure
Policy Period Payroll Factor Exposures Losses LDF Factor Factor Benefit Level Premium(1) 08/16/1994 to 08/16/1995 1,203,557 1.409 1,695,633 146,710 1.000 1.532 1.116 250,890 14.80 (2) 08/16/1995 to 08/16/1996 1,096,742 1.365 1,497,235 65,692 1.000 1.473 1.105 106,955 7.14 (3) 08/16/1996 to 08/16/1997 930,994 1.323 1,231,445 66,507 1.000 1.417 1.105 104,106 8.45 (4) 08/16/1997 to 08/16/1998 1,408,502 1.282 1,805,286 12,257 1.000 1.362 1.105 18,448 1.02 (5) 08/16/1998 to 08/16/1999 2,042,254 1.242 2,536,405 73,859 1.000 1.310 1.105 106,892 4.21 (6) 08/16/1999 to 08/16/2000 2,053,867 1.203 2,471,732 308,591 1.000 1.259 1.094 425,155 17.20 (7) 08/16/2000 to 08/16/2001 2,587,587 1.166 3,017,220 140,009 1.000 1.211 1.015 172,063 5.70 (8) 08/16/2001 to 01/01/2002 1,296,931 1.141 1,480,119 125,200 1.000 1.179 1.004 148,178 10.01 (9) 01/01/2002 to 01/01/2003 3,884,441 1.117 4,338,116 342,934 1.164 1.147 1.002 458,949 10.58
(10) Total 16,504,875 20,073,190 1,281,759 1,791,638 8.93
Notes:(b) Data from Client (c) based on Bureau of Labor Statistics Current Employment Statistics(d) = (b) x (c)(e) Data from Client(f) from 2004 ASB - Alaska 2 Year Average(g) = factor to trend losses to 1/1/2006 based on 4% annual severity trend(h) based on benefit changes in 2004 NCCI Annual Statistical Bulletin for AK(i) = (e) x (f) x (g) x (h)(j) = (i) / ((d) / 100)
Exhibit K-3 - Pure Premium Based on Sample Observer Data - Incl. Non-WC
Preferred Insurance Capital Consultants, LLC 10/14/05

Cost Analysis of Applying the Longshoreman and Harbor WorkersAct to Fisheries Observers
L Exp Prem
Exhibit L - Expected Premium
(a) (b) (c) (d) (e) (f) (g) (h) (i)Provision Provision
for Ins. Co. for Ins. Co.Expenses Estimated Expenses
Expected Excl. Prem. Standard Incl. Prem.Losses Taxes Premium Taxes Est.
Incl. LAE as % of Excl. Prem. as % of DirectExpected and USL Standard Taxes Direct Premium
Observer Programs Losses ALAE ULAE Assessment Premium =(e)/(100%-(f)) Premium =(e)/(100%-(h))(1) North Pacific Groundfish 513,730 8% 6% 695,899 23% 903,765 15.8% 826,562(2) West Coast 79,264 8% 6% 107,371 23% 139,443 17.8% 130,662(3) Northeast Groundfish 204,573 8% 6% 277,114 23% 359,889 16.9% 333,342(4) Southeast 69,500 8% 6% 94,144 23% 122,266 18.1% 114,919(5) Southwest 23,163 8% 6% 31,377 23% 40,749 19.4% 38,931(6) Pacific Islands 178,969 8% 6% 242,432 23% 314,847 17.0% 291,931(7) Total 1,069,200 1,448,338 1,880,959 16.6% 1,736,347
(8) Consolidated Program 1,069,200 8% 6% 1,448,338 23% 1,880,959 15.1% 1,706,140
Notes:(b) from Exhibit K, col. (f)(c) and (d) from Exhibit G-2(e) = (b)x(100%+(c)+(d))+(b)xExhibit J(f) from Exhibit G-1, col. (e) at $5,000(h) from Exhibit G-1, interpolated and/or estimated, plus 5% added for premium taxes
Preferred Insurance Capital Consultants, LLC 10/14/05

Cost Analysis of Applying the Longshoreman and Harbor WorkersAct to Fisheries Observers
M Deduct
Exhibit M - Expected Premium Savings from Per Claim Deductible
(a) (b) (c) (d) (e) (f) (g)Expected Expected Premium Credit for Following Per Claim Deductibles:
Observer Programs Losses 25,000 50,000 100,000 200,000 250,000(1) North Pacific Groundfish 513,730 166,752 213,072 272,024 n/a n/a(2) West Coast 79,264 n/a n/a n/a n/a n/a(3) Northeast Groundfish 204,573 66,402 84,847 n/a n/a n/a(4) Southeast 69,500 n/a n/a n/a n/a n/a(5) Southwest 23,163 n/a n/a n/a n/a n/a(6) Pacific Islands 178,969 58,092 n/a n/a n/a n/a
(7) Consolidated Program 1,069,200 347,052 513,567 566,150 699,362 739,676
(h) (i) (j) (k) (l) (m)Est.
Direct Net Premium After Deductible CreditObserver Programs Premium 25,000 50,000 100,000 200,000 250,000
(8) North Pacific Groundfish 826,562 659,810 613,490 554,538 n/a n/a(9) West Coast 130,662 n/a n/a n/a n/a n/a
(10) Northeast Groundfish 333,342 266,940 248,495 n/a n/a n/a(11) Southeast 114,919 n/a n/a n/a n/a n/a(12) Southwest 38,931 n/a n/a n/a n/a n/a(13) Pacific Islands 291,931 233,839 n/a n/a n/a n/a
(14) Consolidated Program 1,736,347 1,389,295 1,222,780 1,170,197 1,036,985 996,671
Notes:Col. (b) and (h) from Exhibit LCol. (c) thru (g) = col. (b) x Exhibit (I), col. (h)Col. (i) thru (m) = col. (h) - cols. (c) thru (g)
Preferred Insurance Capital Consultants, LLC 10/14/05