NATIONAL METHOD FOR ASSESSING THE IMPACT OF CYCLE …
118
couverture à venire NATIONAL METHOD FOR ASSESSING THE IMPACT OF CYCLE ROUTES Méthode ÉVA-VÉLO √ 5 * 1 ∑ 861 324 475 861 324 475
Transcript of NATIONAL METHOD FOR ASSESSING THE IMPACT OF CYCLE …
couverture à venire
NATIONAL METHOD FOR
ASSESSING THE IMPACT OF CYCLE ROUTES
Méthode ÉVA-VÉLO
√5*1∑
861324475
861324475

2
Document produced by Vélo & Territoires and co-funded by the European Union, as part of the AtlanticOnBike project

3
Introduction
The journey from the beginnings of tourist cycle route observation in 2006 to the publication of this guide in 2020 has depended on the will, patience and open-mindedness of a great many private and public actors. Thanks to these efforts, we henceforward adopt the ÉVA-VÉLO method in place of the EuroVelo 6 method. Vélo & Territoires sees this first publication as a new milestone in which we aim to take cycling observation further on a national scale. The purpose of this guide is twofold. Across both parts of the text, our first aim is to enable a wide public readership to understand why and how to implement observation of a tourist cycle route. Our second aim is to enable the technicians, public actors, or consultants in charge of these observations to identify all the processes and calculations to be carried out in order to arrive at estimates of ridership and economic impacts. We hope that this effort will contribute to a greater general appreciation of these studies and give new impetus to this approach. Above all, we at Vélo & Territoires aspire to see this guide shed light on the method and make it accessible. This tool is therefore intended to be a living one that will evolve according to feedback. Vélo & Territoires will monitor and maintain this guide. Any changes will be incorporated following their validation by a methodological Monitoring Committee composed of experts and observation professionals.

4
Acknowledgements
This guide would not have been possible without the active participation of a number of people. Here we would like to give special thanks to the companies that worked on this method before us: Inddigo, Symetris and Eco-Compteur. Special thanks go to Nicolas MERCAT, Guillaume LUCAS and Bruno DAVID for their patience, for their generosity with their time and advice, and for the whole of the calculation chain.
We would also like to thank the Comité Interministériel pour le Développement de l'Usage du Vélo et de la Marche (CIDUVM) and in particular Pierre TOULOUSE and Gabrielle KOEHL who supported and accompanied us at the beginning of this project.
Thanks to the regions and routes that agreed to the use their data to illustrate this method (such as La Loire à Vélo and the EV1-La Vélodyssée), and in particular to the Comité Régional du Tourisme Centre-Val de Loire for its permission to use the texts from the VélOCentre method. Thanks also to those in charge of coordination at EV1-La Vélodyssée for agreeing to share their "accommodation provider panel" campaign documentation.
Finally, a big thank you to all the technicians of the proofreading committee for their thoughtful feedback and to their supporting structures for the time given. In alphabetical order: Claude BÉCHU - Comité Régional du Tourisme Centre-Val de Loire, Solène HAREL - Comité Régional du Tourisme de Bretagne, Holger HAUBOLD - European Cyclists' Federation, Frédéric LAROCHE - Committee Régional du Tourisme Bourgogne-Franche-Comté, Laura LÉOTOING – Association des Parcs naturels du Massif Central, Philippe TARRICQ – Comité Régional du Tourisme de Nouvelle-Aquitaine, Fanny TESSUTO – Comité Régional du Tourisme Bourgogne-Franche-Comté.
©E.
Ber
thie
r
5
Glossary. . . . . . . . . . . . . . . . . . . . . . . . . . . . . . . . . . . . . . . . . . . .6
Introduction to the method. . . . . . . . . . . . . . . . . . . . . . . . . . . . . .9Why.evaluate?. . . . . . . . . . . . . . . . . . . . . . . . . . . . . . . . . . . . . .10Origin.of.the.method. . . . . . . . . . . . . . . . . . . . . . . . . . . . . . . . .11Study.scope.and.indicators . . . . . . . . . . . . . . . . . . . . . . . . . . .12Prerequisites. . . . . . . . . . . . . . . . . . . . . . . . . . . . . . . . . . . . . . .13A.simplified.explanation.of.the.calculation.method. . . . . . . .18
Setting up the survey . . . . . . . . . . . . . . . . . . . . . . . . . . . . . . .23Analysis.of.count.data. . . . . . . . . . . . . . . . . . . . . . . . . . . . . . . .24Definition.of.the.functional.sections.of.the.route..or.network.to.be.observed. . . . . . . . . . . . . . . . . . . . . . . . . . . .26Implementation.of.the.field.survey . . . . . . . . . . . . . . . . . . . . .27
Field data entry, clearance and validation . . . . . . . . . . . .43
Survey.data:.questionnaires,.counts,.short.interviews. . . . . .44Processing.of.automatic.count.data . . . . . . . . . . . . . . . . . . . .74
Estimating ridership and economic impact . . . . . . . . . . .77Adjustments . . . . . . . . . . . . . . . . . . . . . . . . . . . . . . . . . . . . . . .78Extrapolations. . . . . . . . . . . . . . . . . . . . . . . . . . . . . . . . . . . . . .81Estimated.economic.impact. . . . . . . . . . . . . . . . . . . . . . . . . . .98
Conclusion. . . . . . . . . . . . . . . . . . . . . . . . . . . . . . . . . . . . . . . . . . . 101A.living,.non-exhaustive.and.participatory.method . . . . . . .102
Annexes . . . . . . . . . . . . . . . . . . . . . . . . . . . . . . . . . . . . . . . . . .105Counts.and.short.interviews.grid. . . . . . . . . . . . . . . . . . . . . .106Survey.questionnaire . . . . . . . . . . . . . . . . . . . . . . . . . . . . . . .107Setting.up.a.panel.of.accommodation.providers:..which.tools.should.be.used?. . . . . . . . . . . . . . . . . . . . . . . . .109Standard.file.and.variable.dictionary. . . . . . . . . . . . . . . . . . .114Treatment.of.open.questions. . . . . . . . . . . . . . . . . . . . . . . . .114
Contents

6
Users: all persons, whether cycling or not, who are observed on the route or network.
Tourist: a person who spends at least one night away from their primary residence (including in a second home).
Day-tripper: someone who spends the nights be-fore and after the survey at their primary residence.
Sport cyclist: a cyclist, tourist or day-tripper using special equipment (a road or mountain bike, shorts, shoes with cleats, etc.), travelling for a day or less, and generally covering long distances per trip (more than 50 km)[1].
Cycle tourer: a tourist who travels by bike over several days, changing accommodation along the way. This category does not include cyclists who travel from one accommodation to the next by ano-ther transport mode (usually by car), while also making day trips by bicycle.
Utility cyclist: a cyclist, tourist or day-tripper who uses bicycles for day-to-day transport and for a purpose other than the ride itself, e.g. shopping, walking, work, or going to the beach. Generally, these activities are the primary purpose of the bi-cycle trip. This category is usually too small to be analysed in detail at the scale of a cycle route or network.
Leisure cyclist: this category includes other cate-gories, leisure activities and children, who take day trips and generally cover short distances (up to 50 km)[1]. It also includes utility cyclists when they cannot be isolated for statistical reasons.
Holiday cyclist: a tourist who usually makes loop or return-trips and stays in fixed accommodation or travels between accommodations by a transport mode other than cycling. This category therefore includes all tourists other than cycle tourers.
Economic impacts: the sum of expenditure by cy-clists along the full length of their route. We divide these into four distinct levels, referred to as Level 1 to 4 economic impacts.
Level 1 economic impacts: the sum of spending over the whole route by cyclists who are travelling specifically for this reason, on riding days. This is therefore a conservative estimate of the impacts. This level of impact is therefore also known as a primary route impact.
Level 2 economic impacts: the sum of spending along the route by cyclists, regardless of the rea-son for travel, on riding days. This level of impact is also known as route impact.
Level 3 economic impacts: the sum of spending along the route by cyclists, regardless of the reason for travel, on riding days, and for all kilometres cy-cled (including distance cycled in loops). This level of impact is also known as route and loop impact.
Level 4 economic impacts: the sum of spending along the route by cyclists, regardless of the reason for travel, for all kilometres (including loops). For tourists, this level of impact includes extrapolation of spending to the duration of the stay, according to the frequency of cycling activities during the stay. This level of impact is also known as stay impact.
Adjustment: the survey sample reflects a bias; sport day-trippers respond less frequently than others, while cycle tourers are more often willing to take the survey. With adjustment, it is possible to correct for these biases for a given day by relying on short interviews and visual observation.
Extrapolation: the survey data, even after adjust-ment, only represent a flow observed at times T at places X or Y. Extrapolation makes it possible to derive from these data the total ridership for the year and across the entire route.
Interpolation: this refers to the correction or ex-trapolation of missing data by taking as a reference the results from a statistically similar survey site, over a period for which data have been collected on both sites.
Glossary
1. The notion of distance should be adjusted for bicycle type (mountainbike, ebike) and change in elevation. Generally, cyclists travelling further than 50 km on e-bikes will be classified as leisure cyclists, except in mountainous areas (mountain pass ascents) or when observing mountainbike routes.

7
Cycling trips: Cycling trips represent the volume of cyclists using a cycle route or network. Colloquially, this figure is generally treated as a stand-in for 'num-ber of cyclists'. Cycling trips should be differentiated from the number of bikes recorded by automatic coun-ters as these represent a flow, and thus double-count users making a round trip.
Section: a section of the route or network which is homogeneous in terms of infrastructure and accom-modation offering. Each section measures between 15 and 30 km. Where a section crosses the administrative boundary of a French département [hereafter 'depart-ment'], it is always divided into two sections. Each section will have a counter and a reference survey site.
Segment: a set of sections for which the aggregated data are sufficient to support analysis. Care must be taken to propose segments that are sufficiently ho-mogeneous. Generally, these are between 200 and 400 km in length.
©Y.
Per
rin

8
9
Why evaluate? 10
Origin of the method 11
Study scope and indicators 12
Prerequisites 13
A simplified explanation of the calculation method 18
Introductionto.the.method

10
Measurement of ridership on routes and loop networksThe measurement of ridership on routes and loops is essential for:
›› Verifying that the facilities correspond to the needs of the resident and tourist populations
›› Measuring the effects of the actions implemented›› Maintaining continuous monitoring of ridership as
it changes over time.
Analysing the economic impact of the developments carried outThe second objective is to identify the return on in-vestment of public funds in these operations. This dimension is essential for decision-makers to guide public investment, but it also assists private ope-rators in deciding on the size of their investments and calculating possible returns. Evaluation allows for identification of the direct impacts of the deve-lopments being assessed, as well as certain induced effects such as effects on safety, public health, the environment, etc.
This economic analysis of existing developments also enables the economic impact and potential return on investment of future developments to be modelled to support decision-making. For example, this type of study facilitates the identification of sectors with a potential shortage of accommodation and, by pro-viding economic indicators, helps to encourage the establishment of new operators.
Getting to know the clientele better In order to effectively promote the route or network, it is essential to: conduct a thorough analysis of who is cycling (and who isn't); know the respondent pro-files in terms of age, type of cycling, and reasons for cycling; determine how clients came to know about the destination; and to know whether or not cycling was a determining factor in the choice of the desti-nation. All of these answers are used to guide the marketing and communications strategy.
Listening to the needs of users Beyond the quantitative aspects, the surveys provide very precise information on the level of user satisfac-tion with all the components of the product, to enable continuous improvement of the offer: the route, safety, interaction between users, signposting, ac-commodation and catering, visits, bicycle parking, accessibility (including by public transport), rental and repair services, services along the route, water points and toilet facilities, preparation for the trip, and guidebooks. Survey results are used by public and private stakeholders on an ongoing basis so that they can better meet user expectations.
These evaluations are intended to be carried out regularly as a basis for reflection and to inform decision-making. The automatic counts allow for continuous monitoring. Customer surveys cannot be carried out annually due to their cost, but it is useful to repeat them every 5 years or so.
Why evaluate?
The implementation of cycle routes and loops requires significant public funding to design and imple-ment facilities, develop services, support tourism stakeholders, and promote routes.
The evaluation of ridership and economic impact therefore meets several objectives.
In the future, this method will also make it possible to estimate the degree of job creation induced by these developments. This indicator is particularly important for local decision-makers in a context of high unemployment.
INTRODUCTION TO THE METHOD

11
The EuroVelo 6 method deve-loped in 2006A shared method at the European levelThe cycling observation method currently used in France is based directly on the EuroVelo method developed in 2006 as part of the 'Eurovéloroute des fleuves' programme. This project brought together 18 French, Swiss and German partners and was led by the Centre-Val de Loire region.
Since then, this observation method has been de-ployed in France on many routes. Nearly 35,000 surveys were carried out between 2009 and 2018 on the Tour de Bourgogne, the Canal des Deux Mers, the Voies Vertes de Bretagne (2013 and 2018), Alsace à Vélo (EV5 and EV15), the EuroVelo 6, La Loire à Vélo (in 2010 and 2015), the ViaRhôna (EV17), the Méditerranée à vélo (EV8), the Via Ve-naissia, the Vélodyssée (2018) and the Pyrenean mountain passes (2018).
A necessary adaptationThe various implementation efforts in the field, as well as research work conducted locally, have made[2] possible to identify areas for improvement in the method, and to develop mathematical mo-dels to enhance the reliability of the calculations. The purpose of this document is to set out the various steps to be implemented in the field and the mathematical models to be applied in order to arrive at the most accurate and comparable esti-mates of ridership and economic impact.
Four complementary analysis toolsThe observation method proposed here is based on the implementation of four types of closely related observations conducted at the same locations:
1- Automatic counting of cyclists provides real-time information on the number of bicycle passages at the various counting points. To rationalise costs, depending on the routes and loop networks, we propose the implementation of permanent, pe-riodic (for several months per year) or spot (for several weeks per year) counts.
2- Manual counts allow a visual and exhaustive differentiation of the types of cyclist (tourer, sport, leisure and utility) over several survey days and ad-justment of the survey data.
3- Short interviews supplement manual counts on determining variables, such as the segmentation of tourists/day-trippers.
4- In-depth surveys provide a better understanding of the clientele, their behaviour and expectations, and their spending. These surveys are to be carried out at a selection of points that are representative of the cycle network that is to be observed. Their timing should provide a sample of the days and seasons of the year. On average, 2 to 6 survey days are expected per point.
In addition, counts conducted by accommodation providers can be set up to verify changes in cycling tourism seasonality, and the relative composition of the clientele (holiday cyclists, cycle tourers).
Origin of the method
These observations, once combined and extrapolated, make it possible to estimate the annual volumes of tourists and day-trippers, their expenditure, and the level of economic impacts for the areas observed.
2. Given that the value of cycling observation is now sufficiently accepted, the Centre-Val de Loire region, in cooperation with the consultancy Inddigo and within the context of the MIRCE, carried out a major research project aimed at slimming down the initial observation method, in order to enable its application on a wider scale. The aim of this work was to move from the observation of a route to the observation of an area.
12
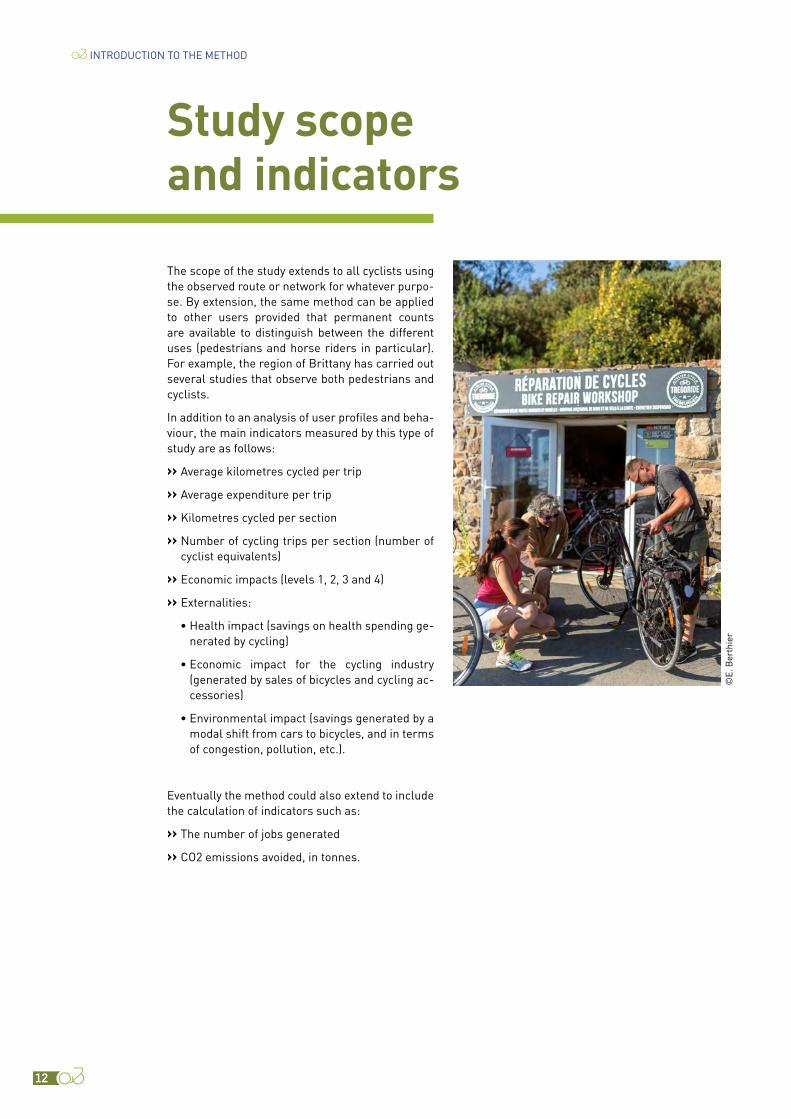
The scope of the study extends to all cyclists using the observed route or network for whatever purpo-se. By extension, the same method can be applied to other users provided that permanent counts are available to distinguish between the different uses (pedestrians and horse riders in particular). For example, the region of Brittany has carried out several studies that observe both pedestrians and cyclists.
In addition to an analysis of user profiles and beha-viour, the main indicators measured by this type of study are as follows:
›› Average kilometres cycled per trip
›› Average expenditure per trip
›› Kilometres cycled per section
›› Number of cycling trips per section (number of cyclist equivalents)
›› Economic impacts (levels 1, 2, 3 and 4)
›› Externalities:
• Health impact (savings on health spending ge-nerated by cycling)
• Economic impact for the cycling industry (generated by sales of bicycles and cycling ac-cessories)
• Environmental impact (savings generated by a modal shift from cars to bicycles, and in terms of congestion, pollution, etc.).
Eventually the method could also extend to include the calculation of indicators such as:
›› The number of jobs generated
›› CO2 emissions avoided, in tonnes.
Study scope and indicators
INTRODUCTION TO THE METHOD
©E.
Ber
thie
r

13
When conducting a study on the ridership and eco-nomic impacts of cycling, whether for a route or an area, there are certain prerequisites:
›› Data from automatic counters
›› A good knowledge of the route or area (cycling practices, tourism, facilities, accommodation, etc.)
›› Active participation from all stakeholders in-volved in the development and promotion of the network to be observed.
Automatic countersAutomatic bicycle count data is one of the cor-nerstones of this method. Before starting any ridership and economic impact study, it is there-fore imperative to have counters in working order and to acquire as much historical data as possible, with one year's data as a minimum.
Prerequisites
Why install counters?Automatic counts are indispensable for:
›› Measuring and monitoring changes in the ri-dership of routes and loop networks over time and over a long period.
›› Differentiating ridership data. Research carried out in France for the Centre-Val de Loire region shows that an in-depth analysis of automatic counting data (time curves, weekend/weekday ratio and July/August weighting, etc.) provides a great deal of information on the ridership typolo-gy (share of tourists, typology of cycling - sport, leisure, utility, touring) and limits the need for lengthy and costly surveys.
›› Estimate the economic impacts of the routes or loop networks. The counting data, combined with the ratios resulting from the surveys, make it possible to calculate the overall volume of cy-clists and the consumption they generate in the areas concerned.
©st
udio
ah

14
Where should they be installed?In the context of implementing a ridership study, the ideal would be to have representative counts of ridership profiles that are very specific to each cate-gory of cyclists. This will help to improve the quality of temporal extrapolation of the data. For each cate-gory, a specific location must be targeted:
›› For utility cyclist traffic: at a cut-off point or chokepoint in an urban environment (such as a water crossing)
›› For day-tripper traffic: close to a leisure destina-tion in the urban environs
›› For cycle tourer traffic: in a remote area with the lowest population density and fewest tourist beds, and with very little "parasitic" ridership
›› For holiday cyclist traffic: close to a major tourist site.
Which solution, and at what cost?There are different types of counters on the market. The main ones are the following:
›› Pneumatic counters operate with rubber tubes placed across the roadway. A passing vehicle exerts pressure on the tube, producing a si-gnal that actuates the counter. These counters can count bicycles on mixed paths or dedicated bikeway, and distinguish bicycles from cars.
Pro: their ease of installation makes them easy to use for occasional counts.
Con: beware of theft and damage. The meter housing must be attached to a shaft or pole. In addition, in shared lanes, the tubes must be re-gularly re-tensioned to ensure optimal counting. On sections with high rollerblader/rollerskater traffic, it is essential to clearly mark the tubes on the ground as they are a trip hazard.
›› Electromagnetic loop counters (ZELT counters) are actuated by a passing metallic mass. These counters enable the measurement of cycling on both dedicated bikeways and shared paths.
›› Radar counters use the Doppler effect to mea-sure a wave reflected off a moving vehicle. The speed, volume and length of the vehicle make it possible to identify cyclists. The adjustment of these counters on mixed infrastructure is a very delicate task, especially on infrastructure with very high traffic, or where the path borders an important road traffic route.
›› Piezoelectric counters are actuated by pressure on a piezoelectric strip. These counters enable the measurement of cycling on both dedicated bikeways and shared paths.
›› Pyroelectric counters are actuated by a passing heat source. As such, they count all vehicles as well as pedestrians, and therefore cannot be used on mixed infrastructure.
›› Optical recognition video counters detect cyclist flows in mixed traffic and identify movements. They remain less precise than ZELTs for very high bicycle traffic or groups. They are also more ex-pensive.
In the field, experience quickly determines the type of counter to be installed.
INTRODUCTION TO THE METHOD
Points to remember• The typical spacing between two counting points on a route
is in the order of 10 to 50 km, depending on population and accommodation density
• Ensure a variety of environments for counting points (such as urban/peri-urban and rural, and tourist and non-tourist areas)
• Ensure a variety of infrastructure types (such as dedicated bikeways or shared paths)
• Consider various ridership typologies (such as utility, leisure, touring, or holiday cyclists)
• Give priority to sites on homogeneous sections (at a location that is representative of a sufficiently lengthy section)
• Modify according to anticipated volume: greater than 50 bikes counts/day for permanent counting, possibly supplemented by temporary counting campaigns in lower-traffic areas
• Avoid close proximity to sites that generate highly localised return trips (such as primary and secondary schools, or sites between beaches and camp sites) and on very short sections of less than 2 or 3 km
• Avoid sites where traffic comes to a stop (such as traffic lights, stop signs, etc.), slows down (slopes) or sites near car parks, rest areas, playgrounds or picnic areas that could create localised counting disturbances
• Consider creating a scalable implementation plan with three types of counting: permanent, periodic or temporary counts.

15
TYPE OF COUNTER
PNEUMATIC ELECTROMAGNETIC ZELT LOOPS
RADAR – DOPPLER
PYROELECTRIC PIEZOELECTRIC
ACTUATION Measurement of the pressure wave of a vehicle on a tube
Actuation by passing metallic mass
Measurement of the wave emitted by a moving vehicle
Actuation by passing heat source
Actuation by sensing passing pressure on conductive tapes
COUNT Bicycles Bicycles All vehicles, with differentiation
Bicycles, pedestrians, rollerbladers/rollerskaters
Without differentiation
Bicycles
ADVANTAGES Easy to install Very high data reliability.
Resistant to wear and tear
Allows differentiation of vehicle types and separation into speed classes
Measures all users
DISADVANTAGES Susceptible to wear and tear
Trip hazard for rollerbladers/rollerskaters
Permanently installed sensor
Requires fine-tuning, especially on shared infrastructure
Less precision in very high traffic flow
Reliability problems related to insect actuations and shadows
Permanently installed sensor
APPLICATION Well-suited to temporary counts
Solution adapted to permanent or periodic counting
Used in Switzerland but gradually being replaced
Unconvincing results in France
Enables differentiation between pedestrians and bicycles when combined with ZELT loops
Solution adapted to permanent or periodic counting
COST (2018 INDICATIVE DATA)
€2,600 incl. VAT €4,800 incl. VAT for installation + maintenance and GSM subscription (€830 incl. VAT/year)
Not available €3,000 incl. VAT (with direction distinction and detection at 4m)
€4,300 incl. VAT for installation + maintenance and GSM subscription (€800 incl. VAT/year)
As far as costs are concerned, the data presented in the table above are indicative. When installing counters, it is important to take into account capital expenditure (procure-ment and installation of the counter(s)) as well as operating expenditure (maintenance, data transfer and processing) and to plan corresponding budgets over the long term to ensure the sustainability of the systems.
16
For more information on the different types of coun-ters available on the market, the choice of location or the methods for monitoring and maintaining counters and data, a detailed guide is available on the Vélo & Territoires website (www.velo-territoires.org, access restricted to members only).
Using one or more counters can be beneficial when carrying out a cycling observation.
›› For very economically significant routes or networks, it is recommended to install one or more permanent counters (e.g. ZELT or pie-zoelectric linked to a GSM). The case for their installation could be validated in advance by a counting campaign using pneumatic counters.
›› For a route or network of moderate economic significance, it is recommended to carry out periodic counts (for a few months a year, using ZELT or rotating piezoelectric counters) and temporary counts (a few weeks a year, using pneumatic counters).
The installation of permanent automatic counters is essential for analysing the quantitative evolution of the use of the route from one year to the next, for extrapolating spot counting and survey data and, as we have seen previously, for qualifying ridership on the route. These permanent counters should be installed on sites with sufficiently high ridership figures to be representative, although the identifi-cation of some points where ridership is very low is very important in determining where cycle tou-ring is dominant (see section: Automatic counters - where to install them, page 14).
As regards periodic or temporary counts, analysis of the data collected makes it possible to identify the characteristic features of each counting point (hourly weekday curve excluding holidays, ratio of weekday to weekend days excluding holidays). This information is compared with data from perma-nent counters at other sites. The objective is to find the reference counter whose characteristics are statistically closest to the point under study. This permanent counter becomes the reference coun-ter for extrapolating point data.
Several companies can be tasked with conducting counting campaigns for one week at a large num-ber of points. Such an exercise may be valuable as preparation for the placement of permanent au-tomatic counters, as it can reveal disparities and similarities between particular sites. Where seve-ral counters have very similar profiles, there is no need to install permanent counters on each sites, as periodic counting may be sufficient.
What is the national platform for?In France, a National Ridership Platform [Plate-forme nationale des fréquentations (PNF)] was created in 2013 by Vélo & Territoires (formerly known as Départements & Régions Cyclables) thanks to the Interministerial Coordination Coun-cil for the Development and Use of Cycling and the French Environment and Energy Manage-ment Agency. This platform is used to collect automatic count data from participating local au-thorities.
By contributing to this platform, the various local authorities are promoting the development of a na-tional dashboard for cycling. Their involvement also facilitates analysis at the scale of major routes.
In the context of the implementation of studies on ridership and economic impacts of cycle routes or networks, it is strongly recommended that the va-rious local authorities concerned share their count data with the national platform. Sharing facilitates the monitoring of automatic count data, proces-sing, comparison and updating of survey data.
A presentation of the national ridership platform (PNF) and the recurring analyses made of it are available on the Vélo & Territoires website: https://www.velo-territoires.org/observatoires/plateforme-nationale-de-frequentation/
It is recommended to link the counters to a GSM op-tion. This allows for near-real time data monitoring and remote verification that equipment is functioning correctly. The use of pneumatic counters is to be reserved for temporary counts or rotating count campaigns.
INTRODUCTION TO THE METHOD

17
For further reading (a document is available for Vélo & Territoires members at www.velo-territoires.org):Guide to choosing and installing automatic bicycle counting solutions
Knowledge of the route or network observedIn order to conduct a study that will provide a re-presentative view of the route or network observed, it is necessary to have a good knowledge of it.
This knowledge is achieved in particular through the compilation and analysis of particular data:
›› Typology and age of the infrastructure (GIS data of the route or network)
›› Tourist accommodation close to the route (INSEE data on tourist beds per twon and city or data from the Tourist Information Systems accessible directly or via the DATAtourisme platform)
›› The population of the environs of the route (INSEE population census data)
›› Typology of towns or cities near the route (INSEE data on the degree of urbanisation)
›› Tourist sites and leisure activities (location and ridership figures) near the route
›› Points of interest on the route relating to heri-tage, landscape, etc.
›› Presence of a rail connection.
All of this information, supplemented by an analy-sis of automatic counting data, will enable the route or network observed to be divided into functional sections. This information will also, when the time comes, inform the choice of survey locations and the size of the teams to be mobilised in the field.
Mobilising people involved in planning and promotionIf it is to succeed, the implementation of a study on the ridership and economic impacts of a route or network should not be the sole responsibility of monitoring experts. It is a broad-based underta-king that can bring together and draw in everyone with a stake in its development and promotion, right from the very start of the project.
Indeed, this type of study goes beyond simply provi-ding figures on ridership or the economic impacts generated. It can be used as a tool for steering and team leadership. Its results also often have politi-cal significance.
Indeed, an operation of this kind requires resources for the coordination of all the actors.
©st
udio
ah
18
As explained above, the ridership and economic impact study is based on four inputs: automatic counts, manual counts, short interviews and in-depth surveys. These four parts of the study are carried out on a one-off basis (except for automa-tic counts) and at specific points on the route or network under observation. The calculation me-thod will therefore aim to adjust the survey data (to correct for biases linked to response rates that differ according to users), to extrapolate data from a sample of days to the whole year, and then to ex-trapolate locally observed data (at a few points) to an entire route or network.
Data extrapolation, or how to transform a point datum into continuous observationTo reconstruct the annual ridership on a route on the basis of a few days' observation at a few points on the network, the method draws on a detailed analysis of automatic counts and a three-way breakdown:
›› A temporal division of the year into homoge-neous periods such as seasons and types of days (weekday, weekend, public holidays, school holidays, etc.).
This temporal breakdown applied to automatic counts makes it possible to identify gross ri-dership per period of the year.
A simplified explanation of the calculation method
INTRODUCTION TO THE METHOD
©D
. Dar
raul
t
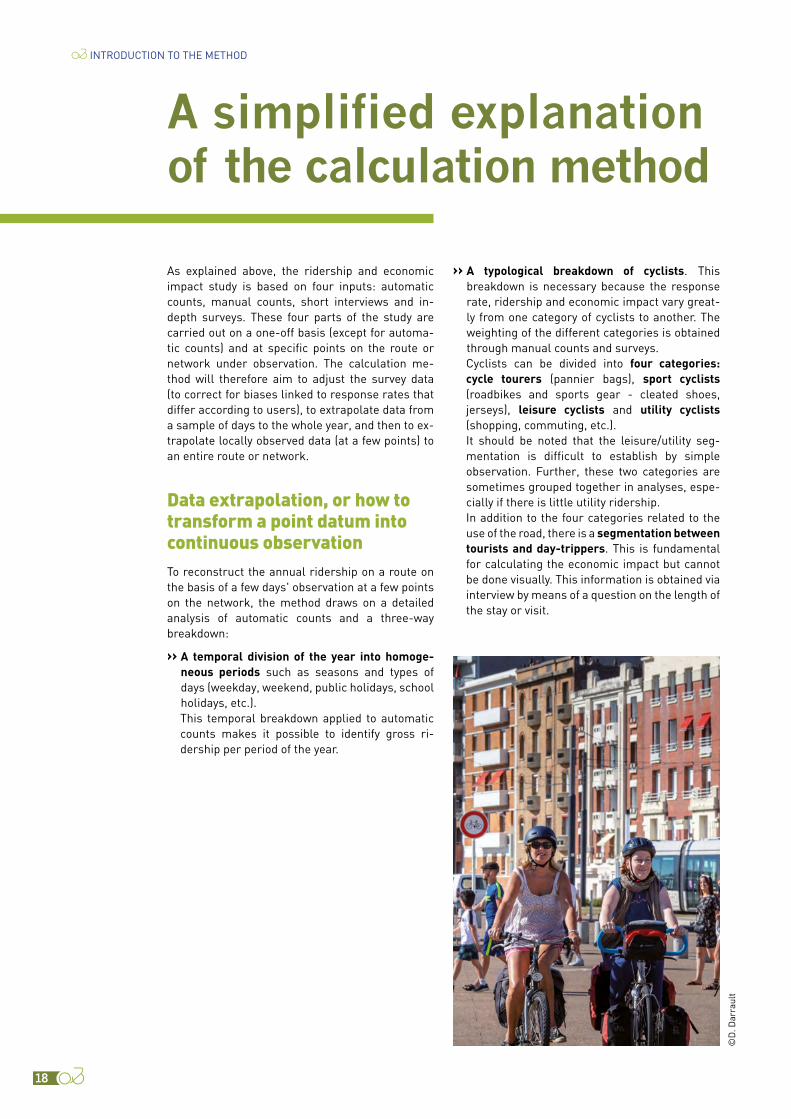
›› A typological breakdown of cyclists. This breakdown is necessary because the response rate, ridership and economic impact vary great-ly from one category of cyclists to another. The weighting of the different categories is obtained through manual counts and surveys.
Cyclists can be divided into four categories: cycle tourers (pannier bags), sport cyclists (roadbikes and sports gear - cleated shoes, jerseys), leisure cyclists and utility cyclists (shopping, commuting, etc.).
It should be noted that the leisure/utility seg-mentation is difficult to establish by simple observation. Further, these two categories are sometimes grouped together in analyses, espe-cially if there is little utility ridership.
In addition to the four categories related to the use of the road, there is a segmentation between tourists and day-trippers. This is fundamental for calculating the economic impact but cannot be done visually. This information is obtained via interview by means of a question on the length of the stay or visit.

19
CYCLISTS
Tourists Excursionnists
Tourists sport cyclist
Tourists leisurecyclists
Tourists utility
cyclists
Cycle tourers
Day-trippers sport cyclists
Day-trippers leisure cyclists
Day-trippers utility cyclists
Cyclist profiles sssssssssssss
›› A spatial breakdown: routes (or networks of loops), whether surveyed or not, are divided into "homogeneous" sections using several criteria:
• The population density of the surrounding area (within a 5 km zone around the route).
• The INSEE municipal typology (based on the degree of urbanisation technique): urban, pe-ri-urban, dense rural and rural 'communes' [hereafter, municipalities] (see ‘Definition of functional sections’ page 26).
• The density of tourist beds in the zone. A cor-rective ratio is applied to take account of the strong emissions differential among cyclists according to the type of accommodation. Ri-dership figures at tourist sites is an additional ratio that may be added.
• The typology of routes: the ridership rate varies according to whether the route is on a paved or stabilised greenway or a shared lane. Limited changes of type over the course of a few kilometres are not significant. This fact should be taken into consideration on impor-tant sections.
Finally, a division is made between sections of between 15 and 30 km (averaging 20-25 km), with a clear distinction between the highly urbanised sections. In areas with high population density or tourist bed density, these divisions are general-ly smaller. A qualitative knowledge of the field is helpful in making relevant divisions.
In summary Self-administered field surveys make it possible to determine spending levels, specify the distances cycled, and establish a ratio of spending per kilometre for each category of user.The breakdown makes it possible to reconstitute ridership by category of user and by type of period, the distances cycled, and then the spending for each site surveyed, and to extrapolate this to the sections not surveyed.
This typological breakdown yields seven cyclist profiles:
The spatial breakdown then makes it possible to establish the expected ridership on each of the non-surveyed sections, based on the calculated emission ratios for the surveyed sites and the density characteristics of these sections (for ap-plication of a "gravity" mathematical model, see ‘Spatial extrapolation’ page 91). The characterisa-tion of these sections, followed by the identification of the relevant ratios, are important and difficult steps owing to the dispersion of the results.

20
Adaptations of the method for lower-density sectorsFrom 2013 to 2014, further investigation into the EuroVelo 6 method was made to adapt it to lower-density routes. A European working group of English and Swiss specialists was set up, resulting in several adaptations:
›› Improved reliability of extrapolation methods based on a very in-depth statistical analysis of automatic counts per classification method (comparison of counting sites with each other and grouping into categories).
›› The use of temporary and periodic automatic counts on a large number of locations.
›› A systematisation of short interviews to better control for the rate of tourists and the categories of users.
›› The introduction of cyclist counts by a panel of accommodation providers to better control the evolution of seasonality and the respective weight of fixed accommodation and touring cy-clists.
Surveys
Manual counts
Automatic counts
Panel accomodation providers
1
2
3
4
5
6
Visual calibration rateFor the correction of observation errors
Adjustment coefficientFor the correction of biases in responses rate and extrapolation to the population observed on site
Coefficient of extrapolation to the dayFor the extrapolation of hours observed to the full day
Expenditure per kmFor calculation of economic impact
Set indicatorsEstimation of cyclists’ number (cycle tourers, holiday cyclists and day-trippers)Economic impact and externalities
Volumes extrapolated
to the daySeasonality
PopulationTourist beds
Gravity modelOrigin-destination
matrix
Volumes extrapolatedthe year for
surveyed sections
Volumes extrapolated to the route
Schematic representation of the method
INTRODUCTION TO THE METHOD
21
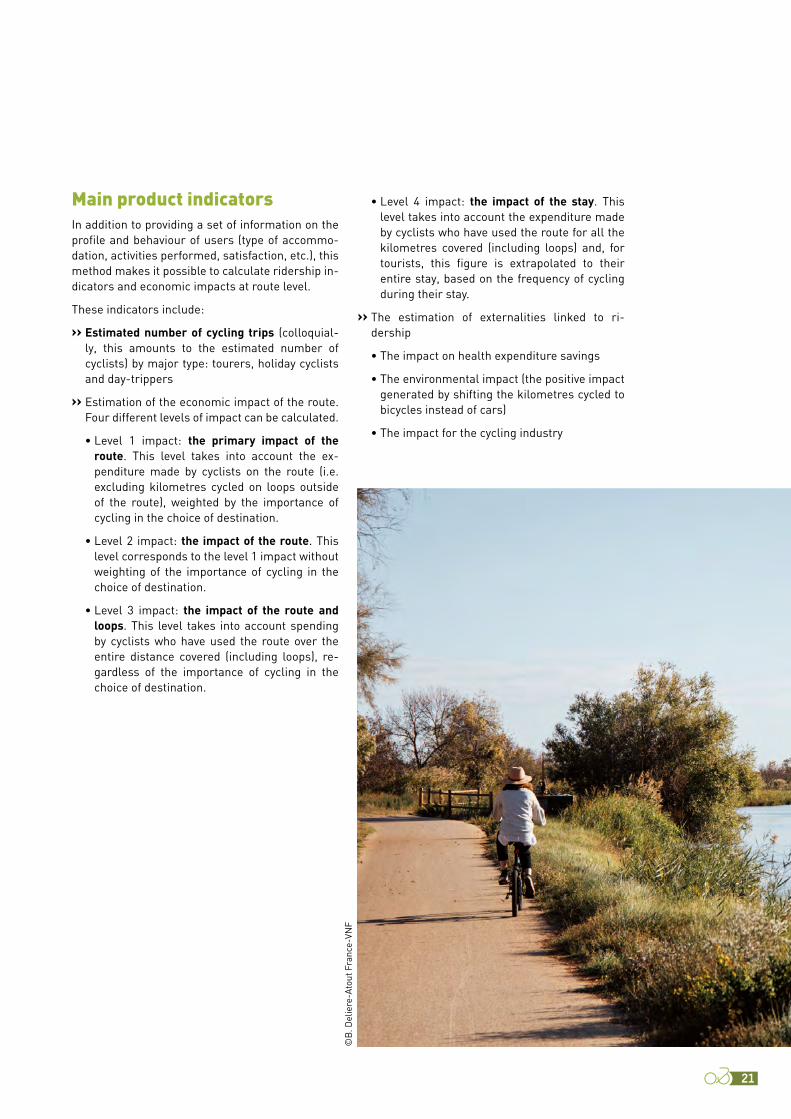
Main product indicatorsIn addition to providing a set of information on the profile and behaviour of users (type of accommo-dation, activities performed, satisfaction, etc.), this method makes it possible to calculate ridership in-dicators and economic impacts at route level.
These indicators include:
›› Estimated number of cycling trips (colloquial-ly, this amounts to the estimated number of cyclists) by major type: tourers, holiday cyclists and day-trippers
›› Estimation of the economic impact of the route. Four different levels of impact can be calculated.
• Level 1 impact: the primary impact of the route. This level takes into account the ex-penditure made by cyclists on the route (i.e. excluding kilometres cycled on loops outside of the route), weighted by the importance of cycling in the choice of destination.
• Level 2 impact: the impact of the route. This level corresponds to the level 1 impact without weighting of the importance of cycling in the choice of destination.
• Level 3 impact: the impact of the route and loops. This level takes into account spending by cyclists who have used the route over the entire distance covered (including loops), re-gardless of the importance of cycling in the choice of destination.
• Level 4 impact: the impact of the stay. This level takes into account the expenditure made by cyclists who have used the route for all the kilometres covered (including loops) and, for tourists, this figure is extrapolated to their entire stay, based on the frequency of cycling during their stay.
›› The estimation of externalities linked to ri-dership
• The impact on health expenditure savings
• The environmental impact (the positive impact generated by shifting the kilometres cycled to bicycles instead of cars)
• The impact for the cycling industry
©B
. Del
iere
-Ato
ut F
ranc
e-VN
F

22

23
Analysis of count data 24
Definition of the functional sections of the route or network to be observed 26
Implementation of the field survey 27
Setting.up.the.survey

24
The analysis of the count data available in the preamble to the survey will make it possible to:
›› Verification of the quality of the available data
›› Assessment of the ridership level and seasona-lity of the route
›› Defining the time period that represents maxi-mum ridership
›› Establish a classification of counters and there-fore potential survey sites.
Verification of the quality of the available dataIn order to validate the correct operation of the counters and the quality of the data, it is necessary to check:
›› Missing data periods (in case of missing readings, non-transmission of GSM data, failure, etc.)
›› Days with 0 bike passages
Analysis of count data
SETTING UP THE SURVEY
©E.
Ber
thie
r
›› Unusual peaks or troughs
›› Unusual night-time data (11 pm to 4 am)
›› Upward or downward regime changes
›› Data periods that show an unusual IN/OUT dis-tribution (for direction-distinct counters)
›› Days with an inconsistent/unusual time profile.
For more information on counting anomalies and their detection and processing, a detailed guide (Comptages de vélos : comment nettoyer les don-nées ? [Bicycle counts: a guide to data cleaning]) is available on the Vélo & Territoires website (www.velo-territoires.org).
In the event of a counter failure, it is necessa-ry to reconstruct missing or outlier data. Several methods can be used for this purpose, based in particular on previous counter data and available data from a counter with similar behaviour as iden-tified by classification.

25
Assessment of the ridership level and seasonality of the routeAnalysis of the data makes it possible to determine the level of ridership for each counting point and check its seasonality.
Seasonality analysis will enable the validation of the survey period (a group of months correspon-ding to the heart and wings of the season).
Defining the time period that represents maximum ridershipAnalysis of the ridership time curve will make it possible to validate the hours of ridership and to schedule the interviewers’ days.
This analysis can be done at the route or network level. Where large discrepancies occur, this ana-lysis can be done on a more local scale, and the interviewers' days can be adapted to the context.
Establish a classification of counters and therefore potential survey sitesThe counters are classified by analysing similari-ties in their ridership ratios, including:
›› Share of ridership on working days compared to weekends outside the holidays (characteristic of utility cycling or, conversely, day-tripper cycling)
›› Share of ridership on working days compared to weekends during the holidays (characteristic of tourist cycling when the difference is small, day-trippers when the weekend figures are large, and utility cycling when the weekend fi-gures are small)
›› Share of July-August ridership in the annual ridership (characteristic of tourist cycling, espe-cially holiday cycling)
›› Share of the ridership on the long weekends of 14 July and 15 August in ridership for the mon-ths of July and August (characteristic of both tourist and day-tripper cycling)
›› Share of ridership between 5 pm and 9 am on weekdays outside holidays in daily ridership (characteristic of utility cycling when this figure is significant)
›› Share of ridership between 9 am and 11 am at weekends in daily ridership (characteristic of cy-cle tourers and leisure cyclists).
This classification will make it possible to recons-truct missing or outlier data from faulty counters. It will also help in decision-making on the sampling of survey sites, and in identifying which counters are most associated with a type of cycling.
©M
. Jol
y
26
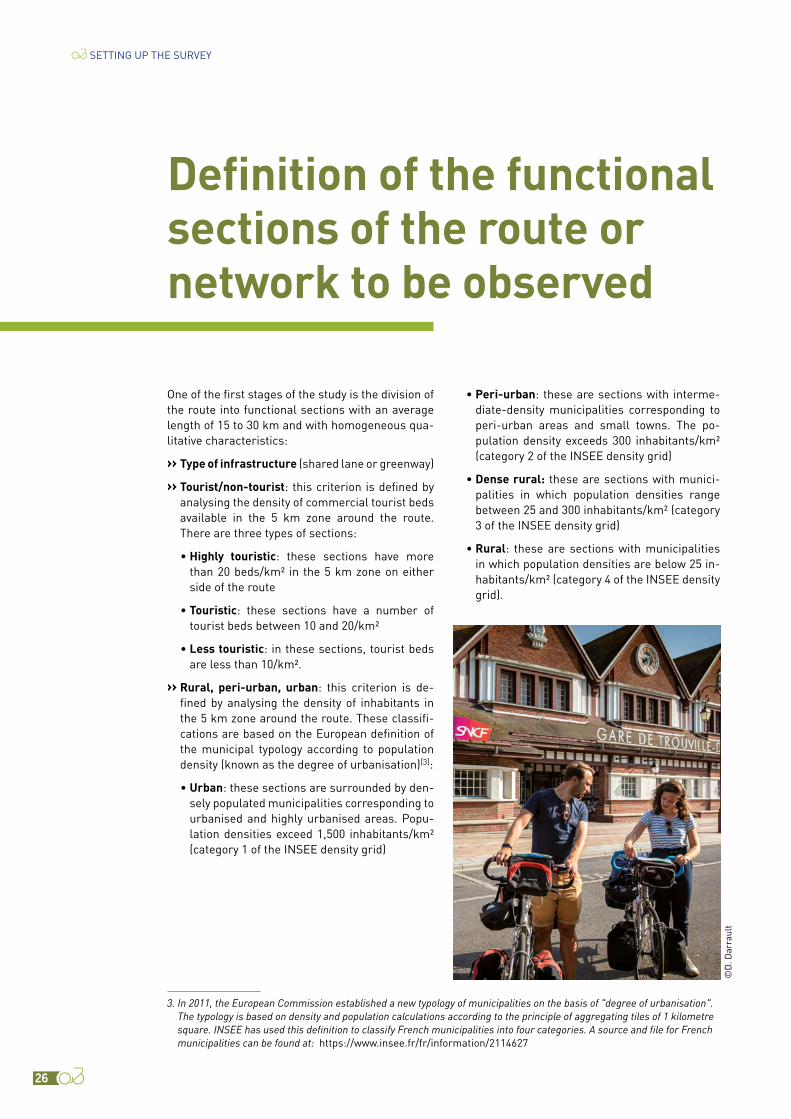
One of the first stages of the study is the division of the route into functional sections with an average length of 15 to 30 km and with homogeneous qua-litative characteristics:
›› Type of infrastructure (shared lane or greenway)
›› Tourist/non-tourist: this criterion is defined by analysing the density of commercial tourist beds available in the 5 km zone around the route. There are three types of sections:
• Highly touristic: these sections have more than 20 beds/km² in the 5 km zone on either side of the route
• Touristic: these sections have a number of tourist beds between 10 and 20/km²
• Less touristic: in these sections, tourist beds are less than 10/km².
›› Rural, peri-urban, urban: this criterion is de-fined by analysing the density of inhabitants in the 5 km zone around the route. These classifi-cations are based on the European definition of the municipal typology according to population density (known as the degree of urbanisation)[3]:
• Urban: these sections are surrounded by den-sely populated municipalities corresponding to urbanised and highly urbanised areas. Popu-lation densities exceed 1,500 inhabitants/km² (category 1 of the INSEE density grid)
• Peri-urban: these are sections with interme-diate-density municipalities corresponding to peri-urban areas and small towns. The po-pulation density exceeds 300 inhabitants/km² (category 2 of the INSEE density grid)
• Dense rural: these are sections with munici-palities in which population densities range between 25 and 300 inhabitants/km² (category 3 of the INSEE density grid)
• Rural: these are sections with municipalities in which population densities are below 25 in-habitants/km² (category 4 of the INSEE density grid).
SETTING UP THE SURVEY
Definition of the functional sections of the route or network to be observed
3. In 2011, the European Commission established a new typology of municipalities on the basis of "degree of urbanisation". The typology is based on density and population calculations according to the principle of aggregating tiles of 1 kilometre square. INSEE has used this definition to classify French municipalities into four categories. A source and file for French municipalities can be found at: https://www.insee.fr/fr/information/2114627
©D
. Dar
raul
t
27
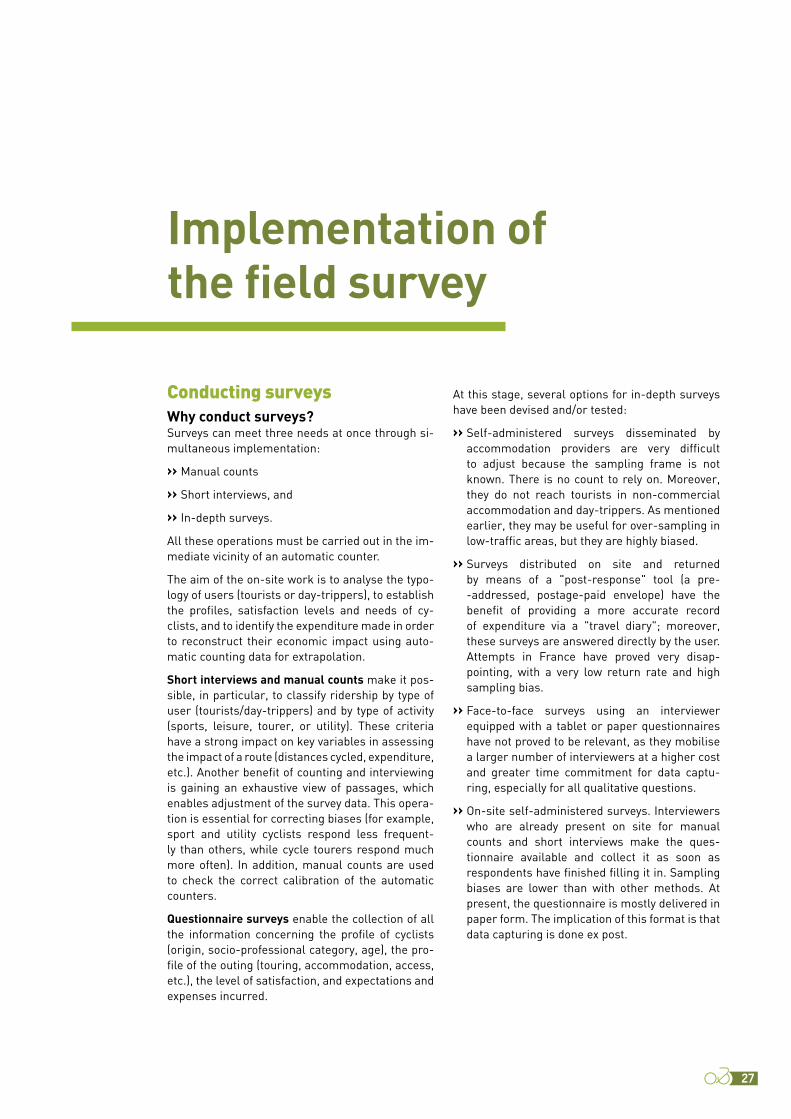
Conducting surveysWhy conduct surveys?Surveys can meet three needs at once through si-multaneous implementation:
›› Manual counts
›› Short interviews, and
›› In-depth surveys.
All these operations must be carried out in the im-mediate vicinity of an automatic counter.
The aim of the on-site work is to analyse the typo-logy of users (tourists or day-trippers), to establish the profiles, satisfaction levels and needs of cy-clists, and to identify the expenditure made in order to reconstruct their economic impact using auto-matic counting data for extrapolation.
Short interviews and manual counts make it pos-sible, in particular, to classify ridership by type of user (tourists/day-trippers) and by type of activity (sports, leisure, tourer, or utility). These criteria have a strong impact on key variables in assessing the impact of a route (distances cycled, expenditure, etc.). Another benefit of counting and interviewing is gaining an exhaustive view of passages, which enables adjustment of the survey data. This opera-tion is essential for correcting biases (for example, sport and utility cyclists respond less frequent-ly than others, while cycle tourers respond much more often). In addition, manual counts are used to check the correct calibration of the automatic counters.
Questionnaire surveys enable the collection of all the information concerning the profile of cyclists (origin, socio-professional category, age), the pro-file of the outing (touring, accommodation, access, etc.), the level of satisfaction, and expectations and expenses incurred.
At this stage, several options for in-depth surveys have been devised and/or tested:
›› Self-administered surveys disseminated by accommodation providers are very difficult to adjust because the sampling frame is not known. There is no count to rely on. Moreover, they do not reach tourists in non-commercial accommodation and day-trippers. As mentioned earlier, they may be useful for over-sampling in low-traffic areas, but they are highly biased.
›› Surveys distributed on site and returned by means of a "post-response" tool (a pre--addressed, postage-paid envelope) have the benefit of providing a more accurate record of expenditure via a "travel diary"; moreover, these surveys are answered directly by the user. Attempts in France have proved very disap-pointing, with a very low return rate and high sampling bias.
›› Face-to-face surveys using an interviewer equipped with a tablet or paper questionnaires have not proved to be relevant, as they mobilise a larger number of interviewers at a higher cost and greater time commitment for data captu-ring, especially for all qualitative questions.
›› On-site self-administered surveys. Interviewers who are already present on site for manual counts and short interviews make the ques-tionnaire available and collect it as soon as respondents have finished filling it in. Sampling biases are lower than with other methods. At present, the questionnaire is mostly delivered in paper form. The implication of this format is that data capturing is done ex post.
Implementation of the field survey
28
SETTING UP THE SURVEY
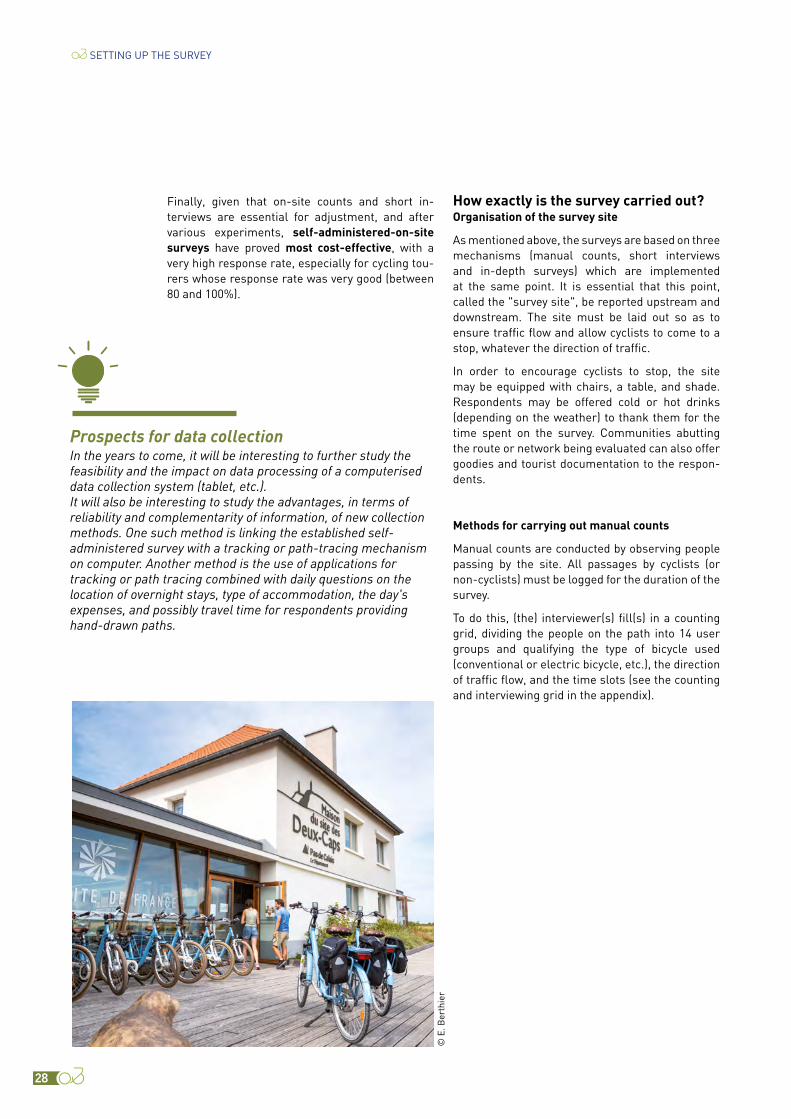
Finally, given that on-site counts and short in-terviews are essential for adjustment, and after various experiments, self-administered-on-site surveys have proved most cost-effective, with a very high response rate, especially for cycling tou-rers whose response rate was very good (between 80 and 100%).
Prospects for data collectionIn the years to come, it will be interesting to further study the feasibility and the impact on data processing of a computerised data collection system (tablet, etc.).It will also be interesting to study the advantages, in terms of reliability and complementarity of information, of new collection methods. One such method is linking the established self-administered survey with a tracking or path-tracing mechanism on computer. Another method is the use of applications for tracking or path tracing combined with daily questions on the location of overnight stays, type of accommodation, the day's expenses, and possibly travel time for respondents providing hand-drawn paths.
How exactly is the survey carried out?Organisation of the survey site
As mentioned above, the surveys are based on three mechanisms (manual counts, short interviews and in-depth surveys) which are implemented at the same point. It is essential that this point, called the "survey site", be reported upstream and downstream. The site must be laid out so as to ensure traffic flow and allow cyclists to come to a stop, whatever the direction of traffic.
In order to encourage cyclists to stop, the site may be equipped with chairs, a table, and shade. Respondents may be offered cold or hot drinks (depending on the weather) to thank them for the time spent on the survey. Communities abutting the route or network being evaluated can also offer goodies and tourist documentation to the respon-dents.
Methods for carrying out manual counts
Manual counts are conducted by observing people passing by the site. All passages by cyclists (or non-cyclists) must be logged for the duration of the survey.
To do this, (the) interviewer(s) fill(s) in a counting grid, dividing the people on the path into 14 user groups and qualifying the type of bicycle used (conventional or electric bicycle, etc.), the direction of traffic flow, and the time slots (see the counting and interviewing grid in the appendix).
© E
. Ber
thie
r

29
USERS GROUPS CRITERIA
CYCLISTS Sport cyclists Road bikes (racing handlebars, thin tyres) or mountain bikes (rather top-of-the-range), clothing for sport cyclists (jersey, helmet, shorts, cleated shoes).
Cycle tourers Touring bike, pannier bags on both sides or another type of bag attached to the rear, map holder on the handlebars, sometimes a trailer or pannier bag under the saddle and on the frame (bikepacking).
Utility cyclists Carrying street clothes, a shoulder bag, small backpack or briefcase, or using a bicycle basket or a single pannier bag.
Leisure cyclists All other cyclists.
Children on bikes Child cyclists on bikes with wheels smaller than 26 inches.
Accompanied children Children on a seat, in a trailer or with a 3rd wheel.
PEDESTRIANS AND SIMILAR
Pedestrians People on foot, in a wheelchair or a stroller.
Joggers
Rollerbladers and rollerskaters
Wearing rollerblades or rollerskates.
Other wheeled users People moving around on electric and conventional push scooters, hoverboard, gyro-wheel, skateboard, rollerski, etc.
OTHER USERS Motorised two-wheelers Motorised two-wheelers: mopeds, motorbikes.
Other motor vehicles(*) Cars, commercial vehicles, maintenance equipment.
Horseback riders People on horseback.
Animals Dogs, horses.
* motorised vehicles are only counted on greenways, not on shared lanes.
Among the different road users, four main types of cyclists can be distinguished, which will serve as the basis for all the treatments in the study:
›› The cycle tourer is a tourist travelling by bicycle who changes accommodation in the course of travel. This category does not include cyclists taking day trips and moving from one accommoda-tion to another by another transport mode (usually a car or camper van). The latter are classified as leisure or sport cyclists, depen-ding on the case.
›› Attention: cycle tourers can usually be identified by their pannier bags. However, they may be accompanied by a tour operator or support vehicle and thus be without pannier bags. These elements can be corrected on the basis of the interviews. On the other hand, some leisure cyclists may use a pannier bag to carry a picnic-and provisions for their trip.
›› The sport cyclist is a cyclist using special equipment (a road/racing bike or mountain bike, cleated shoes, special clothing), travelling for a day or less, and generally covering long distances (more than 50 km) per trip.
›› They are not to be confused with fitness cyclists with straight han-dlebars and without cleated shoes, who will be integrated into the leisure cyclists.
›› Note that mountain bikers are to be differentiated in the same way: when equipped with cleated shoes, shorts and jersey, they are included with the sport cyclists; otherwise they are classified as leisure cyclists.
Take note the allocation according to mileage is to be reviewed in light of the bike type and environment (change in elevation). If the cyclist appears to be a sport cyclist, but uses an e-bike, then regardless of the mileage covered, they will be considered a leisure cyclist, unless they are engaging with changes in elevation (e.g. a hill climb). In this case, they will be considered a sport cyclist.In conventional cycling and in the mountains, the distances covered can be less than or equal to 50 km. If the cyclist has the standard equipment, they are to be considered sport cyclists.For conventional mountain biking, the distances covered by sport cyclists are generally shorter than those covered by users of road bikes.

30
SETTING UP THE SURVEY
Methods for conducting short interviews
The interviewer present on site stops each cyclist and asks them whether they would like to take the in-depth questionnaire (one questionnaire per group). If they refuse, the interviewer uses a very short questionnaire to ask the cyclists (one person per group) questions relating to their origin, type of travel (day-tripping/tourism), type of accommoda-

31
Ideally, where paper questionnaires are used, it would be convenient to print questionnaires with unique numbers. This would limit the risk of mis-numbering, omitting or duplicating numbers.
›› Method of distribution: the interviewer hands the questionnaire to the person, who agrees (or not) to complete it. The person completes the questionnaire on the spot (this takes about 10 minutes). Where cycling practices differ within the group, or when group members insist, ad-ditional group members- may also answer the questionnaire. In this case, all the question-naires in the group will have the same interview number plus an individual suffix (e.g. No. 101-1/101-2/101-3 for 3 questionnaires in the same group corresponding to observation No. 101). In the case of paper questionnaires, they will be at-tached to each other for easy identification.
›› Collection method: the respondent hands the questionnaire to the interviewer, who does a quick check on the consistency of the answers. For large numbers of people, the questionnaire can be returned to a paper tray. Given the low rate of return of questionnaires by post or by Internet, these two survey methods were not selected. Completing the questionnaire at once and on site is preferable. The acceptance rate for filling in the questionnaire on site is relatively high. Refusal rates are mainly observed among sport cyclists and utility day-trippers.
On local routes, one interviewer can survey almost all cyclists on their own, up to a ridership of 100 per day. Thereafter the interviewer interviews a proportion of cyclists at random (first subsequent respondent) but counts all users. It is very important, in the case of high ridership, that the selection of interviewees is done as randomly as possible to avoid any bias. For sites recording up to 300 passages per day, one person is sufficient to manage the entire system. For higher counts, this work should be shared between 2 or even 3 persons, depending on the volume of passages.
›› Questionnaire data entry mode (for paper questionnaires): questionnaires are ideally en-tered on Excel or survey processing software (Sphinx, Moda Lisa or others). The entry time is approximately 20 questionnaires/hour.
Regardless of the choice of input mode, the final file must comply with the grid defined in the ap-pendix to enable the aggregation of files from the different areas/routes observed. In particular, it should include universal fields such as "area name", "department", "survey point" and "survey date". It must be exportable in ".csv" format (com-ma-separated values) so that it can be used by any software.
© E
. Ber
thie
r

32
How should survey points be chosen?How should the number of survey points required be defined?
To estimate the number of survey points required for a study of ridership and economic impact, several criteria come into play. It is generally re-commended to position a survey site at 40 km intervals. The number obtained and the spacing between points may vary according to:
›› The division of the route into functional sec-tions[4] and the variety of its characteristics (the more the environment, and therefore the nu-mber of visitors, changes, the more points are needed).
›› The density of population and tourist beds: in low-density sectors, there is less need for pre-cision in data correction.
›› The availability of a functioning automatic coun-ter, as each survey point must be coupled with a counter.
›› Results of the classification of counters by simi-larity study.
›› The existence of automatic counting points that make it possible to identify the seasonality of very specific practices (utility cyclists, day-trip-pers, sport cyclists, cycle tourers, tourists, etc.) and therefore reduce the need to conduct fur-ther surveys in that year at that same point.
›› The contracting authority’s needs. The greater the need for a fine-grained view with local re-sults, the greater the number of sites required.
For example: along a length of 1,000 km, the nu-mber of survey points required is estimated at 1,000/40, i.e. 25 points. This number may be re-vised slightly upwards or downwards depending on the precise needs of the contracting authority and the homogeneity or diversity of the route. The points may be closer or further than 40km apart in order to keep to the divisions of the route (into sections and segments and/or administrative divi-sions).
Note: where a large amount of automatic count data allows for a good overview of the seasonality of ridership, it is possible to reduce the number of survey days in the year at the same point, and so increase the number of survey sites. Conversely, where there is little data available, and the total number of survey days is constant, it is preferable to restrict the number of sites and increase the nu-mber of survey days per site.
Take note: increasing the number of sites means that more time must be spent on preparing the field phase (precise choice of location, reconnais-sance, applications for permission, monitoring of counters, follow-up on events for the duration of the surveys, etc.).
How should survey point locations be chosen?
The locations for interviews and surveys must be chosen such that they:
›› Avoid parasitic traffic (outside the town centre, in proximity to traffic generating centres [high schools, universities, shopping centres, etc.]) to avoid an overcount of utility cycling. Sites should not be on regional roads with medium traffic of 1,000 to 3,000 vehicles/day to avoid an overcount of day-tripper sport cyclists.
›› Are located in areas that do not pose a safety problem, such as parking and survey spaces and narrow lanes with low traffic that allow in-terviewers to address cyclists in both directions without risk as they cross the road.
›› Are visible from a distance so that cyclists are prepared.
›› Are near a slowing down area to make it easier for users to stop.
›› Are ideally located on sections that are common to two routes, in order to analyse several loops and routes at the same time.
SETTING UP THE SURVEY
4. In 2021, Vélo & Territoires will work on creating a standardised division of the French network, based on a method developed on EuroVelo 1 on a transnational scale, as part of the AtlanticOnBike project.
33
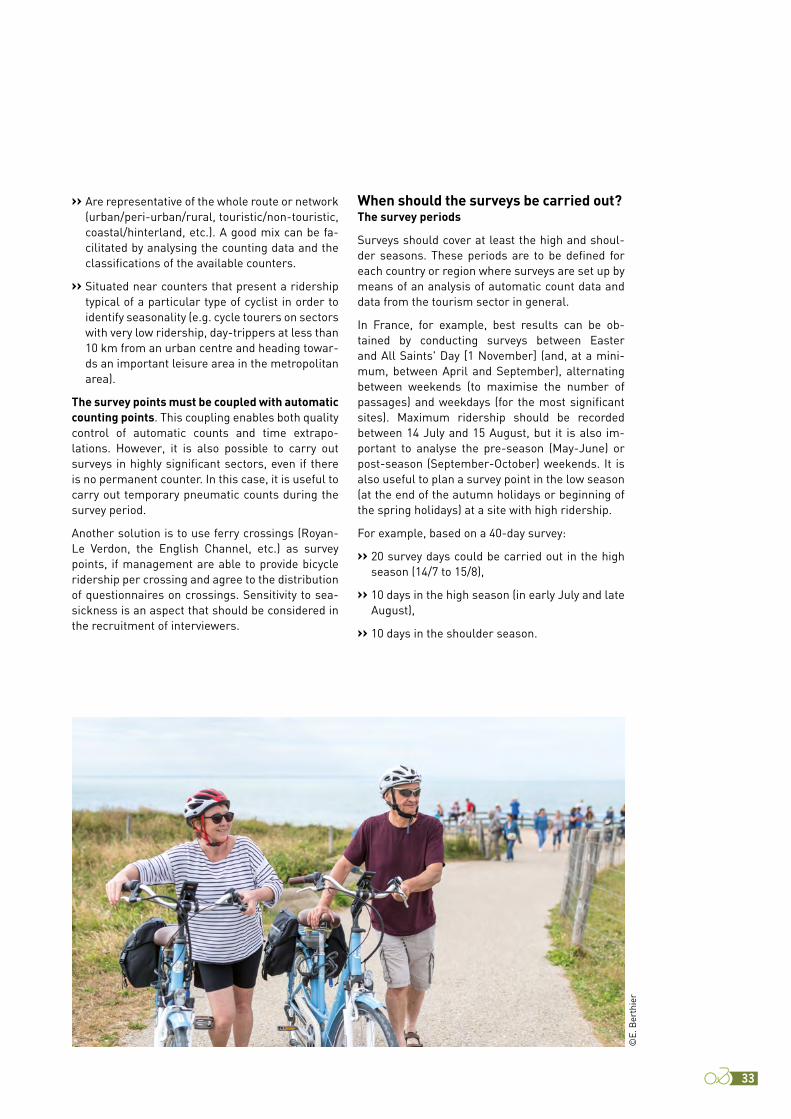
›› Are representative of the whole route or network (urban/peri-urban/rural, touristic/non-touristic, coastal/hinterland, etc.). A good mix can be fa-cilitated by analysing the counting data and the classifications of the available counters.
›› Situated near counters that present a ridership typical of a particular type of cyclist in order to identify seasonality (e.g. cycle tourers on sectors with very low ridership, day-trippers at less than 10 km from an urban centre and heading towar-ds an important leisure area in the metropolitan area).
The survey points must be coupled with automatic counting points. This coupling enables both quality control of automatic counts and time extrapo-lations. However, it is also possible to carry out surveys in highly significant sectors, even if there is no permanent counter. In this case, it is useful to carry out temporary pneumatic counts during the survey period.
Another solution is to use ferry crossings (Royan-Le Verdon, the English Channel, etc.) as survey points, if management are able to provide bicycle ridership per crossing and agree to the distribution of questionnaires on crossings. Sensitivity to sea-sickness is an aspect that should be considered in the recruitment of interviewers.
When should the surveys be carried out?The survey periods
Surveys should cover at least the high and shoul-der seasons. These periods are to be defined for each country or region where surveys are set up by means of an analysis of automatic count data and data from the tourism sector in general.
In France, for example, best results can be ob-tained by conducting surveys between Easter and All Saints' Day [1 November] (and, at a mini-mum, between April and September), alternating between weekends (to maximise the number of passages) and weekdays (for the most significant sites). Maximum ridership should be recorded between 14 July and 15 August, but it is also im-portant to analyse the pre-season (May-June) or post-season (September-October) weekends. It is also useful to plan a survey point in the low season (at the end of the autumn holidays or beginning of the spring holidays) at a site with high ridership.
For example, based on a 40-day survey:
›› 20 survey days could be carried out in the high season (14/7 to 15/8),
›› 10 days in the high season (in early July and late August),
›› 10 days in the shoulder season.©
E. B
erth
ier

34
SETTING UP THE SURVEY
These periods introduce biases, as the seasonality of tourist practice is different, but extrapolation techniques (see ‘A simplified explanation of the calculation method’ page 18 and Part 4, page 77) make it possible to correct them.
Timetables
The period in which passages are highest should be covered in full. The time slot can be set after an analysis of the automatic count data.
In France, the usual time slot for conducting sur-veys and counts is from 9:00 am to 6:00 pm. Before and after those times, tourist ridership is low. For labour law reasons, a break should be planned between 1:00 pm and 2:00 pm. If several inter-viewers are present on site, a rotation should be carried out to maintain continuity of counting.
The number of survey days
The number of survey days depends on the ob-jectives of the contracting authority. The more detailed the results required, the greater the nu-mber of survey days required. Further, the greater the reduction in the number of sites in relation to the length of route that is to be assessed, the grea-ter the need for the number of survey days per site to be consistent.
5. A "pivot" or reference site is a site that is very representative of the ridership of a segment and/or type of practice. It will serve as a basis for spatial and temporal extrapolations.
In response to a common client order, which is to obtain results at the scale of a route and by major region, 3 survey days are generally recommended for "pivot" [5] sites and 1 or 2 days for the others. In the case of a detailed client order, the number of days can increase to up to 6 for "pivot" sites and 3 days for the others.
"Pivot" sites are those that will serve as a basis for extrapolations. These are the reference sites. They are representative:
›› Of a well-identified category of counters resul-ting from the statistical analysis of classification
›› Of a significant part of the route or network (in geographic terms)
›› Of a particular category of users (cycle tourers, day-trippers, holiday cyclists, etc.)
The number of survey days should also be de-termined according to the projected number of surveys to be conduct, which in turn depends on the ridership recorded by the counters (see ‘Estima-ting the number of surveys that can be conducted’, page 37) and the geographical unit for which re-sults are expected (for a departmental analysis, over-sampling may be necessary).
©At
lant
ic C
oast
Rou
te
35
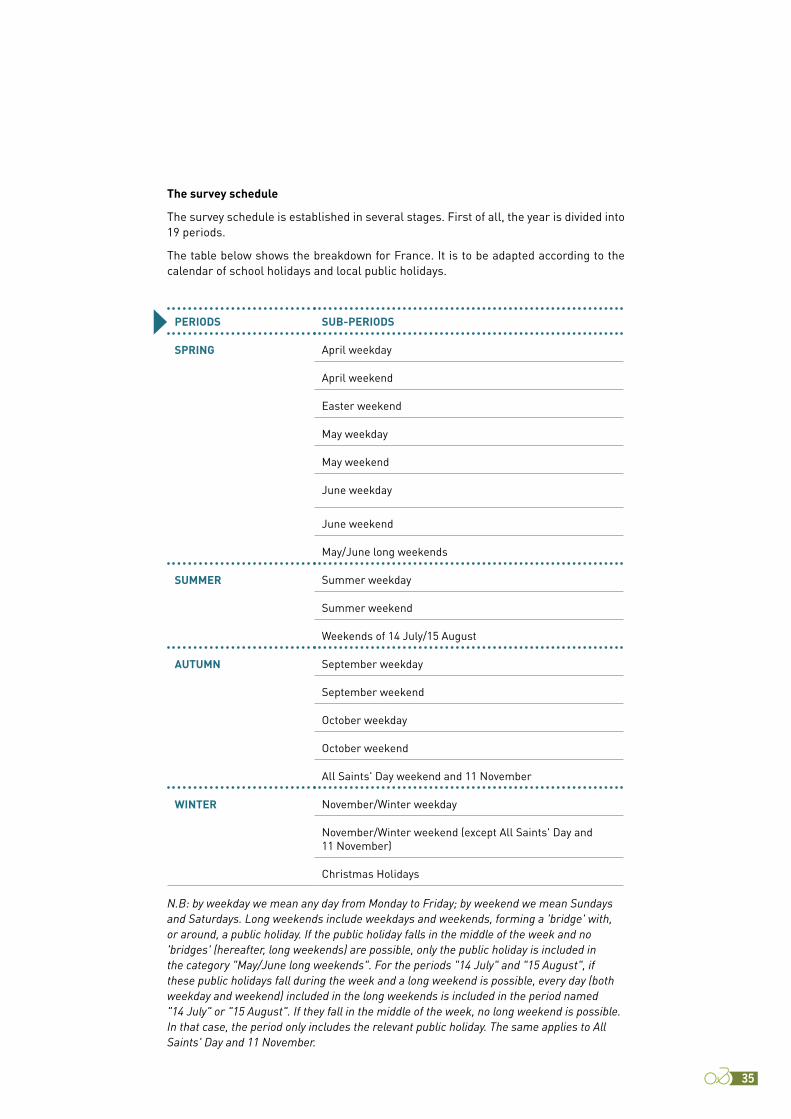
The survey schedule
The survey schedule is established in several stages. First of all, the year is divided into 19 periods.
The table below shows the breakdown for France. It is to be adapted according to the calendar of school holidays and local public holidays.
PERIODS SUB-PERIODS
SPRING April weekday
April weekend
Easter weekend
May weekday
May weekend
June weekday
June weekend
May/June long weekends
SUMMER Summer weekday
Summer weekend
Weekends of 14 July/15 August
AUTUMN September weekday
September weekend
October weekday
October weekend
All Saints' Day weekend and 11 November
WINTER November/Winter weekday
November/Winter weekend (except All Saints' Day and 11 November)
Christmas Holidays
N.B: by weekday we mean any day from Monday to Friday; by weekend we mean Sundays and Saturdays. Long weekends include weekdays and weekends, forming a 'bridge' with, or around, a public holiday. If the public holiday falls in the middle of the week and no 'bridges' (hereafter, long weekends) are possible, only the public holiday is included in the category "May/June long weekends". For the periods "14 July" and "15 August", if these public holidays fall during the week and a long weekend is possible, every day (both weekday and weekend) included in the long weekends is included in the period named "14 July" or "15 August". If they fall in the middle of the week, no long weekend is possible. In that case, the period only includes the relevant public holiday. The same applies to All Saints' Day and 11 November.

36
SETTING UP THE SURVEY
Next, the survey days are distributed by site and by period, so that they are representative of each period (spring, summer and autumn) as a whole. For the "pivot" sites, one survey day will be planned for each period (spring, summer and autumn or winter). Only sites with significant winter ridership will be surveyed during this period. Once the dis-tribution has been made, an overall check must be carried out to ensure that each period is repre-sented for each segment.
The distribution should also take into account constraints in the field (works, events, etc.). This is why it is important to involve the technical road management services and the local authorities concerned before and during the survey in order to identify these constraints.
Once the days have been allocated to the periods, an analysis of the count data is necessary to es-timate the number of interviewers needed on site and to further refine the survey schedule.
A table of the daily averages observed per site and per period is drawn up. This makes it possible to determine the number of interviewers needed, ge-nerally 1, 2 or 3 depending on the case.
›› At sites where ridership is less than 300 pas-sages per day, a single interviewer is sufficient to conduct manual counts, short interviews, and in-depth surveys. The interviewer will survey al-most all cyclists.
›› On intermediate sites where ridership is between 300 and 800 passages per day, two interviewers will be required.
›› On high-traffic sites with more than 800 pas-sages, 3 interviewers will be required. During peak periods, surveys and short interviews will be carried out by sampling. The sample crite-rion used is "first subsequent respondent". This means that as soon as a place is available on site, or an interview is finished, the interviewer interviews the next cyclist to pass by.
›› On sites with very high ridership (over 2,500 passages per day) and high significance, it is recommended to use 4 interviewers (one per station and per direction of traffic) to maximise the response rate at peak times.
Please note that recommendations above that per-tain to volume can be adapted according to field constraints (such as site location and traffic, etc.).
When several interviewers are present at one site, roles should be distributed (e.g. manual counts and short interviews, distribution of questionnaires). For example: where 3 interviewers are present on site, one distributes questionnaires and provides refreshments, while the other two conduct ma-nual counts and short interviews, each serving one stream of traffic.
To avoid fatigue, roles can be rotated regularly.
©At
lant
ic C
oast
Rou
te
37
400
350
300
250
200
150
100
50
0%
500
number of questionnaires completed
average daily number of byke passages
y = 1,0735x 0,7467
1 000 1 500 2 000 2 500• • • • •
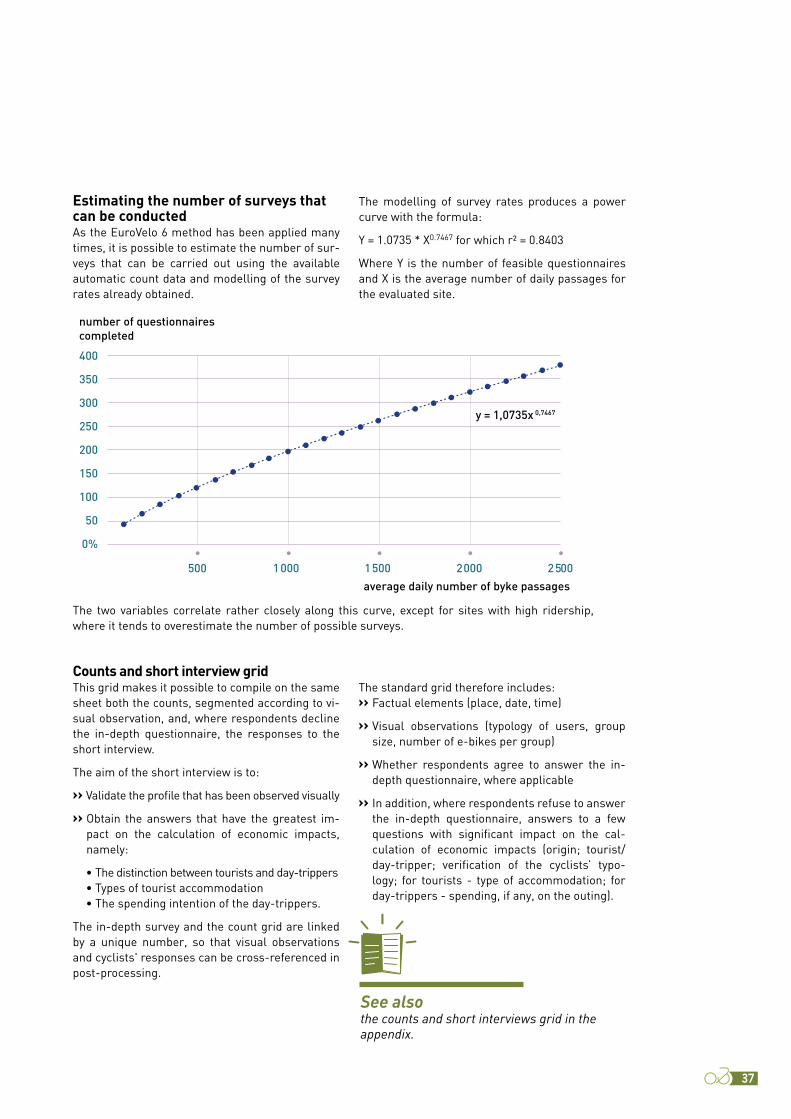
Estimating the number of surveys that can be conductedAs the EuroVelo 6 method has been applied many times, it is possible to estimate the number of sur-veys that can be carried out using the available automatic count data and modelling of the survey rates already obtained.
The modelling of survey rates produces a power curve with the formula:
Y = 1.0735 * X0.7467 for which r² = 0.8403
Where Y is the number of feasible questionnaires and X is the average number of daily passages for the evaluated site.
The two variables correlate rather closely along this curve, except for sites with high ridership, where it tends to overestimate the number of possible surveys.
Counts and short interview gridThis grid makes it possible to compile on the same sheet both the counts, segmented according to vi-sual observation, and, where respondents decline the in-depth questionnaire, the responses to the short interview.
The aim of the short interview is to:
›› Validate the profile that has been observed visually
›› Obtain the answers that have the greatest im-pact on the calculation of economic impacts, namely:
• The distinction between tourists and day-trippers • Types of tourist accommodation • The spending intention of the day-trippers.
The in-depth survey and the count grid are linked by a unique number, so that visual observations and cyclists' responses can be cross-referenced in post-processing.
The standard grid therefore includes:›› Factual elements (place, date, time)
›› Visual observations (typology of users, group size, number of e-bikes per group)
›› Whether respondents agree to answer the in-depth questionnaire, where applicable
›› In addition, where respondents refuse to answer the in-depth questionnaire, answers to a few questions with significant impact on the cal-culation of economic impacts (origin; tourist/day-tripper; verification of the cyclists’ typo-logy; for tourists - type of accommodation; for day-trippers - spending, if any, on the outing).
See also the counts and short interviews grid in the appendix.
38
SETTING UP THE SURVEY
In-depth survey questionnaireSince 2006, the questionnaire has evolved slight-ly to reflect changes in cyclists' behaviour and the needs of contracting authorities. After benchmar-king the main questionnaires used by the reference nations in this area (Switzerland, Germany, etc.), the French questionnaire seems to offer a good compromise between the time required for com-pletion and the need for information. However, it could be improved by adding complementary ele-ments, the testing of which may also be of interest. These are: an online post-stay survey, an expense logbook with online data entry (initial attempts were disappointing due to a low return rate), GPS tracking combined with daily questions (e.g. using a game application that includes gamification).
Please note: in the AtlanticOnBike project, the French questionnaire was used as a basis for the develop-ment of a common core of questions at the level of the European EuroVelo network. Once the evaluation procedures have been established in other European countries and the data collected in France has been adapted to the European format, it will be possible to compare results across the continent.
Standard in-depth questionnaire
The survey takes the form of a self-administered questionnaire (the respondent completes the sur-vey themselves). This is the questionnaire used in EuroVelo surveys conducted in France. It is now well established and consists of four parts:
›› The profile of the outing and the stay (cycling type, distances, accommodation, activities, mode of preparation, mode of access)
›› Satisfaction level
›› Spending per item
›› Personal profile (origin, age, socio-professional category, frequency of cycling practice).
The questionnaire is available to cyclists in (at mi-nimum) French, English, German and Dutch. The model questionnaire currently in use is available in five languages (French, English, German, Dut-ch and Spanish). On paper, it fits onto the front and back of an A4 page. Where paper copies are used, each language version of the questionnaire is printed in a different colour for ease of identifi-cation. While it is possible to add questions to local versions, it is essential that there be an unaltered common core (without modifications to questions) to enable compilation and comparison of data on a regional or even national scale.
Note: it is essential to keep the questionnaire rela-tively short, because the response rate falls sharply once it extends beyond both sides of a single A4 (on paper). It is also essential that the common ques-tionnaire is adhered to as closely as possible in order to ensure comparability between the routes or networks studied and comparability over time.
The aim is to interview as many cyclists or groups of cyclists as possible. Priority should be given to one question session per group. Where practices differ within the same group, or where other group members are very insistent on answering the questionnaire, they may do so. In this case, all the questionnaires in the group should carry the same interview number with their own suffix (e.g. No. 101-1/101-2/101-3 for three questionnaires from the same group corresponding with observation No. 101). They should be attached to each other for ease of identification.
Ideally, where paper questionnaires are used, it would be convenient to print questionnaires with unique numbers. This would limit the risk of mis-numbering, omitting or duplicating numbers.
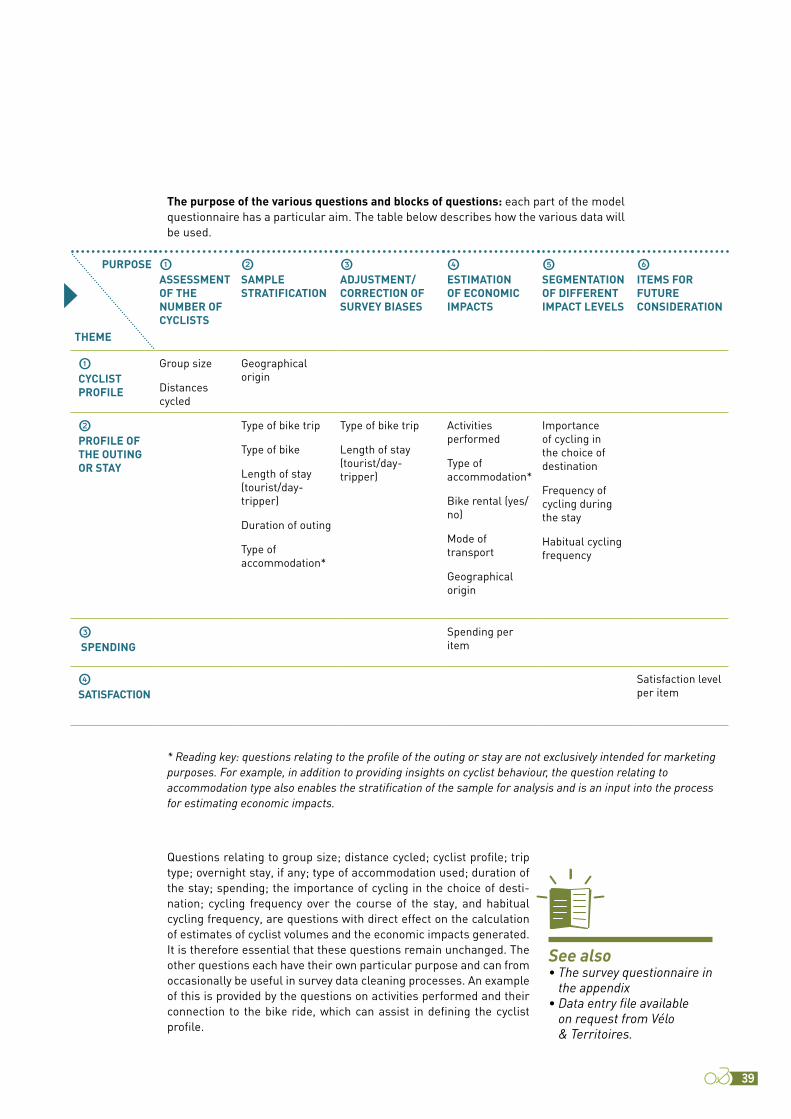
39
The purpose of the various questions and blocks of questions: each part of the model questionnaire has a particular aim. The table below describes how the various data will be used.
PURPOSE
THEME
1�ASSESSMENT OF THE NUMBER OF CYCLISTS
2�SAMPLE STRATIFICATION
3�ADJUSTMENT/CORRECTION OF SURVEY BIASES
4 ESTIMATION OF ECONOMIC IMPACTS
5 SEGMENTATION OF DIFFERENT IMPACT LEVELS
6 ITEMS FOR FUTURE CONSIDERATION
1 CYCLIST PROFILE
Group size
Distances cycled
Geographical origin
2�PROFILE OF THE OUTING OR STAY
Type of bike trip
Type of bike
Length of stay (tourist/day-tripper)
Duration of outing
Type of accommodation*
Type of bike trip
Length of stay (tourist/day-tripper)
Activities performed
Type of accommodation*
Bike rental (yes/no)
Mode of transport
Geographical origin
Importance of cycling in the choice of destination
Frequency of cycling during the stay
Habitual cycling frequency
3� SPENDING
Spending per item
4 SATISFACTION
Satisfaction level per item
* Reading key: questions relating to the profile of the outing or stay are not exclusively intended for marketing purposes. For example, in addition to providing insights on cyclist behaviour, the question relating to accommodation type also enables the stratification of the sample for analysis and is an input into the process for estimating economic impacts.
See also• The survey questionnaire in
the appendix• Data entry file available
on request from Vélo & Territoires.
Questions relating to group size; distance cycled; cyclist profile; trip type; overnight stay, if any; type of accommodation used; duration of the stay; spending; the importance of cycling in the choice of desti-nation; cycling frequency over the course of the stay, and habitual cycling frequency, are questions with direct effect on the calculation of estimates of cyclist volumes and the economic impacts generated. It is therefore essential that these questions remain unchanged. The other questions each have their own particular purpose and can from occasionally be useful in survey data cleaning processes. An example of this is provided by the questions on activities performed and their connection to the bike ride, which can assist in defining the cyclist profile.

40
SETTING UP THE SURVEY
Abridged in-depth questionnaire
In some cases, it is possible to use an abridged questionnaire coupled with an online post-stay questionnaire. However, this type of input requires an incentive (such as a prize draw) to boost the res-ponse rate of the post-stay survey-.
The abridged questionnaire will include only the questions that are essential for calculating ri-dership and economic impacts. All the more marketing-related questions (activities performed, satisfaction, etc.) will be asked in the post-stay questionnaire.
The abridged questionnaire can be self-administe-red or administered by an interviewer.
This approach is recommended when climatic conditions are unfavourable for on-site surveys, or for flash surveys to update the key ratios of the overall survey.
Online questionnaire
This type of questionnaire should only be used in addition to an on-site survey based on a full or abridged questionnaire. It is imperative to link eve-ry element to a single respondent number, in order to enable cross-checking of the answers obtained from various inputs (short interviews, abridged questionnaire, online questionnaire).
The online questionnaire will include all the mar-keting-related questions, such as those relating to activities performed and satisfaction. It will be sent by e-mail after the stay.
In order to obtain a good response rate, it is impor-tant to provide an incentive (a prize draw) and plan at least two reminders.
See also A sample questionnaire will soon be added to the method.
See also A sample questionnaire will soon be added to the method.
Logbook
The logbook is a tool for collecting spending data. It is answered on a daily basis for the duration of the journey.
The data can be collected in a paper document and sent in a prepaid envelope at the end of the journey or submitted online or by means of a specially de-veloped application.
The main aim of setting up this kind of tool is to obtain a more accurate view of spending data. This type of data collection works fairly well in Switzer-land, but the limited tests carried out in France (on paper) have not been conclusive.
See also A sample logbook will soon be added to the method.
©At
lant
ic C
oast
Rou
te

41
Setting up of a panel of accommodation providersDetailed analysis of the automatic counting data does not allow one to differentiate between the seasonality of cycle tourers and that of holiday cy-clists with fixed accommodation, unless the route or the network studied includes counters that ty-pify a given cycling practice. The absence of this type of counter can be mitigated by convening a panel of accommodation providers.
Setting up a panel consists of mobilising volunteer accommodation providers (particularly "Accueil Vélo" [a bike friendly accommodation network]) and asking them to carry out a day-by-day count of the number of cyclists they receive, differentiating between cycle tourers and tourists who cycle du-ring their stay. Counting can be done by tally marks (one mark per cyclist) on a counting sheet or via an online data collection device (see the technical sheet "Tools for setting up a panel of accommoda-tion providers" in the appendix).
Success in setting-up a panel of accommodation providers depends on several elements:
›› Selection of volunteers by geographical area and type of accommodation
›› Monitoring and chairing of the panel throughout the operation.
It is therefore recommended that people who are frequent contact with these accommodation pro-viders (tourism promoters, the cycling sector, "Accueil Vélo" brand developers, etc.) be asso-ciated with this survey. These people will be best positioned to target the accommodation providers most inclined to take part, and enlist their partici-pation.
To help recruit volunteers, it may be useful to draw up an advocacy document that sets out the approach and its potential benefits for the group and for individual respondents. An example of a document produced by the coordinators of EV1-La Vélodyssée® is available in the appendix.
In order to encourage a sustained response (including in high season), it is necessary to pro-vide feedback to the participating accommodation providers. This could, for example, present the respondent's data in comparison with averages for their geographical area and/or type of accommo-dation.
Take note: setting up a panel of accommodation providers is time-consuming and requires ongoing monitoring and facilitation. Without this monito-ring, the resulting data may be too incomplete to be useful. It is therefore necessary to provide ade-quate human resources to complete this project.
See also (documents available in the appendix)• Data sheet on setting up of
panels of accommodation providers
• Advocacy document for accommodation providers (by the coordinators of EV1-La Vélodyssée).
Local leadershipImplementing a study of ridership and economic impacts is not only a matter for the people who are usually responsible for monitoring. It is a tool that produces results that will be used in many areas (marketing, infrastructure, development, etc.), but which depends on the participation of everyone in-volved right from the outset.
This requires the participation of several actors:
›› Local authorities for sites at which survey points are planned (the municipalities concerned should be briefed, and permission requested to conduct the survey in their jurisdictions)
›› Regional partners (regional councils, depart-mental councils, national government technical services [such as the Direction départementale des Territoires (DDT)], local road services, Voies navigables de France [French inland waterway authority], etc.)
These partners should be consulted for informa-tion about any roadworks that may be planned on or near the route, as well as any events or demons-trations that may take place during the survey period. They should also be made aware of the survey schedule and the importance of regularly informing the person in charge of monitoring the survey of any works or events, etc., that could im-pact its progress.
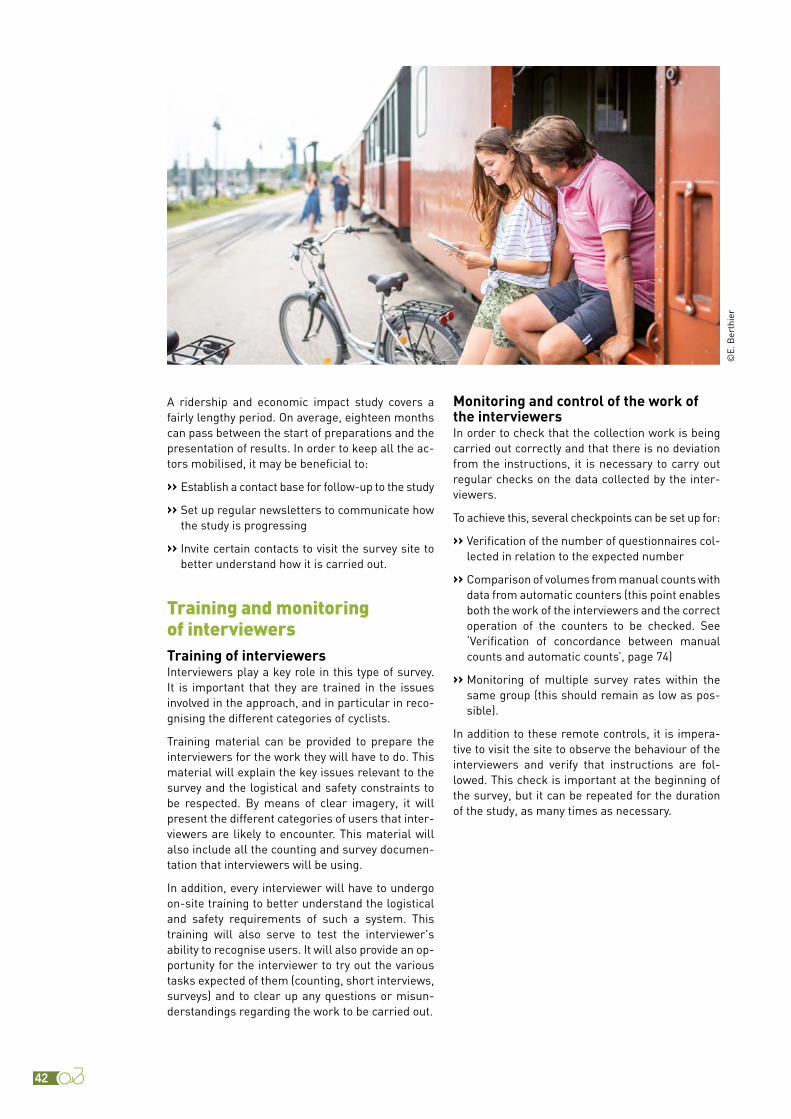
42
A ridership and economic impact study covers a fairly lengthy period. On average, eighteen months can pass between the start of preparations and the presentation of results. In order to keep all the ac-tors mobilised, it may be beneficial to:
›› Establish a contact base for follow-up to the study
›› Set up regular newsletters to communicate how the study is progressing
›› Invite certain contacts to visit the survey site to better understand how it is carried out.
Training and monitoring of interviewersTraining of interviewersInterviewers play a key role in this type of survey. It is important that they are trained in the issues involved in the approach, and in particular in reco-gnising the different categories of cyclists.
Training material can be provided to prepare the interviewers for the work they will have to do. This material will explain the key issues relevant to the survey and the logistical and safety constraints to be respected. By means of clear imagery, it will present the different categories of users that inter-viewers are likely to encounter. This material will also include all the counting and survey documen-tation that interviewers will be using.
In addition, every interviewer will have to undergo on-site training to better understand the logistical and safety requirements of such a system. This training will also serve to test the interviewer's ability to recognise users. It will also provide an op-portunity for the interviewer to try out the various tasks expected of them (counting, short interviews, surveys) and to clear up any questions or misun-derstandings regarding the work to be carried out.
Monitoring and control of the work of the interviewersIn order to check that the collection work is being carried out correctly and that there is no deviation from the instructions, it is necessary to carry out regular checks on the data collected by the inter-viewers.
To achieve this, several checkpoints can be set up for:
›› Verification of the number of questionnaires col-lected in relation to the expected number
›› Comparison of volumes from manual counts with data from automatic counters (this point enables both the work of the interviewers and the correct operation of the counters to be checked. See ‘Verification of concordance between manual counts and automatic counts’, page 74)
›› Monitoring of multiple survey rates within the same group (this should remain as low as pos-sible).
In addition to these remote controls, it is impera-tive to visit the site to observe the behaviour of the interviewers and verify that instructions are fol-lowed. This check is important at the beginning of the survey, but it can be repeated for the duration of the study, as many times as necessary.
©E.
Ber
thie
r

43
Survey data: questionnaires, counts, short interviews 44
Processing of automatic count data 74
Field.data.entry,.clearance.and.validation

44
FIELD DATA ENTRY, CLEARANCE AND VALIDATION
The aim of this phase is to check the internal consistency of the answers, to recode/homogenise the input of questions or open fields, and to pre-pare for the calculation phase by creating fields for grouping items. During this phase, non-responses to certain fields essential for the calculations will be replaced by interpolation estimates.
This phase should make it possible to establish a base that will support profile analyses and calcula-tions of ridership and economic impacts.
As with any survey, the database must be "cleaned" after input, with special attention paid to the following (non-exhaustive) treatments. Other modifications can be made as required [6]. The in-ternal coherence of the answers is the objective that should be kept in mind.
In order to keep track of the corrections made, in case of modification of the answers given by the respondents, it is necessary to keep the original field intact. Under no circumstances should mo-difications overwrite the original answers. For each modification, a new [xxx_correction] field is to be created in which the original data will be co-pied and pasted, and the necessary corrections will then be made.
All the procedures presented below are based on the questionnaire, the counting grid and the model file template that can be consulted in the appendix.
Survey data: questionnaires, counts, short interviews
6. In order to guarantee consistency of treatment between the different surveys carried out over the years, Vélo & Territoires should be consulted regarding any additional treatments. They can then be integrated into this method after validation by the Method Monitoring Committee.
Checking the integrity of the fileThe first things to do when survey data are com-piled are to:
›› Check that all survey days and sites are present in the survey and manual count databases
›› Check that the matching keys between databases (surveys, manual counts, etc.) are correctly en-tered. These keys correspond to the unique questionnaire number appearing on the manual counting grid and on the survey questionnaire (see page 38). This field is named [id_quest] in each database.
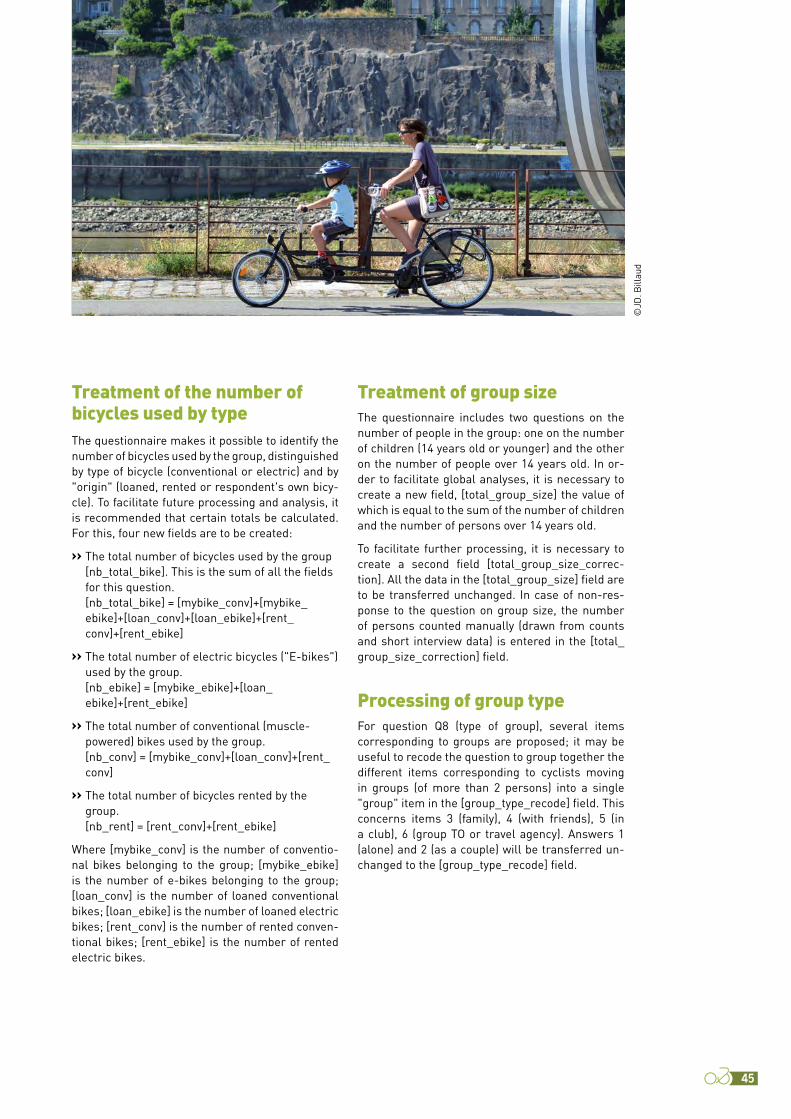
45
Treatment of the number of bicycles used by typeThe questionnaire makes it possible to identify the number of bicycles used by the group, distinguished by type of bicycle (conventional or electric) and by "origin" (loaned, rented or respondent's own bicy-cle). To facilitate future processing and analysis, it is recommended that certain totals be calculated. For this, four new fields are to be created:
›› The total number of bicycles used by the group [nb_total_bike]. This is the sum of all the fields for this question.
›› [nb_total_bike] = [mybike_conv]+[mybike_ebike]+[loan_conv]+[loan_ebike]+[rent_conv]+[rent_ebike]
›› The total number of electric bicycles ("E-bikes") used by the group.
›› [nb_ebike] = [mybike_ebike]+[loan_ebike]+[rent_ebike]
›› The total number of conventional (muscle-powered) bikes used by the group.
›› [nb_conv] = [mybike_conv]+[loan_conv]+[rent_conv]
›› The total number of bicycles rented by the group.
›› [nb_rent] = [rent_conv]+[rent_ebike]
Where [mybike_conv] is the number of conventio-nal bikes belonging to the group; [mybike_ebike] is the number of e-bikes belonging to the group; [loan_conv] is the number of loaned conventional bikes; [loan_ebike] is the number of loaned electric bikes; [rent_conv] is the number of rented conven-tional bikes; [rent_ebike] is the number of rented electric bikes.
Treatment of group sizeThe questionnaire includes two questions on the number of people in the group: one on the number of children (14 years old or younger) and the other on the number of people over 14 years old. In or-der to facilitate global analyses, it is necessary to create a new field, [total_group_size] the value of which is equal to the sum of the number of children and the number of persons over 14 years old.
To facilitate further processing, it is necessary to create a second field [total_group_size_correc-tion]. All the data in the [total_group_size] field are to be transferred unchanged. In case of non-res-ponse to the question on group size, the number of persons counted manually (drawn from counts and short interview data) is entered in the [total_group_size_correction] field.
Processing of group typeFor question Q8 (type of group), several items corresponding to groups are proposed; it may be useful to recode the question to group together the different items corresponding to cyclists moving in groups (of more than 2 persons) into a single "group" item in the [group_type_recode] field. This concerns items 3 (family), 4 (with friends), 5 (in a club), 6 (group TO or travel agency). Answers 1 (alone) and 2 (as a couple) will be transferred un-changed to the [group_type_recode] field.
©JD
. Bill
aud
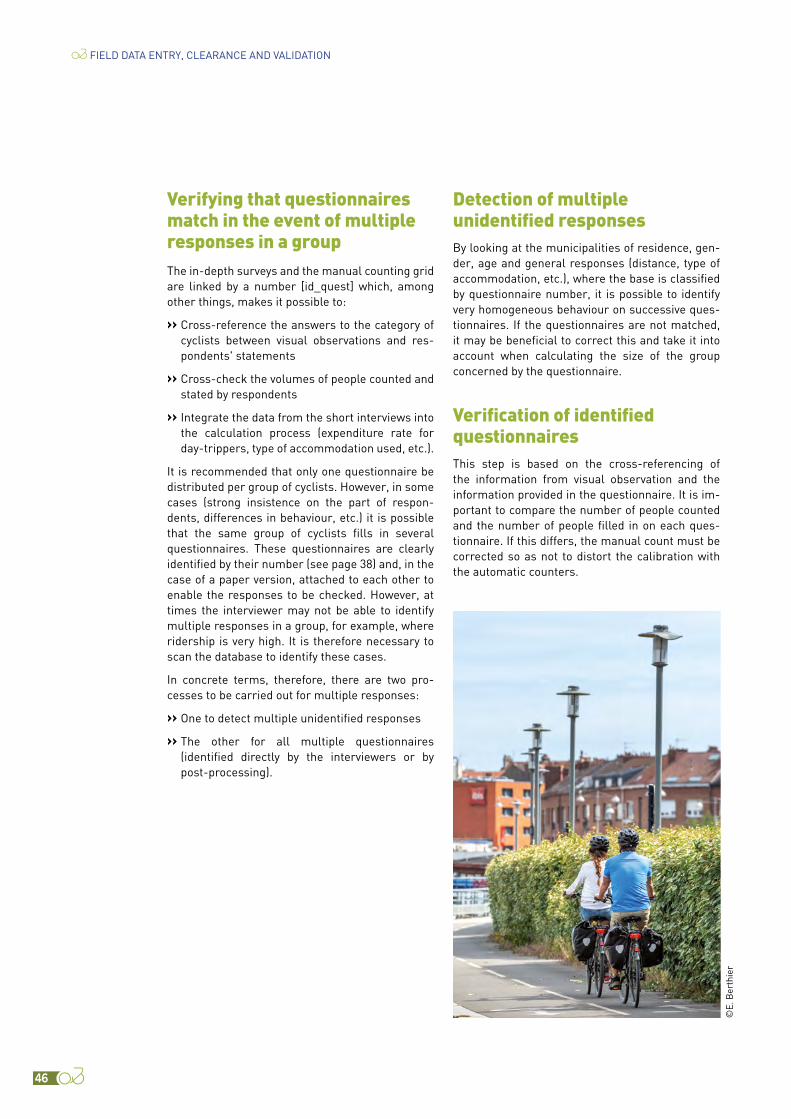
46
FIELD DATA ENTRY, CLEARANCE AND VALIDATION
Verifying that questionnaires match in the event of multiple responses in a groupThe in-depth surveys and the manual counting grid are linked by a number [id_quest] which, among other things, makes it possible to:
›› Cross-reference the answers to the category of cyclists between visual observations and res-pondents' statements
›› Cross-check the volumes of people counted and stated by respondents
›› Integrate the data from the short interviews into the calculation process (expenditure rate for day-trippers, type of accommodation used, etc.).
It is recommended that only one questionnaire be distributed per group of cyclists. However, in some cases (strong insistence on the part of respon-dents, differences in behaviour, etc.) it is possible that the same group of cyclists fills in several questionnaires. These questionnaires are clearly identified by their number (see page 38) and, in the case of a paper version, attached to each other to enable the responses to be checked. However, at times the interviewer may not be able to identify multiple responses in a group, for example, where ridership is very high. It is therefore necessary to scan the database to identify these cases.
In concrete terms, therefore, there are two pro-cesses to be carried out for multiple responses:
›› One to detect multiple unidentified responses
›› The other for all multiple questionnaires (identified directly by the interviewers or by post-processing).
Detection of multiple unidentified responsesBy looking at the municipalities of residence, gen-der, age and general responses (distance, type of accommodation, etc.), where the base is classified by questionnaire number, it is possible to identify very homogeneous behaviour on successive ques-tionnaires. If the questionnaires are not matched, it may be beneficial to correct this and take it into account when calculating the size of the group concerned by the questionnaire.
Verification of identified questionnairesThis step is based on the cross-referencing of the information from visual observation and the information provided in the questionnaire. It is im-portant to compare the number of people counted and the number of people filled in on each ques-tionnaire. If this differs, the manual count must be corrected so as not to distort the calibration with the automatic counters.
©E.
Ber
thie
r
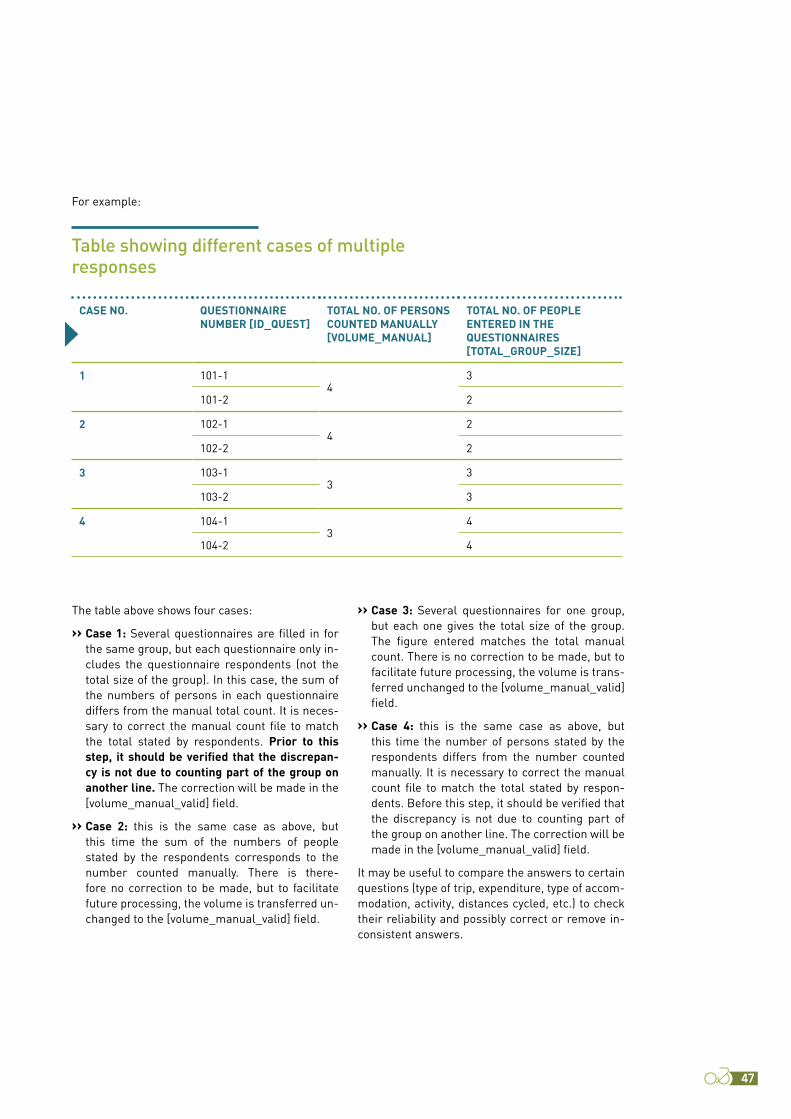
47
CASE NO. QUESTIONNAIRE NUMBER [ID_QUEST]
TOTAL NO. OF PERSONS COUNTED MANUALLY [VOLUME_MANUAL]
TOTAL NO. OF PEOPLE ENTERED IN THE QUESTIONNAIRES[TOTAL_GROUP_SIZE]
1 101-14
3
101-2 2
2 102-14
2
102-2 2
3 103-13
3
103-2 3
4 104-13
4
104-2 4
For example:
Table showing different cases of multiple responses
The table above shows four cases:
›› Case 1: Several questionnaires are filled in for the same group, but each questionnaire only in-cludes the questionnaire respondents (not the total size of the group). In this case, the sum of the numbers of persons in each questionnaire differs from the manual total count. It is neces-sary to correct the manual count file to match the total stated by respondents. Prior to this step, it should be verified that the discrepan-cy is not due to counting part of the group on another line. The correction will be made in the [volume_manual_valid] field.
›› Case 2: this is the same case as above, but this time the sum of the numbers of people stated by the respondents corresponds to the number counted manually. There is there-fore no correction to be made, but to facilitate future processing, the volume is transferred un-changed to the [volume_manual_valid] field.
›› Case 3: Several questionnaires for one group, but each one gives the total size of the group. The figure entered matches the total manual count. There is no correction to be made, but to facilitate future processing, the volume is trans-ferred unchanged to the [volume_manual_valid] field.
›› Case 4: this is the same case as above, but this time the number of persons stated by the respondents differs from the number counted manually. It is necessary to correct the manual count file to match the total stated by respon-dents. Before this step, it should be verified that the discrepancy is not due to counting part of the group on another line. The correction will be made in the [volume_manual_valid] field.
It may be useful to compare the answers to certain questions (type of trip, expenditure, type of accom-modation, activity, distances cycled, etc.) to check their reliability and possibly correct or remove in-consistent answers.

48
FIELD DATA ENTRY, CLEARANCE AND VALIDATION
Warning:
For all subsequent processing of the data collected, in the case of matched questionnaires (multiple responses within the same group), care must be taken to ensure that the responses are corrected. Thus, if the answers are identical on all (or seve-ral) of the group's questionnaires, the processing must be identical for these questionnaires, except in special cases.
Calculating the number of respondents per groupThe [nb_respondent_group] field is created to take into account multiple responses in the same group.
›› When there is only one respondent per group, the number 1 is entered.
›› When several questionnaires are filled in for the same group, but each questionnaire only indicates the number of people actually respon-ding to the questionnaire, the number entered for each questionnaire in the group should be 1. In this case, the sum of the numbers of people indicated on each questionnaire is equal to the size of the group as a whole (cases 1 and 2 in the table presented page 47).
›› When several questionnaires are completed for the same group and each questionnaire indi-cates the total number of people in the group, then the number entered is the number of ques-tionnaires completed by the group (cases 3 and 4 in the table presented pages 47).
Checking consistency between group size and type of groupIt is necessary to check the consistency between the data in the field [total_group_size] and the answer to the question on the type of group (Q8). Thus, if in Q8 the chosen item is:
›› "Alone": the size of the group must be equal to 1
›› "Couple": the size of the group must be 2
›› In other cases, it must be greater than 1.
Be aware that in the case of multiple responses (i.e. several questionnaires for the same group):
›› The answer "alone" cannot be ticked, as these answers relate to groups
›› Where the sum of the fields [total_group_size] of all the questionnaires in the group is greater than 2, the answer cannot be "couple". This is necessarily a larger group.
In case of inconsistencies, it may be relevant to cross-check with the manual counts and adjust the answer to the question on group type (Q8) accordingly. To do this, it is necessary to create a [group_type_recode_correction] field to carry over the corrections. If no correction is made, the origi-nal information will be carried forward unchanged from the [group_type_recode] field.

49
Checking the consistency between the number of bicycles used and the size of the groupIt may seem appropriate to check the consistency between the data in the [nb_total_bike] field and the [total_group_size] field. Nevertheless, as the question on the numbers and types of bicycles used include many items, correction in case of inconsis-tencies appears tricky and complicated given the significance of this question. However, checks on the following two cases can easily be carried out:
›› If the number of bicycles stated is less than the total size of the group. It is sufficient to consult the manual counting grid to check whether the group includes children who are not autono-mous.
›› The number of bicycles stated is greater than the total size of the group. A check should be made on whether several questionnaires have been completed for the same group and whether the answer corresponds to the whole group and not only to the persons who responded to the questionnaire.
In the event of significant discrepancies that involve a large number of questionnaires, all the fields re-lated to question 1 (number of bicycles used per type) will be duplicated with the suffix "correction" [xxxx_correction]. The data of the original fields will be copied there. In case of discrepancies, the problematic data will be removed from these new fields.
Calculation of the number of people represented by the questionnaireIn order to avoid multiple counts of the number of persons linked to multiple questionnaires, the field [rate_respondent_group] is to be created. It cor-responds to the calculation of a ratio between the number of persons stated in the question on the size of the group and the number of respondents within the same group. It is therefore the number of people actually represented by each questionnaire.
The following formula must therefore be entered:
[rate_respondent_group] = [total_group_size_correction]/[nb_respondent_group]
Verification of the volumes of people according to the basesIt may be useful to check the consistency between the volumes of people reported by in-depth surveys resulting from manual counts and those reported by the survey. Ideally, the volumes should be rela-tively close to each other. There may, however, be small discrepancies with, in most cases, a slightly lower volume resulting from the counts than in the survey. This is generally linked to a fragmentation of arrivals at the survey point. In a group arriving in two or three subgroups, only one part of the group is attached to the questionnaire, the others are manually counted as non-surveyed.
The comparison should be made on the basis of the fields [volume_manual_valid], for manual count, and [rate_respondent_group] for the survey.
In the event of a significant deviation, the reason for this should be investigated.
Validation of cyclist categoriesVisual observation allows the cyclists to be seg-mented into four categories:
›› Sport cyclists
›› Cycle tourers
›› Utility cyclists
›› Leisure cyclists.
When cyclists agree to answer the in-depth sur-vey or short interview, it is possible to compare the category filled in by the interviewer with the cyclist's response. Overall, the visual observation corresponds well with the questionnaire response. However, where the two observations differ, cor-rection criteria are used to assign the cyclist to a category. This operation produces the [category_correction] field.
In case of non-response to the question relating to category in the questionnaire (Q3 [category]), the category resulting from visual observation will be assigned in the [category_correction] field.
In the event of divergent information, the different scenarios for assigning each cyclist to a specific category are presented in the table below and ex-plained below.

50
FIELD DATA ENTRY, CLEARANCE AND VALIDATION
RESPONSE TO THE SURVEY
VISUAL OBSERVATION
CYCLE TOURER
SPORT CYCLIST
UTILITY CYCLIST
LEISURE CYCLIST
CYCLE TOURER Case 1 (*) Case 2 Case 3
SPORT CYCLIST Case 4 Case 5 Case 6
UTILITY CYCLIST Case 7 Case 8 Case 9
LEISURE CYCLIST Case 10 Case 11 Case 12
(*) Reading key: in case 1, the interviewer has identified a cyclist as a cycle tourer (see answer to the field [category_visual_cyclists] derived from the manual counts file). This same cyclist has identified themselves as a sport cyclist in the questionnaire (see answer to the [category] field in the survey file).
›› Case 1: someone visually profiled as a cycle tou-rer stating that they are a sport cyclist.
The choice of category is to be made by looking at the answers to the questions on the type of trip, length of stay, and questions specific to cy-cle tourers (origin, destination, total distance of the bicycle trip):
• If the type of trip stated (question 2) is "a mul-ti-day outing" and the length of stay is more than 1 day and/or answers have been provi-ded to the questions specific to cycle tourers (questions 25 to 27), then the cyclist will be al-located to the "cycle tourer" category.
• If the type of trip stated is "a multi-day outing" and the length of stay is less than or equal to 1 day, then:
- If there are answers to the questions that are specific to cycle tourers, the cyclist will be assigned to the "cycle tourer" category.
- If there is no answer to the questions specific to cycle tourers, the cyclist will be assigned to the "sport" category.
• If the type of trip stated is not a "multi-day ou-ting" and there are answers to the questions specific to cycle tourers, then the cyclist will be assigned to the "cycle tourer" category.
• If the type of trip stated is not "a multi-day outing" and there are no answers to the ques-tions specific to cycle tourers, then the cyclist will be assigned to the "sport" category.
›› Case 2: someone visually profiled as a cycle tou-rer who states that they are a utility cyclist. This may involve a cycle tourer who is making a utility trip at the time of questioning.
The choice of category should be made by looking at the answers to the questions on the type of trip, the length of stay and the questions specific to cycle tourers (origin-destination, total distance of the bicycle trip):
• If the type of trip stated (question 2) is "a mul-ti-day outing" and the length of stay is more than 1 day and/or if there are answers to the questions specific to cycle tourers (origin, des-tination, total distance of the ride), then the cyclist will be assigned to the "cycle tourer" category.
• If the type of trip stated is "a multi-day outing" and the length of stay is less than or equal to 1 day, then:
- If there are answers to the questions that are specific to cycle tourers, the cyclist will be assigned to the "cycle tourer" category.

51
- If there is no answer to the questions specific to cycle tourers, the cyclist will be assigned to the "utility" category.
• If the type of trip stated is not a "multi-day ou-ting" and there are answers to the questions specific to cycle tourers, then the cyclist will be assigned to the "cycle tourer" category.
• If the type of trip stated is not "a multi-day outing" and there are no answers to the ques-tions specific to cycle tourers, then the cyclist is assigned to the "utility" category.
›› Case 3: someone visually profiled as a cycle tourer who states that they are a leisure cyclist. They may involve either cycle tourers taking a break in their journey and taking an excursion at the time of questioning; or leisure cyclists with pannier bags on their bikes to carry leisure items.
The choice of category will be made by looking at the answers to the questions on the type of trip, length of stay, and questions specific to cy-cle tourers:
• If the type of trip stated (question 2) is "a mul-ti-day outing" and the length of stay is more than 1 day and/or answers have been provi-ded to the questions specific to cycle tourers (questions 25 to 27), then the cyclist will be al-located to the "cycle tourer" category.
• If the type of trip stated is "a multi-day outing" and the length of stay is less than or equal to 1 day, then:
- If there are answers to the questions that are specific to cycle tourers, the cyclist will be assigned to the "cycle tourer" category.
- If there is no answer to the questions specific to cycle tourers, the cyclist will be assigned to the "leisure" category.
• If the type of trip stated is not a "multi-day ou-ting" and the length of stay is more than 1 day and/or consistent answers have been provided to the questions specific to cycle tourers, then the cyclist will be assigned to the "cycle tou-rer" category.
• If the type of trip stated is not "a multi-day outing", and there are no answers to the ques-tions specific to cycle tourers, then the cyclist will be assigned to the "leisure" category.
›› Case 4: someone visually profiled as a sport cyclist who states that they are a cycle tourer. These are most often groups of people (poten-tially sport cyclists) accompanied by a van or a support vehicle car, who are in fact cycle touring.
The choice of category is to be made by looking at the answers to the questions on the type of trip, length of stay, and questions specific to cy-cle tourers (origin, destination, total distance of the bicycle trip):
• If the type of trip stated (question 2) is "a mul-ti-day outing" and the length of stay is more than 1 day and/or answers have been provi-ded to the questions specific to cycle tourers (questions 25 to 27), then the cyclist will be al-located to the "cycle tourer" category.
• If the type of trip stated is "a multi-day outing" and the length of stay is less than 1 day, then:
- If there are answers to the questions that are specific to cycle tourers, the cyclist will be assigned to the "cycle tourer" category.
- If there is no answer to the questions specific to cycle tourers, then the cyclist will be as-signed to the "sport" category.
• If the type of trip stated is not a "multi-day ou-ting" and there are answers to the questions specific to cycle tourers, then the cyclist will be assigned to the "cycle tourer" category.
• If the type of trip stated is not "a multi-day outing" and there are no answers to the ques-tions specific to cycle tourers, then the cyclist will be assigned to the "sport" category.
›› Case 5: someone visually profiled as a sport cy-clist who states that they are a utility cyclist. This case is becoming more and more common. As a rule, these cyclists carry a small backpack. They are utility cyclists who put on their sportswear to go to work.
The choice of category will be made by looking at the answers to the questions on the kilometres cycled on the trip and the type of journey:
• If the distance is short (less than or equal to 30 km) and if the journey is made on a "round trip", then the cyclist will be assigned to the "utility" category.
• In other cases, the cyclist will be assigned to the "sport" category.
52
FIELD DATA ENTRY, CLEARANCE AND VALIDATION
›› Case 6: someone visually profiled as a sport cy-clist who states that they are a leisure cyclist. This is most often a cyclist on a racing/road bike and bike outfit, but on a relaxed outing (e.g. with the family).
The choice of category will be made by looking at the answers to the questions on the type of bike, the kilometres cycled, and the activities practised during the trip (question 10):
• If the bicycle used is not an e-bike and if the kilometres cycled is more than 50 km and the cyclist does not state any activity other than cycling during the trip, then the cyclist will be assigned to the "sport" category.
• If the bicycle used is an e-bike and the cyclist does not state that they have practised any ac-tivity other than cycling during the trip, then the cyclist will be assigned to the "leisure" category (except when mountain biking and/or cycling in mountainous areas).
• If the mileage cycled is more than 50 km and the cyclist states that they have engaged in ac-tivities other than cycling during the trip, then the cyclist will be assigned to the "leisure" category.
• If the mileage cycled is less than or equal to 50 km or if there is no answer on the kilometres cycled, then the cyclist will be assigned to the "leisure" category.
›› Case 7: someone visually profiled as a utility cyclist who states that they are a cycle tourer. This may be a cycle tourer taking a break in their journey who is taking a utility trip at the time of questioning, or a cycle tourer using a luggage transport service who is cycling in conventional clothing.
The choice of category is to be made by looking at the answers to the questions on the type of trip, length of stay, and questions specific to cy-cle tourers (origin, destination, total distance of the bicycle trip):
• If the type of trip stated (question 2) is "a mul-ti-day outing" and the length of stay is more than 1 day and/or if there are answers to the questions specific to cycle tourers (origin, des-tination, total distance of the ride), then the cyclist will be assigned to the "cycle tourer" category.
• If the type of trip stated is "a multi-day outing" and the length of stay is less than 1 day, then:
- If there are answers to the questions that are specific to cycle tourers, the cyclist will be assigned to the "cycle tourer" category.
- If there is no answer to the questions specific to cycle tourers, then the cyclist will be as-signed to the "utility" category.
• If the type of trip stated is not "a multi-day outing" and there are no answers to the ques-tions specific to cycle tourers, then the cyclist will be assigned to the "utility" category.
• If the type of trip stated is not a "multi-day ou-ting" and there are answers to the questions specific to cycle tourers, then the cyclist will be assigned to the "cycle tourer" category.
›› Case 8: someone visually profiled as a utility cy-clist who states that they are a sport cyclist. The choice of category will be made by looking at the answers to the questions on the kilometres cy-cled on the trip and the type of journey:
• If the distance is more than 50 km and the bike used is not an e-bike, then the cyclist will be assigned to the "sport" category.
• If the distance is less than or equal 50 km and/or the bike used is an e-bike, then the cyclist will be assigned to the "utility" category.
›› Case 9: someone visually profiled as a utility cy-clist who states that they are a leisure cyclist. This may be a frequent occurrence, as the diffe-rence between the two categories is sometimes difficult to establish.
The choice of category should be made by consi-dering the answers to the questions on the activities practised, and the link between the bike ride and activities (Q11):
• If one or more activities are stated and prac-tised on the bike ride, the cyclist is assigned to the "leisure" category.
• If one or more activities are stated and are the purpose of the bike ride, the cyclist is assigned to the "utility" category.
• If no activity is stated, the cyclist is assigned to the "leisure" category.
›› Case 10: someone visually profiled as a leisure cyclist who states that they are a cycle tourer. They may be either cycle tourers taking a break in their journey and going on a day excursion at the time of the questioning, or cycle tourers using a luggage transport service or a support vehicle. Sometimes, some cyclists mistakenly consider
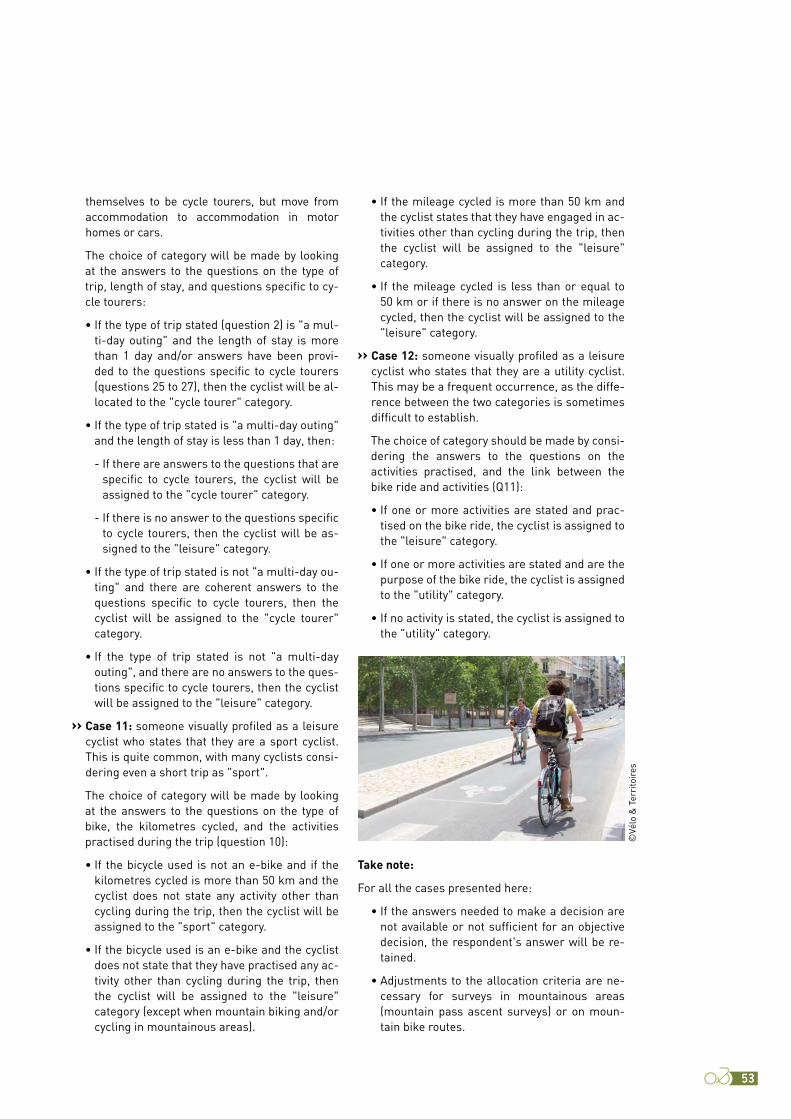
53
themselves to be cycle tourers, but move from accommodation to accommodation in motor homes or cars.
The choice of category will be made by looking at the answers to the questions on the type of trip, length of stay, and questions specific to cy-cle tourers:
• If the type of trip stated (question 2) is "a mul-ti-day outing" and the length of stay is more than 1 day and/or answers have been provi-ded to the questions specific to cycle tourers (questions 25 to 27), then the cyclist will be al-located to the "cycle tourer" category.
• If the type of trip stated is "a multi-day outing" and the length of stay is less than 1 day, then:
- If there are answers to the questions that are specific to cycle tourers, the cyclist will be assigned to the "cycle tourer" category.
- If there is no answer to the questions specific to cycle tourers, then the cyclist will be as-signed to the "leisure" category.
• If the type of trip stated is not "a multi-day ou-ting" and there are coherent answers to the questions specific to cycle tourers, then the cyclist will be assigned to the "cycle tourer" category.
• If the type of trip stated is not "a multi-day outing", and there are no answers to the ques-tions specific to cycle tourers, then the cyclist will be assigned to the "leisure" category.
›› Case 11: someone visually profiled as a leisure cyclist who states that they are a sport cyclist. This is quite common, with many cyclists consi-dering even a short trip as "sport".
The choice of category will be made by looking at the answers to the questions on the type of bike, the kilometres cycled, and the activities practised during the trip (question 10):
• If the bicycle used is not an e-bike and if the kilometres cycled is more than 50 km and the cyclist does not state any activity other than cycling during the trip, then the cyclist will be assigned to the "sport" category.
• If the bicycle used is an e-bike and the cyclist does not state that they have practised any ac-tivity other than cycling during the trip, then the cyclist will be assigned to the "leisure" category (except when mountain biking and/or cycling in mountainous areas).
• If the mileage cycled is more than 50 km and the cyclist states that they have engaged in ac-tivities other than cycling during the trip, then the cyclist will be assigned to the "leisure" category.
• If the mileage cycled is less than or equal to 50 km or if there is no answer on the mileage cycled, then the cyclist will be assigned to the "leisure" category.
›› Case 12: someone visually profiled as a leisure cyclist who states that they are a utility cyclist. This may be a frequent occurrence, as the diffe-rence between the two categories is sometimes difficult to establish.
The choice of category should be made by consi-dering the answers to the questions on the activities practised, and the link between the bike ride and activities (Q11):
• If one or more activities are stated and prac-tised on the bike ride, the cyclist is assigned to the "leisure" category.
• If one or more activities are stated and are the purpose of the bike ride, the cyclist is assigned to the "utility" category.
• If no activity is stated, the cyclist is assigned to the "utility" category.
Take note:
For all the cases presented here:
• If the answers needed to make a decision are not available or not sufficient for an objective decision, the respondent's answer will be re-tained.
• Adjustments to the allocation criteria are ne-cessary for surveys in mountainous areas (mountain pass ascent surveys) or on moun-tain bike routes.
©Vé
lo &
Ter
rito
ires
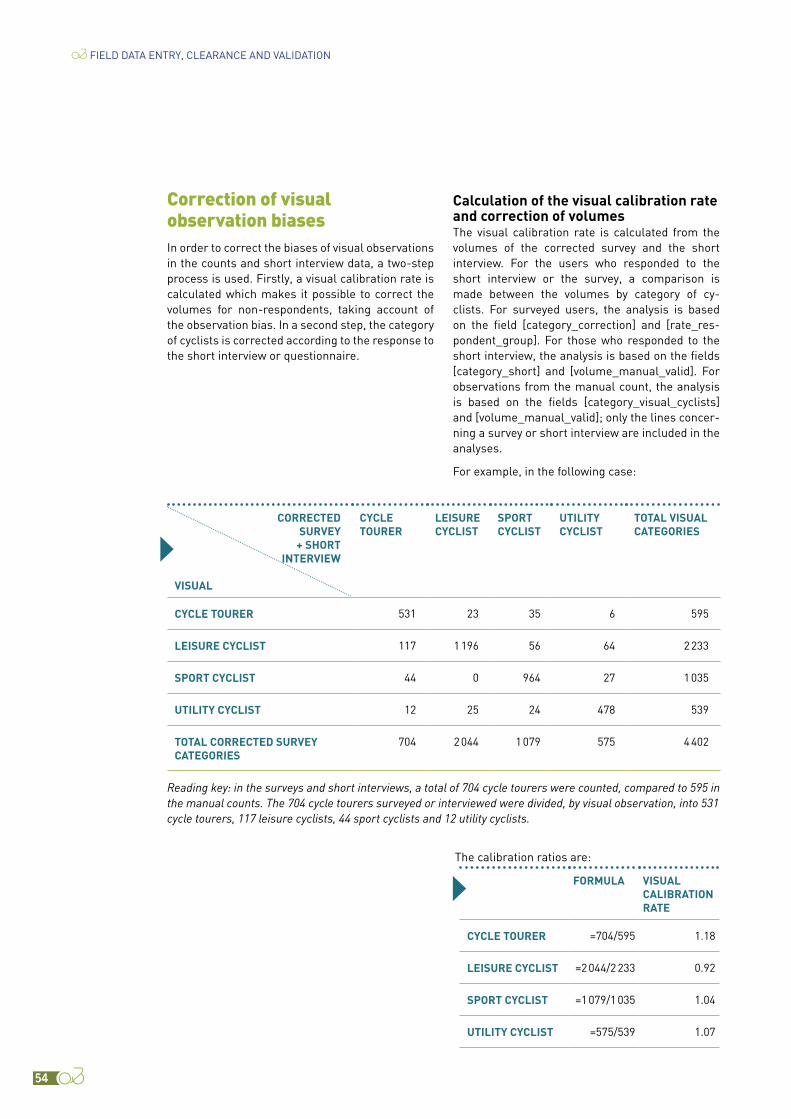
54
FIELD DATA ENTRY, CLEARANCE AND VALIDATION
Correction of visual observation biasesIn order to correct the biases of visual observations in the counts and short interview data, a two-step process is used. Firstly, a visual calibration rate is calculated which makes it possible to correct the volumes for non-respondents, taking account of the observation bias. In a second step, the category of cyclists is corrected according to the response to the short interview or questionnaire.
Calculation of the visual calibration rate and correction of volumesThe visual calibration rate is calculated from the volumes of the corrected survey and the short interview. For the users who responded to the short interview or the survey, a comparison is made between the volumes by category of cy-clists. For surveyed users, the analysis is based on the field [category_correction] and [rate_res-pondent_group]. For those who responded to the short interview, the analysis is based on the fields [category_short] and [volume_manual_valid]. For observations from the manual count, the analysis is based on the fields [category_visual_cyclists] and [volume_manual_valid]; only the lines concer-ning a survey or short interview are included in the analyses.
For example, in the following case:
CORRECTED SURVEY
+ SHORTINTERVIEW
VISUAL
CYCLE TOURER
LEISURE CYCLIST
SPORT CYCLIST
UTILITY CYCLIST
TOTAL VISUAL CATEGORIES
CYCLE TOURER 531 23 35 6 595
LEISURE CYCLIST 117 1 196 56 64 2 233
SPORT CYCLIST 44 0 964 27 1 035
UTILITY CYCLIST 12 25 24 478 539
TOTAL CORRECTED SURVEY CATEGORIES
704 2 044 1 079 575 4 402
Reading key: in the surveys and short interviews, a total of 704 cycle tourers were counted, compared to 595 in the manual counts. The 704 cycle tourers surveyed or interviewed were divided, by visual observation, into 531 cycle tourers, 117 leisure cyclists, 44 sport cyclists and 12 utility cyclists.
The calibration ratios are:
FORMULA VISUAL CALIBRATION RATE
CYCLE TOURER =704/595 1.18
LEISURE CYCLIST =2 044/2 233 0.92
SPORT CYCLIST =1 079/1 035 1.04
UTILITY CYCLIST =575/539 1.07

55
These calibration ratios are calculated for each day and survey site. This produces a table. For each non-respondent, the ratio is applied to the obser-ved manual volumes using a search function.
The [volume_manual_correction] is integrated into the manual count base. For non-respondents to the interview and questionnaire, it will be filled in by the following calculation:
[volume_manual_correction] = [volume_manual_valid] * [rate_calibration_visual].
For interview or questionnaire respondents, the data in the [volume_manual_valid] field is simply transferred unchanged to the [volume_manual_correction] field.
Correction of the category of cyclists in the manual count baseFor non-respondents, the correction of the ob-servation bias is made to the volume itself by integrating a visual calibration rate (see pre-vious paragraph). For respondents to the short interview or questionnaire, if there is a discre-pancy between the visual observation and the cyclist's response, the category assigned to the cyclist or group of cyclists concerned should be corrected [category_visual_cyclists]. The field [category_visual_cyclists_correction] is created for this purpose. It will be filled in as follows:
›› For non-respondents, the data in the [category_visual_cyclists] field is carried over unchanged.
›› For respondents to the short interview, the data in the [category_short] field is carried across unchanged.
›› For respondents to the questionnaire, the data in the [category_correction] field from the survey database is carried over unchanged.
Validation of the type of excursion/outingDepending on changes in the category of cyclists, it may be necessary to correct the type of outing (question 2, [type_trip]). This correction will be made in a new field [type_trip_correction]. The ori-ginal values will be copied and pasted into this new field, and then corrections will be made directly to these values as follows:
›› All questionnaires whose corrected category is "cycle tourer" must have "several days" as the corrected type of outing.
›› All questionnaires whose category is not "cy-cle tourer" and whose type of outing is "several days" must by definition be corrected. As it is not possible to reassign a category from the other questions in the questionnaire, the type of outing is simply deleted.
All the analyses will then be conducted using the data in the [type_trip_correction] field.
Checking and processing of mileage dataThe processing of data on kilometres cycled (ques-tion 4 [km_trip]) will result in the creation of two new fields: [km_trip_valid] and [km_trip_correction].
The first will allow the data collected to be cleaned of possible out of the norm responses (extreme va-lues). These are most often due to input errors or facetious answers. These non-standard or extreme values can be discerned by identifying question-naires whose answers represent the first and last percentiles of the value observed for a group of comparable cyclists. In addition, it may also be useful to compare each data item with the median obtained for a group of comparable cyclists. As far as the mileage cycled is concerned, this analysis will be done according to the category of cyclists (based on the [category_correction] field). Once the extreme values have been identified, several actions are implemented:
›› Checking the data on the original questionnaire to eliminate a data entry error. If it is an input error, the data is corrected in the [km_trip] field.
›› Creation of the new field [km_trip_valid] to which all data is transferred. Extreme values will be removed in this new field. Thereafter, all the mean or median calculations and profile analyses will be carried out only in this field.
For the calculation of the economic impact, it is imperative that each questionnaire has informa-tion on the mileage cycled. Also, in the case of a non-response, the average mileage of the corres-ponding cyclist category (sports, leisure, utility, touring) is inserted by default. This assignment is made in the [km_trip_correction] field.
56
Take note: the mileage data sometimes intervene in the procedure for correcting the category of the cyclist ([category_correction]). As this is sometimes modified according to distance, if the distance is out of the norm and has an impact on the choice of the corrected category, then the category and the other questions that depend on it (type of trip) will have to be corrected again.
Assignment of the tourist/day-tripper profileTourist/day-tripper segmentation is a major factor. It is done by post-processing of the question on overnight stay (question 17, field [overnight_stay]).
Where the answer is 'yes', the 'tourist' profile is as-signed to the questionnaire in the field [tour_dayt]. Where the answer is "no", the profile "day-tripper" is assigned to the questionnaire.
In case of non-response, the profile will be as-signed according to the answers to the questions on length of stay, type of accommodation, mode of transport, or questions specific to cycle touring. Thus:
›› Where an answer has been given regar-ding to the length of stay or to the type of accommodation, if figures have been stated for accommodating expenditure or if the transport mode response is “plane”, the profile "tourist" is assigned to the questionnaire. Take note: some second-home owners tend to consider themsel-ves as "day-trippers", yet they are well suited to the "tourist" profile.
›› If the distance between the survey point and the place of residence[7] exceeds the limit for a day trip (> 150 km[8]), the "tourist" profile is assigned. The "non-commercial" type of accommodation (see ‘Grouping of accommodation types’, pages 61 and 62) is assigned by default. Any expendi-ture data is transferred to the fields specific to tourists.
›› If no answer is given to the length of stay, to the type of accommodation and that the distance between the place of residence and the survey point is compatible with a day trip (< 150 km[8]), the "day-tripper" profile is assigned by default.
Next, check that all questionnaires for which the category of cyclists is "cycle tourer" are assigned to the "tourist" profile. If this is not the case, it is ne-cessary to find out whether the category of cyclists or the profile should be changed. To do this, the answers to the question on length of stay and to the questions specific to cycle tourers (origin, destina-tion, total mileage, etc.) should be checked. If the respondent has filled in one or more of these ques-tions, they must be assigned to the category "cycle tourer" and the profile "tourist". If none of these questions have been answered, the instructions in the previous paragraphs should be repeated to as-sign the correct category.
Assignment of a profile according to the category of the respondentFor extrapolation calculations, it will be necessary to group the questionnaires by large generic pro-files. For this purpose, each questionnaire must be assigned a profile that depends on the category of the respondent and on whether they are a tourist or day-tripper.
The [profile] field is therefore created and filled in as follows:
›› If the respondent is a "day-tripper" (see previous paragraph), then the "dayt" profile for day-trip-per is assigned to the respondent.
›› If the respondent is a "tourist" (see previous paragraph) and their category ([category_cor-rection]) is "cycle tourer", then they are assigned the profile "ct" for cycle tourer.
›› If the respondent is a "tourist" (see previous paragraph) and their category ([category_cor-rection]) is not "cycle tourer", then they are assigned the "tour" profile for holiday cyclists.
This can be translated into the following Excel for-mula:
[profile] = IF([tour_dayt]="Day-tripper";"dayt";IF([category_correction]="Cycle tourer";"ct";"tour"))
7. The methods for calculating this distance are detailed page 59. 8. The 150 km threshold may be increased from time to time, particularly in protruding coastal areas, to avoid sea crossings
(e.g. in the study on EV1-La Vélodyssée, the threshold was raised to 200 km to process distances including Breton municipalities).
FIELD DATA ENTRY, CLEARANCE AND VALIDATION
57
Verification and processing of the length of stayIn order not to distort the analyses, it is necessary to check the relevance of the answers to the ques-tion on the average length of stay. Extreme and questionable values will be excluded from the ana-lyses. To do this, add a [als_correction] field and enter the data from the [als] field. All the modifi-cations will then be carried out on this field. At the end of the operation, this field will only include data that excludes extreme and questionable values; the data will be used later for profile analyses and average/median calculations.
Different checks can be carried out:
›› Verification of the coherence between the profile (tourist/day-tripper) and whether or not there is an answer on the length of stay. Only questionnaires with a "tourist" profile need to be answered. If a day-tripper has answered this question, the data on the original questionnaire should be checked to eliminate any data entry errors. If there has been a data entry error, the data are corrected in the [overnight_stay] and [tour_dayt] fields. If there are no data entry errors, check whether there are other answers to the questions specific to tourists (type of accommodation, accommodation ex-penses, etc.). If one or more answers are present, this profile must be modified. If there are no other data that point to an error in the profile, the data on the length of stay in the [als_correction] field should be deleted.
›› Research and treatment of extreme values:
Extreme data can be defined as the first and last percentiles of the dataset. In addition, it may be useful to compare each data item to the median obtained for a group of comparable cyclists. With regard to length of stay, this analysis will be done according to the category of cyclists cross-refe-renced with the type of accommodation (based on the fields [category_correction] and [acc_mode_grouped] or [acc_mode_grouped2] if the data is not sufficient (see ‘Grouping accommo-dation types, page 61 and 62)).
Once these data have been identified and be-fore any processing, a check of the data on the original questionnaire must be carried out to eli-minate any data entry errors. If there has been an input error, the data is corrected in the [als] field. If there has not been a data entry error and the data seems aberrant and inconsistent with the rest of the questionnaire, it will be removed from the [als_correction] field.
›› Research and treatment of particular extreme values:
As with the other extreme values, a check of the data on the original questionnaire must be done to eliminate a data entry error. If there has been an input error, the data is corrected in the [als] field.
• Data smaller than 1: if the respondent states that the length of their stay was 0 nights, it is necessary to check whether the municipalities in which the stay is taking place are the same as the municipalities of residence, to verify the type of accommodation and the accommoda-tion expenditure.
- If the municipalities in which the stay is ta-king place are the same as the municipalities of residence and no type of accommodation is stated, the "tourist" profile must be modi-fied to "day-tripper", and information related to tourists must be deleted or moved to fields specific to day-trippers (e.g. expenditure).
- If the municipalities are different and there is a response on the type of accommodation or accommodation expenditure, the data on the length of stay will be removed from the [als_correction] field.
• Data equal to 365: the points to be checked and the treatments to be carried out are identical to those in the case of data smaller than 1.
Recoding of open fieldsThe questionnaire consists of several questions with open-ended fields such as "Other, please specify" or "[...], which one?". Before analysing the answers, it is necessary to recode all the answers to each of these fields in order to harmonise their input and facilitate their use.
Three steps must be taken:
›› 1. Harmonise the input.
›› 2. For "other" questions, if necessary, reassign the answer to an existing item (e.g.: in the list of accommodation modes, there is an existing item, "wild camping", and the respondent has not ticked this item; instead, they have ticked "other" and specified "bivouac". This answer can be recoded as "wild camping").

58
›› 3. Draw up a list of the most frequently cited "other" responses and group similar responses into one to facilitate analysis. The recoding of the responses to the "other" item will be done in a [xxx_other_recode] field so as not to lose track of the original response (e.g. the [group_type_other] field will be recoded in the [group_type_other_recode] field).
When recoding, it is recommended to make a list of the response before and after treatment. If cer-tain responses come up very regularly, it is worth considering integrating them directly into the questionnaire in a future survey.
A list for processing open questions is provided in the appendix. The list was compiled on the basis of previous implementations and is intended to be enriched if necessary, after consultation and vali-dation by the Method Monitoring Committee.
In addition to these treatments, it is necessary to clean the contents of all open fields from any inadvertent punctuation. Bear in mind that the fi-nal database must be exportable in ".csv" format (comma-separated values). In fact, it is recom-mended to avoid the use of commas or semicolons for all these fields.
Municipalities of accommodation, departure, arrival, residence and postcodeIt is necessary to homogenise the entry of names and to check the concordance between the name of the municipality and the postcode. For the munici-palities of accommodation [city_acc] and departure on the route [ct_depart_route] and arrival at the route [ct_arrival_route], it is necessary to verify that these municipalities are part of the route or network being assessed.
Ideally, the input base could be linked to a database listing at least the French municipalities and the municipalities of the route or network studied. For municipalities of accommodation and residence, it is also recommended to make use of the geo-graphical codes for municipalities in France (COG [Code officiel géographique]), or even the LAU
(Local Administrative Unit[9]) code of the European Union. This integration will be done in the fields [city_acc_cog_lau] and [city_res_cog_lau].
Each "municipality" field has its own purpose:
›› The municipality of residence [city_res] is used to calculate the distance to the survey point (see page 59) and to calculate the day-tripper drawdown curve (see page 92). It is also used to calculate the day's transport expenditure where the mode of transport stated is car, camper van or motorbike. It can also be used when assi-gning questionnaires to the tourist/day-tripper profiles.
›› The municipality of accommodation [city_acc] is used for the calculation of distances to the sur-vey point (see page 60) and the calculation of the drawdown curve of the tourist gravity model (see page 93).
›› The departure [ct_depart_route] and arrival [ct_arrival_route] municipalities are used to create an origin-destination matrix for cycle tourers. This matrix is used for spatial extrapolation (see page 81 to 95). In this context, it is necessary to check that the municipalities indicated are part of the route. This check is done using a search function between the response base and the table of municipalities [table_municipalities]. The [ct_dep_route_valid] and [ct_arr_route_va-lid] fields are created. If the municipalities entered are indeed part of the route, the names of these municipalities are indicated. If not:
• If the stated municipality is close to the route, the name of the nearest municipality belonging to the route is included in the corresponding field.
• If the municipality entered is far from the route, then the questionnaire will be excluded from the origin-destination analyses, and no municipality will be entered in the correspon-ding fields.
9. The European Union has, through Eurostat, defined a code for each European municipality. For French municipalities, the Local Administration Unit (LAU) code corresponds to the geographical code (COG) used by INSEE. The table of LAUs is available on the Eurostat website (https://ec.europa.eu/eurostat/web/nuts/local-administrative-units) and the table of French municipalities with COG (also called CODGEO) is available on the INSEE website (https://www.insee.fr/fr/information/2028028).
FIELD DATA ENTRY, CLEARANCE AND VALIDATION

59
Calculation of the distance between the home and the survey pointDifferent approaches are possible:
›› This calculation is based on GIS, but in this case it will be necessary to convert the names of the cities into X, Y coordinates (the link between the tables of municipalities and GIS can be made on the basis of the geographical code of the municipalities: COG or LAU), generate the distances as the crow flies (imported into the [distance_home_svpt] field), then transform them into real distances, in the [distance_home_svpt_real] field. The specialist mobility consultancy Indiggo recommends the use of the fol-lowing formula
[distance_home_svpt_real] = [distance_home_svpt]*(1.1+0.3*EXP(-[distance_home_svpt]/20))
›› Calculation and importing of the data in the [distance_home_svpt_real] field can take place by connecting to an API such as Google Maps (https://developers.google.com/maps/documentation/distance-matrix/start?hl=fr) or an API such as openrouteser-vice (https://openrouteservice.org/services/) by referring to the following tutorial:
›› https://www.youtube.com/watch?v=t8knVFKLnQU&feature=youtu.be
The actual distance must be broken down to identify the distance travelled in the re-gions traversed by the route or network being evaluated, in France (excluding regions traversed by the route) and abroad. These distances will be used in the calcula-tion of transport costs. To integrate this breakdown in the file, 3 fields are created: [distance_home_svpt_real_regions], [distance_home_svpt_real_france] and [distance_home_svpt_real_abroad].
For day-trippers, a consistency check can be carried out between the distance stated in Q7 [dist_transp_day] and the home-to-survey point distance [distance_home_svpt_real]. Logically, the distances should be relatively similar. There may be a gap corresponding to the distance travelled between the point of departure for the trip and the survey point, but this gap should be small. If there is a significant difference, the validity of the res-ponse to Q7 should be tested by checking the original questionnaire to ensure that there are no entry errors and by checking the other responses in the questionnaire. It will also be necessary to check that there is no miscalculation in the distance between the home and the survey point (errors may arise from a misapplication of the COG/LAU to the municipality, or from municipalities located on peninsulas or large protrusions of land into the sea (e.g. the case of Brittany in the EV1-La Vélodyssée study)).

60
Calculation of the distance between the place of accommodation and the survey pointDifferent approaches are possible:
›› Calculation is based on GIS, but in this case it will be necessary to convert the names of the cities into X, Y coordinates (the link between the municipality tables and GIS can be made on the basis of the geographical code of the municipalities: COG or LAU), generate the distances as the crow flies (imported into the [distance_acc_svpt] field), and then convert them into real distances, in the [distance_acc_svpt_real] field. The specialist mobility consultancy Indiggo recommends the use of the fol-lowing formula:
[distance_acc_svpt_real] = [distance_acc_svpt]*(1.1+0.3*EXP(-[distance_acc_svpt]/20))
›› Calculation and importing of the data in the [distance_acc_svpt_real] field can take place by connecting to an API such as Google Maps
(https://developers.google.com/maps/documentation/distance-matrix/start?hl=fr) or an API such as openrouteservice (https://openrouteservice.org/services/) by referring to the following tutorial: https://www.youtube.com/watch?v=t8knVFKLnQU&feature=youtu.be
FIELD DATA ENTRY, CLEARANCE AND VALIDATION
©M
. Jol
y

61
Rented accommodation (Gîtes and furnished
accommodation)
Gîte/furnished accommodation
Furnished accommodation let by platforms (Airbnb or equivalent)
Houseboat
Other (holiday resort, hotel apartment,...)
Youth hostels, stopover, group gîtes
Youth hostel, stopover accommodation, group accommodation
Campsites Camping with own equipment/tent camping in a campsite
Camping in cottage or rental accommodation (bungalow) or pitched tente
Camper van (if expenditure is stated)
Hotels/Guests houses Hotel
Guests houses
Non-commercial Second home
Family-friends
Couchsurfing, Warmshowers, Cyclo-Camping International (CCI)
Camping-van (if no expenditure is stated)
Other (bivouac, wild camping...)
CREATED FIELD
Grouping of accommodation types by major typeA field [acc_mode_grouped] should be created to group accommodation types by major type. Groupings are to be made in accordance with the table below.
This grouping is used for the expenditure analyses of line items that feed into the report. As part of the estimation of economic impact, it is used to calculate average expendi-tures as a basis for attributing expenditures to non-respondents. For this, the number of responses per category grouped together must be sufficient to calculate averages. Otherwise, the average expenditure should be calculated by making such groupings as are most relevant for the calculations (e.g. commercial/non-commercial - see next paragraph).

62
Correction of day-trippers' expenditure dataValidation of expenditure dataAs a reminder, the expenditure stated is expendi-ture per person. It is common for respondents to make a mistake when filling out the questionnaire and answer for the group. The first thing to do, therefore, is to calculate the median expenditure for each item, based on respondents reporting an expenditure for the item in question. Then it is ne-cessary to check the deviation from the median for each questionnaire. If the gap is too large, it will be necessary to identify whether the expenditure is more in line with that of the group or whether it is in fact atypical. Particular attention should be paid to responses on expenditure in the case of multiple responses within the same group. Each of these matched questionnaires must be reviewed to check the following: does each answer relate to the entire group or only to the number of people actually covered by the questionnaire?
In order to eliminate unreliable answers, for each expenditure item, two new fields are created and named [dayt_exp_xxx_valid] and [dayt_exp_xxx_correction] (xxx corresponding to the name of the item, for example: [dayt_exp_food_valid] and [dayt_exp_food_correction]). These fields will en-able the integration of corrections in two steps. In the first step, the original data is copied to the [dayt_exp_xxx_valid] field. If it is invalid, it is dele-ted and replaced by the corrected amount. When it cannot be corrected, the field is left blank. In the second step, the data in field [dayt_exp_xxx_valid] is pasted into field [dayt_exp_xxx_correction], and then the data in field [dayt_exp_xxx] that could not be corrected is replaced by the item average for the respondent's category. The average is calculated on the basis of the [dayt_exp_xxx_valid] field.
The main cases that require correction are the fol-lowing:
›› Non-standard expenditure. Before any proces-sing of these expenses, a check of the data on the original questionnaire must be done to eli-minate any data entry errors. If it is an input error, the data is corrected in the [dayt_exp_xxx_valid] fields. Particular attention should be paid to data representing the first and last percentiles. If there are no input errors, but the data show a real inconsistency with the rest of the responses, the data will be removed from the [dayt_exp_xxx_valid] fields. The data will be replaced by the average of the relevant items for the respondent's category in the field
FIELD DATA ENTRY, CLEARANCE AND VALIDATION
Commercial/non-commercial accommodation groupingsCreation of a [acc_mode_grouped2] field to group together all the commercial accommodation, on the one hand, and non-commercial, on the other hand. The 'commercial' corresponds to the grou-ping of all categories other than 'non-commercial' as defined in the previous paragraph.
Conversion of expenditure data that has been enteredThe question on expenditure in the model ques-tionnaire, which is provided in the appendix, is presented in table form. This proposal is an adap-tation of the questionnaire used to date and is the result of an experiment carried out on EuroVelo 1 on a transnational scale as part of the AtlanticOnBike project. The advantage of this new format is that it makes it possible to better identify the people who have spent or will spend money in general and on a per-item basis. In the long term, this will lead to an improvement in the reconstruction of data that is deemed unreliable. The disadvantage lies in the fact that expenditure data for day-trippers and tourists are entered in the same field. As this data entry is likely to complicate the stages of data correction and validation, it is preferable to process the data entered in such a way as to separate the data of day-trippers from that of tourists.
Two new fields are created for each "expense item" field (included the one related to the spen-ding intention). One is named [dayt_exp_xxx] and the other [tour_exp_xxx] (xxx being the name of the item, for example: [dayt_exp_food] and [tour_exp_food]). This transformation is carried out for each item, except for the accommodation item, as it only applies to tourists. The day-tripper data is copied from the original fields to the new fields [dayt_exp_xxx]. The same applies to tourists to the field [tour_exp_xxx].

63
[dayt_exp_xxx_correction], except for transport expenditure which is subject to special treat-ment (see paragraph below).
›› In the case of groups, answers for the group instead of the individual. Take note: in the case of multiple responses within the same group, it will be necessary to pay attention to the answers given on each questionnaire in the group and to treat them in a coherent way.
For some items, in addition to the deviation from the median, a consistency check may be made with the other questions in the survey. For example (non-exhaustive list):
›› For bicycle rental expenses, it is recommended to check whether a non-zero number of "rented bikes" is entered in Q1 ([rent_ebike] and/or [rent_conv]).
›› For transport expenditure, a cross-check of consistency between the stated figures and the mode of transport stated in Q6 ([transp_mode_day]: mode of transport used for travel to and from the route on the day of the trip) is neces-sary.
Correction of transport expenditureFor transport expenditure, the process to be ap-plied differs according to the mode of transport used on the day of the trip to and from the route [transp_mode_day]. For example, for day-trippers:
›› If the mode of transport stated is car or motor-bike, then the transport expenditure is calculated on the basis of the home-to-survey-point dis-tance in the region(s) on the route, multiplied by 2 (to account for a round trip) and multiplied by a cost per kilometre ratio of €0.14[10]. The whole divided by the number of people in the group. The amount is calculated in the [dayt_exp_transp_valid] field and then transferred to [dayt_exp_transp_correction].
›› If the mode of transport stated is a motor home/campervan, the transport expenditure is calcu-lated on the basis of the home-to-survey-point distance in the region(s) on the route, multiplied by 2 (to account for a round trip) and multiplied by a cost per kilometre ratio of €0.36[11]. The whole divided by the number of people in the group. The amount is calculated in the [dayt_exp_transp_valid] field and then transferred to [dayt_exp_transp_correction].
›› If the mode of transport stated is "none" (direct access and return by bicycle), then the amount entered must be €0 in the [dayt_exp_transp_va-lid] and [dayt_exp_transp_correction] fields. However, care will have to be taken as to what to include in the calculated averages and analyses.
›› If another mode of transport is stated and no amount is stated by the respondent or the amount is €0, the amount will be removed from the [dayt_exp_transp_valid] field and replaced by the average transport expenditure for the mode of transport used in [dayt_exp_transp_correction].
›› If another mode of transport is stated and an amount (other than €0) is stated, then the stated amount is kept in [dayt_exp_transp_valid] and carried over to [dayt_exp_transp_correction].
Take note: in the case of matched questionnaires (multiple responses within the same group), care must be taken to ensure that the answers are cor-rected. Thus, if the answers are identical on all (or several) of the group's questionnaires, the proces-sing must be identical for these questionnaires, except in special cases.
10. This ratio is calculated from two data sources. The items "07.2.2. fuels and lubricants" and "07.2.4. miscellaneous services related to private vehicles" derived from actual household expenditure by function (source: French national accounts - INSEE - https://www.insee.fr/), divided by the "private car kilometres" of the French national transport account (source: compte des transports, bilan de la circulation [transport account, traffic dashboard] - French Ministry of Ecological Transition - https://www.statistiques.developpement-durable.gouv.fr/). For 2018, this ratio was €0.14/km. It should be updated according to the latest available data.
11. Source : Inddigo
64
Calculation of the total expenditure of day-trippersIn order to facilitate the analyses and to enable the calculation of economic impact, it is impor-tant that a total expenditure be allocated to each questionnaire. For this, two fields are created: [dayt_exp_tot] and [dayt_exp_tot_impact]. The first allows the consolidation of respondents' data, and the second allows an amount to be allocated to each questionnaire for further calculations. Beha-vioural analyses will be based on the first field only.
The assignment of the data to the [dayt_exp_tot] field is done as follows:
›› If the respondent states that they had no expen-ditures on the trip ([dayt_intention_exp]), a total expenditure of €0 is allocated to them.
›› If the respondent declares an expenditure and has stated an amount for at least one item of ex-penditure, then the total expenditure allocated to it is the sum of the validated and corrected stated expenditure. The fields taken into account are those named [dayt_exp_xxx_correction] (see previous paragraphs).
›› If the respondent reports an expense and has not entered an amount, then the total expense is left blank.
›› If the respondent has not answered the question on intention to spend, then the total expenditure is left blank.
The assignment of data to the [dayt_exp_tot_im-pact] field is made by transferring the data unchanged from the [dayt_exp_tot] field, if avai-lable. In the absence of data:
›› If the respondent declares an expense and has not entered any amount in the questionnaire, then the total expense allocated to them corres-ponds to the average for their category (sports, utility, leisure).
›› If there is no answer to the question on intention to spend and if there is no amount in the ques-tionnaire, then the total expenditure allocated to it is €0.
Take note: All calculations and analyses for marketing purposes must be carried out in the [dayt_exp_tot] field. The [dayt_exp_tot_impact] field will only be taken into account in the economic impact calculations.
If enough answers are available, an average can be calculated on a finer geographical scale (for example, by region or by department), which will
make it possible to take into account the dispari-ties in local supply.
If there is sufficient data, it is possible to calculate the variance of this data to identify variables that may be pertinent (socio-professional category, age, length of trip, reason for trip) to produce a more suitable average. In practice, no survey carried out to date has collected sufficient data showing a significant link between the level of day-tripper spending and other variables, with the exception of significant differences between the French and Germans in Alsace.
Correction of tourist expenditure dataValidation of expenditure dataAs with day-trippers, the expenses reported are per day and per person. However, it frequently happens that respondents make mistakes when filling in the questionnaire and answer for the group or the whole stay. The first thing to do, the-refore, is to calculate the median expenditure for each item, based on respondents reporting an expenditure for the item in question. Then it is ne-cessary to check the deviation from the median for each questionnaire. If the gap is too large, it will be necessary to identify whether the expenditure is more in line with that of the group or whether it is in fact atypical. Particular attention should be paid to responses on expenditure in the case of multiple responses within the same group. Each of these matched questionnaires must be reviewed to check the following: does each answer relate to the entire group or only to the number of people actually covered by the questionnaire?
In order to rule out unreliable answers, for each expenditure item, two new fields are created and named [tour_exp_xxx_valid] and [tour_exp_xxx_correction] (xxx corresponding to the name of the item, for example): [tour_exp_food_valid] and [tour_exp_food_correction] for expenditure on food and catering). These fields will enable the integra-tion of corrections in two steps. In the first step, the original data is copied to the [tour_exp_xxx_valid] field. If it is invalid, it is deleted and replaced by the corrected amount. When it cannot be corrected, the field is left blank. In the second step, the data from field [tour_exp_xxx_valid] is pasted into field [tour_exp_xxx_correction], and then the data from field [tour_exp_xxx] that could not be corrected is replaced by the item average for the respondent's category. The average is calculated on the basis of
FIELD DATA ENTRY, CLEARANCE AND VALIDATION

65
the [tour_exp_xxx_valid] field. This procedure is applied to each item, except those that are subject to special treatment detailed in the following pa-ragraphs (TO package, accommodation, transport).
The main cases that require correction are the fol-lowing:
›› Non-standard expenditure. Before any proces-sing of these expenses, a check of the data on the original questionnaire must be done to eli-minate any data entry errors. If it is an input error, the data is corrected in the [tour_exp_xxx_valid] fields. Particular attention should be paid to data representing the first and last percentiles. If there are no input errors, but the data shows a real inconsistency with the rest of the responses, the data will be removed from the [tour_exp_xxx_valid] fields. They will be re-placed by the average of the relevant items for the respondent's category in the field [tour_exp_xxx_correction], except for expenditure items subject to special treatment.
›› Answers for the whole stay instead of the day of the trip. The expenditure will be replaced by the initial amount divided by the length of stay [als_correction] in the fields [tour_exp_xxx_valid] and [tour_exp_xxx_correction]. If no length of stay data is available, the expenditure will be divided by the average length of stay of the respondent category cross-referenced with the accommoda-tion type, or the accommodation type only in the event that there are not enough responses.
›› In the case of groups, answers for the group instead of the individual. Take note: in the case of multiple responses within the same group, it will be necessary to pay attention to the answers given on each questionnaire in the group and to treat them in a coherent way. If a correction can be made, it will be carried over to the [tour_exp_xxx_valid] and [tour_exp_xxx_correction] fields. In case of doubt, if it is not possible to make a correction, the expenditure will be removed from the [tour_exp_xxx_valid] field and thus from the analyses. It will be replaced by the item average for the category of respondent in the field [tour_exp_xxx_correction], except for items subject to special treatment.
For some items, in addition to the deviation from the median, a consistency check may be made with the other questions in the survey. For example (non-exhaustive list):
›› For bicycle rental expenses, it is recommended to check whether a non-zero number of "rented
bikes" is entered in Q1 ([rent_ebike] and/or [rent_conv]).
›› For transport expenditure, a cross-check of consistency between the stated figures and the mode of transport stated in Q6 ([transp_mode_day]: mode of transport used for travel to and from the route on the day of the trip) is neces-sary.
›› For accommodation expenditure, it is neces-sary to perform a cross-check for consistency between the amounts stated and the accommo-dation mode stated in Q19 [acc_mode].
For expenditure on bike rental or accommodation, it may be useful to contact the regional/depart-mental tourism organisations included in the study area to obtain local price ranges according to type of service rendered, which can serve as a basis for comparison.
Take note: in the case of matched questionnaires (multiple responses within the same group), care must be taken to ensure that the answers are cor-rected. Thus, if the answers are identical on all (or several) of the group's questionnaires, the proces-sing must be identical for these questionnaires, except in special cases.
Correction of the TO packageTO (tour operator) packages generally include accommodation, evening meals and bicycle ren-tal. Other expenses (midday meals, entry fees, purchases of local products) are stated by the res-pondents.
A new field is created [tour_exp_to_day] to calculate the amount of the TO package per day. This is ob-tained by dividing the stated amount [tour_exp_to] by the number of days covered by the package [tour_to_nb_day]. The data obtained will then be submitted for validation and included in the [tour_exp_to_day_va-lid] field. The validated amount will be added to the sum of the expenses incurred outside the package to obtain the total expenses per day.
The number of responses to this question is gene-rally low.
The consistency of the answers is checked by ana-lysing the expenditure according to the type of accommodation. In the event of a significant diffe-rence between the respondent's daily rate and the median daily rate for all respondents using the same mode of accommodation, the data may be disregarded (after checking the data on the origi-nal questionnaire to ensure that there are no data entry errors). For example, one respondent stays
66
in a hotel and reports a TO package of €700 per day, whereas the median TO package for people staying in hotels is €150. In this case, it is wor-thwhile to reflect on whether the respondent may have mistakenly indicated the expenditure for the group instead of the expenditure per person. If the doubt cannot be resolved, the expenditure will be removed from the [tour_exp_to_day_valid] field and will not be included in the analyses. Never-theless, for the economic impact calculations, the data from the field [tour_exp_to_day_valid] will be copied to the field [tour_exp_to_day_correction]. For cases that could not be corrected, the average according to the origin of the respondent (French/foreign) and/or the accommodation mode used is assigned in the [tour_exp_to_day_correction] field. The average is calculated on the basis of the data in the [tour_exp_to_day_valid] field, and the choice of the average to be applied (overall, by origin and/or accommodation mode) will depend on data avai-lability.
Correction of accommodation expensesThere are two ways of checking the consistency of the response regarding accommodation expendi-ture [tour_exp_acc]:
›› By comparing the stated expenditure with average price ranges for the area concerned (submitted by the contracting authority) by ac-commodation mode.
›› By comparing the reported expenditure to the median of the accommodation mode used.
If the difference is too great, it will be necessary to identify whether the expenditure corresponds more to that of the group or that of the stay, or whether it is really atypical. In the case of atypical expenditure, the data on the original questionnaire should be checked to ensure that there are no data entry errors. If an error is found, the data will be modified directly in the [tour_exp_acc] field.
A [tour_exp_acc_valid] field is created. The data deemed correct are carried over unchanged to this field. In case of inconsistencies, the corrected
amount is shown here. For cases that could not be corrected, the field is left blank. The data is pasted into the [tour_exp_acc_correction] field, and the average by accommodation type is assigned to those questionnaires whose expenditure could not be corrected. The average is calculated on the ba-sis of the data in the [tour_exp_acc_valid] field.
Correction of transport expenditure made to reach the departure pointFor transport expenses, special treatment will be given according to the mode of transport used on the day of the trip to get to and from the route (question 6 [transp_mode_day]) and the distance travelled by this mode of transport to reach the starting point of the outing on the day of the outing (question 7 [dist_transp_day]).
But before any processing of the expenditure data, a consistency check between the distances stated in question 7 (distance to reach the route on the day of the outing [dist_transp_day]) and the home-to-survey-point distance [distance_home_svpt_real] must be carried out. If the two values are very close, it means that the respondent started the outing on the same day that they left home. In this case, no expenditure should be recorded for travel on the day of the outing. The [tour_exp_transp_day_valid] field must be set to 0. If the distances differ (and logically [dist_transp_day] should be less than [distance_home_svpt_real]), the following pro-cesses should be applied for tourists:
›› If the mode of transport stated is car or mo-torbike, then the transport expenditure is calculated on the basis of the distance stated in Q7 [dist_transp_day] multiplied by 2 (to account for a return journey) and multiplied by a cost per kilometre ratio of €0.14[12]. This is divided by the number of people in the group [total_group_size_correction] and by the average length of stay [als_correction] [13]. The amount is calcu-lated in the [tour_exp_transp_day_valid], and then transferred to [tour_exp_transp_day_cor-rection].
12. This ratio is calculated from two data sources. The items "07.2.2. fuels and lubricants" and "07.2.4. miscellaneous services related to private vehicles" derived from actual household expenditure by function (source: French national accounts - INSEE - https://www.insee.fr/), divided by the "private car kilometres" of the French national transport account (source: compte des transports, bilan de la circulation [transport account, traffic dashboard] - French Ministry of Ecological Transition - https://www.statistiques.developpement-durable.gouv.fr/). For 2018, this ratio was €0.14/km. It should be updated according to the latest available data.
13. If no data on length of stay is available, the expenditure will be divided by the average length of stay [als_correction] of the respondent category cross-referenced with the accommodation type, or the accommodation type only if there are not enough responses.
FIELD DATA ENTRY, CLEARANCE AND VALIDATION
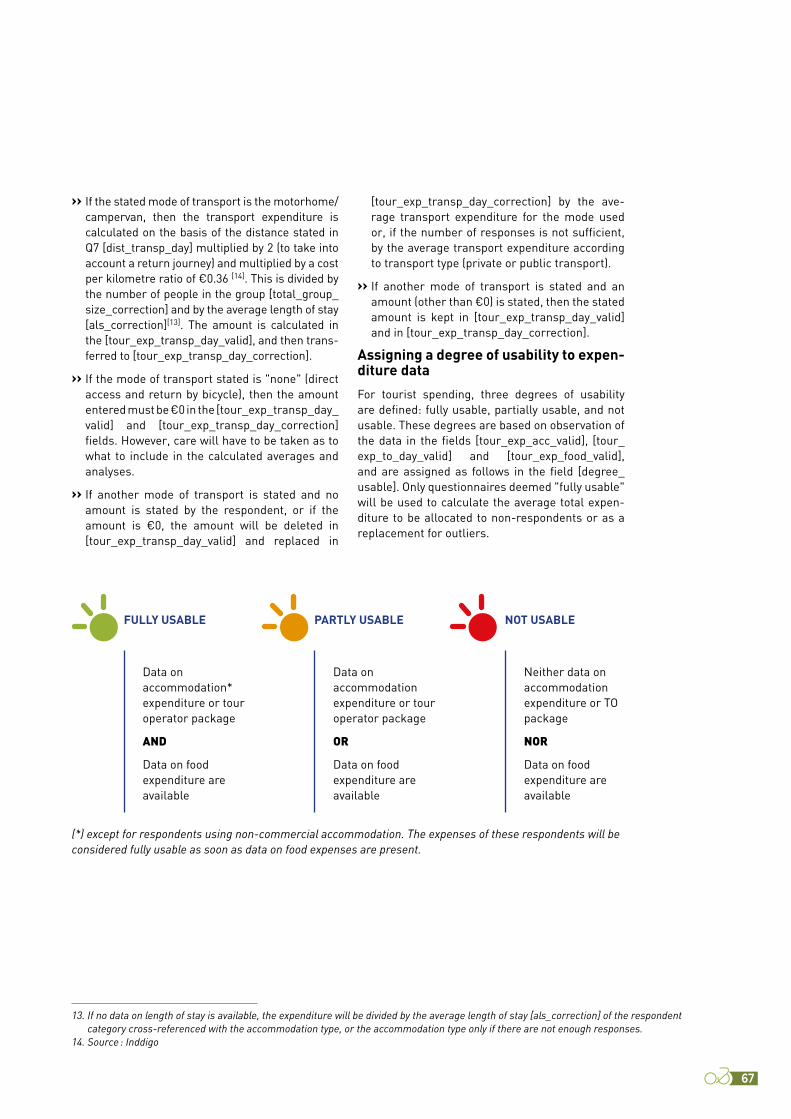
67
›› If the stated mode of transport is the motorhome/campervan, then the transport expenditure is calculated on the basis of the distance stated in Q7 [dist_transp_day] multiplied by 2 (to take into account a return journey) and multiplied by a cost per kilometre ratio of €0.36 [14]. This is divided by the number of people in the group [total_group_size_correction] and by the average length of stay [als_correction][13]. The amount is calculated in the [tour_exp_transp_day_valid], and then trans-ferred to [tour_exp_transp_day_correction].
›› If the mode of transport stated is "none" (direct access and return by bicycle), then the amount entered must be €0 in the [tour_exp_transp_day_valid] and [tour_exp_transp_day_correction] fields. However, care will have to be taken as to what to include in the calculated averages and analyses.
›› If another mode of transport is stated and no amount is stated by the respondent, or if the amount is €0, the amount will be deleted in [tour_exp_transp_day_valid] and replaced in
[tour_exp_transp_day_correction] by the ave-rage transport expenditure for the mode used or, if the number of responses is not sufficient, by the average transport expenditure according to transport type (private or public transport).
›› If another mode of transport is stated and an amount (other than €0) is stated, then the stated amount is kept in [tour_exp_transp_day_valid] and in [tour_exp_transp_day_correction].
Assigning a degree of usability to expen-diture data
For tourist spending, three degrees of usability are defined: fully usable, partially usable, and not usable. These degrees are based on observation of the data in the fields [tour_exp_acc_valid], [tour_exp_to_day_valid] and [tour_exp_food_valid], and are assigned as follows in the field [degree_usable]. Only questionnaires deemed "fully usable" will be used to calculate the average total expen-diture to be allocated to non-respondents or as a replacement for outliers.
Neither data on accommodation expenditure or TO package
NOR
Data on food expenditure are available
Data on accommodation* expenditure or tour operator package
AND
Data on food expenditure are available
Data on accommodation expenditure or tour operator package
OR
Data on food expenditure are available
NOT USABLEPARTLY USABLEFULLY USABLE
(*) except for respondents using non-commercial accommodation. The expenses of these respondents will be considered fully usable as soon as data on food expenses are present.
13. If no data on length of stay is available, the expenditure will be divided by the average length of stay [als_correction] of the respondent category cross-referenced with the accommodation type, or the accommodation type only if there are not enough responses.
14. Source : Inddigo
68
Calculation of total tourist expenditureTo facilitate the analyses and to enable the calcula-tion of economic impact, it is important that a total expenditure be allocated to each questionnaire. For this, two fields are created: [tour_exp_tot] and [tour_exp_tot_impact]. The first allows the conso-lidation of respondent data and the calculation of averages that will be assigned to non-respondents. The second allows you to assign an amount to each questionnaire for further calculations. Behavioural analyses will be based on the first field [tour_exp_tot] only.
The assignment of the data to the [tour_exp_tot] field is done as follows:
›› If the degree of usability of the expenditure is "fully usable", the total expenditure will be equal to the sum of the amounts indicated in the [tour_exp_xxx_correction] fields for all expenditure items. This yields the following:
›› [tour_exp_tot]=[tour_exp_to_day_correction]+[tour_exp_acc_correction]+[tour_exp_food_correction]+[tour_exp_transp_day_correction]+[tour_exp_activities_correction]+[tour_exp_souvenirs_correction]+[tour_exp_rental_correction]+[tour_exp_other_correction].
›› If the degree of usability of the expenditure is 'partly usable' or 'not usable', the [tour_exp_tot] field is left blank.
›› The assignment of the data to the [tour_exp_tot_impact] field is made by carrying across unchanged the data from the [tour_dep_tot], if they are available. In the absence of data, the average total expenditure [tour_exp_tot] of respondents whose expenditure is fully usable will be assigned according to the origin of the respondent (French/foreign) and the type of accommodation. (For example, a foreign res-pondent staying in a hotel whose expenses are not usable will be allocated the average total ex-penditure of foreigners staying in a hotel.)
Treatment of non-responses to the type of journeyThe answer to this field is essential for further calculations. Here too, in case of non-response, a replacement value is assigned. Generally, this is obtained by using the response data of the res-pondent's category (tourer, leisure, sports, utility). Here, as the answer is text, the average is obtained by assigning a coefficient to each item. The calcu-lation is carried out as follows:
The possible answers to this question are:
›› A round trip
›› A loop
›› A one-way trip with return by another mode of transport.
In the following calculations, note should be taken of the difference in kilometres cycled on the route according to the type of journey. For either a round trip or a one-way trip, all the kilometres are cycled on the route, whereas in the case of a loop, it is estimated that only 40% of them are cycled on the route.
Responses to the round-trip and one-way items will therefore have a coefficient equal to 1. Responses to the loop item will have a coefficient of 0.4.
The calculation of averages per category of cy-clists proceeds as follows: a table is created with an inventory of the responses obtained (based on the [coef_adj] field - see page 80) for each item of question 5 [journey_type] and for each corrected category of cyclists [category_correction].
FIELD DATA ENTRY, CLEARANCE AND VALIDATION
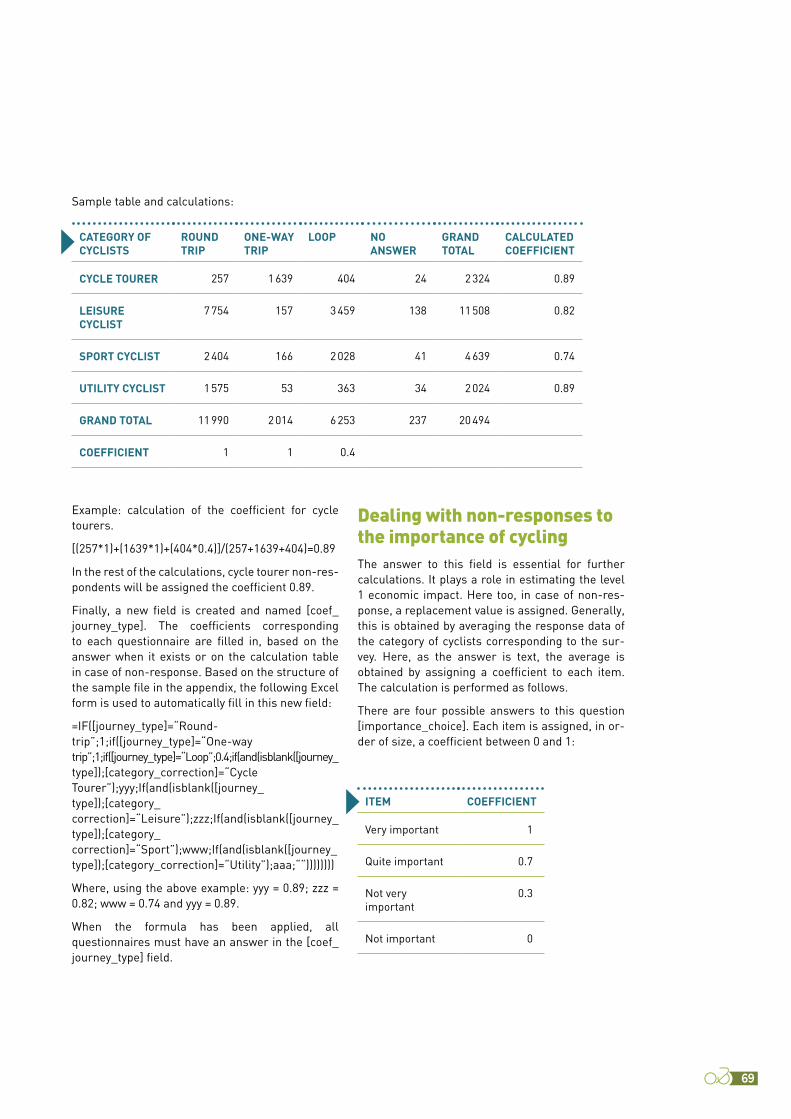
69
Sample table and calculations:
CATEGORY OF CYCLISTS
ROUND TRIP
ONE-WAY TRIP
LOOP NO ANSWER
GRAND TOTAL
CALCULATED COEFFICIENT
CYCLE TOURER 257 1 639 404 24 2 324 0.89
LEISURE CYCLIST
7 754 157 3 459 138 11 508 0.82
SPORT CYCLIST 2 404 166 2 028 41 4 639 0.74
UTILITY CYCLIST 1 575 53 363 34 2 024 0.89
GRAND TOTAL 11 990 2 014 6 253 237 20 494
COEFFICIENT 1 1 0.4
Example: calculation of the coefficient for cycle tourers.
[(257*1)+(1639*1)+(404*0.4)]/(257+1639+404)=0.89
In the rest of the calculations, cycle tourer non-res-pondents will be assigned the coefficient 0.89.
Finally, a new field is created and named [coef_journey_type]. The coefficients corresponding to each questionnaire are filled in, based on the answer when it exists or on the calculation table in case of non-response. Based on the structure of the sample file in the appendix, the following Excel form is used to automatically fill in this new field:
=IF([journey_type]=“Round-trip”;1;if([journey_type]=“One-way trip”;1;if([journey_type]=“Loop”;0.4;if(and(isblank([journey_type]);[category_correction]=“Cycle Tourer”);yyy;If(and(isblank([journey_type]);[category_correction]=“Leisure”);zzz;If(and(isblank([journey_type]);[category_correction]=“Sport”);www;If(and(isblank([journey_type]);[category_correction]=“Utility”);aaa;““))))))))
Where, using the above example: yyy = 0.89; zzz = 0.82; www = 0.74 and yyy = 0.89.
When the formula has been applied, all questionnaires must have an answer in the [coef_journey_type] field.
Dealing with non-responses to the importance of cyclingThe answer to this field is essential for further calculations. It plays a role in estimating the level 1 economic impact. Here too, in case of non-res-ponse, a replacement value is assigned. Generally, this is obtained by averaging the response data of the category of cyclists corresponding to the sur-vey. Here, as the answer is text, the average is obtained by assigning a coefficient to each item. The calculation is performed as follows.
There are four possible answers to this question [importance_choice]. Each item is assigned, in or-der of size, a coefficient between 0 and 1:
ITEM COEFFICIENT
Very important 1
Quite important 0.7
Not very important
0.3
Not important 0

70
CATEGORY OF CYCLISTS
VERY IMPORTANT
QUITE IMPORTANT
NOT VERY IMPORTANT
NOT IMPORTANT
NO ANSWER
GRAND TOTAL
CALCULATED COEFFICIENT
CYCLE TOURER 1 799 107 44 71 303 2 324 0.93
LEISURE CYCLIST
1 782 2 212 1 227 494 5 794 11 508 0.65
SPORT CYCLIST 701 433 177 45 3 283 4 639 0.78
UTILITY CYCLIST 125 234 108 71 1 486 2 024 0.60
GRAND TOTAL 4 407 2 985 1 556 681 10 865 20 494
COEFFICIENT 1 0.7 0.3 0
Example of calculation of the average for assignment to non-responses.
A table that cross-references the responses obtained (based on the [coef_adj] field - see page 80) for each item in question 23 [importance_choice] and for each category of cyclists [category_correction] is produced.
Sample table and calculations:
Example: calculation of the coefficient for cycle tourers.
[(1799*1)+(107*0.7)+(44*0.3)+(71*0)]/(1799+107+44+71)=0.93
In the rest of the calculations, cycle tourer non-respondents will be assigned the coef-ficient 0.93.
Finally, a new field is created and named [coef_imp_cycling]. For tourists, the coef-ficients corresponding to each questionnaire are filled in, based on the answer when available, or on the calculation table in case of non-response. For day-trippers, the coefficient 1 is automatically assigned.
Based on the structure of the sample file in the appendix, the following Excel form is used to automatically fill in this new column:
=IF([category_correction]=“Day-tripper” ;1 ;IF([importance_choice]=“Very important”;1;IF([importance_choice]=“Quite important”;0.7;IF([importance_choice]=“Not very important”;0.3; IF([importance_choice]=“Not important”;0;IF(and(isblank([importance_choice]);[category_correction]=“Cycle tourer”);yyy;IF(and(isblank([importance_choice]);[category_correction]=“Leisure”);zzz;IF(and(isblank([importance_choice]);[category_correction]=“Sport”);www;IF(and(isblank([importance_choice]);[category_correction]=“Utility”);aaa;““))))))))
Where, using the above example: yyy = 0.93; zzz = 0.65; www = 0.78 and yyy = 0.60.
At the end of the application of the formula, all questionnaires must have an answer in the [coef_imp_cycling] field.
FIELD DATA ENTRY, CLEARANCE AND VALIDATION
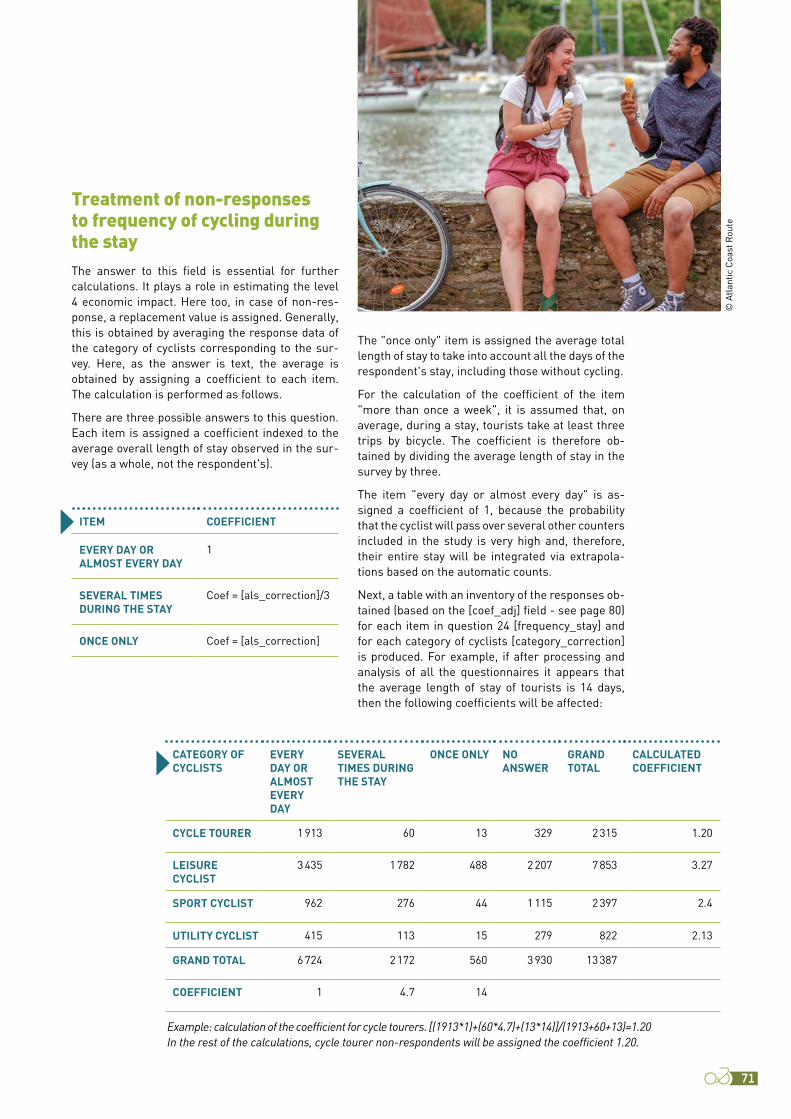
71
Treatment of non-responses to frequency of cycling during the stayThe answer to this field is essential for further calculations. It plays a role in estimating the level 4 economic impact. Here too, in case of non-res-ponse, a replacement value is assigned. Generally, this is obtained by averaging the response data of the category of cyclists corresponding to the sur-vey. Here, as the answer is text, the average is obtained by assigning a coefficient to each item. The calculation is performed as follows.
There are three possible answers to this question. Each item is assigned a coefficient indexed to the average overall length of stay observed in the sur-vey (as a whole, not the respondent's).
ITEM COEFFICIENT
EVERY DAY OR ALMOST EVERY DAY
1
SEVERAL TIMES DURING THE STAY
Coef = [als_correction]/3
ONCE ONLY Coef = [als_correction]
The "once only" item is assigned the average total length of stay to take into account all the days of the respondent's stay, including those without cycling.
For the calculation of the coefficient of the item "more than once a week", it is assumed that, on average, during a stay, tourists take at least three trips by bicycle. The coefficient is therefore ob-tained by dividing the average length of stay in the survey by three.
The item "every day or almost every day" is as-signed a coefficient of 1, because the probability that the cyclist will pass over several other counters included in the study is very high and, therefore, their entire stay will be integrated via extrapola-tions based on the automatic counts.
Next, a table with an inventory of the responses ob-tained (based on the [coef_adj] field - see page 80) for each item in question 24 [frequency_stay] and for each category of cyclists [category_correction] is produced. For example, if after processing and analysis of all the questionnaires it appears that the average length of stay of tourists is 14 days, then the following coefficients will be affected:
CATEGORY OF CYCLISTS
EVERY DAY OR ALMOST EVERY DAY
SEVERAL TIMES DURING THE STAY
ONCE ONLY NO ANSWER
GRAND TOTAL
CALCULATED COEFFICIENT
CYCLE TOURER 1 913 60 13 329 2 315 1.20
LEISURE CYCLIST
3 435 1 782 488 2 207 7 853 3.27
SPORT CYCLIST 962 276 44 1 115 2 397 2.4
UTILITY CYCLIST 415 113 15 279 822 2.13
GRAND TOTAL 6 724 2 172 560 3 930 13 387
COEFFICIENT 1 4.7 14
Example: calculation of the coefficient for cycle tourers. [(1913*1)+(60*4.7)+(13*14)]/(1913+60+13)=1.20 In the rest of the calculations, cycle tourer non-respondents will be assigned the coefficient 1.20.
© A
tlan
tic C
oast
Rou
te
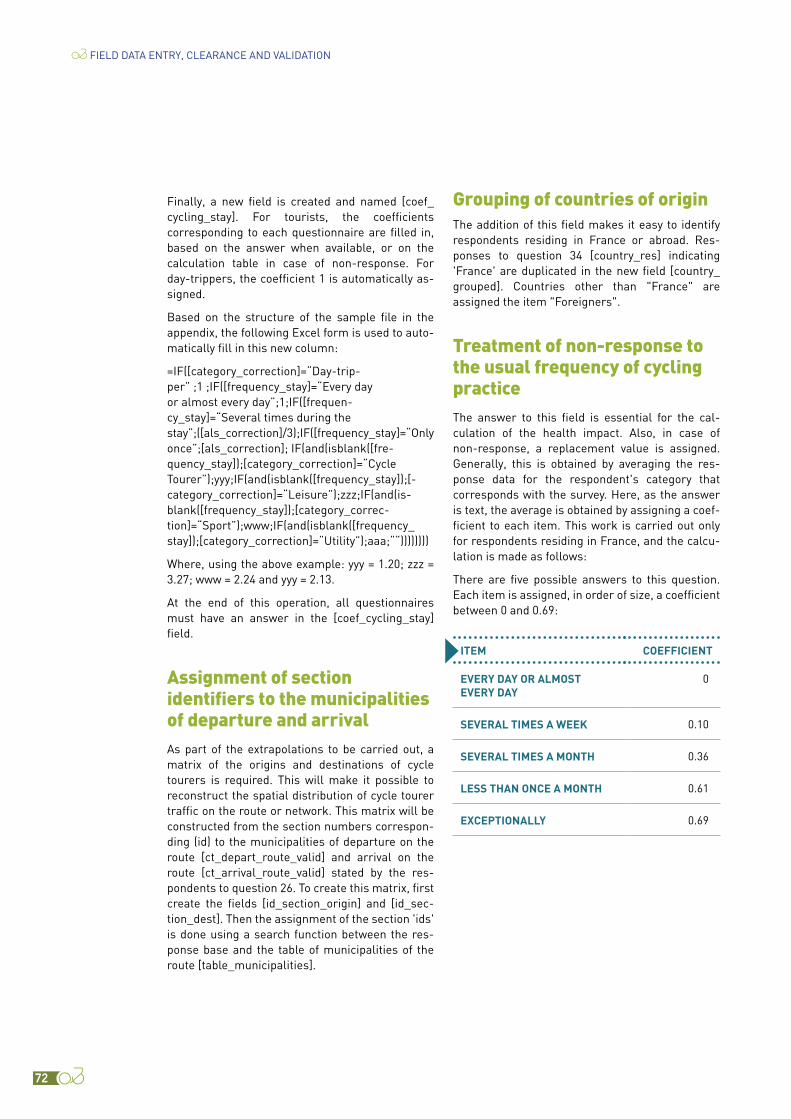
72
Finally, a new field is created and named [coef_cycling_stay]. For tourists, the coefficients corresponding to each questionnaire are filled in, based on the answer when available, or on the calculation table in case of non-response. For day-trippers, the coefficient 1 is automatically as-signed.
Based on the structure of the sample file in the appendix, the following Excel form is used to auto-matically fill in this new column:
=IF([category_correction]=“Day-trip-per” ;1 ;IF([frequency_stay]=“Every day or almost every day”;1;IF([frequen-cy_stay]=“Several times during the stay”;([als_correction]/3);IF([frequency_stay]=“Only once”;[als_correction]; IF(and(isblank([fre-quency_stay]);[category_correction]=“Cycle Tourer”);yyy;IF(and(isblank([frequency_stay]);[-category_correction]=“Leisure”);zzz;IF(and(is-blank([frequency_stay]);[category_correc-tion]=“Sport”);www;IF(and(isblank([frequency_stay]);[category_correction]=“Utility”);aaa;““))))))))
Where, using the above example: yyy = 1.20; zzz = 3.27; www = 2.24 and yyy = 2.13.
At the end of this operation, all questionnaires must have an answer in the [coef_cycling_stay] field.
Assignment of section identifiers to the municipalities of departure and arrivalAs part of the extrapolations to be carried out, a matrix of the origins and destinations of cycle tourers is required. This will make it possible to reconstruct the spatial distribution of cycle tourer traffic on the route or network. This matrix will be constructed from the section numbers correspon-ding (id) to the municipalities of departure on the route [ct_depart_route_valid] and arrival on the route [ct_arrival_route_valid] stated by the res-pondents to question 26. To create this matrix, first create the fields [id_section_origin] and [id_sec-tion_dest]. Then the assignment of the section 'ids' is done using a search function between the res-ponse base and the table of municipalities of the route [table_municipalities].
Grouping of countries of originThe addition of this field makes it easy to identify respondents residing in France or abroad. Res-ponses to question 34 [country_res] indicating 'France' are duplicated in the new field [country_grouped]. Countries other than "France" are assigned the item "Foreigners".
Treatment of non-response to the usual frequency of cycling practiceThe answer to this field is essential for the cal-culation of the health impact. Also, in case of non-response, a replacement value is assigned. Generally, this is obtained by averaging the res-ponse data for the respondent's category that corresponds with the survey. Here, as the answer is text, the average is obtained by assigning a coef-ficient to each item. This work is carried out only for respondents residing in France, and the calcu-lation is made as follows:
There are five possible answers to this question. Each item is assigned, in order of size, a coefficient between 0 and 0.69:
ITEM COEFFICIENT
EVERY DAY OR ALMOST EVERY DAY
0
SEVERAL TIMES A WEEK 0.10
SEVERAL TIMES A MONTH 0.36
LESS THAN ONCE A MONTH 0.61
EXCEPTIONALLY 0.69
FIELD DATA ENTRY, CLEARANCE AND VALIDATION

73
The rationale for these ratios is explained in the section on estimating the impact on health expen-diture savings (see page 99).
Example of weighted average calculation for as-signment to non-responses:
A table with an inventory of the responses obtained
CATEGORY OF CYCLISTS EXCEPTIONALLY
LESS THAN ONCE A MONTH
SEVERAL TIMES A MONTH
SEVERAL TIMES A WEEK
EVERY DAY OR ALMOST EVERY DAY
GRAND TOTAL
CALCULATEDCOEFFICIENT
CYCLE TOURER 121 146 571 441 375 1 654 0.26
LEISURE CYCLIST 1 073 944 2 582 3 236 1 605 9 440 0.27
SPORT CYCLIST 64 76 572 2 016 839 3 568 0.14
UTILITY CYCLIST 53 52 300 571 727 1 702 0.14
GRAND TOTAL 1 311 1 218 4 026 6 264 3 545 16 364
COEFFICIENT 0.69 0.61 0.36 0.1 0
Example: calculation of the coefficient for cycle tourers living in France.[(121*0.69)+(146*0.61)+(571*0.36)+(441*0.1)+(375*0)]/(121+146+571+441+375)=0.26In the rest of the calculations, cycle tourer non-respondents will be assigned the coefficient 0.26.
Finally, a new field is created and named [coef_cycling_usual]. For all profiles (tourists and day-trippers), the coefficients corresponding to each questionnaire are given based on the answer, when available, or on the basis of the calculation table in case of non-response. At the end of this operation, all questionnaires from respondents resident in France must have an answer in the [coef_cycling_usual] field. Inversely, it should be empty for the other respondents.
Income data processingA new field is created and named [income_correc-tion]. The data in the [income] field is copied and pasted there. To avoid distorting the analyses with erroneous or erratic values, the extreme values, corresponding to the first and last percentiles, will be deleted.
(based on the [coef_adj] field - see page 80) for each item in question 39 [cycling_usual] and for each category of cyclists [category_correction] is produced, using only the data of respondents who are resident in France.
Sample table and calculations (based on respon-dents residing in France only):

74
Checking the quality of the automatic count dataAs at the start of the study, an important step in the calculation chain is the collection, validation and correction of the automatic count data.
In order to validate the correct operation of the counters and the quality of the data, it is necessary to check:
›› Missing data periods (in case of missing records or non-transmission of GSM data)
›› Days with 0 bike passages
›› Unusual peaks or troughs
›› Unusual night-time data (from 9 pm to 6 am)
›› Regime changes (increases or decreases in ri-dership)
›› Data periods that show an unusual IN/OUT dis-tribution (for direction-distinct counters)
›› Days with an inconsistent/unusual time profile.
If discrepancies are detected that have not or can-not be explained, the data concerned should (if possible) be reconstructed or deleted.
The collection and monitoring of automatic count data should be carried out regularly during the year of the survey to minimise the risk of technical problems and data loss. In the event of technical problems, this also allows the counters to react and be repaired more quickly.
Processing of automatic count data
FIELD DATA ENTRY, CLEARANCE AND VALIDATION
15. The calibration rate should only be calculated if there is certainty regarding the quality of the manual counts carried out by the interviewers, and if there is no problem with calibration of the hourly data between the two sources caused by an incorrect setting of the internal clock of the automatic counter.
Verification of concordance between manual and automatic countsIt is necessary to verify for the survey periods that manual and automatic counts have identical or very close volumes. Data convergence is one indi-cator of:
›› The quality of the work done by the interviewers
›› The correct calibration of automatic counters.
In case of discrepancies [15], a technical calibration rate [technical_calibration_rate] will be calculated to correct the automatic count data. Since automa-tic counters have a margin of error of +/-5%, it is recommended that this calibration rate be applied when the difference between the two sources ex-ceeds +/-7%.
This verification should be done by comparing the sum of the manual counts of cyclists for all survey days (only for the hours surveyed) [manual_counts_hd_surveyed] and the sum of the automatic counts of bicycles [automatic_counts_hd_surveyed]. The analysis is carried out counter by counter in com-
For further reading A practical guide on the detection of anomalies (Comptages de vélos, comment nettoyer les données [How to clean bicycle count data]) available on the Vélo & Territoires website: (https://www.velo-territoires.org/wp-content/uploads/2020/05/2020-05-18-Fiche_anomalies_compteurs.pdf).
https://www.velo-territoires.org/wp-content/uploads/2020/05/2020-05-18-Fiche_anomalies_compteurs.pdf
https://www.velo-territoires.org/wp-content/uploads/2020/05/2020-05-18-Fiche_anomalies_compteurs.pdf
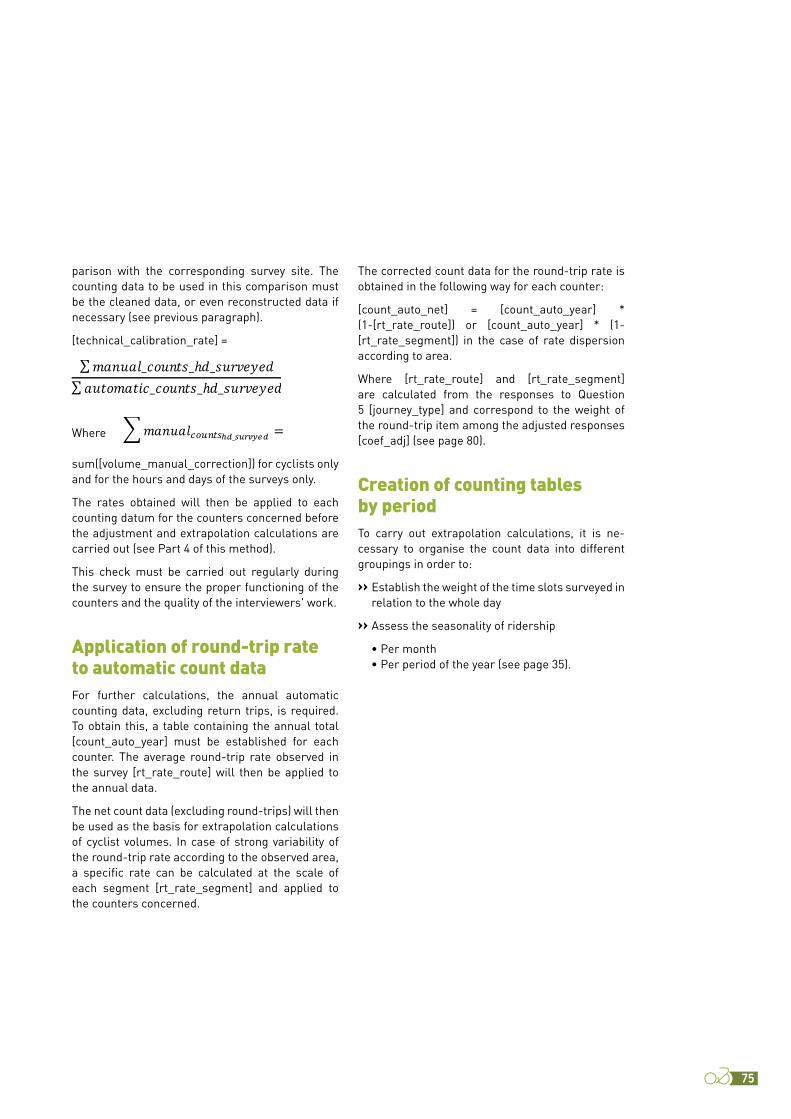
75
parison with the corresponding survey site. The counting data to be used in this comparison must be the cleaned data, or even reconstructed data if necessary (see previous paragraph).
[technical_calibration_rate] =
Where
sum([volume_manual_correction]) for cyclists only and for the hours and days of the surveys only.
The rates obtained will then be applied to each counting datum for the counters concerned before the adjustment and extrapolation calculations are carried out (see Part 4 of this method).
This check must be carried out regularly during the survey to ensure the proper functioning of the counters and the quality of the interviewers' work.
Application of round-trip rate to automatic count dataFor further calculations, the annual automatic counting data, excluding return trips, is required. To obtain this, a table containing the annual total [count_auto_year] must be established for each counter. The average round-trip rate observed in the survey [rt_rate_route] will then be applied to the annual data.
The net count data (excluding round-trips) will then be used as the basis for extrapolation calculations of cyclist volumes. In case of strong variability of the round-trip rate according to the observed area, a specific rate can be calculated at the scale of each segment [rt_rate_segment] and applied to the counters concerned.
The corrected count data for the round-trip rate is obtained in the following way for each counter:
[count_auto_net] = [count_auto_year] * (1-[rt_rate_route]) or [count_auto_year] * (1-[rt_rate_segment]) in the case of rate dispersion according to area.
Where [rt_rate_route] and [rt_rate_segment] are calculated from the responses to Question 5 [journey_type] and correspond to the weight of the round-trip item among the adjusted responses [coef_adj] (see page 80).
Creation of counting tables by periodTo carry out extrapolation calculations, it is ne-cessary to organise the count data into different groupings in order to:
›› Establish the weight of the time slots surveyed in relation to the whole day
›› Assess the seasonality of ridership
• Per month • Per period of the year (see page 35).

76
77
Adjustments 78
Extrapolations 81
Estimated economic impact 98
Estimating.ridership..and.economic.impact
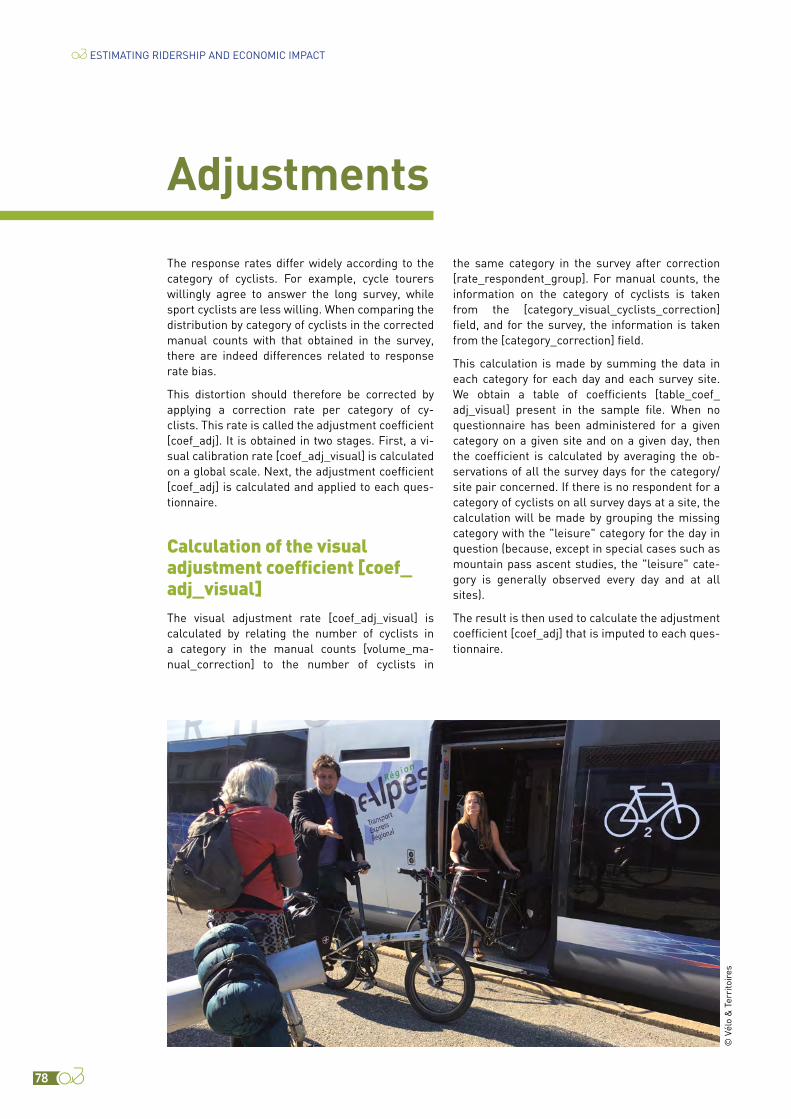
78
ESTIMATING RIDERSHIP AND ECONOMIC IMPACT
The response rates differ widely according to the category of cyclists. For example, cycle tourers willingly agree to answer the long survey, while sport cyclists are less willing. When comparing the distribution by category of cyclists in the corrected manual counts with that obtained in the survey, there are indeed differences related to response rate bias.
This distortion should therefore be corrected by applying a correction rate per category of cy-clists. This rate is called the adjustment coefficient [coef_adj]. It is obtained in two stages. First, a vi-sual calibration rate [coef_adj_visual] is calculated on a global scale. Next, the adjustment coefficient [coef_adj] is calculated and applied to each ques-tionnaire.
Calculation of the visual adjustment coefficient [coef_adj_visual]The visual adjustment rate [coef_adj_visual] is calculated by relating the number of cyclists in a category in the manual counts [volume_ma-nual_correction] to the number of cyclists in
Adjustments
the same category in the survey after correction [rate_respondent_group]. For manual counts, the information on the category of cyclists is taken from the [category_visual_cyclists_correction] field, and for the survey, the information is taken from the [category_correction] field.
This calculation is made by summing the data in each category for each day and each survey site. We obtain a table of coefficients [table_coef_adj_visual] present in the sample file. When no questionnaire has been administered for a given category on a given site and on a given day, then the coefficient is calculated by averaging the ob-servations of all the survey days for the category/site pair concerned. If there is no respondent for a category of cyclists on all survey days at a site, the calculation will be made by grouping the missing category with the "leisure" category for the day in question (because, except in special cases such as mountain pass ascent studies, the "leisure" cate-gory is generally observed every day and at all sites).
The result is then used to calculate the adjustment coefficient [coef_adj] that is imputed to each ques-tionnaire.
© V
élo
& T
erri
toir
es
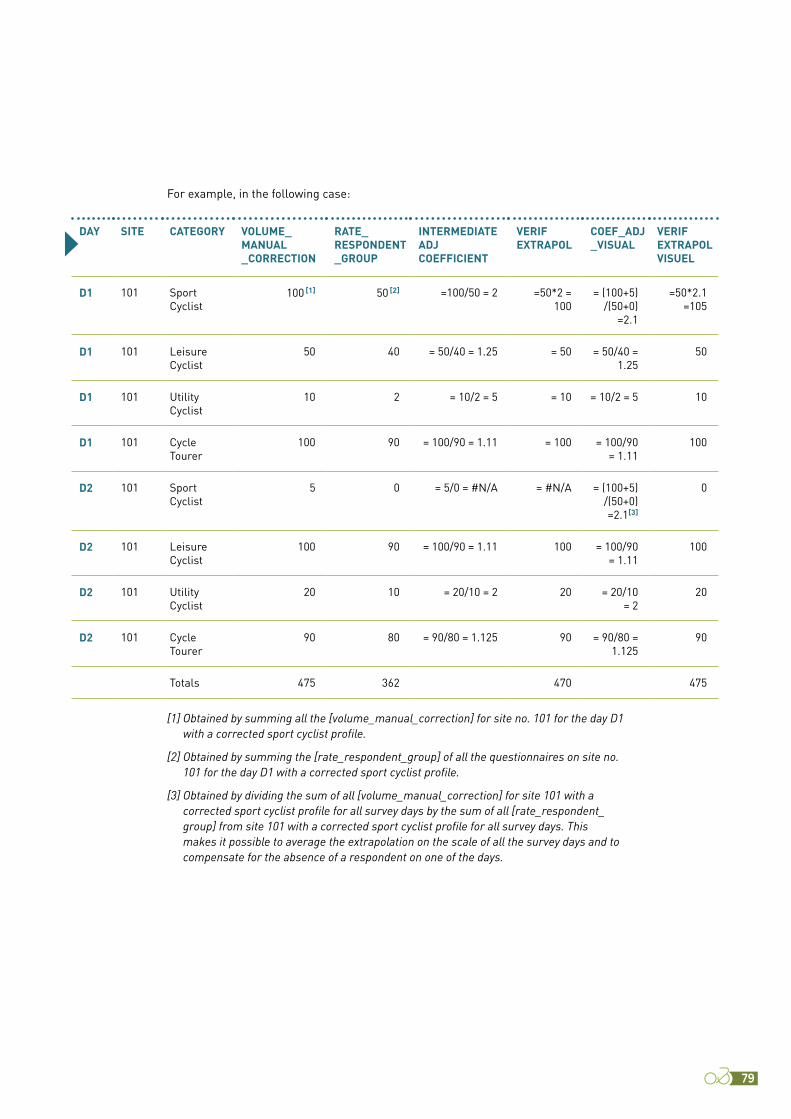
79
DAY SITE CATEGORY VOLUME_MANUAL_CORRECTION
RATE_RESPONDENT_GROUP
INTERMEDIATE ADJ COEFFICIENT
VERIF EXTRAPOL
COEF_ADJ_VISUAL
VERIF EXTRAPOLVISUEL
D1 101 Sport Cyclist
100 [1] 50 [2] =100/50 = 2 =50*2 = 100
= (100+5) /(50+0)
=2.1
=50*2.1 =105
D1 101 Leisure Cyclist
50 40 = 50/40 = 1.25 = 50 = 50/40 = 1.25
50
D1 101 Utility Cyclist
10 2 = 10/2 = 5 = 10 = 10/2 = 5 10
D1 101 Cycle Tourer
100 90 = 100/90 = 1.11 = 100 = 100/90 = 1.11
100
D2 101 Sport Cyclist
5 0 = 5/0 = #N/A = #N/A = (100+5) /(50+0) =2.1[3]
0
D2 101 Leisure Cyclist
100 90 = 100/90 = 1.11 100 = 100/90 = 1.11
100
D2 101 Utility Cyclist
20 10 = 20/10 = 2 20 = 20/10 = 2
20
D2 101 Cycle Tourer
90 80 = 90/80 = 1.125 90 = 90/80 = 1.125
90
Totals 475 362 470 475
For example, in the following case:
[1] Obtained by summing all the [volume_manual_correction] for site no. 101 for the day D1 with a corrected sport cyclist profile.
[2] Obtained by summing the [rate_respondent_group] of all the questionnaires on site no. 101 for the day D1 with a corrected sport cyclist profile.
[3] Obtained by dividing the sum of all [volume_manual_correction] for site 101 with a corrected sport cyclist profile for all survey days by the sum of all [rate_respondent_group] from site 101 with a corrected sport cyclist profile for all survey days. This makes it possible to average the extrapolation on the scale of all the survey days and to compensate for the absence of a respondent on one of the days.

80
ESTIMATING RIDERSHIP AND ECONOMIC IMPACT
Calculation of the adjustment coefficient [coef_adj]The adjustment coefficient is calculated in the [coef_adj] field, by multiplying the calibration ra-tio of the category and survey day/site of each questionnaire [coef_adj_visual] by the number of persons represented by the questionnaire [rate_respondent_group]. This calculation is carried out at the level of each questionnaire, unlike the pre-vious step, which is carried out by averaging across groups of questionnaires with similar characteris-tics (dates, sites, categories).
[coef_adj] = SEARCH([code_concat];[table_coef_adj_visual];[coef_adj_visual])*[rate_group_res-pondent]
Where [code_concat] is a code derived by concate-nating cyclist category, date (decimal format) and survey site number.
And [table_coef_adj_visual] is the table of [coef_adj_visual] coefficients calculated per category/site/survey day pair.
And [rate_respondent_group] corresponds to the number of people represented by the questionnaire (taking into account cases of multiple responses within the same group).
The sum of [coef_adj] for the whole database should therefore be equal to the sum of the manually counted persons and the sum of the au-tomatic counts for the observed period. There may be slight deviations, but these should be minor (see page 74).
The application of this coefficient to each question-naire makes it possible to switch from the 'surveyed' base to the base of the population observed during survey hours. This includes a category adjustment to account for response rate bias. This operation is in fact both an adjustment (correction of the bias linked to the differentiated response rate according to the category of cyclists) and a first extrapolation of the response base.
Calculation of kilometres cycled adjusted and extrapolated to the observed baseThe following extrapolations are based on a 'per kilometres cycled' approach. It is therefore neces-sary to calculate the kilometres cycled for each questionnaire, taking into account the previous adjustment and extrapolation step. Two indicators are calculated: kilometres cycled [km_group] and kilometres cycled exclusively on the route [km_group_route].
›› Calculation of kilometres cycled (including off-route kilometres)
[km_group] = [coef_adj] * [km_trip_correction] (this calculation is made for each questionnaire).
Where [coef_adj] is the coefficient for adjusting for survey bias and extrapolation to the observed base (see previous paragraph).
In addition, [km__trip_correction] is the answer to question 4 corrected where appropriate (see page 55).
›› Calculation of kilometres cycled on the route (excluding kilometres cycled outside the route in loops)
As explained in paragraph ‘Treatment of non-res-ponses to the type of journey’ page 68, in the case of "loop" trips, it is estimated that only 40% of the kilometres cycled are on the route or network stu-died. This is why the calculation of the kilometres is weighted here according to the type of journey.
[km_group_route] = [coef_adj]*IF([journey_type]=“Loop”;0.4;1)*[km_trip_correction]
Where [coef_adj] is the coefficient for adjusting for survey bias and extrapolation to the observed base (see previous paragraph).
And [journey_type] is the answer to question 5.
In addition, [km_trip_correction] is the answer to question 4 corrected where appropriate (see page 55).
81
As the survey is conducted at specific points on the route or cycle network and on particular dates, it is necessary to make two types of extrapolation to obtain results for the route and year as a whole:
›› Temporal extrapolation
›› Spatial extrapolation.
Temporal extrapolationTemporal extrapolation takes place in two phases: firstly, the data collected during the survey period (about 8 or 9 hours) must be extrapolated to the whole day; then, as the survey covers only a few days of the year, it is necessary to extrapolate the 24-hour data from the survey days to the whole year to obtain annual results.
The seasonality of ridership is very different de-pending on the category of cyclists:
›› Utility cycling is generally marked by a slight de-crease in winter and summer (mainly in August). It is concentrated between Monday to Friday and tends to drop at the weekend.
›› Day-tripping by leisure cyclists is generally very popular at weekends, especially on sunny days (from March to November in France).
›› Holiday cycling is generally marked by a peak during the summer period and the May/June long weekends (in France).
›› Cycle touring tends to spread from April to November (in France) with a higher number of cyclists during the summer period.
This is why the temporal extrapolation will have to be done separately for each of them, based on the analysis of counters that are strongly associated with a particular cycling practice and/or based on data from accommodation provider surveys. Thus:
›› The seasonality of utility cycling can be recons-tituted using very urban counters (take care, however, not to neglect tourist utility cycling in coastal resorts).
›› The seasonality of leisure day-tripper cycling can be reconstituted using counters on the edge of large metropolitan areas.
›› Cycle touring can be reconstituted on the main
continuous routes due to counters with a low level of ridership in remote areas where cycle tourer ridership will be maximal or, failing that, it will be reconstituted according to the diffe-rence with ridership for other categories and/or based on the data collected by the accommoda-tion providers.
›› Holiday cycling can be reconstructed from coun-ters located in very touristic areas and/or from data collected by the accommodation providers.
In practice, temporal extrapolations are conducted only for cycle tourers and holiday cyclists. To date, utility cyclists represent a small proportion of the cyclists observed on the routes evaluated and are thus grouped with day-trippers or tourists accor-ding to their profile. The estimate of the number of day-tripper cyclists is, in turn, based on a gravity model for the non-surveyed sections and by de-duction of cycle tourer and holiday cyclist volumes using the surveyed sections (see ‘Estimation of po-tential day-tripper ridership’ page 92).
Temporal extrapolation of cycle tourersSeveral variables come into play:
›› The coefficient of representativeness of survey hours over the 24 hours of a day (i.e. the weight of surveyed hours in relation to a whole day)
›› The monthly breakdown of the surveys
›› The origin-destination matrix of cycle tourers
›› Monthly breakdown of the number of bike pas-sages on a very typical cycle tourer counter
Or, as the case may be,
›› The monthly breakdown of cycle tourers in the data collection carried out by the accommoda-tion providers.
Extrapolations
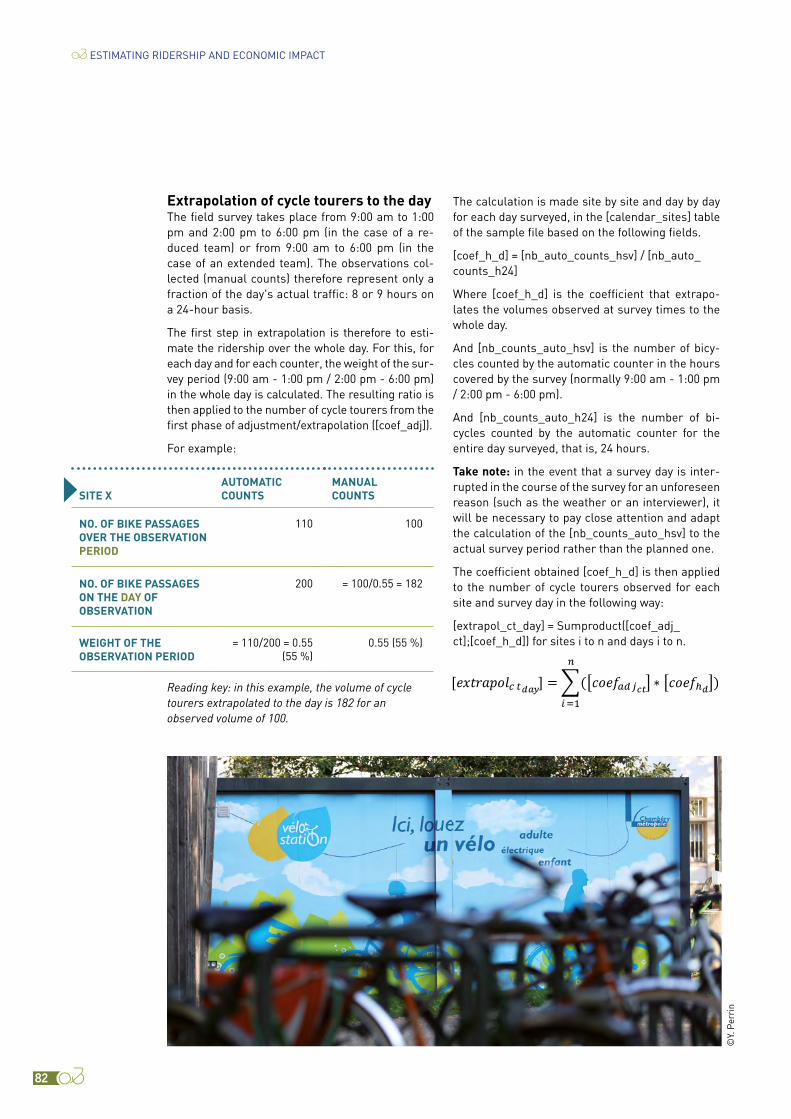
82
ESTIMATING RIDERSHIP AND ECONOMIC IMPACT
Extrapolation of cycle tourers to the dayThe field survey takes place from 9:00 am to 1:00 pm and 2:00 pm to 6:00 pm (in the case of a re-duced team) or from 9:00 am to 6:00 pm (in the case of an extended team). The observations col-lected (manual counts) therefore represent only a fraction of the day's actual traffic: 8 or 9 hours on a 24-hour basis.
The first step in extrapolation is therefore to esti-mate the ridership over the whole day. For this, for each day and for each counter, the weight of the sur-vey period (9:00 am - 1:00 pm / 2:00 pm - 6:00 pm) in the whole day is calculated. The resulting ratio is then applied to the number of cycle tourers from the first phase of adjustment/extrapolation ([coef_adj]).
For example:
Reading key: in this example, the volume of cycle tourers extrapolated to the day is 182 for an observed volume of 100.
SITE XAUTOMATIC COUNTS
MANUAL COUNTS
NO. OF BIKE PASSAGES OVER THE OBSERVATION PERIOD
110 100
NO. OF BIKE PASSAGES ON THE DAY OF OBSERVATION
200 = 100/0.55 = 182
WEIGHT OF THE OBSERVATION PERIOD
= 110/200 = 0.55 (55 %)
0.55 (55 %)
The calculation is made site by site and day by day for each day surveyed, in the [calendar_sites] table of the sample file based on the following fields.
[coef_h_d] = [nb_auto_counts_hsv] / [nb_auto_counts_h24]
Where [coef_h_d] is the coefficient that extrapo-lates the volumes observed at survey times to the whole day.
And [nb_counts_auto_hsv] is the number of bicy-cles counted by the automatic counter in the hours covered by the survey (normally 9:00 am - 1:00 pm / 2:00 pm - 6:00 pm).
And [nb_counts_auto_h24] is the number of bi-cycles counted by the automatic counter for the entire day surveyed, that is, 24 hours.
Take note: in the event that a survey day is inter-rupted in the course of the survey for an unforeseen reason (such as the weather or an interviewer), it will be necessary to pay close attention and adapt the calculation of the [nb_counts_auto_hsv] to the actual survey period rather than the planned one.
The coefficient obtained [coef_h_d] is then applied to the number of cycle tourers observed for each site and survey day in the following way:
[extrapol_ct_day] = Sumproduct([coef_adj_ct];[coef_h_d]) for sites i to n and days i to n.
©Y.
Per
rin
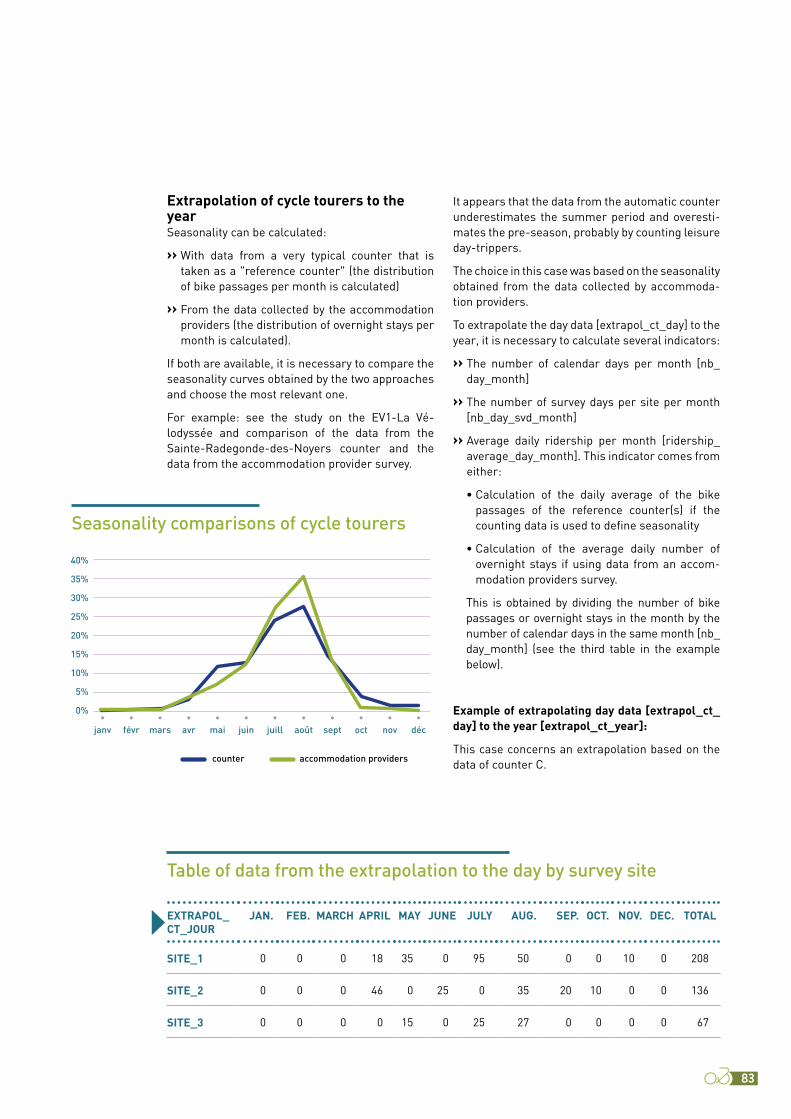
83
Extrapolation of cycle tourers to the yearSeasonality can be calculated:
›› With data from a very typical counter that is taken as a "reference counter" (the distribution of bike passages per month is calculated)
›› From the data collected by the accommodation providers (the distribution of overnight stays per month is calculated).
If both are available, it is necessary to compare the seasonality curves obtained by the two approaches and choose the most relevant one.
For example: see the study on the EV1-La Vé-lodyssée and comparison of the data from the Sainte-Radegonde-des-Noyers counter and the data from the accommodation provider survey.
It appears that the data from the automatic counter underestimates the summer period and overesti-mates the pre-season, probably by counting leisure day-trippers.
The choice in this case was based on the seasonality obtained from the data collected by accommoda-tion providers.
To extrapolate the day data [extrapol_ct_day] to the year, it is necessary to calculate several indicators:
›› The number of calendar days per month [nb_day_month]
›› The number of survey days per site per month [nb_day_svd_month]
›› Average daily ridership per month [ridership_average_day_month]. This indicator comes from either:
• Calculation of the daily average of the bike passages of the reference counter(s) if the counting data is used to define seasonality
• Calculation of the average daily number of overnight stays if using data from an accom-modation providers survey.
This is obtained by dividing the number of bike passages or overnight stays in the month by the number of calendar days in the same month [nb_day_month] (see the third table in the example below).
Example of extrapolating day data [extrapol_ct_day] to the year [extrapol_ct_year]:
This case concerns an extrapolation based on the data of counter C.
40%
35%
30%
25%
20%
15%
10%
5%
0%
janv févr mars
counter accommodation providers
avr mai juin juill août sept oct nov déc• • • • • • • • • • • •
Seasonality comparisons of cycle tourers
EXTRAPOL_CT_JOUR
JAN. FEB. MARCH APRIL MAY JUNE JULY AUG. SEP. OCT. NOV. DEC. TOTAL
SITE_1 0 0 0 18 35 0 95 50 0 0 10 0 208
SITE_2 0 0 0 46 0 25 0 35 20 10 0 0 136
SITE_3 0 0 0 0 15 0 25 27 0 0 0 0 67
Table of data from the extrapolation to the day by survey site

84
ESTIMATING RIDERSHIP AND ECONOMIC IMPACT
NB_JOUR_ENQ_MOIS
JAN. FEB. MARCH APRIL MAY JUNE JULY AUG. SEPT. OCT. NOV. DEC.
SITE_1 0 0 0 1 1 0 2 1 0 0 1 0
SITE_2 0 0 0 2 0 1 0 1 1 1 0 0
SITE_3 0 0 0 0 1 0 1 1 0 0 0 0
JAN. FEB. MARCH APRIL MAY JUNE JULY AUG SEPT. OCT. NOV. DEC. TOTAL
NB_JOUR_MOIS
31 28 31 30 31 30 31 31 30 31 30 31 365
NB_PASSAGES_MOIS
43 64 102 604 2 066 2 314 4 290 4 984 2 353 664 229 224 17937
FREQ_MOY_JOUR_MOIS
=43/31
=1.39
=64/28
=2.29
=102/31
=3.29
=604/30
=20.13
=66.65 =77.13 =138.39 =160.77 =78.43 =21.42 =7.63 =7.23 =49.14
Table of the number of days surveyed per month and per survey site
Table of the number of calendar days per month, the number of bike passages per month on the reference counter, and the average daily ridership per month
For each survey site, extrapolation to the year [extrapol_ct_year] is obtained by calculation:
[1] the annual total of the numbers of cycle tourers extrapolated to the day [extrapol_ct_day] for each site (see the 'Total' column in the first table of the above example)
[2] the annual total of the products of the number of surveyed days in a month [nb_day_svd_month] by the average monthly ridership (from the counter(s) or in the accommodation provider survey) in the same month [ridership_average_day_mon-th], for each site
[3] the annual bike counts of the counter(s) or the annual overnight stay of the accom-modation providers survey.
Then, by performing the ratio between these three operators:
[extrapol_ct_year] = (1)/((2)/(3))
[extrapol_ct_year]=Sum([extrapol_ct_day]site)/sumproduct([nb_day_svd_month]site; [ridership_average_day_month]count_ref])/Sum([nb_passages_month]count_ref
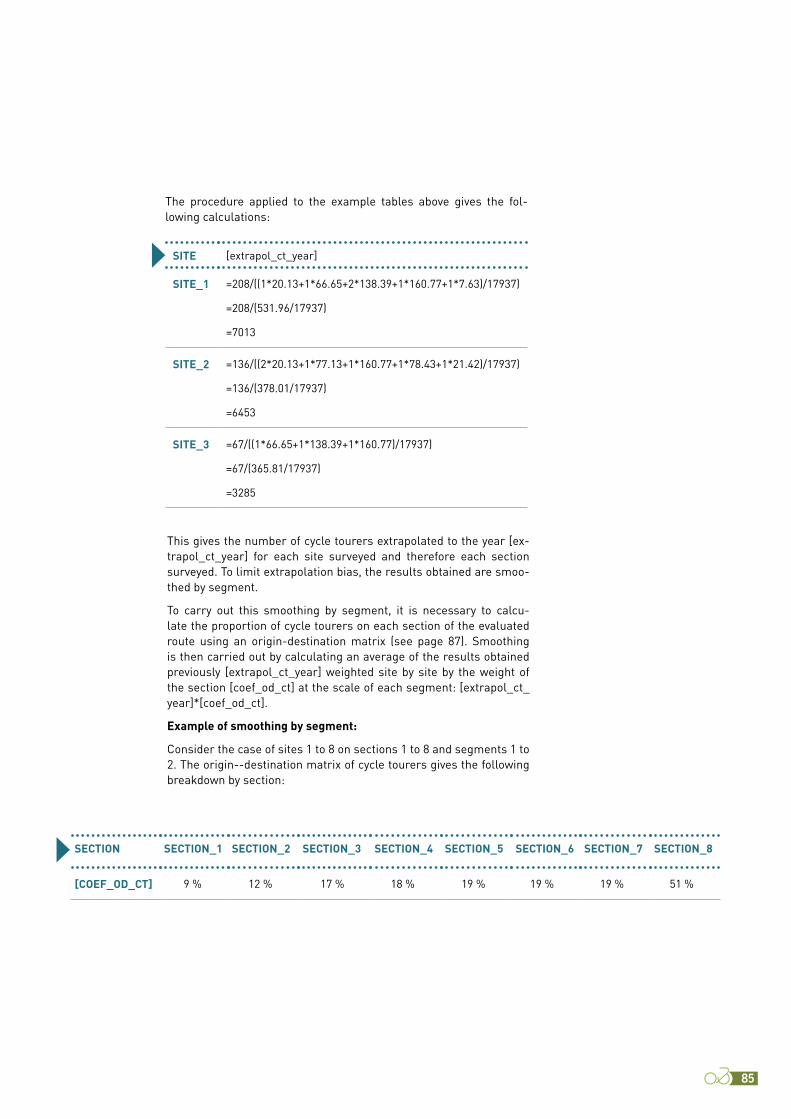
85
The procedure applied to the example tables above gives the fol-lowing calculations:
SITE [extrapol_ct_year]
SITE_1 =208/((1*20.13+1*66.65+2*138.39+1*160.77+1*7.63)/17937)
=208/(531.96/17937)
=7013
SITE_2 =136/((2*20.13+1*77.13+1*160.77+1*78.43+1*21.42)/17937)
=136/(378.01/17937)
=6453
SITE_3 =67/((1*66.65+1*138.39+1*160.77)/17937)
=67/(365.81/17937)
=3285
This gives the number of cycle tourers extrapolated to the year [ex-trapol_ct_year] for each site surveyed and therefore each section surveyed. To limit extrapolation bias, the results obtained are smoo-thed by segment.
To carry out this smoothing by segment, it is necessary to calcu-late the proportion of cycle tourers on each section of the evaluated route using an origin-destination matrix (see page 87). Smoothing is then carried out by calculating an average of the results obtained previously [extrapol_ct_year] weighted site by site by the weight of the section [coef_od_ct] at the scale of each segment: [extrapol_ct_year]*[coef_od_ct].
Example of smoothing by segment:
Consider the case of sites 1 to 8 on sections 1 to 8 and segments 1 to 2. The origin--destination matrix of cycle tourers gives the following breakdown by section:
SECTION SECTION_1 SECTION_2 SECTION_3 SECTION_4 SECTION_5 SECTION_6 SECTION_7 SECTION_8
[COEF_OD_CT] 9 % 12 % 17 % 18 % 19 % 19 % 19 % 51 %
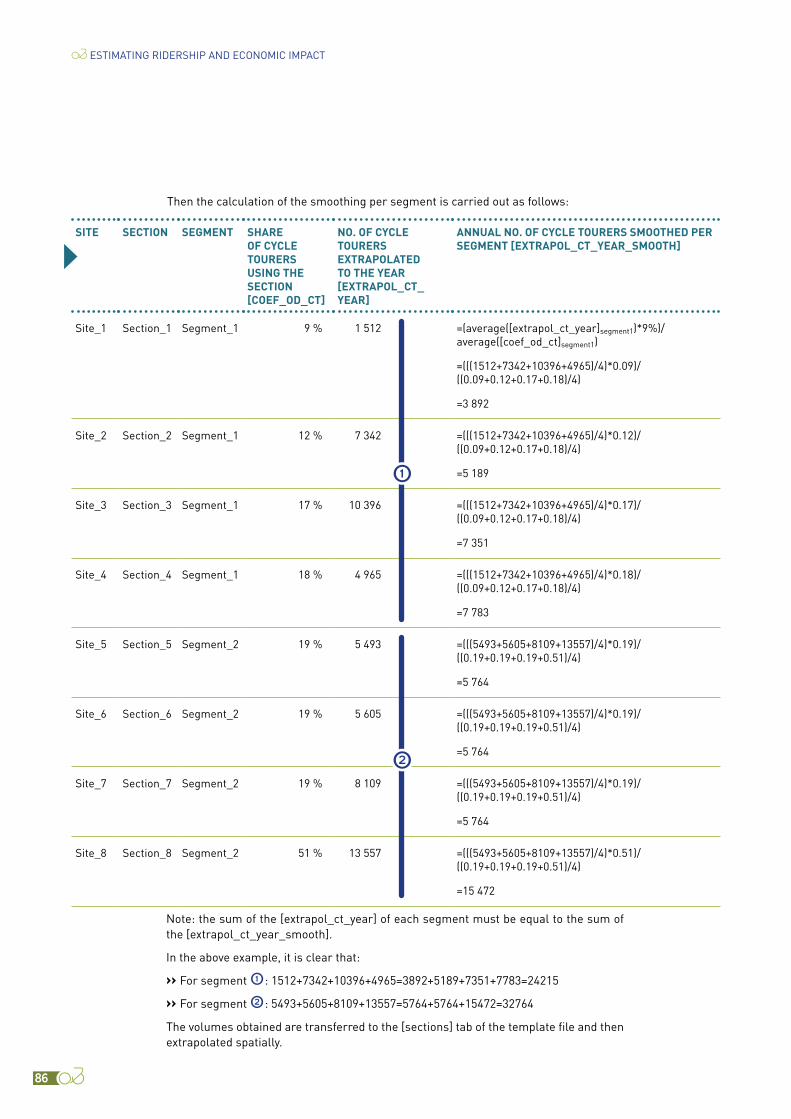
86
ESTIMATING RIDERSHIP AND ECONOMIC IMPACT
Then the calculation of the smoothing per segment is carried out as follows:
SITE SECTION SEGMENT SHARE OF CYCLE TOURERS USING THE SECTION [COEF_OD_CT]
NO. OF CYCLE TOURERS EXTRAPOLATED TO THE YEAR [EXTRAPOL_CT_YEAR]
ANNUAL NO. OF CYCLE TOURERS SMOOTHED PER SEGMENT [EXTRAPOL_CT_YEAR_SMOOTH]
Site_1 Section_1 Segment_1 9 % 1 512 =(average([extrapol_ct_year]segment1)*9%)/average([coef_od_ct]segment1)
=(((1512+7342+10396+4965)/4)*0.09)/((0.09+0.12+0.17+0.18)/4)
=3 892
Site_2 Section_2 Segment_1 12 % 7 342 =(((1512+7342+10396+4965)/4)*0.12)/((0.09+0.12+0.17+0.18)/4)
=5 189
Site_3 Section_3 Segment_1 17 % 10 396 =(((1512+7342+10396+4965)/4)*0.17)/((0.09+0.12+0.17+0.18)/4)
=7 351
Site_4 Section_4 Segment_1 18 % 4 965 =(((1512+7342+10396+4965)/4)*0.18)/((0.09+0.12+0.17+0.18)/4)
=7 783
Site_5 Section_5 Segment_2 19 % 5 493 =(((5493+5605+8109+13557)/4)*0.19)/((0.19+0.19+0.19+0.51)/4)
=5 764
Site_6 Section_6 Segment_2 19 % 5 605 =(((5493+5605+8109+13557)/4)*0.19)/((0.19+0.19+0.19+0.51)/4)
=5 764
Site_7 Section_7 Segment_2 19 % 8 109 =(((5493+5605+8109+13557)/4)*0.19)/((0.19+0.19+0.19+0.51)/4)
=5 764
Site_8 Section_8 Segment_2 51 % 13 557 =(((5493+5605+8109+13557)/4)*0.51)/((0.19+0.19+0.19+0.51)/4)
=15 472
1
2
Note: the sum of the [extrapol_ct_year] of each segment must be equal to the sum of the [extrapol_ct_year_smooth].
In the above example, it is clear that:
›› For segment 1 : 1512+7342+10396+4965=3892+5189+7351+7783=24215
›› For segment 2 : 5493+5605+8109+13557=5764+5764+15472=32764
The volumes obtained are transferred to the [sections] tab of the template file and then extrapolated spatially.

87
Origin-destination matrix for the cycle tourer populationA [mat_od_ct] table is made for cycle tourers only. The selection of the questionnaires to be included is made on the basis of the [category_correction] field. The table includes [id_quest], [catego-ry_correction], [coef_adj], [id_section_origin] and [id_section_dest] information. All of this informa-tion is retrieved using a search formula based on the questionnaire number [id_quest]. This way, the table will always remain up to date in case of changes to the database.
To the table obtained, and to the right of this in-formation, one column is added for every existing section on the route or network studied.
Note: only cycle tourers who have an "id" for both the departure section and the arrival section can be taken into account in the analysis. Question-naires missing the [id_section_origin] and/or the [id_section_dest] should therefore be deleted from the matrix.
For each questionnaire, the [coef_adj] of the said questionnaire is assigned to all the sections tra-versed (included between the [id_section_origin] and the [id_section_dest] according to the fol-lowing Excel formula:
=IF(AND([id_section_origin]<=[id_section_dest];([id_section_origin]<=[id_section];([id_section]<=[id_section_dest];[coef_adj];IF(AND([id_s e c t i o n _ o r i g i n ] > [ i d _ s e c t i o n _ d e s t ] ; ( [ i d _section]<=[id_section_origin];[id_section]>=[id_section_dest]);[coef_adj];0))
Where [id_section_origin] is the identifier of the sec-tion corresponding to the municipality of departure on the route, stated in question 26 (see page 72).
And [id_section_dest] is the identifier of the sec-tion corresponding to the municipality of arrival on the route, stated in question 26 (see page 72).
And [id_section] is the number of the evaluated section in the column heading.
And [coef_adj] is the extrapolation of the question-naire to the observed period.
Then the weight of each section is calculated by summing the [coef_adj] thus assigned and dividing this sum by the sum of the [coef_adj] of the ques-tionnaires included in the matrix.
Example of an origin-destination matrix for a route with 5 sections and 4 cycle tourer questionnaires:
ID_QUEST CATEGORY_CORRECTION
COEF_ADJ ID_SECTION_ORIGIN
ID_SECTION_DEST
SECTION NUMBERS
1 2 3 4 5
1 cycle tourer 1.0 2 4 0 1.0 1.0 1.0 0
2 cycle tourer 1.9 1 5 1.9 1.9 1.9 1.9 1.9
3 cycle tourer 2.1 5 1 2.1 2.1 2.1 2.1 2.1
4 cycle tourer 1.3 3 5 0 0 1.3 1.3 1.3
Total =1+1.9+
2.1+1.3
=6.3
=0+1.9+
2.1+0
=4
5 6.3 6.3 5.3
Weight
[coef_od_ct]
=4/6.3
=0.63
=5/6.3
=0.79
=6.3/6.3
=1
=6.3/6.3
=1
=5.3/6.3
=0.84
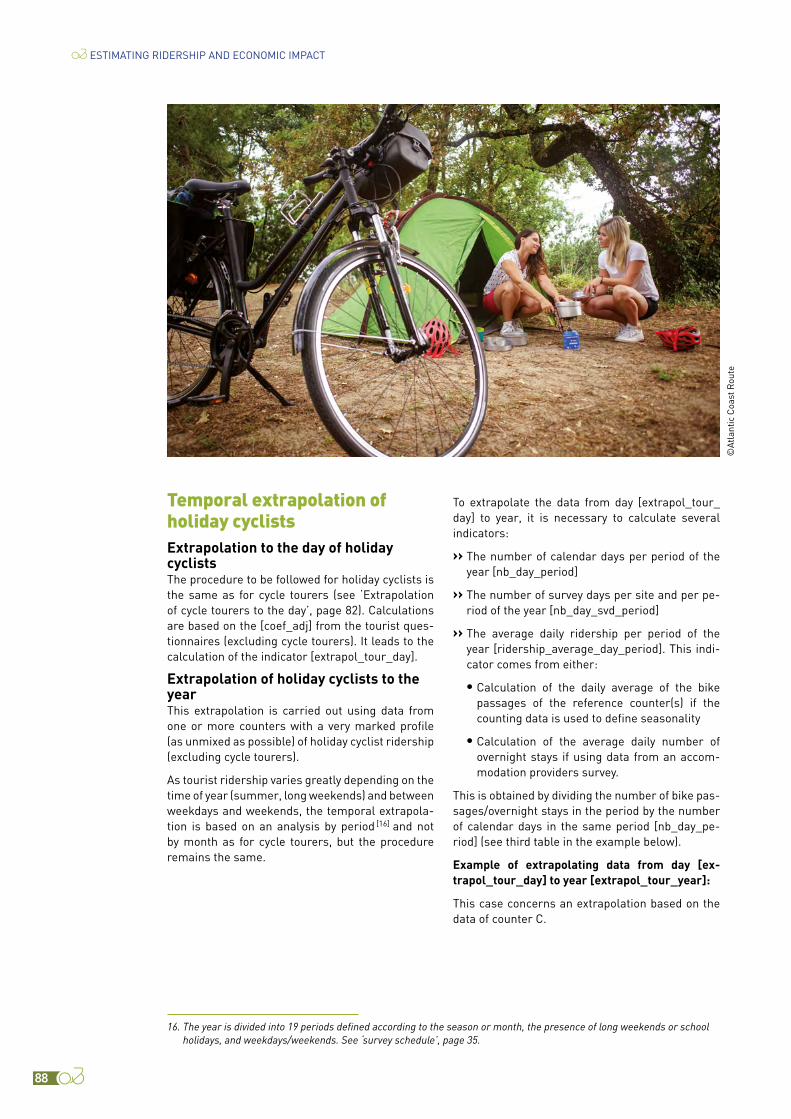
88
ESTIMATING RIDERSHIP AND ECONOMIC IMPACT
Temporal extrapolation of holiday cyclistsExtrapolation to the day of holiday cyclistsThe procedure to be followed for holiday cyclists is the same as for cycle tourers (see ‘Extrapolation of cycle tourers to the day’, page 82). Calculations are based on the [coef_adj] from the tourist ques-tionnaires (excluding cycle tourers). It leads to the calculation of the indicator [extrapol_tour_day].
Extrapolation of holiday cyclists to the yearThis extrapolation is carried out using data from one or more counters with a very marked profile (as unmixed as possible) of holiday cyclist ridership (excluding cycle tourers).
As tourist ridership varies greatly depending on the time of year (summer, long weekends) and between weekdays and weekends, the temporal extrapola-tion is based on an analysis by period [16] and not by month as for cycle tourers, but the procedure remains the same.
16. The year is divided into 19 periods defined according to the season or month, the presence of long weekends or school holidays, and weekdays/weekends. See ‘survey schedule’, page 35.
To extrapolate the data from day [extrapol_tour_day] to year, it is necessary to calculate several indicators:
›› The number of calendar days per period of the year [nb_day_period]
›› The number of survey days per site and per pe-riod of the year [nb_day_svd_period]
›› The average daily ridership per period of the year [ridership_average_day_period]. This indi-cator comes from either:
• Calculation of the daily average of the bike passages of the reference counter(s) if the counting data is used to define seasonality
• Calculation of the average daily number of overnight stays if using data from an accom-modation providers survey.
This is obtained by dividing the number of bike pas-sages/overnight stays in the period by the number of calendar days in the same period [nb_day_pe-riod] (see third table in the example below).
Example of extrapolating data from day [ex-trapol_tour_day] to year [extrapol_tour_year]:
This case concerns an extrapolation based on the data of counter C.
©At
lant
ic C
oast
Rou
te

89
Table of data from the extrapolation to the day by survey site
EXTRAPOL_TOUR_DAY
P1 P2 P3 P4 P5 … … P15 P16 P17 P18 P19 TOTAL
SITE_1 0 0 0 18 35 … … 50 0 0 10 0 208
SITE_2 0 0 0 46 0 … … 35 20 10 0 0 136
SITE_3 0 0 0 0 15 … … 27 0 0 0 0 67
NB_DAY_SVD_PERIOD
P1 P2 P3 P4 P5 … … P15 P16 P17 P18 P19
SITE_1 0 0 0 1 1 … … 1 0 0 1 0
SITE_2 0 0 0 2 0 … … 1 1 1 0 0
SITE_3 0 0 0 0 1 … … 1 0 0 0 0
Table of the number of days surveyed per period of the year and per survey site
©JD
. Bill
aud

90
ESTIMATING RIDERSHIP AND ECONOMIC IMPACT
P1 P2 P3 P4 P5 … … P15 P16 P17 P18 P19 TOTAL
NB_DAY_PERIOD
19 6 3 17 8 … … 8 23 8 111 39 365
NB_PASSAGES_PERIOD
43 64 102 604 2066 … … 4984 2353 664 229 224 17 937
RIDERSHIP_AVERAGE_DAY_PERIOD
=43/19
=2.26
=64/6
=10.67
=102/3
=34.00
=604/17
=35.53
=258.25 … … =623.00 =102.30 =83.00 =2.06 =5.74 =49.14
Table of the number of calendar days per period, the number of bike passages per period on the reference counter and the average daily ridership per period
For each survey site, the extrapolation to the year is obtained by calculating:
(1) the annual total number of holiday cyclists, extrapolated to the day [extrapol_tour_day] for each site
(2) the annual total of the products of the number of surveyed days in a period [nb_day_svd_period] by the average monthly ridership (of the counter(s), or in the accommodation providers survey) of the same period [ridership_average_day_period], for each site
(3) the annual ridership of the counter(s) or accommodation providers survey.
Then, by performing the ratio between these three operators: [extrapol_tour_year] = (1)/((2)/(3))
[extrapol_tour_year]=Sum([extrapol_tour_day]site)/sumproduct([nb_day_svd_period)site;[ridership_ave-rage_day_period]count_ref])/Sum([nb_paasages_period]count_ref
La procédure appliquée aux tableaux exemples ci-dessus donne les calculs suivants :
SITE [extrapol_tour_year]
SITE_1 =208/((1*35.53+1*258.25+…+1*623.00+1*2.06)/17937)
=208/(…/17937)
SITE_2 =136/((2*35.53+…+1*623.00+1*102.30.43+1*83.00)/17937)
=136/(…/17937)
SITE_3 =67/((1*258.25+…+1*623.00)/17937)
=67/(…/17937)

91
We thus obtain the number of holiday cyclists, ex-trapolated to the year [extrapol_tour_year] for each site surveyed and therefore each section surveyed.
The volumes obtained are transferred to the [sec-tions] tab of the template file and then extrapolated spatially.
Spatial extrapolationThe survey covers a limited number of sections. Spatial extrapolation aims to obtain results at the scale of the entire route or network studied, based on the data observed at a few points.
Spatial extrapolation is done in several steps:
›› Application of a gravity model to estimate the potential ridership volume for the route. This calculation is made separately for day-trippers (based on population volumes) and tourists (based on the number of tourist beds).
›› Comparison of the data from the gravity model and the data collected in the field for the sections surveyed. This comparison enables the model's success coefficients to be defined according to the environment. Applying these coefficients to the gravity estimates for the non-surveyed sec-tions makes it possible to determine the 'real' ridership for these sections.
Estimation of ridership by gravity modelThis method is derived from transport infrastruc-ture modelling. It consists of calculating the number of cyclists as a function of the distance to the route (drawdown curve). This method is based on the assumption that the ridership at a given point depends on the distance to that point: the closer the cyclist's place of residence, the higher the ridership throughout the year.
Calculations using a gravity model are therefore based on the calculation of potential tourist and day-tripper ridership based on data on tourist beds and population for a selection of municipalities.
The implementation of this model is done in seve-ral stages:
›› Selection of municipalities of which the centroid is less than 50 km from the centroid of the sec-tion studied. The selection is made for each section.
›› Collection of population data (volumes and pro-pensity to cycle).
›› Collection and calculation of tourist accom-modation data (volumes and emission rates of cyclists per type of accommodation).
›› Estimation of the cycling potential for each mu-nicipality according to the distance from the municipality to the route. The calculation is made separately for tourists and day-trippers.
Selection of the municipalities to be integrated into the gravity model
The selection of municipalities is done by GIS, sec-tion by section, by retaining all the municipalities of which the centroid is less than 50 km[17] away from the centroid of the section considered.
In studies conducted in France, this work is generally carried out on the basis of French muni-cipalities. In the case of border routes or networks with other countries, this basis should be extended to neighbouring countries. Nevertheless, the col-lection of population data (volume and propensity to cycle) and accommodation data on a basis com-parable to that of France is difficult and border sections are limited. For this reason, the work of analysing the gravitational potential is generally limited to the potential generated by the French territory.
The result will result in a table containing:
›› The name of the municipality
›› Its INSEE code (COG) or Eurostat code (LAU), particularly in the case of studies in border areas
›› The ID of the relevant section [id_section]
›› The distance in kilometres between the centroid of the municipality and the centroid of the sec-tion concerned [distance_km]
›› The identification of municipalities located less than 5 km from the centroid of the section [dis-tance_5km]
17. In mountainous areas, the distance used as a basis for selecting municipalities (50 km) may be revised by including an elevation change indicator.
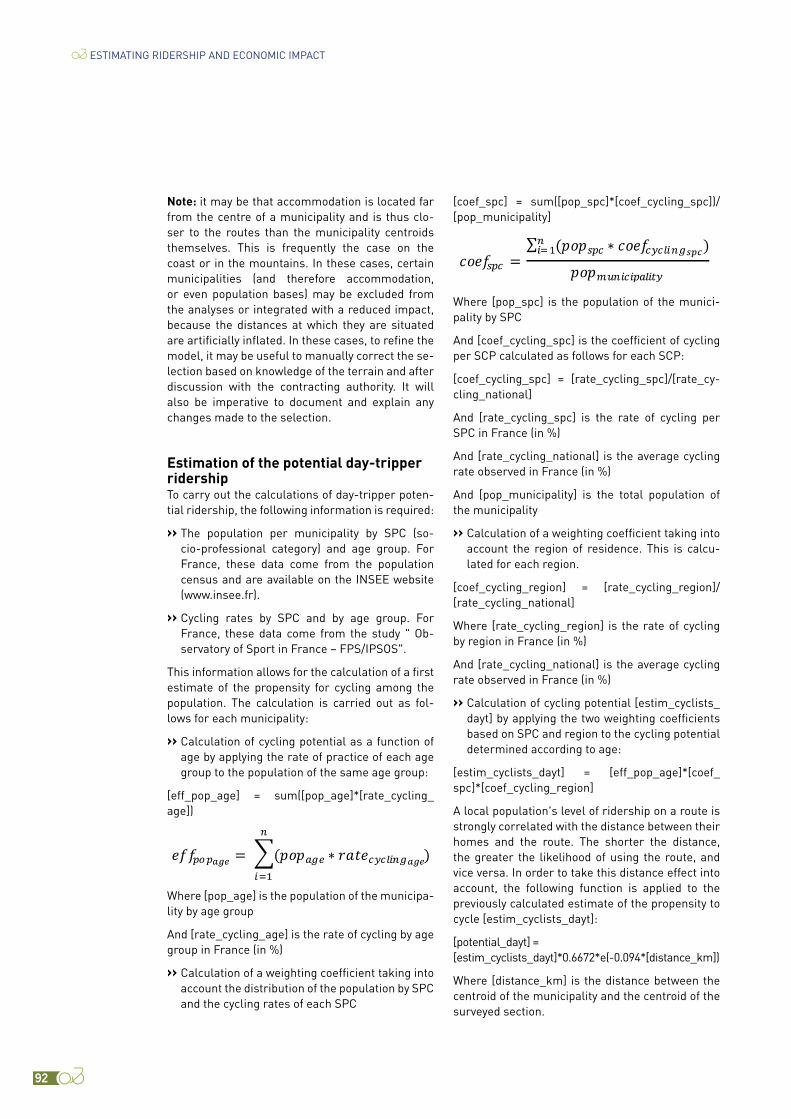
92
ESTIMATING RIDERSHIP AND ECONOMIC IMPACT
Note: it may be that accommodation is located far from the centre of a municipality and is thus clo-ser to the routes than the municipality centroids themselves. This is frequently the case on the coast or in the mountains. In these cases, certain municipalities (and therefore accommodation, or even population bases) may be excluded from the analyses or integrated with a reduced impact, because the distances at which they are situated are artificially inflated. In these cases, to refine the model, it may be useful to manually correct the se-lection based on knowledge of the terrain and after discussion with the contracting authority. It will also be imperative to document and explain any changes made to the selection.
Estimation of the potential day-tripper ridershipTo carry out the calculations of day-tripper poten-tial ridership, the following information is required:
›› The population per municipality by SPC (so-cio-professional category) and age group. For France, these data come from the population census and are available on the INSEE website (www.insee.fr).
›› Cycling rates by SPC and by age group. For France, these data come from the study " Ob-servatory of Sport in France – FPS/IPSOS".
This information allows for the calculation of a first estimate of the propensity for cycling among the population. The calculation is carried out as fol-lows for each municipality:
›› Calculation of cycling potential as a function of age by applying the rate of practice of each age group to the population of the same age group:
[eff_pop_age] = sum([pop_age]*[rate_cycling_age])
Where [pop_age] is the population of the municipa-lity by age group
And [rate_cycling_age] is the rate of cycling by age group in France (in %)
›› Calculation of a weighting coefficient taking into account the distribution of the population by SPC and the cycling rates of each SPC
[coef_spc] = sum([pop_spc]*[coef_cycling_spc])/[pop_municipality]
Where [pop_spc] is the population of the munici-pality by SPC
And [coef_cycling_spc] is the coefficient of cycling per SCP calculated as follows for each SCP:
[coef_cycling_spc] = [rate_cycling_spc]/[rate_cy-cling_national]
And [rate_cycling_spc] is the rate of cycling per SPC in France (in %)
And [rate_cycling_national] is the average cycling rate observed in France (in %)
And [pop_municipality] is the total population of the municipality
›› Calculation of a weighting coefficient taking into account the region of residence. This is calcu-lated for each region.
[coef_cycling_region] = [rate_cycling_region]/[rate_cycling_national]
Where [rate_cycling_region] is the rate of cycling by region in France (in %)
And [rate_cycling_national] is the average cycling rate observed in France (in %)
›› Calculation of cycling potential [estim_cyclists_dayt] by applying the two weighting coefficients based on SPC and region to the cycling potential determined according to age:
[estim_cyclists_dayt] = [eff_pop_age]*[coef_spc]*[coef_cycling_region]
A local population's level of ridership on a route is strongly correlated with the distance between their homes and the route. The shorter the distance, the greater the likelihood of using the route, and vice versa. In order to take this distance effect into account, the following function is applied to the previously calculated estimate of the propensity to cycle [estim_cyclists_dayt]:
[potential_dayt] = [estim_cyclists_dayt]*0.6672*e(-0.094*[distance_km])
Where [distance_km] is the distance between the centroid of the municipality and the centroid of the surveyed section.
93
This function was defined by Inddigo in the context of research work with the University of Grenoble. It concerns the analysis of cyclist emission rates as a function of distance, observed in previous studies (based on 2,500 questionnaires). It should be regu-larly updated thanks to the creation of a national database aggregating all the surveys carried out on French territory.
Estimation of the potential for tourist ridership
In order to carry out calculations of tourist poten-tial, the following information is required:
›› The offer of tourist beds per municipality by type of accommodation.
• For commercial accommodation, with applica-tion to France, these data come from the file on municipalities' commercial accommodation capacity[18], available on the INSEE website (https://www.insee.fr/fr/statistiques/2021703).
• For non-commercial accommodation, for France, the data is limited to the field of second homes[19] and comes from the population cen-sus, available on the INSEE website (https://www.insee.fr/fr/statistiques/4515532?som-maire=4516107#consulter-sommaire).
›› The correction rate or emission rate depending on the type of accommodation. Indeed, the rate of cycling is very different depending on the type of accommodation. A campsite tends to host more cyclists than a furnished rental. In order to calculate this rate, several data items are ne-cessary:
• The offer in tourist beds within 5 km per region and per type of accommodation. This informa-tion is based on the selection of municipalities [distance_5km] mentioned in page 91.
• The volume of tourists by accommodation mode in the questionnaires (based on the indicator [rate_respondent_group] which corresponds to the number of persons repre-sented by the questionnaire).
For each type of accommodation, the following should be calculated:
›› The weight of the offer in the overall offer [weight_offer] (e.g. the weight of hotel beds within 5 km of the route in the total number of tourist beds within 5 km).
›› The weight of the ridership of the type of accommodation as part of total ridership [weight_ridership]. It is calculated by divi-ding the [rate_respondent_group] for the accommodation mode by the sum of [rate_res-pondent_group] for all accommodation modes ([rate_respondent_group] being calculated only on the basis of "tourists excluding cycle tourers" profiles).
›› Then the ratio [coef_corr_acc] = [weight_ri-dership]/[weight_offer]. It is this ratio that will be applied to the bed offer of each type of ac-commodation in order to adjust it.
The estimate of the number of holiday cyclists [estim_cyclists_tour] is obtained by summing the tourist beds [nb_beds_acc] adjusted by the emis-sion rate [coef_corr_acc] for each accommodation mode.
Where [nb_beds_acc] is the number of tourist beds in the municipality by type of accommodation.
As with the resident population, the tourist po-pulation's ridership level for a route is strongly correlated with the distance between their accom-modation and the route. The shorter the distance, the greater the likelihood of using the route, and vice versa. In order to take this distance effect into account, the same function as for the population is applied to the previously calculated estimate of cycling potential [estim_cyclists_tour]:
[potential_tour] = [estim_cyclists_tour]*0.6672* e(-0.094*[distance_km])
Where [distance_km] is the distance between the centroid of the municipality and the centroid of the surveyed section.
18. The INSEE file provides the offer in accommodation units for hotels (rooms) and campsites (sites). It is therefore necessary to convert the data into the number of tourist beds. To this end, the INSEE convention is adopted, which considers a hotel room to be equivalent to 2 beds and a camping pitch to be equivalent to 3 beds.
19. As for commercial accommodation, the file is in accommodation units. INSEE considers that a secondary residence is equivalent to 5 beds.

94
ESTIMATING RIDERSHIP AND ECONOMIC IMPACT
Estimation of ridership of the route or network studiedThe estimate of the ridership of the route or network studied is based on an estimate of the ki-lometres cycled. It requires several steps:
›› Estimation of ridership for all profiles (holiday cyclists, cycle tourers and day-trippers), for each section (surveyed or not, with or without counts).
›› Estimated kilometres cycled by each profile of cyclist and for each section.
›› Calculation of the extrapolation coefficient to be applied to each questionnaire, enabling a switch from a section approach to an extrapolation to the questionnaire in the survey frame.
Extrapolation of ridership to all sections
At this stage of the procedure, we have:
›› On the surveyed sections, an estimate, for cy-cle tourers and holiday cyclists, based on the surveys [extrapol_ct_year_smooth] and [ex-tapol_tour_year],
›› For all sections, an estimate of the theoreti-cal potential ridership for holiday cyclists and day-trippers, derived from the gravity model [potential_tour] and [potential_dayt].
All this data is entered in the table [sections] of the sample file which includes:
›› The informative data for each section (iden-tifier, possible connection counter, possible survey point, identifier for the connecting seg-ment, department, region, length in kilometres, percentage of dedicated bikeway, state of com-pletion, etc.)
›› The data resulting from the calculations (estima-tion of cycle tourer and holiday cyclist volumes for the sections surveyed, estimation of the po-tential number of tourists and day-trippers for all the sections, weight of each section derived from the cycle tourer origin-destination matrix)
›› The number of annual bike passages recorded by the reference counter and corrected for the round-trip rate and technical calibration rate when needed (see page 74 et 75).
At present, this involves comparing the observed data (an estimate resulting from extrapolation from the surveys) with the theoretical potential of the sections surveyed. In the field, however, various factors can favourably or unfavourably influence the attractiveness of a section, and the-refore its level of ridership[20]. For example: the proximity of a railway station, the type and conti-guity of infrastructure, the quality of the landscape or the presence of a leisure area (for swimming) or a tourist site, etc. The comparison between the observed and theoretical values will make it pos-sible to identify the adjustment coefficients which will then be applied to the non-surveyed sections in order to correct the theoretical potential.
The following data is calculated for each cycling profile (cycle tourer, holiday cyclist and day-trip-per):
›› For counted and surveyed sections:
• The volume of day-trippers [extrapol_dayt_year] is estimated by inference from count data and survey estimates for the section: [extrapol_dayt_year] = [count_auto_net]-[ex-trapol_ct_year_smooth]-[extrapol_tour_year].
• A market penetration ratio, or success rate, is calculated for holiday cyclists and day-trip-pers. It is obtained by dividing the observed ridership by the theoretical ridership. For holiday cyclists, let: [rate_success_tour] = [extrapol_tour_year]/[potential_tour]. And for day-trippers: [rate_success_dayt] = [extrapol_dayt_year] / [potential_dayt].
›› For counted, non-surveyed sections:
• For cycle tourers, the calculation is made for each section, taking into account the vo-lumes obtained for the previous section and the respective weight of the sections in the origin-destination matrix (see page 87). For example, the calculation for section n will be as follows:
• [extrapol_ct_year_smooth]section_n = ([extrapol_ct_year_smooth]section_n-1 / [coef_od_ct]section_n-1) * [coef_od_ct]section_n
20. A further refinement to the method might include work that seeks to objectify the elements that have the greatest impact on ridership.

95
• For holiday cyclists, a penetration ratio is applied according to the type of route (dedi-cated bikeways, small roads, sections on main roads), the ratios observed on the previous and following sections and a qualitative as-sessment of the section. The penetration ratio is based on those calculated on sections with counts and surveys.
• For day-trippers, the calculation is made by difference between count data and the data obtained for holiday cyclists and cycle tourers
›› For sections that have been neither surveyed nor counted:
• For cycle tourers, the calculation is made for each section, taking into account the vo-lumes obtained for the previous section and the respective weight of the sections in the origin-destination matrix (see page 87). For example, the calculation for section n will be as follows:
• [extrapol_ct_year_smooth]section_n = ([extrapol_ct_year_smooth]section_n-1 / [coef_od_ct]section_n-1) * [coef_od_ct]section_n
• For holiday cyclists and day-trippers, a pene-tration ratio is applied according to the type of route (dedicated bikeway, small roads, sections on large roads), the ratios observed on the previous and following sections, and a qualitative assessment of the section. The pe-netration ratio is based on those calculated on sections with counts and surveys.
Estimated kilometres cycled
Once the volume estimates have been calculated for all sections and all profiles, the distances cy-cled for each type of user ([km_ct], [km_tour] and [km_dayt]) are calculated. This distance is obtained by multiplying the number of users by the length of the analysed section. This data will be used for the spatial and temporal extrapolation of the data in the survey file.
[km_ct] = [section_length]*[extrapol_ct_year_smooth][km_tour] = [section_length]*[extrapol_tour_year][km_dayt] = [section_length]*[extrapol_dayt_year]This calculation is made section by section directly in the [sections] table.
Calculation of the extrapolation coefficient appli-cable to each questionnaire [coef_extrapol]
The last step is to calculate the coefficient that will allow the extrapolation of the survey data to the route or network under study. This coefficient is obtained by comparing the kilometres cycled from the calculations of the previous stage [km_ct], [km_tour] and [km_dayt] with the kilometres cy-cled from the survey respondents' declarations.
›› Creation of a table of kilometres cycled per seg-ment and per cyclist profile for the data from the table [sections]
Example of summary table of kilometres cycled per segment and per profile (section data)
SEGMENTS [KM_CT] [KM_TOUR] [KM_DAYT] TOTAL
Segment_1 1 819 312 2 161 555 3 012 857 6 993 724
Segment_2 2 200 666 2 655 491 5 133 846 9 990 002
Segment_3 1 602 820 12 164 917 4 812 179 18 579 916
Segment_4 1 428 200 5 086 046 4 378 188 10 892 434
Segment_5 1 401 703 12 270 669 6 991 660 20 664 032
Segment_6 2 250 194 11 511 169 4 986 395 18 747 757
Segment_7 424 587 4 631 138 473 035 5 528 760
GRAND TOTAL 11 127 482 50 480 985 29 788 159 91 396 626

96
ESTIMATING RIDERSHIP AND ECONOMIC IMPACT
›› Calculation of the extrapolation coefficient of the questionnaires (and therefore of the sections surveyed) to the route [coef_extrapol] per profile and per segment.
The coefficient is calculated by relating the data from the section approach to the survey data. Thus, for example, for cycle tourers:
[coef_extrapol] = [km_ct]/[km_group_route]cycle tourers
The calculation is made for each segment and each profile and produces the table below.
Example of table for calculating extrapolation coefficients per segment and per profile
SEGMENTS CYCLE TOURERS HOLIDAY CYCLISTS DAY-TRIPPERS GRAND TOTAL
Segment_1 =[km_ct]/[km_group_route]cycle tourers
=1819312/14428 =126
=[km_tour]/[km_group_route]tourists
=171
=[km_dayt]/[km_group_route]day-trippers
=246
178
Segment_2 93 376 249 195
Segment_3 80 216 226 190
Segment_4 86 282 200 193
Segment_5 66 246 287 216
Segment_6 96 139 217 145
Segment_7 52 106 9 54
GRAND TOTAL 87 187 171 160
From this calculation table, a synthesis table is created which links each coefficient to an identifier based on the segment numbers and the profile [code_concat_segment]. This table can then be used to reintroduce the coefficients into the survey database via a search function.
Example of a summary table of kilometres cycled per segment and per profile (survey data)
›› Creation of a table of kilometres cycled per segment and per cyclist profile for the survey data (based on kilometres cycled exclusively on the route).
The table is created on the basis of the field [km_group_route] resulting from the pro-cessing of the survey frame (see page 80).
SEGMENTS [KM_GROUP_ROUTE] FOR CYCLE TOURERS
[KM_GROUP_ROUTE] FOR HOLIDAY CYCLISTS
[KM_GROUP_ROUTE] FOR DAY-TRIPPERS
GRAND TOTAL
Segment_1 14 428 12 611 12 229 39 268
Segment_2 23 654 7 071 20 637 51 361
Segment_3 20 137 56 406 21 330 97 873
Segment_4 16 674 18 019 21 850 56 543
Segment_5 21 324 49 825 24 378 95 526
Segment_6 23 357 82 556 22 976 128 890
Segment_7 8 097 43 585 50 478 102 160
GRAND TOTAL 127 671 270 073 173 877 571 621

97
Example of a summary table of extrapolation coefficients by segment and by profile based on the previous table
[CODE_CONCAT_SEGMENT] [COEF_EXTRAPOL]
s1-ct 126
s1-tour 171
s1-dayt 246
s2-ct 93
s2-tour 376
s2-dayt 249
… …
s7-ct 52
s7-tour 106
s7-dayt 9
Calculation of the number of cyclists extrapolated to each questionnaireThe number of cyclists extrapolated to each questionnaire is calculated as follows:
›› Calculation of the number of kilometres cycled on the route, extrapolated from each questionnaire [nb_km_extrapol_route]
›› [nb_km_extrapol_route] = [coef_extrapol] of the questionnaire*[km_group_route] of the ques-
tionnaire
›› Calculation of the number of cyclists extrapolated to each questionnaire solely on the basis of kilometres cycled on the route or network studied [nb_pers_extrapol_route]. It is the number of cycling trips that will be used to calculate the economic impacts.
›› [nb_pers_extrapol_route] = [nb_km_extrapol_route]/[km_trip_correction]
›› Calculation of the total number of kilometres cycled, extrapolated to each question-naire [nb_km_extrapol]
›› [nb_km_extrapol] = [coef_extrapol]of the questionnaire * [km_group]of the ques-tionnaire
›› Calculation of the number of cyclists extrapolated to each questionnaire [nb_pers_extrapol]. This is the number of cycling trips on the route.
›› [nb_pers_extrapol] = [nb_km_extrapol]/[km_trip_correction]
In the example in the table above, the [code_concat_segment] of cycle tourers in seg-ment 1 could be: "s1-ct" and that of holiday cyclists in segment 4 could be "s4-tour"
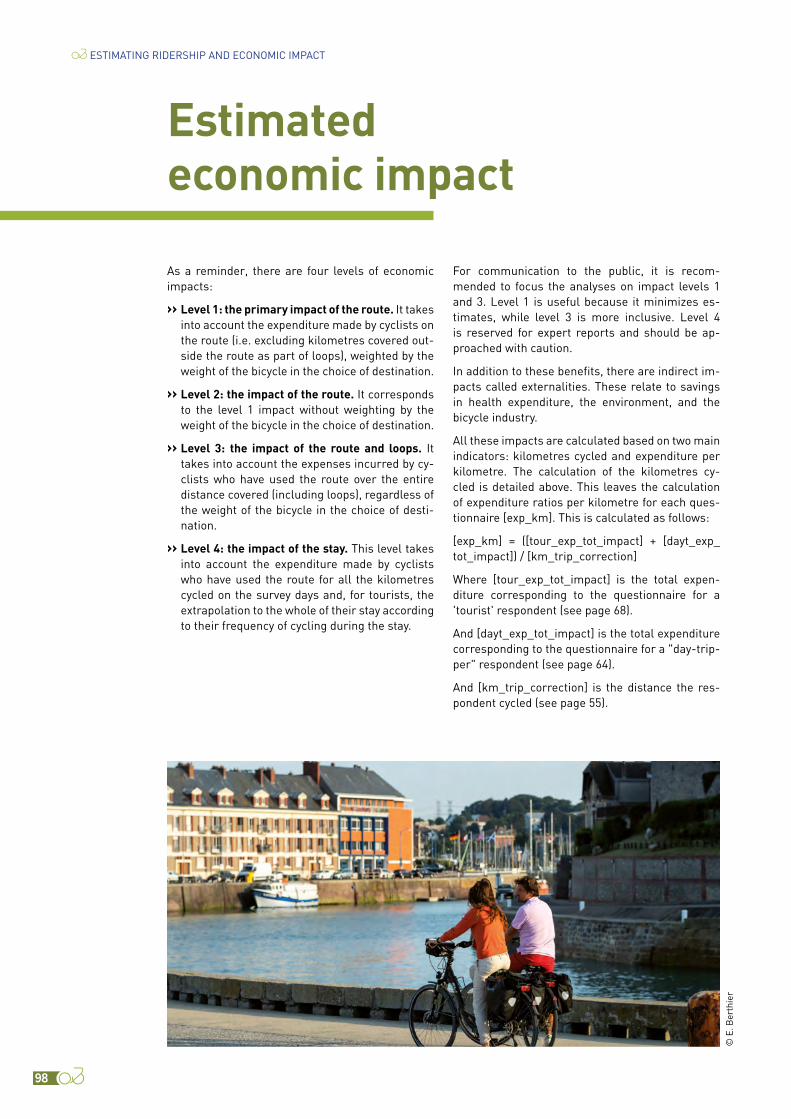
98
As a reminder, there are four levels of economic impacts:
›› Level 1: the primary impact of the route. It takes into account the expenditure made by cyclists on the route (i.e. excluding kilometres covered out-side the route as part of loops), weighted by the weight of the bicycle in the choice of destination.
›› Level 2: the impact of the route. It corresponds to the level 1 impact without weighting by the weight of the bicycle in the choice of destination.
›› Level 3: the impact of the route and loops. It takes into account the expenses incurred by cy-clists who have used the route over the entire distance covered (including loops), regardless of the weight of the bicycle in the choice of desti-nation.
›› Level 4: the impact of the stay. This level takes into account the expenditure made by cyclists who have used the route for all the kilometres cycled on the survey days and, for tourists, the extrapolation to the whole of their stay according to their frequency of cycling during the stay.
Estimated economic impact
ESTIMATING RIDERSHIP AND ECONOMIC IMPACT
For communication to the public, it is recom-mended to focus the analyses on impact levels 1 and 3. Level 1 is useful because it minimizes es-timates, while level 3 is more inclusive. Level 4 is reserved for expert reports and should be ap-proached with caution.
In addition to these benefits, there are indirect im-pacts called externalities. These relate to savings in health expenditure, the environment, and the bicycle industry.
All these impacts are calculated based on two main indicators: kilometres cycled and expenditure per kilometre. The calculation of the kilometres cy-cled is detailed above. This leaves the calculation of expenditure ratios per kilometre for each ques-tionnaire [exp_km]. This is calculated as follows:
[exp_km] = ([tour_exp_tot_impact] + [dayt_exp_tot_impact]) / [km_trip_correction]
Where [tour_exp_tot_impact] is the total expen-diture corresponding to the questionnaire for a 'tourist' respondent (see page 68).
And [dayt_exp_tot_impact] is the total expenditure corresponding to the questionnaire for a "day-trip-per" respondent (see page 64).
And [km_trip_correction] is the distance the res-pondent cycled (see page 55).
© E
. Ber
thie
r

99
Estimation of the level 1 economic impactTo calculate the level 1 impact, the 3 fields are mul-tiplied:
- Expenditure per kilometre [exp_km] - Kilometres cycled on the route and extrapo-
lated [nb_km_extrapol_route] - The coefficient of the weight of the bicycle in
the choice of destination [coef_imp_cycling][impact_level1] = [exp_km] * [nb_km_extrapol_route] * [coef_imp_cycling]
Estimation of the level 2 economic impactTo calculate the level 2 impact, the 2 fields are mul-tiplied:
- Expenditure per kilometre [exp_km] - Kilometres cycled on the route and extrapo-
lated [nb_km_extrapol_route][impact_level2] = [exp_km] * [nb_km_extrapol_route]
Estimation of the level 3 economic impactTo calculate the level 3 impact, the 2 fields are mul-tiplied:
- Expenditure per kilometre [exp_km] - Extrapolated kilometres cycled (including
loops) [nb_km_extrapol][impact_level3] = [exp_km] * [nb_km_extrapol]
Estimated level 4 economic impact estimateTo calculate the level 4 impact, the 3 fields are mul-tiplied:
- Expenditure per kilometre [exp_km] - Extrapolated kilometres cycled (including
loops) [nb_km_extrapol] - Coefficient of frequency of cycling during the
stay [coef_cycling_stay][impact_level4] = [exp_km] * [nb_km_extrapol] * [coef_cycling_stay]
Estimation of externalitiesEstimation of the health impactIn terms of externalities, the main impact is on the savings in health expenditure generated by physi-cal activity.
The results of several converging international studies on the issue make it possible to determine the impacts on social security expenditure based on physical activity time per capita. They show that physical activity reduces the risks of mortality and morbidity. These outcomes are considerable, par-ticularly among people over 55 years of age, who represent a significant segment of the population. The health impacts are estimated at €0.69/km[21] (source: Cycling Economy 2020 study).
On this basis, the kilometres cycled on the routes generate a collective benefit that can be estimated by applying coefficients based on the €0.69/km ratio. A significant part of the estimated distances cycled in the survey would have been cycled by sport cyclists, and some leisure cyclists, in any event. This is why the choice is made to apply a more conservative health impact coefficient de-pending on the respondents' habitual cycling level (question 39 [cycling_usual]). The coefficients used are as follows:
›› 0 for respondents reporting that they cycle daily
›› 0.10 for those who cycle several times a week
›› 0.36 for those who cycle several times a month
›› 0.61 for those who cycle less than once a month
›› 0.69 for those who only cycle occasionally.
These coefficients serve as the basis for calcu-lating the coefficient of habitual cycling practice [coef_cycling_usual] which is applied to each questionnaire (see page 72). They must be updated with each study, according to the state of current research.
Since the benefit to health expenditure is specific only to the country in which the route or network under analysis is found, it is calculated only for people living in the country concerned. Thus, if the study is conducted on a route in France, only people residing in France will be included in the calculation.
21. This ratio is based on the estimate obtained by the WHO HEAT model for the 20-65 age group and extrapolated to the entire French population. This calculation is based on the "Économie du vélo" [Cycling Economy] study carried out by Inddigo and Vertigolab on behalf of the DGE in 2020.

100
The health impact is therefore calculated as fol-lows:
[health_impact] = [nb_km_extrapol_route] * IF([country_res]="France"; [coef_cycling_usual];0)
Estimation of the impact on the environmentThe positive impact of a shift from driving cars to utility cycling has been estimated at €0.18/km (Kilometre allowance report[22]) in terms of conges-tion, lack of safety and pollution. It also represents a loss of tax revenue of €0.05/km (TIPP [French fuel tax], VAT), i.e. an overall net positive externality of €0.13/km. On the basis of a 50% shift from cars to cycling (this figure would benefit from further clarification), the overall impact can therefore be estimated at €0.065/km. This ratio is applied to all kilometres cycled on the route.
[envt_impact] = [coef_envt] * [nb_km_extrapol_route]
Where [coef_envt] is the amount per kilometre of positive externality generated by shifting from cars to cycling (in this case, €0.065/km). This ratio must be updated with each study, according to the state of current research.
Estimated impact on the bicycle industryImpacts on the cycling industry and retail sector can be approached by relating the sales of bicycles and accessories to the distances cycled. According to the study on the bicycle industry carried out by Union Sport & Cycle, sales of bicycles and acces-sories in France amounted to €2.329 billion in 2019 for an estimated total of 11.9 billion kilometres cy-cled[23], i.e. an average ratio of €0.196/km.
This ratio is then multiplied by the distances cycled on the route by the inhabitants of the departments crossed by the route or network studied. Despite this limitation, these estimates remain indicative in that it is not possible to measure the specific impact of the routes on the distances cycled by bi-cycle, particularly for day-trippers. Some of these distances would have been cycled anyway, and some are probably generated specifically by the route.
[ind_impact] = [coef_ind] * [nb_km_extrapol_route]
Where [coef_ind] is the ratio of expenditure on bi-cycles and accessories per kilometre. This ratio must be updated for each survey, according to the state of current research.
22. Report from the Ministry for Ecology and Sustainable Development, "Indemnité kilométrique vélo, enjeux et impacts – novembre 2013" [Bicycle mileage allowance, issues and impacts - November 2013].
23. Data from the corrected 2008 Enquête Nationale Transport et Déplacement [French National Transport and Travel Survey] (see study on the economic impact and development potential of cycling in France - 2020)
ESTIMATING RIDERSHIP AND ECONOMIC IMPACT

101
Conclusion

102
As mentioned in the introduction, this document presents for the first time the processing and cal-culations needed to derive the main indicators of the ridership and economic impact of a cycle route or network. The method is bound to evolve over time to take stock of feedback and technolo-gical advances, as appropriate. This guide details the points of attention to bear in mind when clea-ning the database and carrying out the processing operations. The precautions presented are not res-trictive and do not replace the need for common sense and rigour in all survey procedures.
This guide is written with a vision resolutely oriented towards the evaluation of ridership. Transposing this survey to other modes (pedes-trians, horseback riders, etc.) is entirely possible, with a few adaptations, particularly with regard to the definition of profiles and the data on the ri-dership in the gravity model.
The route committees, local authorities and consultants who will conduct studies of ridership and economic impacts based on this method are warmly invited to contact Vélo & Territoires ([email protected]) and provide feedback on how it fares in use and on any room for improve-ment. Vélo & Territoires is also available to explain and clarify this guide to all and any stakeholders.
A living, non-exhaustive and participatory method
CONCLUSION
Requests for modifications will be studied by a Method Monitoring Committee made up of experts and observation professionals. This Committee will determine the merit of requests and how they should be handled.
From the start of the "EuroVelo 6" method, a large number of studies have been carried out in France based on it. A list of the most recent studies is avai-lable below and will be supplemented in due course by further application of the method, henceforth known as the "ÉVA-VÉLO method".
As part of the ongoing development of the ÉVA-VÉLO method, Vélo & Territoires is developing a unified database tool that will make it possible to aggre-gate at a national level all the surveys conducted using this method from 2020 and beyond. What is the goal? The goal is to steadily produce data and indicators of recurring annual economic impacts at the level of cycle routes and destinations, and soon for the whole of France.

103
ROUTE/NETWORK SURVEYED
YEAR METHOD USED
PUBLICATION CONTACT
EV1 - LA VÉLODYSSÉE
2018 EuroVelo 6 https://www.lavelodyssee.com/etude-2018 Coordination de la Vélodyssée
Tél : +33.(0)6.68.43.86.21
BRETAGNE 2018 EuroVelo 6 https://acteurs.tourismebretagne.bzh/observer/les-etudes-thematiques/mobilites-douces/
Tourisme Bretagne
1 rue Raoul Ponchon – CS 46938 35069 RENNES Cedex
Tél : +33.(0)2.99.28.44.30
COLS PYRÉNÉENS 2018 EuroVelo 6 Département des Pyrénées-Atlantiques, Mission Vélo
64 avenue Jean Biray – 64000 PAU
Tél : +33.(0)5.59.11.46.64
EUROVELO 17 - VIARHÔNA
2017 EuroVelo 6 http://pro.auvergnerhonealpes-tourisme.com/article/analyse-de-la-clientele-et-des-retombees-economiques-sur-viarhona
Région Sud
Service Grands Équipements
Hôtel de Région
27 place Jules Guesde
13481 MARSEILLE cedex 20
Tél : +33.(0)4.91.57.58.53
EUROVELO 8 - LA MÉDITERRANÉE À VÉLO
2017 EuroVelo 6 https://www.lamediterraneeavelo.org/comites-techniques/observation-de-la-frequentation-et-des-retombees-socio-economiques-2017/
Région Sud
Service Grands Équipements
Hôtel de Région
27 place Jules Guesde
13481 MARSEILLE cedex 20
Tél : +33.(0)4.91.57.52.86
VIA VENAISSIA 2017 EuroVelo 6
V65 2017 EuroVelo 6
LA LOIRE À VÉLO 2015 EuroVelo 6 http://www.tourisme-pro-centre.fr/observatoire/etudes-thematiques/etude-la-loire-a-velo
CRT Centre-Val de Loire
37 avenue Paris
45000 ORLEANS
Tél : +33.(0)2.38.79.95.00
Ou
Solutions&co Pays de la Loire
7 rue du Général de Bollardière
44200 Nantes
Tél : +33.(0)2 40 48 92 26
Studies carried out to date

104

105
Counts and short interviews grid 106
Survey questionnaire 107
Setting up a panel of accommodation providers: which tools should be used? 109
Standard file and variable dictionary 114
Treatment of open questions 114
Annexes
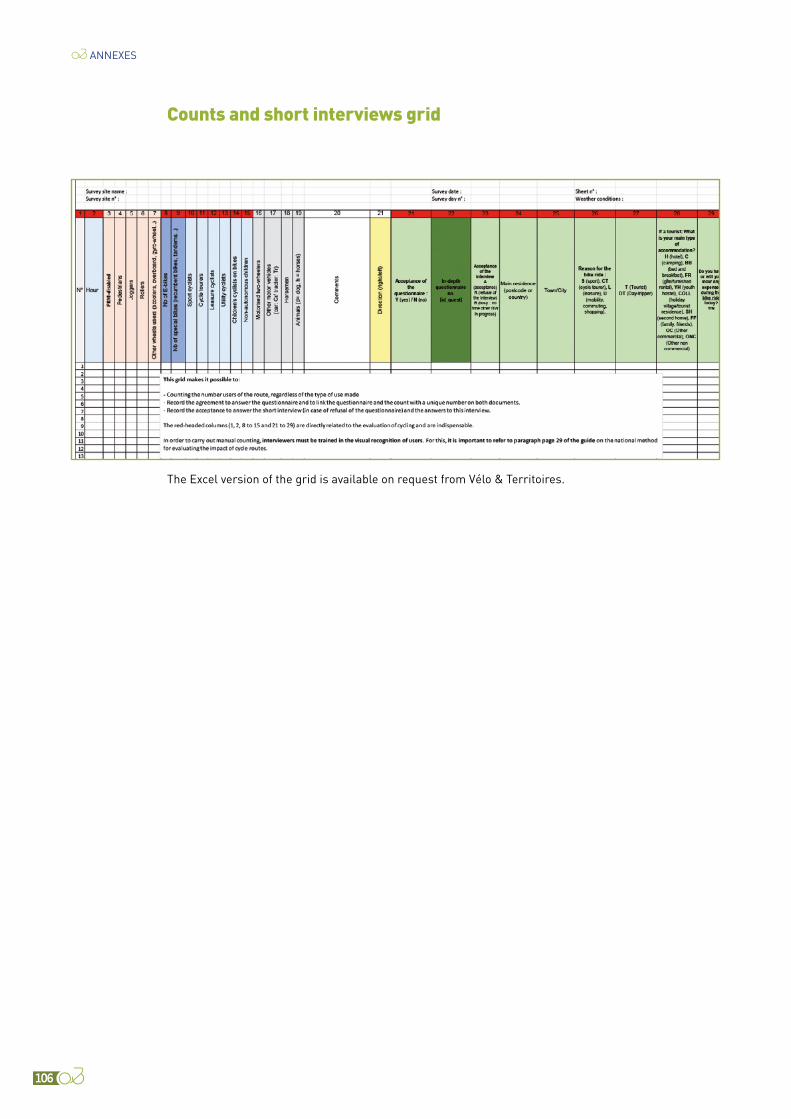
106
Counts and short interviews grid
The Excel version of the grid is available on request from Vélo & Territoires.
ANNEXES
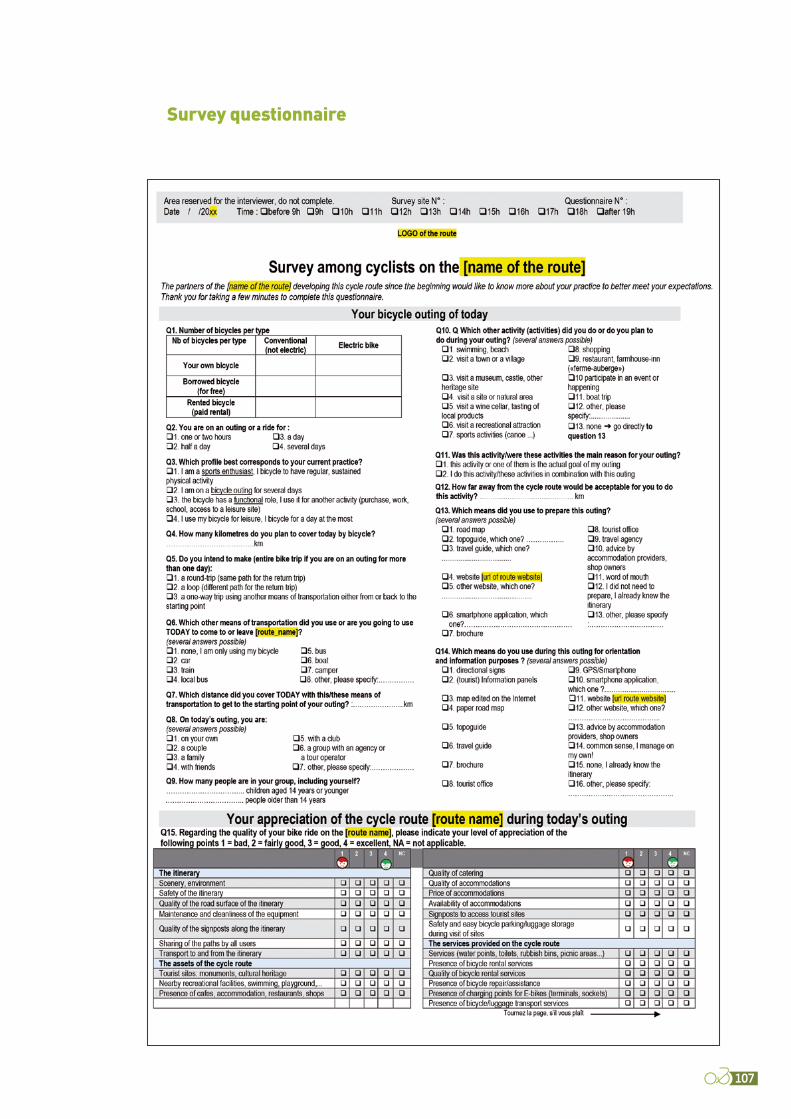
107
Survey questionnaire
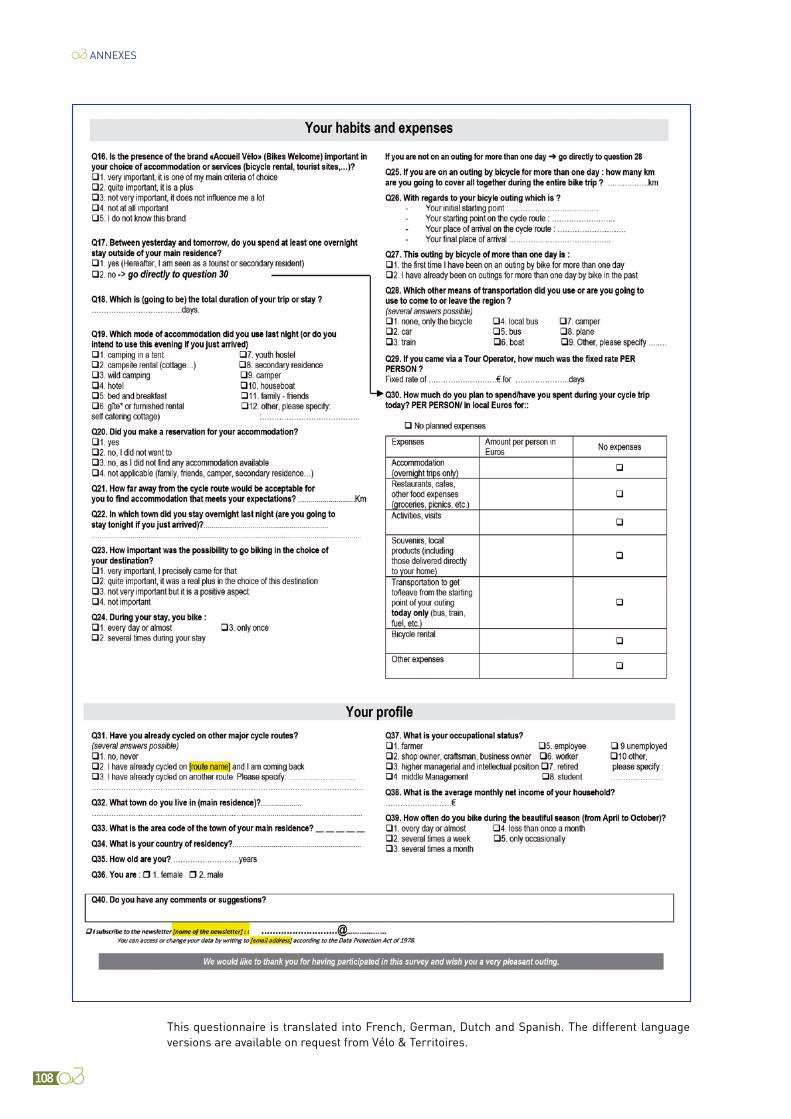
108
This questionnaire is translated into French, German, Dutch and Spanish. The different language versions are available on request from Vélo & Territoires.
ANNEXES

109
Setting up a panel of accommodation providers: which tools should be used?Despite the exploratory work carried out on auto-matic counting data, it appears that the detailed analysis of these data does not always make it possible to differentiate between the seasonality of cycle tourers and holiday cyclists. The latter is one of the points to be mastered to improve the quality and reliability of extrapolations of economic impacts. One of the solutions to have an approach to the seasonality differential between holiday cyclists and cycle tourers is to set up a follow-up thanks to a panel of accommodation providers.
Setting up a panel consists of motivating volunteer accommodation providers from the "Accueil Vélo" group (a bike friendly label) and asking them to carry out a year-round, day-by-day count of the number of cyclists received in their establishment. The count can be done by sticking a stick (one stick per cyclist) on a counting sheet, either paper or computerised (available below), distinguishing between cycle tourers and holiday cyclists during their stay.
For the success of this action, it is necessary to provide human resources accordingly, as several tasks will have to be carried out throughout the year:
›› Recruitment and awareness-raising of accom-modation providers
›› Organisation and monitoring of the data collec-tion
›› Follow-up of non-respondents
›› Synthesis of results and communication to res-pondents
Recruitment and awareness-raising of accommodation providersThis phase is important, because it is necessary to succeed in selecting accommodation providers who are motivated to invest in a long process. To convince them of the interest of this system, it may be interesting to widely distribute an aware-ness-raising document presenting the approach, why it is important and what it can bring them in return. This is what the coordination of EV1-La Vélodyssée has set up for the study conducted in 2018. The arguments used are shared below.
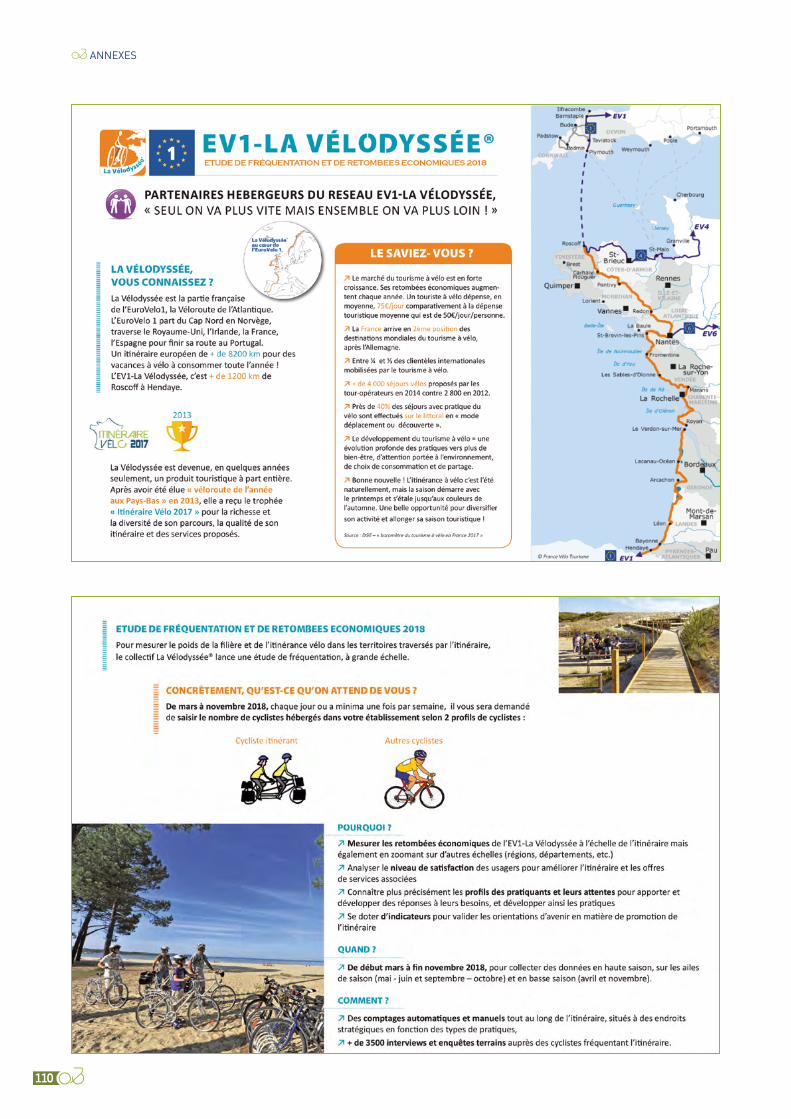
110
ANNEXES

111

112
Organisation of data collectionCount data can be collected in different ways:
›› By email or post: the accommodation providers fill in grids on paper or Excel and send them back to the person in charge of monitoring this panel (see collection grid below)
›› Online: a means of collection can be set up via an online survey tool, such as Survey Monkey or Lime Survey.
Collection grid
Example of a collection grid that can be used by accommodation providers
The Excel version of this grid is available on request from Vélo & Territoires.
ANNEXES
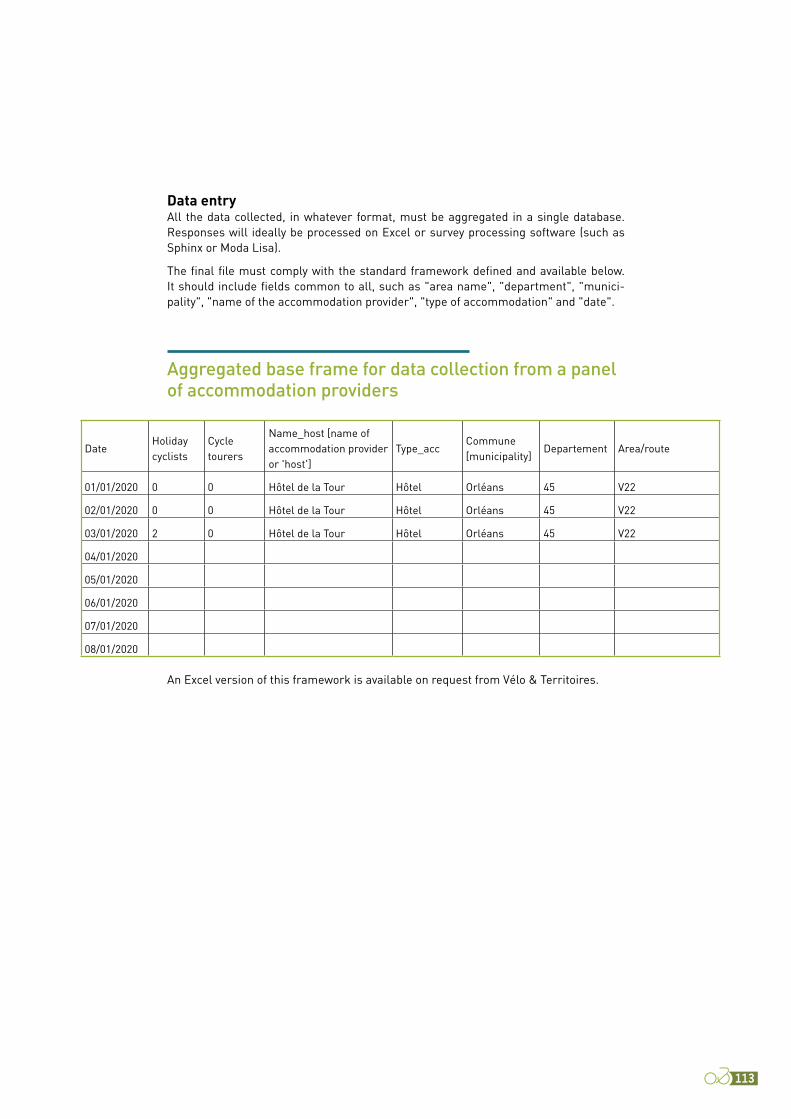
113
DateHoliday cyclists
Cycle tourers
Name_host [name of accommodation provider or 'host']
Type_accCommune [municipality]
Departement Area/route
01/01/2020 0 0 Hôtel de la Tour Hôtel Orléans 45 V22
02/01/2020 0 0 Hôtel de la Tour Hôtel Orléans 45 V22
03/01/2020 2 0 Hôtel de la Tour Hôtel Orléans 45 V22
04/01/2020
05/01/2020
06/01/2020
07/01/2020
08/01/2020
Data entryAll the data collected, in whatever format, must be aggregated in a single database. Responses will ideally be processed on Excel or survey processing software (such as Sphinx or Moda Lisa).
The final file must comply with the standard framework defined and available below. It should include fields common to all, such as "area name", "department", "munici-pality", "name of the accommodation provider", "type of accommodation" and "date".
Aggregated base frame for data collection from a panel of accommodation providers
An Excel version of this framework is available on request from Vélo & Territoires.

114
Standard file and variable dictionaryVélo & Territoires has set up a standard file for input and processing of surveys. This file is accom-panied by a dictionary of variables which explains each of the fields resulting from the survey itself or from the processing and calculations carried out on the data collected.
The standard input file includes all the reference information related to the survey and the route or area surveyed:
›› Survey calendar
›› List of survey sites
›› Population data
›› Accommodation data
›› Route or network segmentation
›› Survey data
›› …
On the basis of this file, Vélo & Territoires is wor-king on the development of a tool to facilitate the processing of survey data, as well as a unified da-tabase that will make it possible to aggregate at a national level all the surveys conducted using the ÉVA-VÉLO method.
All these elements are available on request from Vélo & Territoires.
Processing of open questionsThe main questions that allow for open-ended answers, apart from the questions about munici-palities, are the questions relating to:
›› Modes of transport used on the day of the outing or for travel to and from the region
›› The activities performed
›› The means of preparation for the outing (map book, tourist guide, website, smartphone appli-cation, etc.)
›› The means of wayfinding and seeking informa-tion during the outing (website, smartphone application, etc.)
›› Types of accommodation
›› The routes covered
›› Occupation.
For each of these questions, you will find below a list of recoding proposals to be used when pro-cessing survey data. This list is not exhaustive and will benefit from enrichment with experience. Pro-posals for amendments should be sent to Vélo & Territoires.
ITEMS ENTERED RECORDED ITEMS
FOOT On foot
ON FOOT
WALK
WALKING
RUNNING
FERRY To be included in the existing "Boat" item, unless there is a local impetus for promoting this mode of transport
MOTORBYKE Motorised two-wheelers
SCOOTER
ANNEXES
Modes of transport used on the day of the outing or for travel to and from the region
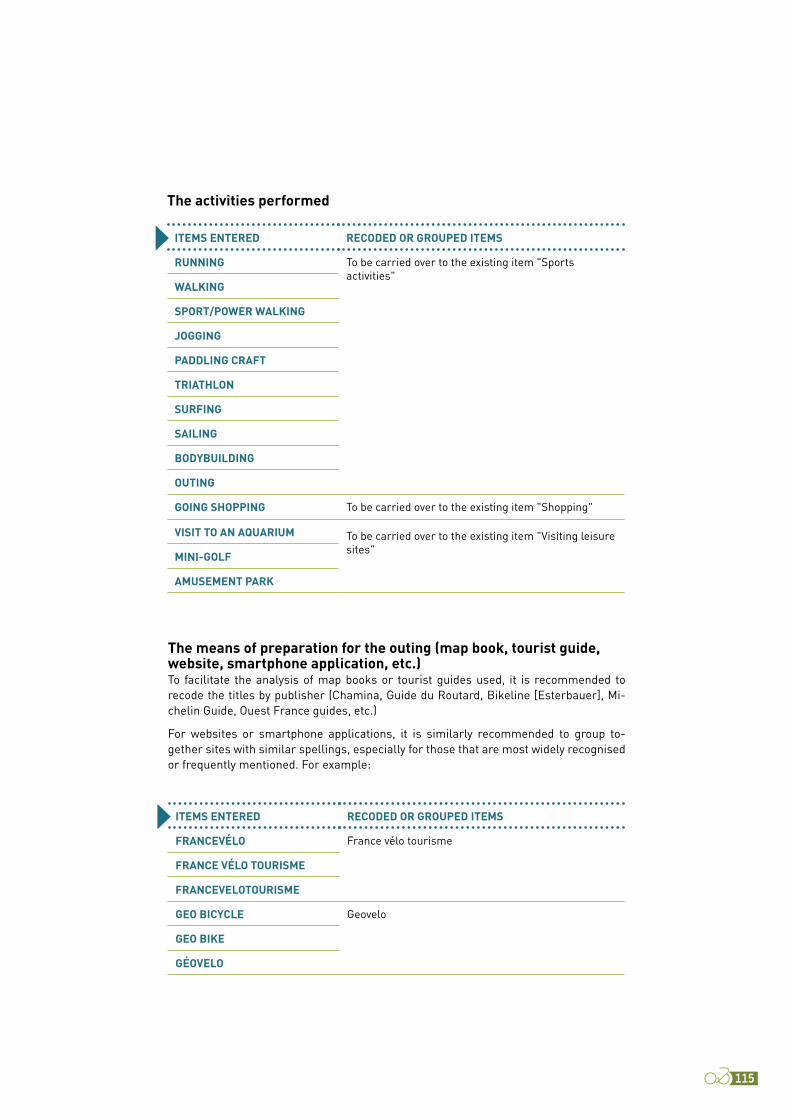
115
The activities performed
ITEMS ENTERED RECODED OR GROUPED ITEMS
RUNNING To be carried over to the existing item "Sports activities"
WALKING
SPORT/POWER WALKING
JOGGING
PADDLING CRAFT
TRIATHLON
SURFING
SAILING
BODYBUILDING
OUTING
GOING SHOPPING To be carried over to the existing item "Shopping"
VISIT TO AN AQUARIUM To be carried over to the existing item "Visiting leisure sites"
MINI-GOLF
AMUSEMENT PARK
The means of preparation for the outing (map book, tourist guide, website, smartphone application, etc.)To facilitate the analysis of map books or tourist guides used, it is recommended to recode the titles by publisher (Chamina, Guide du Routard, Bikeline [Esterbauer], Mi-chelin Guide, Ouest France guides, etc.)
For websites or smartphone applications, it is similarly recommended to group to-gether sites with similar spellings, especially for those that are most widely recognised or frequently mentioned. For example:
ITEMS ENTERED RECODED OR GROUPED ITEMS
FRANCEVÉLO France vélo tourisme
FRANCE VÉLO TOURISME
FRANCEVELOTOURISME
GEO BICYCLE Geovelo
GEO BIKE
GÉOVELO

116
Types of accommodationIn many cases a large proportion of the responses to the item 'other' may be assigned to the field for grouping accommodation by broad type (see page 61). This is the case for all answers relating to VVF, holiday villages, village clubs or similar. In addition, some of these answers can be reassigned to existing items, for example:
ITEMS ENTERED RECODED OR GROUPED ITEMS
HOME RENTAL To be transferred to the existing item "Gîte or furnished rental"
CARAVAN To be transferred to the existing item "Camping"
BIVOUAC To be carried over to the existing item "Wild camping"
IN THE WILD
ITEMS ENTERED RECODED OR GROUPED ITEMS
VÉLOCÉNIE V40 – La Véloscénie
VELOSCENIE
LA VÉLOSCÉNIE
LOIRE À VÉLO La Loire à Vélo
LA LOIRE À VÉLO
NANTES-BUDAPEST EV6 – Véloroute des fleuves
EUROVELO 6
EUROVÉLOROUTE DES FLEUVES
EV6
ITEMS ENTERED RECODED OR GROUPED ITEMS
PROFESSIONAL To be transferred to the existing item "Executive or advanced professional occupation"
SENIOR TECHNICIAN To be transferred to the existing item "Intermediate profession"
SUPERVISOR
The routes coveredIt is necessary to group together all the answers with similar spellings, and to check the exact names of the routes on sites such as Vélo & Territoires (https://www.velo-terri-toires.org/schemas-itineraires). As an indication, a few examples are given below:
Occupation
To carry out the recoding of this question, resources published by INSEE can be used, such as https://www.insee.fr/fr/statistiques/fichier/2401328/Brochure_PCS_ESE_2003.pdf.
ANNEXES

Credits@ Vélo & Territoires
Editorial staff: Stéphanie MANGIN – Vélo & Territoires
Director of publication: Camille THOMÉ – Vélo & Territoires
Layout: Atelier J-Ph GERMANAUD
Photos : cover : Atlantic Coast Route, chapter 1 : M. Joly, chapter 2 : Atlantic Coast Route, chapter 3 : Y. Perrin, chapter 4 : Angers Loire Metropole
Translation from French to English: Atenao
Publication date: Décembre 2020
Version number : 1.0
Document versionsVersion tracking of this document, from validation by the proofreading committee on 29/09/2020:
VERSION NUMBER DATE MODIFIED MODIFICATION MADE

Tél. +33 (0)9 72 56 85 [email protected]
www.velo-territoires.org
Vélo et Territoires
@Vélo Territoires


![[2005] DEVELOPMENT OF A NEW METHOD FOR ASSESSING](https://static.fdocuments.us/doc/165x107/577d2e9e1a28ab4e1eaf8b55/2005-development-of-a-new-method-for-assessing.jpg)