
NATIONAL MATH SCINC Mathematics INITIATIV Slope … Investigation.pdfof the Grade 7 content and some...
16
TEACHER PAGES i Copyright © 2013 National Math + Science Initiative, Dallas, Texas. All rights reserved. Visit us online at www.nms.org. Mathematics NATIONAL MATH + SCIENCE INITIATIVE LEVEL Grade 8, Algebra 1, or Math 1 in a unit with rate of change and slope MODULE/CONNECTION TO AP* Rate of Change *Advanced Placement and AP are registered trademarks of the College Entrance Examination Board. The College Board was not involved in the production of this product. MODALITY NMSI emphasizes using multiple representations to connect various approaches to a situation in order to increase student understanding. The lesson provides multiple strategies and models for using those representations indicated by the darkened points of the star to introduce, explore, and reinforce mathematical concepts and to enhance conceptual understanding. P G N A V P – Physical V – Verbal A – Analytical N – Numerical G – Graphical Slope Investigation ABOUT THIS LESSON This lesson uses a real-world situation to introduce students to a constant rate of change and to define the rate of change as slope. Students begin by calculating data points, using a process column, and then determine rates of change between a variety of those points to establish the constant rate of change. The lesson next introduces the algebraic formula for calculating slope and asks students to apply it to the situation. Students then use their new knowledge to calculate slopes of lines containing given pairs of points, including horizontal and vertical lines, and to recognize how slope is represented in various forms of a linear function. OBJECTIVES Students will ● Translate a real-world scenario into a table. ● Graph data points. ● Calculate the slope of a line. ● Define slope of a line as constant rate of change.
Transcript of NATIONAL MATH SCINC Mathematics INITIATIV Slope … Investigation.pdfof the Grade 7 content and some...

TE
AC
HE
R
PA
GE
S
iCopyright © 2013 National Math + Science Initiative, Dallas, Texas. All rights reserved. Visit us online at www.nms.org.
MathematicsNATIONALMATH + SCIENCEINITIATIVE
LEVELGrade 8, Algebra 1, or Math 1 in a unit with rate of change and slope
MODULE/CONNECTION TO AP*Rate of Change
*Advanced Placement and AP are registered trademarks of the College Entrance Examination Board. The College Board was not involved in the production of this product.
MODALITYNMSI emphasizes using multiple representations to connect various approaches to a situation in order to increase student understanding. The lesson provides multiple strategies and models for using those representations indicated by the darkened points of the star to introduce, explore, and reinforce mathematical concepts and to enhance conceptual understanding.
P
G
N A
V
P – Physical V – VerbalA – AnalyticalN – NumericalG – Graphical
Slope InvestigationABOUT THIS LESSONThis lesson uses a real-world situation to introduce students to a constant rate of change and to define the rate of change as slope. Students begin by calculating data points, using a process column, and then determine rates of change between a variety of those points to establish the constant rate of change. The lesson next introduces the algebraic formula for calculating slope and asks students to apply it to the situation. Students then use their new knowledge to calculate slopes of lines containing given pairs of points, including horizontal and vertical lines, and to recognize how slope is represented in various forms of a linear function.
OBJECTIVESStudents will
● Translate a real-world scenario into a table.● Graph data points.● Calculate the slope of a line. ● Define slope of a line as constant rate of
change.

TE
AC
HE
R
PA
GE
S
Copyright © 2013 National Math + Science Initiative, Dallas, Texas. All rights reserved. Visit us online at www.nms.org.ii
Mathematics—Slope Investigation
COMMON CORE STATE STANDARDS FOR MATHEMATICAL CONTENTThis lesson addresses the following Common Core State Standards for Mathematical Content. The lesson requires that students recall and apply each of these standards rather than providing the initial introduction to the specific skill. The star symbol (★) at the end of a specific standard indicates that the high school standard is connected to modeling.
Targeted Standards – (if used in Grade 8)8.F.4 Construct a function to model a linear
relationship between two quantities. Determine the rate of change and initial value of the function from a description of a relationship or from (x, y) values, including reading these from a table or from a graph. Interpret the rate of change and initial value of a linear function in terms of the situation it models, and in terms of its graph or a table of values. See questions 1-2, 4-12, 15
Reinforced/Applied Standards – (if used in Grade 8)8.F.5 Describe qualitatively the functional
relationship between two quantities by analyzing a graph (e.g., where the function is increasing or decreasing, linear or nonlinear). Sketch a graph that exhibits the qualitative features of a function that has been described verbally. See question 8
Targeted Standards – (if used in Algebra I) F-IF.6 Calculate and interpret the average
rate of change of a function (presented symbolically or as a table) over a specified interval. Estimate the rate of change from a graph. ★ See questions 4-6, 10-12, 15
Reinforced/Applied Standards – (if used in Algebra I)F-IF.4 For a function that models a relationship
between two quantities, interpret key features of graphs and tables in terms of the quantities, and sketch graphs showing key features given a verbal description of the relationship. See question 8
A-CED.2 Create equations in two or more variables to represent relationships between quantities; graph equations on coordinate axes with labels and scales. See questions 1-2, 8, 15a

TE
AC
HE
R
PA
GE
S
i i iCopyright © 2013 National Math + Science Initiative, Dallas, Texas. All rights reserved. Visit us online at www.nms.org.
Mathematics—Slope Investigation
COMMON CORE STATE STANDARDS FOR MATHEMATICAL PRACTICEThese standards describe a variety of instructional practices based on processes and proficiencies that are critical for mathematics instruction. NMSI incorporates these important processes and proficiencies to help students develop knowledge and understanding and to assist them in making important connections across grade levels. This lesson allows teachers to address the following Common Core State Standards for Mathematical Practice.
MP.6: Attend to precision. Students use given variables to identify independent and dependent quantities to write a function rule, evaluate function values, scale and label the axes appropriately, plot points, and use mathematical language to interpret the meaning of the ordered pairs and the slope in the context of the situation.
MP.8 Look for and express regularity in repeated reasoning. In question 12, students use the previous calculations to interpret and understand the process of calculating slope in order to explain how to calculate the average rate of change from the table, graph, and two coordinate points.
FOUNDATIONAL SKILLSThe following skills lay the foundation for concepts included in this lesson:
● Use dimensional analysis● Create a graph of discrete data points
ASSESSMENTSThe following types of formative assessments are embedded in this lesson:
● Students engage in independent practice.● Students apply knowledge to a new situation.● Students summarize a process or procedure.
The following assessments are located on our website:
● Rate of Change: Average and Instantaneous – Algebra 1 Free Response Questions
● Rate of Change: Average and Instantaneous – Algebra 1 Multiple Choice Questions
MATERIALS AND RESOURCES● Student Activity pages
TE
AC
HE
R
PA
GE
S
Copyright © 2013 National Math + Science Initiative, Dallas, Texas. All rights reserved. Visit us online at www.nms.org.iv
Mathematics—Slope Investigation
TEACHING SUGGESTIONS
This lesson can be used to introduce the slope, or constant rate of change, of a linear function. Questions 1 – 4 provide a step-by-
step discovery process for connecting rate of change to the frequently-used algebraic formula for slope.
Before the lesson begins, divide students into groups of two or three. Complete the first row in the table with the entire class, demonstrating the process to determine Mrs. Smith’s weight for each week. Have students predict what will happen to her weight as the weeks increase if she is able to lose 0.5 kg per week. For question 3, discuss that, during the week, Mrs. Smith’s weight could increase or decrease; however, her cumulative weight loss for the week must be 0.5 kg/week to follow this plan. For question 8, students should use their table to determine the minimum and maximum values to label the graph. The data from the graph should not be connected because the data is discrete. Remind students that they looked at this information in question 3. Question 15 can be done as a continuation of the group activity or as individual practice.
You may wish to support this activity with TI-Nspire™ technology. See Working with Fractions and Decimals and Calculations Using Special Keys in the NMSI TI-Nspire Skill Builders.
Suggested question modifications for additional scaffolding include the following:1 Complete several rows of the table prior to
giving the Student Activity pages to the student.4 Provide fill-in-the-blank templates to help the
student perform the calculations.8 Mark labels and scales on the axes of the graph
grid as hints for determining minimum and maximum values.
10 Provide a fill-in-the-blank template to help the student perform the calculations.
Copyright © 2013 National Math + Science Initiative, Dallas, Texas. All rights reserved. Visit us online at www.nms.org.
TE
AC
HE
R
PA
GE
S
v
Mathematics—Slope Investigation
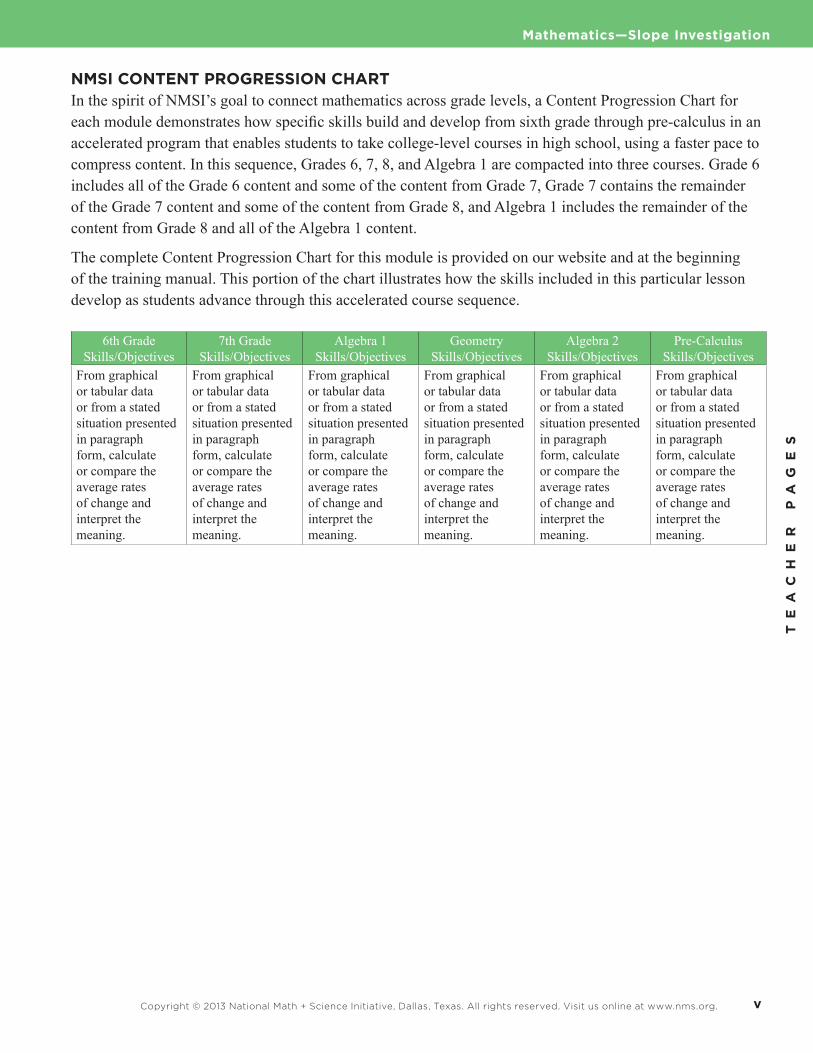
NMSI CONTENT PROGRESSION CHARTIn the spirit of NMSI’s goal to connect mathematics across grade levels, a Content Progression Chart for each module demonstrates how specific skills build and develop from sixth grade through pre-calculus in an accelerated program that enables students to take college-level courses in high school, using a faster pace to compress content. In this sequence, Grades 6, 7, 8, and Algebra 1 are compacted into three courses. Grade 6 includes all of the Grade 6 content and some of the content from Grade 7, Grade 7 contains the remainder of the Grade 7 content and some of the content from Grade 8, and Algebra 1 includes the remainder of the content from Grade 8 and all of the Algebra 1 content.
The complete Content Progression Chart for this module is provided on our website and at the beginning of the training manual. This portion of the chart illustrates how the skills included in this particular lesson develop as students advance through this accelerated course sequence.
6th Grade Skills/Objectives
7th Grade Skills/Objectives
Algebra 1 Skills/Objectives
GeometrySkills/Objectives
Algebra 2 Skills/Objectives
Pre-Calculus Skills/Objectives
From graphical or tabular data or from a stated situation presented in paragraph form, calculate or compare the average rates of change and interpret the meaning.
From graphical or tabular data or from a stated situation presented in paragraph form, calculate or compare the average rates of change and interpret the meaning.
From graphical or tabular data or from a stated situation presented in paragraph form, calculate or compare the average rates of change and interpret the meaning.
From graphical or tabular data or from a stated situation presented in paragraph form, calculate or compare the average rates of change and interpret the meaning.
From graphical or tabular data or from a stated situation presented in paragraph form, calculate or compare the average rates of change and interpret the meaning.
From graphical or tabular data or from a stated situation presented in paragraph form, calculate or compare the average rates of change and interpret the meaning.

TE
AC
HE
R
PA
GE
S
Copyright © 2013 National Math + Science Initiative, Dallas, Texas. All rights reserved. Visit us online at www.nms.org.vi
Mathematics—Slope Investigation

TE
AC
HE
R
PA
GE
S
v i iCopyright © 2013 National Math + Science Initiative, Dallas, Texas. All rights reserved. Visit us online at www.nms.org.
MathematicsNATIONALMATH + SCIENCEINITIATIVE
Slope Investigation
Answers1.
Week Process Column Weight0 120 – 0(.5) 120 kg1 120 – 1(.5) 119.5 kg2 120 – 2(.5) 119 kg3 120 – 3(.5) 118.5 kg4 120 – 4(.5) 118 kg5 120 – 5(.5) 117.5 kg6 120 – 6(.5) 117 kg7 120 – 7(.5) 116.5 kg8 120 – 8(.5) 116 kg9 120 – 9(.5) 115.5 kg10 120 – 10(.5) 115 kgn 120 – n(.5)
2. w=120−0.5n
3. No. The domain can only include whole numbers. Since the data is provided for weeks only, it is unknown what happens during the week. She could gain and lose weight within the week as long as her cumulative weight loss for the week is 0.5 kg per week. For this reason, the data is not continuous.
4. )5.118,3( and )118,4( . The rate of change is )43(
)1185.118(−− , so the rate of change is −0.5 kg
week.
5. )5.118,3( and )5.117,5( . The rate of change is )53(
)5.1175.118(−− , so the rate of change is −0.5 kg
week.
6. )119,2( and )116,8( . The rate of change is )82(
)116119(−− , so the rate of change is −0.5 kg
week.
7. The rate of change is constant, −0.5 kgweek
.
8. x-minimum 0 The smallest number of weeks in the table is 0. x-maximum 10 The largest number of weeks in the table is 10, but a larger maximum is acceptable. x-scale 1 This scale will match the table. y-minimum __ Answers may widely vary here, from 0 to near 115 kg. y-maximum 120 The largest or the starting amount. y-scale __ Answers will vary here depending on the minimum chosen.

TE
AC
HE
R
PA
GE
S
Copyright © 2013 National Math + Science Initiative, Dallas, Texas. All rights reserved. Visit us online at www.nms.org.viii
Mathematics—Slope Investigation
9. The data cannot be connected with a line segment because it is not continuous. Since the data is provided for weeks only, it is unknown what happens during the week. She could gain and lose weight within the week as long as her cumulative weight loss for the week is 0.5 kg per week. For this reason, the data is not continuous.
10. Example: (4, 118), (9, 115.5) slope 115.5 118 kg kg0.59 4 week week
−= = −−
. Check students’ work to be sure that they listed the points as ordered pairs, showed determining the
slope, and arrived at an answer of kg0.5week
− .
11. Check students’ work to be sure that they listed the points as ordered pairs, showed determining the
slope, and arrived at an answer of kg0.5week
− .
12. Using the table, calculate the difference between any two listed weights and divide by the difference in
the corresponding weeks. For any two ordered pairs, 1 1( , )x y and 2 2( , )x y , the slope is 2 1
2 1
y yyx x x
−∆ =∆ −
. Using the graph, divide the “rise” (vertical change) by the “run” (horizontal change).
13. At the end of week 20, Mrs. Smith could expect to weigh 242.55 pounds, since kg 2.205 lbs120 0.5 (20 weeks) 242.55 lbs
week 1 kg − =
.
14. Mrs. Smith could expect to weigh 205.065 pounds after 54 weeks, since 1 kg205.065 lbs 93 kg
2.205 lbs
=
and 93 120 0.5 ; 54n n= − = .

TE
AC
HE
R
PA
GE
S
ixCopyright © 2013 National Math + Science Initiative, Dallas, Texas. All rights reserved. Visit us online at www.nms.org.
Mathematics—Slope Investigation
15. a. 7 2 51 0
− =−
b. 3 3 06 5 1
− =−
; 6 5 13 3 0
− =−
c. 0 01
= , this graph is a horizontal line whose slope is zero. 10
is undefined and the graph is a vertical
line. The lines are perpendicular to one another.
d. 5 2 11 5 11 2 32 0 6 2 6 0 2
− − −= = =− − −
, so the points are on the same line.
e. 2 0 0 ( 5) 2 ( 5)3 1 1 ( 2) 3 ( 2)
− − − − −≠ ≠− − − − −
, so the points are not on the same line.
f. Students may select any two points on the line and calculate the slope. For example, (1) (0) 5 3 2
1 0 1f f− −= =
−
g. Students may select any two points on the line and calculate the slope. For example, (1) (0) 5 ( 2) 3
1 0 1g g− − − −= = −
−

TE
AC
HE
R
PA
GE
S
Copyright © 2013 National Math + Science Initiative, Dallas, Texas. All rights reserved. Visit us online at www.nms.org.x
Mathematics—Slope Investigation
h. Students may select any two points on the line and calculate the slope. For example, (3) (0) 4 2 2
3 0 3 3h h− −= =
−
i. The slope is the number by which the variable is multiplied.
j. Solve for y in the first equation. 2 23
y x= − + , so the slope is 23
− . Since the second equation is in
point-slope form, the slope is displayed in the equation. The slope is 34
− .

1Copyright © 2013 National Math + Science Initiative, Dallas, Texas. All rights reserved. Visit us online at www.nms.org.
Mathematics NATIONALMATH + SCIENCEINITIATIVE
Slope Investigation
At her annual physical, Mrs. Smith, the health teacher at Smedley Middle School, finds that she is 153 centimeters tall and that she weighs 120 kilograms. After being diagnosed with hypertension (high blood pressure) and high cholesterol, she decides that she will follow a diet planned and supervised by her doctor. On this diet, Mrs. Smith plans to lose 0.5 kg per week.
1. Complete the table at right to show Mrs. Smith’s weight during the first 10 weeks of her diet, if she is able to lose 0.5 kg per week.
2. Using the variables n for week number and w for weight, write a rule to describe Mrs. Smith’s weight after n weeks.
3. Is there information provided for mid-week values? Can Mrs. Smith’s weight fluctuate during the week as long as her cumulative weight loss for the week is 0.5 kg? How do these answers affect the domain of the data?
4. Using the ordered pairs (n, w(n)), write the ordered pairs that represent her weight for weeks 3 and 4. What is Mrs. Smith’s rate of change between weeks 3 and 4? Include units in the answer.
5. What is her rate of change in kilograms per week between weeks 3 and 5? Show the points and the method used to calculate the answers.
6. What is her rate of change in kilograms per week between weeks 2 and 8? Show the points and the method used to calculate the answers.
7. What conclusion can you draw about the rate of change for this data?
Week Process Column Weight0 120 kg12345678910n

Copyright © 2013 National Math + Science Initiative, Dallas, Texas. All rights reserved. Visit us online at www.nms.org.2
Mathematics—Slope Investigation
8. Determine an appropriate window for the data then graph the data on the grid provided. Label both axes and the graph.
x-minimumx-maximumx-scaley-minimumy-maximumy-scale
9. Explain why the data cannot be connected with a line segment.

3Copyright © 2013 National Math + Science Initiative, Dallas, Texas. All rights reserved. Visit us online at www.nms.org.
Mathematics—Slope Investigation
When there is a constant rate of change between points, the points will follow a linear pattern. This constant rate of change is called the slope.
In mathematics, the Greek symbol means “change.” In questions 4, 5, and 6, the rate of change was calculated by determining the change in kilograms and dividing it by the change in weeks. For any two
ordered pairs, (x1, y1) and (x2 , y2 ) , the slope is .
10. Select any two points on the graph that you made in question 8. List those two points as ordered pairs and show how to determine the slope algebraically.
11. Select two additional points and calculate the slope algebraically.
12. Explain how to calculate the slope, or average rate of change, from the table, from the graph, and from two coordinate points.
13. At the end of week 20, how many pounds will Mrs. Smith expect to weigh if she has lost 0.5 kg per week? . Show the work that leads to your answer.
14. If she loses 0.5 kg per week, Mrs. Smith wants to know when she will weigh 205.065 pounds. Show the work that leads to your answer.

Copyright © 2013 National Math + Science Initiative, Dallas, Texas. All rights reserved. Visit us online at www.nms.org.4
Mathematics—Slope Investigation
15. Complete the following:a. Using the slope formula , calculate the slope of the line containing the points (0, 2)
and (1, 7) . Sketch a graph of these two points and draw a line that contains them.
b. Calculate the slope of the line containing the points (5, 3) and (6, 3) . Sketch a graph of these two points and draw a line that contains them, labeling the line a. Repeat with the points (3, 5) and (3, 6) , labeling the line b.
c. Write a statement about the slopes and graphs in part (b).
d. One method that can be used to show that three or more points lie on the same line is to determine that the slope between pairs of points are the same. Show whether the points (0, 2), (2, 5) and (6, 11) do or do not lie on the same line.
e. Show whether the points (3, 2), (1, 0), and do or do not lie on the same line.
5Copyright © 2013 National Math + Science Initiative, Dallas, Texas. All rights reserved. Visit us online at www.nms.org.
Mathematics—Slope Investigation
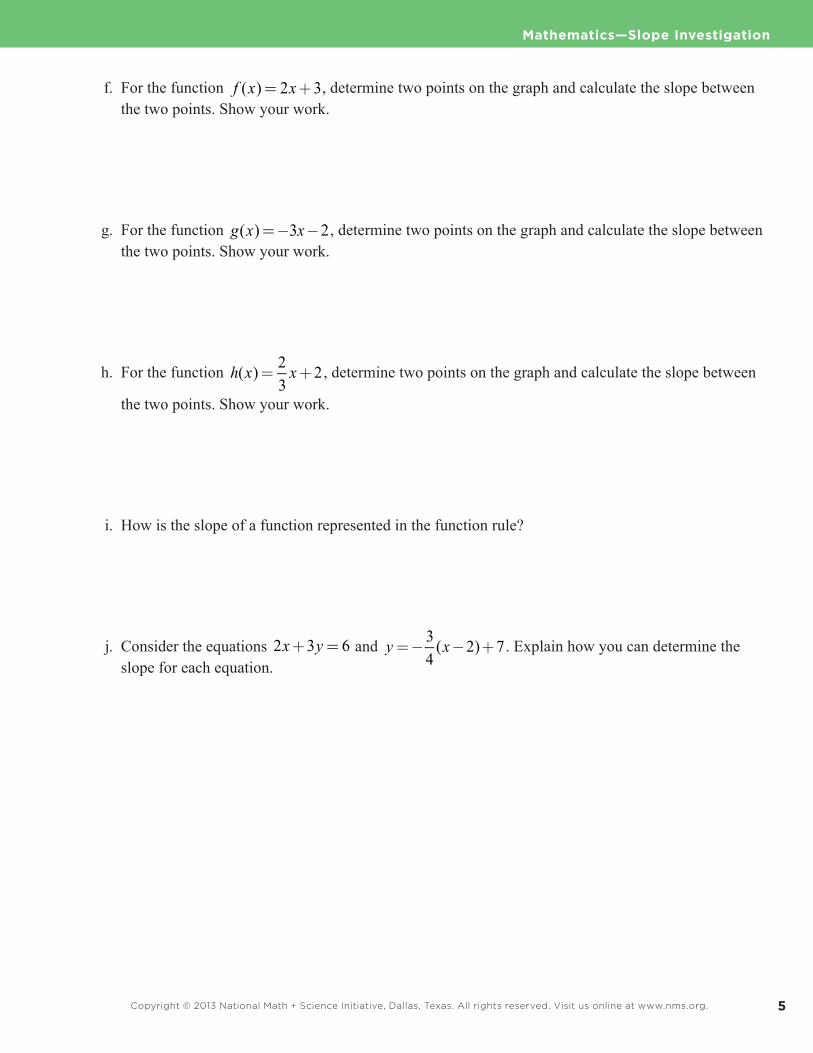
f. For the function , determine two points on the graph and calculate the slope between the two points. Show your work.
g. For the function , determine two points on the graph and calculate the slope between the two points. Show your work.
h. For the function , determine two points on the graph and calculate the slope between
the two points. Show your work.
i. How is the slope of a function represented in the function rule?
j. Consider the equations and . Explain how you can determine the slope for each equation.

Copyright © 2013 National Math + Science Initiative, Dallas, Texas. All rights reserved. Visit us online at www.nms.org.6
Mathematics—Slope Investigation


