
National IQ and National Productivity: The Hive Mind ...
17
Garett Jones is BB&T Professor for the Study of Capitalism at the Mercatus Center, and Associate Professor of Economics at the Center for Study of Public Choice at George Mason University. National IQ and National Productivity: The Hive Mind Across Asia Garett Jones Center for Study of Public Choice Department of Economics George Mason University January 2011 [Published in Asian Development Review, June 2011] Abstract A recent line of research demonstrates that cognitive skills—IQ scores, math skills, and the like— have only a modest influence on individual wages, but are strongly correlated with national outcomes. Is this largely due to human capital spillovers? This paper argues that the answer is yes. It presents four different channels through which intelligence may matter more for nations than for individuals: 1. Intelligence is associated with patience and hence higher savings rates; 2. Intelligence causes cooperation; 3. Higher group intelligence opens the door to using fragile, high- value production technologies, and 4. Intelligence is associated with supporting market-oriented policies. Abundant evidence from across the ADB region demonstrating that environmental improvements can raise cognitive skills is reviewed.
Transcript of National IQ and National Productivity: The Hive Mind ...
Garett Jones is BB&T Professor for the Study of Capitalism at the Mercatus Center, and Associate Professor of Economics at the Center for Study of Public Choice at George Mason University.
National IQ and National Productivity: The Hive Mind Across Asia
Garett Jones
Center for Study of Public Choice Department of Economics George Mason University
January 2011 [Published in Asian Development Review, June 2011]
Abstract
A recent line of research demonstrates that cognitive skills—IQ scores, math skills, and the like—have only a modest influence on individual wages, but are strongly correlated with national outcomes. Is this largely due to human capital spillovers? This paper argues that the answer is yes. It presents four different channels through which intelligence may matter more for nations than for individuals: 1. Intelligence is associated with patience and hence higher savings rates; 2. Intelligence causes cooperation; 3. Higher group intelligence opens the door to using fragile, high-value production technologies, and 4. Intelligence is associated with supporting market-oriented policies. Abundant evidence from across the ADB region demonstrating that environmental improvements can raise cognitive skills is reviewed.

I. INTRODUCTION Within Asia, average intelligence quotient (IQ) scores differ dramatically across countries,
from only around 80 points in South Asia to nearly 110 points in East Asia. This span is large: within a country, one standard deviation is defined as 15 IQ points. This paper argues that this is no mere epiphenomenon. Building upon conventional results in psychology and economics, it will be argued that intelligence matters far more for national productivity than it does for individual productivity and that group intelligence—a Hive Mind—is more important than individual intelligence. If true, then development policies that can increase average national intelligence should have much larger effects than one would predict from routine wage regressions.
National average IQ has a strong positive correlation with gross domestic product (GDP) per worker across Asian countries (Figure 1). Jones and Schneider (2006) demonstrated that the relationship between national IQ and economic performance is robust across hundreds of growth regressions controlling for dozens of widely used control variables. One could tell a similar story about large cross-country skill gaps by using the international math and science achievement test scores favored by Hanushek and his coauthors (1995, 2000, 2010). Nonetheless, there are real advantages to talking about IQ since first, IQ estimates are available for more countries; and second, there is a rich literature in psychology on the causes, correlates, and effects of IQ scores. When talking about IQ, we have a chance to look inside the black box, thanks to a century of research in the field of intelligence testing.
Figure 1. National Average IQ and log GDP per Capita across ADB Member Countries
AUS = Australia; PRC = People’s Republic of China; HKG = Hong Kong, China; INO = Indonesia; IND
= India; JPN = Japan; KOR = Republic of Korea; MAL = Malaysia; THA = Thailand; PAK = Pakistan; PHI = Philippines.
Note: Non-ADB members within Asia and Oceania are also included. Sources:Data from Penn World Tables Version 6.1 and Lynn and Vanhanen (2006).
It is reasonable to be cautious about claims that IQ has a major influence on national
productivity. After all, a large labor economics literature shows that IQ and other testable skills have only modest correlations with wages at the individual level. Whether we look in developing or
developed countries, the story is the same: a 1 standard deviation increase in cognitive skills (15 IQ points) within a country is associated with about a 15 percent increase in wages, perhaps less.
For instance, Alderman et al. (1996) found that in rural Pakistan, those who perform 1 standard deviation better on an abstract visual pattern-finding IQ test—the Raven’s matrices—earned 13 percent more. One should draw two lessons from this result. First, the intelligence tests widely derided in popular culture as being culturally biased nevertheless have the power to predict economic outcomes in one of the poorest regions in Asia. Second, this 13 percent effect is still far too small to explain poverty in South Asia. If differences in cognitive skill are important drivers of national economic outcomes, cognitive externalities must be large.
Jones and Schneider (2006 and 2010) provide evidence for this. They found that across countries, the IQ–productivity relationship is much larger: 15 IQ points is associated with a 150 percent increase in productivity. Perhaps this strong relationship is epiphenomenal but the psychology, economic growth, and behavioral public choice literatures all give reason for thinking otherwise. There are good reasons for thinking that intelligence—the name used for the underlying trait measured by IQ tests—matters more for nations than for individuals. For instance:
1. Intelligent individuals tend to be more patient, and growth theory predicts that patient
nations will save more, building up a larger capital stock in a closed-economy world. 2. Behavioral economics experiments show that high IQ players are more cooperative in
repeated prisoner’s dilemma, trust, and public goods games. Since trust and trustworthiness are key to holding together wealth-creating institutions, intelligence will cause prosperity through public choice channels.
3. Skill complementarities may be important in producing “O-Ring” forms of fragile, delicate output. If so, then small differences in worker skill may cause massive differences in cross-country productivity.
4. According to Caplan and Miller (2010) high-IQ individuals appear more likely to support pro-market, pro-trade policies. Thus, more intelligent voters are more likely to see the invisible hand, supporting policies that create prosperity.
The paper begins with a brief discussion of modern intelligence testing, then turns to a
counsel of hope: sound reasons from modern research for believing that the environment, broadly construed, has an influence on intelligence. Each of the four potential channels linking IQ to productivity, channels that create the “Hive Mind”, are outlined. These channels provide reasons why intelligence may matter little for individuals but massively for groups. Of course, the relative importance of the four channels may vary from country to country. Evidence provided in public health and psychology literatures is presented to prove that national average IQ is not etched in stone. And finally, the simplest way to raise national average IQ is presented.
However, this essay is not primarily about what causes IQ but rather it is about what IQ causes. If any of these four channels are important, then policymakers should include measures of national average IQ when reporting a nation’s level of human development. At present, no nation appears to do so. The paper concludes with a nontrivial call for future research on this genuinely neglected subject.
II. WHAT IS INTELLIGENCE?
To an economist, the most important fact to know about mental abilities is that across large populations, different mental abilities are positively correlated.1 In other words, people who are above average in arithmetic tend to perform above average in vocabulary tests, block puzzles, as well as in memorizing lists of numbers and then repeating them in reverse order. This positive correlation conflicts with the commonsense view that abilities are negatively correlated, that for instance while some people are good in math, others are good in verbal tasks.
This positive correlation is at the heart of the psychological concept of intelligence. Quantitatively, it is at the heart of psychometric methods that extract a principal component from a broad variety of mental ability subtests. This principal component is formally called g, or the g factor. Lay persons, and most routine psychological research, refer to IQ instead of g, but it is worth keeping the concept of g in mind. Across thousands of studies on the correlation across mental abilities across populations, no one has yet found a reliable negative correlation.
This fact should strengthen our priors when we come across new mental tasks and we ask ourselves, “Will high IQ groups be better than average at this new mental task?” For every mental task so far that involves any level of sophistication, the answer has been yes.
A. What are the Physiological Correlates of Intelligence?
The psychometric literature on intelligence testing has exploded in recent decades, with
magnetic resonance imaging (MRI), positron emissions tests (PET scans), and electroencephalogram testing confirming that individuals with high IQs tend to have larger, more efficient brains.
First, on the matter of brain size, it is now unquestioned that people who do best on formal intelligence tests also tend to have larger, heavier brains, a once-mocked claim now confirmed with in vivo MRI tests, with IQ and brain size correlations of between 0.3 to 0.4 (Deary 2001, Hunt 2011). High-IQ brains also react more quickly to stimuli. Multiple studies have shown that IQ is positively correlated with multiple measures of nerve conduction velocity. The simplest example: A light flashes in front of your eyes, and a machine measures how long it takes for the message to reach the vision centers in the back of your brain. This speed is correlated (0.4) with a person’s IQ.
These kinds of results should eliminate claims that IQ is merely a measure of acculturation. Instead, IQ measures something much more like processing speed. It is not a 100 percent accurate measure of processing speed. It is an indirect measure rather than a direct measure. Using an IQ test to measure processing speed is akin to measuring processing speed by using a computer for an hour or two rather than precisely counting millions of instructions per second.
Further, it is entirely unclear whether the cognitive correlates of IQ are mere outgrowths of the underlying processing speed (as faster computers routinely run a variety of software more efficiently) or instead reflect separate mental skills that are routinely bundled together with high processing speed (as faster computers are often bundled with better graphics cards). But for our purposes, the positive correlation across skills can be taken as a given.
B. Other Correlates of Intelligence
Intelligence and patience are positively correlated. Since this robust relationship will play a
major role in the argument below, a brief literature review is in order. Shamosh and Gray (2008),
1Inter alia, see overview volumes by Jensen (1998) and Hunt (2011). For excellent short surveys of modern intelligence research, a consensus
statement by the American Psychological Association (Neisser et al. 1996) is available online, while Deary (2001) is also highly recommended.

two Yale psychologists, summed up 2 dozen studies and found that in almost every study, high IQ is associated with patience, as measured in a variety of methods. The classic example is Walter Mischel’s experiment of a child waiting for marshmallows. In this experiment an experimenter puts a child in a room, puts a marshmallow in front of the child, and tells her that if she leaves the marshmallow untouched until the experimenter returns, she will get a second marshmallow. The experimenter then leaves the room, not returning until the child finally eats the marshmallow.
“Minutes until marshmallow” has been shown to be a reliable predictor of many life outcomes—but it is also highly correlated with IQ (inter alia Shoda, Mischel, and Peake 1990). There are many other ways of measuring the correlation between IQ and impatient behavior—offering $1 tomorrow versus $2 in a week, or whether a person smokes, to name two common examples—and the correlation is almost invariably in the same direction.
Economists have begun confirming this already stylized fact using their preferred methods. Benjamin, Brown and Shapiro (2006) found that high cognitive ability is correlated with low degrees of hyperbolic discounting as well as low levels of long-term discounting. Warner and Pleeter (2001) found that among enlisted service members in the United States military, high IQ is associated with low discount rates. In a study of German citizens, Dohmen et al. (2010) found that high IQ is associated with low time preference, both in hypothetical-money and in real-money conditions.
Another positive correlation is between IQ and risk tolerance. This shows up in standard experimental settings with hypothetical or real choices over lotteries (Al-Ubaydli, Jones, and Weel 2011b). It also shows up in one person’s tendency to invest in stocks, holding income and other observables constant (Dohmen et al. 2010).
The following are a few more routine correlates of intelligence. IQ tests are among the best predictors of good job performance, with meta-studies showing that IQ tests perform as well as a structured interview or actual work samples at predicting job performance. Similarly, IQ is also a better predictor for more technical jobs, and IQ is a better predictor of job performance than a conventional, unstructured job interview (Jones and Schneider 2006, and citations therein). Overall, intelligence is associated with a variety of positive economic outcomes.
C. Does National Average IQ Differ Across Asia?
IQ tests have been given across Asia for decades. Many of these tests have been standardized
for Asian populations using large samples. For instance, the Raven’s Progressive Matrices, a private-sector, visual pattern-finding IQ test now widely used in experimental economics, was standardized for India with students from 49 schools in Pune (Deshpande and Ojha 2002, cited in Tupe and Chiplonkar 2002). The private-sector tests require representative samples so that, for instance, psychological professionals can diagnose students as mentally gifted, cognitively impaired, or somewhere in between; so there is a financial incentive to standardize these tests. Further, Rindermann (2007) has shown that these national IQ estimates are reliably correlated with the other international math and science tests for which, regrettably, a smaller number of national estimates exist.
Thus, we can have some confidence in claims about average IQ in many Asian countries. Japan and India have been the most heavily studied, and these two nations are near the extreme within Asia. Three national average IQ databases now exist: Lynn and Vanhanen (2002 and 2006), and Lynn and Meisenberg (2010), referred to as “Lynn’s IQ data” hereon. These IQ estimates have been used repeatedly in the psychology and the economics literatures. Recently, Lynn’s IQ data were used in the medical literature in demonstrating a positive correlation between national average IQ and infectious disease prevalence, a correlation that held even after controlling for numerous controls (Eppig, Fincher, and Thornhill 2010).

Lynn’s national average IQ estimates all draw upon published studies. Some studies are mere opportunity samples of typical classrooms; others are systematic samples of a thousand or more students designed to calibrate the first and second moments of an existing IQ test in a new population, or of a new test in a well-tested population. In his recent estimates of national average IQ, he typically has more than one representative study (often many more), and he uses the median score as the national estimate. Lynn’s national average IQ data have been used repeatedly, despite the fact that he is a lone researcher who, with the help of two coauthors, has taken on a monumental task.
Lynn has become the Angus Maddison of national IQ statistics; and just as the popularity of Maddison’s work (inter alia, Maddison 1991) ultimately inspired the creation of large-scale cross-country GDP estimating programs like the canonical Penn World Tables, so too, one can hope that the popularity of Lynn’s data spurs an international effort to assemble rigorous, representative estimates of national average IQ, its higher moments, and its factor structure. For most countries, the task should be simple as the raw data—IQ tests—are surely sitting in filing cabinets in elementary schools around the world.
Within ADB member countries, the IQ pattern is relatively simple: highest on average in the northeast, and gradually declining as one moves south and west toward India. The average IQ differences, as noted above, are modest, with a range of 28 IQ points and a standard deviation of 10.1 IQ points. These modest differences show up in wages as well when immigrants from different countries work in the same country, the US: Immigrants from ADB member countries to the US have only modest differences in wages when averaged by nation of origin (Jones and Schneider 2010), on the order of 20–30 percent. So the puzzle of how something that matters little for individuals can matter so much for groups remains.
D. Environmental Influence on IQ: Evidence from Asia
Thus far, most of the IQ studies cited have been run in the developed Western countries. But
there is a vast public health literature on environmental correlates of intelligence, and many of these papers study nations in Asia. A study of excessive fluoride in Indian drinking water found a 13 IQ point-difference between children “residing in two [separate] village areas of India with similar educational and socioeconomic conditions” (Trivedi et al. 2007, 178). If even half of this relationship is genuinely causal, and if intelligence has some of the technological and political spillover effects discussed below, then public health matters are of first-order concern for economic development.
Arsenic and fluoride exposures are also associated with low IQ in the People’s Republic of China’s (PRC) Shanxi province (Wang et al. 2007, 664), even when comparing “groups [who] lived in rural areas with similar geographic and cultural conditions and a comparable level of socioeconomic development.” High arsenic exposure was associated with a 10-point IQ gap, and high fluoride exposure with a 4-point gap. In both cases, the “normal” group had an IQ of 105, 5 points above the US mean.
In the Visayas region of the Philippines, Solon et al. (2008) found evidence that lead levels reduced the IQ of children. In their study, one microgram of lead per liter of blood was associated with a 2.5 point reduction in the verbal IQ of older children, and a 3.3 point reduction in the IQ of young children. In their sample of children, the levels of lead in the blood averaged 7.1 micrograms per liter, so lead exposure could be costing the average child in this sample 15 IQ points even under conservative estimates.
In an experimental nutritional study in Pune City, India, 10 weeks of zinc supplementation caused a 15–25 percent increase in the number of correct answers on the Raven’s Progressive Matrices (Tupe and Chiplonkar 2009).

And “the first systematic study of effects of [arsenic] on children’s intellectual function” in Bangladesh shows the limitations of IQ testing in a world without adequate standardization (Wasserman et al. 2004, 1329). While the authors find a strong negative relationship between arsenic concentration in local well water and children’s IQ, the authors are reluctant to make statements in terms of IQ points. Even after deciding to give their subjects only the portions of a conventional Wechsler IQ test that seemed culturally appropriate, they still chose to make substitutions to reduce cultural barriers: “mango” for “apple,” “flute” for “piano,” and the like. They close the paper with a call for experts to standardize an IQ test for Bangladeshi norms, so that public health experts can know whether the effect of arsenic on IQ is genuinely large.
Environmental health risks to IQ appear too big to be ignored in developing countries. Poor nutrition poses IQ risks. These links between nutrition and cognitive development are already well known in the development literature. Behrman, Aldermann, and Hoddinot’s (2004) Copenhagen Consensus challenge paper demonstrates the many ways in which maternal and child health appear to contribute to intelligence scores: iodine and iron deficiencies appear to pose particularly large risks to cognitive development.
It is also possible that education itself influences IQ. Winship and Korenman (1997) found that in natural experiments in developed countries students with more exogenous education, through the effects of war or racial segregation, had higher IQs, on the order of 1 to 4 points per year of schooling. Is this proof that education raises intelligence?
Trivially, education can influence IQ by just exposing students to the cultural referents common in some IQ tests—the pianos and apples mentioned above. Such increases are rarely of interest to psychologists and economists. Consider this reductio: one particular method that could be highly successful for raising IQ scores would be to give students the answer key beforehand. If we think in terms of a g factor, then we will quickly see the possible link between giving students an answer key and giving them extra education. The goal in raising IQ is to raise general problem solving ability, not simply to increase scores on a particular kind of test.
This brings us to the matter of “hollow IQ.” An unexplored question is whether the gains in IQ associated with schooling, discussed in Winship and Korenman (1997), are examples of what is formally known as “hollow IQ gains.” Hollow IQ is already well documented in some contexts. Jensen (1991), for instance, shows that if students practice on one particular portion of an IQ test, they can become much better at that portion: But that training does not cause higher scores on other IQ subtests. We do not yet know whether gains associated with education are broad-based or hollow, whether they apply to the more abstract portions of an IQ test or whether they apply merely to the more culturally bound portions. This is a question that certainly deserves further research.
E. The Rising Trend in IQ: The Flynn Effect
The Flynn Effect is the well-documented, long-term increase in IQ scores on the order of 2–3
points per decade. The Flynn Effect—so named in the book The Bell Curve (Herrnstein and Murray 1994)—provides strong evidence that IQ scores are not invariably fixed for any large group of people. Discovered by the philosopher (sic) James Flynn (1987 and 2007) in the 1980s, exactly what the Flynn Effect means is a subject of continuing debate. In economists’ terms, is it evidence of “real” or only “nominal” increases in IQ? The Flynn Effect is well documented in developed countries, but research in the developing world has been less thorough.
Flynn himself, in a recent book (2007), has argued on the grounds of casual empiricism that the Flynn Effect must be a merely nominal increase in test scores, not a real increase in overall, real world intelligence. He argues that modern life has become more like an IQ test, with more

opportunities for systematic thinking, categorizing, dividing and uniting concepts, and other tasks that appear prominently in IQ tests.
Some other researchers have disagreed. Lynn (2009) surveyed the evidence from studies on toddlers’ IQs and concludes that the Flynn Effect’s long-term increases in measured intelligence show up by the age of 3, creating difficulties for stories that rely on years of practice and formal schooling. The Flynn Effect shows up as early as we can measure intelligence, and is not a gap that emerges slowly as a child grows and receives education. Lynn concludes that early childhood nutrition and prenatal nutrition are the likely causes of the Flynn Effect.
One question that has occupied psychometricians is whether the Flynn Effect increases scores on all IQ subtests about equally, or whether it shows up disproportionately on the subtests that are typically most highly correlated with overall IQ. In other words, is the Flynn Effect highly correlated with the g factor? In the literature, if it is so correlated, it is called a Jensen Effect. The debate on this question is lively, but of second order importance for our purposes. Some papers find a strong Jensen Effect in some countries, while others do not. But what the literature does not find is evidence of an “anti-Jensen effect”—the score increases are not systemically occurring on the parts of the IQ test that are least correlated with overall IQ.
Regrettably, economists have not yet performed empirical studies on the Flynn Effect. However, the research methodology of Howard (2001) might serve as a spur to future research. He found that chess masters have become younger over the decades. This objectively measurable form of productivity might be a template for others.
Systematic work with sample sizes large enough to establish statistical significance could demonstrate whether the Flynn Effect has been quantitatively large enough in developing ADB member states for there to be IQ convergence across countries in coming decades.
As argued in Jones and Schneider (2010), in the rapidly growing economies of East Asia one might have expected massive convergence from low IQs to high IQs as nations escaped poverty. However, as Figure 2 shows, these nations both started and ended the period with estimated IQs above 100, well above the lowest scores in other ADB member countries. So simple reverse-causation stories of national IQ depending on GDP per capita fail to fit the data.

Figure 2. IQ in East Asia, 1959–2003
HKG = Hong Kong, China; JPN = Japan; PRC = People’s Republic of China; SIN = Singapore; SKO =
South Korea; TAP = Taipei, China. Numbers (e.g., TAP1, TAP2) demarcate separate studies. Sources: Data from Lynn and Vanhanen (2002), and Jones and Schneider (2010).
II. INTELLIGENCE, PATIENCE, AND CAPITAL ACCUMULATION Modern optimizing macroeconomics begins with the Ramsey growth model, where time
preference plays a large role. If national average IQ differs across countries, and if the IQ–time preference relationship discussed by Shamosh and Gray (2008) holds across countries, then the Ramsey model makes a strong prediction. That is, in a closed-economy world, high-IQ countries will save more and have larger ratios of capital to output. Jones and Podemska (2010) provide evidence that this theoretical prediction holds true in practice. They found that the correlation between national IQ and a nation’s capital–output ratio is 0.64.
Further, in an open-economy world, the Ramsey model predicts that high-IQ countries will ultimately own all of the world’s capital (Barro and Sala-i-Martin 2003). In the modern world, presumably somewhere between those two extremes, we might expect high-IQ countries to hold, at the least, a disproportionate share of the world’s globally traded low-risk assets. And that is indeed the case. Since the mid-1990s, when reliable data first became available, a nation’s average IQ has been positively correlated with the ratio of US Treasuries to that nation’s nominal GDP (Jones and Podemska 2010). In 2007, the correlation between national IQ and that nation’s Treasury–GDP ratio was 0.39, and the relationship remained statistically significant when controlling for log GDP per capita.
As long as East Asian countries (and Singapore) continue to have the world’s highest average IQs—not a foregone conclusion, to be sure—conventional growth theory predicts that these countries will hold a disproportionate share of the world’s globally traded low-risk debt. The predictions of theory hold in the data—indeed, the empirical relationships are actually stronger than conventional theory predicts, as demonstrated in Jones and Podemska (2010). The reasons for such a strong macro relationship deserve further attention, but peer effects on saving are one possible channel; and if IQ drives institutional quality then saving may be more dangerous or difficult in a nation with weak economic institutions. In any event, the theoretical channel running
from cognitive skill to patience to physical and financial capital intensity is supported in the cross-country data.
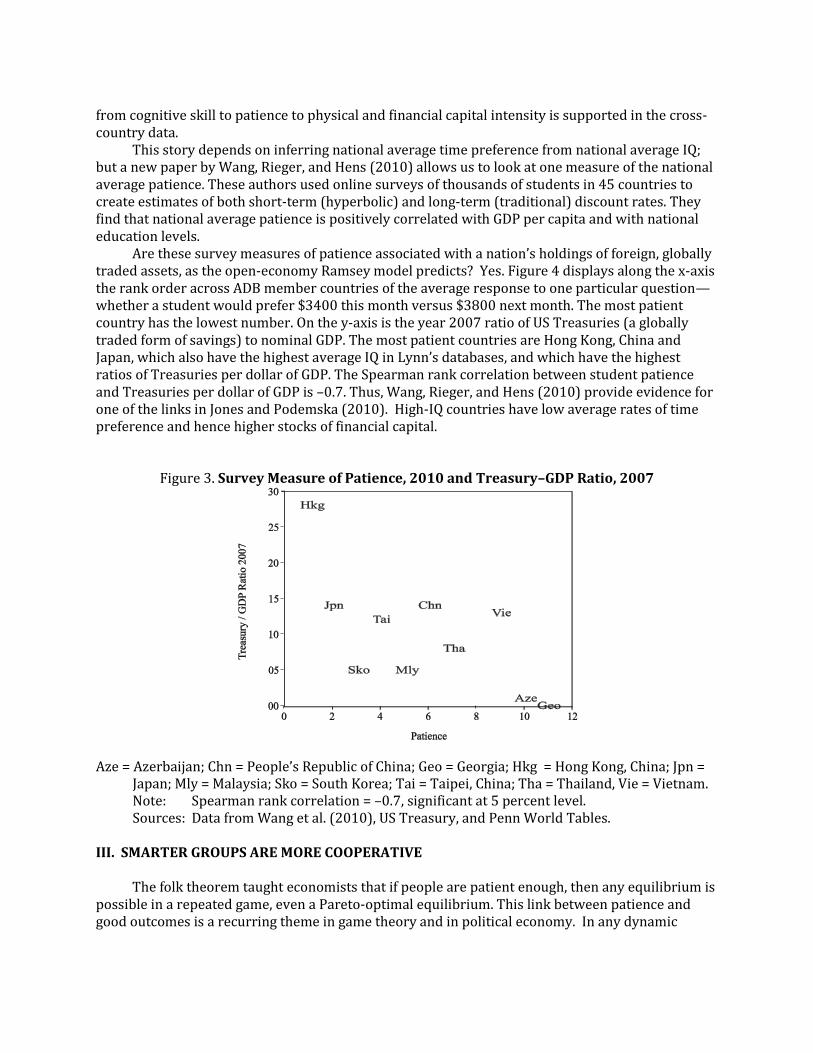
This story depends on inferring national average time preference from national average IQ; but a new paper by Wang, Rieger, and Hens (2010) allows us to look at one measure of the national average patience. These authors used online surveys of thousands of students in 45 countries to create estimates of both short-term (hyperbolic) and long-term (traditional) discount rates. They find that national average patience is positively correlated with GDP per capita and with national education levels.
Are these survey measures of patience associated with a nation’s holdings of foreign, globally traded assets, as the open-economy Ramsey model predicts? Yes. Figure 4 displays along the x-axis the rank order across ADB member countries of the average response to one particular question—whether a student would prefer $3400 this month versus $3800 next month. The most patient country has the lowest number. On the y-axis is the year 2007 ratio of US Treasuries (a globally traded form of savings) to nominal GDP. The most patient countries are Hong Kong, China and Japan, which also have the highest average IQ in Lynn’s databases, and which have the highest ratios of Treasuries per dollar of GDP. The Spearman rank correlation between student patience and Treasuries per dollar of GDP is –0.7. Thus, Wang, Rieger, and Hens (2010) provide evidence for one of the links in Jones and Podemska (2010). High-IQ countries have low average rates of time preference and hence higher stocks of financial capital.
Figure 3. Survey Measure of Patience, 2010 and Treasury–GDP Ratio, 2007
Aze = Azerbaijan; Chn = People’s Republic of China; Geo = Georgia; Hkg = Hong Kong, China; Jpn =
Japan; Mly = Malaysia; Sko = South Korea; Tai = Taipei, China; Tha = Thailand, Vie = Vietnam. Note: Spearman rank correlation = –0.7, significant at 5 percent level. Sources: Data from Wang et al. (2010), US Treasury, and Penn World Tables.
III. SMARTER GROUPS ARE MORE COOPERATIVE
The folk theorem taught economists that if people are patient enough, then any equilibrium is
possible in a repeated game, even a Pareto-optimal equilibrium. This link between patience and good outcomes is a recurring theme in game theory and in political economy. In any dynamic
model, there’s a role for time preference, and the story is always the same: more patience makes it possible for players to get closer to the Pareto outcome.
One example that is familiar to macroeconomists is the reputation-based solution to the time inconsistency of optimal monetary policy (or capital taxation policy, rent-seeking, or other policies where short-run temptation is likely). In this world, the more patient a central banker is, the more willing he/she is to spend years building a reputation as an inflation hawk, because to the patient banker, the possibility of a far-off inflationary boom sounds richly rewarding. By contrast, an impatient central banker will only be willing to fake it for short periods before defecting to high inflation (cf., Romer 2006).
There may be other channels driving high-IQ groups toward Pareto optimality in game theoretic settings. For one, high-IQ players are more likely to simply understand the rules of the game. And as Axelrod (1984) noted in his canonical text, The Evolution of Cooperation, understanding the rules is key to reaping the highest possible reward. As anyone who has taught game theory knows, the insights of Nash equilibrium, the folk theorem, and subgame perfection are often quite difficult to grasp—and this may be true in real life as well as in the classroom.
Finally, as noted above, a routine finding in psychology and behavioral economics is that intelligence is associated with risk tolerance (inter alia, Frederick 2005). Since trust is inherently risky, this is yet another possible channel through which intelligence could cause cooperation. The simplest example would be a one-round stag hunt, where one would predict that high-IQ players would be more likely to play the risk-dominant stag equilibrium over the payoff-dominant rabbit equilibrium. This particular experiment is yet to be run.
So there are at least three sound a priori reasons for thinking that intelligent groups will be more cooperative. But does this hold empirically?
Experimental research finds that the answer is yes. The first paper to show that high-IQ groups of anonymous players are more likely to cooperate is Jones (2008). The canonical trust game for decades was the repeated prisoner’s dilemma (RPD), a game played at dozens of universities around the world. With the help of a research assistant, Jones collected data from dozens of RPD studies in the United States, and then collected data on the average SAT and ACT scores at those schools (Jones 2008). Even after controlling for experiment-specific elements, such as playing for cash; seeing the player; whether the school was private or public; the average admissions score was found to be a reliable predictor of cooperation. 100 more SAT points were associated with 5–8 percent more cooperation. Since IQ is highly correlated with SAT scores—it is indeed a de facto IQ test for students who have attended adequate high schools—then this paper provides the first substantial evidence that smarter groups are more cooperative.
Later experiments have reinforced the meta-experimental finding of Jones (2008). Burks et al. (2009) found that high-IQ students at a truck driving school were more likely to trust and to be trustworthy in a sequential prisoner’s dilemma. Putterman et al. (2010) found that high-IQ individual players were more likely to contribute generously to early rounds of a multi-round public goods game, and ultimately contributed more overall. Both of these papers thus provide evidence of a fourth specific channel through which intelligence can create cooperation: high-IQ players are more likely to play nice, and so spur the norm of reciprocity by starting off with generosity.
Three of these channels—patience, perceptiveness about the rules of the game, and pleasantness (trust) at the beginning of a game—are specifically mentioned in Axelrod’s (1984) classic book The Evolution of Cooperation. He recommends that people follow what one might call these “3 Ps of the PD.” It turns out that high-IQ groups are already doing just that. In unpublished RPD experiments Jones, Al-Ubaydli, and Weel (2011a), have confirmed that the IQ of a pair of players is five times more important than the IQ of an individual player in creating cooperation, so cooperation is an emergent phenomenon.
How can this matter for a national economy? Camerer and Fehr (2006) remind us that the prisoner’s dilemma is a canonical tale of exchange in a world without enforceable contracts. If each of two parties has a choice between offering a high-quality versus a low-quality product in a one-time-only exchange, and the offerer values the product less than the recipient, then the two parties face a prisoner’s dilemma. The one-shot equilibrium is simple: both parties offer a low-quality product. Since real-world contracts are expensive to enforce, norms of trust and more importantly, trustworthiness are solutions to this dilemma.
But political interactions likewise are often prisoner’s dilemmas: The decision of two political parties to offend their extreme wings in order to raise the odds of peace and prosperity, the decision of the Montagues and Capulets to declare a truce and respect the abstract rule of law rather than pursue revenge, the decision of the various branches of the military to decide against a coup that might benefit their branch—all are examples of trust and trustworthiness in a dynamic, contract-free world.
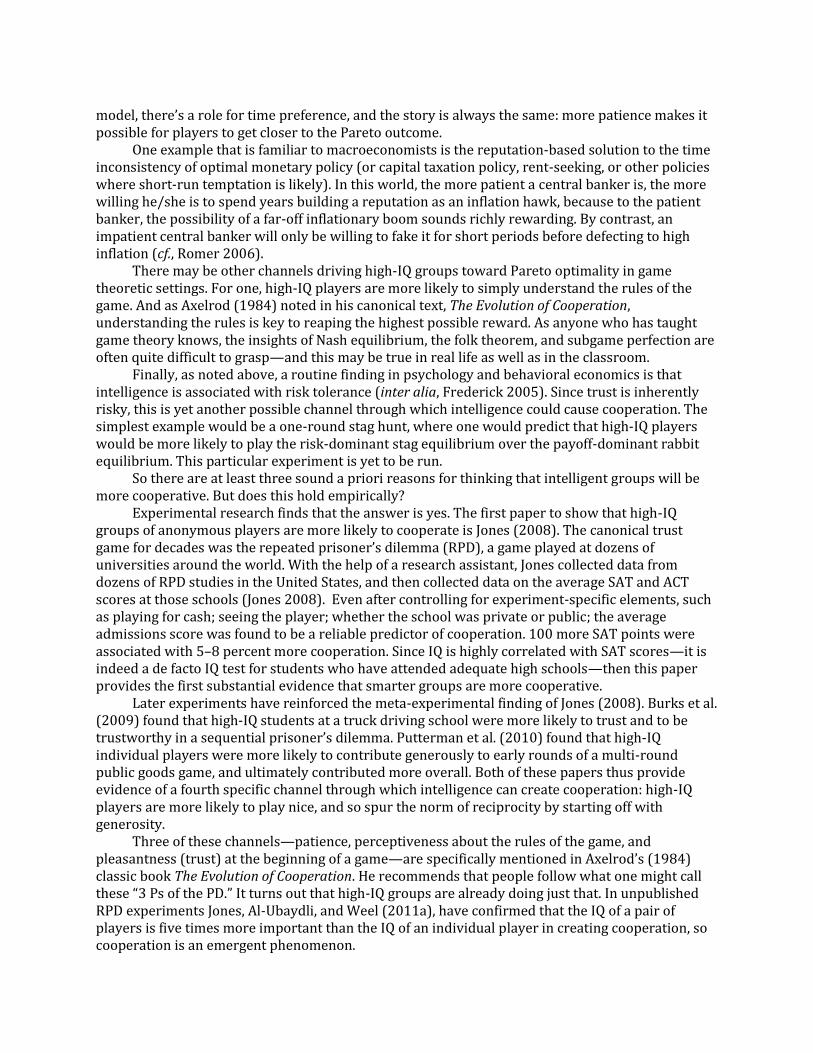
Figure 4 shows that within Asian countries, this positive relationship holds between IQ and a measure of overall institutional quality, the Doing Business Index, just as one would expect from these experimental results. Surely other forces correlated and uncorrelated with national average IQ help to shape institutions, but theory, experiments, and cross-country correlations all point in the same direction. Thus, differences in national intelligence are likely drivers of differences in political institutions and social norms that drive national prosperity.
Figure 4. National IQ and Institutional Quality
Note: 1 IQ point is associated with a nation’s rising 3.8 countries higher in this global ranking of
nations by institutional quality, R2 = 52 percent. Smaller numbers indicate higher rankings. Sources: Data from World Bank and Lynn and Vanhanen (2006).
IV. MODERN OUTPUT: SPACE SHUTTLES, COMPUTER CHIPS, AND DRESSES
Kremer’s (1993) widely cited paper, “The O-Ring Theory of Economic Development”, has yet
to be fully integrated into macroeconomic thinking. He begins with a seemingly obvious point:

looking around at common forms of rich-country economic output, he notices that often, one small error in the production process can drastically destroy the value of final output. An excellent restaurant meal sits under the heat lamp for five minutes; the O-rings on the space shuttle Challenger are too cold for too long; one sleeve is an inch shorter than another on an otherwise beautiful high-end dress—in every case, one error can destroy the value of the output.
Kremer (1993) takes this point about the nature of production—errors along the way in a production process can substantially reduce the value of output—and draws a surprising conclusion. That is, workers will endogenously sort themselves into different firms, with high-skill workers together at the best firms, and low-skill workers at the weakest firms. This turns out to be an output-maximizing solution, and his theoretical achievement is to show that this is a market equilibrium as well.
A simple example should suffice. Consider an economy with four workers, two of whom have quality = 1, and two of whom have quality = 0.5. There is one production technology that involves two steps, and firm-level output is produced like this: Y = q1q2 where qi represents the quality of an individual worker. Thinking in probability terms, qi might represent the probability that a worker drops a vase before handing it to the next worker.
Let us calculate total output if workers sort by quality versus if firms each hire a high-quality and a low-quality worker. In the quality-sorting condition, the high-quality firm produces 1 unit of output, the low-quality firm produces (0.5)2 units of output, so GDP = 1.25. In the nonsorting condition, each firm produces 1*0.5 = 0.5 units of output, so GDP = 1. Thus, the quality sorting of workers raises GDP by 25 percent. This is only a two-step production chain. With longer, more realistic production chains, Jones (2010) shows that even small differences in worker quality can generate massive differences in productivity.
If a substantial fraction of modern output is created using these “O-Ring” production functions, this helps explain why with small differences in worker quality across countries, differences that might not seem to matter much at the individual level, can drive massive productivity differences across countries. In a separate theoretical paper, “The O-Ring Sector and the Foolproof Sector”, Jones (2010) show how this can coexist with small returns to skill within a country. But for our purposes, the message from Kremer’s original paper is enough, and is still underappreciated: A substantial portion of modern production methods are far from the typical Cobb-Douglas specification where average worker skill is plugged into a diminishing-returns production function. In an O-Ring world, the skills of the best workers matter enormously, as long as they are allowed to endogenously sort into their own firms.
A glance at the highest-profile outputs of Asian economies will show that O-Ring production functions are important. A Google scholar search for “quality ladder” and “Asia” returned 671 papers or books on the theme, 268 of which also mention “human capital.” So economists have been thinking about the links between human capital and output quality—but when micro-level regressions find such a small effect of human capital on output, it has been difficult to explain large cross-country differences in productivity by appeals to human capital, at least as long as we view national economies in a conventional Cobb-Douglas economic framework.
If O-Ring production functions are important, then increases in worker quality may have much higher payoffs than expected from routine wage regressions—and decreases in worker quality may be more costly than expected. After all, in an O-Ring world, lower worker quality means a multiplicative increase in errors across the spectrum of production, which probably means shifting to much safer production methods far from the cutting edge of technology. A low-average-IQ workforce likely means making products destined for the bargain bin at Carrefour.

V. IQ AND PROMARKET BELIEFS In his book Myth of the Rational Voter (2007), Caplan showed that well-educated voters in the
US were more likely to agree with economists on a wide range of economic policy matters. If economists really do know more about creating good economic outcomes than the typical person, then better-educated voters will tend to support genuinely better economic policies.
That is a story about education but what about intelligence? In a new paper, Caplan and Miller (2010), using a vocabulary test as an IQ measure and opinion data from the General Social Survey, discover that intelligence is an even better predictor of promarket attitudes than education. A vocabulary test is a plausible IQ proxy. The widely used Wechsler Adult Intelligence Scales (WAIS) contains a vocabulary test as one of its subtests, and it has a high correlation with overall IQ.
Caplan and Miller’s work has not yet been extended across countries. But the cross-country literature on the political economy of trade has used some correlates of IQ—usually an index of “worker skill”—and so are worthy of mention. For instance, O’Rourke and Sinnott (2006) note that in the vast majority of countries, high-skilled workers are more supportive of trade than low-skilled workers. However, they find that within the very poorest countries, the relationship between an individual worker’s skill and her views on trade tends to be weaker, and there is modest evidence that the relationship could reverse in the poorest countries.
Still, these worker skill measures are proxies for the mixture of education and IQ that could be driving this relationship. Moreover, these narrow tests of trade attitudes are only proxies for a larger battery of views on economic policies. Thus, it would of great value to replicate Caplan and Miller’s results within many countries: Knowing whether broader promarket attitudes correlate positively with intelligence would help policy makers in developing countries quantify the size of some of the political externalities of human capital. Simple IQ tests, together with a battery of questions on promarket attitudes and some basic demographic questions, should be enough to provide substantial new information on this important issue in behavioral public choice.
VI. HOW TO RAISE IQ: IMMIGRATION In a recent paper, Putterman and Weil (2010) find that one can predict an economy’s GDP per
capita relatively well by tracking where that nation’s citizens came from. Citizens whose families came from Western Europe or East Asia tend to live in economies that today are very wealthy (with the People’s Republic of China as a major exception). Whether we are speaking of Canada or Singapore or Taipei, China this is true. Putterman and Weil did not attempt to establish precisely what bundle of attributes it is that immigrants bring with them that so helps to drive economic outcomes in their destination economy, but average IQ is one natural possibility. After all, we’ve seen that national average IQ is little changed by massive changes in GDP per capita across East Asia in recent decades—at best perhaps increasing slightly more than the conventional Flynn Effect adjustment. The persistence of average IQ across generations gives reason for believing that whether national IQ is driven by genes, environment, culture, or some poorly understood combination of the three, a group’s average IQ will largely survive immigration to another economy.
Even if scientists and public health officials quickly reach their limits in raising a person’s IQ—again, not a foregone conclusion—we still have a reliable tool for raising a nation’s IQ. Encourage immigration by individuals with higher average intelligence. Many countries implicitly do this by permitting high-skilled immigrants to enter and work legally. While it may be politically difficult to push for a high-average-IQ immigration policy, a high-skilled immigration policy that favors individuals with science and engineering degrees would accomplish much the same with almost none of the political difficulties. And if the political economy channels documented here are

quantitatively important, then important parts of political life in these countries will, on average, improve as well.
VII. CONCLUSION
In largely nontechnical terms, the paper surveyed the psychometric evidence showing that IQ
tests measure something substantial; that mainstream psychologists believe IQ persistently differs across economies; and that public health research indicates that IQ can be increased in the world’s poorest economies. The paper provided four channels, rooted in economic theory, through which intelligence could matter more for nations than for individuals. These are: (i) capital channel, (ii) cooperation channel, (iii) complementarity channel, and (iv) Caplan channel. Of course, for each of these channels, non-IQ factors may be important for explaining cross-country differences in productivity and institutions; the paper never claims otherwise. The paper claims that economists have almost entirely overlooked the evidence that persistent differences in national cognitive skills are likely to have impacts on the economy through these four channels.
As noted in the introduction, even if only one of the four channels of the Hive Mind is quantitatively important, this topic deserves additional attention from economists. Future work documenting whether IQ is robustly associated with patience within and across countries; and how the variance and kurtosis of mental skills impact political, social, and firm-level productivity, would be of substantial value for determining which channels are most important in which countries. And finally, it is time for international institutions to begin a Penn World Table-level effort to carefully document differences in general cognitive skill across countries and across time.
One can only hope that if intelligence spillovers are as important as this paper claims, then researchers across the disciplines will find practical ways to raise the intelligence of nations.
REFERENCES Alderman, H., J. R. Behrman, D. R. Ross, and R. Sabot. 1996. “The Returns to Endogenous Human Capital in
Pakistan's Rural Wage Labour Market.” Oxford Bulletin of Economics and Statistics 58(1):29–55. Al-Ubaydli, O., G. Jones, and J. Weel. 2011a. Intelligence, Patience, and Cooperation: An experimental study.
Unpublished working paper, George Mason University, Fairfax, Virginia. Al-Ubaydli, O., G. Jones, and J. Weel. 2011b. Patience, Cognitive Skill and Coordination in the Repeated Stag
Hunt. GMU Working Paper in Economics No. 11-11 (January), George Mason University, Fairfax, Virginia. Axelrod, R. 1984. The Evolution of Cooperation. New York: Basic Books. Barro, R. J., and X. Sala-i-Martin. 2003. Economic Growth, 2nd ed. Cambridge: The MIT Press. Behrman, J., H. Alderman, and J. Hoddinott. 2004. Copenhagen Consensus—Challenges and Opportunities:
Hunger and Malnutrition. Available: www.copenhagenconsensus.com/ Default.asp?ID=223.
Benjamin, D. J., S. A. Brown, and J. M. Shapiro. 2006. “Who is ‘Behavioral’? Cognitive Ability and Anomalous Preferences.” Unpublished. Available: ssrn.com/abstract=675264.
Burks, S. V., J. P. Carpenter, L. Goette, and A. Rustichini. 2009. “Cognitive Skills Explain Economic Preferences, Strategic Behavior, and Job Attachment.” Proceedings of the National Academy of Science (USA) 106(19):7745–50.
Camerer, C. F., and E. Fehr. 2006. “When Does “Economic Man” Dominate Social Behavior?” Science 311:47–52.
Caplan, B. 2007. The Myth of the Rational Voter: Why Democracies Choose Bad Policies. Princeton: Princeton University Press.
Caplan, B., and S. C. Miller. 2010. “Intelligence Makes People Think Like Economists: Evidence from the General Social Survey.” Intelligence 38(6):636–47.
Deshpande C. G., and J. M. Ojha. 2002. “Indian Norms for Raven’s Standard Progressive Matrices.” Unpublished. Manasayan, New Delhi.
Dohmen, T., A. Falk, D. Huffman, and U. Sunde. 2010. “Are Risk Aversion and Impatience Related to Cognitive Ability?” American Economic Review 100(3):1238–60.
Eppig, C., C. L. Fincher, and R. Thornhill, 2010. “Parasite Prevalence and the Worldwide Distribution of Cognitive Ability.” Proceeding of Royal Society B 277(1701):3745–53.
Flynn, J. R. 1987. “Massive IQ Gains in 14 Nations.” Psychological Bulletin 101:17–191. ———. 2007. What is Intelligence? Beyond the Flynn Effect. Cambridge: Cambridge University Press. Frederick, S. 2005. “Cognitive Reflection and Decision Making.” Journal of Economic Perspectives 19(4):25–42. Hanushek, E. A., and D. Kim. 1995. Schooling, Labor Force Quality, and Economic Growth. NBER Working
Paper No. 5399, National Bureau of Economic Research, Cambridge, Massachusetts. Hanushek, E., and D. D. Kimko. 2000. “Schooling, Labor Force Quality, and the Growth of Nations.” American
Economic Review 90(5):1184–208. Hanushek, E., and L. Woessman. 2007. The Role of School Improvement in Economic Development. NBER
Working Paper No. 12832, National Bureau of Economic Research, Cambridge, Massachusetts. Herrnstein, R. J., and C. A. Murray. 1994. The Bell Curve. New York: Free Press. Howard, R W. 2001. “Searching the Real World for Signs of Rising Population Intelligence.” Personality and
Individual Differences 30(6):1039–58. Hunt, E. 2011. Human Intelligence. New York: Cambridge University Press. Jensen, A. R. 1991. “Spearman's ‘g’ and the Problem of Educational Equality.” Oxford Review of Education
17(2):169–87. ———. 1998. The g Factor: The Science of Mental Ability. Westport: Praeger Publishers. Jones, G. 2008. “Are Smarter Groups More Cooperative? Evidence from Repeated Prisoners’ Dilemma
Experiments, 1959–2003.” Journal of Economic Behavior and Organization 68:489–97. ———. 2010. “The O-Ring Sector and the Foolproof Sector: An Explanation for Cross-country Income
Differences.” Unpublished. George Mason University, Fairfax, Virginia. Jones, G., and M. Podemska. 2010. “IQ in the Utility Function: Cognitive Skills, Time Preference, and Cross-
country Differences in Savings Rates.” Unpublished. George Mason University, Fairfax, Virginia. Jones, G., and W. J. Schneider. 2006. “Intelligence, Human Capital, and Economic Growth: A Bayesian
Averaging of Classical Estimates (BACE) Approach.” Journal of Economic Growth 11(1):71–93.

———. 2010. “IQ in the Production Function: Evidence from Immigrant Earnings.” Economic Inquiry 48(3):743–55.
Kremer, M. 1993. “The O-Ring Theory of Economic Development.” Quarterly Journal of Economics 108(3):551–75.
Lynn, R. 2009. “What Has Caused the Flynn Effect? Secular Increases in the Development Quotients of Infants.” Intelligence 37(1):16–24.
Lynn, R., and G. Meisenberg 2010. “National IQs Calculated and Validated for 108 Nations.” Intelligence 38(4):353–360.
Lynn, R., and T. Vanhanen. 2002. IQ and the Wealth of Nations. Westport: Praeger Publishers. ———. 2006. IQ and Global Inequality. Augusta: Washington Summit Publishers. Maddison, A. 1991. Dynamic Forces in Capitalist Development: A Long-run Comparative View. Oxford: Oxford
University Press. Neisser, U., G. Boodoo, T. J. Bouchard, Jr., A. W. Boykin, N. Brody, S. J. Ceci, D. F. Halpern, J. C. Loehlin, R. Perloff,
R. J. Sternberg, and S. Urbina. 1996. “Intelligence: Knowns and Unknowns.” American Psychologist 51(2):77–101.
O’Rourke, K. H., and R. Sinnott. 2006. “The Determinants of Individual Attitudes Towards Immigration.” European Journal of Political Economy 22(4):838–61.
Putterman, L., J. Tyran, and K. Kamei. 2010. Public Goods and Voting on Formal Sanction Schemes: An Experiment, University of Copenhagen Department of Economics Discussion Paper No. 10–02, Copenhagen.
Putterman, L., and D. N. Weil. 2010. “Post-1500 Population Flows and the Long-Run Determinants of Economic Growth and Inequality.” Quarterly Journal of Economics 125(4):1627–82.
Rindermann, H. 2007. “The g-factor of International Cognitive Ability Comparisons: The Homogeneity of Results in PISA, TIMSS, PIRLS and IQ-tests Across Nations.” European Journal of Personality 21(5):667–706.
Romer, D. 2006. Advanced Macroeconomics, 3rd ed. New York: McGraw-Hill. Shamosh, N. A., and J. R. Gray. 2008. “Delay Discounting and Intelligence: A Meta-analysis.” Intelligence
36(4):289–305. Shoda, Y., W. Mischel, and P. K. Peake. 1990. “Predicting Adolescent Cognitive and Self-Regulatory
Competencies from Preschool Delay of Gratification: Identifying Diagnostic Conditions.” Developmental Psychology 26(6):978–86.
Solon, O., T. J. Riddell, S. A. Quimbo, E. Butrick, G. P. Aylward, M. L. Bacate, J. W. Peabody. 2008. “Associations between Cognitive Function, Blood Lead Concentration, and Nutrition among Children in the Central Philippines.” Journal of Pediatrics 152: 237-243.
Trivedi, M. H., R. J. Verma, N. J. Chinoy, R. S. Patel, and N. G. Sathawara. 2007. “Effect of High Fluoride Water on Intelligence of School Children in India.” Fluoride 40(3):178–83.
Tupe, R., and C. Shashi. 2009. “Zinc Supplementation Improved Cognitive Performance and Taste Acuity in Indian Adolescent Girls.” Journal of the American College of Nutrition 28(4):388–96.
Wang, M., M. O. Rieger, and T. Hens. 2010. How Time Preferences Differ: Evidence from 45 Countries, Swiss Finance Institute Research Paper No. 09–47, University of Zurich, Zurich.
Wang, S. X., Z. H. Wang, X. T. Cheng, J. Li, Z. P. Sang, X. D. Zhang, L. L. Han, X. Y. Qiao, Z. M. Wu, and Z. Q. Wang. 2007. “Arsenic and Fluoride Exposure in Drinking Water: Children’s IQ and Growth in Shanyin County, Shanxi Province, China.” Environmental Health Perspectives 115(4):643–7.
Wasserman, G. A., X. Liu, F. Parvez, H. Ahsan, P. Factor-Litvak, A. van Geen, V. Slavkovich, N. J. Lolacono, Z. Cheng, I. Hussain, H. Momotaj, J. H. Graziano. 2004. “Water Arsenic Exposure and Children’s Intellectual Function in Araihazar, Bangladesh.” Environ Health Perspect. 2004 September; 112(13): 1329–1333.
Warner, J. T., and S. Pleeter. 2001. “The Personal Discount Rate: Evidence from Military Downsizing Programs.” American Economic Review 91(1):33–53.
Winship, C., and S. Korenman. 1997. “Does Staying in School Make You Smarter? The Effect of Education on IQ in The Bell Curve.” In B. Devlin, ed., Intelligence, Genes, and Success: Scientists Respond to the Bell Curve. New York: Springer-Verlag.