National Household Survey 2007 on Corruption in BangladeshThis National Household Survey on...
77
www.ti-bangladesh.org National Household Survey 2007 on Corruption in Bangladesh Dhaka, 18 June, 2008
Transcript of National Household Survey 2007 on Corruption in BangladeshThis National Household Survey on...

www.ti-bangladesh.org
National Household Survey 2007 on Corruption in Bangladesh
Dhaka, 18 June, 2008

ii
National Household Survey 2007 on Corruption in Bangladesh Advisors Professor Muzaffer Ahmad Chairman, TIB Board of Trustees M. Hafizuddin Khan Treasurer, TIB Board of Trustees Dr. Iftekharuzzaman Executive Director Panel of Experts Professor Kazi Saleh Ahmed, Jahangirnagar University Dr. M. Kabir, Jahangirnagar University Dr. Pk. Md. Motiur Rahman, Dhaka University Muhammad Shuaib, Dhaka University Researchers Md. Waheed Alam, Senior Research Officer M. Zakir Hossian Khan, Research Officer Tanvir Mahmud, Research Officer Asif Reza Anik, Assistant Research Officer Md. Akter Hossain, Research Officer Research Associates Md. Shahnur Rahman, Assistant Research Officer Mohammad Abu Sayed, Research Assistant Released on 18 June, 2008 Transparency International Bangladesh Progress Tower (3rd-6th Floor) House # 1, Road # 23, Gulshan-1 Dhaka-1212, Bangladesh Tel: 880 2 9884811, 880 2 8826036 Fax: 880 2 9884811 Email: [email protected] Website: www.ti-bangladesh.org

iii
Preface Transparency International Bangladesh (TIB) has been working with the mission of catalyzing a sustained and effective social movement against corruption in Bangladesh. TIB’s vision is a Bangladesh where government, politics, business, civil society and lives of the common citizens would be free from corruption. Among its manifold activities aimed at creating conditions for reducing corruption and establishing transparent and accountable governance are research, advocacy and citizens’ engagement. National Household Survey on Corruption is a one of TIB’s core research items designed to identify the nature and extent of corruption in different public and private service sectors. Results of the survey are brought into public domain inform stakeholders about the prevailing depth and breadth of corruption in key selected sectors as experienced by households. Survey findings are also expected to feed into initiatives for campaign and advocacy for policy and institutional reforms.
This National Household Survey on Corruption 2007, the fourth in the series, conducted normally in two years intervals, shows that corruption continues to be pervasive in Bangladesh with two-thirds of the households experiencing varying forms of corruption for different public and private sector services. In terms of incidence, law enforcing agencies was found to be the most corrupt sector followed by local government and land administration. Bribery has been reported to be the dominant form of corruption experienced by forty-two percent of surveyed households. Bribery has also been found to be most prevalent in law enforcing agencies followed by land administration and judiciary. Analyzing the surveyed data the annual amount of bribe paid by households in Bangladesh has been estimated to be Taka 54.43 billion (5443 crores). About one-third of this total amount of bribe was collected for the services provided by land administration. Bribery is estimated to have claimed 3.84 percent of per capita income of an average Bangladeshi citizen. Prevalence of corruption has been found to be indifferent to location (urban-local) and gender, suggesting indiscriminately deep and wide spread of the problem.
The research was conducted by a team of 5 members of TIB Research Division, assisted by other members of the staff who provided valuable feedback and suggestions in various ways including supervision of the data collection process in the field. TIB acknowledges the contribution of seventy-two young and enthusiastic field enumerators recruited for data collection, whose tireless and commitment work helped to complete the survey successfully.
The survey had the exceptional benefit of the assistance and guidance of a panel of experts composed of Professor Kazi Saleh Ahmed, Dr. M Kabir, Dr. Pk. Md. Motiur Rahman and Professor Muhammad Shuaib, who generously contributed to its design and methodology as well as analysis and estimates of the data presented in the report. We are grateful to them.
Professor Muzaffer Ahmad, Chairman of the Board of Trustees of TIB and Mr. M. Hafizuddin Khan, Treasurer, provided overall guidance and supervision to the team, without which the study couldn’t be completed.
We hope that the concerned stakeholders would take the finding of the survey into due cognizance and make all efforts to implement the recommendations presented here. TIB would also welcome any constructive critique and suggestions from anyone which would facilitate further enrichment of the study.
Iftekharuzzaman Executive Director

iv
Table of Contents
Page No
Acronyms X
Executive Summary XII-XXXI
Chapter- I: Introduction 1
1.1 Background 1
1.2 Governance and corruption 2
1.3 Rationales of the Study 3
1.4 Objectives and scope 4
1.5 Methodology 5
1.6 Administration of the survey 6
1.7 Data processing and analysis 6
1.8 Limitations 7
1.9 Organization of the Report 7
Chapter- II: Respondents profile and Household Charecteristics 8
2.1 Charecteristics of respondents 8
2.2 Educational Attainment 9
2.3 Occupational Pattern 9
2.4 Religion and ethnicity 10
2.5 Land ownership 11
2.6 Household income and expenditure 11
Chapter- III: Extent of Corruption in Different Sectors 12
3.1 Interactions with differtent sectors 12
3.2 Forms of corruption 13
3.3 Incidence of corruption in different sectors 14
3.4 An overview of bribery 14
3.5 Volume of bribe 16
3.6 Incidence of bribery between two time periods 17
Chapter- IV: Education 19
4.1 Households’ interaction with education sector 19
4.2 Irregularities in enrollment 20

v
4.3 Regularity in holding class and exam 22
4.4 Private tution 22
4.5 Entitlement for Upabritti 23
4.6 Payment without receipt 24
Chapter-V: Public Health 26
5.1 Services in government health centers 26
5.2 Harassment and bribery 27
5.3 Private business by public health professionals 28
5.4 Pathological Tests: 29
Chapter-VI: Land Administration 31
6.1 Interaction with Land Administration 31
6.2 Incidence of bribery 32
6.3 Persons involved in bribery 33
Chapter-VII: Law Enforcement Agencies 34
7.1 Harassment /Corruption committed by law enforcement agencies 34
7.2 Extent of bribery 35
7.3 Physical torture 36
Chapter-VIII: Judiciary 37
8.1 Household interaction with judiciary 37
8.2 Incidence of bribery 38
8.3 Actors involved in receiving bribe 39
Chapter-IX: Electricity 40
9.1 Service providers 40
9.2 Services 41
9.3 Corruption and harassments experienced by households 41
9.4 Harassment and Corruption 42
9.5 Bribery 42
Chapter X: Local Government 44
10.1 Inteaction with local government 44
10.2 Types of Irregularities 44
10.3 Incidence of harassments 45
10.4 Bribery 45

vi
10.5 Salish 46
10.6 Relief 48
Chapter XI: Tax 49
11.1 Income Tax 49
11.2 Holding Tax 49
11.3 UP Tax 50
Chapter XII: Banking 51
12.1 Credit service 51
12.2 Purpose of credit 51
12.3 Bribery in credit service 52
12.4 Other banking services 53
Chapter-XIII: NGO Sector 54
13.1 Types of NGOs 54
13.2 Service provided by NGOs 54
13.3 Bribery in micro credit 55
13.4 Loan recovery method 55
Chapter XIV: Conclusion and Recommendations 56
Appendix 64-67

vii
List of Tables and Figures
Table Page No
1.1 Distribution of PSUs 5
2.1 Nature of Respondents 8
2.2 Sex of Respondents 8
2.3 Size of Household 9
2.4 Educational Attainment of Household Heads 9
2.5 Occupation of Household Heads 10
2.6 Religion of Households 10
2.7 Ethnicity of Households 10
2.8 Land Ownership of Household Heads 11
2.9 Average Monthly Household Income 11
2.10 Average Monthly Household Expenditure 11
3.1 Households interacted with or received services from different sectors 12
3.2 Incidence of corruption in different sectors 14
3.3 Percent of households paid bribe during interaction 15
3.4 Average amount of bribe a household paid during interaction 16
3.5 Total volume of bribe paid by households in different sectors 17
3.6 Incidence of bribery by time periods 18
4.1 Distribution of students in different educational institutions 19
4.2 Incidence of irregularities in getting admission by students 20
4.3 Types of irregularities experienced in different institutions 20
4.4 Donation or unauthorized payments transacted in getting admission 21
4.5 Incidence of being benifited from private tutor 22
4.6 Gains and effect of having private tutors 23
4.7 Misbehaviour of teachers for not having them as private teachers 23
4.8 Percent of students received sub-scholarship by institutions 24
4.9 Students experiencing harassment for getting sub-scholarship 24
4.10 Payment to institutions without receipt 25
5.1 Households receiving services from public health facilities 26
5.2 Type of service received 27
5.3 Status of service recipients reported to be harassed 27

viii
5.4 Households paying bribe in different hospitals 28
5.5 Types of bribe takers 28
5.6 Proportion of patients advised to visit personal chamber/clinic 29
5.7 Facilities availed for pathological tests 29
5.8 Extra money paid for pathological tests in government facilities 29
6.1 Reasons for interaction with land administration 32
6.2 Incidence of bribery for receiving different types of land services 32
6.3 Average amount of bribe paid by to land offices 33
6.4 Persons involved in bribery 33
7.1 Harassment experienced from by law enforcement Agency (LEA) 34
7.2 Different forms of harassment/corruption committee by Law Enforcement 35
7.3 Incidence of bribery for different services from Law Enforcement agencies 35
7.4 Bribe paid by households for different purposes 36
8.1 Proportion of households involved with different types of cases 37
8.2 Households’ interaction with different courts 38
8.3 Incidence and amount of bribery in different courts 38
8.4 Bribe paid in different courts 39
9.1 Households experiencing different types of harassment 42
9.2 Average amount of bribe paid the households paid in different entity 42
9.3 Reasons for paying bribe 43
9.4 Categories of staff involved in bribery 43
10.1 Percent of households receive different services 44
10.2 Types of irregularities 45
10.3 Percent of households experienced harassment during receiving different services 45
10.4 Incidence bribery in receiving services from local government bodies 46
10.5 Amount of bribe paid for different services 46
10.6 Means of enlistment for relief 47
10.7 Households less quantity of relief goods 48
11.1 Households paying income tax 49
11.2 Households paying holding tax 50
11.3 Households paying UP tax 50
12.1 Purpose of loan taken by households by bank type and location 52

ix
12.2 Borrowers paying bribe for receiving loan (%) 52
12.3 Loan amount and bribe paid by loan recipients 52
12.4 Bribe takers by bank type and residence of the loan recipients (%) 53
12.5 Types of harassment faced while receiving other banking services 53
12.6 Amount of bribe paid while receiving other banking services 53
Figure 3.1 Different forms of corruption 13
4.1 Percent of students reported about the regularity in taking classes by institution 21
5.1 Percent of household members visited different GoB hospitals 27
8.1 Actors of receiving or negotiating bribe 39
9.1 Percents of household clients under different service entities 40
9.2 Percents of households received different services by entity 41
9.3 Percents of households experienced harassment and corruption by entities 41
10.4 Reasons for Salish 47
11.1 Reasons for paying bribe by taxpayer households 49
11.2 Reasons for paying bribe as reported by holding taxpayers 50
12.1 Residence of the loan receiver and sources of loan 51
13.1 Interaction with service providing NGOs 54
13.2 Incidence of bribery in micro credit 55
13.3 Respondents response about NGOs’ reaction in failure to return loan 55

x
Acronyms
ACC- Anti Corruption Commission BBS- Bangladesh Bureau of Statistics BEI- Bangladesh Enterprise Institute CPI- Corruption Perception Index DCC- Dhaka City Corporation DESA- Dhaka Electricity Supply Authority DESCO- Dhaka Electric Supply Company EC- Election Commission GDP – Gross Domestic Product IMPS- Integrated Multi-purpose Sampling Frame LFA- Law Enforcing Agency MDG- Millennium Development Goal NGO- Non-government Organization NIS- National Integrity System PDB- Power Development Board PSC- Public Service Commission PSU- Primary Sampling Unit PWD- Public Works Department RAJUK- Rajdhani Unnayan Kortopakha REB- Rural Electrification Board RHD- Roads and Highways Department RSE- Relative Sampling Error SMA-Statistical Metropolitan Area SMC- School Management Committee TI- Transparency International TIB- Transparency International Bangladesh T&T- Telegraph and Telephone UHK- Upa Shastha Kendra UNCAC- UN Convention Against Corruption UHC – Upazila Health Complex VGD- Vulnerable Group Development VGF- Vulnerable Group Feeding WASA- Water and Sanitation Authority

1
Chapter 1
Introduction
1.1 Background
Bangladesh, with a population of over 140 million, is a densely populated country with more than 900 persons living per km. The country has adopted a parliamentary form of democracy and so far held three general elections perceived as reasonably fair by the international community. However, the democratization process had been frequently interrupted by political intimidation and intolerance, prolonged boycott of parliament by the opposition bench, hartal (work stoppage), political bickering and violence resulting in a stalemate situation. The current caretaker government took office on 1/11 and promulgated a state of emergency. A good number of very high profile people, once believed to be untouchable, were arrested on charge of corruption and have been put to justice. Moreover, the government, in line with the spirit of the constitution, has separated the judiciary from the executive and initiated reform measures to make Anti Corruption Commission (ACC), Election Commission (EC) and Public Service Commission (PSC) independent and effective.
GDP growth rate has been hovering between 5 to 6 percent since the 1990s. The per capita GNP is estimated at US$ 5201. The country has taken a large stride towards achieving the Millennium Development Goals (MDGs). Gross primary enrollment increased from 72% in 1980 to 98% in 2001 and gender parity in primary and secondary enrollment has been achieved. Infant mortality rate declined sharply from 145 in 1970 to 46 in 2003 and child morality rate declined from 239 in 1970 to 69 in 2003. Food security situation has also improved and so also the syndrome of absolute poverty.2
Bangladesh has not yet been able to exploit its full potential to achieve desirable socioeconomic progress. The country is characterized by political chaos, lack of coherent policy, rampant corruption, absence of transparency and accountability and indiscriminate foul play of power brokers. Despite these negative phenomena, some progress has been achieved in terms of some socioeconomic indicators. Progresses could be faster and higher, had there been less corruption and good governance.
Bangladesh ranked the lowest in the global ranking of Corruption Perception Index (CPI) developed by Transparency International (TI), consecutively for five years from 2001 to 2005. In the following two years (2006 to 2007), its position marginally improved with only three decimal points increment in the score3. The National Household Survey on Corruption, conducted by Transparency International Bangladesh (TIB) in 2005, revealed that a citizen of Bangladesh had to pay Tk. 485 on an average in 2004 for receiving services from nine specific sectors.
1 Bangladesh Economic Review 2007, Page XV 2 Bangladesh Country Assistance Strategy 2006-2009, The World Bank, page 12 3 Corruption Perception Index 2001-2007, Transparency International. Bangladesh ranked one of the most corrupt countries from 2001 to 2005 measured in a scale of 0 - 10, 0 being most corrupt and 10 being the least corrupt. Its score in this year interval reached from .4 to 1.7. In 2006, its position improved and got the score 2.0 and in 2007 the score remained same.

2
Perception based governance indicators prepared by the World Bank Institute reveal low ratings for Bangladesh on six key indicators, with particularly poor rating on control of corruption, regulatory quality and rule of law. In addition, an investment climate survey of 1001 manufacturing firms operating in Bangladesh showed that nearly three-fifths of these experienced corruption as the most serious constraint, followed by poor infrastructure4.
Recognizing the aspiration for improved governance, the government of Bangladesh has outlined its vision in the Poverty Reduction Strategic Paper (PRSP), “Unlocking the Potential” released in October 2005. It has amply put thrust on combating corruption, restoring rule of law and making governance work for the poor.
Given this context, TIB in every two years interval conducts national household survey on corruption to know about the nature and extent of corruption in service sectors as experienced by households. The current survey is the fourth one in this series.
1.2 Governance and corruption
Governance refers to the process whereby elements in society wield power and authority, and influence and enact policies and decisions for economic and social development. The governance of a country or institution is considered failed or ineffective when rampant corruption takes place.
Gray and Kaufman (1998) defined corruption as abuse of public office for private gain through bribery and extortion, fraud and embezzlement. The United Nations Manual on Anti-Corruption Policy resonates the same meaning. According to the Transparency International, corruption includes embezzlement of funds, theft of corporate or public property as well as corrupt practices such as bribery, extortion or influence peddling. Klitgaard (1998) analyzed corruption from governance point of view; and he formulated formula C = M + D – A, where corruption (C) equals monopoly (M) plus discretion (D) minus accountability (A) in public, private or non-profit sectors where a person has monopoly power over goods and services.
Corruption is the most prevalent in countries, which have colonial history, political instability, bureaucratic red tape, and weak legislative and judicial system5. Besides, low salaries, a gift culture, absence of rules, regulations, policies and legislation, unaccountable public officials with excessive authority, high range of discretion, absence of transparency, accountability and watchdog institution make a country prone to corruption.
On a macroeconomic level, corruption limits economic growth, since private firms see corruption as a sort of "tax" that can be avoided by investing in less corrupt countries. In turn, the lower economic growth results in less government revenue available for investment6. If a country improves its standing on the corruption index from, say 6 to 8 (0 being the most corrupt, 10 the least), it will experience a 4 percentage point increase in its investment rate and a 0.5 percentage point increase in
4 Bangladesh Country Assistance Strategy 2006-2009, The World Bank, page 13 5 Mauro P. , Corruption: causes, Consequences, and Agenda for Further Research, International
Monetary Fund 6 http://www.u4.no/themes/health/causesandconsequences.cfm

3
its annual per capita GDP growth rate (Mauro, 1996). Thus the Word Bank and Bangladesh Enterprise Institute (BEI) have identified corruption is the key obstacle for the development of business sector7. On the revenue side, paying bribes to evade taxes and tariff lead to revenue loss for the state.
Corruption also affects government’s investment decision, as corrupt governments are more likely to invest in infrastructure-intensive sectors such as transport and military, where procurement contracts offer larger bribes, rather than social sectors like health and education.
Furthermore, corruption escalates poverty by widening gap between the rich and the poor. Corruption undermines legitimacy of the public service, as the people have to pay more to access services. Corruption is a key impediment for human development, because it draws off education and health services from poor and marginalized people.
Corruption can have some political and social implications by damaging the image and investment potential of a country, destabilizing democracy, cultivating a culture of fraudulence, creating distrust in leaders and escalating serious crimes including terrorism, drug trafficking, violence, money laundering, etc.
1.3 Rationale of the study
The year 2007 has been extraordinary in the history of Bangladesh following a prolonged period of political turmoil. After taking office on 1/11, the caretaker government took initiatives to separate judiciary from executives and undertook reform measures to make several public institutions like the ACC, EC and the PSC effective and functional, so that the National Integrity System (NIS) will be strengthened and country would not revert to pre 1/11 situation. The government also acceded to the UN Convention against Corruption (UNCAC) to demonstrate its commitment to fight against corruption.
Besides, the government spearheaded an unprecedented campaign against corruption. To prevent serious crimes and offences, the government formed a taskforce involving different law enforcing agencies to investigate and prosecute the offenders. As part of this massive campaign, more than one hundred high profile politicians, bureaucrats and business people were arrested on charges of corruption and legal process was brought against them. The taskforce also started investigations in different institutions like Chittagong Port, Rajdhani Unnayan Kortipakha (RAJUK), Titas Gas and Transmission Company, Dhaka City Corporation (DCC), Roads and Highways Department (RHD), Public Works Department (PWD) etc. to identify corrupt elements and prosecute them. These are milestone measures taken by the government to fight against corruption and improve the governance mechanism in Bangladesh. In this regard, this survey would help the government and other stakeholders to assess the state of the corruption in Bangladesh and ultimately enable it to set priorities and formulate further courses of action.
Corruption has become a major social problem and many studies have shown that it hinders human development and drive away resources from households in any 7 Improving Investment Climate in Bangladesh, World Bank and Bangladesh Enterprise Institute,
Dhaka, June 2003

4
country. Therefore, the survey has direct relevance by sensitizing the people of Bangladesh about the nature and extent of corruption on households, from which sectors they experienced corruption and in what ways and who make households and its members victim to corruption.
TIB is committed to combat corruption and to promote integrity and accountability at all levels of the country by ushering a social movement and creating social demand. To materialize these aims TIB has undertaken civic engagement, research and advocacy under its Making Waves project. To identify the nature as well as to measure the extent of corruption, harassments and sufferings the citizens experience, TIB has been conducting the National Household Survey on Corruption in every two years interval. This survey demonstrates TIB’s firm commitment to combat corruption.
1.4 Objectives and scope
The board objective of the survey is to explore the sectors, nature and extent of corruption in different services of Bangladesh as experienced by households.
Specific objectives are:
• To identify the sectors or services where households experience corruption;
• To assess the nature and extent of corruption and harassments in selected
institutions/services in public and private sectors;
• To determine the entry points and processes of corruption – where and how;
and
• To make policy recommendations.
In this survey, corruption is defined as more than bribery - abuse of entrusted power for personal gain manifested in six common forms –bribery, negligence of duties, nepotism, embezzlement, deception and extortion.
Corruption occurs at different levels, some are grand involving huge procurement contract committed by high profile politicians and bureaucrats and some are petty in nature committed by the officials and miscreants in different public and private institutions. This survey covered households’ experience mostly that of petty corruption and in some cases big corruption that they experienced in different institutions in the period from July’06 to June’07.
Households interact with different public and private institutions for receiving services. Some of them are very essential for their well being and some are important for maintaining social cohesion and order. It was observed in earlier household surveys and newspaper scanning that corruption is rife in certain sectors and households are more susceptible to experience corruption from them. Therefore, broader emphasis was given to collect corruption information from those institutions and services that the households experienced. These sectors include education, health, land administration, law enforcing agencies, judiciary, power (electricity), revenue administration (taxes/duty), local government, finance (banking) and NGO services.

5
However, household experiences on corruption from other service institutions were also collected through an additional section in the questionnaire.
1.5 Methodology
For selecting households for the survey, a three stage stratified cluster sampling method was followed. The Integrated Multipurpose Sampling (IMPS) Frame developed by the Bangladesh Bureau of Statistics (BBS) was used as sampling frame.8
A total of 5,000 households were interviewed for attaining the objectives of the survey, 3,000 (60%) from rural areas and 2,000 (40%) from urban areas. There were 250 Primary Sampling Units (PSU). Among them 150 were for rural and 100 were for urban areas. More weight was given to urban PSU selection, as National Household Survey on Corruption 2005 found higher variability in overall bribe amount in urban areas than in rural areas. Then 250 PSUs were distributed in 16 strata according to the national population weights of those strata.
Table 1.1: Distribution of PSUs
Division SMA Municipality Rural Total no. of PSUs
Barisal - 4 10 14 Chittagong 11 8 26 45 Dhaka 29 18 44 91 Khulna 5 6 19 30 Rajshahi 2 14 42 58 Sylhet - 3 9 12 Total 47 53 150 250
At the first stage, PSUs or Mauzas were selected randomly from each of 16 strata according to above allocation. At the second stage a block of 200 households was constructed randomly from each PSU. As there are some PSUs in the IMPS that have less than 200 households, households from adjacent Mauzas were added to those PSUs. At the third stage, 20 households were selected systematically for interview. The selected households were asked questions regarding corruption they experienced in the last one year through a structured questionnaire.
This design ensured ‘validity’ and ‘reliability’ of this sampling design. From ‘validity’ point of view, allocation of PUSs covered 62 districts out of 64 under 6 divisions in Bangladesh with divisional and rural–urban population representations. On the other hand, from ‘reliability’ point of view, the Relative Standard Error (RSE) of most important indicators was found at a desired level. For instance, the RSE of the proportion of households experienced any form of corruption in last one year was found 2.4% of the estimate and corresponding figure for the proportion of households experienced bribery was found 2.9% of the estimate. Besides, the RSE of the proportions of households experienced bribery in dominant and important sectors were found around 10% of the corresponding estimates (see Appendix A1-A5). 8 The IMPS design consists of 1,000 Mauzas distributed in 16 strata according to rural, municipality and SMA (Statistical Metropolitan Area) throughout the country. There were 6 rural, 6 urban and 4 SMA strata. These Mauzas constitute the PSUs in this sampling frame.

6
The survey was conducted in the period from June 7 to July 5, 2007. Survey teams started data collection throughout the country at the same time. Household heads were interviewed using a questionnaire. In case of unavailability of household heads, subsequent visits were made to the sampled households. If not found though, the female head or an adult person who is familiar with household activities or one of the key household decision makers was interviewed. The questionnaire was designed using the lessons of previous surveys conducted by TIB. An expert panel was also consulted for designing the survey method and questionnaire and their expert opinions were received through in-house presentations.
The survey intended to collect information on corruption that the households experienced from different service sectors. For many years TIB has been maintaining year round scanning of 23 newspapers, from where it identified some sectors that were found to be very corrupt, although they are essential for public well being. Moreover, TIB has conducted three national surveys on corruption since 1997. In those surveys some sectors were identified as most corrupt and developed ideas about the nature and extent of corruption in them. Through such process, ten specific sectors were identified for this survey.
1.6 Administration of the survey
In May 2007, candidates for the field positions were recruited in a competitive manner. Recruitment criteria included educational attainment (at least graduate), maturity, intelligence, ability to spend one month in the field and related experiences. A two-day long detailed training was arranged for the field enumerators and supervisors. During training they were taken to adjacent areas to get practical orientation on how to interact with the households and fill up questionnaires. Finally, 62 enumerators and 10 supervisors were appointed for data collection. Later 31 enumerator teams were formed, each comprised of 2 members. Each team was assigned to work in one PSU for consecutive three days.
Strong supervision and quality control measures were adopted for this survey. A total of 33 researchers from TIB’s research team made extensive field during data collection. They performed 11.9% spot checks and 13.1% back checks during data collection.
1.7 Data Processing and Analysis
Data processing operation consisted of coding of open ended questions, editing, and removing inconsistencies from the questionnaires. Ten enumerators who performed with excellence in data collection process were engaged for data recoding and editing. Extensive cleaning was performed to remove all forms of inconsistencies in the data.
Finally, tables were generated from the cleaned data using data analysis software like STATA and SPSS. As this is a complex survey in nature, weights were used for getting the estimates of desired indicators after calculating the selection probabilities at each stage under each stratum. In analysis, mostly proportions and averages of different indicators or variables were estimated. Totals were estimated for the amount of bribe the households in Bangladesh paid in different sectors in a year. To assess the reliability of estimates, Relative Standard Errors (RSE) were calculated for the sector level estimates.

7
1.8 Limitations
• The survey intended to collect households’ experience on corruption from household heads. However, in 23.6% cases the enumerators could not interview the household heads despite repeated visits. In those cases, the enumerators interviewed another adult person from the household who could give reliable information.
• Although random section was maintained during PSUs selection from each stratum, the selected PSUs in Sylhet division mostly covered poor, marginalised, ethnic and religious minority areas. For this reason, religious, ethnic and professional representational estimates were found somewhat higher in this division than those of national estimates. This, however, did not distort the overall findings.
• This report provides sector wise estimates of corruption. Because of varying levels of interactions reliability of these estimates may also very. Therefore, these estimates have to be used with caution.
1.9 Organization of the report
This report has fifteen chapters. The first chapter provides an overview of the context, theoretical framework and methodology. The second chapter presents respondents’ profile and household characteristics. Chapters 3 to13, the findings of the survey have been presented. The concluding chapter presents policy, structural and institutional recommendations.

8
Chapter 2
Respondents’ Profile and Household Characteristics
A household is defined as a person or a group of related and/or unrelated persons who usually live in the same dwelling unit, have common cooking and eating arrangements and acknowledge one adult member as a head of the household. A member of the household is any person who usually lives in the household.
The survey covered households that are more or less representative of the national statistics in terms of selected demographic and socio-economic indictors. Household characteristics are summarized in this chapter.
2.1 Characteristics of respondents
Table 2.1 shows the distribution of respondents by residents. In this survey the household head was considered as respondent. But due to unavailability of some household heads during interview, two types of respondents were included in interview –acknowledged household head and a member of the household who was familiar with the household activities. In the survey overall 76.3% respondents were household heads and the rest 23.7% respondents were members of respective households. The proportion of respondents as household head is higher in rural areas than in urban areas.
Table 2.1: Nature of Respondents
Residence Urban
Nature of Respondents
SMA Municipality OverallRural Overall
Household head himself
63.1 76.5 68.0 82.6 76.3
Other member of household
36.9 23.5 32.0 17.4 23.7
Total 100.0 100.0 100.0 100.0 100.0 Among the respondents, 78.5% are male and 21.4% are female, which is indicative of male domination in our society (see Table 2.2)
Table 2.2: Sex of Respondents
Residence Urban
Sex of the HH
SMA Municipality OverallRural Overall
Female 36.3 20.7 30.5 14.4 21.4Male 63.7 79.3 69.5 85.6 78.6Total 100.0 100.0 100.0 100.0 100.0
Table 2.3 shows the distribution of household size according to residence. The average number of members per household was 5.5. The highest number of households has four to six members.

9
Table 2.3: Size of Household
Residence Urban
No. of HH members
SMA Municipality OverallRural Overall
1 .3 .2 0.2 .2 0.22 5.7 4.1 5.0 2.7 3.73 14.3 12.9 13.7 10.6 12.04 22.4 20.9 21.8 20.2 20.95 25.0 21.4 23.6 22.6 23.06 12.6 14.0 13.1 16.0 14.87 6.8 8.3 7.3 10.9 9.48 5.7 7.4 6.3 6.7 6.69+ 7.3 10.8 8.6 9.9 9.4Total 100.0 100.0 100.0 100.0 100.0
2.2 Educational attainment
Literacy is a key determinant of the lifestyle and status an individual enjoys in a society. It affects many aspects of life including attitude, resource accumulation and bargaining capacity in the society. Table 2.4 shows the educational status of the household heads by residence.
More than 50% of surveyed household heads attained primary education or more, while 34% household heads had no literacy; illiteracy rate in rural and urban areas being 42.6% and 22.5% respectively.
Table 2.4: Educational Attainment of Household Heads
Residence Urban
Education level
SMA Municipality OverallRural Overall
No Education 23.3 21.3 22.5 42.6 33.9Can Read and Write
2.5 4.0 3.0 5.1 4.2
Primary Incomplete
3.0 4.4 3.5 7.6 5.8
Primary Complete
12.2 8.2 10.7 10.8 10.8
Secondary Incomplete
20.2 23.1 21.5 18.6 19.8
Secondary Complete
11.2 11.3 11.2 7.3 9.0
Above Secondary 27.4 28.0 27.5 8.0 16.5Total 100.0 100.0 100.0 100.0 100.0
2.3 Occupational pattern
Table 2.3 shows that business is the dominant profession among the household heads closely followed by agriculture. Farming is more pronounced in rural areas, while business is more dominant in urban areas. Day labor is the third largest occupation

10
which is evenly distributed in urban and rural areas. But there exist differences in professions among the household heads. Profession of household heads as agriculture is almost 30.0 percentage point higher in rural areas than in urban areas. Profession as day laborer is almost similar both in rural and urban areas.
Table 2.5: Occupation of Household Heads
Residence Urban
Occupation
SMA Municipality OverallRural Overall
Agriculture 3.3 7.5 4.9 35.4 22.1Business 32.5 29.6 31.4 20.3 25.1Day Laborer 13.6 10.9 12.6 13.3 13.0Private Service 13.1 11.9 12.7 4.8 8.2Retired 9.3 9.0 9.2 5.6 7.2Home Service 7.8 7.3 7.6 5.3 6.3Government Service
7.6 7.2 7.5 2.1 4.4
Others 12.8 16.6 14.1 13.2 13.6Total 100.0 100.0 100.0 100.0 100.0
2.4 Religion and ethnicity Table 2.4 presents the distribution of respondents by religious belief. Muslims are about 89% of the respondents. According to the population census conducted in 2001, the proportions of population belonging to Muslim and Hindu community were found 89.7% and 9.2% respectively. Therefore these estimates are quite comparable with national statistics.
Table 2.6: Religion of Households
Residence Urban
Religion
SMA Municipality OverallRural Overall
Muslim 92.7 87.8 90.9 87.2 88.8Hindu 5.6 11.0 7.6 8.1 7.8Others 1.7 1.2 1.5 4.7 3.4Total 100.0 100.0 100.0 100.0 100.0
In terms of ethnicity, 96.3% of surveyed households were found Bangalees. Only 3.6% households belong to other indigenous communities.
Table 2.7: Ethnicity of Households
Residence Urban
Ethnicity
SMA Municipality OverallRural Overall
Bangalee 97.9 98.3 98.1 95.1 96.4Indigenous people
2.1 1.7 1.9 4.9 3.6
Total 100.0 100.0 100.0 100.0 100.0

11
2.5 Land ownership
Table 2.8 shows that 9% of surveyed households do not own any land and 56% are functionally landless (owning less than 0.5 acre of holding). Landlessness is more pronounced in urban areas.
Table 2.8: Land Ownership of Household Heads
Residence Urban
Land Ownership (in acre)
SMA Municipality OverallRural Overall
No Land 23.2 5.4 16.6 3.8 9.3<0.05 20.2 23.6 21.4 11.8 16.00.05-0.49 32.1 30.9 31.6 30.2 30.80.50-1.49 13.6 15.7 14.3 24.0 19.81.50-2.49 4.6 10.2 6.6 11.0 9.12.50-7.49 4.8 11.2 7.1 15.7 12.07.5+ 1.6 3.1 2.1 3.6 3.0Total 100.0 100.0 100.0 100.0 100.0
2.6 Household income and expenditure
In this survey average monthly income of a household is Tk. 10,003 with corresponding figures in rural and urban areas Tk. 7,489 and Tk. 13,285 respectively9. Rural income is almost one half of urban income (see Table 2.9).
Table 2.9: Average Monthly Household Income
Residence Average Monthly Income (Tk.) Urban 13,285
SMA 14,883 Municipality 10536
Rural 7,489 Overall 10,003
Average monthly expenditure of a household is found Tk. 7,345 with corresponding figures for rural and urban areas Tk. 5,643 and Tk. 9,875 respectively.
Table 2.10: Average Household Expenditure
Residence Average Monthly Expenditure (Tk.)
Urban SMA 11,154
Municipality 7,677 Overall 9,875
Rural 5,643 Overall 7,345
9 According to the National Household Income and Expenditure Survey 2005, the average household income and expenditure were Tk. 7,203 and Tk. 6134 respectively. As the survey was conducted in 2007, these are estimates are largely consistent considering the three years inflation.

12
Chapter 3
Extent of Corruption in Different Sectors
According to different reports and studies, corruption is all pervasive in Bangladesh. Almost all public sector institutions are infested with the menace of corruption. Corruption has become institutionalized in many public offices to an alarming state. The aim of this chapter is to identify the nature of corrupt practices and their intensity in different sectors.
3.1 Interactions with different sectors
Detailed information on corruption was collected on eleven specific sectors. These include those that are perceived as highly corrupt and are essential for ensuring public well-being. Household experience on corruption in all other sectors was collected through a separate section in the questionnaire.
Table 3.1 shows percentages of households interacted with or received services from different sectors. According to this table, almost every household in Bangladesh interacted with public and private institutions for receiving services. The survey reveals that households in highest proportion (72.2%) interacted with or received services from education sector, followed by electricity (60.0%), health (44.9%) and NGO (39.6%). Around 11% households interacted with each of law enforcement agencies and judiciary. Around one-fourth of households interacted with different institutions under land administration. From all other institutions or sectors, 32.5% households interacted or received services. These sectors or institutions were largely found to be gas, WASA, T&T, agriculture, private health facilities, insurance, passport services, etc.
Table 3.1: Households interacted with or received services from different sectors
Percentage of households Urban
Sector
SMA Municipality Overall
Rural Overall
Education (n= 3636) 67.8 75.6 70.8 73.3 72.2Electricity (n=3003) 86.0 78.5 83.1 44.6 60.0Health (n=2229) 36.2 50.6 37.4 46.8 44.5NGO (n=1971) 40.0 37.6 35.8 44.4 39.6Banking (n=1945) 48.2 39.8 44.2 34.8 39.3Tax (n=1935) 18.4 51.4 30.5 34.6 32.8Land Administration (n=1352)
21.8 34.9 26.1 25.2 25.8
Local Government (n=1191)
18.1 12.9 15.3 29.3 23.2
Law Enforcement (n=504)
17.4 9.9 14.3 8.7 11.2
Judiciary (n=561) 8.4 13.1 10.0 11.7 11.0Others (n= 1441) 52.0 28.8 43.3 24.8 32.9All Sectors (n=4962) 100.0 99.6 99.5 99.0 99.4

13
With respect to residence, incidence of interaction with different sectors differs. Rural households interacted more with education, health, NGO and local government compared to their urban counterparts. On the other hand, households in urban areas interacted more with electricity, law enforcement and banks. However, interactions with land administration and judiciary were found almost similar both in urban and rural areas.
3.2 Forms of corruption
In this survey, corruption is defined as more than bribery - abuse of entrusted power for personal gain. The survey considered corruption in six common forms –bribery, negligence of duties, nepotism, embezzlement, deception and extortion. Figure 3.1 presents an overview of different forms of corruption the households experienced. More than three-fourths of the households in aggregate (76.9%) found to have experienced either bribery or negligence of duties. Responses of bribery (38.6%) were marginally higher than that of negligence of duties (38.3%). About one-tenth of the households reported about embezzlement.
Figure 3.1: Different forms of corruption
Bribery, 38.6
Deception, 3.5
Nepotism, 8 Embezzlement , 9.8
Negligence of duties, 38.3
Extortion, 1.7
Manifestations of different forms of corruption vary among sectors. Bribery as a foremost form of corruption prevails almost in all sectors in varying proportions. It was found that bribery was most prevalent in land administration (89.1%) followed by judiciary (78.4%), law enforcement (56.1%) and tax (53.0%). Negligence of duties as next dominant form of corruption was present in considerable proportions in those services from where households seek basic and essential services. Eventually, negligence of duties was found most prevalent in services like public health (61.2%), electricity (55.5%), bank (53.8%) and education (37.6%). Nepotism is conspicuously observed in education (19.5%) and local government (18.9%), as these services usually confine to the vicinities of households and family relationships with the service providers help them to avail these services. Embezzlement was most prevalent in education sector (26.0%), followed by local government (13.4%), presumably for the existence of upabritti (sub-scholarship) and relief in the basket of their services. Extortion is notably observed in NGOs (21.7%) and law enforcement (9.8%) due to NGOs’ micro credit activities and discretionary power retained by law enforcing agencies respectively. Deception is also most prevalent in NGOs (21.7%) and law

14
enforcing agencies (9.8%) apparently for the same reasons (for details, see Appendix A.1).
3.3 Incidence of corruption in different sectors
Table 3.2 provides an overview of corruption the households experienced in different sectors. Overall 66.7% households experienced corruption during interactions with different service providers. However, the urban-rural differentiation is minimal in this respect. An overwhelming 96.6% households that interacted with law enforcing agencies experienced corruption. Land administration (52.7%) and judiciary (47.7%) are the next most corrupt sectors. Nearly two-fifths of those households who interacted with education and health services experienced corruption. In electricity, around one-third of the households experienced corruption.
Table 3.2: Incidence of corruption in different sectors
Percent of households experienced corruption Urban
Sector
SMA Municipality OverallRural Overall
Law Enforcement (n=475)
95.0 97.1 96.1 97.0 96.6
Local Government (n=675)
74.1 68.3 67.7 59.8 62.5
Land Administration (n=741)
53.7 41.2 46.9 57.2 52.7
Judiciary (n=244) 37.2 56.8 45.5 49.1 47.7Health (n=981) 51.2 54.0 52.7 37.6 44.1Education (n=1440) 32.0 35.7 33.9 43.4 39.3Electricity (n=894) 30.4 28.3 28.9 40.6 33.2Banking (n=519) 19.7 38.6 29.8 27.9 28.7NGO (n=246) 13.7 12.8 13.2 13.7 13.5Tax (n=80) 12.3 11.3 1.2 2.1 6.4Others (n=452) 30.5 30.1 30.3 39.5 35.5All Sectors (n=3291) 67.5 66.2 66.9 66.5 66.7
Incidence of corruption in different sectors varies with respect to residence. For receiving service of land administration, education and electricity, households in rural areas experienced corruption in higher proportion than in urban areas. On the other hand, households in urban areas experienced corruption in higher proportion for receiving services of local government and health than in rural areas. For receiving services of law enforcing agencies and banking, incidences of corruption remain same with respect to residence.
3.4 An overview of bribery
Bribery is the most dominant form of corruption in Bangladesh. However, bribery is prevalent in different sectors in varying proportions. Table 3.3 presents an overview of bribery the households experienced during their interaction with different service organizations. In survey’s reference period (July’06 to June’07), 42.1% households paid bribe during their interaction with different services and institutions. Paying bribe by the households was found marginally higher in rural areas (43.8%) than in urban areas (40.2%). According to findings of the survey, paying bribe during interaction was most prevalent in law enforcing agencies. As many as 64.5%

15
households had to pay bribe during interaction with or receiving services from law enforcing agencies, followed by land administration (51.1%), judiciary (41.7%) and local government (32.5%). Although household interaction with education or its institutions was found to be as high as 72.2%, only 8.8% of them experienced the incidence of bribery.
Such incidences of bribery differ with respect to residence. Notable difference is observed in education, electricity and banking sectors. Proportions of households who paid bribe during interaction with these sectors are two times higher in rural areas than in urban areas.
Table 3.3: Percent of households paid bribe during interaction
Percent of households paid bribe Urban
Sector
SMA Municipality Overall Rural Overall
Law Enforcement (n=342)
68.4 60.7 65.7 63.7 64.6
Land Administration (n=717)
48.7 41.7 46.2 54.4 50.9
Judiciary (n=231) 39.7 29.2 35.6 46.0 41.7Local Government (n=350)
47.1 51.0 49.2 22.9 32.5
Health (n=365) 18.5 15.2 17.3 15.6 16.3Banking (n=264) 8.6 9.5 8.9 20.7 15.7Electricity (n=405) 8.3 15.3 10.1 21.6 14.3Education (n=334) 4.7 5.9 5.1 11.6 8.8NGO (n=145) 10.7 2.2 6.1 6.8 6.5Tax (n=53) 12.5 6.3 10.2 1.1 5.1Others (n=204) 14.6 20.2 16.7 16.6 16.6All Sectors (n=2095) 41.1 39.9 40.2 43.4 42.2
Table 3.4 also gives an indication of how much bribe a household during interaction paid during the reference period. According to this table, a Bangladeshi household paid on average Tk. 4,134 in a year for receiving services from different sectors. The corresponding figures for urban and rural areas are Tk. 5,174 and Tk. 3,337 respectively. Considering the average household size of 4.8, the per capita bribery during receiving service is Tk. 861. On the other hand, the average amount of bribe paid by a household is the highest for receiving services from banking, followed by judiciary, land administration and law enforcement. In urban areas, higher bribe amounts are observed for interaction with education, health, land administration, law enforcement and banking sectors. Conversely, in rural areas, higher bribe amounts are observed for interaction with electricity and local government.

16
Table 3.4: Average amount of bribe a household paid during interaction
Average amount of bribe Urban
Sector
SMA Municipality Overall
Rural Overall
Law Enforcement 3,605 6,165 4,513 3,462 3,940Land Administration
5,715 4,722 5,334 3,749 4,408
Judiciary 3,960 10,638 6,104 3,966 4,825Local Government
538 499 522 1,148 883
Health 629 342 534 516 524Banking 17,796 17,220 17,556 1,319 7,799Electricity 1,535 1,066 1,356 2,521 1,993Education 1,137 4,448 2,720 265 1,296NGO 1,075 470 752 259 420Tax 5,502 1,247 3,661 139 2,293Others 8,426 3,783 6,666 8268 7,578All Sectors 5,227 5,082 5,174 3,337 4,134
3.5 Volume of bribe
Total volume of bribe paid by the entire population in the reference year (2007) is estimated around 54 billion Taka. Table 3.5 shows estimates of total amount of bribe the households paid annually in different sectors. It is estimated that the households in Bangladesh had to pay Tk. 54.434 billion during the reference year to receive services from all sectors. The incidence of bribery and average bribe amount are found highest in land administration among all sectors, total amount of bribe amounting to Tk. 16.078 billion. Given the fact that more than half of the households are functionally landless, this amount is alarmingly high. The second and third largest recipients of bribe are law enforcement (Tk. 8.802bn) and judiciary (Tk. 6.707bn) respectively. Considering the fact that land being the most critical resource in the country, law enforcement agencies being perceived as protectors of the disadvantaged people and the judiciary being the ultimate shelter for the helpless individuals and communities, these three sectors are found to be the most corrupt and thus make the challenge of good governance into a farce. The smallest amount of bribe has accrued to the NGO sector (Tk. 209 million), though it is a paradox that NGOs often advocate for good governance.

17
Table 3.5: Total volume of bribe paid by households in different sectors
Sector
Average amount of bribe
households paid in consideration of whole sample
(Tk.)
Total amount of bribe households
paid in consideration of
whole population
(million Tk.)
Percentage of sector-wise
bribe
Land Administration 536.5 16,063 29.5Law Enforcement 293.6 8,790 16.1Judiciary 224.1 6,710 12.3Banking 175.5 5,254 9.7Electricity 158.2 4,737 8.7Local Government 62.5 1,871 3.4Tax 49.7 1,488 2.7Education 39.1 1,171 2.2Health 35.9 1,075 2.0NGO 6.8 204 0.4Others 236.3 7075 13.0Total 1,818.1 54,434 100.0Note: Total households in Bangladesh in 2007: 29.94 million10
3.5 Incidence of bribery between two time periods
The survey attempted to bring out a comparative picture of prevalence of bribery during July-December 2006 and January-June 2007. The result is mixed. In some sectors corruption in the form of bribery has increased, on the other hand, it has decreased in some sectors. Although the overall incidence of bribery is found marginally higher in the former period than in the later period, the difference is not statistically significant11. The incidence of bribery was increased in education, health, land administration, local government and NGO. Although the incidence of bribery in education is found higher in the former period than in the later period, this sector is more prone to periodicity as most of the admission related corruption take place in starting months of a year. So this increase should be considered cautiously. The sectors that showed decline in incidence of bribery include law enforcement, judiciary, electricity, bank and tax. This might have happened due to focused anti-corruption drive by the caretaker government after assumption of office on 1/11 2007.
10 Projected households using Exponential Growth rate based on the provisional population estimate of BBS for 2005 11 The two tailed Z test to determine if two independent proportions are significantly different from one another shows that the difference falls within the confidence limit. This means that two proportions are not statistically different (for detail, please sees Appendix D1).

18
Table 3.6: Incidence of bribery by time periods
Percent against the periods Sector Jul-Dec
’06 Jan-Jun’07 In both periods
Education* 12.5 44.5 43.0 Health 32.0 36.9 31.1 Land Administration** 39.4 45.1 15.6 Local Government** 38.2 47.9 13.9 NGO 33.3 35.7 31.0 Others 35.5 44.5 20.0 Law Enforcement* 49.7 37.3 13.0 Judiciary 31.9 28.8 39.3 Electricity 41.0 38.7 20.4 Banking* 55.4 22.7 21.9 Tax 44.9 34.9 20.4 Overall 37.5 39.3 23.1
* denotes significant at 5% error level ** denotes significant at 10% error level

19
Chapter 4
Education
Education is a basic right of citizens and indispensable prerequisite for the advancement of a society. A citizen, with quality education, is a key asset/capital for the nation to pursue excellence in the field of economy and building a civilized society. Keeping this view in mind, each government prioritized the policies to ensure, at least, the primary education for all children and to maintain high attainment rate at schools.
Although the government has undertaken some positive initiatives, the quality of education is still in question. Total rate of enrollment was 18.4 million in 2003 and it decreased to 16.2 million in 200512. According to TIB’s Corruption Database Report 2005 (released on July 5, 2006), education sector was ranked the most corrupt sector13. As per the National Household Survey in Corruption, also conducted by TIB in 2005, the incidence of corruption and harassments were pervasive at primary education level. Although primary education is free, 40% of surveyed households revealed that while enrolling their children in primary schools, they paid extra money/fees. Through several Report Card surveys, TIB reported several incidences of corruption and irregularities at primary and secondary education levels.
4.1 Households’ interaction with education sector
Access to education is one of the basic rights and it is a vehicle to attain country’s human development. Besides, Bangladesh is also obliged to meet the MDG target to ensure high rate of literacy by 2015. According to this Household Survey on Corruption, 72.2% households interacted with educational institutions for the education of their family members. The interactions with education in urban and rural areas do not vary considerably.
Table 4.1: Distribution of students in different educational institutions
Institutions Government Non-government and Private Primary School 59.0 41.0 Secondary School 33.0 67.0 College 45.5 54.5 University 63.6 36.4 Madrasha 18.7 81.3 Others 11.9 88.1 Overall 43.3 56.7
According to the survey (see Table 4.1), majority of students are studying in non-government and private institutions (56.7%). For primary and university education, students’ enrollment in government institutions is found dominant. For secondary, higher secondary and madrasha education, non-government and private institutions are serving majority of students. Students in others types of institutions are mostly served by non-government and private institutions, presumably due to enrollments of students in kindergartens 12 Bangladesh Economic Review, 2007 13 Those sectors in which frequency of corruption exceeded 5 percent of the total number of reports

20
4.2 Irregularities in enrollment/admission
For the last two decades, getting admission in educational institutions has become highly competitive, particularly in urban areas, for growing demand for quality education. Limited choices for the guardians as well as excessive demand have created a culture of donation/rent seeking behaviors in educational institutions with higher demand.
According to the survey, overall 9.0 % students in all educational institutions encountered irregularities during getting admission. Such irregularities were found marginally higher in rural areas (9.1%) than in urban areas (8.6%). Students in primary education experienced highest such incidences (11.2 %). Secondary, college and Madrasha students experienced such irregularities closed to the overall incidence. However, students in university education experienced lowest such incidences (0.6%) (see Table 4.2).
Table 4.2: Incidence of irregularities in getting admission by students
Urban (%) Institutions
Rural (%) SMA* Municipality Overall
Overall (%)
Primary School 11.0 12.0 11.2 11.7 11.2 Secondary School 7.0 8.1 10.6 8.8 7.8 College 6.8 5.1 6.1 5.5 6.6 University 0.0 2.5 2.9 2.6 0.6 Madrasha 11.0 1.2 9.7 3.5 10.7 Others 6.5 3.7 15.3 8.4 8.4 Overall 9.1 7.8 10.2 8.6 9.0
* SMA = Statistical Metropolitan Areas There are a number of reasons for which students experienced irregularities. Of those students, who experienced irregularities, overall 65.3% students had to pay donation or unauthorized payments for admission. Around there fourth of students enrolled in primary and maddrasha education experienced irregularities relating to donation or unauthorized payments. Taking assistance from influential person was the next dominant irregularity. Of those students who experienced irregularities, 33.4% of them took assistance from influential persons. Students studying or enrolled in maddrasha and other educational institutions experienced such irregularities in higher proportions (see Table 4.3).
Table 4.3: Types of irregularities experienced in different institutions
Types of irregularities Institution Transaction of
unauthorized money Took Assistance of
the influential person Others
Primary 75.2 24.2 0.6 Secondary 63.3 35.4 1.3 College 33.3 60.0 6.7 Madrasha 73.3 26.7 0.0 Others 23.1 76.9 0.0 Overall 65.3 33.4 1.3
According to Table 4.4, of those students who made unauthorized payments (bribe/donation/extra) in getting admission on average they paid Tk. 574. In term of residence the students in urban areas paid three times higher unauthorized payments in

21
getting admission that those of rural areas. In consideration of educational institutions, the college level students paid highest amount of such payment in getting admission.
Table 4.4: Donation or unauthorized payments transacted in getting admission
Average bribe/extra fee / donation (Tk.) Institutions
Rural Urban Overall Primary 112 917 340 Secondary 836 1009 877 College 1535 200 1201 Madrasha 89 460 121 Other 102 1090 349 Overall 389 1149 574
4.3 Regularity in holding class and exam
Regularity in taking classes as well as holding exams is an important performance indicator for ensuring quality education. Concerned education officials at district and upazila level are responsible for monitoring classroom activities in educational institutions.
According to the survey, 88.2% students reported that their educational institutions had maintained regularity through holding routine classes. However, students of secondary schools, colleges and universities reported to have experienced lesser regularity (see Figure 4.3).
82848688909294
% o
f stu
dent
s
Prim
ary
Scho
ol
Seco
ndar
y Sc
hool
Col
lege
Uni
vers
ity
Mad
rash
a
Oth
ers
(NFE
P, K
S, T
SC,
and
OU
)
Ove
rall
Types of institutes
Figure 4.2: Percent of students reported about the regularity in taking classes by institution
Seven percent students of surveyed households reported to have experienced delays in declaring exam results. This syndrome is high (9.6 %) in the kindergarten schools, which are out of the purview of government monitoring mechanism (see Appendix C1).

22
4.4 Private tuition
Ideally, educational institutions are expected to ensure complete delivery of lessons in the classroom and they should have good mechanism to support students who are weak and falling behind. Nevertheless, 21.5% students of surveyed households reported to have private tutors as they presumably did not receive full attention and benefit from classroom teaching. The extent of having private tutors is pervasive among college level students, as high as 31.4% students reported to have private tutors, thus consume students’ precious time and exert monetary burden on the guardians. This might happen for lack of monitoring of educational institutions by the authority concerned and poor salary structure of teachers that encourage them to earn extra money from private tuition.
The above figures on the extent of having private tutors places a question on whether students of those households get any benefit from such practice, and if so to what extent. Findings show that 38.7 % students of those households who reported to have tutors, admitted to have benefited from private tutors and this rate is 30.5% in rural areas, but almost one-third in urban areas i.e. 8.2 % (see Table 4.5).
Table 4.5: Incidence of being benefited from private tutor
Benefit from private tutor (% responses) Educational Institutes Rural Urban Overall
Primary School 33.9 34.9 34.1 Secondary School 43.3 40 42.6
College 45.7 40 44.4 University 45 42.2 44.4 Madrasha 35.5 33.3 35.0
Others 41.7 37.4 40.8 Overall 30.5 8.2 38.7
Students of all institutions experienced such benefits almost in similar extent. Evidently, more than 30% to 42% students of each category reported about the benefits of having private tutors. The major concern is the considerable presence of private tutors in higher secondary, graduate level colleges and private universities.
The responding households were also asked about the types of benefits they experienced for having private tutors (see Table 4.6). Among the students who reported to have private tutors, around one half of them mentioned that they received hints about the questions before the exam and another half got exaggerated marks in the exam. It is evident from data that private tuition help students mostly to pass exams with ease. Only 3.5% students admitted that they receive quality education from their tutors.
Proportion of students who reported about getting hints about the exam questions earlier is the highest (55.6%) in the college level and proportion of students getting exaggerated marks in exam is found highest among the Madrasha students (57.4%). From ethical point of view, both these acts should be regarded as corruption. These wrongdoings will ultimately affect the integrity of both students and teachers and the quality of education pursued by the students.

23
Table 4.6: Gains & effect of having private tutors
Students reporting on private tutor (%)
Institution Getting
suggestions about questions and
exams
Favoring with exaggerate
marks in the exam sheets
Get help in the exam hall
Teach accurately at home
Primary School 47.3 48.4 0.8 3.5 Secondary School 53.3 41.4 1.3 4 College 55.6 35.6 4.4 4.4 University14 46.4 32.1 14.3 7.1 Madrasha 37 57.4 5.6 Others 48.5 42.4 3 6.1 Overall 49.5 44.1 2.5 3.9
A number of TIB’s Report Cards studies reported about experiencing teachers’ misbehavior by the students for not hiring them as tutor. According to Table 4.7, 9.1% of the students who did not have any private tutor reported instances of misbehavior by teachers for not engaging them as private tutors; of which the overall incidence rate is around 60 % of experiencing misbehavior of teachers for not having them as private tutor and this rate is two-third (69%) in rural areas.
Table 4.7: % of Misbehavior of teachers for not having them as private tutors
Behave wrongly Educational Institutes Overall Rural UrbanPrimary School 63.3 73.8 26.2 Secondary School 59.0 66.1 33.9 College 55.9 60.5 39.5 University 56.2 61.1 38.9 Madrasha 63.0 73.2 26.8 Others 59.4 66.7 33.3 Overall 60.6 69 31
Such rate is the highest for primary-going students (63.3%). This might happen due to the apparent threat of getting low marks in practical exams. Within rural-based institutions, around 74 percent students of both primary and madrasha level of education reported about misbehaver of the teachers in case of not having private tuitions. Besides, misbehavior in the classroom and non-cooperation by the concerned teachers were reported by 19.0% and 34.5% students respectively (see Appendix C2).
4.5 Entitlement for Upabritti
The government of Bangladesh has been implementing a program of upabritti (sub-scholarship), especially to encourage female education of poor and marginalized households in rural areas. Since the number of scholarships is limited, the demand for it has been high. This situation can be exploited for biased selection. Overall, 25.1% students of surveyed households reported about receiving sub-scholarships (see Table
14 Graduate level Colleges and Private Universities

24
4.8). The proportion is the highest for secondary level students (34.0%), closely followed by college level students (30.2%).
Table 4.8: Percent of students received sub-scholarship by institutions
Institution % of students
Primary School 23.5 Secondary School 34.0 College 30.2 Madrasha 15.1 Others 18.9 Overall 25.1
Among those students who got upabritti, 22.0% experienced harassments for receiving this (see Table 4.9). Highest such harassment was experienced by the primary level students (25.1%) followed by secondary level students (21.1%).
Table 4.9: Students experiencing harassment for getting sub-scholarship
Institution % of students harassed Primary School 25.1 Secondary School 21.1 College 5.3 Madrasha 12.5 Others 15.8 Overall 22.0
The nature of irregularities involved in getting the scholarship includes persuasion through influential persons, personal request to the head/class teacher, payment of bribe/commission for entitlement, etc. Among these irregularities, the receiving of payment of bribe or commission for enlistment is dominant. Of those students who experienced irregularities, 74.6% of them paid bribe/commission for the enlistment. Households of these students on average paid Tk. 90.72 as bribe/commission for scholarship. The corresponding average payments by the primary and Madrasha level students were Tk. 107 and Tk. 111 respectively.
The major beneficiaries of such illegal transaction were concerned school headmasters (44.7%) and class teachers (42.4%). Among other beneficiaries are Union Parishad Chairman and Members, SMC members, Upazila Project Officer (SS) and bank officials.
The households reported several reasons for not being enlisted for sub-scholarship. About 31.6% surveyed households reported that school authorities failed to enlist their eligible students (see Appendix C5). The others reasons in this regard include poor class attendance (5.1%), location of school at municipal areas (21.6%) that does not allow such entitlement, intentional rejection (15.5%), failing to get minimum marks in the exam (5.6%), being financially solvent (4.3%) and studying in Madrasha (4.3%).
4.6 Payment without receipt
TIB’s report cards and earlier surveys reported about receiving of unauthorized payments without any receipt by school authorities from students. As many as 18 %

25
students of surveyed households reported about the presence of such practices and of this amount the highest incidence (around 26.2%) of payment without receipt are made in primary schools stand at rural areas. Among the types of institutions, primary level students reported about the presence of such practices in the highest proportion (22.8%). The surveyed households also mentioned about the presence of such practices in secondary, college, madrasha, and others such as kindergarten schools and even in NFPE schools (see Table 4.10).
Table 4.10: Incidence of payment without receipt to institutions
% of students made payment without receipt Institution Overall Rural Urban
Primary School 22.8 26.2 10.7 Secondary School 15.7 17.2 10.6 College 7.6 6 13.3 Madrasha 3.7 4.7 - Others 9.6 9.5 9.9

26
Chapter 5
Public Health
Article 15 of the Constitution of Bangladesh puts obligations on the state to ensure basic rights of all citizens that also include right to health care. Following this constitutional guidance, the Government of Bangladesh (GoB) through its various policies, plans and programs, attempts to ensure health care services to all citizens, particularly the disadvantaged groups, such as, the poor, women and children. The government has established nationwide infrastructure to deliver health care services. But the quality of services is poor. There are many problems that have almost crippled public health services that include absence of doctors and service providers, their negligence of duty, maltreatment of the service recipients, unavailability of medicines, collection of fees illegally, unhealthy and unhygienic condition of the health service centers, lack of privacy and so on. Corruption and irregularities that the households experienced in last one year while receiving health services from different government health service delivery institutes are analyzed in this chapter.
5.1 Services in government health centers
In last one year, 44.9% of surveyed households received services from different government health facilities. Proportion of households received services from public facilities is higher in rural areas (50.1%) than in urban areas (37.4%) (Table 5.1).
Table 5.1: Households receiving services from public health facilities
Residence % of households received services Rural 50.1 Urban 37.4 Overall 44.9
With an aim of brining health services at the doorsteps of common people, the government has established different health facilities at different levels with a distinct referral mechanism. Among the government health facilities, the Upazila Health Complex (UHC) serves majority of the patients. Household members who received services from government facilities, 40.6% found to have received services from the UHCs. The General Hospitals rank second that serve 25.5% people. Union level Upa Shastha Kendra (USK- sub-health center) provided services to 20.3% people. Medical College Hospitals that stand at the top of the ladder of the referral system serve only 10.1% members of surveyed households (see Figure 5.1).

27
Figure 5.1: Percent of household members visited different GoB hospitals
General Hospital, 25.4
Upa-shasta Kendra, 20.3
Medical College Hospital, 10.1
Others, 3.4
Upazial Health Complex, 40.6
Table 5.2 shows that around three-fourths members of surveyed households received out-door services from these facilities. Another 14.6% received indoor services. Besides, 9.8% people received emergency treatment. Less than two percent availed family planning services. Data is indicative of meager in-door facilities in the public health care system.
Table 5.2: Type of service received
% of household members Type of service received Rural Urban Overall
Out-door 76.6 69.4 73.8 In-door 14.4 15.0 14.6 Emergency 7.2 13.9 9.8 Family Planning 1.9 1.7 1.8 Total 100.0 100.0 100.0
5.2 Harassment and bribery
According to the survey, two out of five service recipients faced harassment while visiting government health facilities (Table 5.3). Amongst the people who received services, one-third of them Those who experienced different forms of harassment, 33.4% of them paid extra money during receiving treatment. They paid on average Tk. 461 as bribe or speed money to receive services from government health facilities.
Table 5.3: Status of service recipients reported to be harassed
% of households members Faced harassment Rural Urban Overall
Yes 39.8 37.5 39.0 No 60.2 62.5 61.0 Total 100.0 100.0 100.0
Table 5.4 presents the types of hospitals from where the members of responding households paid bribe. Paying bribe during receiving services was found most prevalent in UHCs. It was found that almost half of the patients paid bribe to receive

28
services. This proportion is over 20% for the union level USKs. Findings show that bribery is more rampant in rural health centers.
Table 5.4: Households paying bribe in different hospitals
% of household members Type of hospitals Rural Urban Overall
Upa Shastha Kendra 36.1 31.8 34.8 Upazila Health Complex 30.0 27.4 29.2 General Hospital 11.6 14.8 12.6 Medical College Hospital 7.1 16.6 10.2 Others 15.1 9.4 13.3 Total 100.0 100.0 100.0
Table 5.5 shows that almost all categories of professionals and workers engaged in the health centers are involved in bribery, doctors and nurses being the major bribe takers. Among other bribe takers are the employees, ward boys and brokers.
Table 5.5: Types of bribe takers
% of household members paying bribe
Types of bribe takers
Rural Urban Overall Doctors 47.6 33.9 42.2 Nurses 20.0 32.2 24.8 Employees 5.2 14.8 9.0 Ward boy 2.8 4.4 3.4 Brokers 17.0 12.4 15.2 Others 7.4 2.3 5.4 Total 100.0 100.0 100.0
To ensure citizens’ access to health facilities, the government has made a policy that patients do not need to pay money for consulting a doctor in a government hospital. But it is found in the survey that doctors in hospitals take money from patients for writing the prescription. According to the survey findings, about 13.6% of surveyed households reported that doctors had taken money for writing prescription during the consultations. In doing so, the doctors received on average Tk. 95 per consultation.
5.3 Private business by public health professionals
Doctors in Bangladesh are often blamed for not taking proper care of their patients in government health facilities and to advice patients to visit their personal chamber and/or clinic. Doctors sometimes defend themselves in the pretext of unavailability of that particular service in government health facilities. More than one fifth of the households (22.7%) who received services from government health facilities reported that they had been advised to visit private chamber/clinic of the doctor (see Table 5.6). This phenomenon is relatively higher in urban areas, presumably for the existence of more private facilities, then rural areas (USK and UHC).

29
Table 5.6 Proportion of patients advised to visit personal chamber/clinic
% of household members advised Institution Rural Urban Overall
Upa Shastha Kendra 19.4 26.1 21.7 Upazila Health Complex 16.5 27.9 20.5 General Hospital 19.9 28.9 23.1 Medical College Hospital 26.7 38.5 31.6 Others 20.4 33.3 24.9 Overall 19.4 29.2 22.8
5.4 Pathological tests
Pathological tests are essential for diagnosing a disease and for the treatment of patients. Every public hospital maintains a pathological center, though the range of services or tests may vary in quality according to the level of hospital. In the survey, it was found that members of 39.5% households were asked to do pathological tests when they consulted with doctors. Among them, 55.8% household members did pathological tests from government hospitals and 44.2% of them did pathological tests from privately-owned hospitals and clinics (Table 5.7).
Table 5.7: Facilities availed for pathological tests
% of household members Types of facilities Rural Urban Overall
Government Hospitals 52.5 59.3 55.8 Non-Government Diagnostic Hospitals/Clinics
48.5 40.7 44.2
Total 100.0 100.0 100.0
For pathological tests, the government facilities charge fees set by the government. These charges are usually nominal and lower than the charges that private hospitals/clinics charge, so that the general people can afford such services from government hospitals. Besides, the quality of such services in government hospitals is better in public perception, as these have good technicians and accompanying technologies. For these two reasons, people tend to get pathological services from government hospitals. However, in the survey, it was found that 24.6% of service recipients paid extra money in addition to official rates (Table 5.8). The service recipients paid on average an additional Tk. 260 for pathological tests in government hospitals/facilities.
Table-6.7: Extra money paid for pathological tests in government facilities
% of household members Extra money paid Rural Urban Overall
Yes 25.3 23.0 24.6 No 74.7 77.0 75.4 Total 100.0 100.0 100.0

30
In response to a question whether the service recipient households were compelled to do pathological test from specific pathological center or clinic, 41.1% service recipient households reported that they had to do so. This means that the patients had to incur more costs for the same services that had been available in public health centers, as well as they suffered intimidation by a section of public health professionals for their private gains, that eventually undermined the image of public health service in people’s perception.

31
Chapter 6
Land Administration
Land is the most critical natural resource in a land-scarce country like Bangladesh. Both directly and indirectly, its particular use and management affect the quality and quantity of production and employment associated with land. Therefore, land administration has become one of the key public service sectors. However, corruption in this sector has been widespread for a long time. There is hardly anyone who can escape land offices without paying bribe and experiencing harassments after receiving services. Respondents of National Survey on Corruption 1997 identified ‘record office’, ‘sub-registry office’ and ‘tahsil’ office as the fourth, fifth and seventh corrupt public offices in the country. For this reason, land administration was included in the current survey as one of the vital sectors. Information was collected relating to what forms of corruption households experienced during receiving services, who were the victims, what amount of bribe households had to pay for receiving those services, etc.
6.1 Interaction with land administration
Out of 5,000 households covered by the survey, 1,352 (25.20%) interacted with or received services from the institutions of land administration. Among those who availed services from the land offices, 717, that is, the majority experienced incidence of bribery. On average, each of them paid Tk. 4,409. In consideration of whole sample, 14% households had to pay bribe during receiving services from land offices and on average a household had to pay Tk. 537.
As agricultural of Bangladesh is primarily dependent on land, most of its land related activities take place in rural areas. Therefore, households in urban areas are comparatively less in number and frequency to receive services from land offices. However, the average amount of bribe a household paid for receiving services is higher in urban areas than in rural areas, presumably because of higher market price and relative scarcity of land.
As the services related to land are diverse and more than one institution is involved, households have to interact with different land offices. These services include land registration, mutation, purchase and sale of land, obtaining documents, etc.
Among different reasons reported by the households, payment of land tax was found to be the main reason (33.0%) for interaction with land office. At least one in five households went to land offices for each of the following reasons, such as obtaining of documents (23.9%), land survey (21.2%), mutation (20.9%) and land registration (20.1%). Another 2.1% households reported that they went to land offices to hide land price (Table 6.1).

32
Table 6.1: Reasons for interaction with land administration
% of service recipients who interacted
Types of service
Rural Urban Overall Yearly tax payment 26.5 42.0 33.0 Withdrawal of documents 29.4 16.1 23.9 Land survey/defining boundary 21.5 20.7 21.2 Mutation 20.1 22.1 20.9 Land registration 25.1 13.3 20.1 Allotment of Khas land 3.3 7.0 4.9 To hide actual land price 3.1 0.9 2.1 Others 2.9 4.6 3.6
6.2 Incidence of bribery
While interacting with different land authorities, households are compelled to pay bribe in varying proportion. In the survey it is found that the highest number of households (70.0%) experienced the incidence of bribery to obtain documents. The other services for which the households had to pay bribe next to the above proportion are Khash land allotment (65.6%), land survey (64.7%) and mutation (63.4 %). Although households in highest proportion (33.0%) interacted with land offices for payment of land tax, proportion of households who paid bribe (26.0%) for this stands out lowest among all services received (Table 6.2).
Table 6.2: Incidence of bribery for receiving different types of land services
% of service recipients paid bribe Types of services Rural Urban Overall
Withdrawal of documents 72.2 62.9 70.0 Allotment of Khash land 72.0 61.5 65.6 Land Survey/Defining Boundary
68.7 59.0 64.7
Mutation 64.3 62.2 63.4 Land selling and purchase 58.3 60.0 58.6 Land Registration 43.3 40.3 44.6 Yearly tax payment 28.4 23.9 26.0 Others 87.0 76.0 81.3 Overall 54.4 46.2 50.9
Amount of bribe paid also varies according to the nature of services people receive. The survey shows that households on average had to pay Tk.5,680 to receive allotment of Khas land, which is the highest that service recipients had to pay “in exchange” of a service from land offices. For Khas land allotment households in urban area paid more than double than those of rural areas. For land registration and mutation households on average had to pay Tk. 4,237 and Tk. 3,303 respectively. The lowest average bribe amount was found for land tax payment (Table 6.3).

33
Table 6.3: Average amount of bribe paid by to land offices
Average amount of bribe paid (Tk.)
Type of service
Rural Urban Overall Allotment of Khas land 3,186 7,550 5,680 Land registration 3,090 7,422 4,237 Land survey/defining boundary 3,685 4,140 3,857 Mutation 2,701 4,125 3,303 Land selling and purchase 1,488 3,333 1,857 Withdrawal of documents 1,344 2,526 1,639 Yearly tax payment 938 1,424 1,170 Others 4,329 4,009 4,281 Overall 3,055 4,945 4,409
6.3 Persons involved in bribery
In transactions of bribery, a few public officials and employees in land offices are customarily involved. Apart from them, some professional groups like Deed Writers and Stamp Vendors are also involved in dealing and or negotiation of bribery. Presence of brokers in such transactions can not be ignored. In the survey it was found that Tahsilders’ involvement was leading for services like tax payment (77.6%), mutation (56.4%) and withdrawal of documents (36.3%). Deed writers were found in highest proportion in dealing of bribery for services like land registration (48.7%) and selling and purchase of land (80.0%). Involvement of Sub-Registers was found highest in land registration (Table 6.3). In cases of mutation, Assistant Commissioner’s involvement in bribery was found in highest proportion (7.04%). This means that persons in almost every layer, from brokers to elite civil servants, involved in land administration have been sucking hard-earned money from the people for whom land is so critically important for life and livelihood.
Table 6.4: Persons involved in bribery
Type of service
Ass
ista
nt
Com
mis
sion
er
Sub-
regi
ster
Rev
enue
off
icer
Stam
p V
endo
r
Dee
d W
rite
r
Tah
sild
ar
Surv
eyor
Bro
kers
Oth
ers
Land registration 0.9 19.1 0.0 3.5 48.7 13.0 0.0 9.6 5.2Land selling and purchase
0.0 0.0 0.0 13.3 80.0 6.7 0.0 0.0 0.0
Mutation 7.4 5.0 2.5 1.0 3.0 56.4 2.0 9.9 12.9Yearly tax payment 1.9 0.0 0.9 0.0 0.9 77.6 1.9 5.6 11.2Land survey/defining boundary
3.5 2.0 1.5 0.5 0.5 7.9 70.3 6.9 6.9
Allotment of Khas land 2.3 0.0 7.7 0.0 0.0 15.9 43.2 20.5 11.4Withdrawal of documents
3.0 3.0 0.9 1.7 12.9 36.3 7.3 18.0 16.7
Others 13.2 0.0 10.5 0.0 2.6 13.2 13.2 0.0 47.4

34
Chapter 7
Law Enforcement Agencies
Police, RAB, Ansar & VDP, Chaukidar and Dafadar are responsible for ensuring law and order situation in the country. However, in the later half of the survey period, under emergency rule, the joint forces comprised of defense personnel, played a role in maintaining law and order and investigating serious crimes and offences. Among the law enforcing agencies, the police holds a special position in maintaining law and order. But corruption and irregularities in these agencies, particularly in police, have been reported in different occasions by media and other stakeholders like policy makers, ex-police officials, columnists, law professionals, ex-judges, human rights activists, civil society organizations and donors. This chapter deals with corruption and irregularities that the surveyed households experienced while receiving services from law enforcement agencies.
Using a separate section, this survey collected information on corruption that the households encountered to receive services from law enforcing agencies. Among the surveyed households, 10.7% interacted with law enforcing agencies.
7.1 Harassment/corruption committed by law enforcement agencies
Although it is formally pronounced and written explicitly in front of many police stations that “sheba-e policer dharma” (the religion of the police is to serve), the popular saying is, “baghe chhuley atharo gha”, meaning “if one is touched by a tiger (police), there is no escape from harassment”. This phenomenon has been clearly manifested in the TIB survey. The survey revealed that 96.6% among the surveyed households experienced harassment and corruption during interacting with or receiving services from law enforcing agencies. Among them, the overwhelming majority of households (94.0%) experienced so from police, 4.9% from joint forces and 1.1% from RAB (Table 7.1). Among the victims, 62% are male and 38% female. It is to be noted that corruption and harassments among the law enforcing agencies are so institualized that incidence of corruption and harassments are almost equal in both rural and urban areas.
Table 7.1: Harassment experienced from by law enforcement Agency (LEA)
% of households Type of LEA Rural Urban Overall
Police 94.4 92.9 94.0Joint forces 4.9 5.0 4.9RAB 0.4 2.1 0.8Others (VDP, Ansar) 0.4 0.0 0.3Total 100.0 100.0 100.0
Table 7.1 presents different forms of harassment and corruption the households experienced from law enforcing agencies. The households reported bribery (41.6%) as the key offence committed by the law enforcement agencies. The other forms of corruption and irregularities committed by law enforcing agencies include misbehavior (21.5%), threat for torture (10.7%), arrest without warrant or case

35
(8.0%), filing of false FIR/charge sheet (6.7%) and negligence in filing cases (4.3%). Most of these harassments and irregularities were committed by the police. The joint force personnel mostly involved in misbehavior and threat for torture. However, in few cases, the households paid bribe to them particularly for avoiding arrest and torture in the “remand”.
Table 7.2: Different forms of harassment/corruption committee by Law Enforcement agencies
Percentage of Responses Types of harassment/corruption Police Joint
forces RAB Others Overall
Bribery and or extortion 44.0 9.9 25.0 38.5 41.6Misbehavior 20.1 41.3 25.0 23.1 21.5Threat for torture 10.2 20.9 0.0 7.7 10.7Threat to arrest without warrant 7.4 9.3 25.0 23.1 8.0Negligence in filing cases 4.6 0.0 0.0 0.0 4.1False FIR/charge sheet/case file 6.9 7.0 0.0 0.0 6.8Others 6.8 11.6 25.0 7.7 7.3Total 100.0 100.0 100.0 100.0 100.0 7.2 Extent of bribery
The survey found that 64.5% households who interacted with LEAs in the reference year paid bribe. There are a number of reasons for which the households paid bribe, particularly to police. The highest proportion of households paid bribe for police verifications and clearance certificates (21.7%) that the people need for various purposes. The other reasons for which notable proportions of households paid bribe include charge sheet (18.6%), general diary (14.8%) and to avoid arrest (10.0%). As police deals with a wide range of law and order issues, a considerable proportion of households (26.6%) paid bribe for several other reasons. (Table7.3). These findings reinforce popular belief, as well as media report, that many identified criminals are visible in the society, as they could negotiate with the police by paying bribe and thereby avoid arrest.
Table 7.3: Incidence of bribery for different services from Law Enforcement agencies
Percentage of Responses Types of harassment/corruption Police Others* Overall
Police verification and clearance certificate
22.0 0.0 22.0
Charge sheet 19.2 8.3 18.5 General dairy 15.5 0.0 14.9 Avoid Arrest 9.9 16.6 10.1 FIR 6.8 0.0 6.5 others 26.6 75.0 28.0 Total 100.0 100.0 100.0 *Others include RAB, Joint Forces, Ansar, VDP etc.
The survey found that on the average a household paid Tk. 3,940 during receiving services or interacting with law enforcing agencies. However, average bribe amount varies from one type of service to another. There is obviously a market for bribe

36
transaction that determines how serious is the offence or how essential is the service and, accordingly, the price is negotiated. For example, payment for avoiding arrest averaged Tk. 10,927 (Table 7.4).
Table 7.4: Bribe paid by households for different purposes
Average amount of bribe paid (Tk.) Purpose
Police Others Overall Avoid arrest 11,480 1,250 10,927 FIR 3,983 0.0 3,983 Police verification or clearance certificate
2,633 0.0 2,605
Charge sheet 1,699 2,000 1,703 General diary 795 0.0 795 Others 5,129 6,739 5,269 Overall 3,887.0 5,015 3,940
7.3 Physical torture
The survey identified 78 households whose member(s) were arrested by law enforcing agencies. Among them 22.1% reported to have been tortured physically while in custody. This aspect has also a gender dimension. Often innocent women are harassed for their relationship with the “accused”. Respondents were asked to comment whether law enforcement agencies exerted any discriminatory attitude on women during arrest. Among the respondents 34.1% mentioned that women members of their families were harassed by members of the law enforcement agencies for being woman. It may be mentioned that harassment of women may be of varying nature and many such cases remain unreported because of social prejudices and taboo.

37
Chapter 8
Judiciary
Judiciary is the sin qua non of a democratic society. It redresses the grievances of the people and resolves disputes. A social structure remains coherent and cohesive with the aid of a sound judicial system. It comprises of all courts and tribunals, which perform the delicate tasks of ensuring rule of law and protecting human rights. Studies have shown that corruption including undue political and executive interference is widespread in Bangladesh’s justice system, especially in the lower courts. It is also characterized by prolonged judicial process and delayed delivery of justice to the service recipients. In many cases, it seems to be a never-ending process, where the plaintiff does not receive any justice during her/his lifetime. Recently the current caretaker government took some reform measures including separation of judiciary from executive with the aim of making this service more effective and pro-people.
8.1 Household interaction with judiciary
Given its paramount importance, judiciary has been included in this survey as a specific sector. According to this survey, judiciary has emerged as one of the most corrupt sectors in the country. This chapter deals with a number of questions exploring household’s experiences with the judiciary that shows how an institution victimizes people whom it is supposed to protect.
Out of 5,000 surveyed households, 10.7% or 561 households received services from judicial system during the reference period. Almost equal proportion of households in both rural (10.1%) and urban (11.2%) areas sought judicial services. Among the service recipient households, 46.0% were plaintiff, 51.9% were accused and the rest 2.1% were witnesses.
Table 8.1: Proportion of households involved with different types of cases
% of responses Types of CourtsLand
disputes Criminal Offenses
Women torture
Smuggling Others Overall
Magistrate court 44.2 16.7 7.4 13.4 18.2 42.0Judge Court 66.0 10.5 5.1 9.2 9.2 49.1High/Supreme Court
54.1 21.6 2.7 10.8 10.8 5.8
Specialized Court 60.0 0.0 6.7 26.7 6.7 2.3Others 60.0 0.0 20.0 20.0 0.0 .8Total 56.0 13.4 6.1 11.5 12.9 100.0
Table 8.1 shows that more than half of the cases for which the surveyed households interacted with judiciary relate to land disputes (56%). It has already been mentioned in Chapter 6 how people are harassed by land administration agencies. Their problems and agony are further aggravated by the judicial system.
Justice system in Bangladesh has four tires- lower courts, special courts, the High Court and the Supreme Court. Among them the lower courts play a crucial role in the chain of the justice system, as maximum number of criminal and civil lawsuits is

38
handled by these counts. The survey revealed that among the households who received services from judiciary, the overwhelming majority of them went to the lower courts (43.6% to magistrate courts and 48.3% to judge courts) followed by the High Court and the Supreme Court (4.6%) and specialized courts (2.7%). However, there exist differences in terms residence against receiving services from magistrate and judge courts (Tabel 8.2).
Table 8.2: Households’ interaction with different courts
% of responses Types of Court Rural Urban Overall
Magistrate court 45.8 35.7 43.6 Judge Court 46.9 53.4 48.3 High & Supreme Court 3.6 8.0 4.6 Specialized Court 2.8 2.0 2.7 Others .8 .8 0.8 Total 100.0 100.0 100.0
8.2 Incidence of bribery
Findings of the survey show that 41.7% of the households who interacted with the judiciary in the reference year had to pay bribe for receiving services. This proportion is comparatively higher in rural areas (48.3%) than in urban areas (37.3%). The responding households, among those who paid bribe, had to pay on average Tk. 4,825 for receiving services. Average amount of bribe paid was found higher in urban households (Tk. 6,104) than in rural households (Tk 3,966).
Table 8.3 shows the incidence of bribe households paid in different courts. According to the table, bribery is most prevalent in magistrate courts and judge courts. Among the bribe paying households, 46.7% and 46.5% of them paid bribe in these two courts respectively for receiving services.
Table 8.3: Incidence and amount of bribery in different courts
% of households experienced bribery Types of Court Rural Urban Overall
Magistrate Court 48.7 39.4 46.7 Judge Court 44.9 52.1 46.5 High/Supreme Court 3.8 5.3 4.1 Special Court 1.9 2.1 1.9 Others 0.6 1.1 0.8 Overall 100.0 100.0 100.0
Almost same trend is visible in cases of amount of bribe paid by the households in different courts. Average bribe payment is found higher in the judge courts than in the magistrate courts. In terms of residence, the urban households paid higher amount of bribe in all courts than the rural households. Although the number of households interacted with special courts was found lower; but the average payment of bribe in this court was found the highest among those payments in different courts (Table 8.4).

39
Table 8.4: Bribe paid in different courts
Average amount of bribe paid (Tk.) Types of court Rural Urban Overall Magistrate Court 4,270 7,009 5,124 Judge Court 1,360 7,223 5,516 High Court 2,700 2,520 2,571 Special Court 1,400 12,500 5,840 Others 1,500 500 1,000 Overall 3,966 6,104 4,825
8.3 Actors involved in receiving bribe
The bribe paying households reported about different persons who received bribe from them. It is difficult to determine who the ultimate beneficiaries of the bribery are. It is alleged that some actors are active in receiving or negotiating the bribe on behalf of the ultimate recipients. Among the bribe-paying households, 36.9% paid bribe to court officials, followed by middlemen (31.1%), own lawyers (10.7%), public prosecutors (10.7%), opposition lawyer (2.1%) and judges (1.2%) (Figure 8.4). Though the proportion is comparatively low, yet some judges receive bribe directly from the service seekers (see Figure 8.3).
Figure 8.4: Actors of receiving or negotiating bribe
Middlemen, 31.1
Court Officials, 36.9
Judge, 1.2Opposite
Lawyer, 2.1Public Prosecutor, 10.7
Own lawyer, 17.6
Others, 0.4
In most of the cases (64.3%), the households pay bribe directly. Other persons that were used for transaction of bribe include lawyers (22.3%), court officials (5.8%) and middleman (7.6%).

40
Figure 9.1: Percents of household clients under different service entities
REB , 56.5
DESCO, 3.0
DESA , 9.7
PDB, 30.8
Chapter 9
Electricity
Electricity is one of basic amenities of modern life. It is a key element for sustainable economic development of a country. It also plays some positive roles for the expansion of business and industrial production. Access to electricity, especially of the rural people, is enshrined in the constitution of Bangladesh as a right. The Government of Bangladesh (GoB) has set agenda to ensure affordable and reliable electricity to all citizens by 2020. Recognizing the challenges that emerged at different junctures, different entities have been established for ensuring electricity services efficiently for all.
The generation of electricity involves huge capital investment and a long gestation period. In recent years, the country has been experiencing severe shortage of power. At the same time, low quality services delivered by the concerned agencies have exacerbated consumers’ misery. Consumers are reported to have experienced corruption and harassments in accessing day-to-day commercial services like installation and expansion of household distribution network, getting new connection, meter reading, billing etc. Although the current caretaker government has already adopted several steps to increase generation of electricity, quality of services should be addressed. This survey included electricity sector to gather the different dimensions of corruption and harassments experienced by the households.
9.1 Service providers
Under the guidance of the Power Division of the Ministry of Power, Energy and Mineral Resources, four distinct entities, PDB, DESA, DESCO and REB, are engaged for the generation, transmission and distribution of electricity throughout the country. Among the households that interacted for the services of electricity, Rural Electrification Board (REB) that works in rural areas covers the highest number of households (56.5%). Power Development Board (PDB) usually works in urban and peri-urban areas, which covers 30.8% households. The other two entities - Dhaka Electric Supply Authority (DESA) and Dhaka Electric Supply Company (DESCO) that work in Dhaka City cover 9.7% and 3.0% households respectively (Figure 9.1).
.

41
Figure 9.2: Percents of households received different services by entity
30.8
10.1 16.930 28.4
54
59.1
66.257.1 56.7
10.1
8.6
12.7 5.3 7.35.1
21.64.2 7.5 7.6
0%
20%
40%
60%
80%
100%
PDB DESA DESCO REB OverallService delivery entities
% o
f clie
nts
Relating to new connection Relating to electricity bill Relating to meter reading Others
Figure 9.3: Percents of households experienced harassment and corruption by entities
52.751.7
73.966.7
50.8
01020304050607080
PDB DESA DESCO REB Overall
Types of entities
% o
f hou
seho
lds
9.2 Services
According to Figure 9.2, the surveyed households interacted with concerned institutions for services mostly relating to new connection, electricity bill and meter reading. Findings show that majority of households (56.7%) interacted with different entities for services relating to electricity bill. In all four institutions, household interactions relating to the service stand out highest for this purpose. The services relating to new connection is the next dominant service for which the households interacted (28.4%). Almost equal proportions of households interacted with PDB and REB for this service. A considerable proportion of clients belonging to DESA interacted for other services relating to restoration of connection, connecting ripped cables, replacement of meters, repairing meters etc.
9.2 Corruption and harassments experienced by households
Findings presented in Figure 9.3 show that on average 52.7% experienced harassment and corruption during receiving services from electricty distrbutor agenices. Although the services of DESCO are supposed to be more customer friendly, the incidence of harassment and corruption is paradoxically found the highest (73.9%) in it. DESA ranks second in terms of the proportion of households experiencing harassments and corruption.

42
9.3 Harassment and corruption
Of those households who experienced harassments and corruption in electricity sector, the highest proportion of them (41.8%) experienced the incidence of bribery. Among other forms of harassment encountered were unnecessary wastage of time (27.8%) and inflated bill (9.8%). Bribery was most prevalent in PDB as 44.0% of its consumers experienced it during receiving services. The bribery situation is almost similar in REB. In DESCO, incidence of unusual delay was found highest in their services of DESCO, experienced by 41.9% households, while inflated bills mostly come from DESA, experienced by one in every three households (Table 9.1).
Table 9.1: Households experiencing different types of harassment
Types of harassment and corruption
Entity Name Unusual
delay Bribery Got
inflated bill
Got bill without
reading of the meter
Others
PDB 24.5 44.7 9.9 1.2 19.6DESA 18.4 36.8 31.6 2.6 10.5DESCO 41.9 29.0 16.1 0.0 12.9REB 29.6 41.2 7.9 1.4 19.9Overall 27.8 41.8 9.8 1.4 19.2
9.4 Bribery
Table 9.2 presents average amount of bribe the households paid in different entities for receiving services. The households who paid bribe for receiving services from different entities on average paid Tk. 1,993. The amount of bribe paid by households varies across entities ranging from Tk. 906 (DESCO) to Tk. 2,552 (DESA). As the REB has the highest number of subscribers among all entities (56.5%), the aggregate amount of bribe accruing to REB would be the highest.
Table 9.2: Average amount of bribe paid the households paid in different entity
Entity Name Average amount of bribe paid (In Tk.)
PDB 1,512 DESA 2,552 DESCO 906 REB 1,468 Overall 1,993
Table 9.3 shows that two-thirds of the households (67%) paid bribe for getting new connection. Such incidence of bribery differs considerably across entities. The highest such incidence was found among the subscribers of REB (78%). The extent of harassment is so high that one in every three DESCO subscribers and one in every five DESA subscriber paid bribe to avoid inflated bill. This is tantamount to double harassment; first to intimidate a subscriber with inflated bill and, secondly, to extort money in the name of adjusting the bill.

43
Table 9.3: Purpose for paying bribe
Reasons for bribery
Entities To get
connection without hassle
To avoid unnecessary
complain
To avoid inflated
bill
Restoration of
connection
To reduce
bill Others
PDB 53.0 10.6 9.1 6.1 6.1 15.2DESA 20.0 40.0 20.0 20.0 0.0 0.0DESCO 66.7 0.0 33.3 0.0 0.0 0.0REB 77.6 6.5 6.5 4.7 2.8 1.9Overall 66.9 8.8 8.3 5.5 3.9 6.6
Table 9.4 presents an overview of persons involved in bribery. The linemen were involved in transaction or receiving bribe in majority cases (51%). While linemen are the main culprit in all the institutions, their proportion is the highest in REB extorting money from the households (55%). In DESA, it is the resident engineer that extorts most of the households (23%), and in DESA, the meter reader is the major bribe taker from the households (23%).
Table 9.4: Categories of staff involved in bribery
Persons or categories of staff
Entities Lineman Resident
Engineer
Helper/
Repairmen/
Electrician
Broker Meter reader Others
PDB 47.3 15.3 10.0 5.3 10.0 12.0DESA 23.1 23.1 7.7 0.0 23.1 23.1DESCO 41.7 0.0 16.7 0.0 8.3 33.3REB 54.6 8.1 11.9 9.2 4.2 23.1Overall 50.8 10.8 9.7 9.0 6.9 12.9

44
Chapter 10
Local Government
It is very difficult for a central government to serve and govern people at the grassroots level through its traditional mechanism. For this reason, local government bodies emerged as a necessity. These bodies provide basic services and ensure civic amenities for the citizens in a locality virtually as a close door neighbors. These bodies accomplish socioeconomic development in a locality through some locally elected representatives. In Bangladesh, it is comprised of City Corporation and Paurashava in urban area and Union Parishad in rural areas.
10.1 Interaction with local government
In the survey out of 5,000 households, 949 households (19.0%) received services from local government bodies. The major services the households and its members received from them include birth/death registration, trade license issuance and renewal, holding tax payment and VGD/VGF and old age endowment. Union Parisahd, being a lower tier local government body, plays a crucial role in the arbitration of local disputes popularly known as Salish.
Households in highest proportion (32%) went to local government bodies to obtain birth/death/citizenship certificates. The next dominant services for which the households interacted with local government bodies are collection of fertilizer (28.8%), old age endowment (13.2%) and VGD/VGF cards (11.8%). In comparison to residence, households in urban areas received birth/death/citizen certificate and trade license services in higher proportion than those in rural areas (Table10.1).
Table 10.1: Percent of households receive different services
Percent of households Service Type Rural Urban Overall
Birth/Death/Citizen Certificates
21.7 62.2 32.1
Collection of fertilizer 35.9 7.1 28.8 Old-age Endowment 15.6 6.1 13.2 VGF/VGD Cards 15.0 4.1 11.8 Trade License 3.5 17.3 5.8 Others 8.2 3.1 8.2 Overall 100.0 100.0 100.0
10.2 Types of irregularities
Like other services, the services of local government bodies are also not free from irregularities. Table 10.2 shows that incidence of harassment (57%) was most prevalent among the irregularities households experienced during receiving services from local government bodies, followed by bribery (41.8%). However, bribery was found more prevalent in urban areas than in rural areas for the services of local government.

45
Table 10.2: Types of irregularities Percent of households Type of
irregularities Rural Urban Overall Harassment 67.8 27.6 57.6 Bribery 31.4 71.4 41.8 Others 0.8 0.8 .7 Total 100.0 100.0 100.0
10.3 Incidence of harassments
In the survey, it was found that incidence of harassment is most frequent during fertilizer collection (46.2%). In other services for which the households experienced harassment considerably when they collect VGD/VGF card (18.2%), old-age endowment (14.9%) and birth/death/citizenship certificates (11.6%). For receiving birth/death/citizen certificates, households in urban areas experienced harassment in higher proportion than those in rural areas (Table 10.3).
Table 10.3: Percent of households experienced harassment during receiving different services
Percent of households Service Type
Rural Urban Overall Birth/Death/Citizen Certificates
7.7 44.4 11.6
Collection of fertilizer 48.8 14.8 46.2 Old-age Endowment 15.7 11.1 14.9 VGF/VGD Cards 19.0 14.8 18.2 Trade License 1.9 7.4 2.4 Others 7.2 7.4 9.5 Overall 100.0 100.0 100.0
10.4 Bribery
Bribery is another key form of corruption encountered in local government bodies. The respondents who paid bribe to local government bodies, more than 60.0% of them paid it for collection of birth/death/citizenship certificates. However, for getting other services like getting trade license, fertilizer and old-age endowment, respondents, almost one in every ten households had to pay bribe (Table 10.4).

46
Table 10.4: Incidence bribery in receiving services from local government bodies
Percent of HH paid bribe Service Type Rural Urban Overall
Birth/Death/Citizen Certificates
55.1 68.9 62.0
Collection of fertilizer 10.9 4.1 8.2 Old-age Endowment 15.2 4.1 9.2 VGF/VGD Cards 5.5 0.0 3.2 Trade License 6.7 21.6 10.5 Others 10.3 1.4 7.0 Overall 100.0 100.0 100
Although incidence of bribery is most prevalent during receiving birth/death/citizenship certificates, households had to pay much higher amount of bribe for reasons that are more important and relevant or their livelihoods (Table 10.1). Average amount of bribe paid for a service is the highest for obtaining clearance for a house building plan (Tk. 5005) followed by installation of tube well (Tk. 3120), VGF/FGD card (Tk. 840), collection of fertilizers (Tk. 828) and obtaining trade license (493). Even the old people, who are too vulnerable in the society had to pay Tk. 310 on the average to avail boyoshko bhata (old-age endowment).
Table 10.5: Amount of bribe paid for different services
Average amount of bribe paid by a household
Type of service
Rural Urban Overall House building plan clearance 0 5,005 5,005 Installation of tube well 2,650 5,000 3,120 VGF/VGD card 971 0 840 Collection of fertilizer 448 1,805 828 Trade License 223 653 505 Old-age Endowment 301 351 310 Birth/Death/Citizen Certificates 77 90 84 Others 1,358 65 1,172 Overall 367 368 367
10.5 Salish
Union Parishad as a lowest tier of the local government plays a crucial role in arbitration of local disputes. This arbitration is commonly known as Salish, which is an informal and traditional social institution. The survey shows that 339 households took part in salish administered by the Union Parishad. The reasons for which the respondents participated in salish relate to common local level conflicts like land and monetary disputes, quarrel and marriage-related problems. Findings show that almost one half of the households seeking salish came to resolve land disputes.
About 51% respondents reported that they experienced irregularities during salish administered by the Union Parishad. These irregularities include nepotism, biased decision and bribery. Among them, nepotism is the most prominent, experienced by
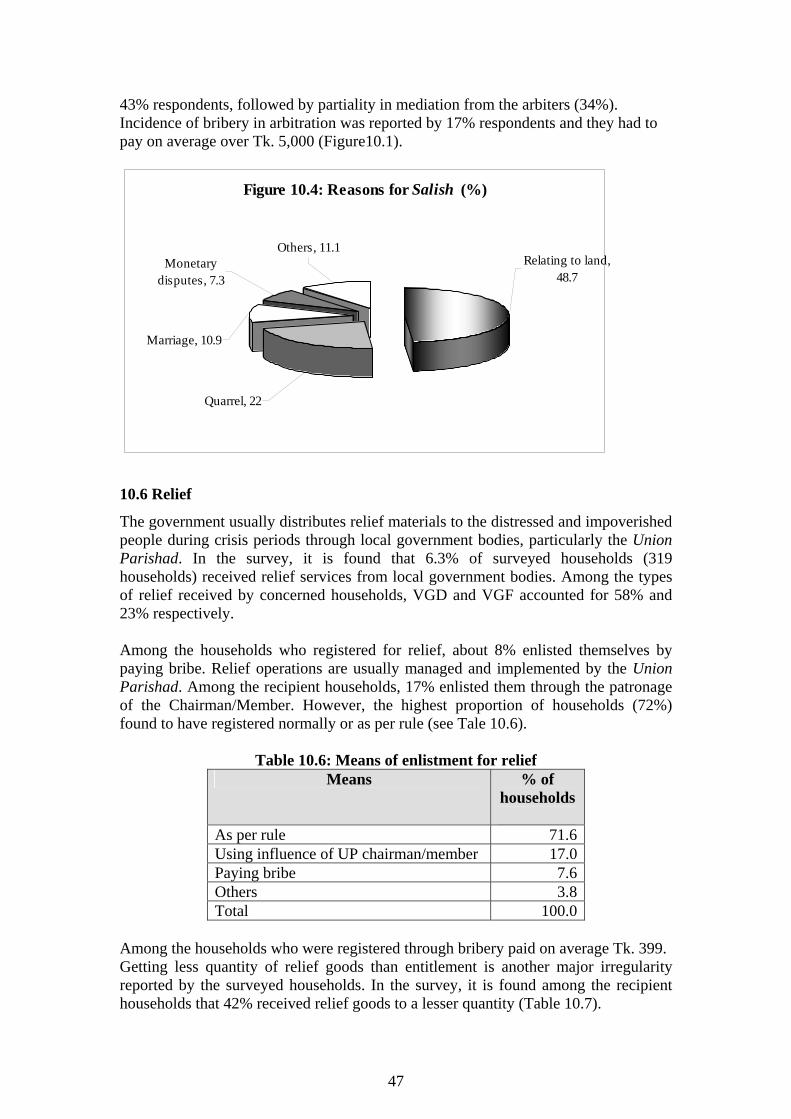
47
Figure 10.4: Reasons for Salish (%)
Quarrel, 22
Marriage, 10.9
Monetary disputes, 7.3
Others, 11.1Relating to land,
48.7
43% respondents, followed by partiality in mediation from the arbiters (34%). Incidence of bribery in arbitration was reported by 17% respondents and they had to pay on average over Tk. 5,000 (Figure10.1).
10.6 Relief
The government usually distributes relief materials to the distressed and impoverished people during crisis periods through local government bodies, particularly the Union Parishad. In the survey, it is found that 6.3% of surveyed households (319 households) received relief services from local government bodies. Among the types of relief received by concerned households, VGD and VGF accounted for 58% and 23% respectively. Among the households who registered for relief, about 8% enlisted themselves by paying bribe. Relief operations are usually managed and implemented by the Union Parishad. Among the recipient households, 17% enlisted them through the patronage of the Chairman/Member. However, the highest proportion of households (72%) found to have registered normally or as per rule (see Tale 10.6).
Table 10.6: Means of enlistment for relief Means % of
households
As per rule 71.6 Using influence of UP chairman/member 17.0 Paying bribe 7.6 Others 3.8 Total 100.0
Among the households who were registered through bribery paid on average Tk. 399. Getting less quantity of relief goods than entitlement is another major irregularity reported by the surveyed households. In the survey, it is found among the recipient households that 42% received relief goods to a lesser quantity (Table 10.7).

48
Table 10.7: Households less quantity of relief goods
Whether received less quantity % of households Yes 41.8 No 51.2 Total 100.0

49
Figure 11.1: Reason for paying bribe by taxpayer households (%)
To avoid harassment, 62.5
Others, 18.7To reduce tax amount, 18.8
Chapter 11
Tax
Both central and local government authorities impose different taxes on its citizens to collect revenue. The Government of Bangladesh collects income tax, vat and customs and excise duty through the National Board of Revenue. Besides, local authorities collect holding tax, UP and other taxes. In this survey, household experience about tax payment and harassment has been dealt with.
11.1 Income tax From July 2006 to June 2007, only 1.6 percent of the surveyed households found to have paid income tax. Among the income-tax payers, 20.7% paid bribe in the process of tax payment, averaging Tk. 5,282. In urban areas, higher proportion of households paid income tax and their amount was also higher. Incidence of bribery and amount of bribe was also higher for urban households. The amount of bribe is alarmingly high, which is 32% of the gross amount of tax (Table 11.1). Most of the households (62.5%) reported that they paid bribe to avoid harassment (Figure 11.1). This seems to be a major disincentive for potential taxpayers not to pay tax or to pay less.
Table 11.1: Households paying income tax
Residence % of households paying tax
Average amount of tax paid
(Tk.)
% of taxpayers
paying bribe
Average amount of bribe paid
(Tk.)
Bribe as % of tax paid
Rural 0.4 3,636 9.1 200 5.5Urban 3.6 18,669 22.5 5,600 30.0Overall 1.6 16,652 20.7 5,282 31.7
11.2 Holding tax Among the surveyed households, 14% paid holding tax during the reference year, the proportion being very high in urban areas (31%). On an average a household paid Tk. 782 as holding tax. While paying the tax, abut 3% of the households paid bribe. The

50
Figure 11.2: Reasons for paying bribe as reported by holding taxpayers (%)
Mandatory rate, 18.2
Others, 18.2To reduce tax amount, 40.9
To avoid harassment, 22.7
average amount of bribe annually paid by the households was Tk. 619, which is over 79% of the gross amount of tax. This is indicative of serous unscrupulous practices in our revenue administration (Table 11.2).
Table 11.2: Households paying holding tax
Residence % of households paying tax
Average tax paid (Tk.)
% of taxpayers
paying bribe
Average amount of bribe paid
(Tk.)
Bribe as % of tax paid
Rural 2.8 232 2.4 155 66.8Urban 30.9 857 2.9 674 78.6Overall 14.0 782 2.9 619 79.2
The single most important reason mentioned by holding taxpayers for paying bribe was to reduce tax amount (41%). Over 18% households mentioned that paying bribe seemed to be mandatory (Figure 11.2).
11.3 UP tax Table 11.3 shows that 38% percent rural households paid Union Parishad (UP) tax. They paid Tk. 151 as tax and additionally paid bribe averaging Tk. 56 annually. Bribe accounts for 37% of the gross amount of tax. The households reported that they paid bribe to reduce tax amount, to avoid harassment or it was imposed as a mandatory system.
Table 11.3: Households paying UP tax
% of rural household paying tax
Average amount of tax
paid (Tk.)
Average amount of bribe paid
(Tk.)
Bribe as % of tax
38.4 151 56 37.1

51
Figure 12.1: Residence of the loan receiver and sources of loan (%)
90.870.6
84.5
9.229.4
15.5
0%10%20%30%40%50%60%70%80%90%
100%
Rural Urban OverallResidence of the loan recipients
% o
f loa
n re
cipi
ents
Private Bank
Government Bank
Chapter 12
Banking
Banks have important role in modern economic system. By collecting citizen’s savings and lending the same to different projects, these financial institutions recycle the economy and keep it alive. Besides, banks have a vital role in implementing Government’s financial and economic policies. This chapter tries to address irregularities that clients face while availing different banking services, hidden financial costs associated with these services and persons responsible for these irregularities and anomalies.
12.1 Credit service
Among the borrowers, 85% received loan from government banks. Urban borrowers have comparatively higher access to private banks than their rural counterparts. In rural areas, over nine-tenths of the borrowers received loan from government banks (Figure 12.1).
12.2 Purpose of credit
Most of the loan recipients took loan to do agricultural activities (64%). Among other activities where households invested credit money are business (17%), housing (9% percent) and industry (6%). Government banks provided agricultural loan to 71% of their loan recipients, whereas business loan (36%) was the main financing area for private banks (Table 12.1).

52
Table 12.1: Purpose of loan taken by households by bank type and location
Purpose of loan taken by households (%)
Status of the borrower
Agri.
Business
Housing
Industry
Others
Government 70.9 13.5 8.3 4.2 3.1 Type of bank
Private 23.8 14.3 17.9 35.7 8.3 Rural 77.2 9.8 5.2 3.0 4.9
Residence Urban 33.7 32.5 18.3 13.6 1.8 Overall 63.5 16.9 9.3 6.3 3.9
12.3 Bribery in credit service
Among the loan recipients, 32% paid bribe to get a loan. Bribery is much higher in government banks (36%) than private banks (7%). Rural borrowers tend to pay bribe in higher proportions (34%) than the urban ones (26%) (Table 12.2). This means, in terms of credit service, the public sector, as well as the rural sector, are more unfriendly to borrowers. This would obviously have a negative implication on rural development.
Table 13.2: Borrowers paying bribe for receiving loan (%)
Status of the borrower % of respondents
paying bribe Government bank 36.3 Bank type Private bank 7.1 Rural 34.2 Residence Urban 26.0
Overall 31.7
On an average, borrowers paid Tk. 5,071 as bribe while receiving loan and this was 7.6 percent of the loan amount. In terms of percentage of loan amount, amount of bribe payment was comparatively higher for clients of government banks (7.7 percent) (Table 12.3).
Conventionally the cost of credit is determined in terms of interest. If other transaction costs, such as bribe, is added to the amount of interest, the real cost of credit would become too high and not so attractive for the purpose of investment.
Table 12.3: Loan amount and bribe paid by loan recipients
Status of the borrower Loan amount (Tk.)
Bribe (Tk.)
Percentage of loan paid as bribe
Government bank 66,632 5,125 7.7Bank type Private bank 66,833 3,608 5.4Rural 27,402 1,424 5.2Residence Urban 180,698 15,671 8.7
Overall 66,639 5,071 7.6

53
Among the bribe payers, 43% reported that they paid bribe to the concerned officers of the bank, 18.1% paid bribe to branch managers, while 19.9% paid to other employees of the bank. Another 18.7 percent of the bribe payers paid bribe through brokers. Clients of government banks and rural areas had higher report of using middle man to do negotiations (Table 12.4).
Table 12.4: Bribe takers by bank type and residence of the loan recipients (%)
Status of loan recipients
Manager Officer Employee Broker
Government Bank 17.5 42.8 20.5 19.3 Bank type Private Bank 40.0 60.0 0.0 0.0 Rural 14.2 44.9 18.1 22.8 Residence Urban 29.5 38.6 25.0 6.8
Overall 18.1 43.3 19.9 18.7
12.4 Other banking services
Respondents of the survey reported that they had to go to the bank to receive different services like L/C opening, money withdrawal and deposit, bill payment, pay order and money order, trade license, etc. While receiving these services, 22.4 percent mentioned that they were harassed. Wastage of time was reported as the foremost form of harassment and 62.1 percent of the harassed respondents reported this. Another 24.3 percent of the harassed respondents reported that bribe was demanded from them. Respondents paid Tk. 620 as bribe on the average while receiving such services. Incidence and amount of bribe is much higher in rural areas (Tables 12.5 and 12.6).
Table 12.5 Types of harassment faced while receiving other banking services
Types of harassment faced by service seekers (%) Residence Harassed
(%) Time wasting
Bad behavior
Demanded bribe Others
Rural 21.7 57.9 8.6 31.1 2.4
Urban 23.2 66.6 12.8 17.5 3.3
Overall 22.4 62.1 10.7 24.3 2.9
Table 12.6 Amount of bribe paid while receiving other banking services
Residence Average bribe amount (Tk.) Rural 705
Urban 465
Overall 620

54
Figure 13.1: Interaction with service providing NGOs
National, 78.9%
Local, 17.8%
International, 3.2%
Chapter 13
NGO sector
Over the years NGOs have become very prominent in the country as a third sector after public and private sectors. They have been implementing numerous socio-economic development programs for the masses. Over the years, their networks have widened all over the country. There is hardly any union in the country where NGOs have not reached with their programs. However, NGOs have gradually shifted their focus from various social development programs to micro credit to foster income generating activities for poor households and to gain their own institutional sustainability in terms of finance.
13.1 Types of NGOs
In the survey it was found that 1,970 households out of 5,000 took services from Non Government Organizations (NGOs). Three types of NGOs - local, national and international, rendered services to these households. National NGOs play the major part in delivering the services, as they reached 79% households covered by all types of NGOs. The rest one-fifth of the households were served by the local and international NGOs (Figure 13.1).
13.2 Services provided by NGOs
NGOs in Bangladesh are engaged in diverse activities – the same NGO may be involved in multiple activities. Micro credit is one of most common and increasingly popular type of operation of NGOs because of the success of the model in reaching the poor, especially women, but also for the reason that it has also become a legally endorsed income generating activity helping development and sustainability of the NGOs themselves. Other popular programs include education, health, family planning, environment, human rights, women and children welfare, etc.

55
Figure 13.2: Incidence of bribery in micro credit
% of recipients did not pay bribe, 92.5
% of recipients paid bribe, 7.5
Figure 13.3: Respondents response about NGOs’ reaction in failure to return loan (%)
Used harsh words , 21.1
Used police threats, 9.8
Others, 5.6
Did nothing, 63.5
During the reference period, it was found that as high as 90% households received micro credit from NGOs. Only 10.5% households reported to receive other services like health, education, relief, training, etc.
13.3 Bribery in micro credit
Among micro credit receivers from NGOs, only 7.5% respondents reported to have paid bribe to obtain credit (Figure 13.2). The average amount of bribe had been Tk. 299 per transaction.
13.4 Loan recovery method Among the credit receivers from NGOs, 300 respondents (17.3%) could not repay the loan in due time. The loan receivers mentioned three major reactions from the concerned NGO for not being able to repay the loan in time. Figure 13.3 shows that 64% defaulters did not face any reaction from NGOs for failing to repay the credit. However, 21% respondents received harsh comments from NGO staff. Nevertheless, one-tenth of the defaulters received police threat.

56
Chapter 14
Conclusion and Recommendations
The Corruption Household Survey 2007 was initiated to assess and analyze the nature and extent of corruption that the households in Bangladesh experienced from different service sectors during July 2006 to June 2007. Surveyed households experienced six different forms of corruption in different proportions, while bribery and negligence of duties were found most common forms of corruption.
Corruption so pervasive that there is hardly any public service, which is not infested with corruption. According to this survey, two-thirds households in Bangladesh experienced different forms of corruption from different sectors during the reference period. Law enforcing agencies was found the most corrupt sector in Bangladesh.
Incidence and average amount of bribe were found highest in land administration, followed by judiciary, law enforcement and tax. Corruption is certain sectors like banking and tax is so pervasive that hinders investment and economic growth.
Compared to the earlier period, bribery seemed to increase in January-June’07 in some sectors like education, health, land administration, local government and NGOs. While in some other sectors like law enforcement, judiciary, electricity, bank, tax and relief distribution, incidence of bribery decreased after December 2006.
Most of the cases with which the surveyed households were involved were related to land issues that involve mainly land administration, law enforcement agencies and the judiciary. This aspect needs special attention to make any significant inroad to curb corruption. Essential services like electricity have remained elusive because of continued corruption.
NGOs, who often talk about good governance and participatory decision making, are not totally free from corruption. Though the extent of corruption in the NGO sector is much lower compared to other sectors, still this is not compatible with the spirit with which NGOs work. The corruption in micro credit has perhaps exploded the myth contrary to popular notions.
Corruption in public services (or private organizations with explicit aim of serving the people) cannot be legitimized in a society with overwhelming poor people. It is ludicrous to observe that one has to pay bribe to pay tax, meaning that an enabling environment is absent for law-abiding citizens who want to pay tax without any hassle. This situation is not at all acceptable.
17. Recommendations
On the basis of findings of the survey the following recommendations are put forward for consideration of the Government, relevant authorities and all stakeholders. The first set of recommendations is also consistent with those emanating from several other research recently conducted by Transparency International Bangladesh.

57
1.Criminalization of Corruption: That corruption is a punishable offence has to be established in the society, irrespective of the level at which the act of corruption takes place. Enforcement of law in the due judicial process without fear or favour and without deviation from the due judicial process and transparency is the key.
2.Checks and Balances: The more discretion in the hands of people in positions of responsibility, the more is the scope of corruption. The scope and process of checks and balances in use of entrusted powers must be institutionalized.
3.Transparency and Accountability in Institutions: Strong transparency and accountability mechanisms in every institution have to be established and they should be followed effectively. Institutional Code of Ethics should be adopted based on the principle of zero tolerance of corruption.
4.Monitoring Cell in the Ministry: Every Government Ministry and Department should establish a regular Monitoring Cell to address irregularities and corruption as a tool for self-regulation.
5.Integrity in Public Service: Ensuring integrity in public service is crucial to
addressing corruption. Whatever well-meaning may be reforms in other sectors, these cannot bear fruits nor can any of those be sustained without convincingly establishing that appointments, promotions, postings and transfers in public service are based on performance and merit and not on political influence, bribery and other means of subjective influence. So long as the scope remains for abuse of power with impunity, and as long as effective legal and ethical standards are not in place with enforcement mechanisms for zero tolerance of corruption, no true results can be expected or sustained. No less important is the issue of salaries and benefits, which can no longer be viewed as costs, but as investments for future. In reviewing salaries and benefits of public officials there is no alternative to considering it in a full package. The key factor here would be a combination of positive and negative incentives to prevent erosion of integrity, honesty and accountability by enforcing codes of conduct for the correct, honourable and proper performance of public functions.
6.Citizens’ Charters: Citizens’ Charter on every service delivery institution has to be adopted in a participatory process including provisions for enforcement, specific measures to prevent deviation, and strict monitoring. Such Charters should be easily available for members of the public.
7.Implementation of UNCAC: Bangladesh’s accession to the UN Convention against Corruption is a significant milestone in the history of anti-corruption movement in the country. However, the greater challenges lies ahead in terms of actual implementation of the many commitments for reform including institutional reforms and policy change, for which all stakeholders – Government, private sector and civil society should work in concert.
8.Effective Watchdog Bodies: Independent and effective functioning of the watchdog bodies like the Anti-corruption Commission is indispensable. Equally important is their credibility, resource endowment, skills and capacities. The

58
office of Ombudsman should be created with sufficient resources and capacities in every Government Ministry and/or Department.
9.Effective National Integrity System: In addition to the watchdog bodies like the Anti-corruption Commission and Ombudman’s office, the key institutions of democracy and national Integrity System must work effectively, reflecting high degree of professionalism, impartiality, ethics and integrity. These include the parliament, especially the parliamentary standing committees; the Executive, the Election Commission, Judiciary, Law-enforcement Institutions, and Public Service Commission.
10. Role of Media: Media should be allowed full freedom to report on corruption and create public awareness and demand for controlling corruption. Media organizations should also develop and strictly observe their own codes of integrity for maintaining highest standards of professional integrity.
11. Right to Information: Access to information is the key to effective prevention and control of corruption. Government’s recent initiative to promulgate Right to Information Act should be finalized without further delay, and initiatives should be taken by all stakeholders including Government, public, private and non-governmental organizations to enforce it with particular emphasis on proactive disclosures.
12. E-governance: E-governance has to be introduced in all public institutions, so that transparency and accountability can be ensured.
13. Role of Citizens: Among many provisions of the UNCAC, the Government is under obligation to fully recognize the role of citizens and civil society in fighting corruption. No legal and institutional reforms can ensure true success and sustainability of the anti-corruption initiatives unless the common citizens take a stand against it. It is the responsibility of the Government and other stakeholders to create conducive environment for a robust and effective social movement against corruption.
14. Participatory Citizens Watchdog Forums: An effective tool for preventing corruption at the service delivery end is the participation of citizens in the role of demand creation and accountability. Efforts should be made to create and engage such citizens’ forums especially the young generation in promoting awareness, information disclosures, and monitoring of content and quality of services in vital areas of public interest like education, health, local government, land administration, etc.
15. Political Commitment: Political commitment is the absolutely crucial determinant of any possibility of success in anti-corruption efforts. No country has succeeded in fighting corruption without the commitment of the top level Government and political leadership. Bangladesh will be no exception to this. The Caretaker Government has demonstrated some realistic opportunities to fight corruption through some remarkable policy and institutional reforms, which continue to be on shaky grounds. The government should pursue the reform process and anti-corruption drive in a fully transparent way through due

59
judicial process, and thereby leave sufficient incentives for the next elected government to own these reforms and build upon further.
Sector-specific recommendations are offered below.
Education
• Establish citizens watchdog bodies to work in collaboration with the management for monitoring the quality of education and prevent various forms of corruption including bribery.
• Major reforms are needed to ensure teachers’ accountability in terms of their responsibility and ethical standards and address the issues of salaries and benefits, training and skill development.
Public Health Services • Establish citizens watchdog bodies to work in collaboration with the
management for monitoring the content and quality of services provided by the health service providing institutions and prevent various forms of corruption including bribery.
• Major reforms are needed to ensure accountability of medical professionals and other staff in terms of responsibility and ethical standards and address the issues of salaries and benefits, training and skill development.
• Proactive disclosure of information relating to allocated fund, medicine and equipment should be practiced by health service providing institutions. There should also be processes and mechanism for receiving complains of grievances and channels to address the same.
Land Administration • Establish a Land Reform Commission to function as an oversight body to
address all the issues behind pervasive corruption in land administration. The mandate should include introduction of modernization and e-governance in land administration and allocation of khash land to the distressed and marginalized people.
• Arrange speedy tribunal to settle old civil cases relating to land. • Introduce ‘one stop center’ at land registration offices for tax payment,
withdrawal of documents, mutation, etc. • Establish the office of Ombudsman for Land Administration. • Create opportunities for citizens involvement in monitoring the content and
quality of services provided by the land administration offices and prevent various forms of corruption including bribery.
Law Enforcement Institutions • Implement the Police Reform Project without delay. Strengthen checks and
balances in the use of authority of law enforcement. • Major reforms are needed to ensure accountability and professionalism in law
enforcement institutions and ethical standards • Address the issues of salaries and benefits, resources including logistical
capacity, training and skill development including training on human rights and behavioral change.
• Proactive disclosure of information on activities, budgets, resources of the various law enforcement agencies.

60
• Develop, implement and monitor participatory Citizens Charter of law enforcement institutions and institutional Code of Ethics including zero tolerance of corruption.
Judiciary
• Independent judicial appointments: An objective and transparent process for the appointment of judges ensures that only the highest quality candidates are selected without any sense of obligation to the appointing authority.
• Salaries and benefits: Judicial salaries and benefits must be commensurate with cost of living, judges’ position, experience, performance and professional development for the entirety of their tenure; fair pensions should be provided for.
• Access to information and training: Judges must have easy access to legislation, cases and court procedures, and receive training prior to or upon appointment, as well as continuing training throughout their careers. This includes training in legal analysis, the explanation of decisions, judgment writing and case management; as well as ethical and anti-corruption training.
• Enforcement of code of conduct: The code of judicial conduct should be rigorously enforced and breaches must be investigated and sanctioned by a judicial body.
• Transparency: The judiciary should publish annual reports of its activities and spending, and provide the public with reliable information about its governance and organisation. Judges should make periodic asset disclosures especially where other public officials are required to do so.
• Freedom of expression Journalists must be able to comment fairly on legal proceedings and report suspected or actual corruption or bias. Laws that inhibit the media from investigating and reporting suspected criminality, and should be reformed. Journalists and editors should be better trained in reporting what happens in courts and in presenting legal issues to the general public in an understandable form.
Electricity • Existing ‘Electricity Act’ law should be reviewed to ensure the justifiable
punishment applicable for trivial offence and inclusion of exemplary prosecution of the accused staff
• Under the “Speedy Tribunal Act” a number of mobile/special courts and required judicial magistrates should be appointed to complete the trial of ongoing cases
• An integrated MIS system has to be introduced and checked it regularly by the Inquiry and Investigation units.
• Ministry should make an agreement with DESCO to supply ‘pre-paid meters’ to its consumers by the next 5 years
• ‘One stop’ center for new connections should be introduced • Meter readers should be transferred after completion of three years on a station • Outsourcing of the billing and meter reading of BPDB and DESA should be
widen further Local Government
• Proactive disclosure of information on activities, budgets, resources of the various local government bodies.

61
• Mobilize citizens participation to make the local government representatives and staff accountable to the citizens through arranging channels and forums like face the public regularly.
• Strict monitoring of distribution process and service delivery of Birth/Death/Citizenship certificates, and distribution of seeds and fertilizer, and humanitarian assistance.
• In case of Salish or arbitration of local disputes, the judgment process should have involve Citizens Jury Board.
Banking Services • Ensure professionalism among bank officials, including programmes to
strengthen the ethical and moral standards, training and capacity building. • Regular monitoring of the performance of the staff through objective system
of evaluation including service recipients’ feedback • Introduce Code of Ethics and implement rigorously with zero tolerance vis-à-
vis any deviations.
Taxation • The office of the Tax Ombudsman should be proactive and sufficiently
resourced with efficient and skilled human resources. • The concerned authority should collect the feedbacks of the tax payers through
independent or research agencies/organization on the quality or performance of the tax collection system
• Facilitate citizens participation in monitoring the performance of the members of the staff in taxation at various levels.
NGO Sector • An NGO Commission should be established as the policy making and
supervisory body with the authority of grievance management and prosecution of illegal practice in NGO operation.
• The NGO Affairs Bureau should be sufficiently resourced to develop the capacities, skills and professionalism through training of human resource. Its institutional and logistic capacity should also be significantly beefed up to facilitate proper discharge of its monitoring role. Salaries and benefits of the staff of the Bureau must be reviewed to make it consistent with cost of living and the necessary level of professionalism. A combination of positive and negative incentives should be institutionalized to ensure integrity and credibility of the Bureau.
• Self-regulation is the best regulation. NGOs and various sectoral and sub-sectoral umbrella bodies and forums should develop their own Code of Ethics with provisions for rigorous enforcement and monitoring on the basis of zero tolerance against any deviation from the Code.

62
Appendix A: A1. Estimates of households who experienced corruption during interaction with different sectors
Sector name Estimate Standard Error Relative Standard Error
Education 0.392 0.020 0.051Health 0.441 0.025 0.057Land administration 0.527 0.031 0.059Law enforcement 0.966 0.009 0.009Judiciary 0.477 0.039 0.082Electricity 0.332 0.03 0.090Local government 0.624 .037 0.059Bank 0.287 0.021 0.073Tax 0.135 0.017 0.126NGO 0.064 0.017 0.266Others 0.313 0.012 0.038Overall 0.667 0.016 0.024 A2. Estimates of households who paid bribe during interaction with different sectors
Sector name Estimate Standard Error Relative Standard Error
Education .087 .011 .126Health .163 .017 .104Land administration .495 .031 .063Law enforcement .645 .038 .059Judiciary .437 .034 .078Electricity .143 .019 .133Local government .32.4 .029 .089Bank .156 .017 .109Tax .051 .017 .333NGO .065 .009 .138Others .166 .020 .120Overall .421 .012 .029

63
A3. Estimates of households who paid bribe in different sectors in consideration of whole sample
Sector name Estimate Standard Error Relative Standard Error
Education .064 .008 .125 Health .073 .009 .123 Land administration .139 .009 .065 Law enforcement .076 .006 .079 Judiciary .048 .005 .104 Electricity .084 .009 .107 Local government .069 .006 .086 Bank .055 .005 .091 Tax .010 .002 .200 NGO .023 .002 .126 Others .042 .005 .119 A4. Average amount of bribe households paid during interaction with different sectors
Sector name Average bribe amount
Standard Error
Relative Standard Error
Deff
Education 1296.00 893.00 .689 .98 Health 524.00 127.00 .242 3.92 Land administration 4409.00 603.30 .137 3.95 Law Enforcement 3940.00 949.00 .241 1.25 Judiciary 4825.00 861.00 .178 1.31 Electricity 1938.00 551.00 .284 5.00 Local government 882.78 197.93 .224 2.00 Bank 7795.00 3964.00 .509 4.05 Tax 2293.00 1333.00 .581 0.96 NGO 421.00 144.00 .342 3.16 Others 7578.00 2239.00 .295 2.84 Overall 4134.00 396.00 .096 1.70

64
A5. Average amount of bribe households paid in different sectors in consideration of whole sample
Sector name Estimate Standard Error
Relative Standard
Error
Deff
Education 39.13 21.40 .547 0.37Health 35.95 7.09 .197 2.10Land administration 536.12 69.60 .130 2.34Law Enforcement 293.62 63.02 .215 1.27Judiciary 224.10 40.70 .182 1.37Electricity 158.20 44.90 .248 4.16Local government 62.50 17.20 .275 2.36Bank 175.50 55.30 .315 1.07Tax 50.00 31.80 .637 2.23NGO 6.80 1.68 .247 0.77Others 236.31 61.84 .262 1.23Overall 1818.10 186.70 .103 2.01 Appendix B B1. Incidence of different forms of corruption in different sectors
Types of Corruption Sector Name Bribery Negligence
of duty Nepotis
m Embezzle
-ment Deception Extortion
Education 14.9 37.6 19.5 26.0 1.9 0.1Health 27.6 61.2 2.6 4.0 4.6 Land Administration
89.1 8.4 0.1 0.9 0.9 0.6
Law Enforcement Agencies
56.1 27.2 1.6 1.1 4.1 9.8
Judiciary 78.4 10.6 2.7 3.0 3.3 2.0Electricity 35.5 55.5 0.4 2.4 6.1 0.1Tax 53.0 25.0 2.0 3.0 12.0 5.0NGO 52.0 14.9 0.7 3.9 6.8 21.7Bank 45.1 53.8 0.5 0.3 0.2 Local Government
42.9 22.0 18.9 13.4 2.5 0.3
Others 31.9 44.8 8.0 7.1 7.0 1.3

65
B2. Overview of bribery in different sectors considering all samples
Proportions of households paid bribe in the
population (in %)
Average amount of bribe a household paid in the
population (in Tk.) Sector
Rural Urban Overall Rural Urban Overall Land Administration 14.6 13.1 14.0 474 618 537
Electricity 8.1 8.7 8.4 175 136 158Law Enforcement 6.0 9.6 7.6 221 388 294Health 7.7 6.7 7.3 41 30 36Local Government 6.2 7.9 7.0 79 41 63Education 8.3 3.5 6.4 23 61 39Banking 6.8 3.7 5.5 92 284 176Judiciary 5.7 3.7 4.9 228 220 224NGO 2.8 1.7 2.3 8 6 7Tax .01 2.0 1.1 .6 114 50Others 3.1 5.7 4.2 209 272 236Overall - - - 1,550 2,169 1,818
Appendix C: C1. Regularity in announce of examination result
Irregularity in announce of the examination results (%) Institutions
Yes No Primary School 6.7 93.3 Secondary School 7.3 92.7 College 9.4 90.6 University 7.4 92.6 Madrasha 4.9 95.1 Non-formal Education 3.0 97 Kindergarten School 9.6 90.4 Private Institutions 100.0 Technical School and College 23.1 76.9 Open University 0 0.2 Overall 7 .0 93.0

66
C2. Nature of misbehaves for not having private tutors
C 3. Reasons (Experience and Perception) for not being selected for the Sub-scholarships
Educ
atio
nal
Inst
itutio
ns
scho
ol
adm
inis
tratio
n di
d no
t inc
lude
the
nam
ein
the
list
dedu
cted
nam
e du
e to
poo
r pre
senc
e p
yp
amou
nt o
r co
mm
issi
on to
scho
ol si
tuat
ed a
t m
unic
ipal
ity a
rea
due
to n
ew
adm
issi
on a
t pr
imar
y le
vel,
high
sc
hool
getti
ng m
arks
less
th
an 4
5 pe
rcen
t
owin
g to
stud
ent o
f pr
ivat
e sc
hool
bein
g fin
anci
ally
w
ell o
ff
to st
udy
in th
e M
adra
sha
the
scho
lars
hip
is
not a
pplic
able
for
mor
e th
an o
ne
bf
fil
non
form
al p
rimar
y ed
ucat
ion,
hig
h sc
hool
, col
lege
, ch
angi
ng th
e in
stitu
tion
'Oth
er
Primary School 67.2 55 0 57.6 65.3 68.2 38.1 41.2 41.2 69.2 50 0 16.7
Secondary School 23 35 0 23.5 24.2 31.8 23.8 5.9 17.6 15.4 25 0 0
College 4.9 0 50 7.1 3.2 0 4.8 11.8 0 0 0 0 0
University 1.6 0 0 0 0 0 0 0 0 0 0 0 0
Madrasha 1.6 5 0 4.7 5.6 0 4.8 0 29.4 15.4 0 100 33.3
NFPE 0 5 50 3.5 1.6 0 14.3 5.9 11.8 0 25 0 33.3
Kindergarten School 1.6 0 0 3.5 0 0 14.3 35.3 0 0 0 0 16.7
Total (N=393) 15.5 5.1 0.5 21.6 31.6 5.6 5.3 4.3 4.3 3.3 1 0.3 1.5
Others = Mother stays far away, to take position in the rival political group, name was cancelled due to getting marry, being a member from low cast, residence and school are situated in different union'
40.1
1934.5
3.9 2.6
100
0
20
40
60
80
100
120
Marking poorin the exam
sheets (n=93)
Behavewrongly in the
classroom(n=19)
Non-coperatiion
from theconcern
teacher (n=80)
Makingpressure from
all respectsupon the
student (n=9)
Giving threatfor not selcted
for sub-scholarshipholders(n=6)
Total (N=232)
(In
perc
entil
e %
)Responses (in Perecntile)

67
Appendix D1
Z-Test for Two Proportions Calculator Results
The Z-Test for Two Proportions Calcuator tests proportions from two independent groups to determine if they are significantly different from one another.
Z statistics )11(ˆˆ
21
21
nnQP
ppZ+
−=
Confidence Level: 95%
Group 1
Base size: 1162
Proportion: 465 (40%)
Group 2
Base size: 1124
Proportion: 427 (38%)
1-Tail Confidence Level: 82.6% (Not Significant)
2-Tail Confidence Level: 65.1% (Not Significant)


