National Hospital Ambulatory Medical Care Survey: 2016 ... · S Department o Healt and Human...
38
U.S. Department of Health and Human Services • Centers for Disease Control and Prevention • National Center for Health Statistics National Hospital Ambulatory Medical Care Survey: 2016 Emergency Department Summary Tables The Ambulatory and Hospital Care Statistics Branch is pleased to release the most current nationally representative data on ambulatory care visits to hospital emergency departments (ED) in the United States. Estimates are presented on selected hospital, patient, and visit characteristics using data collected in the 2016 National Hospital Ambulatory Medical Care Survey (NHAMCS). NHAMCS is an annual nationally representative sample survey of visits to EDs; outpatient departments; and hospital-based ambulatory surgical centers (ASCs) (starting in 2009), and freestanding ASCs (starting in 2010). The sampling frame for the 2016 NHAMCS was constructed from IMS Health’s annual data product “Healthcare Market Index,” updated for the 2016 survey. NHAMCS uses a multistage probability design with samples of primary sampling units (PSUs), hospitals within PSUs, and patient visits within emergency service areas (ESAs) of each selected hospital. A total of 450 hospitals were selected for the 2016 NHAMCS, of which, 361 were in scope and had eligible EDs. Of these, 265 participated, yielding an unweighted ED response rate of 73.4%. A total of 385 ESAs were identified from the EDs. Of these, 271 responded fully or adequately by providing forms for at least one-half of their expected visits based on the total number of visits during the reporting period. In all, 19,467 Patient Record forms (PRFs) were submitted electronically. The resulting unweighted ESA sample response rate was 70.4% (77.9% weighted), and the overall unweighted two-stage sampling response rate was 51.7% (56.2% weighted). The 2016 NHAMCS was conducted from December 28, 2015, through December 25, 2016. The U.S. Census Bureau was the data collection agent, and developed a computerized instrument to collect NHAMCS data electronically. Census field representatives completed a PRF for a sample of about 100 ED visits during a randomly assigned 4-week reporting period. The content of the PRF is available from: https://www.cdc.gov/nchs/data/ahcd/2016_NHAMCS_ED_PRF_Sample_Card.pdf. Data processing and medical coding were performed by RTI International in Research Triangle Park, North Carolina. As part of the quality assurance procedure, a 27% quality control sample of ED survey records was keyed and coded independently. Coding error rates ranged between 0.1% and 1.5% for the ED sample. For more details, see the 2016 NHAMCS public-use data file documentation: ftp://ftp.cdc.gov/pub/Health_Statistics/NCHS/Dataset_Documentation/NHAMCS/doc16_ed.pdf. Table estimates are based on sample data weighted to produce annual national estimates and include standard errors. The sample weight that is computed for each sample visit considers all stages of survey design. The survey data are inflated or weighted to produce unbiased, national annual estimates. The visit weight includes three basic components: inflation by reciprocals of selection probabilities, adjustment for nonresponse, and population ratio adjustments. Estimates of the sampling variability were calculated using the Taylor series method in SUDAAN, which takes into account the complex sample design of NHAMCS. Detailed information on the design, conduct, and estimation procedures of the 2016 NHAMCS are discussed in the public-use data file documentation. As with any survey, results are subject to sampling and nonsampling errors. Nonsampling errors include reporting and processing errors as well as biases due to nonresponse and incomplete response. In 2016, race data were missing for 16.1% (unweighted) of ED records, and ethnicity data were missing for 18.2% (unweighted) of ED records. The National Center for Health Statistics uses model-based single imputation for NHAMCS race and ethnicity data. The race imputation, based on research by an internal work group, is restricted to three categories (white, black, and other) because of quality concerns with imputed estimates for race categories other than white and black. The imputation technique is described in more detail in the 2016 public-use data file documentation.
Transcript of National Hospital Ambulatory Medical Care Survey: 2016 ... · S Department o Healt and Human...

U.S. Department of Health and Human Services • Centers for Disease Control and Prevention • National Center for Health Statistics
National Hospital Ambulatory Medical Care Survey: 2016 Emergency Department Summary Tables
The Ambulatory and Hospital Care Statistics Branch is pleased to release the most current nationally representative data on ambulatory care visits to hospital emergency departments (ED) in the United States. Estimates are presented on selected hospital, patient, and visit characteristics using data collected in the 2016 National Hospital Ambulatory Medical Care Survey (NHAMCS). NHAMCS is an annual nationally representative sample survey of visits to EDs; outpatient departments; and hospital-based ambulatory surgical centers (ASCs) (starting in 2009), and freestanding ASCs (starting in 2010).
The sampling frame for the 2016 NHAMCS was constructed from IMS Health’s annual data product “Healthcare Market Index,” updated for the 2016 survey. NHAMCS uses a multistage probability design with samples of primary sampling units (PSUs), hospitals within PSUs, and patient visits within emergency service areas (ESAs) of each selected hospital. A total of 450 hospitals were selected for the 2016 NHAMCS, of which, 361 were in scope and had eligible EDs. Of these, 265 participated, yielding an unweighted ED response rate of 73.4%. A total of 385 ESAs were identified from the EDs. Of these, 271 responded fully or adequately by providing forms for at least one-half of their expected visits based on the total number of visits during the reporting period. In all, 19,467 Patient Record forms (PRFs) were submitted electronically. The resulting unweighted ESA sample response rate was 70.4% (77.9% weighted), and the overall unweighted two-stage sampling response rate was 51.7% (56.2% weighted).
The 2016 NHAMCS was conducted from December 28, 2015, through December 25, 2016. The U.S. Census Bureau was the data collection agent, and developed a computerized instrument to collect NHAMCS data electronically. Census field representatives completed a PRF for a sample of about 100 ED visits during a randomly assigned 4-week reporting period. The content of the PRF is available from: https://www.cdc.gov/nchs/data/ahcd/2016_NHAMCS_ED_PRF_Sample_Card.pdf.
Data processing and medical coding were performed by RTI International in Research Triangle Park, North Carolina. As part of the quality assurance procedure, a 27% quality control sample of ED survey records was keyed and coded independently. Coding error rates ranged between 0.1% and 1.5% for the ED sample. For more details, see the 2016 NHAMCS public-use data file documentation: ftp://ftp.cdc.gov/pub/Health_Statistics/NCHS/Dataset_Documentation/NHAMCS/doc16_ed.pdf.
Table estimates are based on sample data weighted to produce annual national estimates and include standard errors. The sample weight that is computed for each sample visit considers all stages of survey design. The survey data are inflated or weighted to produce unbiased, national annual estimates. The visit weight includes three basic components: inflation by reciprocals of selection probabilities, adjustment for nonresponse, and population ratio adjustments. Estimates of the sampling variability were calculated using the Taylor series method in SUDAAN, which takes into account the complex sample design of NHAMCS. Detailed information on the design, conduct, and estimation procedures of the 2016 NHAMCS are discussed in the public-use data file documentation.
As with any survey, results are subject to sampling and nonsampling errors. Nonsampling errors include reporting and processing errors as well as biases due to nonresponse and incomplete response. In 2016, race data were missing for 16.1% (unweighted) of ED records, and ethnicity data were missing for 18.2% (unweighted) of ED records. The National Center for Health Statistics uses model-based single imputation for NHAMCS race and ethnicity data. The race imputation, based on research by an internal work group, is restricted to three categories (white, black, and other) because of quality concerns with imputed estimates for race categories other than white and black. The imputation technique is described in more detail in the 2016 public-use data file documentation.
U.S. Department of Health and Human Services • Centers for Disease Control and Prevention • National Center for Health Statistics
Beginning in 2016, NHAMCS–ED diagnosis data are coded according to the International Classification of Diseases, 10 th Revision, Clinical Modification (ICD–10–CM). Five tables (Tables 11, 12, 16, 17, and 26) present estimates of primary diagnoses, injury diagnoses, and primary hospital discharge diagnoses using ICD–10–CM codes, and are different from web tables before 2016 that present diagnosis estimates using the International Classification of Diseases, Ninth Revision, Clinical Modification (ICD–9–CM) coding system. Because there are substantial differences between ICD–9–CM and ICD–10–CM, users should take caution when comparing diagnosis estimates from 2016 with those from previous years.
Beginning with the 2016 NHAMCS–ED, proportion estimates are not presented or are flagged based on the procedure specified in “National Center for Health Statistics Data Presentation Standards for Proportions,” available from: https://www.cdc.gov/nchs/data/series/sr_02/sr02_175.pdf. Except for estimates of proportions, the following approach is used: Visit estimates are not presented if they are based on fewer than 30 cases in the sample data; only an asterisk (*) appears in the tables. Visit estimates based on 30 cases or more include an asterisk if the relative standard error of the estimate exceeds 30%.
Suggested citation: Rui P, Kang K, Ashman JJ. National Hospital Ambulatory Medical Care Survey: 2016 emergency department summary tables. 2016. Available from: https://www.cdc.gov/nchs/data/ahcd/nhamcs_emergency/2016_ed_web_tables.pdf.

U.S. Department of Health and Human Services • Centers for Disease Control and Prevention • National Center for Health Statistics
National Hospital Ambulatory Medical Care Survey: 2016 Emergency Department Summary Tables
Table 1. Emergency department visits, by selected characteristics: United States, 2016
Characteristic
Number of visits (standard error)
in thousandsPercent distribution
(standard error)
Number of visits per 100 persons1
(standard error)
All visits 145,591 (8,798) 100.0 (...) 45.8 (2.8)
OwnershipVoluntary 103,153 (8,592) 70.9 (4.0) 32.4 (2.7)Government 25,104 (4,678) 17.2 (3.1) 7.9 (1.5)Proprietary 17,335 (4,868) 11.9 (3.2) 5.5 (1.5)
Metropolitan status2,3,4
MSA 117,189 (8,454) 80.5 (3.2) 42.8 (3.1)Non-MSA 28,402 (5,057) 19.5 (3.2) 64.5 (11.5)
Geographic region4
Northeast 24,514 (2,991) 16.8 (2.0) 44.2 (5.4)Midwest 31,428 (3,834) 21.6 (2.4) 46.9 (5.7)South 53,485 (5,412) 36.7 (2.9) 44.6 (4.5)West 36,165 (4,940) 24.8 (2.8) 47.9 (6.5)
Teaching hospitalYes 21,474 (3,907) 14.7 (2.7) 6.8 (1.2)No5 124,117 (8,898) 85.3 (2.7) 39.0 (2.8)
Trauma centerYes 65,863 (7,541) 45.2 (4.4) 20.7 (2.4)No or blank 79,729 (8,018) 54.8 (4.4) 25.1 (2.5)
Season⁶Winter 34,829 (6,443) 23.9 (4.0) 11.0 (2.0)Spring 28,544 (4,738) 19.6 (3.2) 9.0 (1.5)Summer 45,543 (6,525) 31.3 (4.0) 14.3 (2.1)Fall 36,675 (5,226) 25.2 (3.4) 11.5 (1.6)
... Category not applicable. 1Visit rates for region are based on the July 1, 2016, set of the estimates of the civilian noninstitutionalized population of the United States as developed by the U.S. Census Bureau Population Division. 2MSA is metropolitan statistical area. 3Population estimates by MSA are based on estimates of the civilian noninstitutionalized population of the United States as of July 1, 2016, from the 2016 National Health Interview Survey, compiled according to the 2013 Office of Management and Budget definitions of core-based statistical areas. See https://www.census.gov/programs-surveys/metro-micro.html, for more about metropolitan statistical area definitions. 4For geographic region and MSA, population denominators are different for each category and so do not add to the total population rate. For other variables, the denominator is the total population. 5Teaching status was unknown for 0.9% (weighted) of visits. 6Winter is December 22 to March 19, spring is March 20 to June 20, summer is June 21 to September 22, and fall is September 23 to December 21.
NOTE: Numbers may not add to totals because of rounding.
SOURCE: NCHS, National Hospital Ambulatory Medical Care Survey, 2016.
Table page 1 of 1

U.S. Department of Health and Human Services • Centers for Disease Control and Prevention • National Center for Health Statistics
National Hospital Ambulatory Medical Care Survey: 2016 Emergency Department Summary Tables
Table 2. Emergency department visits, by patient age, sex, and residence: United States, 2016
Patient characteristic
Number of visits in thousands
(standard error)Percent distribution
(standard error)
Number of visits per 100 persons1 (standard error)
All visits 145,591 (8,798) 100.0 (…) 45.8 (2.8)Under 15 years 27,436 (2,587) 18.8 (1.2) 45.0 (4.2)
Under 1 year 3,916 (412) 2.7 (0.2) 98.7 (10.4)1–4 years 9,790 (1,112) 6.7 (0.6) 61.4 (7.0)5–14 years 13,729 (1,258) 9.4 (0.6) 33.5 (3.1)
15–24 years 20,674 (1,253) 14.2 (0.4) 48.6 (2.9)25–44 years 40,014 (2,503) 27.5 (0.6) 48.1 (3.0)45–64 years 34,359 (2,099) 23.6 (0.6) 41.2 (2.5)65 years and over 23,108 (1,734) 15.9 (0.6) 48.2 (3.6)
65–74 years 10,985 (808) 7.5 (0.3) 38.7 (2.8)75 years and over 12,123 (1,014) 8.3 (0.4) 62.0 (5.2)
Female 79,595 (4,803) 54.7 (0.5) 49.0 (3.0)Under 15 years 12,810 (1,244) 8.8 (0.6) 43.0 (4.2)15–24 years 12,680 (781) 8.7 (0.3) 60.2 (3.7)25–44 years 22,883 (1,488) 15.7 (0.4) 54.3 (3.5)45–64 years 18,346 (1,203) 12.6 (0.4) 42.7 (2.8)65–74 years 5,757 (450) 4.0 (0.2) 38.1 (3.0)75 years and over 7,119 (601) 4.9 (0.3) 62.3 (5.3)
Male 65,996 (4,119) 45.3 (0.5) 42.5 (2.7)Under 15 years 14,625 (1,380) 10.0 (0.6) 47.0 (4.4)15–24 years 7,995 (613) 5.5 (0.2) 37.2 (2.9)25–44 years 17,131 (1,105) 11.8 (0.3) 41.8 (2.7)45–64 years 16,013 (982) 11.0 (0.3) 39.6 (2.4)65–74 years 5,228 (445) 3.6 (0.2) 39.4 (3.3)75 years and over 5,004 (470) 3.4 (0.2) 61.6 (5.8)
ResidencePrivate1 135,268 (8,206) 92.9 (1.3) 42.5 (2.6)Nursing home2 2,225 (296) 1.5 (0.2) 159.4 (21.2)Homeless3 1,446 (237) 1.0 (0.2) 263.0 (43.1)Other 2,427 (427) 1.7 (0.3) 0.8 (0.1)Unknown or blank *4,224 (1,720) * (…) *1.3 (0.5)
Urban–rural classification4
Large central metro 32,381 (4,057) 22.2 (2.6) …Large fringe metro 29,663 (4,489) 20.4 (2.8) …Medium metro 34,286 (4,519) 23.5 (2.9) …Small metro 12,488 (2,769) 8.6 (1.9) …
NonmetropolitanMicropolitan 14,550 (2,862) 10.0 (1.9) …Noncore (nonmetro) 13,536 (3,010) 9.3 (2.0) …Unknown or blank *8,688 (3,679) 6.0 (2.4) …
... Category not applicable. * Estimate does not meet NCHS standards of reliability. 1Visit rates for age, sex, and private residence are based on the July 1, 2016, set of estimates of the civilian noninstitutionalized population of the United States as developed by the U.S. Census Bureau Population Division. 2Visit rates for nursing home residents are based on the 2016 population denominators from the Centers for Medicare and Medicaid Services 2016 Minimum Data Set frequency reports, available from: https://www.cms.gov/Research-Statistics-Data-and-Systems/Computer-Data-and-Systems/Minimum-Data-Set-3-0-Public-Reports/Minimum-Data-Set-3-0-Frequency-Report.html. 3Visit rates for homeless people are based on the January 2016 estimate of people who were homeless on a given night, as reported in “The 2016 Annual Homeless Assessment Report (AHAR) to Congress,” available from: https://www.hudexchange.info/resources/documents/2016-AHAR-Part-1.pdf. 4For each record, county of residence was determined using patient ZIP code, and was then matched to the National Center for Health Statistics Urban–Rural Classification Scheme for Counties, available from: https://www.cdc.gov/nchs/data_access/urban_rural.htm.
NOTE: Numbers may not add to totals because of rounding.
SOURCE: NCHS, National Hospital Ambulatory Medical Care Survey, 2016.
Table page 1 of 1

U.S. Department of Health and Human Services • Centers for Disease Control and Prevention • National Center for Health Statistics
National Hospital Ambulatory Medical Care Survey: 2016 Emergency Department Summary Tables
Table 3. Emergency department visits, by patient race, age, and ethnicity: United States, 2016
Patient characteristic
Number of visits (standard error)
in thousandsPercent distribution
(standard error)
Number of visits per 100 persons per year
(standard error)1
All visits 145,591 (8,798) 100.0 (…) 45.8 (2.8)
Race2,3 and age (years)White 106,602 (6,711) 73.2 (1.6) 43.5 (2.7)
Under 15 18,526 (1,709) 12.7 (0.8) 42.0 (3.9)15–24 14,619 (973) 10.0 (0.4) 46.7 (3.1)25–44 28,420 (1,842) 19.5 (0.6) 45.5 (3.0)45–64 25,868 (1,650) 17.8 (0.6) 38.8 (2.5)65–74 8,869 (717) 6.1 (0.3) 37.2 (3.0)75 and over 10,300 (914) 7.1 (0.4) 61.4 (5.4)
Black or African American 33,476 (3,195) 23.0 (1.5) 80.4 (7.7)Under 15 7,497 (1,218) 5.1 (0.7) 81.7 (13.3)15–24 5,315 (566) 3.7 (0.3) 82.2 (8.8)25–44 10,076 (917) 6.9 (0.4) 88.4 (8.0)45–64 7,331 (758) 5.0 (0.4) 71.9 (7.4)65–74 1,821 (230) 1.3 (0.1) 65.9 (8.3)75 and over 1,437 (232) 1.0 (0.1) 87.5 (14.2)
Other3 5,513 (675) 3.8 (0.5) 17.6 (2.2)
Ethnicity2
Hispanic or Latino 22,936 (2,484) 15.8 (1.3) 40.4 (4.4)Not Hispanic or Latino 122,656 (7,453) 84.2 (1.3) 47.0 (2.9)
White 87,290 (5,617) 60.0 (1.7) 44.8 (2.9)Black or African American 30,688 (2,894) 21.1 (1.4) 78.9 (7.4)Other³ 4,678 (623) 3.2 (0.4) 17.2 (2.3)
... Category not applicable. 1Visit rates are based on the July 1, 2016, set of estimates of the civilian noninstitutionalized population of the United States as developed by the U.S. Census Bureau Population Division. 2The race groups white, black or African American, and other include persons of Hispanic and non-Hispanic origin. Persons of Hispanic origin may be of any race. For 2016, race data were missing for 16.9% (weighted) of visits, and ethnicity data were missing for 19.5% (weighted) of visits. Starting with 2009 data, the National Center for Health Statistics has adopted the technique of model-based single imputation for National Hospital Ambulatory Medical Care Survey (NHAMCS) race and ethnicity data. The race imputation is restricted to three categories (white, black, and other) based on research by an internal work group and on quality concerns with imputed estimates for race categories other than white and black. The imputation technique is described in more detail in the 2016 NHAMCS public-use data file, available from: ftp://ftp.cdc.gov/pub/Health_Statistics/NCHS/Dataset_Documentation/NHAMCS/doc16_ed.pdf. 3Includes Asian, Native Hawaiian or Other Pacific Islander, American Indian or Alaska Native, and persons with more than one race.
NOTE: Numbers may not add to totals because of rounding.
SOURCE: NCHS, National Hospital Ambulatory Medical Care Survey, 2016.
Table page 1 of 1

U.S. Department of Health and Human Services • Centers for Disease Control and Prevention • National Center for Health Statistics
National Hospital Ambulatory Medical Care Survey: 2016 Emergency Department Summary Tables
Table 4. Wait time at emergency department visits: United States, 2016
Visit characteristic
Number of visits (standard error)
in thousandsPercent distribution
(standard error)
All visits 145,591 (8,798) 100.0 (...)
Time spent waiting to see a physician, APRN, or PA1
Fewer than 15 minutes 56,822 (4,981) 39.0 (2.4)15–59 minutes 45,974 (3,425) 31.6 (1.4)1 hour, but less than 2 hours 14,567 (1,600) 10.0 (0.9)2 hours, but less than 3 hours 4,715 (588) 3.2 (0.3)3 hours, but less than 4 hours 1,742 (281) 1.2 (0.2)4 hours, but less than 6 hours 1,345 (251) 0.9 (0.2)6 hours or more 750 (183) 0.5 (0.1)Not applicable 4,415 (464) 3.0 (0.3)Blank 15,261 (2,882) 10.5 (1.9)
Time spent in the emergency departmentLess than 1 hour 17,588 (1,761) 12.1 (0.9)1 hour, but less than 2 hours 32,816 (2,462) 22.5 (0.8)2 hours, but less than 4 hours 49,128 (3,139) 33.8 (0.8)4 hours, but less than 6 hours 21,940 (1,552) 15.1 (0.7)6 hours, but less than 10 hours 11,315 (1,064) 7.8 (0.6)10 hours, but less than 14 hours 2,293 (244) 1.6 (0.1)14 hours, but less than 24 hours 2,246 (281) 1.5 (0.2)24 hours or more 1,546 (270) 1.1 (0.2)Blank 6,719 (1,588) 4.6 (1.1)
Patient arrived in emergency department after business hours2
Yes 84,357 (5,332) 57.9 (0.6)No 59,887 (3,574) 41.1 (0.5)Blank *1,347 (530) 0.9 (0.4)
... Category not applicable. * Estimate does not meet NCHS standards of reliability.1APRN is advanced practice registered nurse. PA is physician assistant. The median wait time to see a physician, APRN, or PA was 17 minutes; the mean wait time to see a physician, APRN, or PA was 42 minutes. 2Business hours are defined as Monday through Friday, 8 a.m. to 5 p.m.
NOTE: Numbers may not add to totals because of rounding.
SOURCE: NCHS, National Hospital Ambulatory Medical Care Survey, 2016.
Table page 1 of 1

U.S. Department of Health and Human Services • Centers for Disease Control and Prevention • National Center for Health Statistics
National Hospital Ambulatory Medical Care Survey: 2016 Emergency Department Summary Tables
Table 5. Mode of arrival at emergency department, by patient age: United States, 2016
Patient age (years)Number of visits
in thousands
Patient mode of arrival
Total1 Ambulance Other Unknown or blank
Percent distribution (standard error)
All visits 145,591 100.0 15.8 (0.7) 81.8 (0.9) 2.5 (0.5)Under 15 27,436 100.0 4.4 (0.6) 93.5 (1.0) 2.1 (0.6)
Under 1 3,916 100.0 5.2 (1.3) 92.9 (1.6) 2.0 (0.8)1–4 9,790 100.0 4.5 (0.9) 93.7 (1.2) 1.8 (0.6)5–14 13,729 100.0 4.1 (0.8) 93.5 (1.1) 2.4 (0.8)
15–24 20,674 100.0 11.2 (1.1) 87.1 (1.3) 1.6 (0.4)25–44 40,014 100.0 12.8 (0.9) 84.9 (1.0) 2.4 (0.5)45–64 34,359 100.0 19.0 (1.0) 78.4 (1.2) 2.6 (0.6)65 and over 23,108 100.0 33.6 (1.3) 62.8 (1.5) 3.5 (0.9)
65–74 10,985 100.0 25.9 (1.6) 70.6 (1.7) 3.6 (1.1)75 and over 12,123 100.0 40.7 (1.6) 55.8 (1.8) 3.5 (0.9)
1Arrival by ambulance was the mode of arrival for 22,936,000 visits; arrival by other mode was the mode of arrival for 119,070,000 visits.
NOTE: Numbers may not add to totals because of rounding.
SOURCE: NCHS, National Hospital Ambulatory Medical Care Survey, 2016.
Table page 1 of 1

U.S. Department of Health and Human Services • Centers for Disease Control and Prevention • National Center for Health Statistics
National Hospital Ambulatory Medical Care Survey: 2016 Emergency Department Summary Tables
Table 6. Expected source of payment at emergency department visits: United States, 2016
Payment source
Number of visits1 (standard error)
in thousandsPercent of visits (standard error)
All visits 145,591 (8,798) ...
Private insurance 46,332 (2,961) 31.8 (1.3)Medicaid or CHIP2 or other state-based program 54,949 (3,889) 37.7 (1.9)Medicare 25,916 (1,849) 17.8 (0.9)Medicare and Medicaid3 5,523 (606) 3.8 (0.4)No insurance4 12,287 (1,508) 8.4 (0.9)
Self-pay 11,483 (1,424) 7.9 (0.8)No change or charity *1,047 (548) 0.7 (0.4)
Worker’s compensation 1,581 (208) 1.1 (0.1)Other 5,516 (822) 3.8 (0.5)Unknown or blank 16,584 (4,690) 11.4 (3.0)
... Category not applicable. * Estimate does not meet NCHS standards of reliability. 1Total exceeds “All visits” and percentage exceeds 100% because more than one source of payment may be reported per visit. 2Children’s Health Insurance Program. 3Visits are also included in the “Medicaid or CHIP or other state-based program” and “Medicare” categories. 4Defined as having only self-pay, no charge, or charity as payment sources.
NOTE: Numbers may not add to totals because of rounding.
SOURCE: NCHS, National Hospital Ambulatory Medical Care Survey, 2016.
Table page 1 of 1

U.S. D
epartment of H
ealth and Hum
an Services • Centers for D
isease Control and Prevention • N
ational Center for H
ealth Statistics
National H
ospital Ambulatory M
edical Care Survey: 2016 Em
ergency Departm
ent Summ
ary Tables
Table 7. Triage status of emergency department visits, by selected patient characteristics: United States, 2016
Patient and visit characteristic
Number of visits in thousands Total
Level 1 (immediate)
Level 2 (emergent)
Level 3 (urgent)
Level 4 (semiurgent)
Level 5 (nonurgent) No triage¹
Unknown or blank
Percent distribution (standard error)
All visits 145,591 100.0 0.6 (0.1) 8.1 (0.7) 32.4 (2.1) 24.5 (1.5) 4.3 (0.5) 6.5 (1.9) 23.5 (3.7)
Age (years)Under 15 27,436 100.0 0.6 (0.3) 4.6 (0.8) 22.4 (2.5) 32.3 (2.9) 7.6 (1.2) * (…) 24.9 (5.6)
Under 1 3,916 100.0 1.5 (0.8) 4.5 (1.0) 28.7 (3.8) 28.6 (3.1) 8.9 (2.3) * (…) 19.9 (4.5)1–4 9,790 100.0 0.4 (0.3) 4.0 (0.9) 23.0 (3.0) 31.2 (3.6) 7.1 (1.5) 6.0 (1.8) 28.2 (6.8)5–14 13,729 100.0 0.6 (0.3) 5.1 (1.1) 20.2 (2.3) 34.0 (3.1) 7.6 (1.3) * (…) 23.9 (5.5)
15–24 20,674 100.0 0.5 (0.2) 5.8 (0.8) 31.1 (2.4) 29.0 (2.1) 4.0 (0.7) * (…) 22.7 (3.7)25–44 40,014 100.0 0.4 (0.1) 6.8 (0.7) 33.9 (2.1) 25.9 (1.8) 3.7 (0.5) * (…) 23.4 (3.5)45–64 34,359 100.0 0.4 (0.1) 10.1 (1.1) 36.4 (2.5) 20.9 (1.5) 3.9 (0.6) * (…) 22.1 (3.5)65 and over 23,108 100.0 0.9 (0.2) 13.8 (1.6) 37.1 (3.0) 14.4 (1.4) 2.3 (0.6) 6.6 (1.9) 24.9 (4.2)
65–74 10,985 100.0 0.9 (0.2) 12.6 (1.5) 35.7 (3.2) 16.8 (1.9) 2.8 (0.7) 7.0 (1.9) 24.3 (4.2)75 and over 12,123 100.0 0.9 (0.3) 14.9 (2.1) 38.4 (3.3) 12.2 (1.4) 1.8 (0.5) 6.3 (1.9) 25.5 (4.5)
SexFemale 79,595 100.0 0.5 (0.1) 7.5 (0.7) 34.2 (2.3) 24.0 (1.6) 3.7 (0.5) 6.7 (1.9) 23.5 (3.7)Male 65,996 100.0 0.6 (0.1) 9.0 (0.8) 30.4 (2.0) 25.1 (1.5) 5.0 (0.7) 6.3 (1.9) 23.6 (3.7)
Race2
White 106,602 100.0 0.5 (0.1) 8.2 (0.7) 33.0 (2.2) 24.7 (1.5) 4.6 (0.6) 6.4 (1.8) 22.6 (3.7)Black or African American 33,476 100.0 0.7 (0.2) 7.9 (1.2) 30.5 (3.0) 24.5 (2.5) 3.8 (0.5) * (…) 26.4 (5.8)Other³ 5,513 100.0 0.3 (0.2) 8.2 (1.7) 33.6 (4.3) 20.8 (3.1) 2.5 (0.7) * (…) 23.5 (5.7)
Ethnicity and race2
Hispanic or Latino 22,936 100.0 0.7 (0.3) 5.4 (0.7) 30.5 (2.9) 28.5 (2.7) 6.1 (1.2) * (…) 23.3 (5.3)Not Hispanic or Latino 122,656 100.0 0.5 (0.1) 8.6 (0.8) 32.8 (2.2) 23.8 (1.6) 4.0 (0.5) 6.7 (2.0) 23.5 (3.7)
White 87,290 100.0 0.5 (0.1) 8.9 (0.8) 33.5 (2.4) 23.6 (1.6) 4.2 (0.6) 6.5 (1.9) 22.8 (3.9)Black or African American 30,688 100.0 0.7 (0.2) 8.0 (1.3) 30.7 (3.0) 24.6 (2.5) 3.7 (0.5) * (…) 25.8 (5.6)Other 4,678 100.0 0.2 (0.1) 8.3 (1.8) 34.2 (4.5) 20.8 (3.2) 2.1 (0.7) * (…) 22.4 (6.0)
See footnotes at end of table.
Table page 1 of 2

U.S. D
epartment of H
ealth and Hum
an Services • Centers for D
isease Control and Prevention • N
ational Center for H
ealth Statistics
National H
ospital Ambulatory M
edical Care Survey: 2016 Em
ergency Departm
ent Summ
ary Tables
Table 7. Triage status of emergency department visits, by selected patient characteristics: United States, 2016—Con.
Patient and visit characteristic
Number of visits in thousands Total
Level 1 (immediate)
Level 2 (emergent)
Level 3 (urgent)
Level 4 (semiurgent)
Level 5 (nonurgent) No triage¹
Unknown or blank
Expected source of payment4 Percent distribution (standard error)
Private insurance 46,332 100.0 0.6 (0.1) 9.1 (0.9) 33.8 (2.4) 23.6 (1.6) 3.5 (0.7) 7.3 (2.2) 22.1 (3.6)Medicaid or CHIP5 or other state-based program 54,949 100.0 0.5 (0.2) 6.8 (0.7) 32.8 (2.0) 28.3 (1.8) 5.3 (0.7) 6.5 (1.8) 19.8 (3.3)
Medicare 25,916 100.0 0.8 (0.2) 13.9 (1.5) 38.8 (2.6) 15.7 (1.4) 2.8 (0.6) 5.9 (1.7) 22.1 (3.5)Medicare and Medicaid6 5,523 100.0 0.4 (0.3) 14.0 (2.4) 40.1 (3.4) 15.9 (2.2) 3.4 (0.9) * (…) 21.2 (4.5)No insurance⁷ 12,287 100.0 0.5 (0.3) 6.0 (1.0) 31.8 (2.8) 30.3 (2.2) 5.9 (1.3) * (…) 20.2 (3.7)Worker’s compensation 1,581 100.0 * (…) * (…) 22.9 (4.6) 34.9 (4.8) * (…) * (…) 22.8 (6.3)Other 5,516 100.0 1.1 (0.7) 11.2 (1.4) 35.8 (3.5) 25.6 (2.8) 3.8 (0.8) * (…) 17.7 (4.7)Unknown or blank 16,584 100.0 0.2 (0.1) 7.5 (2.2) 22.6 (5.9) 15.4 (4.4) 2.4 (0.8) * (…) * (…)
* Estimate does not meet NCHS standards of reliability. ... Category not applicable. 1A visit in which the emergency service area (ESA) coded nursing triage as zero (had admitted to hospital or treated immediately) or visit occurred in ESA that does not conduct triage. 2The race groups white, black or African American, and other include persons of Hispanic and non-Hispanic origin. Persons of Hispanic origin may be of any race. Starting with 2009 data, the National Center for Health Statistics has adopted the technique of model-based single imputation for National Hospital Ambulatory Medical Care Survey (NHAMCS) race and ethnicity data. The race imputation is restricted to three categories (white, black, and other) based on research by an internal work group and on quality concerns with imputed estimates for race categories other than white and black. The imputation technique is described in more detail in the 2016 NHAMCS public-use data file, available from: ftp://ftp.cdc.gov/pub/Health_Statistics/NCHS/Dataset_Documentation/NHAMCS/doc16_ed.pdf. For 2016, race data were missing for 16.9% (weighted) of visits, and ethnicity data were missing for 19.5% (weighted) of visits. 3Includes Asian, Native Hawaiian or Other Pacific Islander, American Indian or Alaska Native, and persons with more than one race. 4Total exceeds “All visits” and percentage exceeds 100% because more than one source of payment may be reported per visit. 5Children’s Health Insurance Program. 6Visits also included in both the “Medicaid or CHIP or other state-based program” and “Medicare” categories. 7Defined as having only self-pay, no charge, or charity as payment sources.
NOTES: The 2016 Patient Record Form (PRF) requested responses using a 1–5 scale. PRF responses were evaluated with reference to responses on the Ambulatory Unit Record, completed during induction, to the question, “How many levels are in this emergency service area’s (ESA) triage system?” ESAs using 3- or 4-level triage systems had their responses rescaled to fit the 5-level system, such that, for 3-level ESAs, responses of 1, 2, and 3 were recoded to 2, 3, and 4. For ESAs using a 4-level system, responses were recoded from 1–4 to 2–5. The rescaling method was determined in consultation with subject-matter experts and was based on record analysis. Rescaling was required for about 5.6% of records, or 7.1% of records with nonmissing data. Triage level was imputed in years prior to 2012. Starting in 2012, triage level has not been imputed. Numbers may not add to totals because of rounding.
SOURCE: NCHS, National Hospital Ambulatory Medical Care Survey, 2016.
Table page 2 of 2

U.S. D
epartment of H
ealth and Hum
an Services • Centers for D
isease Control and Prevention • N
ational Center for H
ealth Statistics
National H
ospital Ambulatory M
edical Care Survey: 2016 Em
ergency Departm
ent Summ
ary Tables
Table 8. Initial blood pressure measurements recorded at emergency department visits for adults, by selected patient characteristics: United States, 2016
Initial blood pressure1
Patient characteristicNumber of visits
in thousands Total
Not high (SBP less than 120 mm Hg
and DBP less than 80 mm Hg)
Prehypertension (SBP 120–139 mm Hg or
DBP 80–89 mm Hg)
Stage 1 hypertension
(SBP 140–159 mm Hg or DBP 90–99 mm Hg)
Stage 2 hypertension
(SBP greater than or equal to 160 mm Hg or
DBP greater than 100 mm Hg)
Percent distribution(standard error)
All visits2 109,128 100.0 19.2 (0.5) 34.0 (0.6) 27.3 (0.5) 19.5 (0.6)
Age (years)18–24 15,293 100.0 29.6 (1.3) 43.8 (1.4) 21.5 (1.3) 5.1 (0.8)25–44 38,375 100.0 21.1 (0.9) 38.6 (1.1) 27.0 (0.9) 13.4 (0.7)45–64 33,221 100.0 15.0 (0.8) 30.0 (0.9) 29.7 (0.8) 25.3 (1.0)65–74 10,563 100.0 14.9 (1.4) 28.1 (1.7) 28.7 (1.5) 28.3 (1.7)75 and over 11,677 100.0 15.5 (0.8) 22.8 (1.0) 27.9 (1.4) 33.8 (1.5)
SexFemale 62,053 100.0 22.3 (0.7) 34.7 (0.8) 25.3 (0.6) 17.8 (0.8)Male 47,075 100.0 15.1 (0.6) 33.1 (0.9) 30.0 (0.8) 21.7 (0.9)
Race³White 81,328 100.0 18.7 (0.5) 34.2 (0.7) 27.6 (0.6) 19.5 (0.7)Black or African American 24,053 100.0 21.3 (1.0) 33.0 (1.2) 26.3 (1.1) 19.4 (0.9)Other4 3,748 100.0 17.9 (2.2) 37.0 (2.5) 26.4 (2.1) 18.7 (2.0)
Ethnicity and race3
Hispanic or Latino 14,184 100.0 20.7 (1.3) 38.7 (1.6) 24.8 (1.8) 15.8 (1.0)Not Hispanic or Latino 94,944 100.0 19.0 (0.5) 33.3 (0.6) 27.7 (0.6) 20.0 (0.6)
White 69,274 100.0 18.4 (0.5) 33.4 (0.8) 28.0 (0.7) 20.1 (0.7)Black or African American 22,361 100.0 21.0 (1.0) 32.2 (1.2) 26.7 (1.1) 20.0 (0.9)Other4 3,309 100.0 17.4 (2.2) 37.5 (2.5) 27.0 (2.2) 18.1 (2.3)
1SBP is systolic blood pressure. DBP is diastolic blood pressure. Three high blood pressure categories (SBP greater than 120 or DBP greater than 80) are based on “The Seventh Report of the Joint National Committee on Prevention, Detection, Evaluation, and Treatment of High Blood Pressure” and correspond to prehypertensive, stage 1 hypertensive, and stage 2 hypertensive ranges. If SBP and DBP fall into two categories, the visit is included in the higher blood pressure category. 2Visits by adults (aged 18 and over). Visits where blood pressure was taken represent 96.2% (standard error = 0.9) of all emergency department visits made by adults. 3The race groups white, black or African American, and other include persons of Hispanic and non-Hispanic origin. Persons of Hispanic origin may be of any race. For 2016, race data were missing for 15.1% (weighted) of visits made by adults, and ethnicity data were missing for 18.7% (weighted) of visits made by adults. Beginning with 2009, the National Center for Health Statistics has adopted model-based single imputation for National Hospital Ambulatory Medical Care Survey (NHAMCS) race and ethnicity data. The race imputation is restricted to three categories (white, black, and other) based on research by an internal work group and on quality concerns with imputed estimates for race categories other than white and black. The imputation technique is described in more detail in the 2016 NHAMCS public-use data file, available from: ftp://ftp.cdc.gov/pub/Health_Statistics/NCHS/Dataset_Documentation/NHAMCS/doc16_ed.pdf. 4Includes Asian, Native Hawaiian or Other Pacific Islander, American Indian or Alaska Native, and persons with more than one race.
NOTE: Numbers may not add to totals because of rounding.
SOURCE: NCHS, National Hospital Ambulatory Medical Care Survey, 2016. Table page 1 of 1

U.S. Department of Health and Human Services • Centers for Disease Control and Prevention • National Center for Health Statistics
National Hospital Ambulatory Medical Care Survey: 2016 Emergency Department Summary Tables
Table 9. Initial temperature, pulse oximetry, and visit history at emergency department visits: United States, 2016
Visit characteristic
Number of visits (standard error)
in thousandsPercent distribution
(standard error)
All visits 145,591 (8,798) 100.0 (…)
TemperatureFebrile: higher than 38.0° C or higher than 100.4°F 4,534 (403) 3.1 (0.2)Normal: 35.1–38.0° C or 95.1–100.4°F 130,985 (8,014) 90.0 (1.0)Hypothermic: lower than or equal to 35.0° C or lower than or equal to 95.0°F * (…) 0.1 (0.0)
Blank 9,927 (1,580) 6.8 (1.0)
Pulse oximetry1
95%–100% 122,051 (8,015) 83.8 (2.0)Less than 95% 12,148 (1,916) 8.3 (1.2)Blank 11,393 (1,967) 7.8 (1.3)
Episode of careInitial visit 128,606 (7,930) 88.3 (1.7)Follow-up visit 7,180 (709) 4.9 (0.4)Unknown or blank 9,805 (2,650) 6.7 (1.7)
Patient seen in this emergency department within the last 72 hours
Yes 3,878 (372) 2.7 (0.2)No 127,054 (8,321) 87.3 (2.1)Unknown or blank 14,659 (3,278) 10.1 (2.2)
... Category not applicable. * Estimate does not meet NCHS standards of reliability. 0.0 Quantity more than zero but less than 0.05. 1Normal oxygen saturation as measured by pulse oximetry is 95% or more.
NOTE: Numbers may not add to totals because of rounding.
SOURCE: NCHS, National Hospital Ambulatory Medical Care Survey, 2016.
Table page 1 of 1

U.S. Department of Health and Human Services • Centers for Disease Control and Prevention • National Center for Health Statistics
National Hospital Ambulatory Medical Care Survey: 2016 Emergency Department Summary Tables
Table 10. Ten principal reasons for emergency department visits, by patient age and sex: United States, 2016
Principal reason for visit and RVC code1
Number of visits (standard error)
in thousandsPercent distribution
(standard error)
All visits ... 145,591 (8,798) 100.0 (…)
Stomach and abdominal pain, cramps, and spasms S545 12,525 (876) 8.6 (0.3)Chest pain and related symptoms (not referable to body systems) S050 7,565 (647) 5.2 (0.2)Fever S010 5,494 (628) 3.8 (0.3)Cough S440 5,146 (483) 3.5 (0.2)Headache, pain in head S210 4,104 (359) 2.8 (0.2)Back symptoms S905 3,691 (359) 2.5 (0.2)Pain, site not referable to a specific body system S055 3,513 (315) 2.4 (0.1)Shortness of breath S415 3,444 (408) 2.4 (0.2)Accident, not otherwise specified J810 3,216 (350) 2.2 (0.2)Vomiting S530 2,769 (274) 1.9 (0.1)All other reasons2 ... 94,124 (5,518) 64.6 (0.6)
All visits under age 15 years ... 27,436 (2,587) 100.0 (…)Female ... 12,810 (1,244) 46.7 (0.8)
Fever S010 2,212 (365) 8.1 (0.8)Cough S440 1,102 (163) 4.0 (0.4)Stomach and abdominal pain, cramps, and spasms S545 603 (89) 2.2 (0.3)Vomiting S530 596 (99) 2.2 (0.3)Skin rash S860 511 (97) 1.9 (0.3)Symptoms referable to throat S455 482 (98) 1.8 (0.3)Accident, not otherwise specified J810 *341 (115) 1.2 (0.4)Earache or ear infection S355 328 (68) 1.2 (0.3)Injury, other and unspecified type—head, neck, and face J505 282 (63) 1.0 (0.2)Headache, pain in head S210 * (…) 0.7 (0.2)All other reasons2 ... 6,164 (610) 22.5 (1.0)
Male ... 14,625 (1,380) 53.3 (0.8)Fever S010 2,114 (266) 7.7 (0.7)Cough S440 1,348 (216) 4.9 (0.6)Vomiting S530 651 (120) 2.4 (0.3)Skin rash S860 614 (90) 2.2 (0.3)Earache or ear infection S355 506 (112) 1.8 (0.3)Injury, other and unspecified type—head, neck, and face J505 467 (121) 1.7 (0.4)Stomach and abdominal pain, cramps, and spasms S545 434 (82) 1.6 (0.3)Laceration or cut of facial area J210 345 (76) 1.3 (0.3)Accident, not otherwise specified J810 336 (80) 1.2 (0.3)Symptoms referable to throat S455 266 (70) 1.0 (0.3)All other reasons2 ... 7,546 (699) 27.5 (1.0)
See footnotes at end of table.
Table page 1 of 2

U.S. Department of Health and Human Services • Centers for Disease Control and Prevention • National Center for Health Statistics
National Hospital Ambulatory Medical Care Survey: 2016 Emergency Department Summary Tables
Table 10. Ten principal reasons for emergency department visits, by patient age and sex: United States, 2016—Con.
Principal reason for visit and RVC code1
Number of visits (standard error)
in thousandsPercent distribution
(standard error)
All visits, ages 15–64 years ... 95,048 (5,640) 100.0 (...)Female ... 53,909 (3,293) 56.7 (0.7)
Stomach and abdominal pain, cramps, and spasms S545 6,614 (515) 7.0 (0.3)Chest pain and related symptoms (not referable to body systems) S050 3,192 (320) 3.4 (0.2)Headache, pain in head S210 2,169 (224) 2.3 (0.2)Pain, site not referable to a specific body system S055 1,759 (195) 1.9 (0.2)Back symptoms S905 1,614 (182) 1.7 (0.2)Symptoms referable to throat S455 1,250 (165) 1.3 (0.1)Cough S440 1,249 (133) 1.3 (0.1)Problems of pregnancy S790 1,208 (183) 1.3 (0.2)Shortness of breath S415 1,088 (147) 1.1 (0.1)Motor vehicle accident, type of injury unspecified J805 1,022 (148) 1.1 (0.2)All other reasons² ... 32,745 (2,055) 34.5 (0.6)
Male ... 41,139 (2,506) 43.3 (0.7)Stomach and abdominal pain, cramps, and spasms S545 3,116 (276) 3.3 (0.2)Chest pain and related symptoms (not referable to body systems) S050 2,495 (272) 2.6 (0.2)Back symptoms S905 1,453 (157) 1.5 (0.1)Pain, site not referable to a specific body system S055 1,302 (154) 1.4 (0.1)Headache, pain in head S210 1,136 (143) 1.2 (0.1)Cough S440 866 (132) 0.9 (0.1)Shortness of breath S415 865 (192) 0.9 (0.2)Laceration or cut of upper extremity J225 859 (139) 0.9 (0.1)Motor vehicle accident, type of injury unspecified J805 814 (103) 0.9 (0.1)Other symptoms or problems relating to psychological and mental disorders S165 755 (110) 0.8 (0.1)
All other reasons2 ... 27,478 (1,666) 28.9 (0.6)
All visits, ages 65 years and over ... 23,108 (1,734) 100.0 (…)Female ... 12,876 (976) 55.7 (1.1)
Stomach and abdominal pain, cramps, and spasms S545 1,083 (162) 4.7 (0.6)Accident, not otherwise specified J810 845 (118) 3.7 (0.5)Chest pain and related symptoms (not referable to body systems) S050 776 (112) 3.4 (0.4)Shortness of breath S415 661 (109) 2.9 (0.4)Vertigo—dizziness S225 496 (71) 2.1 (0.3)General weakness S020 465 (92) 2.0 (0.3)Leg symptoms S920 398 (86) 1.7 (0.4)Cough S440 350 (78) 1.5 (0.3)Nausea S525 324 (79) 1.4 (0.3)Other symptoms or problems relating to psychological and mental disorders S165 315 (77) 1.4 (0.3)
All other reasons2 ... 7,163 (593) 31.0 (1.3)Male ... 10,232 (831) 44.3 (1.1)
Chest pain and related symptoms (not referable to body systems) S050 877 (137) 3.8 (0.5)Stomach and abdominal pain, cramps, and spasms S545 675 (130) 2.9 (0.5)Shortness of breath S415 639 (138) 2.8 (0.5)Accident, not otherwise specified J810 461 (84) 2.0 (0.3)General weakness S020 421 (101) 1.8 (0.4)Vertigo–dizziness S225 346 (82) 1.5 (0.3)Back symptoms S905 * (…) 1.2 (0.3)Other symptoms or problems relating to psychological and mental disorders S165 * (…) 1.1 (0.3)
Cough S440 231 (52) 1.0 (0.2)Leg symptoms S920 221 (53) 1.0 (0.2)All other reasons2 ... 5,827 (424) 25.2 (0.9)
... Category not applicable. * Estimate does not meet NCHS standards of reliability. 1Based on “A Reason for Visit Classification for Ambulatory Care” (National Center for Health Statistics, 1979). See the 2016 National Hospital Ambulatory Medical Care Survey public-use data file documentation, available from: ftp://ftp.cdc.gov/pub/Health_Statistics/NCHS/Dataset_Documentation/NHAMCS/doc16_ed.pdf. Reason for visit is defined by the patient’s own words. 2Includes all other reasons not listed above, as well as unknown and blank responses.
NOTE: Numbers may not add to totals because of rounding.
SOURCE: NCHS, National Hospital Ambulatory Medical Care Survey, 2016.
Table page 2 of 2

U.S. Department of Health and Human Services • Centers for Disease Control and Prevention • National Center for Health Statistics
National Hospital Ambulatory Medical Care Survey: 2016 Emergency Department Summary Tables
Table 11. Primary diagnosis at emergency department visits, by major disease category: United States, 2016
Major disease category and ICD–10–CM code range1
Number of visits(standard error)
in thousands Percent distribution
(standard error)
All visits ... 145,591 (8,798) 100.0 (…)
Certain infectious and parasitic diseases A00–B99 3,672 (303) 2.5 (0.2)Neoplasms C00–D49 294 (57) 0.2 (0.0)Diseases of the blood and blood-forming organs and certain disorders involving the immune mechanism D50–D89 695 (109) 0.5 (0.1)
Endocrine, nutritional, and metabolic diseases E00–E89 2,187 (242) 1.5 (0.1)Mental, behavioral and neurodevelopmental disorders F01–F99 5,485 (472) 3.8 (0.2)Diseases of the nervous system G00–G99 3,202 (260) 2.2 (0.1)Diseases of the eye and adnexa H00–H59 1,328 (155) 0.9 (0.1)Diseases of the ear and mastoid process H60–H95 3,185 (380) 2.2 (0.2)Diseases of the circulatory system I00–I99 4,774 (461) 3.3 (0.2)Diseases of the respiratory system J00–J99 14,918 (1,232) 10.2 (0.5)Diseases of the digestive system K00–K95 7,968 (538) 5.5 (0.3)Diseases of the skin and subcutaneous tissue L00–L99 5,037 (376) 3.5 (0.2)Diseases of the musculoskeletal system and connective tissue M00–M99 10,756 (762) 7.4 (0.3)Diseases of the genitourinary system N00–N99 8,192 (668) 5.6 (0.2)Pregnancy, childbirth and the puerperium O00–O9A 2,553 (259) 1.8 (0.2)Symptoms, signs, and abnormal clinical and laboratory findings, not elsewhere classified R00–R99 34,028 (2,207) 23.4 (0.6)
Injury, poisoning and certain other consequences of external causes S00–T88 29,888 (2,063) 20.5 (0.6)Injuries to the head S00–S09 6,477 (563) 21.7 (1.0)Injuries to the neck S10–S19 1,135 (160) 3.8 (0.5)Injuries to the thorax S20–S29 1,259 (182) 4.2 (0.5)Injuries to the abdomen, lower back, lumbar spine, pelvis and external genitals S30–S39 1,494 (202) 5.0 (0.6)
Injuries to the shoulder and upper arm S40–S49 1,899 (232) 6.4 (0.6)Injuries to the elbow and forearm S50–S59 1,552 (192) 5.2 (0.6)Injuries to the wrist, hand and fingers S60–S69 4,305 (374) 14.4 (0.9)Injuries to the hip and thigh S70–S79 683 (84) 2.3 (0.3)Injuries to the knee and lower leg S80–S89 2,343 (245) 7.8 (0.7)Injuries to the ankle and foot S90–S99 3,199 (318) 10.7 (0.7)Injuries involving multiple body regions or unspecified body region T07, T14 * (…) 3.7 (0.0)Effects of foreign body entering through natural orifice T15–T19 576 (105) 1.9 (0.3)Burns and corrosions T20–T32 516 (91) 1.7 (0.3)Poisoning by, adverse effect of and underdosing of drugs, medicaments and biological substances T36–T50 1,043 (146) 3.5 (0.5)
Toxic effects of substances chiefly nonmedicinal as to source T51–T65 552 (104) 1.8 (0.3)Other and unspecified effects of external causes T66–T78 1,127 (119) 3.8 (0.4)Certain early complications of trauma T79 * (…) * (…)Complications of surgical and medical care T80–T88 598 (110) 2.0 (0.3)
All other diagnoses2 ... 6,551 (557) 4.5 (0.3)Unknown or blank ... 877 (168) 0.6 (0.1)
... Category not applicable. 0.0 Quantity more than zero but less than 0.05. * Estimate does not meet NCHS standards of reliability. 1Based on the International Classification of Diseases,10 th Revision, Clinical Modification (ICD–10–CM). However, certain codes have been combined in this table to better describe the utilization of ambulatory care services. Web tables presenting diagnosis estimates before 2016 used the International Classification of Diseases, Ninth Revision, Clinical Modification (ICD–9–CM) coding system. Because there are substantial differences between ICD–9–CM and ICD–10–CM, users should take caution when comparing diagnosis estimates in this table with those from previous years. 2Includes certain conditions originating in the perinatal period (P00–P96), congenital malformations, deformations and chromosomal abnormalities (Q00–Q99), external causes of morbidity (V00–Y99), and factors influencing health status and contact with health services (Z00–Z99).
NOTE: Numbers may not add to totals because of rounding.
SOURCE: NCHS, National Hospital Ambulatory Medical Care Survey, 2016.
Table page 1 of 1

U.S. Department of Health and Human Services • Centers for Disease Control and Prevention • National Center for Health Statistics
National Hospital Ambulatory Medical Care Survey: 2016 Emergency Department Summary Tables
Table 12. Annual number and percent distribution of emergency department visits, by diagnosis group: United States, 2016
Primary diagnosis group1
Number of visits (standard error)
in thousands Percent distribution
(standard error)
All visits 145,591 (8,798) 100.0 (...)
Certain infectious and parasitic diseasesSepticemia (sepsis) 390 (88) 0.3 (0.1)Human immunodeficiency virus syndrome (HIV, HIV+, HIV positive) * (...) 0.0 (0.0)Viral warts, not sexually transmitted * (...) * (...)Acute and chronic viral hepatitis, excluding types B and C * (...) * (...)Acute and chronic viral hepatitis C * (...) * (...)Sexually transmitted infections (STIs) excluding viral hepatitis and HIV * (...) 0.1 (0.0)Unspecified viral infection 1,339 (160) 0.9 (0.1)Dermatophytosis * (...) 0.1 (0.0)Candidiasis 249 (58) 0.2 (0.0)Other systemic infectious and parasitic diseases 1,290 (137) 0.9 (0.1)
Neoplasms2
Diseases of the blood and blood-forming organs and certain disorders involving the immune mechanism
Anemias 526 (86) 0.4 (0.1)Other diseases of the blood and blood-forming organs and certain disorders involving the immune mechanism * (...) 0.1 (0.0)
Endocrine, nutritional and metabolic diseasesAcquired hypothyroidism * (...) 0.0 (0.0)Disorders of thyroid gland, excluding acquired hypothyroidism * (...) 0.0 (0.0)Type 1 diabetes mellitus * (...) 0.1 (0.0)Type 2 diabetes mellitus or unspecified 444 (67) 0.3 (0.0)Other types of diabetes mellitus * (...) 0.1 (0.0)Other disorders of endocrine glands * (...) 0.1 (0.0)Obesity * (...) * (...)Hyperlipidemias * (...) 0.0 (0.0)Volume depletion 727 (134) 0.5 (0.1)Other nutritional deficiencies and metabolic disorders 538 (106) 0.4 (0.1)
Mental, behavioral and neurodevelopmental disorders Dementia, excluding Alzheimer’s disease * (...) 0.1 (0.0)Alcohol-related disorders, excluding alcohol-related dementia and chronic alcoholic liver disease 1,533 (174) 1.1 (0.1)
Opioid-related disorders * (...) 0.1 (0.0)Cocaine-related disorders * (...) * (...)Nicotine dependence * (...) * (...)Other drug-related disorders excluding other drug-related dementia 399 (70) 0.3 (0.0)Schizophrenia 365 (92) 0.3 (0.1)Non-mood psychoses, excluding schizophrenia 333 (62) 0.2 (0.0)Bipolar disorders, excluding those with depression *224 (73) 0.2 (0.0)Bipolar disorders, with depression * (...) 0.0 (0.0)Depressive disorders, excluding bipolar depression and adjustment reaction with depressed mood 781 (110) 0.5 (0.1)
Acute reaction to stress and adjustment reaction, excluding those with depressed mood * (...) 0.1 (0.0)
Acute reaction to stress and adjustment reaction with depressed mood * (...) 0.1 (0.0)Eating disorders * (...) * (...)Impulse disorders * (...) * (...)Other mood disorders, nonpsychotic mental disorders, behavioral syndromes, and disorders of adult personality and behavior 1,030 (152) 0.7 (0.1)
Attention-deficit/hyperactivity disorders * (...) * (...)Oppositional defiant disorder * (...) * (...)Conduct disorders, excluding oppositional defiant disorder * (...) 0.1 (0.0)Autism spectrum disorder * (...) * (...)Other mental disorders * (...) 0.1 (0.0)
See footnotes at end of table.
Table page 1 of 6

U.S. Department of Health and Human Services • Centers for Disease Control and Prevention • National Center for Health Statistics
National Hospital Ambulatory Medical Care Survey: 2016 Emergency Department Summary Tables
Table 12. Annual number and percent distribution of emergency department visits, by diagnosis group: United States, 2016—Con.
Primary diagnosis group1
Number of visits (standard error)
in thousands Percent distribution
(standard error)
Diseases of the nervous system Alzheimer’s disease * (...) 0.0 (0.0)Other degenerative diseases of the nervous system, excluding Alzheimer’s disease * (...) * (...)
Migraine 1,094 (125) 0.8 (0.1)Transient cerebral ischemic attacks and related syndromes 309 (73) 0.2 (0.0)Sleep disorders, excluding sleep apnea (adult, pediatric, obstructive) and non-organic sleep disorders * (...) 0.0 (0.0)
Carpal tunnel syndrome * (...) 0.0 (0.0)Other disorders of the nervous system 1,595 (161) 1.1 (0.1)
Diseases of the eye and adnexaInflammation and disorders of eyelid * (...) 0.1 (0.0)Conjunctivitis 649 (101) 0.4 (0.1)Retinal detachment and other retinal disorders, excluding diabetic retinopathy * (...) * (...)
Glaucoma * (...) * (...)Other disorders of the eye and adnexa 510 (88) 0.4 (0.1)
Diseases of the ear and mastoid processDisorders of external ear 515 (101) 0.4 (0.1)Otitis media and eustachian tube disorders 1,944 (270) 1.3 (0.2)Other disorders of the ear and mastoid process 726 (133) 0.5 (0.1)
Diseases of the circulatory system Heart valve disorders * (...) * (...)Essential hypertension 1,016 (147) 0.7 (0.1)Hypertensive heart disease with heart failure * (...) * (...)Hypertensive heart disease without heart failure * (...) * (...)Hypertensive chronic kidney disease with stage 1 through stage 4 chronic kidney disease or unspecified chronic kidney disease * (...) * (...)
Hypertensive chronic kidney disease with stage 5 chronic kidney disease or end-stage renal disease (ESRD) * (...) * (...)
Hypertensive heart and chronic kidney disease with heart failure and stage 1 through 4 chronic kidney disease or unspecified chronic kidney disease * (...) * (...)
Secondary hypertension * (...) * (...)Angina pectoris not stated as with chronic ischemic heart disease * (...) 0.1 (0.0)Acute myocardial infarction 251 (55) 0.2 (0.0)Other acute and subacute ischemic heart disease * (...) 0.0 (0.0)Coronary atherosclerosis and other chronic ischemic heart disease (with angina pectoris) * (...) 0.0 (0.0)
Pulmonary heart disease and diseases of pulmonary circulation * (...) 0.0 (0.0)Conduction disorders * (...) * (...)Cardiac dysrhythmias, excluding ventricular fibrillation 950 (139) 0.7 (0.1)Cardiac arrest and ventricular fibrillation * (...) 0.1 (0.0)Heart failure, non-hypertensive 414 (68) 0.3 (0.0)Pericarditis, endocarditis, myocarditis and cardiomyopathy * (...) * (...)Other and ill-defined heart disease * (...) * (...)Cerebrovascular disease 590 (104) 0.4 (0.1)Diseases of the arteries, arterioles and capillaries * (...) 0.1 (0.0)Varicose veins of lower extremity * (...) 0.0 (0.0)Other disorder of circulatory system 826 (135) 0.6 (0.1)
See footnotes at end of table.
Table page 2 of 6

U.S. Department of Health and Human Services • Centers for Disease Control and Prevention • National Center for Health Statistics
National Hospital Ambulatory Medical Care Survey: 2016 Emergency Department Summary Tables
Table 12. Annual number and percent distribution of emergency department visits, by diagnosis group: United States, 2016—Con.
Primary diagnosis group1
Number of visits (standard error)
in thousands Percent distribution
(standard error)
Diseases of the respiratory system Streptococcal pharyngitis and tonsillitis 704 (138) 0.5 (0.1)Acute sinusitis 302 (75) 0.2 (0.1)Acute pharyngitis, except streptococcal pharyngitis 1,631 (219) 1.1 (0.1)Acute tonsillitis, except streptococcal tonsillitis 306 (71) 0.2 (0.0)Influenza 527 (140) 0.4 (0.1)Pneumonia 1,700 (201) 1.2 (0.1)Acute bronchitis and bronchiolitis 1,542 (192) 1.1 (0.1)Other acute respiratory infections 3,450 (411) 2.4 (0.2)Allergic rhinitis * (...) 0.1 (0.0)Chronic sinusitis 389 (99) 0.3 (0.1)Chronic diseases of tonsils and adenoids * (...) * (...)Chronic and unspecified bronchitis 629 (128) 0.4 (0.1)Emphysema and other chronic obstructive pulmonary disease, including chronic obstructive asthma 1,066 (168) 0.7 (0.1)
Asthma, excluding chronic obstructive asthma 1,777 (196) 1.2 (0.1)Respiratory failure * (...) 0.1 (0.0)Other diseases of the respiratory system 580 (92) 0.4 (0.1)
Diseases of the digestive system Diseases of the teeth and supporting structures, excluding dentofacial anomalies and disorders of the jaw 1,683 (182) 1.2 (0.1)
Esophagitis without gastroesophageal reflux disease * (...) * (...)Gastroesophageal reflux disease (with esophagitis) 318 (57) 0.2 (0.0)Other diseases of the esophagus * (...) 0.0 (0.0)Ulcers of stomach and small intestine * (...) 0.0 (0.0)Gastritis and duodentitis 490 (92) 0.3 (0.1)Appendicitis 197 (44) 0.1 (0.0)Diaphragmatic hernia * (...) * (...)Hernias of abdominal cavity, except diaphragmatic hernia 293 (84) 0.2 (0.1)Crohn’s disease and ulcerative colitis * (...) 0.1 (0.0)Complications of surgical and medical care 1,031 (118) 0.7 (0.1)Intestinal obstructions 268 (62) 0.2 (0.0)Diverticula of intestine 288 (70) 0.2 (0.0)Irritable bowel syndrome * (...) * (...)Constipation 854 (135) 0.6 (0.1)Anal and rectal diseases 286 (60) 0.2 (0.0)Hemorrhoids and perianal venous thrombosis * (...) 0.1 (0.0)Alcoholic liver disease * (...) 0.0 (0.0)Other diseases of the liver * (...) 0.1 (0.0)Disorders of gallbladder and biliary tract 431 (61) 0.3 (0.0)Diseases of the pancreas 273 (53) 0.2 (0.0)Unspecified gastrointestinal bleeding 412 (64) 0.3 (0.0)Other diseases of the digestive system 451 (81) 0.3 (0.1)
Diseases of the skin and subcutaneous tissueCellulitis 1,932 (214) 1.3 (0.1)Cutaneous abscess 1,095 (103) 0.8 (0.1)Other local infections of the skin and subcutaneous tissue 400 (69) 0.3 (0.0)Contact dermatitis and other eczema 335 (68) 0.2 (0.0)Psoriasis and other similar disorders * (...) * (...)Urticaria 448 (77) 0.3 (0.0)Other inflammatory conditions of skin and subcutaneous tissue 423 (89) 0.3 (0.1)Acne * (...) * (...)Sebaceous cyst * (...) 0.0 (0.0)Corns, callosities and other hypertrophic and atrophic skin condition * (...) * (...)Pressure ulcers * (...) * (...)Other disorders of the skin and subcutaneous tissue 277 (50) 0.2 (0.0)
See footnotes at end of table.
Table page 3 of 6

U.S. Department of Health and Human Services • Centers for Disease Control and Prevention • National Center for Health Statistics
National Hospital Ambulatory Medical Care Survey: 2016 Emergency Department Summary Tables
Table 12. Annual number and percent distribution of emergency department visits, by diagnosis group: United States, 2016—Con.
Primary diagnosis group1
Number of visits (standard error)
in thousands Percent distribution
(standard error)
Diseases of the musculoskeletal system and connective tissue
Infectious and inflammatory arthropathies, excluding rheumatoid and juvenile arthritis 331 (59) 0.2 (0.0)
Osteoarthritis 244 (43) 0.2 (0.0)Acquired deformities of fingers and toes * (...) * (...)Internal derangement of knee * (...) 0.0 (0.0)Other joint disorders 2,283 (210) 1.6 (0.1)Spinal stenosis * (...) * (...)Spondylopathies, excluding spinal stenosis * (...) 0.1 (0.0)Intervertebral disc disorders * (...) 0.1 (0.0)Low back pain, unspecified 1,327 (164) 0.9 (0.1)Other conditions of the spine and back, excluding low back pain 2,887 (250) 2.0 (0.1)Synovitis and tenosynovitis * (...) 0.0 (0.0)Soft tissue disorders related to use, overuse and pressure 371 (83) 0.3 (0.1)Ganglion and cyst of synovium, tendon and bursa * (...) 0.0 (0.0)Myalgia and myositis, unspecified * (...) 0.2 (0.0)Disorders of bone and cartilage, excluding osteoporosis 260 (57) 0.2 (0.0)Other diseases of the musculoskeletal system and connective tissue 2,412 (304) 1.7 (0.2)
Diseases of the genitourinary systemNephritis, nephrotic syndrome, and nephrosis * (...) * (...)Infections of kidney 381 (83) 0.3 (0.1)Acute kidney failure * (...) 0.1 (0.0)Chronic kidney disease, excluding ESRD * (...) 0.1 (0.0)ESRD * (...) 0.0 (0.0)Unspecified kidney failure, including uremia not otherwise specified * (...) 0.0 (0.0)Calculus of kidney and ureter 981 (133) 0.7 (0.1)Cystitis 628 (136) 0.4 (0.1)Urinary tract infection, site not specified 2,638 (279) 1.8 (0.1)Stress and other specified urinary incontinence, excluding functional * (...) * (...)Other diseases of the urinary system 753 (126) 0.5 (0.1)Benign prostatic hyperplasia * (...) * (...)Disorders of prepuce * (...) * (...)Other disorders of the male genital system 455 (102) 0.3 (0.1)Unspecified lump or mass in breast * (...) 0.1 (0.0)Disorders of the breast, excluding unspecified lump or mass * (...) 0.1 (0.0)Inflammatory disease of female pelvic organs 322 (61) 0.2 (0.0)Endometriosis * (...) * (...)Genital prolapse (female) * (...) * (...)Dysplasia of cervix (uteri) * (...) * (...)Other noninflammatory disorders of the female genital organs 459 (83) 0.3 (0.1)Disorders of menstruation and abnormal bleeding 748 (101) 0.5 (0.1)Menopausal and postmenopausal disorders * (...) * (...)Other disorders of female genital tract * (...) 0.1 (0.0)
Complications of pregnancy, childbirth, and the puerperiumMissed abortion * (...) * (...)Other pregnancy with abortive outcome * (...) 0.2 (0.0)Supervision of high-risk pregnancy * (...) 0.0 (0.0)Pre-existing diabetes mellitus, types 1 and 2, complicating pregnancy * (...) * (...)Early or threatened labor * (...) 0.0 (0.0)Other complications of pregnancy 2,230 (245) 1.5 (0.1)Other complications of childbirth * (...) * (...)
Certain conditions originating in the perinatal periodSleep apnea of newborn * (...) * (...)Certain other conditions originating in the perinatal period * (...) 0.1 (0.0)
Congenital anomalies * (...) 0.0 (0.0)
See footnotes at end of table.
Table page 4 of 6

U.S. Department of Health and Human Services • Centers for Disease Control and Prevention • National Center for Health Statistics
National Hospital Ambulatory Medical Care Survey: 2016 Emergency Department Summary Tables
Table 12. Annual number and percent distribution of emergency department visits, by diagnosis group: United States, 2016—Con.
Primary diagnosis group1
Number of visits (standard error)
in thousands Percent distribution
(standard error)
670 (99) 0.5 (0.1)523 (99) 0.4 (0.1)
1,099 (153) 0.8 (0.1)1,218 (142) 0.8 (0.1)5,321 (441) 3.7 (0.2)7,428 (549) 5.1 (0.2)1,463 (148) 1.0 (0.1)
237 (61) 0.2 (0.0)
599 (104) 0.4 (0.1)* (...) * (...)
1,347 (149) 0.9 (0.1)2,044 (324) 1.4 (0.2)2,136 (221) 1.5 (0.1)
619 (99) 0.4 (0.1)1,411 (153) 1.0 (0.1)
622 (102) 0.4 (0.1)7,290 (545) 5.0 (0.3)
496 (84) 0.3 (0.1)3,630 (393) 2.5 (0.2)
1,611 (266) 1.1 (0.2)1,868 (221) 1.3 (0.1)1,782 (163) 1.2 (0.1)
985 (136) 0.7 (0.1)
593 (92) 0.4 (0.1)
617 (134) 0.4 (0.1)718 (124) 0.5 (0.1)
773 (98) 0.5 (0.1)* (...) 0.1 (0.0)
* (...) 0.1 (0.0)
730 (100) 0.5 (0.1)
901 (120) 0.6 (0.1)382 (67) 0.3 (0.0)968 (146) 0.7 (0.1)
1,095 (141) 0.8 (0.1)682 (149) 0.5 (0.1)311 (66) 0.2 (0.0)
1,330 (162) 0.9 (0.1)1,022 (138) 0.7 (0.1)
559 (112) 0.4 (0.1)* (...) 0.1 (0.0)* (...) 0.1 (0.0)
4,451 (382) 3.1 (0.2)516 (91) 0.4 (0.1)385 (70) 0.3 (0.0)
297 (86) 0.2 (0.1)
* (...) * (...)
Symptoms, signs, and ill-defined conditions Abnormal heart beat and heart soundsEpistaxisCough, unspecifiedDyspnea and respiratory abnormalitiesChest painAbdominal painUnspecified jaundice, edema and other nonspecific skin symptoms HematuriaSymptoms involving the urinary system, excluding hematuria and urinary incontinence
Age-related cognitive decline, age-related physical debilityVertigo and lightheadednessFever of other and unknown originHeadacheMalaise and fatigueSyncope and collapseConvulsions and seizures, not elsewhere classifiedOther symptoms, signs, abnormal findings and ill-defined conditions
Injury and poisoning Injury of eye and orbitContusions (bruise, hematoma)Superficial injuries, excluding contusions (abrasion, blister, external constriction, splinter, superficial bite)
Open wound of headOpen wound of wrist, hand and fingersOpen wound of hip and lower limbOpen wound, excluding head, hand, fingers, lower limb and internal organs
Traumatic fracture of shoulder and upper arm (clavicle, scapula, humerus)
Traumatic fracture of forearm (radius and ulna)Traumatic fracture of wrist, hand and fingers (carpal, metacarpals, phalanges)
Traumatic fracture of hip (head and neck of femur)Traumatic fracture of ankle (medial malleolus, lateral malleolus, bimalleolar, trimalleolar)
Traumatic fracture of leg, foot and toes, excluding hip and ankle (femur, patella, tibia, fibula, tarsals, metatarsals, phalanges)
Other traumatic fractures (skull, facial bones, vertebrae, ribs, sternum, pelvis)
Dislocations, excluding tear of medial meniscusSprains and strains of neckSprains and strains of backSprains and strains of wrist and handSprains and strains of kneeSprains and strains of ankleSprains and strains, excluding neck, back, wrist, hand, knee, ankle ConcussionIntracranial injury, excluding concussionInternal injury of chest, abdomen and pelvisOther injuries, excluding burns and poisoningsBurns and corrosions, external and internal, excluding sunburn Poisoning due to drugs and biological substances, unintentionalPoisoning (overdose or wrong substance given or taken in error) due to drugs and biological substances, intentional self-harm
Poisoning (overdose or wrong substance given or taken in error) due to drugs and biological substances, undetermined intent
Adverse effects (of correct substance properly administered) of drugs and biological substances 367 (75) 0.3 (0.0)
See footnotes at end of table.
Table page 5 of 6

U.S. Department of Health and Human Services • Centers for Disease Control and Prevention • National Center for Health Statistics
National Hospital Ambulatory Medical Care Survey: 2016 Emergency Department Summary Tables
Table 12. Annual number and percent distribution of emergency department visits, by diagnosis group: United States, 2016—Con.
Primary diagnosis group1
Number of visits (standard error)
in thousandsPercent distribution
(standard error)
Injury and poisoning Toxic effects of substances chiefly nonmedical, accidental (unintentional) 483 (93) 0.3 (0.1)Toxic effects of substances chiefly nonmedical, intentional self-harm * (...) * (...)Toxic effects of substances chiefly nonmedical, undetermined * (...) 0.0 (0.0)Other and unspecified effects of external causes 1,132 (120) 0.8 (0.1)Complications of surgical and medical care 908 (140) 0.6 (0.1)
External-cause codesAccidental (unintentional) injury due to slipping, tripping, stumbling or fall * (...) * (...)Accidental (unintentional) injury due to other and unspecified means * (...) * (...)
Supplementary classifications Encounter for general adult medical examinations, including routine
gynecological examination 290 (60) 0.2 (0.0)Encounter for routine newborn health examination * (...) * (...)Encounter for routine child examination, excluding newborns * (...) 0.1 (0.0)Encounter and observation for suspected conditions ruled out 785 (168) 0.5 (0.1)Encounter for specific procedures and aftercare and follow-up examination after completed treatment, excluding for injuries 918 (136) 0.6 (0.1)
Potential health hazards related to communicable diseases * (...) 0.1 (0.0)Encounter for contraceptive management * (...) * (...)Fertility and genetic counseling and screening * (...) 0.1 (0.0)Other encounter related to pregnancy, excluding incidental pregnancy * (...) 0.0 (0.0)Postpartum care and examination * (...) * (...)Personal history of cerebral infarction or transient ischemic attack (TIA) without residual deficits * (...) * (...)
Potential health hazards related to personal and family history, excluding personal history of pulmonary embolism and personal history of cerebral infarction or TIA without residual deficits * (...) 0.1 (0.0)
Other factors influencing health status and contact with health services 1,103 (140) 0.8 (0.1)Uncodable entries3 2,423 (313) 1.7 (0.2)Unknown or blank 877 (168) 0.6 (0.1)
... Category not applicable. * Estimate does not meet NCHS standards of reliability.0.0 Quantity more than zero but less than 0.05. 1Based on the International Classification of Diseases, 10 th Revision, Clinical Modification (ICD–10–CM). Codes have been combined in this table to better describe the utilization of ambulatory care services. For a list of ICD–10–CM codes corresponding to a specific diagnosis group, contact the National Center for Health Statistics Ambulatory and Hospital Care Statistics Branch at [email protected]. 2Diagnosis groups for this chapter are not shown due to low sample sizes. 3Includes illegible diagnosis, left before being seen, walked out, eloped, left against medical advice, and entries of “none,” “no diagnosis,” “no disease,” and “healthy” as the only entry in the diagnosis item.
NOTE: Numbers may not add to totals because of rounding.
SOURCE: NCHS, National Hospital Ambulatory Medical Care Survey, 2016.
Table page 6 of 6

U.S. Department of Health and Human Services • Centers for Disease Control and Prevention • National Center for Health Statistics
National Hospital Ambulatory Medical Care Survey: 2016 Emergency Department Summary Tables
Table 13. Presence of chronic conditions at emergency department visits: United States, 2016
Chronic condition1
Number of visits (standard error)
in thousands Percent distribution
(standard error)
All visits 145,591 (8,798) 100.0 (...)
Alcohol misuse, abuse, or dependence 4,700 (379) 3.2 (0.2)Alzheimer's disease or dementia 1,785 (204) 1.2 (0.1)Asthma 14,687 (1,037) 10.1 (0.4)Cancer 3,874 (414) 2.7 (0.2)Cerebrovascular disease or history of stroke or transient ischemic attack 4,644 (443) 3.2 (0.2)
Chronic kidney disease 3,662 (379) 2.5 (0.2)Chronic obstructive pulmonary disease 8,164 (752) 5.6 (0.4)Congestive heart failure 4,111 (337) 2.8 (0.2)Coronary artery disease, ischemic heart disease or history of myocardial infarction 8,588 (748) 5.9 (0.4)
Depression 14,767 (1,153) 10.1 (0.5)Diabetes mellitus—Type 1 1,004 (191) 0.7 (0.1)Diabetes mellitus—Type 2 7,750 (767) 5.3 (0.4)Diabetes mellitus—Type unspecified 7,835 (774) 5.4 (0.4)End stage renal disease 1,002 (143) 0.7 (0.1)History of pulmonary embolism, deep vein thrombosis, or venous thromboembolism 1,728 (229) 1.2 (0.1)
HIV (human immunodeficiency virus) or AIDS (acquired immune deficiency syndrome) 726 (191) 0.5 (0.1)
Hyperlipidemia 12,880 (1,087) 8.8 (0.5)Hypertension 35,197 (2,383) 24.2 (0.7)Obesity 5,399 (597) 3.7 (0.3)Obstructive sleep apnea 2,821 (361) 1.9 (0.2)Osteoporosis 1,269 (194) 0.9 (0.1)Substance abuse or dependence 7,411 (874) 5.1 (0.5)None of the above 74,648 (4,836) 51.3 (1.0)Blank 1,763 (463) 1.2 (0.3)
... Category not applicable. 1Presence of chronic conditions was based on the checklist of chronic conditions and reported diagnoses. Total exceeds “All visits” and percentage exceeds 100% because more than one chronic condition may be reported per visit.
NOTE: Numbers may not add to totals because of rounding.
SOURCE: NCHS, National Hospital Ambulatory Medical Care Survey, 2016.
Table page 1 of 1

U.S. Department of Health and Human Services • Centers for Disease Control and Prevention • National Center for Health Statistics
National Hospital Ambulatory Medical Care Survey: 2016 Emergency Department Summary Tables
Table 14. Injury visits to emergency departments, by selected patient and hospital characteristics: United States, 2016
Patient and hospital characteristic
Number of visits (standard error)
in thousandsPercent distribution
(standard error)
Number of visits per 100 persons per year1
(standard error)
All injury visits2 42,253 (2,676) 100.0 (...) 13.3 (0.8)
Age (years)Under 15 8,717 (857) 20.6 (1.3) 14.3 (1.4)
Under 1 437 (72) 1.0 (0.2) 11.0 (1.8)1–4 2,693 (357) 6.4 (0.7) 16.9 (2.2)5–14 5,586 (562) 13.2 (0.9) 13.6 (1.4)
15–24 6,918 (512) 16.4 (0.6) 16.3 (1.2)25–44 11,717 (831) 27.7 (1.0) 14.1 (1.0)45–64 9,468 (656) 22.4 (0.9) 11.3 (0.8)65 and over 5,433 (405) 12.9 (0.6) 11.3 (0.8)
65–74 2,440 (243) 5.8 (0.4) 8.6 (0.9)75 and over 2,993 (252) 7.1 (0.5) 15.3 (1.3)
Female 20,177 (1,296) 47.8 (0.9) 12.4 (0.8)Under 15 3,856 (431) 9.1 (0.8) 12.9 (1.4)15–24 3,259 (244) 7.7 (0.4) 15.5 (1.2)25–44 5,444 (447) 12.9 (0.7) 12.9 (1.1)45–64 4,359 (347) 10.3 (0.6) 10.1 (0.8)65–74 1,397 (140) 3.3 (0.3) 9.2 (0.9)75 and over 1,861 (190) 4.4 (0.4) 16.3 (1.7)
Male 22,076 (1,493) 52.2 (0.9) 14.2 (1.0)Under 15 4,861 (502) 11.5 (0.8) 15.6 (1.6)15–24 3,659 (364) 8.7 (0.6) 17.0 (1.7)25–44 6,272 (468) 14.8 (0.7) 15.3 (1.1)45–64 5,109 (387) 12.1 (0.6) 12.6 (1.0)65–74 1,043 (146) 2.5 (0.3) 7.9 (1.1)75 and over 1,131 (115) 2.7 (0.2) 13.9 (1.4)
Ownership
Voluntary 29,310 (2,530) 69.4 (4.3) 9.2 (0.8)Proprietary 7,854 (1,537) 18.6 (3.4) 2.5 (0.5)Government 5,089 (1,475) 12.0 (3.4) 1.6 (0.5)
Geographic regionNortheast 7,113 (880) 16.8 (2.0) 12.8 (1.6)Midwest 9,194 (1,092) 21.8 (2.4) 13.7 (1.6)South 15,833 (1,804) 37.5 (3.2) 13.2 (1.5)West 10,114 (1,391) 23.9 (2.8) 13.4 (1.8)
Metropolitan status3
Metropolitan statistical area 33,628 (2,621) 79.6 (3.5) 12.3 (1.0)Nonmetropolitan statistical area 8,625 (1,563) 20.4 (3.5) 19.6 (3.5)
... Category not applicable. 1Visit rates for age, sex, and region are based on the July 1, 2016, set of estimates of the civilian noninstitutionalized population of the United States as developed by the U.S. Census Bureau Population Division. 2The definition of injury changed in 2016 due to the switch from the International Classification of Diseases, Ninth Revision, Clinical Modification (ICD–9–CM) coding system for diagnosis data to the International Classification of Diseases, 10 th Revision, Clinical Modification (ICD–10–CM) coding system. In prior years, injury visits included any-listed reason for visit and diagnosis codes related to injury and poisoning based on ICD–9–CM. In 2016, injury visits included any-listed reason for visit and diagnosis codes related to injury and poisoning based on ICD–10–CM and information indicating that the visit is related to an injury, trauma, overdose, or poisoning based on the Patient Record Form item, “Is this visit related to an injury/trauma, overdose/poisoning, or adverse effect of medical/surgical treatment?” with further consideration of values for visits with no concrete evidence of injury. “All injury visits” includes any-listed reason for visit and diagnosis codes related to injury and poisoning. Injury visits do not include adverse effects and complication codes. Using this definition, injury visits represent 29.0% (standard error = 0.6) of all emergency department visits. For more details, see the 2016 NHAMCS public-use data file documentation, available from: ftp://ftp.cdc.gov/pub/Health_Statistics/NCHS/Dataset_Documentation/NHAMCS/doc16_ed.pdf. 3Population estimates by metropolitan statistical area status are based on data from the National Center for Health Statistics’ 2016 National Health Interview Survey, compiled according to the Office of Management and Budget’s definition of core-based statistical areas as of February 2013. See https://www.census.gov/programs-surveys/metro-micro.html for more about metropolitan statistical area definitions.
NOTE: Numbers may not add to totals because of rounding.
SOURCE: NCHS, National Hospital Ambulatory Medical Care Survey, 2016.
Table page 1 of 1

U.S. Department of Health and Human Services • Centers for Disease Control and Prevention • National Center for Health Statistics
National Hospital Ambulatory Medical Care Survey: 2016 Emergency Department Summary Tables
Table 15. Injury visits to emergency departments, by race, age, and ethnicity: United States, 2016
Patient characteristic
Number of visits (standard error)
in thousandsPercent distribution
(standard error)
Number of visits per 100 persons per year
(standard error)1
All injury visits2 42,253 (2,676) 100.0 (...) 13.3 (0.8)
Race and age (years)3
White 32,044 (2,113) 75.8 (1.6) 13.1 (0.9)Under 15 6,332 (624) 15.0 (1.0) 14.4 (1.4)15–24 5,352 (447) 12.7 (0.6) 17.1 (1.4)25–44 8,584 (653) 20.3 (0.9) 13.8 (1.0)45–64 7,234 (502) 17.1 (0.8) 10.9 (0.8)65–74 1,935 (187) 4.6 (0.4) 8.1 (0.8)75 and over 2,606 (235) 6.2 (0.5) 15.5 (1.4)
Black or African American 8,515 (882) 20.2 (1.6) 20.4 (2.1)Under 15 1,877 (367) 4.4 (0.8) 20.5 (4.0)15–24 1,330 (166) 3.1 (0.4) 20.6 (2.6)25–44 2,652 (324) 6.3 (0.7) 23.3 (2.8)45–64 1,907 (251) 4.5 (0.5) 18.7 (2.5)65–74 462 (98) 1.1 (0.2) 16.7 (3.6)75 and over 287 (62) 0.7 (0.1) 17.5 (3.8)
Other⁴ 1,693 (239) 4.0 (0.5) 5.4 (0.8)
Ethnicity3
Hispanic 6,054 (663) 14.3 (1.2) 10.7 (1.2)Not Hispanic 36,199 (2,324) 85.7 (1.2) 13.9 (0.9)
White 26,948 (1,829) 63.8 (1.7) 13.8 (0.9)Black or African American 7,852 (799) 18.6 (1.4) 20.2 (2.1)Other4 1,399 (217) 3.3 (0.5) 5.1 (0.8)
... Category not applicable. 1Visit rates are based on the July 1, 2016, estimates of the civilian noninstitutionalized population of the United States as developed by the U.S. Census Bureau Population Division. 2The definition of injury changed in 2016 due to the switch from the International Classification of Diseases, Ninth Revision, Clinical Modification (ICD–9–CM) coding system for diagnosis data to the International Classification of Diseases, 10 th Revision, Clinical Modification (ICD–10–CM) coding system. In prior years, injury visits included any-listed reason for visit and diagnosis codes related to injury and poisoning based on ICD–9–CM. In 2016, injury visits included any-listed reason for visit and diagnosis codes related to injury and poisoning based on ICD–10–CM and information indicating that the visit is related to an injury, trauma, overdose, or poisoning based on the Patient Record Form item, “Is this visit related to an injury/trauma, overdose/poisoning, or adverse effect of medical/surgical treatment?” with further consideration of values for visits with no concrete evidence of injury. “All injury visits” do not include adverse effects of medical or surgical treatment. Using this definition, injury visits accounted for 29% (standard error = 0.6) of all emergency department visits in 2016. For more details, see the 2016 National Hospital Ambulatory Medical Care Survey (NHAMCS) public-use data file documentation, available from: ftp://ftp.cdc.gov/pub/Health_Statistics/NCHS/Dataset_Documentation/NHAMCS/doc16_ed.pdf. 3The race groups white, black or African American, and other include persons of Hispanic and non-Hispanic origin. Persons of Hispanic origin may be of any race. For 2016, race data were missing for 17.1% of injury visits, and ethnicity data were missing for 19.8% of injury visits. Beginning with 2009, the National Center for Health Statistics has adopted model-based single imputation for NHAMCS race and ethnicity data. The race imputation is restricted to three categories (white, black, and other) based on research by an internal work group and on quality concerns with imputed estimates for race categories other than white and black. The imputation technique is described in more detail in the 2016 NHAMCS public-use data file documentation. 4Includes Asian, Native Hawaiian or Other Pacific Islander, American Indian or Alaska Native, and persons with more than one race.
NOTE: Numbers may not add to totals because of rounding.
SOURCE: NCHS, National Hospital Ambulatory Medical Care Survey, 2016.
Table page 1 of 1

U.S. Department of Health and Human Services • Centers for Disease Control and Prevention • National Center for Health Statistics
National Hospital Ambulatory Medical Care Survey: 2016 Emergency Department Summary Tables
Table 16. Emergency department visits related to injury, poisoning, and adverse effect, by intent: United States, 2016
Intent1
Number of visits (standard error)
in thousandsPercent distribution
(standard error)
All injury visits related to injury, poisoning, and adverse effect2
45,501 (2,871) 100.0 (...)
Unintentional 29,200 (1,908) 64.2 (1.1)Self-harm 273 (64) 0.6 (0.1)Assault 1,619 (160) 3.6 (0.3)Undetermined or other3 1,722 (179) 3.8 (0.3)Legal intervention or war * (...) 0.1 (0.1)Blank cause 12,635 (900) 27.8 (1.0)
... Category not applicable. * Estimate does not meet NCHS standards of reliability. 1Based on the proposed International Classification of Diseases, 10 th Revision, Clinical Modification (ICD–10–CM) external cause-of-injury matrix, available from: https://www.cdc.gov/injury/wisqars/pdf/ICD-10-CM_External_Cause_Injury_Codes-a.pdf. 2The definition of visits related to injury, poisoning, and adverse effects changed in 2016 due to the switch from the International Classification of Diseases, Ninth Revision, Clinical Modification (ICD–9–CM) coding system for diagnosis data to the ICD–10–CM coding system. In prior years, injury visits included any-listed reason for visit and diagnosis codes related to injury and poisoning based on ICD–9–CM. In 2016, injury visits included any-listed reason for visit and diagnosis codes related to injury, poisoning, and adverse effects based on ICD–10–CM and information indicating that the visit is related to an injury, trauma, overdose, poisoning, or adverse effect of medical or surgical treatment based on the Patient Record Form item, “Is this visit related to an injury/trauma, overdose/poisoning, or adverse effect of medical/surgical treatment?,” with further consideration of values for visits with no concrete evidence of injury. Using this definition, injury visits accounted for 31.3% (standard error = 0.6) of all emergency department visits in 2016. 3Other includes certain diagnosis codes for injury visits not captured using the ICD–10–CM external-cause matrix. Common diagnoses in this group include medical and surgical complications, activity of person seeking health care (such as a heart attack while shoveling snow, which resulted from, or was contributed to, by the activity), and place of occurrence of external cause. For more details, see the 2016 National Hospital Ambulatory Medical Care Survey public-use data file documentation, available from: ftp://ftp.cdc.gov/pub/Health_Statistics/NCHS/Dataset_Documentation/NHAMCS/doc16_ed.pdf.
NOTE: Numbers may not add to totals because of rounding.
SOURCE: NCHS, National Hospital Ambulatory Medical Care Survey, 2016.
Table page 1 of 1

U.S. Department of Health and Human Services • Centers for Disease Control and Prevention • National Center for Health Statistics
National Hospital Ambulatory Medical Care Survey: 2016 Emergency Department Summary Tables
Table 17. Emergency department visits related to injury, poisoning, and adverse effect, by mechanism: United States, 2016
Mechanism1
Number of visits (standard error)
in thousandsPercent distribution
(standard error)
All injury visits related to injury, poisoning, and adverse effect 2
45,501 (2,871) 100.0 (...)
Cut or pierce 2,378 (215) 5.2 (0.4)Drowning or submersion * (...) * (...)Fall 10,481 (729) 23.0 (0.9)Fire or burn 338 (67) 0.7 (0.1)Fire or flame * (...) 0.3 (0.1)Hot object or substance 222 (48) 0.5 (0.1)Firearm * (...) 0.2 (0.1)Machinery * (...) 0.4 (0.1)All transportation 5,221 (426) 11.5 (0.7)
Motor vehicle—traffic 3,692 (334) 8.1 (0.6)Motor vehicle—nontraffic 290 (74) 0.6 (0.2)Pedal cyclist, other 264 (62) 0.6 (0.1)Pedestrian, other * (...) 0.2 (0.1)Other land transport 843 (130) 1.9 (0.2)Other transport * (...) 0.1 (0.0)
Natural or environmental³ 1,833 (229) 4.0 (0.4)Overexertion 296 (74) 0.7 (0.2)Struck by or against 5,921 (562) 13.0 (0.7)Other specified4 805 (121) 1.8 (0.2)Unspecified or other5 5,310 (423) 11.7 (0.5)Blank cause 12,635 (900) 27.8 (1.0)
... Category not applicable. * Estimate does not meet NCHS standards of reliability. 0.0 Quantity more than zero but less than 0.05. 1Based on the proposed International Classification of Diseases, 10 th Revision, Clinical Modification (ICD–10–CM) external-cause of-injury matrix, available from: https://www.cdc.gov/injury/wisqars/pdf/ICD-10-CM_External_Cause_Injury_Codes-a.pdf. 2The definition of visits related to injury, poisoning, and adverse effects changed in 2016 due to the switch from the International Classification of Diseases, Ninth Revision, Clinical Modification (ICD–9–CM) coding system for diagnosis data to ICD–10–CM. In prior years, injury visits included any-listed reason for visit and diagnosis codes related to injury and poisoning based on ICD–9–CM. In 2016, injury visits included any-listed reason for visit and diagnosis codes related to injury, poisoning, and adverse effects based on ICD–10–CM and information indicating that the visit is related to an injury, trauma, overdose, poisoning, or adverse effect of medical or surgical treatment based on the Patient Record Form item, “Is this visit related to an injury/trauma, overdose/poisoning, or adverse effect of medical/surgical treatment?,” with further consideration of values for visits with no concrete evidence of injury. Using this definition, injury visits accounted for 31.3% (standard error = 0.6) of all emergency department visits in 2016. 3Includes bites and stings (venomous and nonvenomous), natural or environmental, and other. 4Includes child or adult abuse, foreign body, classifiable and not elsewhere classifiable. 5Other includes certain diagnosis codes for injury visits not captured using the ICD–10–CM external-cause matrix. Common diagnoses in this group include medical and surgical complications, activity of person seeking health care, and place of occurrence of external cause. For more details, see the 2016 National Hospital Ambulatory Medical Care Survey public-use data file documentation, available from: ftp://ftp.cdc.gov/pub/Health_Statistics/NCHS/Dataset_Documentation/NHAMCS/doc16_ed.pdf.
NOTE: Numbers may not add to totals because of rounding.
SOURCE: NCHS, National Hospital Ambulatory Medical Care Survey, 2016.
Table page 1 of 1

U.S. Department of Health and Human Services • Centers for Disease Control and Prevention • National Center for Health Statistics
National Hospital Ambulatory Medical Care Survey: 2016 Emergency Department Summary Tables
Table 18. Selected diagnostic and screening services ordered or provided at emergency department visits: United States, 2016
Diagnostic and screening services ordered or provided
Number of visits1 (standard error)
in thousandsPercent distribution
(standard error)
All visits 145,591 (8,798) ...
One or more diagnostic or screening service listed 105,322 (6,490) 72.3 (1.0)None 38,507 (2,776) 26.4 (1.0)Blank 1,762 (461) 1.2 (0.3)
Blood testsComplete blood count 56,381 (3,726) 38.7 (1.1)Creatinine or renal function panel 6,646 (1,444) 4.6 (0.9)Glucose, serum 10,242 (1,733) 7.0 (1.1)Electrolytes *3,576 (1,102) 2.5 (0.7)Prothrombin time (IPT/PTT/INR)2 13,038 (1,330) 9.0 (0.7)Liver enzymes or hepatic function panel 5,705 (1,197) 3.9 (0.8)Cardiac enzymes 7,897 (1,207) 5.4 (0.7)Comprehensive metabolic panel 41,186 (3,179) 28.3 (1.3)Blood culture 4,785 (443) 3.3 (0.3)Brain natriuretic peptide 4,132 (532) 2.8 (0.3)D-dimer 2,984 (319) 2.0 (0.2)Arterial blood gases *3,058 (1,130) 2.1 (0.8)Blood alcohol concentration 3,215 (373) 2.2 (0.2)Basic metabolic panel 15,015 (1,539) 10.3 (1.0)Lactate 3,240 (531) 2.2 (0.3)Other blood test 28,390 (2,132) 19.5 (1.2)Any blood test listed 64,780 (4,033) 44.5 (1.1)
ImagingX-ray 49,061 (3,276) 33.7 (0.8)Computed tomography (CT) scan 25,421 (1,723) 17.5 (0.6)
Abdomen or pelvis 10,377 (730) 7.1 (0.3)Chest 2,763 (284) 1.9 (0.2)Head 11,869 (883) 8.2 (0.4)Other 4,595 (424) 3.2 (0.3)
Intravenous (IV) contrast with CT 6,349 (575) 4.4 (0.3)Ultrasound 7,635 (730) 5.2 (0.4)Magnetic resonance imaging (MRI) scan 1,280 (154) 0.9 (0.1)IV contrast with MRI * (...) 0.1 (0.0)Other imaging 1,295 (154) 0.9 (0.1)Any imaging 70,496 (4,509) 48.4 (0.9)
Examinations and testsCardiac monitor 10,990 (1,190) 7.5 (0.7)Urinalysis or urine dipstick 38,791 (2,593) 26.6 (0.8)Electrocardiogram 29,588 (2,130) 20.3 (0.8)Urine culture 11,862 (1,112) 8.1 (0.6)Pregnancy/HCG test3 12,032 (947) 8.3 (0.5)Toxicology screen 6,398 (638) 4.4 (0.4)Influenza test 3,123 (477) 2.1 (0.3)Throat culture 2,576 (423) 1.8 (0.3)Wound culture 609 (133) 0.4 (0.1)Other culture 1,970 (255) 1.4 (0.2)HIV4 test 650 (160) 0.4 (0.1)Other test or service 19,580 (2,082) 13.4 (1.3)
... Category not applicable. * Estimate does not meet NCHS standards of reliability. 1Total exceeds “All visits” and percentage exceeds 100% because more than one service may be reported per visit. 2PT is prothrombin time. PTT is partial thromboplastin time. INR is international normalized ratio. 3HCG is human chorionic gonadotropin. 4HIV is human immunodeficiency virus.
SOURCE: NCHS, National Hospital Ambulatory Medical Care Survey, 2016.
Table page 1 of 1
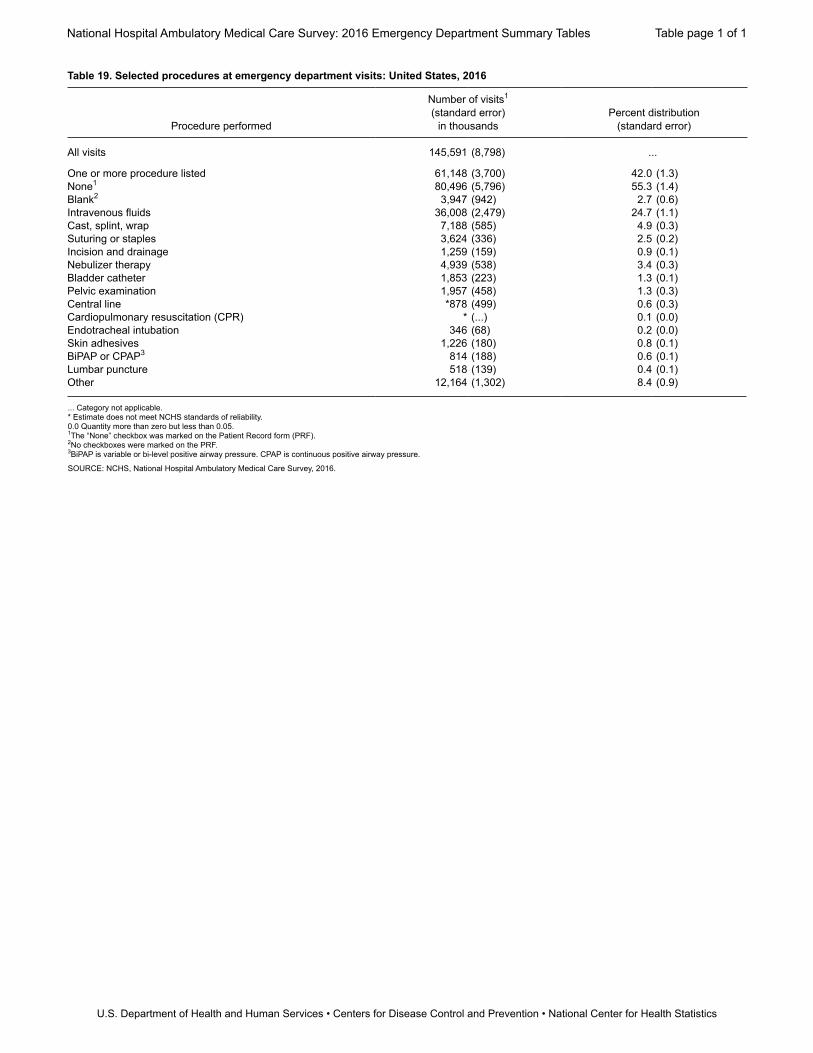
U.S. Department of Health and Human Services • Centers for Disease Control and Prevention • National Center for Health Statistics
National Hospital Ambulatory Medical Care Survey: 2016 Emergency Department Summary Tables
Table 19. Selected procedures at emergency department visits: United States, 2016
Procedure performed
Number of visits1 (standard error)
in thousandsPercent distribution
(standard error)
All visits 145,591 (8,798) ...
One or more procedure listed 61,148 (3,700) 42.0 (1.3)None1 80,496 (5,796) 55.3 (1.4)Blank2 3,947 (942) 2.7 (0.6)Intravenous fluids 36,008 (2,479) 24.7 (1.1)Cast, splint, wrap 7,188 (585) 4.9 (0.3)Suturing or staples 3,624 (336) 2.5 (0.2)Incision and drainage 1,259 (159) 0.9 (0.1)Nebulizer therapy 4,939 (538) 3.4 (0.3)Bladder catheter 1,853 (223) 1.3 (0.1)Pelvic examination 1,957 (458) 1.3 (0.3)Central line *878 (499) 0.6 (0.3)Cardiopulmonary resuscitation (CPR) * (...) 0.1 (0.0)Endotracheal intubation 346 (68) 0.2 (0.0)Skin adhesives 1,226 (180) 0.8 (0.1)BiPAP or CPAP3 814 (188) 0.6 (0.1)Lumbar puncture 518 (139) 0.4 (0.1)Other 12,164 (1,302) 8.4 (0.9)
... Category not applicable. * Estimate does not meet NCHS standards of reliability. 0.0 Quantity more than zero but less than 0.05. 1The “None” checkbox was marked on the Patient Record form (PRF). 2No checkboxes were marked on the PRF. 3BiPAP is variable or bi-level positive airway pressure. CPAP is continuous positive airway pressure.
SOURCE: NCHS, National Hospital Ambulatory Medical Care Survey, 2016.
Table page 1 of 1

U.S. Department of Health and Human Services • Centers for Disease Control and Prevention • National Center for Health Statistics
National Hospital Ambulatory Medical Care Survey: 2016 Emergency Department Summary Tables
Table 20. Medication therapy and number of medications mentioned at emergency department visits: United States, 2016
Medication therapy1
Number of visits (standard error)
in thousandsPercent distribution
(standard error)
All visits 145,591 (8,798) 100.0 (...)
Visits with mention of medication2 117,068 (7,163) 80.4 (0.7)Visits without mention of medication 28,523 (1,960) 19.6 (0.7)
Number of medications provided or prescribed3
0 medications 28,523 (1,960) 19.6 (0.7)1 medication 32,025 (2,122) 22.0 (0.5)2 medications 29,320 (2,001) 20.1 (0.4)3 medications 20,317 (1,381) 14.0 (0.3)4 medications 14,009 (1,051) 9.6 (0.4)5 medications 7,804 (548) 5.4 (0.3)6 medications 5,087 (433) 3.5 (0.2)7 medications 2,941 (323) 2.0 (0.2)8 medications 1,803 (228) 1.2 (0.1)9 medications 1,124 (167) 0.8 (0.1)10 medications 529 (87) 0.4 (0.1)11 medications 511 (97) 0.4 (0.1)12 medications 325 (75) 0.2 (0.1)13 medications or more 1,272 (278) 0.9 (0.2)
... Category not applicable. 1Includes prescription drugs, over-the-counter preparations, immunizations, and desensitizing agents. 2Visits at which one or more drugs were given in the emergency department (ED) or prescribed at discharge (up to 30 per visit). Also defined as drug visit. 3There were 358,950,000 drug mentions at ED visits in 2016. The average drug mention rate was 2.5 drug mentions per ED visit. For visits with at least one drug mention, the average drug visit rate was 3.1 drugs per visit.
NOTE: Numbers may not add to totals because of rounding.
SOURCE: NCHS, National Hospital Ambulatory Medical Care Survey, 2016.
Table page 1 of 1

U.S. Department of Health and Human Services • Centers for Disease Control and Prevention • National Center for Health Statistics
National Hospital Ambulatory Medical Care Survey: 2016 Emergency Department Summary Tables
Table 21. Twenty most frequently mentioned drugs at emergency department visits, by therapeutic drug category: United States, 2016
Drug category1
Number of occurrences (standard error)
in thousandsPercent of drug mentions2
(standard error)
Analgesics3 100,656 (6,421) 28.0 (0.4)Antiemetic or antivertigo agents 41,685 (2,671) 11.6 (0.4)Minerals and electrolytes 34,378 (2,542) 9.6 (0.4)Miscellaneous respiratory agents 28,301 (2,159) 7.9 (0.3)Anxiolytics, sedatives, and hypnotics 16,768 (1,128) 4.7 (0.2)Bronchodilators 13,155 (1,068) 3.7 (0.2)Adrenal cortical steroids 12,484 (918) 3.5 (0.2)Antihistamines 11,558 (762) 3.2 (0.1)Cephalosporins 11,212 (835) 3.1 (0.1)Anticonvulsants 11,043 (869) 3.1 (0.2)Penicillins 8,795 (706) 2.5 (0.1)Dermatological agents 7,099 (680) 2.0 (0.2)Local injectable anesthetics 7,061 (627) 2.0 (0.1)Antiarrhythmic agents 6,945 (637) 1.9 (0.1)Muscle relaxants 6,677 (538) 1.9 (0.1)Antiparkinson agents 6,511 (552) 1.8 (0.1)Antiplatelet agents 5,811 (612) 1.6 (0.1)Macrolide derivatives 5,209 (505) 1.5 (0.1)Laxatives 4,609 (447) 1.3 (0.1)Quinolones 4,239 (383) 1.2 (0.1)
1Based on Cerner Multum second-level therapeutic drug category (see https://www.cerner.com/solutions/drug-database). 2Based on an estimated 358,950,000 drug mentions at emergency department (ED) visits in 2016. Drug mentions are medications given in EDs or prescribed at discharge. 3Includes narcotics (11.7%), nonsteroidal anti-inflammatory drugs (10.6%), and other analgesics (including salicylates, analgesic combinations, antimigraine agents, Cox-2 inhibitors, and miscellaneous analgesics) (5.7%).
SOURCE: NCHS, National Hospital Ambulatory Medical Care Survey, 2016.
Table page 1 of 1

U.S. D
epartment of H
ealth and Hum
an Services • Centers for D
isease Control and Prevention • N
ational Center for H
ealth Statistics
National H
ospital Ambulatory M
edical Care Survey: 2016 Em
ergency Departm
ent Summ
ary Tables
Table 22. Twenty most frequently mentioned drugs at emergency department visits: United States, 2016
Drug name1
Percent of drug mentions (standard error)
Therapeutic drug category3
Number of drug mentions
(standard error) in thousands
Percent distribution
(standard error) Total
Given in emergency department
Prescribed at discharge
Both given in emergency department
and prescribed at discharge Unknown2
All drug mentions 358,950 (22,723) 100.0 (0.0) 100.0 58.0 (1.5) 31.8 (1.6) 9.8 (0.6) 0.4 (0.1) ...
Sodium chloride 28,197 (2,152) 7.9 (0.3) 100.0 98.7 (0.4) 0.8 (0.3) 0.3 (0.1) 0.2 (0.1) Minerals and electrolytes, miscellaneous respiratory agents
Ondansetron 23,210 (1,634) 6.5 (0.3) 100.0 66.2 (1.7) 15.0 (1.2) 18.6 (1.2) 0.3 (0.1) Antiemetic or antivertigo agentsIbuprofen 21,446 (1,792) 6.0 (0.3) 100.0 31.1 (2.4) 49.4 (2.8) 19.1 (1.6) 0.4 (0.2) AnalgesicsAcetaminophen 14,331 (1,307) 4.0 (0.2) 100.0 47.9 (4.0) 40.2 (4.1) 11.5 (1.1) 0.4 (0.2) AnalgesicsKetorolac 11,662 (819) 3.2 (0.2) 100.0 91.6 (1.1) 5.2 (1.0) 3.1 (0.6) 0.1 (0.1) AnalgesicsAcetaminophen-hydrocodone 11,229 (898) 3.1 (0.2) 100.0 27.0 (2.0) 56.5 (2.1) 16.2 (1.5) 0.3 (0.2) AnalgesicsMorphine 8,513 (674) 2.4 (0.1) 100.0 98.3 (0.5) 1.3 (0.5) 0.2 (0.1) 0.2 (0.1) AnalgesicsAlbuterol 6,907 (597) 1.9 (0.1) 100.0 40.1 (2.6) 40.0 (3.2) 19.7 (2.2) 0.2 (0.1) BronchodilatorsDiphenhydramine 6,125 (525) 1.7 (0.1) 100.0 68.8 (2.6) 19.4 (2.3) 11.7 (1.6) 0.1 (0.1) Antiemetic or antivertigo agents,
antihistamines, antiparkinson agents, anxiolytics, sedatives, and hypnotics
Hydromorphone 5,733 (523) 1.6 (0.1) 100.0 95.7 (0.9) 1.5 (0.5) 2.8 (0.9) 0.0 (0.0) AnalgesicsLidocaine 5,265 (544) 1.5 (0.1) 100.0 89.0 (2.4) 7.2 (1.6) 3.8 (1.1) 0.0 (0.0) Antiarrhythmic agents, local
injectable anestheticsPrednisone 5,222 (464) 1.5 (0.1) 100.0 16.5 (2.5) 56.1 (3.4) 27.4 (3.3) 0.0 (0.0) Adrenal cortical steroidsAspirin 5,150 (512) 1.4 (0.1) 100.0 78.5 (3.5) 16.5 (3.4) 4.9 (1.1) 0.1 (0.1) Analgesics, antiplatelet agentsTramadol 5,034 (639) 1.4 (0.2) 100.0 18.7 (3.4) 71.0 (3.9) 10.1 (2.0) 0.3 (0.2) AnalgesicsCephalexin 4,928 (448) 1.4 (0.1) 100.0 11.3 (2.2) 71.0 (3.7) 17.3 (3.1) 0.4 (0.3) CephalosporinsCeftriaxone 4,621 (410) 1.3 (0.1) 100.0 94.9 (1.5) * (…) 2.1 (0.6) 0.0 (0.0) CephalosporinsAzithromycin 4,591 (473) 1.3 (0.1) 100.0 29.6 (2.9) 55.2 (3.5) 15.2 (2.2) 0.0 (0.0) Macrolide derivativesAmoxicillin 4,474 (447) 1.2 (0.1) 100.0 12.4 (2.7) 70.7 (3.5) 16.2 (2.4) 0.7 (0.6) PenicillinsLorazepam 4,452 (395) 1.2 (0.1) 100.0 83.1 (2.0) 9.3 (1.8) 7.5 (1.1) 0.0 (0.0) Anticonvulsants, antiemetic or
antivertigo agents, anxiolytics, sedatives, and hypnotics
Acetaminophen-oxycodone 4,152 (541) 1.2 (0.1) 100.0 36.8 (3.5) 40.0 (3.7) 23.1 (3.1) 0.1 (0.1) AnalgesicsAll other 173,708 (11,677) 48.4 (0.8) 100.0 54.2 (2.0) 36.8 (2.2) 8.3 (0.6) 0.6 (0.2) ...
... Category not applicable. 0.0 Quantity more than zero but less than 0.05. * Estimate does not meet NCHS standards of reliability. 1Based on Cerner Multum terminology, the drug name reflects the active ingredients of a drug mention. 2Includes drugs given or prescribed that did not have either the “given in emergency department” or “prescribed at discharge” check boxes marked. 3Based on Cerner Multum second-level therapeutic drug category (see https://www.cerner.com/solutions/drug-database).
SOURCE: NCHS, National Hospital Ambulatory Medical Care Survey, 2016.
Table page 1 of 1

U.S. Department of Health and Human Services • Centers for Disease Control and Prevention • National Center for Health Statistics
National Hospital Ambulatory Medical Care Survey: 2016 Emergency Department Summary Tables
Table 23. Providers seen at emergency department visits: United States, 2016
Type of provider
Number of visits1 (standard error)
in thousandsPercent distribution
(standard error)
All visits 145,591 (8,798) ...
Any physician 123,947 (7,426) 85.1 (1.9)Emergency department attending physician 121,077 (7,439) 83.2 (2.1)Emergency department resident or intern 11,931 (1,973) 8.2 (1.3)Consulting physician 13,374 (1,627) 9.2 (1.1)
Registered nurse or licensed practical nurse 136,930 (8,613) 94.1 (1.1)Any physician seen 117,100 (7,282) 80.4 (2.1)Physician not seen 19,829 (3,237) 13.6 (1.9)
Nurse practitioner 17,822 (3,295) 12.2 (2.1)Any physician seen 10,279 (2,306) 7.1 (1.5)Physician not seen 7,543 (2,170) 5.2 (1.4)
Physician assistant 24,173 (2,682) 16.6 (1.6)Any physician seen 14,134 (1,997) 9.7 (1.3)Physician not seen 10,039 (1,567) 6.9 (0.9)
Emergency medical technician 7,856 (1,222) 5.4 (0.8)Mental health provider 2,357 (376) 1.6 (0.2)Other 42,461 (4,647) 29.2 (2.7)Blank 323 (84) 0.2 (0.1)
... Category not applicable. 1Total exceeds “All visits” and percentage exceeds 100% because more than one provider may be reported per visit.
SOURCE: NCHS, National Hospital Ambulatory Medical Care Survey, 2016.
Table page 1 of 1

U.S. Department of Health and Human Services • Centers for Disease Control and Prevention • National Center for Health Statistics
National Hospital Ambulatory Medical Care Survey: 2016 Emergency Department Summary Tables
Table 24. Disposition of emergency department visits: United States, 2016
Disposition
Number of visits1 (standard error)
in thousandsPercent of visits (standard error)
All visits 145,591 (8,798) ...
Admitted, transferred, or diedAdmit to this hospital 12,644 (1,110) 8.7 (0.6)
Critical care unit 2,166 (427) 1.5 (0.3)Stepdown or telemetry unit *609 (184) 0.4 (0.1)Operation room 959 (174) 0.7 (0.1)Mental health or detoxification unit 535 (144) 0.4 (0.1)Cardiac catheterization laboratory * (...) 0.1 (0.0)Other bed or unit 6,004 (670) 4.1 (0.4)Unknown or blank 2,164 (432) 1.5 (0.3)
Admit to observation unit 2,969 (652) 2.0 (0.4)Then hospitalized * (...) * (...)Then discharged 2,967 (651) 2.0 (0.4)
Return or transfer to nursing home 555 (91) 0.4 (0.1)Transfer to psychiatric hospital 1,629 (255) 1.1 (0.2)Transfer to other hospital 2,357 (291) 1.6 (0.2)Died in emergency department2 270 (61) 0.2 (0.0)
Outpatient follow upReturn or refer to physician or clinic for follow up 103,713 (6,578) 71.2 (1.5)No follow up planned 13,030 (2,076) 8.9 (1.2)
Left prior to completing visitLeft without being seen 1,560 (237) 1.1 (0.2)Left before treatment complete 1,447 (193) 1.0 (0.1)Left against medical advice 1,151 (175) 0.8 (0.1)Other 3,518 (880) 2.4 (0.6)Blank 1,541 (409) 1.1 (0.3)
... Category not applicable. * Estimate does not meet NCHS standards of reliability. 0.0 Quantity more than zero but less than 0.05. 1Total exceeds “All visits” and percentage exceeds 100% because more than one disposition may be reported per visit. 2Includes “Dead on arrival”.
SOURCE: NCHS, National Hospital Ambulatory Medical Care Survey, 2016.
Table page 1 of 1

U.S. Department of Health and Human Services • Centers for Disease Control and Prevention • National Center for Health Statistics
National Hospital Ambulatory Medical Care Survey: 2016 Emergency Department Summary Tables
Table 25. Emergency department visits resulting in hospital admission, by selected patient and visit characteristics: United States, 2016
Selected characteristic
Number of visits(standard error)
in thousandsPercent distribution
(standard error)
Mean length of stay1 (standard error)
in days
Admissions as percent of visits (standard error)
All admissions 12,644 (1,110) 100.0 (...) 4.5 (0.1) 8.7 (0.6)
Age (years)Under 15 *413 (133) 3.3 (1.0) 2.4 (0.2) 1.5 (0.5)15–24 675 (106) 5.3 (0.9) 3.3 (0.3) 3.3 (0.5)25–44 1,983 (227) 15.7 (1.3) 3.6 (0.2) 5.0 (0.5)45–64 3,967 (395) 31.4 (1.6) 4.6 (0.2) 11.5 (1.0)65–74 2,463 (330) 19.5 (1.5) 4.9 (0.3) 22.4 (2.1)75 and over 3,143 (348) 24.9 (1.7) 5.4 (0.2) 25.9 (1.7)
ResidencePrivate 10,889 (1,002) 86.1 (2.1) 4.4 (0.1) 8.1 (0.6)Nursing home 739 (126) 5.8 (0.8) 5.7 (0.5) 33.2 (3.5)Homeless * (...) 1.4 (0.5) 3.5 (0.5) * (...)Other 366 (89) 2.9 (0.7) 5.4 (1.3) 15.1 (3.8)Unknown or blank *474 (178) * (...) 6.1 (1.2) 11.2 (1.7)
Expected source of payment2
Private insurance 4,478 (511) 35.4 (2.1) 4.9 (0.3) 9.7 (1.0)Medicare 5,394 (554) 42.7 (2.2) 5.2 (0.2) 20.8 (1.3)Medicaid or CHIP3 3,845 (497) 30.4 (3.0) 4.0 (0.2) 7.0 (0.7)No insurance4 497 (119) 3.9 (0.9) 4.0 (0.3) 4.0 (0.8)
Mode of arrivalAmbulance 5,363 (589) 42.4 (2.5) 4.9 (0.2) 23.4 (2.0)Other 7,281 (683) 57.6 (2.5) 4.3 (0.2) 5.9 (0.5)
Triage categoryImmediate or emergent5 3,019 (440) 23.9 (2.6) 4.7 (0.2) 23.8 (2.2)Other 9,625 (871) 76.1 (2.6) 4.5 (0.2) 7.2 (0.6)
Patient seen in this emergency department during the last 72 hours
Yes 371 (72) 2.9 (0.6) 4.4 (0.5) 9.6 (1.7)No, unknown, or blank 12,273 (1,095) 97.1 (0.6) 4.5 (0.2) 8.7 (0.6)
See footnotes at end of table.
Table page 1 of 2

U.S. Department of Health and Human Services • Centers for Disease Control and Prevention • National Center for Health Statistics
National Hospital Ambulatory Medical Care Survey: 2016 Emergency Department Summary Tables
Table 25. Emergency department visits resulting in hospital admission, by selected patient and visit characteristics: United States, 2016—Con.
Selected characteristic
Number of visits(standard error)
in thousandsPercent distribution
(standard error)
Mean length of stay1 (standard error)
in days
Admissions as percent of visits(standard error)
Length of stay (days)1–2 3,077 (337) 24.3 (1.6) ... ...3–4 3,901 (480) 30.9 (2.0) ... ...5–6 2,073 (255) 16.4 (1.5) ... ...7–8 860 (117) 6.8 (0.8) ... ...9–10 462 (75) 3.7 (0.5) ... ...More than 10 572 (97) 4.5 (0.7) ... ...Unknown or blank 1,698 (384) 13.4 (3.0) ... ...
Hospital discharge statusAlive 11,177 (1,074) 88.4 (2.9) 4.4 (0.1) ...
Home or residence 8,611 (819) 77.0 (1.9) 4.0 (0.1) ...Return or transfer to nursing home 953 (153) 8.5 (1.1) 6.5 (0.4) ...Transfer to another facility 860 (148) 7.7 (1.0) 4.8 (0.5) ...Other * (...) 3.1 (1.0) 4.4 (0.8) ...Unknown or blank 408 (120) 3.7 (1.0) 7.0 (1.0) ...
Died 257 (55) 2.0 (0.4) 6.7 (1.5) ...Unknown or blank *1,210 (386) * (...) 9.4 (1.9) ...
... Category not applicable. * Estimate does not meet NCHS standards of reliability. 1Denominator for length of stay for 10,946,000 visits where this variable was known. Length of stay was unknown for 13.4% (weighted) of visits resulting in admission. 2Total exceeds “All visits” and percentage exceeds 100% because more than one source of payment may be reported per visit. Workers compensation, other, and unknown sources of payment are not included in this table, but account for 11.2% of expected sources of payment. 3CHIP is Children’s Health Insurance Program. 4Defined as having only self-pay, no charge, or charity as payment sources. The individual self-pay and no charge or charity categories are not mutually exclusive. 5Defined as needing to be seen within 1–14 minutes.
NOTE: Numbers may not add to totals because of rounding.
SOURCE: NCHS, National Hospital Ambulatory Medical Care Survey, 2016.
Table page 2 of 2

U.S. Department of Health and Human Services • Centers for Disease Control and Prevention • National Center for Health Statistics
National Hospital Ambulatory Medical Care Survey: 2016 Emergency Department Summary Tables
Table 26. Principal hospital discharge diagnoses for patients admitted through the emergency department, by major disease category: United States, 2016
Major disease category and ICD–10–CM code range1
Number of visits (standard error)
in thousandsPercent distribution
(standard error)
All visits ... 12,644 (1,110) 100.0 (...)
Certain infectious and parasitic diseases A00–B99 280 (74) 2.2 (0.5)Neoplasms C00–D49 * (...) 1.0 (0.3)Diseases of the blood and blood-forming organs and certain disorders involving the immune mechanism D50–D89 * (...) 1.2 (0.3)
Endocrine, nutritional, and metabolic diseases E00–E89 492 (107) 3.9 (0.8)Mental, behavioral and neurodevelopmental disorders F01–F99 612 (136) 4.8 (1.0)Diseases of the nervous system and sense organs2 G00–G99, H00–H95 312 (61) 2.5 (0.4)Diseases of the circulatory system I00–I99 1,494 (216) 11.8 (1.2)Diseases of the respiratory system J00–J99 1,321 (230) 10.4 (1.5)Diseases of the digestive system K00–K95 1,324 (179) 10.5 (1.2)Diseases of the skin and subcutaneous tissue L00–L99 234 (56) 1.8 (0.4)Diseases of the musculoskeletal system and connective tissue M00–M99 * (...) 2.2 (0.6)
Diseases of the genitourinary system N00–N99 813 (159) 6.4 (1.0)Pregnancy, childbirth and the puerperium O00–O9A *198 (67) 1.6 (0.5)Symptoms, signs, and abnormal clinical and laboratory findings, not elsewhere classified R00–R99 1,852 (192) 14.6 (1.2)Injury, poisoning and certain other consequences of external causes S00–T88 792 (133) 6.3 (0.9)
All other diagnoses³ ... 328 (87) 2.6 (0.7)Unknown or blank ... 2,037 (439) 16.1 (3.3)
... Category not applicable. * Figure does not meet NCHS standards of reliability.1Based on the International Classification of Diseases, 10 th Revision, Clinical Modification (ICD–10–CM). However, certain codes have been combined in this table to better describe the utilization of ambulatory care services. 2Sense organs include eye, adnexa, ear, and mastoid process. 3Includes certain conditions originating in the perinatal period (P00–P96); congenital malformations, deformations and chromosomal abnormalities (Q00–Q99); external causes of morbidity (V00–Y99); and factors influencing health status and contact with health services (Z00–Z99).
NOTE: Numbers may not add to totals because of rounding.
SOURCE: NCHS, National Hospital Ambulatory Medical Care Survey, 2016.
Table page 1 of 1

U.S. Department of Health and Human Services • Centers for Disease Control and Prevention • National Center for Health Statistics
National Hospital Ambulatory Medical Care Survey: 2016 Emergency Department Summary Tables
Table 27. Hospital and emergency department characteristics, by emergency department visit volume: United States, 2016
Hospital and emergency department characteristic
Emergency department annual visit volume1
Total Fewer than 20,000 20,000 to 50,000 50,000 or more
Percent distribution (standard error)
All emergency departments 100.0 (...) 100.0 (...) 100.0 (...) 100.0 (...)
Hospital characteristic
Number of days per week that elective surgeries are scheduled
0–4 13.8 (2.6) 28.9 (4.6) * (...) * (...)5 68.9 (3.1) 62.7 (4.6) 79.7 (5.4) 63.0 (7.0)6–7 14.9 (2.7) * (...) * (...) 31.1 (6.7)Unknown or blank 2.4 (0.9) * (...) * (...) * (...)
Has bed coordinatorYes 59.6 (5.7) * (...) * (...) 91.7 (3.2)No 36.4 (5.7) * (...) * (...) * (...)Unknown or black * (...) * (...) * (...) * (...)
How often hospital bed census data are availableInstantaneously 78.5 (3.8) 71.7 (6.6) 79.8 (5.2) **89.5 (3.7)Every 4 hours * (...) * (...) * (...) * (...)Every 8 hours 1.8 (1.0) * (...) * (...) * (...)Every 12 hours 2.1 (1.0) * (...) * (...) * (...)Every 24 hours 10.0 (3.0) * (...) * (...) * (...)Other * (...) * (...) * (...) * (...)Unknown or blank * (...) * (...) * (...) * (...)
Has hospitalists on staffYes **85.4 (5.4) * (...) **92.8 (3.2) **97.2 (2.0)No * (...) * (...) * (...) * (...)Unknown or blank 1.3 (0.6) * (...) * (...) * (...)
Has emergency medicine residency programYes 18.6 (3.1) * (...) * (...) * (...)No 75.6 (3.5) **86.1 (5.3) 80.6 (5.0) * (...)Unknown or blank * (...) * (...) * (...) * (...)
Emergency department (ED) characteristic
ED submits claims electronicallyYes **91.8 (2.9) **92.6 (3.6) * (...) **94.0 (2.9)No * (...) * (...) * (...) * (...)Unknown or blank, or refused to answer * (...) * (...) * (...) * (...)
ED uses electronic medical records or health records
Yes, all electronic 80.1 (3.8) * (...) **84.0 (5.0) **85.6 (4.3)Yes, part paper and part electronic 15.2 (3.3) * (...) * (...) * (...)No * (...) * (...) * (...) * (...)Unknown or blank, or refused to answer * (...) * (...) * (...) * (...)
ED has physically separate observation or clinical decision unit
Yes 44.6 (5.3) * (...) 42.7 (6.9) 53.6 (6.9)No 51.5 (5.1) * (...) 52.9 (6.8) 40.1 (6.8)Unknown * (...) * (...) * (...) * (...)
Admitted patients were ever boarded 2 or more hours in the ED or observation unit while
waiting for an inpatient bedYes 66.0 (4.1) 58.3 (6.9) 71.8 (6.9) 71.5 (6.7)No 26.0 (3.7) 40.2 (6.7) 17.3 (5.0) * (...)Unknown or blank 8.0 (2.1) * (...) * (...) * (...)
See footnotes at end of table.
Table page 1 of 2

U.S. Department of Health and Human Services • Centers for Disease Control and Prevention • National Center for Health Statistics
National Hospital Ambulatory Medical Care Survey: 2016 Emergency Department Summary Tables
Table 27. Hospital and emergency department characteristics, by emergency department visit volume: United States, 2016—Con.
Hospital and emergency department characteristic
Emergency department annual visit volume1
Total Fewer than 20,000 20,000 to 50,000 50,000 or more
Emergency department (ED) characteristic—Con. Percent distribution (standard error)
ED went on ambulance diversion in 2015Yes 32.1 (4.5) * (...) * (...) * (...)No 50.6 (5.3) * (...) * (...) 30.7 (5.8)Unknown or blank 17.3 (3.6) * (...) 17.3 (4.7) 23.2 (6.2)
Ambulance diversion actively managed on a regional level compared with each hospital adopting
diversion if and when it chooses²Yes 48.2 (7.2) * (...) * (...) * (...)No 43.0 (7.1) * (...) * (...) * (...)Unknown or blank * (...) * (...) * (...) * (...)
Hospital continues to admit elective or scheduled surgery cases when ED is on ambulance diversion2
Yes **83.4 (5.6) * (...) * (...) * (...)No * (...) * (...) * (...) * (...)Unknown or blank * (...) * (...) * (...) * (...)
ED increased the number of standard treatment spaces in last 2 years
Yes 17.2 (3.2) * (...) * (...) 25.9 (5.5)No 75.8 (3.9) **81.6 (6.4) 77.6 (6.1) 61.8 (6.3)Unknown or blank * (...) * (...) * (...) * (...)
ED physical space was expanded in last 2 years
Yes 14.6 (3.1) * (...) * (...) 19.5 (5.7)No 81.4 (3.4) 88.4 (5.5) 79.3 (5.8) 71.3 (6.3)Unknown or blank * (...) * (...) * (...) * (...)
ED plans to expand physical space in next 2 years3
Yes 22.2 (3.9) * (...) 19.6 (5.8) 25.9 (6.0)No 71.3 (4.1) * (...) 71.8 (6.5) 62.6 (6.4)Unknown or blank 6.5 (1.9) * (...) * (...) * (...)
Services ED usesBedside registration 87.9 (3.5) * (...) **87.8 (4.7) **87.8 (4.9)Kiosk self check-in * (...) * (...) * (...) * (...)Computer-assisted triage 52.7 (5.7) * (...) * (...) 64.5 (7.1)Immediate bedding 71.4 (4.3) * (...) 73.4 (6.0) * (...)Advanced triage (triage-based care) protocols 70.3 (4.1) * (...) 73.6 (5.4) 79.9 (5.2)Physician or practitioner at triage 37.3 (4.6) * (...) * (...) 40.6 (7.1)Separate fast-track unit for nonurgent care 46.5 (5.3) * (...) * (...) 59.5 (6.5)Separate operating room dedicated to ED patients * (...) * (...) * (...) * (...)Electronic dashboard4 80.5 (4.4) * (...) **79.2 (6.5) **90.9 (4.6)Radio frequency identification tracking5 18.9 (3.6) * (...) 22.2 (6.4) * (...)Wireless devices by providers 57.9 (4.9) * (...) * (...) 76.4 (6.5)Zone nursing6 57.7 (5.1) * (...) 69.5 (6.0) * (...)Pool nurses7 66.4 (4.3) * (...) 61.6 (7.1) 69.8 (5.9)
... Category not applicable. * Estimate does not meet NCHS standards of reliability. ** Estimate meets NCHS standards of reliability, but its complement does not. 1Number of sample records for all EDs (N = 228); Fewer than 20,000 (N = 62); 20,000 to 50,000 (N = 82); 50,000 or more (N = 84). 2Denominator is the number of EDs on ambulance diversion or for which ambulance diversion status is unknown. 3Denominator is number of EDs that did not expand its physical space, including unknown or blank responses, in the last 2 years. 4An electronic dashboard displays updated patient information and integrates multiple data sources. 5Radio frequency identification tracking shows the exact location of patients, caregivers, and equipment. 6Refers to all of a nurse’s patients being located in one area. 7Pool nurses are those who can be pulled into the ED on demand to respond to surges.
SOURCE: NCHS, National Hospital Ambulatory Medical Care Survey, 2016.
Table page 2 of 2