National Health Statistics Reportsstacks.cdc.gov/view/cdc/12410/cdc_12410_DS1.pdfNational Health...
15
National Health Statistics Reports Number 32 ■ January 12, 2011 Asthma Prevalence, Health Care Use, and Mortality: United States, 2005-2009 by Lara J. Akinbami, M.D., Office of Analysis and Epidemiology, National Center for Health Statistics; Jeanne E. Moorman, M.S., National Center for Environmental Health; and Xiang Liu, M.Sc., Office of Analysis and Epidemiology, National Center for Health Statistics Abstract Introduction Objectives—This report presents recent data on asthma prevalence and health care use. Additional data on school and work absences and asthma management practices are also presented. Where possible, differences are examined by age, sex, race or ethnicity, geographic region, poverty status, and urbanicity. Methods —Data from the National Health Interview Survey, the National Ambulatory Medical Care Survey, the National Hospital Ambulatory Medical Care Survey, the National Hospital Discharge Survey, and the National Vital Statistics System were used to calculate national estimates. The most recent data available from each system are presented, and 3-year annual averages are used to increase the reliability of estimates for subgroups where necessary. Results —In 2009, current asthma prevalence was 8.2% of the U.S. population (24.6 million people); within population subgroups it was higher among females, children, persons of non-Hispanic black and Puerto Rican race or ethnicity, persons with family income below the poverty level, and those residing in the Northeast and Midwest regions. In 2008, persons with asthma missed 10.5 million school days and 14.2 million work days due to their asthma. In 2007, there were 1.75 million asthma-related emergency department visits and 456,000 asthma hospitalizations. Asthma emergency visit and hospitalization rates were higher among females than males, among children than adults, and among black than white persons. Despite the high burden from adverse impacts, use of some asthma management strategies based on clinical guidelines for the treatment of asthma remained below the targets set by the Healthy People 2010 initiative. Keywords: school and work absence visits • hospitalizations ambulatory care • emergency department Asthma is a chronic respiratory disease characterized by episodes or attacks of impaired breathing. Symptoms are caused by inflammation and narrowing of small airways and may include shortness of breath, coughing, wheezing, and chest pain. Disease severity ranges from mild with occasional symptoms to severe with persistent symptoms that impact quality of life. However, even people with mild disease may suffer severe attacks. Common attack triggers include airway irritants (e.g., tobacco smoke and air pollution), allergens, respiratory infections, stress, and exercise (1). Although little is understood about preventing asthma from developing, the means for controlling and preventing symptoms are well established. Treatment includes the use of medication for short-term relief; daily use of preventive medication to avert attacks; monitoring of early symptoms; avoiding factors that trigger attacks; and removing risks (e.g., tobacco smoke or mold) from the home, school, and work environments. Nevertheless, morbidity, direct health care costs, indirect costs such as lost productivity, and mortality due to asthma continue pose a high burden in the United States. The present 4 U.S. DEPARTMENT OF HEALTH AN D HUMAN SERVICES Centers for Disease Control and Prevention National Center for Health Statistics
Transcript of National Health Statistics Reportsstacks.cdc.gov/view/cdc/12410/cdc_12410_DS1.pdfNational Health...
National Health Statistics ReportsNumber 32 ■ January 12, 2011
Asthma Prevalence, Health Care Use, and Mortality: United States, 2005-2009
by Lara J. Akinbami, M.D., Office of Analysis and Epidemiology, National Center for Health Statistics; Jeanne E. Moorman, M.S., National Center for Environmental Health; and Xiang Liu, M.Sc.,
Office of Analysis and Epidemiology, National Center for Health Statistics
Abstract IntroductionObjectives—This report presents recent data on asthma prevalence and health
care use. Additional data on school and work absences and asthma management practices are also presented. Where possible, differences are examined by age, sex, race or ethnicity, geographic region, poverty status, and urbanicity.
Methods—Data from the National Health Interview Survey, the National Ambulatory Medical Care Survey, the National Hospital Ambulatory Medical Care Survey, the National Hospital Discharge Survey, and the National Vital Statistics System were used to calculate national estimates. The most recent data available from each system are presented, and 3-year annual averages are used to increase the reliability of estimates for subgroups where necessary.
Results— In 2009, current asthma prevalence was 8.2% of the U.S. population (24.6 million people); within population subgroups it was higher among females, children, persons of non-Hispanic black and Puerto Rican race or ethnicity, persons with family income below the poverty level, and those residing in the Northeast and Midwest regions. In 2008, persons with asthma missed 10.5 million school days and 14.2 million work days due to their asthma. In 2007, there were 1.75 million asthma-related emergency department visits and 456,000 asthma hospitalizations. Asthma emergency visit and hospitalization rates were higher among females than males, among children than adults, and among black than white persons. Despite the high burden from adverse impacts, use of some asthma management strategies based on clinical guidelines for the treatment of asthma remained below the targets set by the Healthy People 2010 initiative.
Keywords: school and work absence visits • hospitalizations
ambulatory care • emergency department
Asthma is a chronic respiratory disease characterized by episodes or attacks of impaired breathing.Symptoms are caused by inflammation and narrowing of small airways and may include shortness of breath, coughing, wheezing, and chest pain. Disease severity ranges from mild with occasional symptoms to severe with persistent symptoms that impact quality of life. However, even people with mild disease may suffer severe attacks. Common attack triggers include airway irritants (e.g., tobacco smoke and air pollution), allergens, respiratory infections, stress, and exercise (1).
Although little is understood about preventing asthma from developing, the means for controlling and preventing symptoms are well established. Treatment includes the use of medication for short-term relief; daily use of preventive medication to avert attacks; monitoring of early symptoms; avoiding factors that trigger attacks; and removing risks (e.g., tobacco smoke or mold) from the home, school, and work environments. Nevertheless, morbidity, direct health care costs, indirect costs such as lost productivity, and mortality due to asthma continue pose a high burden in the United States. The present
4 U.S. DEPARTMENT OF HEALTH AND HUMAN SERVICES Centers for Disease Control and Prevention
National Center for Health Statistics

Page 2 National Health Statistics Reports ■ Number 32 ■ January 12, 2011
report presents estimates for asthma prevalence in the United States, as well as for asthma-related health care use and mortality. Differences between groups are presented where data are available.
Methods
Data sourcesEstimates for asthma prevalence,
school and work absences, and asthma control measures are based on data from the National Health Interview Survey (NHIS). NHIS serves as a principal source of health information for the U.S. civilian noninstitutionalized population. Questions used to ascertain asthma prevalence are contained in the core questionnaire asked of one sample adult in each family included in NHIS, and, if children are present, one sample child in the family for whom a responsible adult responds. Periodically, supplements with special content for asthma are included in the survey. In 2008, an asthma supplement ascertained aspects of disease control and asthma-specific absences from school and work (questionnaires for 2008 and other years can be viewed at: http://www.cdc.gov/ nchs/nhis/nhis_questionnaires.htm). Definitions and question wording for estimates used in this report are found in the ‘‘Technical Notes’’ section.
Ambulatory visit numbers and rates were estimated using data from the National Ambulatory Medical Care Survey (NAMCS) and the National Hospital Ambulatory Medical Care Survey (NHAMCS). Visits to private physician offices were estimated using NAMCS, which samples visits made in the United States to offices of nonfederally employed physicians. Visits to private, nonhospital-based clinics, community health centers, and health maintenance organizations were included. Telephone contacts and visits made outside of physician offices were excluded. Visits to outpatient departments (OPDs) and emergency departments (EDs) were estimated using NHAMCS, which samples visits made to these departments in nonfederal short-stay hospitals (average stay fewer than 30 days) and in general hospitals
(medical or surgical) and children’s general hospitals. EDs that operate fewer than 24 hours were included in the OPD component.
Data for asthma hospitalization numbers and rates were obtained from the National Hospital Discharge Survey (NHDS). NHDS is a national probability survey that collects data from a sample of inpatient records acquired from a national sample of nonfederal short-stay hospitals in the United States. Only hospitals with an average length of stay of fewer than 30 days for all patients, and general hospitals and children’s general hospitals were included in the survey.
Asthma death data were obtained from the National Vital Statistics System (NVSS). NVSS includes data on births and deaths based on U.S. standard certificates. The mortality component was used to report asthma death rates.
Statistical analysesFor all health care surveys used in
this analysis (NAMCS, NHAMCS, and NHDS), International Classification o f Diseases, Ninth Revision (ICD-9-CM ) code 493 was used to identify asthma. Asthma deaths were those with an underlying cause of death classified to the International Classification o f Diseases, Tenth Revision (ICD-10) codes J45-J46.
To calculate national numbers and percentages from NHIS, NAMCS, NHAMCS, and NHDS, survey weights were used to inflate survey counts to national counts (2). All estimates and standard errors were estimated using SUDAAN software (3) to account for the complex sampling design of these surveys. Only reliable estimates— those with a relative standard error less than or equal to 30%— are presented in this report. Total population numbers and rates for the most recent single year are presented, whereas for subgroups, 3-year annual averages from NAMCS, NHAMCS, NHDS, and NVSS are presented to ensure stable estimates. Differences between percentages were evaluated using two-sided significance tests at the 0.05 level. No adjustments were made for multiple comparisons.
Terms such as ‘‘similar’’ and ‘‘no difference’’ indicate that the estimates being compared were not significantly different. However, lack of comment regarding the difference between any two statistics does not necessarily suggest that the difference was tested and found to be not significant.
The prevalence rate estimates shown in Figure 2 (except age-specific estimates) were age-adjusted using the direct method and the 2000 U.S. standard population. However, prevalence numbers, health care use numbers and rates, and mortality numbers and rates were not age- adjusted, to allow evaluation of crude estimates of health care utilization and mortality.
The denominators for the rates of health care use and mortality per the population with current asthma were obtained from NHIS. These denominators are the estimated annual average number of persons within the specified group with reported current asthma during the period 2005-2007. Relative standard errors for these rates were calculated using both the standard error of the numerator and the denominator.
More information concerning data sources and statistical analyses is provided in the ‘‘Technical Notes’’ section.
Results
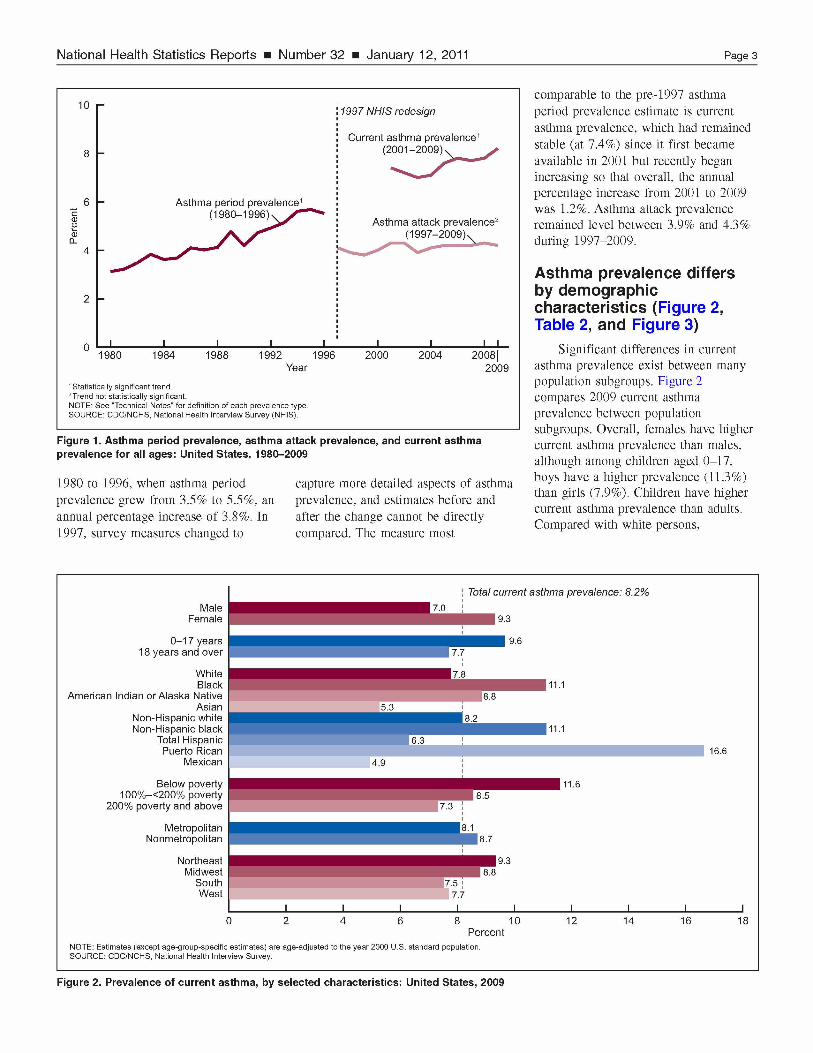
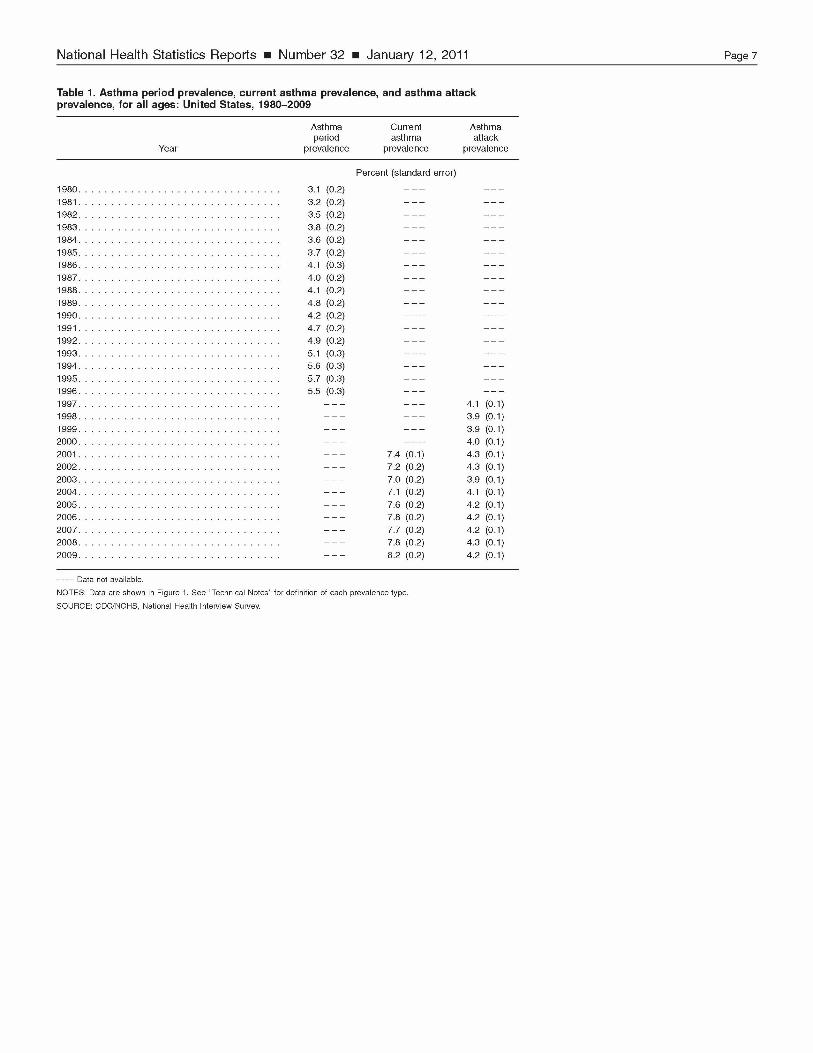
Asthma prevalence continues to increase (Figure 1 and Table 1)
In 2009, current asthma prevalence was 8.2%, affecting 24.6 million people in the United States (17.5 million adults and 7.1 million children aged 0-17 years) (Table 1). Asthma attack prevalence— the proportion of the population with at least one attack in the previous year—was 4.2%. That is, 12.8 million people (8.7 million adults and 4.0 million children aged 0-17), or 52% of those with current asthma, had attacks and were at risk for adverse outcomes such as ED visits or hospitalization. The most rapid growth in asthma prevalence occurred from
National Health Statistics Reports ■ Number 32 ■ January 12, 2011 Page 3
Year 2009
1 S t a t is t ic a l ly s ig n i f i c a n t t r e n d .
2 T r e n d n o t s ta t is t ic a l ly s ig n i f ic a n t .
N O T E : S e e " T e c h n ic a l N o te s ” f o r d e f in i t io n o f e a c h p r e v a le n c e ty p e .
S O U R C E : C D C / N C H S , N a t io n a l H e a l th I n te r v ie w S u r v e y ( N H IS ) .
Figure 1. Asthma period prevalence, asthma attack prevalence, and current asthma prevalence for all ages: United States, 1980-2009
1980 to 1996, when asthma period prevalence grew from 3.5% to 5.5%, an annual percentage increase of 3.8%. In 1997, survey measures changed to
capture more detailed aspects of asthma prevalence, and estimates before and after the change cannot be directly compared. The measure most
comparable to the pre-1997 asthma period prevalence estimate is current asthma prevalence, which had remained stable (at 7.4%) since it first became available in 2001 but recently began increasing so that overall, the annual percentage increase from 2001 to 2009 was 1.2%. Asthma attack prevalence remained level between 3.9% and 4.3% during 1997-2009.
Asthma prevalence differs by demographic characteristics (Figure 2, Table 2, and Figure 3)
Significant differences in current asthma prevalence exist between many population subgroups. Figure 2 compares 2009 current asthma prevalence between population subgroups. Overall, females have higher current asthma prevalence than males, although among children aged 0-17, boys have a higher prevalence (11.3%) than girls (7.9%). Children have higher current asthma prevalence than adults. Compared with white persons,
MaleFemale
0 -17 years 18 years and over
WhiteBlack
American Indian or Alaska Native Asian
Non-Hispanic white Non-Hispanic black
Total Hispanic Puerto Rican
Mexican
Below poverty 100%-<200% poverty
200% poverty and above
MetropolitanNonmetropolitan
NortheastMidwest
SouthWest
PercentN O T E : E s t im a t e s ( e x c e p t a g e - g r o u p - s p e c i f ic e s t im a te s ) a r e a g e - a d ju s t e d t o t h e y e a r 2 0 0 0 U .S . s ta n d a r d p o p u la t io n .
S O U R C E : C D C / N C H S , N a t io n a l H e a l th I n te r v ie w S u rv e y .
Figure 2. Prevalence of current asthma, by selected characteristics: United States, 2009

Page 4 National Health Statistics Reports ■ Number 32 ■ January 12, 2011
Figure 3. Prevalence of current asthma among males and females aged 1-85 years, by age: United States, annual average 2001-2009
prevalence is higher among black and lower among Asian persons. Compared with non-Hispanic white and non- Hispanic black persons, current asthma prevalence is higher among Puerto Rican and lower among Mexican persons. Those with family income below the federal poverty level have higher asthma prevalence than those with incomes in the near poor (100% to less than 200% of poverty) and not poor (200% of poverty and above) categories. The near poor also have higher prevalence compared with the not poor. There is no difference in prevalence rates between residents of metropolitan and nonmetropolitan areas, but when examined by geographic region, prevalence is higher in the Northeast than in the West and South and in the Midwest compared with the South.
Figure 3 shows sex differences in more detail across lifespan. Boys have higher prevalence than girls throughout most of childhood. During early adolescence, current asthma prevalence declines among males, whereas in females, current asthma prevalence rises steadily through childhood so that
between ages 14 and 17 years, prevalence rates are similar among boys and girls. This pattern of change continues to early adulthood so that throughout most of adulthood, women report higher current asthma prevalence compared with men.
School and work absences are common among persons with symptomatic asthma (Table 3)
In 2008, children aged 5-17 years with at least one asthma attack in the previous year were reported to miss 10.5 million school days in the past year. Nearly 60% had at least one asthma absence day in the past year, and 5.5% were reported to have an activity limitation due to asthma. An activity limitation is defined as a long-term reduction in a person’s capacity to perform the usual kind or amount of activities associated with his or her age group as a result of a chronic condition. Adults aged 18 and over who had at least one asthma attack in the past 12 months and were currently employed
reported missing 14.2 million work days, and nearly 34% missed at least one work day due to asthma in the previous year. Among those employed, 6% of adults with at least one asthma attack in the previous year reported that a breathing problem caused an activity limitation. Missed work days were also measured among adults with at least one asthma attack in the past 12 months who were not currently employed and included missed days of work around the house. Among those not currently employed, 22 million days of housework or other types of activities were missed, and 27% of those with at least one asthma attack in the past 12 months reported an activity limitation caused by a breathing problem.
Health care use for asthma is high, and disparities remain in asthma health care use and mortality (Table 4 and Figure 4)
In 2007, 13.9 million visits for asthma were made to private physician offices (7.2 million for adults and 6.7

National Health Statistics Reports ■ Number 32 ■ January 12, 2011 Page 5
0 1 2 3 4Rate ratio
N O T E : A r a te r a t io o f 1 .0 ( d a s h e d l in e ) in d ic a te s e q u a l r a te s b e tw e e n th e g r o u p s b e in g c o m p a r e d .
S O U R C E S : C D C / N C H S , N a t io n a l A m b u la to r y M e d ic a l C a r e S u rv e y , N a t io n a l H o s p i ta l A m b u la to r y M e d ic a l C a r e S u rv e y ,
N a t io n a l H o s p i ta l D is c h a r g e S u rv e y , M o r ta l i t y c o m p o n e n t o f t h e N a t io n a l V i ta l S t a t is t ic s S y s t e m , a n d N a t io n a l H e a l th
I n te r v ie w S u r v e y ( p o p u la t io n w i t h c u r r e n t a s th m a ) .
Figure 4. Relative burden of asthma health care use and mortality, adjusted for current asthma prevalence, by sex, race, and age group: United States, annual average 2005-2007
million for children aged 0-17 years) and 1.4 million visits to hospital OPDs (0.6 million for adults and 0.8 million for children aged 0-17 years). The National Heart, Lung, and Blood Institute guidelines for the clinical management of asthma recommend periodic preventive ambulatory visits for asthma monitoring, and a proportion of visits in nonemergent ambulatory settings may reflect appropriate disease management. In contrast, visits to EDs and hospital stays for asthma represent adverse outcomes. There were 1.75 million ED visits (1.11 million for adults and 0.64 million for children aged 0-17) and 456,000 asthma hospitalizations (299,000 for adults and 157,000 for children aged 0-17). There were 3,447 deaths due to asthma in 2007 (3,262 among adults and 185 among children aged 0-17).
To account for differing prevalence rates between groups and to focus on the population at risk for these outcomes, health care use rates in Table 4 were calculated per 100 persons with current asthma. Because numbers of asthma deaths are smaller, death rates were calculated per 10,000 persons with
current asthma. Estimates by income are not available, and less detail is available on health care use and mortality by race or ethnicity. Even after accounting for prevalence differences between groups, differences are seen in health care use and mortality burdens between groups. Health care use is highest among children aged 0-4 (rates per 100 persons with current asthma for total ambulatory visits were 144.9, for ED visits 24.6, and for hospitalizations 8.4). However, deaths from asthma are rare among children aged 0-17, with 174 deaths on average per year from 2005-2007.
To illustrate differences between groups, the rates in Table 4 were used to calculate the rate ratios shown in Figure 4 . A rate ratio of 1.0 indicates equal rates between the groups being compared. The largest differences are seen for race and age groups. The black-to-white rate ratio was nearly 1.0 for total ambulatory visits but was greater than 1.0 for ED visits, hospitalizations, and deaths. The rate ratios for children compared with adults were above 1.0 for all types of health care services but below 1.0 for death.
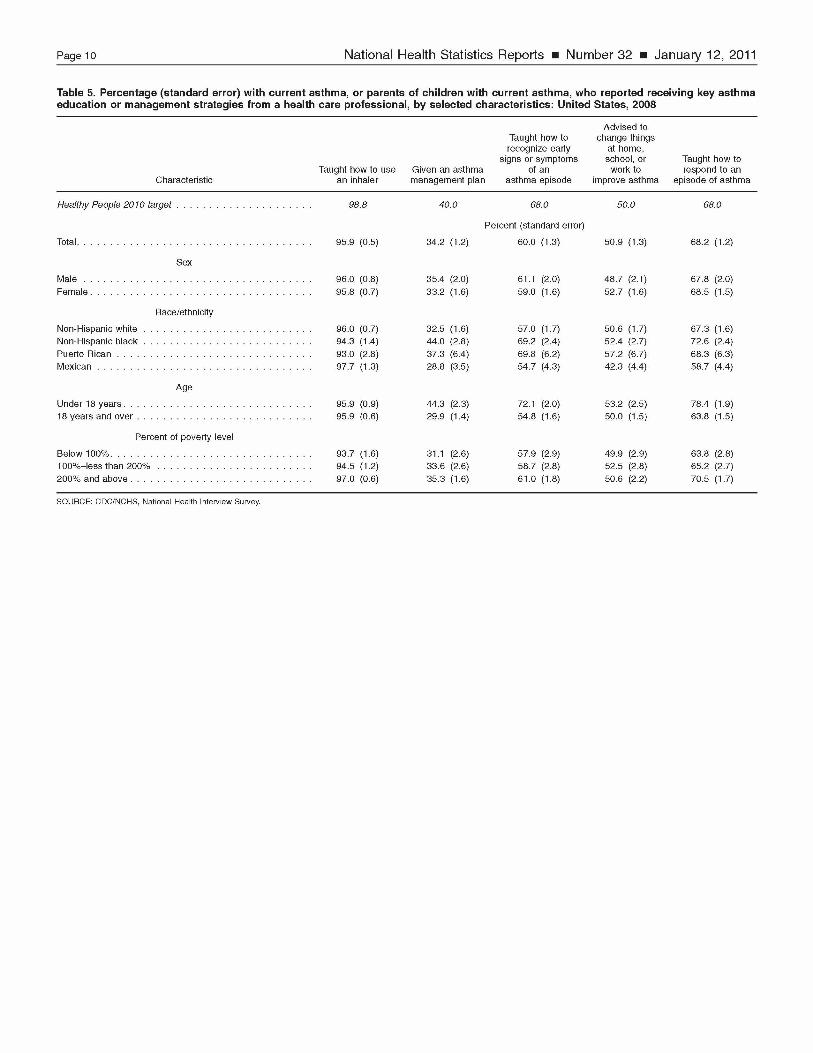
Despite the large asthma burden and the existence of effective disease control strategies, some Healthy People 2010 targets for asthma management have not been met (Table 5)
The cornerstone of clinical guidelines for the management of asthma is control of symptoms and prevention of adverse outcomes (1). Some important components of guideline-recommended management that are also objectives of the Healthy People 2010 initiative (4) are shown in Table 5. In 2008, about 96% of people with current asthma reported that a health professional taught them how to use their inhaler, nearly meeting the target of 98.8%. However, 34% reported receiving an asthma management plan with specific instructions on how to change the amount or type of medicine taken, when to call a doctor for advice, and when to go to the ED, and 60% reported that they were taught how to recognize early signs and symptoms of an asthma episode. Report of receiving these asthma control strategies differed among groups, with generally higher rates among children than adults and among non-Hispanic black persons than non-Hispanic white and Mexican persons.
SummaryAlthough increases in asthma
prevalence have slowed since the mid-1990s, asthma prevalence remains at historically high levels. Current asthma prevalence differs between groups, with higher rates among females, children, non-Hispanic black and Puerto Rican persons, those with family income below the poverty level, and those residing in the Northeast and Midwest regions. Asthma can involve costs related to health care use and morbidity, including missed work and school days. Even after accounting for prevalence differences between groups, health care use differs among groups. Non-Hispanic black persons have relatively low rates of ambulatory visits

Page 6 National Health Statistics Reports ■ Number 32 ■ January 12, 2011
compared with their use of urgent health 7 care services, which may represent underuse of or lower access to preventive services. In contrast, although children have higher health care use than adults, they have much lower death g rates. However, because adverse asthma outcomes are theoretically preventable, lowering asthma death rates among people of all ages remains a priority.The large asthma burden and continued adverse outcomes present an ongoing public health challenge, including the effort to enhance uptake of underutilized management strategies to control symptoms.
References1. National Asthma Education and
Prevention Program. Expert Panel Report 3: Guidelines for the diagnosis and management of asthma. NIH pub no 07-4051.Bethesda, MD: National Heart, Lung, and Blood Institute, National Institutes of Health. 2007. Available from: http://www.nhlbi.nih.gov/ guidelines/asthma/.
2. Botman SL, Moore TF, Moriarity CL, Parsons VL. Design and estimation for the National Health Interview Survey, 1995-2004.National Center for Health Statistics.Vital Health Stat 2(130). 2000.Available from: http://www.cdc.gov/ nchs/data/series/sr_02/sr02_130.pdf.
3. RTI International. SUDAAN language manual, release 10.Research Triangle Park, NC: RTI International. 2008.
4. U.S. Department of Health and Human Services. Tracking Healthy People 2010. Washington, DC:Government Printing Office. 2000.
5. Schenker N, Raghunathan TE, Chiu PL, Makuc DM, Zhang G, Cohen AJ.Multiple imputation of family income and personal earnings in the National Health Interview Survey: Methods and examples. National Center for Health Statistics. 2008. Available from: http://www.cdc.gov/nchs/data/ nhis/tecdoc.pdf.
6. Klein RJ, Schoenborn CA. Age adjustment using the 2000 projected U.S. population. Healthy People 2010 statistical notes, no 20.Hyattsville, MD: National Center for Health Statistics. 2001.
Joinpoint regression program, version 3.4 [computer software]. Bethesda, MD: National Cancer Institute, National Institutes of Health. 2010. Available from: http://srab.cancer. gov/joinpoint/.Xu JQ, Kochanek KD, Murphy SL, Tejada-Vera B. Deaths: Final data for 2007. National vital statistics reports; vol 58 no 19. Hyattsville, MD: National Center for Health Statistics.2010. Available from: http:// www.cdc.gov/nchs/data/nvsr/nvsr58/ nvsr58_19.pdf.
National Health Statistics Reports ■ Number 32 ■ January 12, 2011 Page 7
Table 1. Asthma period prevalence, current asthma prevalence, and asthma attack prevalence, for all ages: United States, 1980-2009
Year
Asthmaperiod
prevalence
Currentasthma
prevalence
Asthmaattack
prevalence
1980................................................ .................................... 3.1 (0.2)
Percent (standard error)
1981................................................ .................................... 3.2 (0.2) ------- -------
1982................................................ .................................... 3.5 (0.2) ------- -------
1983................................................ .................................... 3.8 (0.2) ------- -------
1984................................................ .................................... 3.6 (0.2) ------- -------
1985................................................ .................................... 3.7 (0.2) ------- -------
1986................................................ .................................... 4.1 (0.3) ------- -------
1987................................................ .................................... 4.0 (0.2) ------- -------
1988................................................ .................................... 4.1 (0.2) ------- -------
1989................................................ .................................... 4.8 (0.2) ------- -------
1990................................................ .................................... 4.2 (0.2) ------- -------
1991................................................ .................................... 4.7 (0.2) ------- -------
1992................................................ .................................... 4.9 (0.2) ------- -------
1993................................................ .................................... 5.1 (0.3) ------- -------
1994................................................ .................................... 5.6 (0.3) ------- -------
1995................................................ .................................... 5.7 (0.3) ------- -------
1996................................................ .................................... 5.5 (0.3) ------- -------
1997................................................ ...................... ......... ------- 4.1 (0.1)1998................................................ ...................... ......... ---- 3.9 (0.1)1999................................................ ...................... ......... ---- 3.9 (0.1)2 000 ................................................ ...................... ......... ---- 4.0 (0.1)2 001 ................................................ ...................... ......... 7.4 (0.1) 4.3 (0.1)2 002 ................................................ ...................... ......... 7.2 (0.2) 4.3 (0.1)2 003 ................................................ ...................... ......... 7.0 (0.2) 3.9 (0.1)2 004 ................................................ ...................... ......... 7.1 (0.2) 4.1 (0.1)2 005 ................................................ ...................... ......... 7.6 (0.2) 4.2 (0.1)2 006 ................................................ ...................... ......... 7.8 (0.2) 4.2 (0.1)2 007 ................................................ ...................... ..... 7.7 (0.2) 4.2 (0.1)2 008 ................................................ ...................... ..... 7.8 (0.2) 4.3 (0.1)2 009 ................................................ ...................... ..... 8.2 (0.2) 4.2 (0.1)
Data not available.
NOTES: Data are shown in Figure 1. See ‘‘Technical Notes’’ for definition of each prevalence type.
SOURCE: CDC/NCHS, National Health Interview Survey.

Page 8 National Health Statistics Reports ■ Number 32 ■ January 12, 2011
Table 2. Current asthma prevalence, by selected characteristics: United States, 2009
Characteristic
Number (rounded to nearest hundred)
Percent1 (standard error)
T o ta l.................................................................................... 24,566,700 8.2 (0.2)
Sex
M a le .................................................................................... . . 10,325,400 7.0 (0.3)F e m a le .............................................................................. 14,241,300 9.3 (0.3)
Age
0 -1 7 ye a rs ........................................................................ . . 7,111,100 9.6 (0.4)18 years and o v e r ......................................................... 17,455,600 7.7 (0.2)
Race/ethnicity
W h ite ................................................................................. . . 18,533,500 7.8 (0.2)B la c k ................................................................................. . . 4,273,400 11.1 (0.6)Am erican Indian or Alaska N a tive ............................... . . 233,700 8.8 (2.4)A s ia n ................................................................................. . . 721,600 5.3 (0.7)Non-Hispanic w h ite ......................................................... . . . 15,957,300 8.2 (0.3)Non-Hispanic b lack ......................................................... . . . 4,068,700 11.1 (0.6)Total Hispanic2 .............................................................. . . 2,997,000 6.3 (0.4)
M e x ic a n ........................................................................ . . 1,458,300 4.9 (0.4)Puerto R ic a n ............................................................... 707,200 16.6 (19)
Percent of poverty level
Below 1 0 0 % ..................................................................... . . 5,086,900 11.6 (0.6)100% -less than 200% ................................................... . . 5,056,100 8.5 (0.4)200% and a b o v e ............................................................ 14,423,700 7.3 (0.2)
UrbanicityM e tro po lita n ..................................................................... . . 20.283,000 8.1 (0.2)N o n m e tro p o lita n ............................................................ 4,283,700 8.7 (0.5)
Geographic region
N ortheast........................................................................... . . 4,863,900 9.3 (0.5)M idw est.............................................................................. . . 6,384,500 8.8 (0.5)S o u th ................................................................................. . . 8,027,100 7.5 (0.3)W est.................................................................................... 5,291,200 7.7 (0.4)
1Age-adjusted to the year 2000 U.S. standard population, except age-group-specific estimates.2Includes all Hispanic ethnicities, including Mexican, Puerto Rican, and others not shown separately.
NOTES: Data are shown in Figure 2. Numbers for subgroups may not sum to total due to rounding. Numbers for race and ethnicity groups will not sum to the total because not all race/ethnicity groups are shown separately in the table, but all are included in the total.
SOURCE: CDC/NCHS, National Health Interview Survey.

National Health Statistics Reports ■ Number 32 ■ January 12, 2011 Page 9
Table 3. School and work absences and percentage with activity limitation caused by asthma, among persons with at least one asthma attack in the past year: United States, 2008
Percent withPercent with activity limitation
Weighted Total days one or more caused bypopulation m issed,1 in asthma absence asthma or
size, in millions days in past year1 breathing problemPopulation millions (standard error) (standard error) (standard error)
Children 5 -1 7 y e a rs ..................................................................... . . 3.3 10.5 (1.3) 58.7 (3.6) 5.5 (1.2)Adults 18 years and over, currently e m p lo y e d ..................... . . 4.9 14.2 (4.7) 33.5 (2.8) 6.2 (1.3)Adults 18 years and over, not currently em ployed ............... 3.8 22.0 (5.9) 29.1 (3.1) 26.5 (2.7)
1Records with missing responses for days of school (1% among children aged 5-17 years), work (0.4% among adults currently employed), or housework or other activity (25.1% among adults not currently employed) missed due to asthma are excluded.
SOURCE: CDC/NCHS, National Health Interview Survey.
Table 4. Asthma health care use per 100 persons with current asthma, and asthma deaths per 10,000 persons with current asthma, by selected characteristics: United States, annual average 2005-2007
Per 100 persons with asthma
Hospital Total Emergency Deaths perOffice outpatient am bulatory department 10,000 persons
Characteristic visits visits visits visits Hospitalizations with asthma
Total........................... .................. 54.8 (5.6) 5.6 (0.7) 60.4
Number (standard error)
(5.6) 7.5 (0.4) 1.4 (0.2) 1.6 (0.0)
M a le ........................
Sex
.................. 61.6 (7.3) 5.8 (0.8) 67.4 (7.3) 7.7 (0.5) 1.3 (0.2) 1.4 (0.1)F e m a le ..................... .................. 50.0 (6.2) 5.5 (0.7) 55.5 (6.2) 7.4 (0.5) 1.4 (0.2) 1.8 (0.0)
W h ite ........................
Race
.................. 57.4 (6.3) 4.6 (0.6) 62.0 (6.3) 5.6 (0.4) 0.9 (0.1) 1.4 (0.0)B la c k ........................ .................. 49.4 (9.2) 11.5 (2.1) 60.9 (9.4) 18.6 (1.6) 2.0 (0.3) 2.7 (0.1)O ther ........................ .................. 38.5 (9.5) 3.4 (0.8) 41.9 (9.5) 4.1 (0.8) 0.8 (0.2) 1.1 (0.1)
H is p a n ic ..................
Ethnicity
.................. 72.1 (19.8) 11.1 (2.3) 83.2 (19.9) 10.7 (1.2) 0.9 (0.1)N on -H isp a n ic ............ .................. 52.4 (5.4) 4.8 (0.6) 57.2 (5.4) 7.1 (0.4) ---- 1.7 (0.1)
Under 18 years . . .
Age
.................. 77.5 (10.3) 9.7 (1.7) 87.2 (10.4) 9.9 (0.9) 1.6 (0.3) 0.3 (0.0)18 years and over . .................. 45.4 (5.4) 3.9 (0.5) 49.3 (5.4) 6.5 (0.4) 1.3 (0.2) 2.1 (0.1)
Data on Hispanic ethnicity are not available for hospitalization.
SOURCES: CDC/NCHS, National Ambulatory Medical Care Survey, National Hospital Ambulatory Medical Care Survey, National Hospital Discharge Survey, mortality component of the National Vital Statistics System, and National Health Interview Survey (population with current asthma).
Page 10 National Health Statistics Reports ■ Number 32 ■ January 12, 2011
Table 5. Percentage (standard error) with current asthma, or parents of children with current asthma, who reported receiving key asthma education or management strategies from a health care professional, by selected characteristics: United States, 2008
CharacteristicTaught how to use
an inhalerGiven an asthma management plan
Taught how to recognize early
signs or symptoms of an
asthm a episode
Advised to change things
at home, school, or
work to improve asthma
Taught how to respond to an
episode of asthma
H ealthy People 2010 ta r g e t .......................................... ............... 98.8 40.0 68.0
Percent (standard error)
50.0 68.0
Total.................................
Sex
............... 95.9 (0.5) 34.2 (1.2) 60.0 (1.3) 50.9 (1.3) 68.2 (12 )
M a le .............................. ............... 96.0 (0.8) 35.4 (2.0) 61.1 (2.0) 48.7 (2.1) 67.8 (2.0)F e m a le ...........................
Race/ethnicity
............... 95.8 (0.7) 33.2 (1.6) 59.0 (1.6) 52.7 (1.6) 68.5 (15 )
Non-Hispanic white . . ............... 96.0 (0.7) 32.5 (1.6) 57.0 (1.7) 50.6 (1.7) 67.3 (16 )Non-Hispanic b lack . . ............... 94.3 (1.4) 44.0 (2.8) 69.2 (2.4) 52.4 (2.7) 72.6 (2.4)Puerto R ic a n ............... ............... 93.0 (2.8) 37.3 (6.4) 69.8 (6.2) 57.2 (6.7) 68.3 (6.3)M e x ic a n ........................
Age
............... 97.7 (1.3) 28.8 (3.5) 54.7 (4.3) 42.3 (4.4) 58.7 (4.4)
Under 18 y e a rs ............ ............... 95.9 (0.9) 44.3 (2.3) 72.1 (2.0) 53.2 (2.5) 78.4 (1.9)18 years and o v e r ............................................................
Percent of poverty level
............... 95.9 (0.6) 29.9 (1.4) 54.8 (1.6) 50.0 (1.5) 63.8 (15)
Below 100% .................. ............... 93.7 (1.6) 31.1 (2.6) 57.9 (2.9) 49.9 (2.9) 63.8 (2.8)100% -less than 200% ............... 94.5 (1.2) 33.6 (2.6) 58.7 (2.8) 52.5 (2.8) 65.2 (2.7)200% and above . . . . ............... 97.0 (0.6) 35.3 (1.6) 61.0 (1.8) 50.6 (2.2) 70.5 (17)
SOURCE: CDC/NCHS, National Health Interview Survey.

National Health Statistics Reports ■ Number 32 ■ January 12, 2011 Page 11
Technical NotesFindings presented in this report
were based on data from the National Health Interview Survey, the National Ambulatory Medical Care Survey, the National Hospital Ambulatory Medical Care Survey, the National Hospital Discharge Survey, and the mortality component of the National Vital Statistics System. Survey descriptions, question wording for estimates, descriptions of statistical analyses, and definitions are provided below.
National Health Interview Survey (NHIS)
Sample design
NHIS is a cross-sectional household interview survey of the U.S. civilian noninstitutionalized population. Data are collected continuously throughout the year in all 50 states and the District of Columbia. NHIS uses a multistage, clustered sample design to produce national estimates for a variety of health indicators (Table). Information on basic health topics is collected for all household members. Interviews are conducted in the home by field staff from the U.S. Census Bureau, using a computer-assisted personal interviewing system, with telephone interviewing permitted for follow-up if necessary. Starting in 2006, the sample design oversampled Asian persons; during 2001-2005, only households with black and Hispanic residents were oversampled. From 2001 to 2009, the final response rate for each survey component (which takes into account household nonresponse) ranged from 81.6% to 88.1% for the family questionnaire, 72.3% to 81.3% for the sample child, and 62.6% to 74.3% for the sample adult. More information is available at: http://www.cdc.gov/nchs/ nhis.htm.
Item nonresponse
From 2001 through 2009, item nonresponse for each of the demographic indicators shown in this report was generally less than 1%, with the exception of poverty status, which is
based on detailed family income ascertained from the Family Core component of the questionnaire. Because the item nonresponse for the poverty status variable was relatively high (22%-31% from 1997 through 2007), family income data were imputed for families with missing values (5). The denominators for asthma prevalence exclude persons with unknown information about asthma status (less than 0.8% for all years 1997-2009).
National Ambulatory Medical Care Survey (NAMCS)
Sample design
NAMCS is an annual probability survey of nonfederal, office-based physicians providing direct patient care who practice in the 50 states or the District of Columbia, excluding radiologists, anesthesiologists, and pathologists. NAMCS collects data from a national sample of over 2,000 physicians each year who provide information on nearly 30,000 visits. Because persons with multiple visits during the year may be sampled more than once, estimates are for visits, not persons. NAMCS uses a multistage sample design and sampling weights applied to each record to provide nationally representative estimates.Visits to private, nonhospital-based clinics and health maintenance organizations were within the scope of the survey, but visits that occurred in federally operated facilities and hospital-based OPDs were not. A sample of office-based physicians who reported that they were in direct patient care was taken from the master files of the American Medical Association and the American Osteopathic Association. The sample design includes 112 geographic primary sampling units. Within those units, physicians were stratified by specialty, and a sample of physicians was selected. Physicians were randomly assigned to 1 of 52 reporting weeks throughout the year. Between 2005 and 2007, the overall unweighted physician response rate ranged from 58.9% to 61.6%. More information is available at: http://www.cdc.gov/nchs/ahcd.htm.
Item nonresponse
Item nonresponse rates in NAMCS are generally low (5% or less). Sex was imputed for 0.8%-1.6% of records with missing values, and birth year for 1.9%-2.5%, in the survey years 2005-2007. During this period, race was imputed for 20.8%-32.9% of visits and ethnicity for 24.9%-31.0%. In contrast to the imputation method used to impute race and ethnicity in previous years (random assignment of a value from a patient record form with similar characteristics based on physician specialty, geographic region, and three-digit IC D -9-C M code for primary diagnosis), a hierarchical procedure was used in 2006. Cases missing race (or ethnicity) were initially assigned a donor’s value after matching donor and recipient by three-digit ICD -9-CM codes for primary diagnosis and ZIP Code of the patient making the sampled visit. If no donor was found after several matching rounds of increasing geographic size (county, state, region), traditional imputation procedures were applied. If both race and ethnicity were missing, both were imputed from the same donor. Standard errors may be underestimated because single imputation was used.
National Hospital Ambulatory Medical Care Survey (NHAMCS)
Sample design
NHAMCS is a national probability sample survey of in-person visits made in the United States to EDs and OPDs of nonfederal short-stay hospitals (hospitals with an average stay of fewer than 30 days) and those whose specialty is general (medical or surgical) or children’s general. EDs that operate 24 hours a day are considered within the scope of the ED component; EDs that operate fewer than 24 hours are included in the OPD component of NHAMCS. The hospital sampling frame for 2006 consisted of hospitals listed in the 1991 Verispan Hospital Database (formerly known as the SMG Hospital Database) updated using hospital data

Page 12 National Health Statistics Reports ■ Number 32 ■ January 12, 2011
Table. Definitions and questions for NHIS asthma prevalence, school and work absences, and asthma control measures
Estimate NHIS question Questionnaire
Asthm a period prevalence. During the past 12 months, did anyone in the family have asthma?
1982-1996 NHIS Respiratory Conditions questionnaires
Current asthma p reva le nce ................................. Has a doctor or other professional ever told you that[you/your child] had asthma? and[Do you/does your child] still have asthma?
2001 forward, NHIS Sample Child and Sample Adult Core questionnaires
Asthm a attack preva lence. Has a doctor or other professional ever told you that[you/your child] had asthma?andDuring the past 12 months, [have you/has your child] had an episode of asthm a or an asthma attack?
1997 forward NHIS Sample Child and Sample Adult Core questionnaires
Missed work d a y ................................................... During the past 12 months, how many days were youunable to work because of your asthma?
Missed school d a y ................................................ During the past 12 months, how many days of [daycare/preschool/school/school or work] did your child miss because of [his/her] asthma?
Taught how to use an inha ler.............................. Has a health professional shown [you/your child] how touse [your/your child 's] inhaler?
Given an asthma management p la n ............... Has a doctor or other health professional ever given[you/your child] an asthma action plan?
Taught how to recognize early signs or Has a doctor or other health professional ever taughtsym ptom s of an asthma e p is o d e ..................... [you/your child] how to recognize early signs or
symptoms of an asthma episode?
Advised to change things at home, school, or Has a doctor or other health professional ever advisedwork to improve a s th m a ....................................... you to change th ings in [your/your child 's] home, school,
or work to improve [your/your child's] asthma?
Taught how to respond to an episode of Has a doctor or other health professional ever taughta s th m a ..................................................................... [you/your child] how to respond to episodes of asthma?
Activity lim itation caused by asthma/breathing This estimate is based on a series of questions on thep rob le m ..................................................................... Family Core questionnaire about lim itations in activities
of daily living, instrumental activities of daily living, school, work, difficulty walking or remembering, and any other activity lim itations: Are [you/your child] limited in any way because of physical, mental, or emotional problems?
For persons with a lim itation, a question is asked: What conditions or health problems cause [you/your child] limitations?
For adults: Lung or breathing problem?For children: Asthm a or a breathing problem?
2008 NHIS Sample Adult Asthm a Module questionnaire
2008 NHIS Sample Child Asthm a Module questionnaire
2008 NHIS Sample Adult and Sample Child Asthma Module questionnaires
2008 NHIS Sample Adult and Sample Child Asthma Module questionnaires
2008 NHIS Sample Adult and Sample Child Asthma Module questionnaires
2008 NHIS Sample Adult and Sample Child Asthma Module questionnaires
2008 NHIS Sample Adult and Sample Child Asthm a Module questionnaires
2008 NHIS Person File summary variables based on multiple questions from the Family Core questionnaire. See: ftp://ftp.cdc.gov/pub/Health_Statistics/NCHS/ Survey_Questionnaires/NHIS/2008/English/qfam ily.pdf.
SOURCE: CDC/NCHS, National Health Interview Survey (NHIS).
from Verispan, L.L.C. (Yardley, Pennsylvania). About 500 hospitals are included in the sample, from which about 1,200 OPDs and 400 EDs are selected. Because persons with multiple visits during the year may be sampled more than once, estimates are for visits, not persons. NHAMCS uses a multistage probability sample and sampling weights applied to each record to produce nationally representative estimates. Between 2005 and 2007, the overall unweighted hospital response rate ranged from 89.4% to 90.7%. More information
is available at: http://www.cdc.gov/nchs/ ahcd.htm.
Item nonresponse
Item nonresponse rates in NHAMCS are generally low (5% or less), with some exceptions. Sex was imputed for 0.3% -0.7% of records with missing values, and birth year for 0.7%-1.9%, in the survey years 2005-2007. During this period, race was imputed for 9.8%-14.9% of visits and ethnicity for 17.0%-24.9%. In contrast to imputation methods used in previous years for race and ethnicity (random assignment of a value from a
patient record form with similar characteristics based on physician specialty, geographic region, and three-digit IC D -9-C M code for primary diagnosis), in 2006, cases missing race or ethnicity were initially assigned a donor’s value after matching donor and recipient by three-digit ICD -9-CM codes for primary diagnosis and ZIP Code of the patient making the sampled visit; if no donor was found after several matching rounds, imputation procedures based on geographic region, OPD volume by clinic type, and three-digit IC D -9-C M codes for primary diagnosis were applied. If
National Health Statistics Reports ■ Number 32 ■ January 12, 2011 Page 13
both race and ethnicity were missing, both were imputed from the same donor. Beginning in 2007, a new method was used to impute race and ethnicity. Race and ethnicity assignments were based, where possible, on diagnosis and patient’s locality (ZIP Code or state or county of residence). A hot deck approach (i.e., filling in missing values on incomplete records using values from similar but complete records of the same data set) was employed, rather than the previously used cold deck strategy (i.e., filling in missing values on incomplete records using values from similar but complete records of the data set from the previous year), except in cases where a matching record could not be obtained from the current data. When race or ethnicity data could not be assigned using patient locality, the new method attempted to impute within the same facility wherever possible. Failing that, imputation was based on diagnosis, hospital, type of emergency service area, immediacy, and, as a last resort, on a randomly selected record.
National Hospital Discharge Survey (NHDS)
Sample design
NHDS collects data from a sample of inpatient records acquired from a national sample of hospitals. Because persons with multiple discharges during the year may be sampled more than once, estimates are for discharges, not persons. Only hospitals with an average length of stay of fewer than 30 days for all patients, and general hospitals and children’s general hospitals, are included in the survey. Federal, military, and Department of Veterans Affairs hospitals, as well as hospital units of institutions (e.g., prison hospitals), and hospitals with fewer than six beds staffed for patient use are excluded. NHDS collects data from a sample of approximately 270,000 inpatient records acquired from a national sample of about 500 hospitals. A three-stage sampling design procedure is used to produce national estimates of hospital discharges. Weights are assigned to each sample record. Between 2005 and 2007,
the overall unweighted hospital response rate ranged from 88% to 93%. More information is available at: http:// www.cdc.gov/nchs/about/major/hdasd/ nhds.htm.
Item nonresponse
Less than 1% of records failed to include the sex, age, or date of birth of the patient. If the hospital record did not state either the age or sex of patient, the characteristic was imputed by assigning an age or sex value that maintained the known distribution of these variables according to the categories of the first-listed diagnosis. In a very few cases (less than 1% of the records), the age or sex was edited because it was inconsistent with the diagnosis. For the period 2005-2007, data for race were missing for 28%-30% of the discharges, and no attempt was made to impute for these missing values. Nonresponse for ethnicity is generally higher than for race; therefore, ethnicity was not imputed and is not reported in this analysis.
Mortality component of the National Vital Statistics System (NVSS)
Data are based on information from all death certificates filed in the 50 states and the District of Columbia and are processed by the Centers for Disease Control and Prevention’s National Center for Health Statistics (NCHS). Mortality statistics are based on information coded by the states and provided to NCHS through the Vital Statistics Cooperative Program, as well as from copies of original certificates received by NCHS from state registration offices. More information is available at: http://www.cdc.gov/nchs/ deaths.htm.
Age adjustmentData for the percentages shown in
Figure 2 and Table 2 were age-adjusted using the 2000 U.S. population provided by the U.S. Census Bureau as the standard population (6). Age adjustment was used to allow comparison among various population subgroups that have
different age composition. The following age groups were used for age adjustment: under 1 year, 1-4 years,5-14 years, 15-25 years, 25-34 years, 35-44 years, 45-54 years, 55-64 years, 65-74 years, 75-84 years, and 85 years and over.
Estimation of countsThe estimated counts of persons
affected by asthma (NHIS), number of office visits for asthma to private physician offices (NAMCS), visits to hospital OPDs (NHAMCS) and EDs (NHAMCS), and asthma hospitalizations (NHDS) are calculated by weighting the number of respondents or visits by the survey weights. Age-adjusted estimates of counts of numbers of persons affected by asthma are not presented because only the crude numbers are of interest.
Tests of significanceStatistical tests performed to assess
the significance of differences in estimates were two-tailed, with no adjustments for multiple comparisons. The test statistic used to determine statistical significance of differences between two percentages was
Xa-Xblz = ,
Vs 2+Sb2
where Xa and Xb are the two percentages being compared, and Sa and Sb are the standard errors of those percentages. The critical value used for two-sided tests at the 0.05 level of significance was 1.96.
The significance of trends was tested using Joinpoint software (7) to determine whether an apparent change over time was statistically significant, taking into account the standard error for each data point. The weighted least squares regression models produce an annual percentage rate change when a log of the outcome is analyzed.
Relative standard errorEstimates with a relative standard
error (RSE) greater than 30% are not reported. The RSE of an estimate is calculated as:

Page 14 National Health Statistics Reports ■ Number 32 ■ January 12, 2011
RSE (percent) = (SEst/Est) * 100,
where SEst is the standard error of the estimate and Est is the estimate.
Definition of termsAge—Recorded for each person as
of his or her last birthday.Hispanic or Latino origin— Includes
persons of Mexican, Puerto Rican, Cuban, Central and South American, or Spanish origin. Persons of Hispanic or Latino origin may be of any race.
Poverty status— Based on family income and family size, using the U.S. Census Bureau’s poverty thresholds. ‘‘Poor’’ persons are defined as those with family incomes below the poverty threshold. Persons who are ‘‘near poor’’ have family incomes of 100% to less than 200% of the poverty threshold, and persons who are ‘‘not poor’’ have family incomes that are 200% of the poverty threshold or above.
Race and Hispanic origin—The collection of race and Hispanic origin data in NHIS, NAMCS, NHAMCS, and NHDS conforms with the 1997 U.S. Office of Management and Budget’s Revisions to the Standards for the Classification o f Federal Data on Race and Ethnicity. The 1997 Standards specify five racial groups as the minimum for data collection on race in federal statistics: American Indian or Alaska Native, Asian, Black or African American, Native Hawaiian or Other Pacific Islander, and White. The standards also offer respondents the opportunity to select more than one of the five groups. Hispanic or Latino origin includes persons of Mexican, Puerto Rican, Cuban, Central and South American, and other or unknown Latin American or Spanish origin. Persons of Hispanic origin may be of any race. The NVSS mortality component conformed to the 1997 Standards in 21 states in 2005 and increased to 27 states and the District of Columbia in 2007. To provide uniformity and comparability of NVSS mortality data during the transition period, before all or most of the data become available in the new multiple-race format, the responses of those for whom more than one race was reported (multiple race) are bridged to a single race (8).

Page 16 National Health Statistics Reports ■ Number 32 ■ January 12, 2011
Suggested citation
Akinbami LJ, Moorman JE, Liu X. Asthma prevalence, health care use, and mortality: United States, 2005-2009. National health statistics reports; no 32. Hyattsville, MD: National Center for Health Statistics. 2011.
Copyright information
All material appearing in this report is in the public domain and may be reproduced or copied without permission; citation as to source, however, is appreciated.
National Center for Health Statistics
Edward J. Sondik, Ph.D., Director Jennifer H. Madans, Ph.D., Associate Director
fo r Science
Office of Analysis and EpidemiologyLinda T. Bilheimer, Ph.D., Director
U.S. DEPARTMENT OF HEALTH & HUMAN SERVICES
Centers for Disease Control and Prevention National Center for Health Statistics 3311 Toledo Road Hyattsville, MD 20782
OFFICIAL BUSINESSPENALTY FOR PRIVATE USE, $300
To receive this publication regularly, contact the National Center for Health Statistics by calling 1 -800-232-4636 E-mail: [email protected] Internet: http://www.cdc.gov/nchs
DHHS Publication No. (PHS) 2011-1250CS218396T38273 (01/2011)
FIRST CLASS POSTAGE & FEES PAID
CDC/NCHS PERMIT NO. G-284