National Grid plc Utilities – Regulated Window of...
21
National Grid plc Utilities – Regulated Window of opportunity; up to Buy ● Mispriced, so upgrade to Buy: The bond-market-led fall in National Grid’s share price at the end of 2016 (-16% since July 2016’s high) has created an opportunity to buy this robust income stock. We do not believe that the current share price fairly reflects the £4bn net proceeds that National Grid expects to return to shareholders from the sale of its Gas Distribution stake starting in Q2 2017. We expect an 85p (8.9%) special dividend and the launch of a £1bn share buyback programme. The special dividend is incorporated into our £10.50 price target, which we have increased from £9.70. Beyond this event, the shares continue to hold plenty of appeal for income investors. The 4.8% yield may be a little below the sector average but the dividend comes with a promise of RPI-linked dividend growth for the foreseeable future. Our EPS forecasts are on a pre-consolidation basis although we also show what the effects of a consolidation would be. ● Special dividend from gas sale: National Grid has negotiated a good price for its UK Gas Distribution business. It has agreed to sell a 61% stake to a consortium of long-term infrastructure investors. The £13.8bn price tag (including £1.8bn of new debt) exceeds our prior £12bn valuation and represents a 55% premium to the 2016/17E regulated asset value. The bulk of the net proceeds will be returned to shareholders in Q2 2017 via a special dividend (with accompanying share consolidation) and a share buyback. There is a possibility that the group will sell a further 14% stake to the consortium on similar terms in the future. ● Refocused portfolio offers better growth: The stake sale also rebalances National Grid’s portfolio of regulated businesses. Gas Distribution had reached maturity in terms of capex opportunities. Post-disposal, we should see stronger regulated asset base (RAB) growth, driven by both UK transmission and the group’s US operations. We expect a c7% pa CAGR in regulated assets for 2017-20. ● RPI-linked dividend: RAB growth and improving US returns support National Grid’s inflation-linked dividend growth commitment. We think there is scope for dividends to grow at a marginally faster pace than RPI. ● Dollar impact: The movement in sterling versus the dollar will have a positive translation effect on the group’s US EBIT (33% of group in FY16) and increase the sterling-value of the US RAB. However, National Grid also has a large proportion of US-denominated debt, which largely offsets the benefits. US earnings should be further supplemented by RAB growth and gradually improving returns. ● The caveat: Our economists put a 30% chance on a UK rate rise this year and make a good case as to why currency-induced inflation may be temporary. However, if investors believe that there is more to recent bond market moves than a correction and expect yields to continue to rise, then they should put National Grid on the wait-and-see pile. 19 January 2017 BUY Current price Price target GBp 949 GBp1,050 18/01/2017 London Close Market cap (GBPm) 35,646 Reuters NG.L Bloomberg NG/ LN Changes made in this note Rating: Buy (Hold) Price target: GBp 1,050 (970) Estimates changes 2016 2017E 2018E old ∆ % old ∆ % old ∆ % EBITD A 5,622 1.6 4,643 26.9 4,902 2.4 EBIT 4,064 0.8 3,312 27.0 3,499 1.8 EPS 61.02 4.1 54.40 14.3 56.65 7.5 Source: Berenberg estimates Share data Shares outstanding (m) 3,755 Enterprise value (GBPm) 69,191 Daily trading volume 9,150,000 Key data Net gearing 231.6% CAGR EPS 2009-2013 107.4% Interactive model click here to explore * there may be a delay for the new estimates to be updated on the interactive model View all interactive models in Utilities Y/E 30/3., GBPm 2014 2015 2016 2017E 2018E EBITDA 5,080 5,345 5,710 5,892 5,018 EBIT 3,664 3,863 4,096 4,205 3,564 EPS 53.50 57.60 63.50 62.19 60.92 DPS 42.03 42.25 43.16 43.76 45.51 FCF per share 15.2 40.5 37.9 21.6 75.2 Y/E net debt (net cash) 23,775 27,294 28,320 30,643 25,203 EBITDA Growth 1.6% 5.2% 6.8% 3.2% -14.8% EPS Growth 4.1% 7.7% 10.2% -2.1% -2.0% DPS Growth 2.9% 0.5% 2.2% 1.4% 4.0% ROCE 8.1% 8.1% 8.0% 7.9% 7.7% EV/EBITDA 12.6x 12.2x 11.7x 11.7x 12.5x P/E 17.7x 16.5x 14.9x 15.3x 15.6x Dividend Yield 4.4% 4.5% 4.5% 4.6% 4.8% FCF Yield 1.6% 4.3% 4.0% 2.3% 7.9% Source: Company data, Berenberg Andrew Fisher Analyst +44 20 3207 7937 [email protected] Lawson Steele Analyst +44 20 3207 7887 [email protected] Neha Saxena Analyst +44 20 3753 3048 [email protected] Oliver Brown Analyst +44 20 3207 7922 [email protected]
Transcript of National Grid plc Utilities – Regulated Window of...

National Grid plc
Utilities – Regulated
Window of opportunity; up to Buy
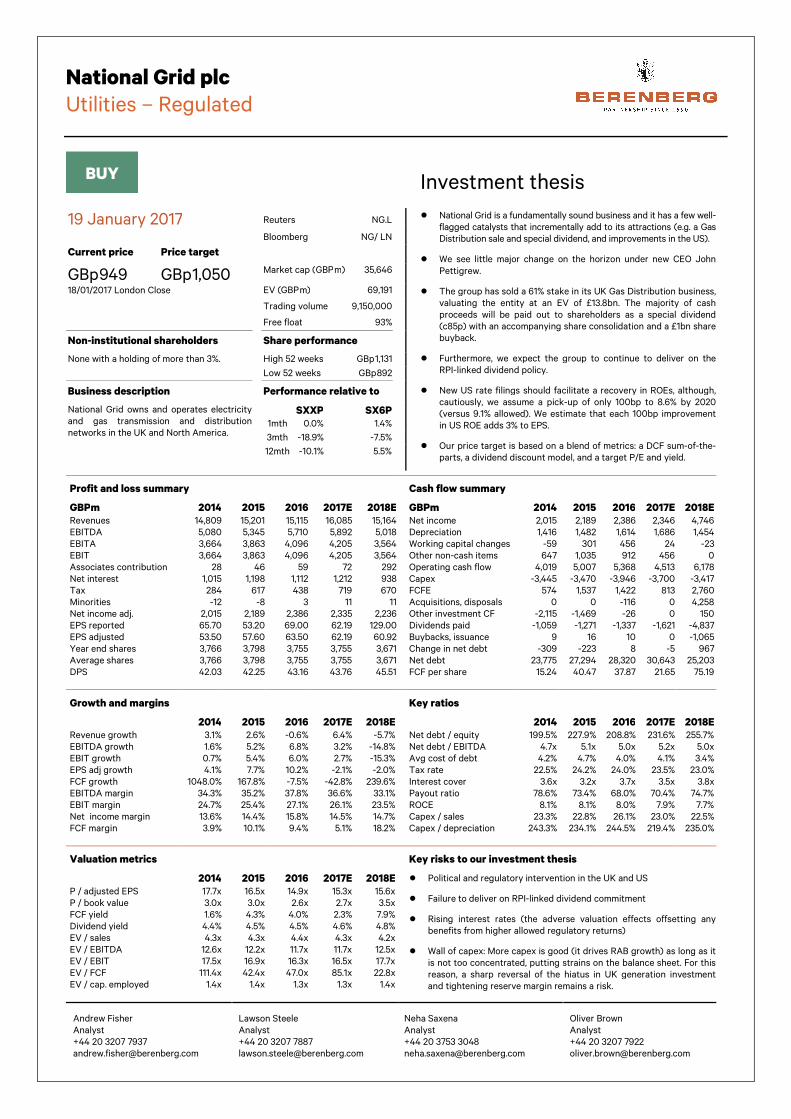
● Mispriced, so upgrade to Buy: The bond-market-led fall in National Grid’s share price at the end of 2016 (-16% since July 2016’s high) has created an opportunity to buy this robust income stock. We do not believe that the current share price fairly reflects the £4bn net proceeds that National Grid expects to return to shareholders from the sale of its Gas Distribution stake starting in Q2 2017. We expect an 85p (8.9%) special dividend and the launch of a £1bn share buyback programme. The special dividend is incorporated into our £10.50 price target, which we have increased from £9.70. Beyond this event, the shares continue to hold plenty of appeal for income investors. The 4.8% yield may be a little below the sector average but the dividend comes with a promise of RPI-linked dividend growth for the foreseeable future. Our EPS forecasts are on a pre-consolidation basis although we also show what the effects of a consolidation would be.
● Special dividend from gas sale: National Grid has negotiated a good price for its UK Gas Distribution business. It has agreed to sell a 61% stake to a consortium of long-term infrastructure investors. The £13.8bn price tag (including £1.8bn of new debt) exceeds our prior £12bn valuation and represents a 55% premium to the 2016/17E regulated asset value. The bulk of the net proceeds will be returned to shareholders in Q2 2017 via a special dividend (with accompanying share consolidation) and a share buyback. There is a possibility that the group will sell a further 14% stake to the consortium on similar terms in the future.
● Refocused portfolio offers better growth: The stake sale also rebalances National Grid’s portfolio of regulated businesses. Gas Distribution had reached maturity in terms of capex opportunities. Post-disposal, we should see stronger regulated asset base (RAB) growth, driven by both UK transmission and the group’s US operations. We expect a c7% pa CAGR in regulated assets for 2017-20.
● RPI-linked dividend: RAB growth and improving US returns support National Grid’s inflation-linked dividend growth commitment. We think there is scope for dividends to grow at a marginally faster pace than RPI.
● Dollar impact: The movement in sterling versus the dollar will have a positive translation effect on the group’s US EBIT (33% of group in FY16) and increase the sterling-value of the US RAB. However, National Grid also has a large proportion of US-denominated debt, which largely offsets the benefits. US earnings should be further supplemented by RAB growth and gradually improving returns.
● The caveat: Our economists put a 30% chance on a UK rate rise this year and make a good case as to why currency-induced inflation may be temporary. However, if investors believe that there is more to recent bond market moves than a correction and expect yields to continue to rise, then they should put National Grid on the wait-and-see pile.
19 January 2017
BUY
Current price
Price target
GBp 949
GBp1,050 18/01/2017 London Close
Market cap (GBP m) 35,646
Reuters NG.L
Bloomberg NG/ LN
Changes made in this note
Rating: Buy (Hold) Price target: GBp 1,050 (970)
Estimates changes
2016 2017E 2018E
old ∆ % old ∆ % old ∆ %
EBITD
A
5,622 1.6 4,643 26.9 4,902 2.4
EBIT 4,064 0.8 3,312 27.0 3,499 1.8
EPS 61.02 4.1 54.40 14.3 56.65 7.5 Source: Berenberg estimates
Share data
Shares outstanding (m) 3,755
Enterprise value (GBP m) 69,191 Daily trading volume 9,150,000
Key data
Net gearing 231.6%
CAGR EPS 2009-2013 107.4%
Interactive model click here to explore
* there may be a delay for the new estimates to be
updated on the interactive model
View all interactive models in Utilities
Y/E 30/3., GBP m 2014 2015 2016 2017E 2018E
EBITDA 5,080 5,345 5,710 5,892 5,018 EBIT 3,664 3,863 4,096 4,205 3,564 EPS 53.50 57.60 63.50 62.19 60.92 DPS 42.03 42.25 43.16 43.76 45.51 FCF per share 15.2 40.5 37.9 21.6 75.2 Y/E net debt (net cash) 23,775 27,294 28,320 30,643 25,203 EBITDA Growth 1.6% 5.2% 6.8% 3.2% -14.8% EPS Growth 4.1% 7.7% 10.2% -2.1% -2.0% DPS Growth 2.9% 0.5% 2.2% 1.4% 4.0% ROCE 8.1% 8.1% 8.0% 7.9% 7.7% EV/EBITDA 12.6x 12.2x 11.7x 11.7x 12.5x P/E 17.7x 16.5x 14.9x 15.3x 15.6x Dividend Yield 4.4% 4.5% 4.5% 4.6% 4.8% FCF Yield 1.6% 4.3% 4.0% 2.3% 7.9%
Source: Company data, Berenberg
Andrew Fisher Analyst +44 20 3207 7937 [email protected]
Lawson Steele Analyst +44 20 3207 7887 [email protected]
Neha Saxena Analyst +44 20 3753 3048 [email protected]
Oliver Brown Analyst +44 20 3207 7922 [email protected]
National Grid plc
Utilities – Regulated
BUY
Investment thesis
19 January 2017 Reuters NG.L
● National Grid is a fundamentally sound business and it has a few well-flagged catalysts that incrementally add to its attractions (e.g. a Gas Distribution sale and special dividend, and improvements in the US).
● We see little major change on the horizon under new CEO John
Pettigrew.
● The group has sold a 61% stake in its UK Gas Distribution business, valuating the entity at an EV of £13.8bn. The majority of cash proceeds will be paid out to shareholders as a special dividend (c85p) with an accompanying share consolidation and a £1bn share buyback.
● Furthermore, we expect the group to continue to deliver on the RPI-linked dividend policy.
● New US rate filings should facilitate a recovery in ROEs, although, cautiously, we assume a pick-up of only 100bp to 8.6% by 2020 (versus 9.1% allowed). We estimate that each 100bp improvement in US ROE adds 3% to EPS.
● Our price target is based on a blend of metrics: a DCF sum-of-the-parts, a dividend discount model, and a target P/E and yield.
Bloomberg NG/ LN
Current price Price target
GBp 949 GBp 1,050 Market cap (GBP m) 35,646
18/01/2017 London Close EV (GBP m) 69,191
Trading volume 9,150,000
Free float 93%
Non-institutional shareholders Share performance
None with a holding of more than 3%.
High 52 weeks GBp 1,131
Low 52 weeks GBp 892
Business description Performance relative to
National Grid owns and operates electricity and gas transmission and distribution networks in the UK and North America.
SXXP SX6P
1mth 0.0% 1.4%
3mth -18.9% -7.5%
12mth -10.1% 5.5%
Profit and loss summary
GBPm 2014 2015 2016 2017E 2018E
Revenues 14,809 15,201 15,115 16,085 15,164 EBITDA 5,080 5,345 5,710 5,892 5,018 EBITA 3,664 3,863 4,096 4,205 3,564 EBIT 3,664 3,863 4,096 4,205 3,564 Associates contribution 28 46 59 72 292 Net interest 1,015 1,198 1,112 1,212 938 Tax 284 617 438 719 670 Minorities -12 -8 3 11 11 Net income adj. 2,015 2,189 2,386 2,335 2,236 EPS reported 65.70 53.20 69.00 62.19 129.00 EPS adjusted 53.50 57.60 63.50 62.19 60.92 Year end shares 3,766 3,798 3,755 3,755 3,671 Average shares 3,766 3,798 3,755 3,755 3,671 DPS 42.03 42.25 43.16 43.76 45.51
Cash flow summary
GBPm 2014 2015 2016 2017E 2018E
Net income 2,015 2,189 2,386 2,346 4,746 Depreciation 1,416 1,482 1,614 1,686 1,454 Working capital changes -59 301 456 24 -23 Other non-cash items 647 1,035 912 456 0 Operating cash flow 4,019 5,007 5,368 4,513 6,178 Capex -3,445 -3,470 -3,946 -3,700 -3,417 FCFE 574 1,537 1,422 813 2,760 Acquisitions, disposals 0 0 -116 0 4,258 Other investment CF -2,115 -1,469 -26 0 150 Dividends paid -1,059 -1,271 -1,337 -1,621 -4,837 Buybacks, issuance 9 16 10 0 -1,065 Change in net debt -309 -223 8 -5 967 Net debt 23,775 27,294 28,320 30,643 25,203 FCF per share 15.24 40.47 37.87 21.65 75.19
Growth and margins
2014 2015 2016 2017E 2018E
Revenue growth 3.1% 2.6% -0.6% 6.4% -5.7% EBITDA growth 1.6% 5.2% 6.8% 3.2% -14.8% EBIT growth 0.7% 5.4% 6.0% 2.7% -15.3% EPS adj growth 4.1% 7.7% 10.2% -2.1% -2.0% FCF growth 1048.0% 167.8% -7.5% -42.8% 239.6% EBITDA margin 34.3% 35.2% 37.8% 36.6% 33.1% EBIT margin 24.7% 25.4% 27.1% 26.1% 23.5% Net income margin 13.6% 14.4% 15.8% 14.5% 14.7% FCF margin 3.9% 10.1% 9.4% 5.1% 18.2%
Key ratios
2014 2015 2016 2017E 2018E
Net debt / equity 199.5% 227.9% 208.8% 231.6% 255.7% Net debt / EBITDA 4.7x 5.1x 5.0x 5.2x 5.0x Avg cost of debt 4.2% 4.7% 4.0% 4.1% 3.4% Tax rate 22.5% 24.2% 24.0% 23.5% 23.0% Interest cover 3.6x 3.2x 3.7x 3.5x 3.8x Payout ratio 78.6% 73.4% 68.0% 70.4% 74.7% ROCE 8.1% 8.1% 8.0% 7.9% 7.7% Capex / sales 23.3% 22.8% 26.1% 23.0% 22.5% Capex / depreciation 243.3% 234.1% 244.5% 219.4% 235.0%
Valuation metrics
2014 2015 2016 2017E 2018E
P / adjusted EPS 17.7x 16.5x 14.9x 15.3x 15.6x P / book value 3.0x 3.0x 2.6x 2.7x 3.5x FCF yield 1.6% 4.3% 4.0% 2.3% 7.9% Dividend yield 4.4% 4.5% 4.5% 4.6% 4.8% EV / sales 4.3x 4.3x 4.4x 4.3x 4.2x EV / EBITDA 12.6x 12.2x 11.7x 11.7x 12.5x EV / EBIT 17.5x 16.9x 16.3x 16.5x 17.7x EV / FCF 111.4x 42.4x 47.0x 85.1x 22.8x EV / cap. employed 1.4x 1.4x 1.3x 1.3x 1.4x
Key risks to our investment thesis
● Political and regulatory intervention in the UK and US
● Failure to deliver on RPI-linked dividend commitment
● Rising interest rates (the adverse valuation effects offsetting any benefits from higher allowed regulatory returns)
● Wall of capex: More capex is good (it drives RAB growth) as long as it is not too concentrated, putting strains on the balance sheet. For this reason, a sharp reversal of the hiatus in UK generation investment and tightening reserve margin remains a risk.
Andrew Fisher Analyst +44 20 3207 7937 [email protected]
Lawson Steele Analyst +44 20 3207 7887 [email protected]
Neha Saxena Analyst +44 20 3753 3048 [email protected]
Oliver Brown Analyst +44 20 3207 7922 [email protected]

National Grid plc
Utilities – Regulated
3
National Grid – investment thesis
What’s new: National Grid has agreed to sell a 61% stake in its Gas Distribution business. We expect a special dividend (with accompanying share consolidation) and share buyback in Q2 2017. Our EPS forecasts are on a pre-consolidation basis although we also show what the effects of a consolidation would be; consensus does not. New US filings should boost ROEs.
Key investment point one: UK Gas Distribution sale nears
completion
● Key statistic: We expect National Grid to pay an 85p/share special dividend from the lion’s share of the net proceeds from its Gas Distribution stake sale. We assume that there will be an accompanying £1bn share buyback and share consolidation, starting in Q2 2017.
● On 8 December 2016, National Grid agreed to sell a 61% stake in its UK Gas Distribution business to a consortium of long-term infrastructure investors (Macquarie Infrastructure and Real Assets, Allianz Capital Partners, Hermes Investment Management, CIC Capital Corporation, Qatar Investment Authority, Dalmore Capital and Amber Infrastructure Limited/International Public Partnerships).
● The £13.8bn enterprise valuation implied by the transaction reflects a £12bn underlying valuation (in line with our estimate), plus a £1.8bn injection from additional debt financing. This effectively values the business at a 55% premium to RAV.
● The bulk (£4bn) of the net cash proceeds (including some of the new debt) will be returned to shareholders via a special dividend (at least 75%) and a share buyback. The c85p special dividend is expected to be paid in Q2 2017. We also expect a share consolidation (10 for 11), which will smooth the impact on earnings.
● Both National Grid and the consortium have expressed an interest in the possibility of a further 14% stake sale, on broadly similar terms, in the future.
● Note, our EPS forecasts are on a pre-consolidation basis although we also show what the effects of a consolidation would be.
Berenberg EBIT estimates versus consensus (consensus does
not yet appear to reflect the Gas Distribution sale)…
We show here how there would be little impact on EPS, if we
include the share consolidation to accompany the disposal and
special DPS (although in the near-term this would distort ratios)
Source: Company reports, Berenberg estimates, Bloomberg Source: Company reports, Berenberg estimates, Bloomberg
-
1,000
2,000
3,000
4,000
5,000
6,000
-
1,000
2,000
3,000
4,000
5,000
6,000
EBIT Actual/Forecast EBIT Actual/Forecast EBIT (Consensus High)
EBIT (Consensus Low) EBIT (Consensus)
-
0.10
0.20
0.30
0.40
0.50
0.60
0.70
0.80
0.90
-
0.10
0.20
0.30
0.40
0.50
0.60
0.70
0.80
0.90
EPS Actual/Forecast EPS Actual/Forecast EPS (Consensus High)
EPS (Consensus Low) EPS (Consensus) EPS post-consolidation

National Grid plc
Utilities – Regulated
4
Key investment point two: a faster-growing portfolio, especially in
the US
● Key statistic: We expect a c7% CAGR (2017-20) in total group regulated assets, with the US business leading the way. We anticipate an underlying growth rate of 7-8% pa from the US, but the RAB, in sterling terms, will receive an extra fillip from currency movements.
● Gas Distribution in the UK had matured in terms of RAB growth opportunities. Disposing of a majority stake frees up capital for management to invest in the faster-growing UK transmission businesses and the US.
We expect growth from all three remaining regulated businesses Growth in UKET and the US, plus currency movements, drive net
income growth
Source: Berenberg estimates Source: Berenberg estimates
Key investment point three: currency tailwind and US recovery
● Key statistic: We estimate that every additional 100bp on National Grid’s average achieved US ROE is worth +3% EPS.
● A promise of a US recovery is nothing new to the National Grid story. Past achieved returns have been frustratingly low versus allowed levels, most recently due to a self-enforced hiatus in new rate filings while accounting issues were addressed.
● New filings (in Massachusetts and downstate New York) should rectify this. Cautiously, however, we assume a pick-up of only 60bp by 2020/21 versus a forecast 8.0% ROE for FY 2016/17 (ie 8.6% achieved versus 9.1% allowed). We also assume that allowed ROE’s decline by 60bp over this period from the current 9.7% (see chart below). However, it is unlikely that achieved ROEs in the US will hit the allowed level due to regulatory lag.
● Sterling’s weakness against the dollar will have a positive translation effect on EBIT from the US business (33% of group profit). However, investors should be aware that National Grid has the equivalent of £17bn of US-denominated debt on its balance sheet. This mitigates the currency effects via interest costs and, from a valuation point of view, the associated increase in net debt offsets any rise in the value of the North American business.
● It is too early to tell what Donald Trump’s presidency means for the US utility sector as a whole, although it is important to remember that the bulk of National Grid’s activities in the country are dictated by state-level regulation, rather than federal policies. It is also feasible that a leaner Trump government could lead to faster decision making on infrastructure projects. Of course, that could simply mean that it says no more quickly.
2,386
2,511
415 31
448
233
246 5
208
(180)
(878)
(90)
(314)
2,100
2,300
2,500
2,700
2,900
3,100
3,300
3,500
3,700

National Grid plc
Utilities – Regulated
5
US EBIT growth driven by currency and rate base growth US business ROE’s should recover, although they are likely to
stay below a falling allowed level due to the nature of regulation
Source: Company reports, Berenberg estimates Source: Company reports, Berenberg estimates
Key investment point four: dividend sustainability
● Key statistic: National Grid targets annual growth in its dividend that is at least in line with inflation for the foreseeable future.
● The group’s dividend commitment is appealing (certainly in the context of the dividend pitfalls seen in the broader utilities sector) and looks achievable. Of course, the payout ratio and cash cost of dividends will be helped by the share consolidation, which is expected to accompany the distribution of proceeds from the Gas Distribution stake sale.
● In fact, we think there is scope for dividends to grow at a marginally faster pace than RPI.
● A little inflation can help: National Grid’s UK business is index-linked. Revenues and regulated assets are adjusted for inflation. Consequently, a little inflation as a result of sterling’s fall against the dollar can (eventually) contribute to earnings and dividend growth.
We do not expect the Gas Distribution sale and distribution of
proceeds to affect National Grid’s underlying DPS growth promise
The balance sheet remains robust. 5x net debt/EBITDA is about
right for a highly regulated utility
Source: Company reports, Berenberg estimates Source: Company reports, Berenberg estimates
Key investment point five: the caveat – beware rising bond yields
● Key statistic: We estimate that a 0.25% increase in the group’s post-tax, nominal WACC (of 3.8%) affects our price target by -7%.
● National Grid’s share price has been closely linked to medium/long-term bond yields; ever since it was floated in 1995, in fact (see chart below).
● The recent set back in National Grid’s share price (16% off its July 2016 high) appears to be largely bond-yield related. UK gilt yields rose (relatively sharply) at the end of 2016 in
-
5,000
10,000
15,000
20,000
25,000
-
200
400
600
800
1,000
1,200
1,400
1,600
1,800
2,000
2010A 2011A 2012A 2013A 2014A 2015A 2016E 2017E 2018E 2019E 2020E
EB
IT (
£m
)
US Regulated US Rate Base
7%
8%
9%
10%
11%
12%
13%
14%
15%
2013A 2014A 2015A 2016E 2017E 2018E 2019E 2020E
US ROE (Allowed) US ROE (Achieved) UKET ROE (Achieved)
UKGT ROE (Achieved) UKET ROE (Allowed) UKGT ROE (Allowed)
50%
55%
60%
65%
70%
75%
80%
85%
-
0.20
0.40
0.60
0.80
1.00
1.20
1.40
2010A 2011A 2012A 2013A 2014A 2015A 2016E 2017E 2018E 2019E 2020E
Div
idn
ed
pa
yo
ut
(%)
DP
S (
£)
DPS DPS (Special)
Payout ratio (post-consolidation) Payout ratio (pre-consolidation)
3.0
3.5
4.0
4.5
5.0
5.5
6.0
-
1,000
2,000
3,000
4,000
5,000
6,000
7,000
2010A 2011A 2012A 2013A 2014A 2015A 2016E 2017E 2018E 2019E 2020E
Ne
t d
eb
t/E
BIT
DA
EB
ITD
A (
£m
)
Rep. EBITDA Financial Net Debt/EBITDA

National Grid plc
Utilities – Regulated
6
anticipation of interest rate hikes, leading to a sharp correction in the valuation of National Grid and its regulated peers.
● Our in-house view is that, although UK inflation is expected to rise due to higher input costs as a consequence of sterling weakness, the effects are likely to be temporary. Our economics team sees only a 30% risk of an interest rate hike later this year. Of course, long-dated bond yields may rise to accommodate higher inflation, even if base rates remain low.
● If investors are convinced that bond yields will continue to rise, then National Grid is probably not the stock for them; it is more one to keep a watchful eye on.
National Grid share price versus UK 10-year government bond yield
Source: Bloomberg
Other key investment points
● The “Other” activities: The group’s “Other” activities are often overlooked. They include LNG (liquefied natural gas) and metering, property, US development projects and electricity interconnectors.
o Following the divestment of the UK Gas Distribution stake, the “Other” activities division will represent c10% of group EBITDA. Importantly, the businesses offer a relatively reliable and growing income stream. The 50/50 St William property development JV with Berkeley Group provides a vehicle for the group to unlock some value from redundant gas and electricity sites. The market-based land valuation was recorded at the time of exchange with the JV, with a 50% gain versus book value booked as EBIT; remaining EBIT will be recognised gradually as units are sold. The operating profit of the property segment (including the share of the St William JV) is expected to grow sustainably, with medium-term performance beyond 2019E reaching 2x current levels. As a consequence, the contribution of JVs will grow. We expect Property profits to tail off thereafter though as the sites are developed and sold.
o Grain LNG is underpinned by long-term take-or-pay contracts.
o Interconnectors should benefit from the tight supply-demand balance in the UK and, for that matter, France (while a number of nuclear units are offline). That said, the Brexit vote has cast some doubt over the likelihood of future interconnector projects to increase the links between the UK electricity market and Europe. Of course there are two interconnectors already in use. Furthermore, the UK is short of power and, irrespective of Brexit, needs more interconnection with the European mainland.
o Metering has performed solidly over the last three years, supported by a sharp focus on efficiency and investment. National Grid is exploring participation in rolling out smart meters as a logical extension to its existing UK metering activities. It hopes to benefit from experience, financing and customer feedback, and has already started a pilot with a mid-level energy supplier.
0
1
2
3
4
5
6
7
8
90
200
400
600
800
1000
1200
UK
Go
v 1
0 Y
r B
on
d Y
ield
(%
)U
K G
ov
10
Yr
Bo
nd
Yie
ld (
%)
UK
Go
v 1
0 Y
r B
on
d Y
ield
(%
)U
K G
ov
10
Yr
Bo
nd
Yie
ld (
%)
Na
tio
na
l G
rid
Sh
are
Pri
ce
(G
Bp
)N
ati
on
al
Gri
d S
ha
re P
ric
e (
GB
p)
Na
tio
na
l G
rid
Sh
are
Pri
ce
(G
Bp
)N
ati
on
al
Gri
d S
ha
re P
ric
e (
GB
p)
National Grid Share Price (GBp) UK Gov 10 Yr Bond Yield (%)

National Grid plc
Utilities – Regulated
7
EBITDA split of “Other” activities 2016-17E (excluding JV
contribution for Property and interconnectors)
We expect Property profits to tail off by 2020E as the sites are
developed and sold
Source: Company reports, Berenberg estimates
● Compromise on Systems Operator role: National Grid and energy regulator Ofgem have hopefully found a solution to the distracting debate over the group’s role as UK electricity system operator. In recent years, there have been calls for the group to divest this relatively small part of its business due to concerns over a perceived conflict of interest with its ownership of electricity market infrastructure (including interconnectors). The compromise is for greater separation of the activities. National Grid will move its Systems Operator activities into a new wholly owned subsidiary.
Grain LNG
24%
Metering
43%
Interconnectors
23%
Property
10%
National Grid plc
Utilities – Regulated
8
Valuation and sensitivity analysis
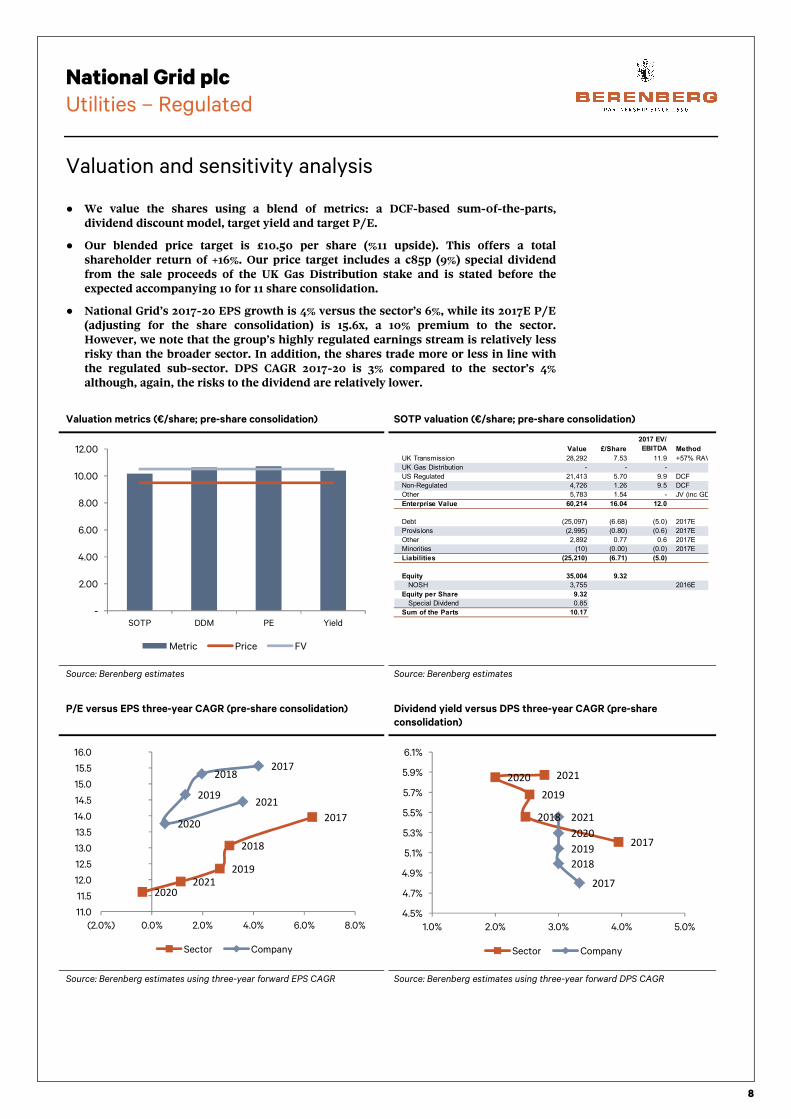
● We value the shares using a blend of metrics: a DCF-based sum-0f-the-parts, dividend discount model, target yield and target P/E.
● Our blended price target is £10.50 per share (%11 upside). This offers a total shareholder return of +16%. Our price target includes a c85p (9%) special dividend from the sale proceeds of the UK Gas Distribution stake and is stated before the expected accompanying 10 for 11 share consolidation.
● National Grid’s 2017-20 EPS growth is 4% versus the sector’s 6%, while its 2017E P/E (adjusting for the share consolidation) is 15.6x, a 10% premium to the sector. However, we note that the group’s highly regulated earnings stream is relatively less risky than the broader sector. In addition, the shares trade more or less in line with the regulated sub-sector. DPS CAGR 2017-20 is 3% compared to the sector’s 4% although, again, the risks to the dividend are relatively lower.
Valuation metrics (€/share; pre-share consolidation) SOTP valuation (€/share; pre-share consolidation)
Source: Berenberg estimates Source: Berenberg estimates
P/E versus EPS three-year CAGR (pre-share consolidation) Dividend yield versus DPS three-year CAGR (pre-share
consolidation)
Source: Berenberg estimates using three-year forward EPS CAGR Source: Berenberg estimates using three-year forward DPS CAGR
-
2.00
4.00
6.00
8.00
10.00
12.00
SOTP DDM PE Yield
Metric Price FV
Value £/Share
2017 EV/
EBITDA Method
UK Transmission 28,292 7.53 11.9 +57% RAV
UK Gas Distribution - - -
US Regulated 21,413 5.70 9.9 DCF
Non-Regulated 4,726 1.26 9.5 DCF
Other 5,783 1.54 - JV (inc GD)
Enterprise Value 60,214 16.04 12.0
Debt (25,097) (6.68) (5.0) 2017E
Provisions (2,995) (0.80) (0.6) 2017E
Other 2,892 0.77 0.6 2017E
Minorities (10) (0.00) (0.0) 2017E
Liabilities (25,210) (6.71) (5.0)
Equity 35,004 9.32
NOSH 3,755 2016E
Equity per Share 9.32
Special Dividend 0.85
Sum of the Parts 10.17
2017
2018
2019
20202021
20172018
2019
2020
2021
11.0
11.5
12.0
12.5
13.0
13.5
14.0
14.5
15.0
15.5
16.0
(2.0%) 0.0% 2.0% 4.0% 6.0% 8.0%
Sector Company
2017
2018
2019
2020 2021
2017
2018
2019
2020
2021
4.5%
4.7%
4.9%
5.1%
5.3%
5.5%
5.7%
5.9%
6.1%
1.0% 2.0% 3.0% 4.0% 5.0%
Sector Company

National Grid plc
Utilities – Regulated
9
Black-sky/blue-sky scenario
Our black-sky/blue-sky price target range is £8.0-£12.0 per share. Our blue-sky valuation gives 27% upside from current levels and our black-sky valuation gives -15% downside.
Price target black-sky/ blue-sky scenario (€/share)
Source: Berenberg estimates
Black-sky/blue-sky scenario assumptions
Source: Berenberg estimates
£1.54£0.27
£0.17 £0.34£0.14
£0.77£0.27
£0.17£0.17
£0.14
£9.48
£10.50
£ 12.0 + 27%
£ 8.0 - 15%
7.00
8.00
9.00
10.00
11.00
12.00
13.00
Current Price
& 52 Week
Range
FV Range +0.5%/-0.25%
WACC
+/- 1 %
Achieved ROE
US
+/- 500 £ m
US Rate Base
+0.25% / -0.5
% Achieved
Return
+/- 500 £ m
RAV UKE/GT
Blue & Black
Sky
DriverDriverDriverDriver Bull €/shareBull €/shareBull €/shareBull €/share Bear €/shareBear €/shareBear €/shareBear €/share AssumptionsAssumptionsAssumptionsAssumptions
Base Case Valuation 10.5 10.5
+0.5%/-0.25% WACC 0.8 (1.5) Post-tax WACC 3.8%
+/- 1 % Achieved ROE US 0.3 (0.3) UKET 13.7%; UKGT 11.7%
+/- 500 £ m US Rate Base 0.2 (0.2) ROE 8.2%
+0.25% / -0.5 % Achieved Return 0.2 (0.3) Rate base £17bn
+/- 500 £ m RAV UKE/GT 0.1 (0.1) RAV £19bn
Blue & Black Sky ValuationBlue & Black Sky ValuationBlue & Black Sky ValuationBlue & Black Sky Valuation 12.012.012.012.0 8.08.08.08.0
Upside/(Downside) from share price 27% (15%)

National Grid plc
Utilities – Regulated
10
Changes to numbers: Berenberg versus consensus
Estimate changes
Source: Berenberg
Berenberg versus consensus
Source: Berenberg estimates, Bloomberg
Estimate ChangesEstimate ChangesEstimate ChangesEstimate Changes 2013/14A2013/14A2013/14A2013/14A 2014/15A2014/15A2014/15A2014/15A 2015/16A2015/16A2015/16A2015/16A 2016/17E2016/17E2016/17E2016/17E 2017/18E2017/18E2017/18E2017/18E 2018/19E2018/19E2018/19E2018/19E 2019/20E2019/20E2019/20E2019/20E 2020/21E2020/21E2020/21E2020/21E
EBITDA (New - as reported; £ m)EBITDA (New - as reported; £ m)EBITDA (New - as reported; £ m)EBITDA (New - as reported; £ m) 5,0805,0805,0805,080 5,3455,3455,3455,345 5,7105,7105,7105,710 5,8925,8925,8925,892 5,0185,0185,0185,018 5,2695,2695,2695,269 5,5515,5515,5515,551 5,9115,9115,9115,911
EBITDA (Old - as reported; £ m) 5,080 5,345 5,622 4,643 4,902 5,173 5,487 5,899
Change +0% +0% +2% +27% +2% +2% +1% +0%
EBIT (New - as reported; £ m)EBIT (New - as reported; £ m)EBIT (New - as reported; £ m)EBIT (New - as reported; £ m) 3,6643,6643,6643,664 3,8633,8633,8633,863 4,0964,0964,0964,096 4,2054,2054,2054,205 3,5643,5643,5643,564 3,7303,7303,7303,730 3,9113,9113,9113,911 4,1654,1654,1654,165
EBIT (Old - as reported; £ m) 3,664 3,863 4,064 3,312 3,499 3,693 3,913 4,225
Change +0% +0% +1% +27% +2% +1% -0% -1%
EPS (New - as reported; £)EPS (New - as reported; £)EPS (New - as reported; £)EPS (New - as reported; £) 0.54 0.58 0.64 0.62 0.61 0.62 0.65 0.69
EPS (Old - as reported; £) 0.54 0.58 0.61 0.54 0.57 0.60 0.63 0.69
Change +0% -1% +4% +14% +8% +4% +2% +0%
DPS (New - as reported; £)DPS (New - as reported; £)DPS (New - as reported; £)DPS (New - as reported; £) 0.42 0.42 0.43 0.44 0.46 0.47 0.49 0.50
DPS (Old - as reported; £) 0.42 0.43 0.43 0.44 0.45 0.47 0.48 0.49
Change +0% -1% -0% -1% +0% +1% +2% +2%
Berenberg Forecasts vs ConsensusBerenberg Forecasts vs ConsensusBerenberg Forecasts vs ConsensusBerenberg Forecasts vs Consensus 2013/14A2013/14A2013/14A2013/14A 2014/15A2014/15A2014/15A2014/15A 2015/16A2015/16A2015/16A2015/16A 2016/17E2016/17E2016/17E2016/17E 2017/18E2017/18E2017/18E2017/18E 2018/19E2018/19E2018/19E2018/19E 2019/20E2019/20E2019/20E2019/20E 2020/21E2020/21E2020/21E2020/21E
EBITDA* (£ m)EBITDA* (£ m)EBITDA* (£ m)EBITDA* (£ m) 5,0805,0805,0805,080 5,3455,3455,3455,345 5,7105,7105,7105,710 5,8925,8925,8925,892 5,0185,0185,0185,018 5,2695,2695,2695,269 5,5515,5515,5515,551 5,9115,9115,9115,911
Consensus (Average) 5,213 5,349 5,644 5,645 5,734 5,850 6,439 #N/A
Berenberg +/- vs Cons -3% -0% +1% +4% -12% -10% -14% #N/A
EBIT* (£ m)EBIT* (£ m)EBIT* (£ m)EBIT* (£ m) 3,6643,6643,6643,664 3,8633,8633,8633,863 4,0964,0964,0964,096 4,2054,2054,2054,205 3,5643,5643,5643,564 3,7303,7303,7303,730 3,9113,9113,9113,911 4,1654,1654,1654,165
Consensus (Average) 3,780 3,851 4,085 4,202 4,242 4,282 4,428 #N/A
Berenberg +/- vs Cons -3% +0% +0% +0% -16% -13% -12% #N/A
Net Income* (£ m)Net Income* (£ m)Net Income* (£ m)Net Income* (£ m) 2,0152,0152,0152,015 2,1892,1892,1892,189 2,3862,3862,3862,386 2,3352,3352,3352,335 2,2362,2362,2362,236 2,2562,2562,2562,256 2,3562,3562,3562,356 2,5112,5112,5112,511
Consensus (Average) 1,921 2,096 2,333 2,510 2,354 2,403 2,503 #N/A
Berenberg +/- vs Cons +5% +4% +2% -7% -5% -6% -6% #N/A
EPS* (£)EPS* (£)EPS* (£)EPS* (£) 0.54 0.58 0.64 0.62 0.61 0.62 0.65 0.69
Consensus (Average) 0.52 0.56 0.62 0.63 0.66 0.70 0.71 #N/A
Berenberg +/- vs Cons +3% +3% +3% -1% -7% -12% -9% #N/A
EPS (post-consolidation)* (£)EPS (post-consolidation)* (£)EPS (post-consolidation)* (£)EPS (post-consolidation)* (£) 0.67 0.69 0.72 0.77
Consensus (Average) 0.66 0.70 0.71 #N/A
Berenberg +/- vs Cons +3% -2% +1% #N/A
DPS (£)DPS (£)DPS (£)DPS (£) 0.42 0.42 0.43 0.44 0.46 0.47 0.49 0.50
Consensus (Average) 0.42 0.43 0.44 0.44 0.46 0.47 0.49 #N/A
Berenberg +/- vs Cons -0% -2% -1% -1% -0% -0% -1% #N/A
* Based on company's definition of metric

National Grid plc
Utilities – Regulated
11
Sensitivity analysis
Sensitivity analysis
Source: Berenberg
SensitivitiesSensitivitiesSensitivitiesSensitivities 2013/14A2013/14A2013/14A2013/14A 2014/15A2014/15A2014/15A2014/15A 2015/16A2015/16A2015/16A2015/16A 2016/17E2016/17E2016/17E2016/17E 2017/18E2017/18E2017/18E2017/18E 2018/19E2018/19E2018/19E2018/19E 2019/20E2019/20E2019/20E2019/20E 2020/21E2020/21E2020/21E2020/21E
EBITDA Sensitivity* toEBITDA Sensitivity* toEBITDA Sensitivity* toEBITDA Sensitivity* to
+/- 1 % Achieved Return UKET 2.1% 2.1% 2.1% 2.1% 2.6% 2.7% 2.8% 2.8%
+/- 1 % Achieved Return UKGT 1.1% 1.0% 1.0% 1.0% 1.2% 1.2% 1.2% 1.2%
+/- 1 % Achieved Return UKGD 1.7% 1.6% 1.5% 1.5% 0.0% 0.0% 0.0% 0.0%
+/- 1 % Achieved ROE US 0.9% 1.0% 1.1% 1.2% 1.6% 1.7% 1.7% 1.7%
+/- 1000 £ m RAV UKE/GT 2.4% 2.5% 2.3% 2.2% 2.5% 2.3% 2.1% 2.0%
+/- 1000 £ m RAV UKGD 2.7% 2.4% 2.4% 0.0% 0.0% 0.0% 0.0% 0.0%
+/- 1000 £ m US Rate Base 3.0% 2.8% 2.4% 2.3% 2.5% 2.4% 2.4% 2.3%
+/- 1 % UK Growth 0.4% 0.4% 0.4% 0.4% 0.5% 0.5% 0.5% 0.5%
+/- 1 % US Growth 0.2% 0.2% 0.2% 0.2% 0.3% 0.3% 0.3% 0.3%
+/- 10 % USDGBP currency move 3.0% 3.0% 3.0% 3.3% 4.3% 4.4% 4.5% 4.6%
Net Income Sensitivity* toNet Income Sensitivity* toNet Income Sensitivity* toNet Income Sensitivity* to
+/- 1 % Achieved Return UKET 4.1% 3.9% 3.7% 4.0% 4.4% 4.8% 4.9% 5.0%
+/- 1 % Achieved Return UKGT 2.1% 1.9% 1.8% 1.8% 2.0% 2.1% 2.1% 2.1%
+/- 1 % Achieved Return UKGD 3.2% 3.0% 2.8% 2.9% 0.0% 0.0% 0.0% 0.0%
+/- 1 % Achieved ROE US 1.8% 1.8% 1.9% 2.3% 2.8% 2.9% 3.0% 3.0%
+/- 1000 £ m RAV UKE/GT 3.2% 3.2% 3.0% 3.4% 3.4% 3.2% 3.0% 2.8%
+/- 1000 £ m RAV UKGD 3.8% 3.2% 3.2% 0.0% 0.0% 0.0% 0.0% 0.0%
+/- 1000 £ m US Rate Base 4.3% 3.8% 3.3% 3.6% 3.5% 3.5% 3.4% 3.3%
+/- 1 % UK Growth 0.7% 0.7% 0.7% 0.7% 0.8% 0.8% 0.8% 0.8%
+/- 1 % US Growth 0.3% 0.3% 0.4% 0.4% 0.5% 0.5% 0.6% 0.5%
+/- 10 % USDGBP currency move 3.9% 3.5% 3.7% 4.3% 5.7% 6.0% 6.2% 6.4%
* Ceteris Paribus; e.g. does not take account of hedged positions.

National Grid plc
Utilities – Regulated
12
Key assumptions
Key assumptions
Source: Berenberg
Power Price ForecastsPower Price ForecastsPower Price ForecastsPower Price Forecasts 2014A2014A2014A2014A 2015A2015A2015A2015A 2016E2016E2016E2016E 2017E2017E2017E2017E 2018E2018E2018E2018E 2019E2019E2019E2019E 2020E2020E2020E2020E
CountryCountryCountryCountry UnitUnitUnitUnit
UK (Local) £/MWh 47.0 47.0 43.1 46.2 50.6 51.3 51.0
UK (EUR) EUR/MWh 58.5 62.1 54.2 54.1 58.9 59.0 57.9
Germany EUR/MWh 35.0 30.5 27.0 27.8 29.8 27.8 29.5
Nordic EUR/MWh 33.1 32.8 22.0 27.5 25.0 23.7 23.5
Italy EUR/MWh 52.9 46.0 40.8 41.3 45.7 45.2 45.3
Benelux EUR/MWh 47.0 40.0 32.0 32.8 34.8 33.0 32.6
France EUR/MWh 47.0 38.0 32.0 34.9 37.0 36.9 37.0
Spain/Portugal EUR/MWh 47.0 47.0 43.0 44.0 45.7 42.9 43.7
Fuel Price ForecastsFuel Price ForecastsFuel Price ForecastsFuel Price Forecasts 2014A2014A2014A2014A 2015A2015A2015A2015A 2016E2016E2016E2016E 2017E2017E2017E2017E 2018E2018E2018E2018E 2019E2019E2019E2019E 2020E2020E2020E2020E
FuelFuelFuelFuel UnitUnitUnitUnit
Oil (Brent) $/bbl 101.9 53.5 53.5 59.7 59.1 59.1 59.1
Coal $/t 78.3 53.3 49.5 57.5 63.0 58.0 58.0
Gas (Europe LTC) EUR/MWh 26.4 21.9 13.6 14.9 17.9 18.2 17.7
Gas (Italy) EUR/MWh 23.2 20.0 12.4 13.7 16.4 16.6 16.2
Gas (UK) £ £/MWh 14.1 12.0 9.3 10.8 13.1 13.4 13.2
Carbon UK floor £/t 14.3 20.0 22.0 22.7 23.0 23.1 23.2
US Gas Henry Hub $/MWh 14.7 8.7 29.6 11.9 10.0 9.7 9.9
Uranium EUR/MWh 8.5 8.5 8.5 8.5 8.5 8.5 8.5
Carbon EUR/t 6.0 7.8 5.5 5.5 5.9 5.9 5.9
Year end currency ratesYear end currency ratesYear end currency ratesYear end currency rates 2014A2014A2014A2014A 2015A2015A2015A2015A 2016E2016E2016E2016E 2017E2017E2017E2017E 2018E2018E2018E2018E 2019E2019E2019E2019E 2020E2020E2020E2020E
EURGBP 0.78 0.74 0.85 0.85 0.86 0.87 0.89
EURTRY 2.83 3.17 3.70 4.16 4.68 5.23 5.85
EURSEK 9.44 9.17 9.57 9.52 9.52 9.58 9.70
EURUSD 1.21 1.09 1.05 1.06 1.09 1.12 1.15
EURRUB 73.50 80.00 64.72 68.86 74.83 80.39 86.10
EURMXN 17.84 18.75 21.81 23.17 25.07 27.12 29.29
USDBRL 2.66 4.00 3.26 3.56 3.80 4.06 4.35
InflationInflationInflationInflation 2014A2014A2014A2014A 2015A2015A2015A2015A 2016E2016E2016E2016E 2017E2017E2017E2017E 2018E2018E2018E2018E 2019E2019E2019E2019E 2020E2020E2020E2020E
Central Europe 0.8% 0.1% 0.4% 1.6% 1.7% 1.7% 1.7%
Eastern Europe 5.8% 9.0% 6.1% 4.8% 4.6% 4.6% 4.6%
UK 1.5% 0.1% 0.6% 2.5% 2.4% 2.4% 2.4%
Nordic 0.5% -0.2% 0.7% 1.4% 1.6% 1.6% 1.6%
Spain/Portugal -0.2% -0.1% 0.2% 1.2% 1.5% 1.5% 1.5%
US 1.6% 0.1% 1.3% 2.3% 2.4% 2.4% 2.4%

National Grid plc
Utilities – Regulated
13
Financials
Income statement
Source: Berenberg
Income Statement (£ m)Income Statement (£ m)Income Statement (£ m)Income Statement (£ m) 2013/14A2013/14A2013/14A2013/14A 2014/15A2014/15A2014/15A2014/15A 2015/16A2015/16A2015/16A2015/16A 2016/17E2016/17E2016/17E2016/17E 2017/18E2017/18E2017/18E2017/18E 2018/19E2018/19E2018/19E2018/19E 2019/20E2019/20E2019/20E2019/20E 2020/21E2020/21E2020/21E2020/21E
Revenue 14,809 15,201 15,115 16,085 15,164 15,772 16,429 17,301
Reported EBITDAReported EBITDAReported EBITDAReported EBITDA 5,0805,0805,0805,080 5,3455,3455,3455,345 5,7105,7105,7105,710 5,8925,8925,8925,892 5,0185,0185,0185,018 5,2695,2695,2695,269 5,5515,5515,5515,551 5,9115,9115,9115,911
Change +2% +5% +7% +3% -15% +5% +5% +6%
Margin +34% +35% +38% +37% +33% +33% +34% +34%
Depreciation (1,416) (1,482) (1,614) (1,686) (1,454) (1,538) (1,640) (1,746)
Other OPEX - - - - - - - -
Reported EBITReported EBITReported EBITReported EBIT 3,6643,6643,6643,664 3,8633,8633,8633,863 4,0964,0964,0964,096 4,2054,2054,2054,205 3,5643,5643,5643,564 3,7303,7303,7303,730 3,9113,9113,9113,911 4,1654,1654,1654,165
Change +1% +5% +6% +3% -15% +5% +5% +6%
Margin +25% +25% +27% +26% +24% +24% +24% +24%
Net Financial Expenses (1,015) (1,198) (1,112) (1,212) (938) (1,088) (1,144) (1,197)
Tax (284) (617) (438) (719) (670) (676) (706) (752)
Other (362) 133 (157) 72 292 300 305 305
Minorities 12 8 (3) (11) (11) (11) (11) (11)
Reported Net IncomeReported Net IncomeReported Net IncomeReported Net Income 2,0152,0152,0152,015 2,1892,1892,1892,189 2,3862,3862,3862,386 2,3352,3352,3352,335 2,2362,2362,2362,236 2,2562,2562,2562,256 2,3562,3562,3562,356 2,5112,5112,5112,511
Change +5% +9% +9% -2% -4% +1% +4% +7%
Margin +14% +14% +16% +15% +15% +14% +14% +15%
Number of Shares 3,766 3,798 3,755 3,755 3,671 3,643 3,643 3,643
Per Share:Per Share:Per Share:Per Share:
Basic EPS 0.66 0.53 0.69 0.62 1.29 0.62 0.65 0.69
Change +14% -19% +30% -10% +107% -52% +4% +7%
Reported EPSReported EPSReported EPSReported EPS 0.540.540.540.54 0.580.580.580.58 0.640.640.640.64 0.620.620.620.62 0.610.610.610.61 0.620.620.620.62 0.650.650.650.65 0.690.690.690.69
Change +4% +8% +10% -2% -2% +2% +4% +7%
EPS post share consolidationEPS post share consolidationEPS post share consolidationEPS post share consolidation 0.670.670.670.67 0.690.690.690.69 0.720.720.720.72 0.770.770.770.77
Change +2% +5% +7%
DPSDPSDPSDPS 0.420.420.420.42 0.420.420.420.42 0.430.430.430.43 0.440.440.440.44 0.460.460.460.46 0.470.470.470.47 0.490.490.490.49 0.500.500.500.50
Change +3% +1% +2% +1% +4% +4% +3% +3%
Payout 79% 73% 68% 70% 75% 76% 75% 73%
DPS Special DPS Special DPS Special DPS Special 0.000.000.000.00 0.000.000.000.00 0.000.000.000.00 0.000.000.000.00 0.850.850.850.85 0.000.000.000.00 0.000.000.000.00 0.000.000.000.00
National Grid plc
Utilities – Regulated
14
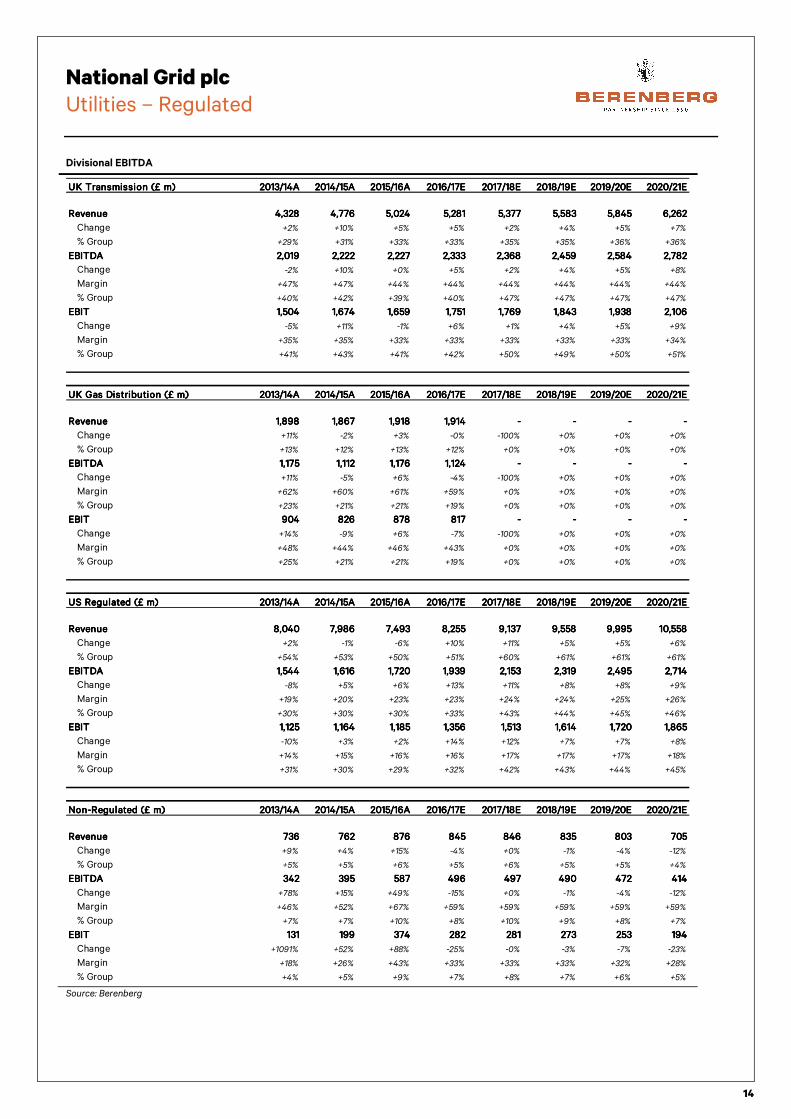
Divisional EBITDA
Source: Berenberg
UK Transmission (£ m)UK Transmission (£ m)UK Transmission (£ m)UK Transmission (£ m) 2013/14A2013/14A2013/14A2013/14A 2014/15A2014/15A2014/15A2014/15A 2015/16A2015/16A2015/16A2015/16A 2016/17E2016/17E2016/17E2016/17E 2017/18E2017/18E2017/18E2017/18E 2018/19E2018/19E2018/19E2018/19E 2019/20E2019/20E2019/20E2019/20E 2020/21E2020/21E2020/21E2020/21E
RevenueRevenueRevenueRevenue 4,3284,3284,3284,328 4,7764,7764,7764,776 5,0245,0245,0245,024 5,2815,2815,2815,281 5,3775,3775,3775,377 5,5835,5835,5835,583 5,8455,8455,8455,845 6,2626,2626,2626,262
Change +2% +10% +5% +5% +2% +4% +5% +7%
% Group +29% +31% +33% +33% +35% +35% +36% +36%
EBITDAEBITDAEBITDAEBITDA 2,0192,0192,0192,019 2,2222,2222,2222,222 2,2272,2272,2272,227 2,3332,3332,3332,333 2,3682,3682,3682,368 2,4592,4592,4592,459 2,5842,5842,5842,584 2,7822,7822,7822,782
Change -2% +10% +0% +5% +2% +4% +5% +8%
Margin +47% +47% +44% +44% +44% +44% +44% +44%
% Group +40% +42% +39% +40% +47% +47% +47% +47%
EBITEBITEBITEBIT 1,5041,5041,5041,504 1,6741,6741,6741,674 1,6591,6591,6591,659 1,7511,7511,7511,751 1,7691,7691,7691,769 1,8431,8431,8431,843 1,9381,9381,9381,938 2,1062,1062,1062,106
Change -5% +11% -1% +6% +1% +4% +5% +9%
Margin +35% +35% +33% +33% +33% +33% +33% +34%
% Group +41% +43% +41% +42% +50% +49% +50% +51%
UK Gas Distribution (£ m)UK Gas Distribution (£ m)UK Gas Distribution (£ m)UK Gas Distribution (£ m) 2013/14A2013/14A2013/14A2013/14A 2014/15A2014/15A2014/15A2014/15A 2015/16A2015/16A2015/16A2015/16A 2016/17E2016/17E2016/17E2016/17E 2017/18E2017/18E2017/18E2017/18E 2018/19E2018/19E2018/19E2018/19E 2019/20E2019/20E2019/20E2019/20E 2020/21E2020/21E2020/21E2020/21E
RevenueRevenueRevenueRevenue 1,8981,8981,8981,898 1,8671,8671,8671,867 1,9181,9181,9181,918 1,9141,9141,9141,914 ---- ---- ---- ----
Change +11% -2% +3% -0% -100% +0% +0% +0%
% Group +13% +12% +13% +12% +0% +0% +0% +0%
EBITDAEBITDAEBITDAEBITDA 1,1751,1751,1751,175 1,1121,1121,1121,112 1,1761,1761,1761,176 1,1241,1241,1241,124 ---- ---- ---- ----
Change +11% -5% +6% -4% -100% +0% +0% +0%
Margin +62% +60% +61% +59% +0% +0% +0% +0%
% Group +23% +21% +21% +19% +0% +0% +0% +0%
EBITEBITEBITEBIT 904904904904 826826826826 878878878878 817817817817 ---- ---- ---- ----
Change +14% -9% +6% -7% -100% +0% +0% +0%
Margin +48% +44% +46% +43% +0% +0% +0% +0%
% Group +25% +21% +21% +19% +0% +0% +0% +0%
US Regulated (£ m)US Regulated (£ m)US Regulated (£ m)US Regulated (£ m) 2013/14A2013/14A2013/14A2013/14A 2014/15A2014/15A2014/15A2014/15A 2015/16A2015/16A2015/16A2015/16A 2016/17E2016/17E2016/17E2016/17E 2017/18E2017/18E2017/18E2017/18E 2018/19E2018/19E2018/19E2018/19E 2019/20E2019/20E2019/20E2019/20E 2020/21E2020/21E2020/21E2020/21E
RevenueRevenueRevenueRevenue 8,0408,0408,0408,040 7,9867,9867,9867,986 7,4937,4937,4937,493 8,2558,2558,2558,255 9,1379,1379,1379,137 9,5589,5589,5589,558 9,9959,9959,9959,995 10,55810,55810,55810,558
Change +2% -1% -6% +10% +11% +5% +5% +6%
% Group +54% +53% +50% +51% +60% +61% +61% +61%
EBITDAEBITDAEBITDAEBITDA 1,5441,5441,5441,544 1,6161,6161,6161,616 1,7201,7201,7201,720 1,9391,9391,9391,939 2,1532,1532,1532,153 2,3192,3192,3192,319 2,4952,4952,4952,495 2,7142,7142,7142,714
Change -8% +5% +6% +13% +11% +8% +8% +9%
Margin +19% +20% +23% +23% +24% +24% +25% +26%
% Group +30% +30% +30% +33% +43% +44% +45% +46%
EBITEBITEBITEBIT 1,1251,1251,1251,125 1,1641,1641,1641,164 1,1851,1851,1851,185 1,3561,3561,3561,356 1,5131,5131,5131,513 1,6141,6141,6141,614 1,7201,7201,7201,720 1,8651,8651,8651,865
Change -10% +3% +2% +14% +12% +7% +7% +8%
Margin +14% +15% +16% +16% +17% +17% +17% +18%
% Group +31% +30% +29% +32% +42% +43% +44% +45%
Non-Regulated (£ m)Non-Regulated (£ m)Non-Regulated (£ m)Non-Regulated (£ m) 2013/14A2013/14A2013/14A2013/14A 2014/15A2014/15A2014/15A2014/15A 2015/16A2015/16A2015/16A2015/16A 2016/17E2016/17E2016/17E2016/17E 2017/18E2017/18E2017/18E2017/18E 2018/19E2018/19E2018/19E2018/19E 2019/20E2019/20E2019/20E2019/20E 2020/21E2020/21E2020/21E2020/21E
RevenueRevenueRevenueRevenue 736736736736 762762762762 876876876876 845845845845 846846846846 835835835835 803803803803 705705705705
Change +9% +4% +15% -4% +0% -1% -4% -12%
% Group +5% +5% +6% +5% +6% +5% +5% +4%
EBITDAEBITDAEBITDAEBITDA 342342342342 395395395395 587587587587 496496496496 497497497497 490490490490 472472472472 414414414414
Change +78% +15% +49% -15% +0% -1% -4% -12%
Margin +46% +52% +67% +59% +59% +59% +59% +59%
% Group +7% +7% +10% +8% +10% +9% +8% +7%
EBITEBITEBITEBIT 131131131131 199199199199 374374374374 282282282282 281281281281 273273273273 253253253253 194194194194
Change +1091% +52% +88% -25% -0% -3% -7% -23%
Margin +18% +26% +43% +33% +33% +33% +32% +28%
% Group +4% +5% +9% +7% +8% +7% +6% +5%
National Grid plc
Utilities – Regulated
15
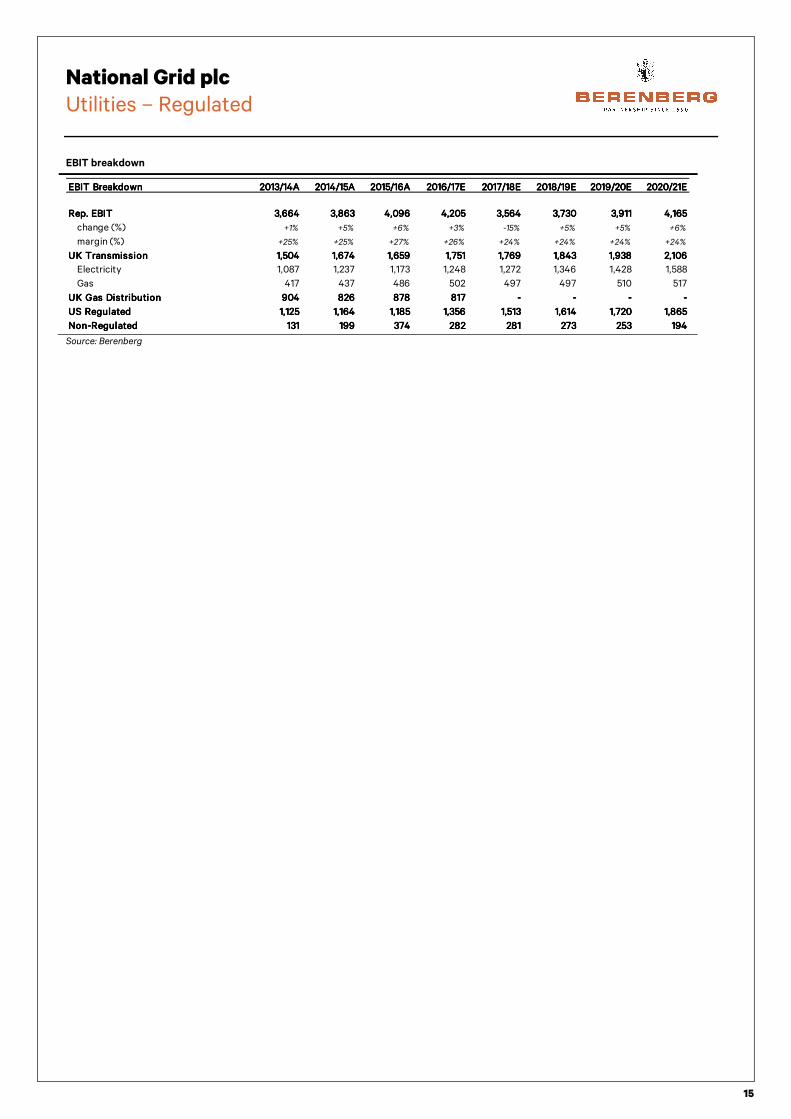
EBIT breakdown
Source: Berenberg
EBIT BreakdownEBIT BreakdownEBIT BreakdownEBIT Breakdown 2013/14A2013/14A2013/14A2013/14A 2014/15A2014/15A2014/15A2014/15A 2015/16A2015/16A2015/16A2015/16A 2016/17E2016/17E2016/17E2016/17E 2017/18E2017/18E2017/18E2017/18E 2018/19E2018/19E2018/19E2018/19E 2019/20E2019/20E2019/20E2019/20E 2020/21E2020/21E2020/21E2020/21E
Rep. EBITRep. EBITRep. EBITRep. EBIT 3,6643,6643,6643,664 3,8633,8633,8633,863 4,0964,0964,0964,096 4,2054,2054,2054,205 3,5643,5643,5643,564 3,7303,7303,7303,730 3,9113,9113,9113,911 4,1654,1654,1654,165
change (%) +1% +5% +6% +3% -15% +5% +5% +6%
margin (%) +25% +25% +27% +26% +24% +24% +24% +24%
UK TransmissionUK TransmissionUK TransmissionUK Transmission 1,5041,5041,5041,504 1,6741,6741,6741,674 1,6591,6591,6591,659 1,7511,7511,7511,751 1,7691,7691,7691,769 1,8431,8431,8431,843 1,9381,9381,9381,938 2,1062,1062,1062,106
Electricity 1,087 1,237 1,173 1,248 1,272 1,346 1,428 1,588
Gas 417 437 486 502 497 497 510 517
UK Gas DistributionUK Gas DistributionUK Gas DistributionUK Gas Distribution 904904904904 826826826826 878878878878 817817817817 ---- ---- ---- ----
US RegulatedUS RegulatedUS RegulatedUS Regulated 1,1251,1251,1251,125 1,1641,1641,1641,164 1,1851,1851,1851,185 1,3561,3561,3561,356 1,5131,5131,5131,513 1,6141,6141,6141,614 1,7201,7201,7201,720 1,8651,8651,8651,865
Non-RegulatedNon-RegulatedNon-RegulatedNon-Regulated 131131131131 199199199199 374374374374 282282282282 281281281281 273273273273 253253253253 194194194194

National Grid plc
Utilities – Regulated
16
Cash flow statement
Source: Berenberg
Cash Flow (£ m)Cash Flow (£ m)Cash Flow (£ m)Cash Flow (£ m) 2013/14A2013/14A2013/14A2013/14A 2014/15A2014/15A2014/15A2014/15A 2015/16A2015/16A2015/16A2015/16A 2016/17E2016/17E2016/17E2016/17E 2017/18E2017/18E2017/18E2017/18E 2018/19E2018/19E2018/19E2018/19E 2019/20E2019/20E2019/20E2019/20E 2020/21E2020/21E2020/21E2020/21E
Net Income 2,015 2,189 2,386 2,346 4,746 2,267 2,367 2,522
Depreciation 1,416 1,482 1,614 1,686 1,454 1,538 1,640 1,746
Working Capital (59) 301 456 24 (23) 15 16 22
Other Operating Cash Flow 647 1,035 912 456 - - - -
Operating Cash FlowOperating Cash FlowOperating Cash FlowOperating Cash Flow 4,0194,0194,0194,019 5,0075,0075,0075,007 5,3685,3685,3685,368 4,5134,5134,5134,513 6,1786,1786,1786,178 3,8203,8203,8203,820 4,0234,0234,0234,023 4,2894,2894,2894,289
CAPEX (3,445) (3,470) (3,946) (3,700) (3,417) (4,204) (4,358) (4,516)
FCF (Post CAPEX)FCF (Post CAPEX)FCF (Post CAPEX)FCF (Post CAPEX) 574574574574 1,5371,5371,5371,537 1,4221,4221,4221,422 813813813813 2,7602,7602,7602,760 (384)(384)(384)(384) (335)(335)(335)(335) (227)(227)(227)(227)
Acquisitions and Disposals - - (116) - 4,258 - - -
FCF (p. CAPEX, Aq&D)FCF (p. CAPEX, Aq&D)FCF (p. CAPEX, Aq&D)FCF (p. CAPEX, Aq&D) 574574574574 1,5371,5371,5371,537 1,3061,3061,3061,306 813813813813 7,0187,0187,0187,018 (384)(384)(384)(384) (335)(335)(335)(335) (227)(227)(227)(227)
Other Investment Cash Flow 2,115 1,469 26 - (150) - - -
Dividends (1,059) (1,271) (1,337) (1,621) (4,837) (1,671) (1,724) (1,776)
FCF (p. CAPEX, Aq&D, Divs)FCF (p. CAPEX, Aq&D, Divs)FCF (p. CAPEX, Aq&D, Divs)FCF (p. CAPEX, Aq&D, Divs) 1,6301,6301,6301,630 1,7351,7351,7351,735 (5)(5)(5)(5) (808)(808)(808)(808) 2,0312,0312,0312,031 (2,054)(2,054)(2,054)(2,054) (2,059)(2,059)(2,059)(2,059) (2,003)(2,003)(2,003)(2,003)
Buybacks and Equity Issuance 9 16 10 - (1,065) - - -
Borrowings (1,058) (1,296) 1,830 803 - 1,088 2,059 2,003
Other Financing, Disc and FX (890) (678) (1,827) - - - - -
Net Change in Group CashNet Change in Group CashNet Change in Group CashNet Change in Group Cash (309)(309)(309)(309) (223)(223)(223)(223) 8888 (5)(5)(5)(5) 967967967967 (967)(967)(967)(967) ---- ----

National Grid plc
Utilities – Regulated
17
Balance sheet statement
Source: Berenberg
Balance Sheet (£ m)Balance Sheet (£ m)Balance Sheet (£ m)Balance Sheet (£ m) 2013/14A2013/14A2013/14A2013/14A 2014/15A2014/15A2014/15A2014/15A 2015/16A2015/16A2015/16A2015/16A 2016/17E2016/17E2016/17E2016/17E 2017/18E2017/18E2017/18E2017/18E 2018/19E2018/19E2018/19E2018/19E 2019/20E2019/20E2019/20E2019/20E 2020/21E2020/21E2020/21E2020/21E
Intangible Fixed Assets 5,263 5,947 6,202 6,202 6,202 6,202 6,202 6,202
PP&E 37,179 40,723 43,364 45,378 34,199 36,865 39,582 42,353
Other Non-Current Assets 2,453 2,388 3,056 3,056 5,396 5,396 5,396 5,396
Total Non-Current AssetsTotal Non-Current AssetsTotal Non-Current AssetsTotal Non-Current Assets 44,89544,89544,89544,895 49,05849,05849,05849,058 52,62252,62252,62252,622 54,63654,63654,63654,636 45,79745,79745,79745,797 48,46348,46348,46348,463 51,18051,18051,18051,180 53,95153,95153,95153,951
Inventories and Receivables 3,123 3,176 2,909 3,096 2,918 3,035 3,162 3,330
Cash 354 119 127 119 1,086 119 119 119
Other Liquid Assets - - - - - - - -
Other Current Assets 4,012 2,736 3,276 3,276 3,276 3,276 3,276 3,276
Assets Held for Sale - - - - - - - -
Total Current AssetsTotal Current AssetsTotal Current AssetsTotal Current Assets 7,4897,4897,4897,489 6,0316,0316,0316,031 6,3126,3126,3126,312 6,4916,4916,4916,491 7,2807,2807,2807,280 6,4306,4306,4306,430 6,5576,5576,5576,557 6,7256,7256,7256,725
Total AssetsTotal AssetsTotal AssetsTotal Assets 52,38452,38452,38452,384 55,08955,08955,08955,089 58,93458,93458,93458,934 61,12661,12661,12661,126 53,07753,07753,07753,077 54,89354,89354,89354,893 57,73757,73757,73757,737 60,67560,67560,67560,675
Short-Term Debt (3,511) (3,028) (3,611) (3,608) (3,608) (3,608) (3,608) (3,608)
Payables (3,031) (3,292) (3,285) (3,496) (3,296) (3,428) (3,571) (3,760)
Provisions (282) (235) (236) (236) (236) (236) (236) (236)
o/w Nuclear Liabilities - - - - - - - -
o/w Pensions - - - - - - - -
o/w Other Provisions (282) (235) (236) (236) (236) (236) (236) (236)
Other Current Liabilities (507) (819) (589) (589) (589) (589) (589) (589)
Liabilities of Businesses Held for Sale - - - - - - - -
Total Current LiabilitiesTotal Current LiabilitiesTotal Current LiabilitiesTotal Current Liabilities (7,331)(7,331)(7,331)(7,331) (7,374)(7,374)(7,374)(7,374) (7,721)(7,721)(7,721)(7,721) (7,929)(7,929)(7,929)(7,929) (7,729)(7,729)(7,729)(7,729) (7,861)(7,861)(7,861)(7,861) (8,004)(8,004)(8,004)(8,004) (8,193)(8,193)(8,193)(8,193)
Long-Term Debt (22,439) (22,882) (24,733) (27,051) (22,578) (23,473) (25,257) (26,957)
Provisions (3,948) (4,879) (4,478) (4,478) (4,478) (4,478) (4,478) (4,478)
o/w Nuclear Liabilities - - - - - - - -
o/w Pensions (2,585) (3,379) (2,995) (2,995) (2,995) (2,995) (2,995) (2,995)
o/w Other Provisions (1,363) (1,500) (1,483) (1,483) (1,483) (1,483) (1,483) (1,483)
Other Non-Current Liabilities (6,747) (7,980) (8,437) (8,437) (8,437) (8,437) (8,437) (8,437)
Total Non-Current LiabilitiesTotal Non-Current LiabilitiesTotal Non-Current LiabilitiesTotal Non-Current Liabilities (33,134)(33,134)(33,134)(33,134) (35,741)(35,741)(35,741)(35,741) (37,648)(37,648)(37,648)(37,648) (39,966)(39,966)(39,966)(39,966) (35,493)(35,493)(35,493)(35,493) (36,388)(36,388)(36,388)(36,388) (38,172)(38,172)(38,172)(38,172) (39,872)(39,872)(39,872)(39,872)
Shareholders' Equity (11,911) (11,962) (13,555) (13,222) (9,846) (10,634) (11,551) (12,601)
Minorities (8) (12) (10) (10) (10) (10) (10) (10)
Total EquityTotal EquityTotal EquityTotal Equity (11,919)(11,919)(11,919)(11,919) (11,974)(11,974)(11,974)(11,974) (13,565)(13,565)(13,565)(13,565) (13,232)(13,232)(13,232)(13,232) (9,856)(9,856)(9,856)(9,856) (10,644)(10,644)(10,644)(10,644) (11,561)(11,561)(11,561)(11,561) (12,611)(12,611)(12,611)(12,611)
Total Liabilities and EquityTotal Liabilities and EquityTotal Liabilities and EquityTotal Liabilities and Equity (52,384)(52,384)(52,384)(52,384) (55,089)(55,089)(55,089)(55,089) (58,934)(58,934)(58,934)(58,934) (61,126)(61,126)(61,126)(61,126) (53,077)(53,077)(53,077)(53,077) (54,893)(54,893)(54,893)(54,893) (57,737)(57,737)(57,737)(57,737) (60,675)(60,675)(60,675)(60,675)
Net Debt (As Reported) 21,190 23,915 25,325 27,648 22,208 24,070 25,854 27,554
Economic Net Debt 23,775 27,294 28,320 30,643 25,203 27,065 28,849 30,549
Net Debt / EBITDA (As Reported) 4.2 4.5 4.4 4.7 4.4 4.6 4.7 4.7
Economic Net Debt / EBITDA 4.7 5.1 5.0 5.2 5.0 5.1 5.2 5.2

National Grid plc
Utilities – Regulated
18
Please note that the use of this research report is subject to the conditions and restrictions set forth in the “General invePlease note that the use of this research report is subject to the conditions and restrictions set forth in the “General invePlease note that the use of this research report is subject to the conditions and restrictions set forth in the “General invePlease note that the use of this research report is subject to the conditions and restrictions set forth in the “General investmentstmentstmentstment----related related related related disclosures” and the “Legal disclaimer” at the end of this document. disclosures” and the “Legal disclaimer” at the end of this document. disclosures” and the “Legal disclaimer” at the end of this document. disclosures” and the “Legal disclaimer” at the end of this document.
For analyst certification and remarks regardinFor analyst certification and remarks regardinFor analyst certification and remarks regardinFor analyst certification and remarks regarding foreign investors and countryg foreign investors and countryg foreign investors and countryg foreign investors and country----specific disclosures, please refer to the respective specific disclosures, please refer to the respective specific disclosures, please refer to the respective specific disclosures, please refer to the respective paragraph at the end of this document.paragraph at the end of this document.paragraph at the end of this document.paragraph at the end of this document.
Disclosures in respect of Article 20 of Regulation (EU) No. 596/2014 of the European Parliament and of the Disclosures in respect of Article 20 of Regulation (EU) No. 596/2014 of the European Parliament and of the Disclosures in respect of Article 20 of Regulation (EU) No. 596/2014 of the European Parliament and of the Disclosures in respect of Article 20 of Regulation (EU) No. 596/2014 of the European Parliament and of the
Council of 16 April 2014 Council of 16 April 2014 Council of 16 April 2014 Council of 16 April 2014 on market abuse (market abuse regulation on market abuse (market abuse regulation on market abuse (market abuse regulation on market abuse (market abuse regulation ---- MAR)MAR)MAR)MAR)
CompanyCompanyCompanyCompany DisclosuresDisclosuresDisclosuresDisclosures National Grid plc no disclosures (1) Joh. Berenberg, Gossler & Co. KG (hereinafter referred to as “the Bank”) and/or its affiliate(s) was Lead Manager or Co-
Lead Manager over the previous 12 months of a public offering of this company. (2) The Bank acts as Designated Sponsor/Market Maker for this company. (3) Over the previous 12 months, the Bank and/or its affiliate(s) has effected an agreement with this company for investment
banking services or received compensation or a promise to pay from this company for investment banking services. (4) The Bank and/or its affiliate(s) holds 5% or more of the share capital of this company. (5) The Bank holds a long position in shares of this company. (6) The Bank holds a short position in shares of this company. Production of the recommendation completed: 19.01.2017, 18:03 Historical price target and rating changes for Historical price target and rating changes for Historical price target and rating changes for Historical price target and rating changes for National Grid plcNational Grid plcNational Grid plcNational Grid plc in the last 12 months in the last 12 months in the last 12 months in the last 12 months DateDateDateDate Price target Price target Price target Price target ---- GBpGBpGBpGBp RatingRatingRatingRating First dissemination GMTFirst dissemination GMTFirst dissemination GMTFirst dissemination GMT Initiation of coverageInitiation of coverageInitiation of coverageInitiation of coverage
12 May 16 970.00 Hold 2016-05-13 07:04 06 March 12
19 January 17 1050.00 Buy - Click here for a list of all recommendations on any financial instrument or issuer that were disseminated during the preceding 12-month period. BerBerBerBerenberg Equity Research ratings distribution and in proportion to investment banking services on a quarterly basis, as enberg Equity Research ratings distribution and in proportion to investment banking services on a quarterly basis, as enberg Equity Research ratings distribution and in proportion to investment banking services on a quarterly basis, as enberg Equity Research ratings distribution and in proportion to investment banking services on a quarterly basis, as of 1 of 1 of 1 of 1 January 2017January 2017January 2017January 2017 Buy 48.09 % 87.50 % Sell 13.38 % 0.00 % Hold 38.54 % 12.50 % Valuation basis/rating Valuation basis/rating Valuation basis/rating Valuation basis/rating keykeykeykey The recommendations for companies analysed by Berenberg’s Equity Research department are made on an absolute basis for which the following three-step rating key is applicable:
Buy:Buy:Buy:Buy: Sustainable upside potential of more than 15% to the current share price within 12 months;
Sell:Sell:Sell:Sell: Sustainable downside potential of more than 15% to the current share price within 12 months;
Hold:Hold:Hold:Hold: Upside/downside potential regarding the current share price limited; no immediate catalyst visible.
NB: During periods of high market, sector, or stock volatility, or in special situations, the recommendation system criteria may be breached temporarily.
Competent supervisory authorityCompetent supervisory authorityCompetent supervisory authorityCompetent supervisory authority
Bundesanstalt für Finanzdienstleistungsaufsicht -BaFin- (Federal Financial Supervisory Authority),
Graurheindorfer Straße 108, 53117 Bonn and Marie-Curie-Str. 24-28, 60439 Frankfurt am Main, Germany.
General investmentGeneral investmentGeneral investmentGeneral investment----related disclosuresrelated disclosuresrelated disclosuresrelated disclosures Joh. Berenberg, Gossler & Co. KG (hereinafter referred to as “the Bank”) has made every effort to carefully research all information contained in this financial analysis. The information on which the financial analysis is based has been obtained from sources which we believe to be reliable such as, for example, Thomson Reuters, Bloomberg and the relevant specialised press as well as the company which is the subject of this financial analysis.

National Grid plc
Utilities – Regulated
19
Only that part of the research note is made available to the issuer (who is the subject of this analysis) which is necessary to properly reconcile with the facts. Should this result in considerable changes a reference is made in the research note.
Opinions expressed in this financial analysis are our current opinions as of the issuing date indicated on this document. The companies covered by Berenberg are continuously followed by the analyst. Based on developments with the relevant company, the sector or the market which may have a material impact on the research views, research reports will be updated as it deems appropriate.
The functional job title of the person/s responsible for the recommendations contained in this report is “Equity Research Analyst” unless otherwise stated on the cover.
The following internet link provides further remarks on our financial analyses:The following internet link provides further remarks on our financial analyses:The following internet link provides further remarks on our financial analyses:The following internet link provides further remarks on our financial analyses: http://www.berenberg.de/research.html?&L=1&no_cache=1http://www.berenberg.de/research.html?&L=1&no_cache=1http://www.berenberg.de/research.html?&L=1&no_cache=1http://www.berenberg.de/research.html?&L=1&no_cache=1
Legal disclaimerLegal disclaimerLegal disclaimerLegal disclaimer This document has been prepared by Joh. Berenberg, Gossler & Co. KG (hereinafter referred to as “the Bank”). This document does not claim completeness regarding all the information on the stocks, stock markets or developments referred to in it.
On no account should the document be regarded as a substitute for the recipient procuring information for himself/herself or exercising his/her own judgements.
The document has been produced for information purposes for institutional clients or market professionals.
Private customers, into whose possession this document comes, should discuss possible investment decisions with their customer service officer as differing views and opinions may exist with regard to the stocks referred to in this document.
This document is not a solicitation or an offer to buy or sell the mentioned stock.
The document may include certain descriptions, statements, estimates, and conclusions underlining potential market and company development. These reflect assumptions, which may turn out to be incorrect. The Bank and/or its employees accept no liability whatsoever for any direct or consequential loss or damages of any kind arising out of the use of this document or any part of its content.
The Bank and/or its employees may hold, buy or sell positions in any securities mentioned in this document, derivatives thereon or related financial products. The Bank and/or its employees may underwrite issues for any securities mentioned in this document, derivatives thereon or related financial products or seek to perform capital market or underwriting services.
Analyst certificationAnalyst certificationAnalyst certificationAnalyst certification I, Andrew Fisher, hereby certify that all of the views expressed in this report accurately reflect my personal views about any and all of the subject securities or issuers discussed herein.
In addition, I hereby certify that no part of my compensation was, is, or will be, directly or indirectly related to the specific recommendations or views expressed in this research report, nor is it tied to any specific investment banking transaction performed by the Bank or its affiliates.
I, Lawson Steele, hereby certify that all of the views expressed in this report accurately reflect my personal views about any and all of the subject securities or issuers discussed herein.
In addition, I hereby certify that no part of my compensation was, is, or will be, directly or indirectly related to the specific recommendations or views expressed in this research report, nor is it tied to any specific investment banking transaction performed by the Bank or its affiliates.
I, Neha Saxena, hereby certify that all of the views expressed in this report accurately reflect my personal views about any and all of the subject securities or issuers discussed herein.
In addition, I hereby certify that no part of my compensation was, is, or will be, directly or indirectly related to the specific recommendations or views expressed in this research report, nor is it tied to any specific investment banking transaction performed by the Bank or its affiliates.
I, Oliver Brown, hereby certify that all of the views expressed in this report accurately reflect my personal views about any and all of the subject securities or issuers discussed herein.
In addition, I hereby certify that no part of my compensation was, is, or will be, directly or indirectly related to the specific recommendations or views expressed in this research report, nor is it tied to any specific investment banking transaction performed by the Bank or its affiliates.
Remarks regarding foreign investorsRemarks regarding foreign investorsRemarks regarding foreign investorsRemarks regarding foreign investors The preparation of this document is subject to regulation by German law. The distribution of this document in other jurisdictions may be restricted by law, and persons into whose possession this document comes should inform themselves about, and observe, any such restrictions.

National Grid plc
Utilities – Regulated
20
United KingdomUnited KingdomUnited KingdomUnited Kingdom This document is meant exclusively for institutional investors and market professionals, but not for private customers. It is not for distribution to or the use of private investors or private customers.
United States of AmericaUnited States of AmericaUnited States of AmericaUnited States of America This document has been prepared exclusively by the Bank. Although Berenberg Capital Markets LLC, an affiliate of the Bank and registered US broker-dealer, distributes this document to certain customers, Berenberg Capital Markets LLC does not provide input into its contents, nor does this document constitute research of Berenberg Capital Markets LLC. In addition, this document is meant exclusively for institutional investors and market professionals, but not for private customers. It is not for distribution to or the use of private investors or private customers.
This document is classified as objective for the purposes of FINRA rules. Please contact Berenberg Capital Markets LLC (+1 617 292 8200) if you require additional information.
ThirdThirdThirdThird----party research disclosures party research disclosures party research disclosures party research disclosures CompanyCompanyCompanyCompany DisclosuresDisclosuresDisclosuresDisclosures National Grid plc no disclosures (1) Berenberg Capital Markets LLC owned 1% or more of the outstanding shares of any class of the subject company by the end
of the prior month.* (2) Over the previous 12 months, Berenberg Capital Markets LLC has managed or co-managed any public offering for the subject
company.* (3) Berenberg Capital Markets LLC is making a market in the subject securities at the time of the report. (4) Berenberg Capital Markets LLC received compensation for investment banking services in the past 12 months, or expects to
receive such compensation in the next 3 months.* (5) There is another potential conflict of interest of the analyst or Berenberg Capital Markets LLC, of which the analyst knows
or has reason to know at the time of publication of this research report.
* For disclosures regarding affiliates of Berenberg Capital Markets LLC please refer to the ‘Disclosures in respect of section 34b of the German Securities Trading Act (Wertpapierhandelsgesetz – WpHG)’ section above.
CopyrightCopyrightCopyrightCopyright The Bank reserves all the rights in this document. No part of the document or its content may be rewritten, copied, photocopied or duplicated in any form by any means or redistributed without the Bank’s prior written consent.
© July 2016 Joh. Berenberg, Gossler & Co. KG

Contacts
21
Internet www.berenberg.com E-mail: [email protected]
AEROSPACE & DEFENCE CHEMICALS GENERAL MID CAP - UK (cont'd) REAL ESTATE
Ryan Booker +44 20 3753 3074 Sebastian Bray +44 20 3753 3011 Edward James +44 20 3207 7811 Kai Klose +44 20 3207 7888
Andrew Gollan +44 20 3207 7891 Rikin Patel +44 20 3753 3080 Benjamin May +44 20 3465 2667 Tina Munda +44 20 3465 2716
Charlotte Keyworth +44 20 3753 3013 Andrew Heap +44 20 3207 7918 Owen Shirley +44 20 3465 2731
Ross Law +44 20 3465 2692 TECHNOLOGY
CONSTRUCTION GENERAL RETAIL Jean Beaubois +44 20 3207 7835
AUTOMOTIVES Saravana Bala +44 20 3753 3043 Conrad Bartos +44 20 3753 3053 Josep Bori +44 20 3753 3058
Cristian Dirpes +44 20 3465 2721 Lush Mahendrarajah +44 20 3207 7896 Camilla Mazzolini +44 20 3753 3042 Georgios Kertsos +44 20 3465 2715
Alexander Haissl +44 20 3465 2749 Robert Muir +44 20 3207 7860 Michelle Wilson +44 20 3465 2663 Gal Munda +44 20 3465 2746
Paul Kratz +44 20 3465 2678 Olivia Peters +44 20 3465 2646 Richard Odumosu +44 20 3207 7851
Fei Teng +44 20 3753 3049 HEALTHCARE Tammy Qiu +44 20 3465 2673
ENERGY Scott Bardo +44 20 3207 7869
BANKS Yuriy Kukhtanych (EM) +44 20 3465 2675 Jakob Berry +44 20 3465 2724 TELECOMMUNICATIONS
Adam Barrass +44 20 3207 7923 Alistair Campbell +44 20 3207 7876 Ondrej Cabejsek (EM) +44 20 3753 3071
James Chappell +44 20 3207 7844 FOOD MANUFACTURING AND H&PC Klara Fernandes +44 20 3465 2718 Nicolas Didio +44 20 3753 3091
Andrew Lowe +44 20 3465 2743 Rosie Edwards +44 20 3207 7880 Tom Jones +44 20 3207 7877 Usman Ghazi +44 20 3207 7824
Andreas Markou (EM) +44 20 3753 3022 Yordana Mavrodieva +44 20 3207 7817 Joseph Lockey +44 20 3465 2730 Siyi He +44 20 3465 2697
Alex Medhurst +44 20 3753 3047 Philip Patricha +44 20 3753 3039 Laura Sutcliffe +44 20 3465 2669 Laura Janssens +44 20 3465 2639
Eoin Mullany +44 20 3207 7854 Fintan Ryan +44 20 3465 2748 Paul Marsch +44 20 3207 7857
Peter Richardson +44 20 3465 2681 James Targett +44 20 3207 7873 INSURANCE Michael Summerville +44 20 3207 7914
Jonathan Sharpe +44 20 3753 3031 Charles Bendit +44 20 3465 2729
FOOD RETAIL Trevor Moss +44 20 3207 7893 THEMATIC RESEARCH
BEVERAGES Batuhan Karabekir (EM) +44 20 3465 2631 Emanuele Musio +44 20 3207 7916 Nick Anderson +44 20 3207 7838
Javier Gonzalez Lastra +44 20 3465 2719 Iain Pearce +44 20 3465 2665 Asad Farid +44 20 3207 7932
Batuhan Karabekir (EM) +44 20 3465 2631 GENERAL MID CAP - DACH Sami Taipalus +44 20 3207 7866 Robert Lamb +44 20 3465 2623
Matt Reid +44 20 3753 3075 Gunnar Cohrs +44 20 3207 7894 James Sherborne +44 20 3753 3073
Martin Comtesse +44 20 3207 7878 LUXURY GOODS
BUSINESS SERVICES, LEISURE & TRANSPORT Charlotte Friedrichs +44 20 3753 3077 Mariana Horn +44 20 3753 3044 TOBACCO
Roberta Ciaccia +44 20 3207 7805 Gerhard Orgonas +44 20 3465 2635 Zuzanna Pusz +44 20 3207 7812 Jonathan Leinster +44 20 3465 2645
Najet El Kassir +44 20 3207 7836 Benjamin Pfannes-Varrow +44 20 3465 2620
Stuart Gordon +44 20 3207 7858 Julia Scheufler +44 20 3753 3016 MEDIA UTILITIES
Josh Puddle +44 20 3207 7881 Robert Berg +44 20 3465 2680 Oliver Brown +44 20 3207 7922
Kate Somerville +44 20 3753 3081 GENERAL MID CAP - EU core Laura Janssens +44 20 3465 2639 Andrew Fisher +44 20 3207 7937
Julia Winarso +44 20 3465 2627 Flavien Hias +44 20 3465 2693 Alastair Reid +44 20 3207 7841 Neha Saxena +44 20 3753 3048
Aymeric Lang +44 20 3753 3037 Sarah Simon +44 20 3207 7830 Lawson Steele +44 20 3207 7887
CAPITAL GOODS Anna Patrice +44 20 3207 7863
Nicholas Housden +44 20 3753 3050 Simona Sarli +44 20 3207 7834 METALS & MINING
Sebastian Kuenne +44 20 3207 7856 Alessandro Abate +44 20 3753 3029 ECONOMICSPhilippe Lorrain +44 20 3207 7823 GENERAL MID CAP - UK Fawzi Hanano +44 20 3207 7910 Florian Hense +44 20 3207 7859
Rizk Maidi +44 20 3207 7806 Robert Chantry +44 20 3207 7861 Yuriy Vlasov +44 20 3465 2674 Carsten Hesse (EM) +44 20 3753 3001
Horace Tam +44 20 3465 2726 Sam England +44 20 3465 2687 Kallum Pickering +44 20 3465 2672
Simon Toennessen +44 20 3207 7819 Ned Hammond +44 20 3753 3017 Holger Schmieding +44 20 3207 7889
SPECIALIST SALES UK SWITZERLAND, AUSTRIA & ITALY LONDON
AEROSPACE & DEFENCE, CAPITAL GOODS Alexandra Clément +44 20 3753 3018 Andrea Ferrari +41 44 283 2020 Assia Adanouj +44 20 3753 3087
Bruna Zugliani +44 20 3207 7818 Fabian De Smet +44 20 3207 7810 Carsten Kinder +41 44 283 2024 Mike Berry +44 20 3465 2755
AUTOMOTIVE & THEMATICS Karl Hancock +44 20 3207 7803 Gianni Lavigna +41 44 283 2038 Stewart Cook +44 20 3465 2752
Chris Armstrong +44 20 3207 7809 Sean Heath +44 20 3465 2742 Jamie Nettleton +41 44 283 2026 Mark Edwards +44 20 3753 3004
BANKS, DIVERSIFIED FINANCIALS & INSURANCE David Hogg +44 20 3465 2628 Benjamin Stillfried +41 44 283 2033 Tristan Hedley +44 20 3753 3006
Iro Papadopoulou +44 20 3207 7924 Gursumeet Jhaj +44 20 3753 3041 Peter King +44 20 3753 3139
Calum Marris +44 20 3753 3040 Peter Kaineder +44 20 3753 3062 CRM Christoph Kleinsasser +44 20 3753 3063
BUSINESS SERVICES, LEISURE & TRANSPORT James Matthews +44 20 3207 7807 Laura Cooper +44 20 3753 3065 Chris McKeand +44 20 3207 7938
Rebecca Langley +44 20 3207 7930 James McRae +44 20 3753 3036 Louise Hughes +44 20 3753 3066 Simon Messman +44 20 3465 2754
CONSTRUCTION,CHEMICALS, METALS & MINING David Mortlock +44 20 3207 7850 Jessica Jarmyn +44 20 3465 2696 AJ Pulleyn +44 20 3465 2756
James Williamson +44 20 3207 7842 Eleni Papoula +44 20 3465 2741 Edwina Lucas +44 20 3207 7908 Matthew Regan +44 20 3465 2750
CONSUMER STAPLES Bhavin Patel +44 20 3207 7926 Greg Swallow +44 20 3207 7833 Asbjoern Rogge +44 20 3753 3051
Rupert Trotter +44 20 3207 7815 Kushal Patel +44 20 3753 3038 Michael Schumacher +44 20 3753 3006
CONSUMER DISCRETIONARY Richard Payman +44 20 3207 7825 CORPORATE ACCESS Paul Somers +44 20 3465 2753
Victoria Maigrot +44 20 3753 3010 Clémence Peyraud +44 20 3465 2651 Lindsay Arnold +44 20 3207 7821
HEALTHCARE Christopher Pyle +44 20 3753 3076 Jennie Jiricny +44 20 3207 7886 EQUITY TRADINGAbigail James +44 20 3753 3078 Joanna Sanders +44 20 3207 7925 Stella Siggins +44 20 3465 2630
MEDIA & TELECOMMUNICATIONS Mark Sheridan +44 20 3207 7802 HAMBURG
Julia Thannheiser +44 20 3465 2676 George Smibert +44 20 3207 7911 EVENTS David Hohn +49 40 350 60 761
SPECIAL SITUATIONS Alexander Wace +44 20 3465 2670 Laura Hawes +44 20 3753 3008 Gregor Labahn +49 40 350 60 571
Jeremy Grant +44 20 3207 7890 Paul Walker +44 20 3465 2632 Suzy Khan +44 20 3207 7915 Lennart Pleus +49 40 350 60 596
Charlotte Kilby +44 20 3207 7832 Marvin Schweden +49 40 350 60 576
FRANCE Natalie Meech +44 20 3207 7831 Linus Weidner +49 40 350 60 798
SALES Thibault Bourgeat +33 1 5844 9505 Ellen Parker +44 20 3465 2684 Philipp Wiechmann +49 40 350 60 346
BENELUX Alexandre Chevassus +33 1 5844 9512 Sarah Weyman +44 20 3207 7801 Christoffer Winter +49 40 350 60 559
Miel Bakker +44 20 3207 7808 Dalila Farigoule +33 1 5844 9510
Martin de Laet +44 20 3207 7804 Benjamin Voisin +33 1 5844 9507 LONDON
SALES TRADING Edward Burlison-Rush +44 20 3753 3055
GERMANY SCANDINAVIA HAMBURG Richard Kenny +44 20 3753 3083
Michael Brauburger +49 69 91 30 90 741 Frederik Angel +44 20 3753 3055 Tim Storm +49 40 350 60 415
Nina Buechs +49 69 91 30 90 735 Marco Weiss +49 40 350 60 719 ELECTRONIC TRADINGAndré Grosskurth +49 69 91 30 90 734 PARIS
Florian Peter +49 69 91 30 90 740 Vincent Klein +33 1 58 44 95 09 Daniel Eichhorn +49 40 350 60 391
Joerg Wenzel +49 69 91 30 90 743 Antonio Scuotto +33 1 58 44 95 03 Matthias Führer +49 40 350 60 597
Member FINRA & SIPC E-mail: [email protected]
SALES (cont'd) CRM
SALES Michael Lesser +1 646 445 5575 Monika Kwok +1 646 445 4863 Christopher Kanian +1 646 445 5576
Enrico DeMatt +1 646 445 4845 Jessica London +1 646 445 7218 Lars Schwartau +1 646 445 5571
Kelleigh Faldi +1 617 292 8288 Ryan McDonnell +1 646 445 7214 CORPORATE ACCESS Brett Smith +1 646 445 4873
Isabella Fantini +1 646 445 4861 Emily Mouret +1 415 802 2525 Olivia Lee +1 646 445 7212 Bob Spillane +1 646 445 5574
Alexander Frankiewicz +1 646 445 4870 Peter Nichols +1 646 445 7204 Tiffany Smith +1 646 445 4874
Shawna Giust +1 646 445 7216 Kieran O'Sullivan +1 617 292 8292
Rich Harb +1 617 292 8228 Rodrigo Ortigao +1 646 445 7202 Mickey Levy +1 646 445 4842
Zubin Hubner +1 646 445 5572 Matt Waddell +1 646 445 5562 Roiana Reid +1 646 445 4865
ECONOMICS
BERENBERG CAPITAL MARKETS LLC
JOH. BERENBERG, GOSSLER & CO. KG
EQUITY SALES
EQUITY RESEARCH
EQUITY SALES SALES TRADING