National Food Policy Plan of Ac -...
232
-
Upload
phungduong -
Category
Documents
-
view
214 -
download
1
Transcript of National Food Policy Plan of Ac -...


National Food Policy Plan of Ac on and Country Investment Plan
Monitoring Report 2013
June 2013
FPMU, Ministry of Food Government of the People’s Republic of Bangladesh

This document is the result of a joint effort by the: Ministry of Agriculture Ministry of Disaster Management and Relief Ministry of Finance (Finance Division and Economic Relations Division) Ministry of Fisheries and Livestock Ministry of Food Ministry of Health and Family Welfare Ministry of Industries Ministry of Local Government, Rural Development and Cooperatives (LG Division and RDC Division) Ministry of Planning (Planning Commission, Statistics and Informatics Division and IMED) Ministry of Primary and Mass Education Ministry of Social Welfare Ministry of Water Resources Ministry of Women and Children Affairs
Coordinated by the
FPMU, Ministry of Food with technical support from the Na onal Food Policy Capacity Strengthening Programme (NFPCSP)
ISBN 978-984-33-7539-1
Published by FPMU, Ministry of Food. For copies/update on the Monitoring Report please contact: DG, FPMU – Khaddya Bhaban, 16 Abdul Ghani Road, Dhaka -1000; [email protected]
Printed by Dynamic Printers, 53/1 Arambagh, Dhaka-1000, Phone : 7192771, E-mail : [email protected]

i
Foreword
The Government of Bangladesh is committed to achieve food and nutrition security for all citizens, especially the most vulnerable. The Government adopted a comprehensive National Food Policy (NFP, 2006), aiming to enhance food availability, access and utilisation through interventions detailed in the Plan of Action (PoA, 2008-2015) and investments specified in the multi-billion dollar Country Investment Plan (CIP, 2011-2015) consistently with the Sixth Five Year Plan, the Vision 2021 and the Millennium Development Goals. The NFP, PoA and CIP articulate measurable results and required resources up to 2015. Achievements so far were internationally recognized in May 2013, when FAO awarded Bangladesh in recognition of its “notable and outstanding progress in fighting hunger”.
This report is the third in the series that monitors implementation of the PoA and CIP, and tracks progress towards the NFP goal. Production of the report was led by the Food Planning and Monitoring Unit of the Ministry of Food, in collaboration with 17 partner Ministries/ Divisions, and with technical assistance from FAO and financial support from EU and USAID, under the National Food Policy Capacity Strengthening Programme. The report drew on 32 inter-ministerial meetings; drafts were reviewed by the inter-ministerial Food Policy Working Group (FPWG), a stakeholder workshop composed of the Government, development partners, private sector and civil society; and it was discussed and endorsed by the National Committee.
The Monitoring Report 2013 shows that the high recognition accorded to food and nutrition security at the highest levels of the Government and amongst development partners continues to pay substantial dividends for the well-being of Bangladeshi people. The CIP budget is now at 9.8 billion USD, of which 6.2 billion USD is already financed; 3.3 billion USD was mobilized since the CIP was launched in 2010 of which 1.7 billion USD was in fiscal year 2011/12. The Government financed 3.9 billion USD (62%) and development partners 2.3 billion USD (38%). As funding continues growing, the challenge is to use it timely and effectively.
At the same time, the report is realistic to the situation in Bangladesh and urges for concerted efforts to do better. Rice production has intensified making the country self-sufficient, purchasing power has increased, people are consuming a broader range of foods, and exclusive breastfeeding has dramatically increased. Mixed signals exist on the NFP’s undernourishment goal; food availability needs to be more diversified, resilient and sustainable; food access needs to be broadened and stabilised; and progress on utilisation needs to be radically accelerated because despite much progress to date, regrettably still two-in-five children are stunted. The Government has taken major steps to address these challenges, including rebalancing fertilizer subsidies, greater efforts to mainstream nutrition across sectors to Scaling Up Nutrition; drafting a National Food Safety Act and scaling up investments for emergency foodgrain storage.
Much has been done, as identified in the report, and much more needs to be done, as also identified in the report. With this in mind, I am confident that this Report will inform and guide more robust actions, ideas and energies towards food and nutrition security in Bangladesh.
Dhaka, 9 June 2013 Dr. Mohammad Abdur Razzaque, MP Minister
Ministry of Food
trition securrity in Banglad
ammadddddddddddddddddddddddddddddddddddddd AAAAAAAAAAAAAAAAAAAAAAAAAAAAAAAAAAAAAbdurrrrrrrr RRRRRRRRRRRRRRRRRRRRRRRRRRRRRRRRRRRRRRRRRRRRRRRRRazzaque, M


iii
Table of contents
Foreword ............................................................................................................................................ i Acronyms .......................................................................................................................................... iv Execu ve summary ........................................................................................................................... ix 1. Introduc on .............................................................................................................................. 1 2. Approach to monitoring ............................................................................................................ 3 3. Progress towards NFP goals and outcomes ............................................................................... 7
3.1. NFP goals ................................................................................................................................. 7 3.2. NFP Objective 1 outcomes ..................................................................................................... 10 3.3. NFP Objective 2 outcomes ..................................................................................................... 17 3.4. NFP Objective 3 outcomes ..................................................................................................... 24
4. Availability: progress towards CIP and NFP PoA outputs ......................................................... 33 4.1. Programme 1: Sustainable and diversified agriculture through integrated research
and extension ........................................................................................................................ 33 4.2. Programme 2: Improved water management and infrastructure for irrigation purposes ........ 41 4.3. Programme 3: Improved quality of input and soil fertility ...................................................... 46 4.4. Programme 4: Fisheries and aquaculture development ......................................................... 53 4.5. Programme 5: Livestock development with a focus on poultry and dairy production ............. 59
5. Access: progress towards CIP and NFP PoA outputs ................................................................ 65 5.1. Programme 6: Improved access to markets, value-addition in agriculture, and
non-farm incomes ................................................................................................................. 65 5.2. Programme 7: Strengthened capacities for implementation and monitoring of the NFP
and CIP actions ...................................................................................................................... 71 5.3. Programme 8: Enhanced public food management system .................................................... 78 5.4. Programme 9: Institutional development and capacity development for more effective
safety nets ............................................................................................................................. 83 6. U liza on: progress towards CIP and NFP PoA outputs .......................................................... 91
6.1. Programme 10: Community based nutrition programmes and services.................................. 91 6.2. Programme 11: Orienting food and nutrition programmes through data ............................... 99 6.3. Programme 12: Food safety and quality improvement ......................................................... 106
7. Food security and CIP financing ............................................................................................. 113 7.1. Fiscal space for food security: budgets of key NFP partner ministries ................................... 113 7.2. CIP financing ........................................................................................................................ 117
8. Overall assessment and recommendations ............................................................................... 131 8.1. Overall assessment .............................................................................................................. 131 8.2. Recommendations ............................................................................................................... 133
Annexes ......................................................................................................................................... 137 Annex 1. Comparison of the CIP and PoA output monitoring indicators ...................................... 138 Annex 2. Composition of Thematic Teams .................................................................................. 144 Annex 3. Cost and financing of the CIP ....................................................................................... 145 Annex 3.1. CIP budget revisions .................................................................................................. 148 Annex 3.2. Number and average budget of projects in CIP 2013 by subprogramme .................... 150 Annex 3.3. CIP Budget 2013 and delivery in fiscal year 2011/12 by subprogramme .................... 152 Annex 3.4. Ongoing and completed CIP projects as of June 2012 ............................................... 156 Annex 3.5. Projects in the CIP pipeline as of June 2012 (updated Table 4.6 of CIP 2011) ............. 194
iv
Acronyms
ADP Annual Development Programme AEU Aid Effectiveness Unit AI Artificial Insemination AIS Agriculture Information Service AIMS Aid Information Management System ANC Antenatal Care AusAid Australian Agency for International Development AoI Area of Intervention ATIs Agricultural Training Institutions BADC Bangladesh Agricultural Development Corporation BARD Bangladesh Academy for Rural Development BARC Bangladesh Agricultural Research Council BARI Bangladesh Agricultural Research Institute BAU Bangladesh Agricultural University BB Bangladesh Bank BBF Bangladesh Breastfeeding Foundation BBS Bangladesh Bureau of Statistics BCC Behavioural Change Communication BCIC Bangladesh Chemical Industries Corporation BDHS Bangladesh Demographic and Health Survey BER Bangladesh Economic Review BHE Bureau of Health Education BFDC Bangladesh Fisheries Development Corporation BFRI Bangladesh Fisheries Research Institute BIDS Bangladesh Institute of Development Studies BIHS Bangladesh Integrated Household Survey BINA Bangladesh Institute of Nuclear Agriculture BIRDEM Bangladesh Institute of Research and Rehabilitation in Diabetes, Endocrine and
Metabolic Disorders BJRI Bangladesh Jute Research Institute BLRI Bangladesh Livestock Research Institute BMDA Barendra Multipurpose Development Authorities BMS Breast Milk Substitutes BRAC Bangladesh Rural Advancement Committee BRDB Bangladesh Rural Development Board BRRI Bangladesh Rice Research Institute BSRI Bangladesh Sugarcane Research Institute BSTI Bangladesh Standards and Testing Institute BWDB Bangladesh Water Development Board CARS Centre for Advanced Research in Sciences CBN Cost of Basic Needs CD Cooperative Department CDC Centre for Disease Control CED Chronic Energy Deficiency CFPR Challenging the Frontiers of Poverty Reduction CIMMYT International Maize and Wheat Improvement Center

v
CPI Consumer Price IndexCPRC Chronic Poverty Research Center CIP
Country Investment Plan : A Roadmap Towards Investment in Agriculture, Food Security and Nutrition
CMAM Community Management of Acute MalnutritionCMNS Child and Mother Nutrition Survey CNU Child Nutrition Units CSISA Cereal Systems Initiative for South Asia DAE Department of Agricultural ExtensionDAM Department of Agricultural Marketing DAMA Department of Agricultural Marketing and Agribusiness DCI Direct Calorie Intake DDP Desirable Dietary Pattern DEI Dietary Energy Intake DES Dietary Energy Supply DFID UK Department for International Development DGFP Directorate General of Family Planning DGHS Directorate General of Health Services DoF Department of Fisheries DoForestry Department of Forestry DLS Department of Livestock Services DMB Disaster Management Bureau DPHE Department of Public Health EngineeringDP Development Partner DPP Development Project Proposal DRF Development Result Framework (of the 6th FYP) DRR Directorate of Relief and Rehabilitation DSS Department of Social Services DU Dhaka University DWA Department of Women AffairsECRRP Emergency 2007 Cyclone Recovery and Restoration Project EGP Employment Generation Programme EEP Economic Empowerment of the Poorest EKN Embassy of the Kingdom of NetherlandsERD Economic Relations Division EU European Union FAO Food and Agriculture Organization FBCCI Federation of Bangladesh Chambers of Commerce and Industry FCD Food Composition DatabaseFCT Food Composition Tables FPMC Food Planning and Monitoring Committee FPMU Food Planning and Monitoring Unit FPWG Food Policy Working Group FSNIS Food Security and Nutrition Information SystemFSNSP Food Security Nutritional Surveillance Programme FYP Five Year Plan GAFSP Global Agriculture and Food Security Programme GAM Global Acute Malnutrition
vi
GHP Good Hygienic Practices GDP Gross Domestic Product GIZ Gesellschaft für Internationale Zusammenarbeit GoB Government of Bangladesh GMP Good Manufacturing PracticesGR Gratuitous Relief HACCP Hazard Analysis and Critical Control Point HFSNA Household Food Security and Nutrition Assessment HIES Household Income and Expenditure Survey HILIP Haor Infrastructure and Livelihood Improvement Project HKI Helen Keller International HPNSDP Health, Population and Nutrition Sector Development Programme HSDP Health Sector Development Programme IAPP Integrated Agricultural Productivity Project IEC Information, Education and Communication IDA Iron Deficiency Anemia ICDDR,B International Centre for Diarrhoeal Disease and Research, Bangladesh ICN International Conference on Nutrition ICT Information and Communication Technology IDD Iodine Deficiency Disorders IEDCR Institute of Epidemiology, Disease Control and Research IFA Iron Folate Supplementation IFAD International Fund for Agricultural Development IPC Integrated Phase Classification IFPRI International Food Policy Research Institute IPCC Intergovernmental Panel on Climate Change IPPC International Plant Protection Convention IPH Institute of Public Health IPHN Institute of Public Health and Nutrition IPM Integrated Pest Management IMCI Integrated Management of Childhood Illness IMED Implementation Monitoring and Evaluation Division INFS-DU Institute of Nutrition and Food Science – Dhaka University IYCF Infant and Young Child Feeding JICA Japan International Cooperation Agency LANSA Leveraging Agriculture for Nutrition in South Asia LCG-AFSRD Local Consultative Group on Agriculture, Food Security and Rural Development LGD Local Government Division LGED Local Government Engineering Department LPL Lower Poverty Line MAPP Micro-enterprise and Agricultural Promotion Project MCHTA Ministry of Chittagong Hill Tracts Affairs MICS Multiple Indicator Cluster Surveys MoA Ministry of AgricultureMoC Ministry of Commerce MoDMR Ministry of Disaster Management and Relief MoEF Ministry of Environment and ForestsMoF Ministry of Finance
vii
MoFood Ministry of Food MoFL Ministry of Fisheries and Livestock MoHFW Ministry of Health and Family Welfare MoI Ministry of Industries MoLGRD&C Ministry of Local Government, Rural Development and Cooperatives MoP Muriate of Potash MoWR Ministry of Water Resources MoSW Ministry of Social Welfare MoWCA Ministry of Women and Children Affairs MTBF Medium Term Budgetary Framework NAEP National Agricultural Extension Policy NAPA National Adaptation Programme of Action NARS National Agricultural Research System NC National Committee NCD Non Communicable Diseases NCHS National Center for Health Statistics NFP National Food Policy NFPCSP National Food Policy Capacity Strengthening Programme NFP PoA National Food Policy Plan of Action NFNP National Food and Nutrition Policy NHSBD Nutrition, Health and Demographic Survey of Bangladesh NIPU Nutrition Information Management Unit NMSS National Micronutrient Status Survey NPAN National Plan of Action for Nutrition NGOs Non Governmental Organizations NNP National Nutrition Programme NNS National Nutrition Services NSAPR National Strategy for Accelerated Poverty Reduction NSDS National Strategy for Development of Statistics NSPS National Social Protection Strategy NSS National Statistical System NWG Nutrition Working Group OMS Open Market Sales OP Operational Plan ORS Oral Rehydration Solution PA Project Assistance PMO Prime Minister’s Office PoA Plan of Action PRSP Poverty Reduction Strategy Paper RDA Rural Development Academy RDCD Rural Development and Cooperatives Division RDRS Rangpur Dinajpur Rural Service REACH Renewed Efforts Against Child Hunger REOPA Rural Employment Opportunities for Public Assets RGS Research Grants Scheme of the NFPCSP SAAO Sub-Assistant Agricultural Officer SAARC South Asian Association for Regional Cooperation SAFANSI South Asia Food and Nutrition Security Initiative
viii
SAM Severe Acute MalnutritionSFYP Sixth Five Year Plan SMART Specific, measurable, achievable, relevant and time-bound SMILE Sustainable Market Infrastructure for Livelihoods Enhancement SPA Strategic Partnership Arrangement SPEMP Strengthening Public Expenditure Management Programme SPRING Strengthening Partnerships, Results and Innovations in Nutrition Globally SRDI Soil Resource Development Institute SSN Social Safety Net SUN Scaling Up NutritionTPP Technical Assistance Project Proposal TSP Triple Super Phosphate TT Thematic Team TVET Technical and Vocational Education and TrainingUNDP United Nations Development Programme UNICEF United Nations Children’s Fund UPL Upper Poverty Line USAID United States Agency for International Development USG Urea Super Granule VGD Vulnerable Group Development VGF Vulnerable Group Feeding WFP World Food Programme
ix
Executive summary
The National Food Policy (NFP) provides strategic guidance for achieving food and nutrition security in Bangladesh. The NFP Plan of Action (PoA) translates this into 26 Areas of Intervention (AoI) for the period 2008 to 2015. The Bangladesh Country Investment Plan: A road map towards investment in agriculture, food security and nutrition (CIP) identifies 12 investment programs to ensure implementation of the PoA. Implementation mechanisms and responsibilities across Government are specified in the NFP PoA Section I.4 and Part II, respectively.
Progress towards NFP goals The goal of the NFP is to ensure dependable, sustained food security for all people of the country at all times. According to FAO estimates, in Bangladesh the MDG hunger target has been reached in terms of proportion of people below the minimum level of dietary energy consumption (under-nourishment), but has slowly worsened since the PoA began implementation, despite a slight improvement in the monitored year. At national level progress in this indicator is measured through the DCI poverty estimates. These have not been made available from the HIES 2010, but projecting the trend emerging from the previous two HIES surveys, the undernourishment target appears to be out of reach. The other two indicators to measure progress towards the NFP goal - underweight and stunting amongst under-5 year old children- have continued to decline and the targets fixed for 2015 appear achievable if the past rates of decline are sustained.
In the Results Framework of the SFYP, progress towards targets on CBN poverty declined in 2010 with no estimates available after then (although some drivers of poverty reduction appear to have slowed – see Chapter 3); growth was registered in agricultural GDP and rice wage, but these are lower than previous years and below their targets; and government spending on social protection as a share of GDP dropped and was below target. In sum, a number of points of caution in the assessment for 2011/12, against a backdrop of successes in earlier years, indicate the importance to protect previous gains and to re-double efforts to ensure that the pace of progress is sufficient to achieve NFP targets by the 2015 deadline.
Progress towards NFP outcomes Availability: Agricultural GDP (excluding forestry) growth slowed in 2011/12 and was below target, mainly owing to slower cereal production growth. Rice import dependency decreased steadily, consistent with the Government’s self-sufficiency objective, and instability of rice production decreased to its lowest yet, but both remain above their targets of 0%. The share of rice value added in total food value added declined over the last year but shows no clear trend since the PoA began implementation, and hence little indication of diversification.
Recommendations for further actions in this area include the need to: Promote intensification, sustainability and resilience to ensure rice production
growth outpaces consumption growth through productivity gains rather than land expansion;
Bring more unused land under cultivation in coastal areas;

x
Scale up diversification into fisheries, livestock and high value crops through a range of interventions in the value-chain from the producer to the consumer;
Better tailor interventions towards small and marginal farmers, particularly for production diversification;
Promote research and extension towards climate change adaptation; Conserve soil fertility, arable land and groundwater; Promote agricultural mechanization to address emerging agricultural labour scarcity.
Access: Poverty continued to decline by 1.7% per year. There has been little improvement in income inequality. The annual change in national wages expressed in terms of rice increased. Food inflation declined and fell below general inflation in 2011/12. Men still earn more than women, although a marginal decline was registered.
Recommendations for further actions in this area include the need to: Promote people's right to food in line with the Constitutional provisions and
international treaty obligations; Protect migrants, including rural-to-urban migrants; Address regional and seasonal dimensions of poverty and shocks; Increase decent employment, particularly in non-farm sectors, through skill
development; Reduce income inequality through pro-poor growth and asset creation.
Utilisation: The share of dietary energy supply and intake from cereals remains far above their recommended targets of 60%. Average caloric intake is below requirements and increased only slightly in 15 years. Women’s chronic energy deficiency reduced. The proportion of children receiving minimum acceptable diet decreased using the stricter definition of complementary feeding. However, recent surveys show some improvement. The increasing trend in consumption of iodized salt has slowed in recent years, and there are concerns about quality assurance.
Recommendations for further actions in this area include the need to: Strengthen implementation of National Nutrition Services through better multi-
sectoral coordination; Enhance women’s role in agriculture and nutrition; Implement the Non Communicable Disease strategy; Ensure food safety and promote hygiene.
Output monitoring: CIP programmes and associated NFP PoA Areas of Intervention Research and extension: The development of new crops varieties accelerated for rice, wheat, pulses, vegetables and potato, remained stable for oilseeds and decelerated for fruit and maize. There was little change in the numbers of farmers trained on sustainable agricultural practices. The share of rice in total cropped area remained stable while the area planted with HYV rice continued expanding, though at a reduced speed. Production growth slowed down for rice and wheat, but picked up for vegetables. A bumper harvest was registered for maize. What little agricultural diversification occurred in the past decade has been between paddy and minor crops.

xi
Recommendations for further actions in this area include the need to: Strengthen research sustainably and effectively implement the Bangladesh
Agricultural Research Vision 2030 and the Bangladesh Agricultural Research Council Act 2011;
Improve agricultural extension services, especially on technology adoption, community-based learning and promotion of sustainable agriculture, including implementation of the Southern Delta Master Plan;
Strengthen human and infrastructural capacities of organizations engaged in the delivery of extension services, and effectively implement the National Agricultural Extension Policy 2012;
Increase public spending in agricultural research, which is low in Bangladesh compared to neighbouring countries;
Strengthen linkages among research, extension, education and farmers, and; Strengthen the One Stop Service Centre, farmers’ participation and the use of ICT in
extension services. Water management and irrigation: The area cropped under irrigation has increased whilst the contribution of surface water fell and the groundwater table deepened since 1981, although the situation improved slightly in 2011. The share of irrigation in boro production cost declined since 2007/08.
Recommendations for further actions in this area include the need to: Enhance river water flow through dredging and international water-sharing treaty; Promote sustainable and efficient groundwater use by formulating detailed water
budgets for main water basins; gradually shifting farmers from boro to higher value crops in critical basins; managing aquifer recharge and adapting it to different contexts nationwide; conserving water in canals, ponds, khals, and water bodies; reducing salinity and its impact in the South; and quantifying and qualifying arsenic and other physical, chemical and biological contaminants to develop prevention and mitigation options;
Control flood and river erosion through floodplain zoning, planned urbanization, restoration of abundant channels, dredging of rivers and streams, increased elevations of roads and village platforms, building of efficient storm sewer systems, establishment of buffer zones along rivers, conservation tillage, controlled runoff near construction sites, adjustment of life-style and crop patterns, good governance, and improvement in flood warning/preparedness systems.
Inputs and soil fertility: Year-on-year fluctuations in the supply of improved seed as a percentage of agronomic requirements have persisted since 2007/8, although the supply increased between 2010/11 and 2011/12 for all monitored crops except rice, maize and vegetables. Seed quality remains an issue. Fertilizer subsidies - the largest element of public expenditure in agriculture- increased from 35.3 billion taka in 2007/08 to 69.5 billion taka in 2011/12 and allocation was substantially rebalanced among the various nutrients. This has positively influenced fertilizer use and is reflected in the mixed trends observed for the share of supply relative to agronomic requirement: reductions in urea increases in TSP with a significant convergence since the baseline. Yields have increased for most crops. Among fruits, relatively high yield variability is observed: while growth prevailed for guava and

xii
mango, yields declined for pineapple, jackfruit and, quite consistently for banana. Agricultural credit disbursement continues to increase substantially year-on-year.
Recommendations for further actions in this area include the need to: Strengthen production and distribution of quality seed, particularly through capacity
strengthening of the Bangladesh Agricultural Development Corporation and Seed Certification Agency;
Reinforce quality control and promote private sector participation in production and distribution of improved seeds as well as in establishing voluntary certifications;
Train farmers on quality seed production; Rebalance fertilizer subsidy and move towards ensuring quality of supply and quality
controls; Strengthen training on balanced fertiliser use, and promote USG technology and
organic fertilizer; Improve pest management by scaling up efforts of DAE and other extension
agencies; Reintroduce crop insurance as a potential risk management strategy against extreme
shocks.
Fisheries and aquaculture: Fishery expanded faster than other agricultural subsectors, with the share of fishery value added on agricultural GDP increasing by 0.6 percentage point and reaching almost a quarter of total agricultural value added. This is an encouraging sign of diversification. Fish production was one of the best since the PoA baseline year, with a growth of 6.5%, and with significant exports.
Recommendations for further actions in this area include the need to: Increase productivity through improved technology, better management and further
investment in the sector; Implement a national breeding plan and law on hatchery management, to prevent
genetic deterioration, which is a main obstacle to increasing aquaculture production; Enhance extension and training based on well-defined roles for fishers, fish farmers,
shrimp farmers, aratdars, wholesalers, transporters, depot holders, processors, retailers, fish vendors, and other market actors;
Strengthen the Bangladesh Fisheries Research Institute and the Bangladesh Fisheries Development Corporation;
Reinforce community based co-management for sustainable wet lands management and maximize the role of fishery in livelihoods of the poor;
Minimize the impacts of shrimp culture on soil quality and biodiversity; Promote alternate rice-fish farming system through an integrated approach
cognizant of the interactions between rice cultivation, other crop cultivation, and fish farming in line with small holder livelihood strategies;
Manage effectively open water fisheries resources.
Livestock development: Livestock production increased. The share of livestock value added in agriculture GDP (excluding forestry) remained unchanged at 14.1% in 2011, in contrast with slow decline observed previously. Encouraging growth was observed for the production of eggs, milk and meat. Poultry death due to highly pathogenic avian influenza dropped markedly in 2011/12 after booming in 2009/10 and 2010/11. Artificial insemination, a key

xiii
factor for improving livestock breeds, accelerated in 2011/12, after a slow-down observed in 2010/11, confirming an overall satisfactory progress since 2007/08.
Recommendations for further actions in this area include the need to: Ensure supply of quality feed and fodder, especially by better enforcement of the
Animal and Fish Feed Act, establishment of testing laboratories and use of Government and other fallow land;
Diversify supply and monitor private sector production and marketing of vaccines; Initiate properly monitored cross breeding and selective breeding programmes; Improve the productivity of goats, recognizing that programmes for scientific
breeding, genetic improvement and conservation of local goat are practically absent; Improve bio-security in poultry farms as well as in markets; Improve marketing of livestock and livestock products and development of the value
chain.
Access to markets and value addition: There is an observable increase in the mark-up of retail on farm gate prices between 2010/11 and 2011/12. The price mark-up for fertilizers remains relatively stable. The number of rural markets developed in 2011/12 declined compared to the exceptionally high number registered in 2010/11. Wage difference between males and females in agriculture continued declining slightly, but still remains around 40%. Growth of value added in small scale manufacturing exceeded overall GDP growth. The provisional real GDP growth rate of small scale manufacturing stands at 7.1% in 2011-12, well above the final estimate of growth in 2010/11, which is unusually low compared to the average annual performance. Enrolment of students in technical and vocational education and training continued to increase from 89,637 in 2007-08 to 144,904 in 2011-12, representing an annual average increase by about 12%.
Recommendations for further actions in this area include the need to: Develop and maintain rural marketing and transportation infrastructure; Further reinforce synergies between infrastructure development and safety net
programmes; Promote development of cold storage and transportation facilities; Expand skill development facilities focusing on non-crop and non-agricultural
activities; Minimize wage differentials between males and females in agriculture; Strengthen farmers’ organizations to ensure remunerative prices to farmers.
Implementation and monitoring of the NFP and CIP: The Government’s institutional arrangements are operating for implementing, coordinating and monitoring the NFP PoA and CIP, with TT meetings regularly held. Although CIP delivery increased from 48% in 2010/11 to 51% in 2011/12 of the available funds, it is slower than required. During 2011/12, 65 new projects were initiated, valued at 1,591 million USD, out of a total additional financing of 1,712 million USD, with revisions to the budgets of ongoing projects accounting for the balance of 121 million USD. Additional resources mobilised under newly initiated and ongoing projects increased from 1,616 million USD to 1,712 million USD.
Recommendations for further actions in this area include the need to: Increase efforts to institutionalise the annual monitoring process within FPMU; Increase efforts to scale up and strengthen implementation of the CIP and PoA;

xiv
Increase awareness and build capacity of GoB and DPs on input data coverage timeliness, consistency and accuracy;
Strengthen capacity for the inclusion of civil society and community based organisations in the implementation of the CIP.
Public food management: Public foodgrain storage capacity has increased to manage price volatility induced by vulnerability to natural disasters and fluctuations in price increases. Effective grain storage capacity increased, reaching 1.62 million metric tons in 2011/12 with a significant increase on the previous year that constitutes acceleration in the slowly increasing trend observed since the food price crises. Actual annual domestic procurement has varied over the past years. In 2011/12, total procurement was 0.98 million metric tons (mmt) compared to 0.56 mmt in 2010/11 and 1.20 mmt in 2009/10. Open market sales (OMS) has contributed to stabilizing consumer prices and after a considerable scaling up during the price surge of 2010/11, has been reduced in 2011/12.
Recommendations for further actions in this area include the need to: Expedite construction of enhanced storage facilities; Introduce country-wide computerized food stock monitoring system; Estimate annual private foodgrain stocks for effective food planning; Develop an effective early warning information system; Increase effectiveness of domestic procurement.
Effective safety nets: Social safety net spending is shrinking as a share of GDP, total Government spending and total social protection spending. Budget coverage of VGF decreased, while the VGD remained steady. The quantity of food distributed under VGF and GR increased from 147,853 MT in 2010/11 to 209,367 MT in 2011/12. Using HIES 2010 data on SSNPs, 9.9% are poor beneficiary households, 56.6% are non-poor non-beneficiary households; on average beneficiary households received less than 100 taka per month, and if the benefits were deducted, the poverty rate would increase by 2 percentage points.
Recommendations for further actions in this area include the need to: Simplify targeting criteria and reduce leakages; Finalise the National Social Protection Strategy; Enhance capacity to implement safety nets; Adjust safety net interventions to enhance resilience to climate change; Enhance safety nets operations during lean seasons; Integrate graduation strategies into safety net programmes; Design social protection interventions to support migration.
Community-based nutrition: Exclusive breastfeeding for the first six months increased, helped by paid maternity leave for 6 months, part time work arrangements, facilities for expressing and storing breast milk and breastfeeding breaks. Home gardens need enhanced resilience to land degradation, water scarcity, bio-security (especially avian flu), and climate change to support its further expansion. Dietary energy supply is not diversifying. Average per capita consumption of all food groups, except cereals, increased between 1995 and 2010. Acute malnutrition (wasting) slightly improved, while severe wasting deteriorated. Marginal progress is noted for antenatal coverage. Bangladesh is an exemplary case of the increasing momentum for nutrition advocacy that is fostering and supporting Government

xv
commitment to SUN. Joint government and research initiatives, notably the CGIAR research programme, LANSA, SAFANSI, MDGF Programme and SPRING are examples of nutrition sensitive interventions in agriculture.
Recommendations for further actions in this area include the need to: Scale up Infant and Young Child Feeding practices; Strengthen biodiversity for healthy diets and nutrition, including indigenous foods
and species; Promote school feeding and nutrition gardens; Ensure implementation of the BMS code; Revitalize of Baby Friendly Hospital Initiative to promote, protect and support
breastfeeding; Strengthen fortification initiatives and the National Fortification Alliance.
Data for improved nutrition: The number of BCC activities increased in 2011/12. Desirable dietary patterns have been established and food consumption tables have been updated through research commissioned by FPMU and technically supported by NFPCSP–FAO. Several new sources of survey data and analyses are available. FSNSP is now working towards a sustainable institutionalization plan to integrate surveillance into the activities of BBS, FPMU, NNS and related partners.
Recommendations for further actions in this area include the need to: Monitor impacts of food security and nutrition interventions; Promote convergence among information systems; Institutionalize food security and nutrition surveillance; Use evidence based research for promoting BCC programmes; Promote food based dietary guidelines to inform policies and actions.
Food safety and quality: The certification of enlisted foods reduced from 64 in 2010/11 to 12 in 2011/12. Greater capacity in BSTI and other agencies would increase progress in food certification. A decline in diarrhoea is observed, although it still caused 2% of under-5 deaths during 2007-11. Almost universal coverage has been reached for safe water supply for domestic use. Access to safe drinking water increased to 98% nationally, and 88% in arsenic affected areas. Both poor and non-poor households have harmful concentrations of heavy metals in their foods, although this varies depending upon where food is grown and marketed.
Recommendations for further actions in this area include the need to: Activate CODEX focal point and ensure compliance to standards; Finalize and enact the new Food Safety Act, 2013; Seek approval of the National Food Safety and Quality Policy and of the National
Food Safety Emergency Response Plan; Promote effective utilization of national food safety testing facilities; Scale up healthy street food vending.
The CIP 2013: Financial input monitoring Budgets of key NFP partner ministries and divisions in total GoB expenditure shrunk to 29%, its lowest share since the start of PoA implementation. The CIP 2013 totals 9.8 billion USD, of which 6.2 billion USD is completed or ongoing, and 3.6 billion USD is in the pipeline, of
xvi
which 2.5 billion USD is marked as priority pipeline. Marginal progress is noted in the implementation rate – cumulative delivery stands at 1.7 billion USD out of 6.2 billion USD financed. In addition, 218 million USD of investments is already committed to ongoing projects continuing beyond 2015, of which 45% is for availability, 29% for access and 26% for utilisation.
Availability accounts for 56% of the value of financed projects and 65% of the value of pipeline projects – the respective figures of access are 39% and 33%, and for utilisation 6% and 2%, respectively. The GoB has invested into the CIP 1.65 dollars for every dollar invested by DPs – and for availability this ratio is 2, for access it is 1.62 and for utilisation it is just 0.26.
DPs reported that they contributed to the CIP 2.6 billion USD, of which 55% went to the availability pillar, 37% to the access pillar and 8% to the utilisation pillar. In addition, DPs have committed a total of 737 million USD to food and nutrition security projects outside the ADP, and therefore outside the CIP. Future potential contributions to the CIP, indicated as of 1 July 2012 by DPs, totalled 1.6 billion USD, of which 22% was towards availability, 69 % towards access and 9 % towards nutrition.
The monitoring exercise In preparing the Monitoring Report 2013: National Food Policy Plan of Action and Country Investment Plan (CIP), a results-oriented monitoring approach was adopted, coherent with the national planning processes in place, namely the national MDGs and the SFYP results framework. A four-level results chain was defined whereby NFP goals are articulated into outcomes/impacts that are expected to result from outputs, which are in turn generated from inputs. Monitoring indicators have been chosen at each level, within the data available, against SMART criteria: Specific, Measurable, Achievable, Relevant and Time-bound. These provide targets, baselines and proxy indicators for performance. Institutional framework for monitoring Bangladesh’s institutional structure on food security and nutrition provides coordination at different levels, including for monitoring. The Food Planning and Monitoring Committee (FPMC) provides strategic orientation and establishes a high-level commitment to inter-sectoral collaboration. The National Committee (NC) is tasked with overseeing CIP implementation and monitoring processes. The Food Policy Working Group (FPWG) is the mechanism for coordinating collaboration at the technical and operational level through the four Thematic Teams (TTs) that execute the monitoring process. The FPMU provides support to the unified framework. In addition to this, GoB agencies involved in running programmes pertaining to the CIP (over 30) as well as DPs provide inputs towards the CIP financial monitoring.
1
1. Introduction
The policy framework The National Food Policy (NFP) endorsed by the Food Planning and Monitoring Committee (FPMC), and thereafter approved by the Cabinet in August 2006, provides strategic guidance to address the key challenges facing Bangladesh in achieving food security in all its dimensions, including food supply and availability; physical, social and economic access to food; and nutrition and utilization of food, as embedded in its three core objectives: - NFP Objective 1: Adequate and stable supply of safe and nutritious food - NFP Objective 2: Increased purchasing power and access to food of the people - NFP Objective 3: Adequate nutrition for all individuals, especially women and children
The overall goal of the NFP is to ensure dependable food security for all people at all times.
The NFP Plan of Action (PoA) translates the provisions of the NFP into 26 strategic Areas of Intervention (AoI) to be implemented over the period 2008-2015. The PoA identifies responsible actors (government and non-government) and suggests policy targets and indicators for monitoring progress. The document also provides guidelines regarding inter-ministerial coordination, and sectoral planning and budgeting, with a view to promoting implementation effectiveness. It also outlines a strategy for monitoring progress.
The Bangladesh Country Investment Plan: A road map toward investment in agriculture, food security and nutrition (CIP) is a five-year comprehensive investment plan identifying 12 programmes articulated in 40 subprogrammes and a large number of projects to be executed from 1 July 2010 to 30 June 2015 to ensure implementation of the PoA. It is a country-led planning, fund mobilization and alignment tool. It supports increased, effective public investment to increase and diversify food availability in a sustainable manner and improve access to food and nutrition security. The CIP only covers public investments under the Annual Development Plan of the Government of Bangladesh but it is designed in such a way to leverage investment by private sector food security actors and smallholders in particular.
The CIP was developed in 2010 and discussed in the Bangladesh Food Security Investment Forum held in Dhaka on 26th and 27th May 2010 with the inauguration of the event by H.E. the Prime Minister Sheikh Hasina. It was further developed through a wider consultation process involving main stakeholders in Government, civil society and development partners that resulted in the publication of a revised version in June 2011. The CIP has been conceived as a living document. Indeed, while the structure of main programmes and subprogrammes remains unchanged, the number of projects and related financial resources are in continuous evolution. The monitoring exercise contributes to animate and take stock of this evolution, keeping the CIP budget updated, based on progress against its results’ framework and needs emerging from a changing context.
The CIP is anchored in the policy, programmatic and financial framework of Bangladesh: (i) it is the investment arm of the National Food Policy (NFP, 2006) and its Plan of Action (PoA, 2008-2015); (ii) it is embedded in the Sixth Five Year Plan (SFYP); (iii) it is a strong advocacy and financial tool for increased resource allocation from the budget (through the Government process) and development partners (DPs). The CIP benefited from the commitment at the national level to food security and nutrition expressed in the Scaling up Nutrition Movement (SUN). The CIP provides a coherent set of 12 priority investment programmes to improve food security and nutrition in an integrated way.

2
Introducing the monitoring exercise The establishment of an effective monitoring system enables policy-makers to timely assess progress towards the achievements of NFP goals, objectives and sectoral targets, and to take corrective action, if required. This guided the formulation of the National Food Policy Plan of Action (PoA) and is reflected in the National Food Policy Plan of Action (2008-2015) Monitoring Report 2010, which among others, served to inform the Government of Bangladesh in the elaboration of the CIP.
The monitoring framework of the CIP is built upon the NFP PoA monitoring framework, and monitoring of the NFP PoA and the CIP is embedded into Programme 7 of the CIP. Monitoring two policy documents jointly required careful thinking on how to organize the exercise to ensure adequate coverage and consistency. An approach for jointly monitoring the CIP and PoA was designed and implemented for the Monitoring Report 2012, and since it was found to be successful, the same approach was used for the monitoring conducted for this report.
A Roadmap for Producing the 2013 CIP and NFP PoA Monitoring Report1 was elaborated over the summer of 2012 by the NFPCSP Technical Assistance Team, in consultation with the Thematic Teams (TTs) and the FPMU. The document was presented and discussed with the TTs and FPMU staff during a training workshop on ‘Monitoring Food Security Framework in Bangladesh’ held in October 2012. Based on the assessment of the activities conducted in 2012, the workshop refined the approach, indicators and monitoring responsibilities, and enabled participants to be effectively involved in the monitoring exercise as a learning process to independently and sustainably carry out the monitoring process. Description of this report The report presents data and analysis on the selected indicators of goals, outcomes and outputs for 2011/12 (the monitored year) and previous years, including 2007/08 (the PoA baseline) and 2009/10 (the CIP baseline). For inputs, the report presents data and analysis on financial commitments for the period 1 July 2010 to 30 June 2015, updated as of the second financial year after the start of the CIP.
Chapter 2 describes the approach taken to jointly monitor the NFP PoA and CIP. Chapter 3 assesses progress towards NFP Goals and NFP Objectives related to food availability, food access and food utilization. Chapter 4, 5 and 6 monitor, respectively, the five CIP programmes that contribute to food availability, the four CIP programmes that contribute to food access and the three CIP programmes that contribute to food utilisation and improved nutrition. Each chapter assesses progress towards achievement identified in the CIP and PoA result frameworks, reviews policy developments/programmes underway and identifies needs for further action. Chapter 7 monitors financing of food and nutrition security by the GoB and DPs under the CIP. The report ends in Chapter 8 with an overall assessment of progress and recommendations based on the analysis carried out. Annexes present the full CIP database updated for 2013.
___________________________________________________________________________ 1 http://www.nfpcsp.org/agridrupal/content/roadmap-producing-cip-and-nfp-poa-monitoring-report-2013
3
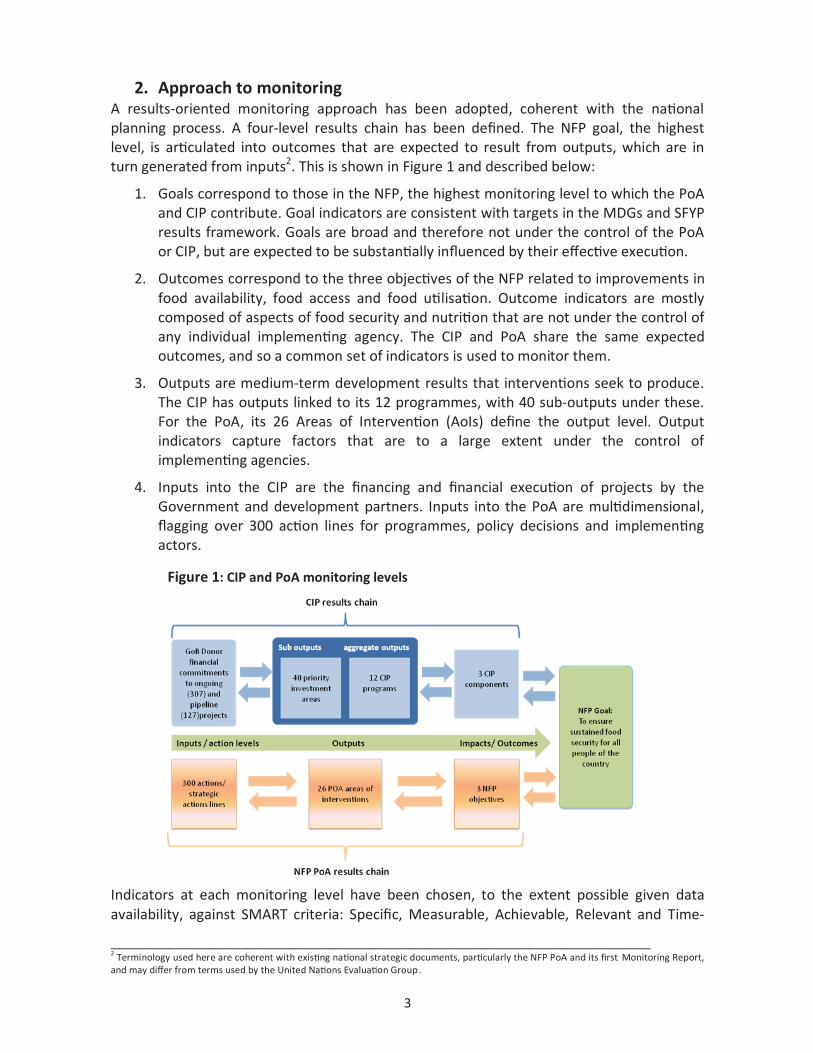
2. Approach to monitoring A results-oriented monitoring approach has been adopted, coherent with the national planning process. A four-level results chain has been defined. The NFP goal, the highest level, is articulated into outcomes that are expected to result from outputs, which are in turn generated from inputs2. This is shown in Figure 1 and described below:
1. Goals correspond to those in the NFP, the highest monitoring level to which the PoA and CIP contribute. Goal indicators are consistent with targets in the MDGs and SFYP results framework. Goals are broad and therefore not under the control of the PoA or CIP, but are expected to be substantially influenced by their effective execution.
2. Outcomes correspond to the three objectives of the NFP related to improvements in food availability, food access and food utilisation. Outcome indicators are mostly composed of aspects of food security and nutrition that are not under the control of any individual implementing agency. The CIP and PoA share the same expected outcomes, and so a common set of indicators is used to monitor them.
3. Outputs are medium-term development results that interventions seek to produce. The CIP has outputs linked to its 12 programmes, with 40 sub-outputs under these. For the PoA, its 26 Areas of Intervention (AoIs) define the output level. Output indicators capture factors that are to a large extent under the control of implementing agencies.
4. Inputs into the CIP are the financing and financial execution of projects by the Government and development partners. Inputs into the PoA are multidimensional, flagging over 300 action lines for programmes, policy decisions and implementing actors.
Indicators at each monitoring level have been chosen, to the extent possible given data availability, against SMART criteria: Specific, Measurable, Achievable, Relevant and Time-
___________________________________________________________________________ 2 Terminology used here are coherent with existing national strategic documents, particularly the NFP PoA and its first Monitoring Report, and may differ from terms used by the United Nations Evaluation Group.
Figure 1: CIP and PoA monitoring levels
4
bound. These provide targets, baselines and proxy indicators for performance. Minor adjustments have been made to the indicators used in the Monitoring Report 2012.
Goal monitoring NFP PoA and CIP share the same goal: “to ensure dependable food security for all people of the country at all times”. The indicators to monitor progress were specified in the CIP as a refinement and simplification of the one included in the CIP PoA. Moreover, in monitoring progress toward the goal, evidence is given to relevant indicators included in the results framework of the Sixth Five Year Plan. Outcome monitoring The outcome level is common to both the PoA and CIP, and so progress at this level is evaluated through a common set of indicators. Efforts were made in the Monitoring Report 2012 to streamline the indicators used for monitoring the NFP PoA, and this substantially reduced the total number of indicators.
In order to gauge performance at the action level, highlights are given of recent/planned programmes or policy developments considered most representative of progress towards the achievement of the policy targets. Recommendations to accelerate progress are drawn based on the analysis. Output monitoring The CIP is a prioritized coverage of the AoIs in the NFP PoA. This called for some streamlining of the indicators used to monitor the NFP PoA in 2010. Therefore, indicators for monitoring the CIP are narrower in coverage3, and on some issues do not directly capture the full breadth of the NFP PoA. Consequently, the discussion accompanying the indicator tables is much broader to fully monitor the PoA. The list of indicators proposed for monitoring at the output level of the CIP and NFP PoA is the result of:
- An effort to streamline the output level indicators selected for the NFP PoA monitoring exercise in 2010;
- An effort to reflect the thinking and consensus reached during the extensive consultations with the many stakeholders of the CIP;
- A methodical examination of all the AoIs of the NFP PoA to ensure that the proposed indicators cover all of them.
To this effect, the first step was to define a set of SMART output indicators for each of the CIP programmes, using the output indicators of the NFP PoA Monitoring Report 2010. The second step was to match the CIP programmes to the NFP PoA AoIs. The latter were all found to have been covered, largely speaking, by the CIP4. Having carried out this matching exercise, specific areas of the NFP PoA not covered by the indicators selected for the CIP were identified and appropriate indicators were added to the list of indicators to be monitored to ensure full coverage of both the CIP and the NFP PoA in this report.
___________________________________________________________________________ 3 There is one exception: Programme 7 of the CIP (Strengthened capacities for implementation and monitoring of NFP and CIP) is not covered by the NFP PoA, for obvious reasons. 4 Conversely, as mentioned above, the NFP PoA does not cover all the CIP Programmes (see Programme 7).
5
(Figure 1) presents the result of this exercise with the list of output indicators to be used for the joint monitoring of the CIP and NFP PoA. The CIP programmes are shown with the corresponding AoIs of the NFP PoA. These are monitored together using the indicators listed in the column ‘CIP/NFP PoA output proxy indicators’. Input monitoring The inputs level monitoring relates to the financing and financial execution of the CIP. This involves:
- Updating the inventory of completed and ongoing projects relevant to the CIP - including projects starting before 1 July 2010 and completed after that date, and projects starting before 30 June 2015 and completed after that date – the two dates being the start and end dates of the CIP, respectively;
- Updating the GoB for funding needs for projects in the pipeline; - Updating the DPs current and future commitments, both within the CIP and outside
the CIP.
The exercise this year, a reiteration following last year’s exercise, has resulted in a second update of the CIP. The baseline CIP was published as Tables 4.1 to 4.6 in the CIP document in June 2011, and the first update was published as Annex 3 of the Monitoring Report 2012. These are now replaced by Annex 3 of this monitoring report. The monitoring exercise takes stock of the progress in implementation, and updates the CIP as a ‘living document’5.
Financial resources for the implementation of the CIP are provided as part of the Government’s Annual Development Programme. These are monitored and presented in this report at the project, subprogramme and programme levels. The PoA includes a broader set of actions (for example subsidies and safety nets) which are not covered in the CIP. Inputs for the implementation of the PoA are provided as part of the annual budget of the Government, including both development and revenue expenditure of relevant Ministries. For this reason the report also presents -under section 7.1- a review of recent trends in food security spending in the National Budget. Lessons from Monitoring Report 2010 and 2012 Lessons from the previous two monitoring reports in 2010 and 2012 inform the approach in this monitoring report. Both reports successfully adopted a results-based monitoring approach, with indicators carefully identified at different levels of the results chain. The main difference between the 2010 and 2012 monitoring reports was that the 2010 MR monitored only the NFP PoA because the CIP had not been developed at that stage, while the MR 2012 was the first joint-monitoring of the NFP PoA and the CIP. This report also jointly monitors the NFP PoA and CIP. Some lessons from previous experiences applied to this report include:
- Shortened duration of the MR production process to permit better use of its findings in the budgetary and planning process for FY 2013-14;
- Better defined roles, responsibilities and participation of TT members from partner ministries and divisions – teamwork has proven instrumental to quality and transfer of capacities;
___________________________________________________________________________ 5 GoB (2011). Bangladesh Country Investment Plan – A road map towards investment in agriculture, food security and nutrition p. 1.

6
- Rebalanced contents to make more systematic use of the financial database, thus linking the CIP investments more closely to PoA programmes, and thereby tying the assessment of inputs into the PoA to the assessment of results from the PoA.
The institutional setting for monitoring Bangladesh has a composite institutional structure for food security and nutrition that provides coordination at different levels, including for monitoring (Figure 2). This includes at its top the Cabinet level Food Planning and Monitoring Committee (FPMC), chaired by the Food Minister and with membership of various Ministers and Secretaries. This Committee provides strategic orientation on food security issues and establishes a high-level commitment to inter-sectoral collaboration. The National Committee (NC)6 also chaired by
the Food Minister is composed of the Secretaries of the various concerned divisions, Heads of Universities/Research Institutions, DPs, private sector and other NGOs. Among other things, it is tasked with overseeing CIP implementation and monitoring processes. The Food Policy Working Group (FPWG)7 is the mechanism for coordinating collaboration at the technical and operational level through the four Thematic Teams (TTs)8 that carry out the monitoring process of the NFP PoA and the CIP consistently with monitoring of progress towards MDG 1.
The FPMU provides support to these institutions acting as the secretariat of
the various Committees and providing technical and operational support to the FPWG and TTs. In addition to this, GoB agencies involved in running programmes pertaining to the CIP (over 30) as well as the DPs provide inputs towards the financial monitoring section.
___________________________________________________________________________ 6 The NC is chaired by the Minister of Food and includes the following: Secretaries from the Ministry of Finance (Finance and Economic Relations divisions), MoHFW, MoA, MoFL, MoWR, MoDMR, MoFood and IMED; members from the Planning Commission (General Economics Division and Agriculture, Water Resources and Rural Institutions Division); and the Vice C hancellor of BAU, Executive Chairman of BARC, President of FBCCI, Mission Director of USAID, Representative of FAO, Director General of BIDS, Country Director of World Bank and Chief of Party of IFPRI. 7 The FPWG is chaired by the Secretary, Ministry of Food and includes representatives from the Planning Commission (General Economics Division, Socio-economic Infrastructure Division and Agriculture, Water Resources and Rural Institutions Division), Ministry of Finance (Finance Division and Economic Relations Division), IMED and FPMU-MoFood. 8 Annex 2 provides the structure and list of Ministries/agencies participating in the TTs.
Figure 2: Institutional framework
7
3. Progress towards NFP goals and outcomes
3.1. NFP goals
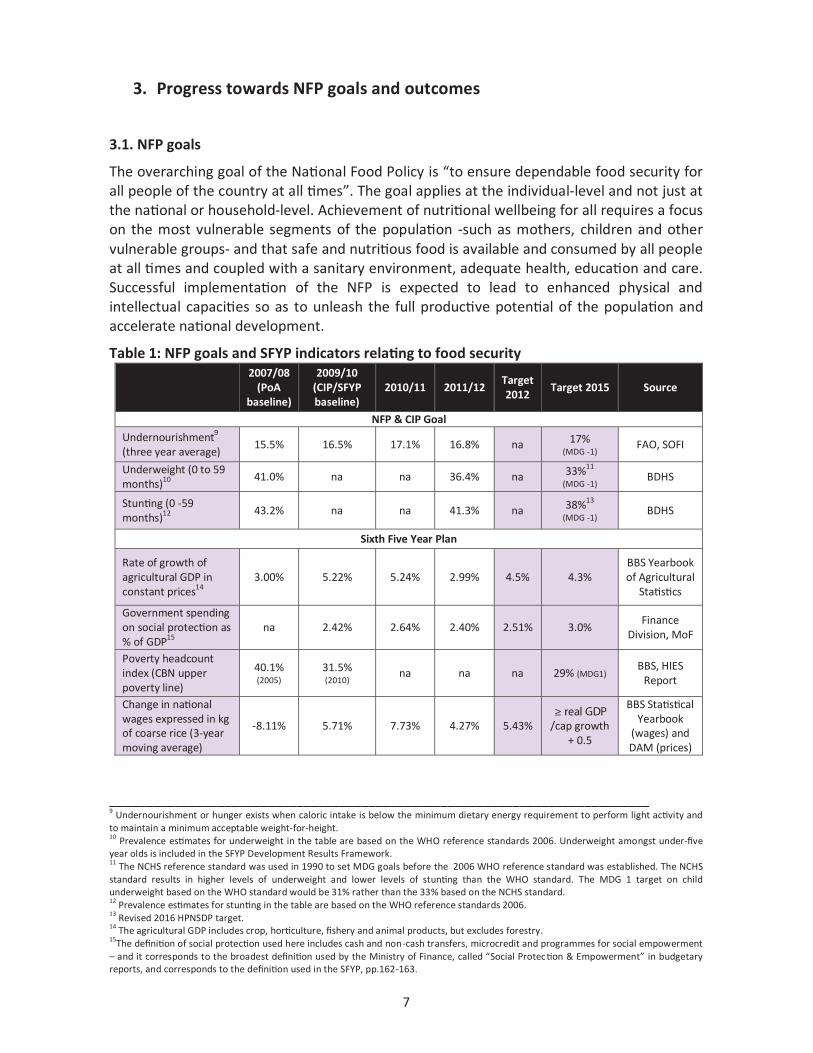
The overarching goal of the National Food Policy is “to ensure dependable food security for all people of the country at all times”. The goal applies at the individual-level and not just at the national or household-level. Achievement of nutritional wellbeing for all requires a focus on the most vulnerable segments of the population -such as mothers, children and other vulnerable groups- and that safe and nutritious food is available and consumed by all people at all times and coupled with a sanitary environment, adequate health, education and care. Successful implementation of the NFP is expected to lead to enhanced physical and intellectual capacities so as to unleash the full productive potential of the population and accelerate national development.
Table 1: NFP goals and SFYP indicators relating to food security
___________________________________________________________________________ 9 Undernourishment or hunger exists when caloric intake is below the minimum dietary energy requirement to perform light activity and to maintain a minimum acceptable weight-for-height. 10 Prevalence estimates for underweight in the table are based on the WHO reference standards 2006. Underweight amongst under-five year olds is included in the SFYP Development Results Framework. 11 The NCHS reference standard was used in 1990 to set MDG goals before the 2006 WHO reference standard was established. The NCHS standard results in higher levels of underweight and lower levels of stunting than the WHO standard. The MDG 1 target on child underweight based on the WHO standard would be 31% rather than the 33% based on the NCHS standard. 12 Prevalence estimates for stunting in the table are based on the WHO reference standards 2006. 13 Revised 2016 HPNSDP target. 14 The agricultural GDP includes crop, horticulture, fishery and animal products, but excludes forestry. 15The definition of social protection used here includes cash and non-cash transfers, microcredit and programmes for social empowerment – and it corresponds to the broadest definition used by the Ministry of Finance, called “Social Protection & Empowerment” in budgetary reports, and corresponds to the definition used in the SFYP, pp.162-163.
2007/08
(PoA baseline)
2009/10 (CIP/SFYP baseline)
2010/11 2011/12 Target 2012
Target 2015 Source
NFP & CIP Goal
Undernourishment9 (three year average)
15.5% 16.5% 17.1% 16.8% na 17% (MDG -1)
FAO, SOFI
Underweight (0 to 59 months)10
41.0% na na 36.4% na 33%11 (MDG -1)
BDHS
Stunting (0 -59 months)12
43.2% na na 41.3% na 38%13 (MDG -1)
BDHS
Sixth Five Year Plan
Rate of growth of agricultural GDP in constant prices14
3.00% 5.22% 5.24% 2.99% 4.5% 4.3% BBS Yearbook of Agricultural
Statistics
Government spending on social protection as % of GDP15
na 2.42% 2.64% 2.40% 2.51% 3.0% Finance
Division, MoF
Poverty headcount index (CBN upper poverty line)
40.1% (2005)
31.5% (2010)
na na na 29% (MDG1) BBS, HIES
Report
Change in national wages expressed in kg of coarse rice (3-year moving average)
-8.11% 5.71% 7.73% 4.27% 5.43% ≥ real GDP
/cap growth + 0.5
BBS Statistical Yearbook
(wages) and DAM (prices)

8
Progress towards the NFP goal is measured in this report using the three indicators of nutritional status identified in the monitoring framework of the CIP16. Selection of these indicators is consistent with other national development planning tools, notably the MDGs. The three indicators are prevalence of undernourishment, child underweight and child stunting. The indicators are formulated as shortfalls against minimum thresholds of nutritional adequacy.
The undernourishment indicator is measured across the whole population. It measures only calorie adequacy. Adequate nutrition includes dietary quality, protein intakes and micronutrient intakes required to avoid “hidden hunger”. The other two indicators are age-specific, referring to those aged 0-59 months. The child anthropometric indicators are also useful proxy indicators for nutrition in the broader population. For example, micronutrient deficiency, poor sanitation and unsafe drinking water all undermine food utilisation, but except for extreme cases it is hard to detect quickly these impacts in the adult population due to adult resiliency, whereas the impacts are sharply reflected in children’s nutritional status. While updated statistics are not available, about one-third of babies in Bangladesh are born with low birth weight, which is closely associated with mortality, morbidity, inhibited growth and harmed cognitive development. Furthermore, early childhood malnutrition can cause irreversible damage carried into adulthood.
The undernourishment indicator shows that whilst its MDG target was met in early 2000s, it has been slowly deteriorating thereafter, although with an improvement in the last year (Table 1). The picture is complicated by the fact that FAO refined its worldwide methodology for estimating undernourishment. This led to substantial changes in estimates for many countries, and for Bangladesh a downward revision of its data (Box 1). The FAO estimate of undernourishment is based on apparent per capita caloric consumption, which reflects availability rather than actual consumption. A more direct measurement would be provided by the DCI estimate of poverty, which is a headcount of people consuming less than the desirable amount of calories based on the consumption registered in the HIES surveys. However, DCI poverty estimates have not been
___________________________________________________________________________ 16 Government of Bangladesh (2011). Country Investment Plan. A roadmap towards investment in Agriculture, Food Security and Nutrition.
Box 1: Revision of FAO undernourishment estimates SOFI 2012 published estimates of the prevalence of undernourishment in Bangladesh, revised from 1990 to take advantage of improved methods and data from FAO. In these revisions, Bangladesh was estimated to have a lower prevalence of undernourishment than what was previously estimated. The chart below summarizes the new estimates against the old estimates. The revisions use updated information on population, food supply, food losses, dietary energy requirements and other factors. They also better estimate the distribution of food (as measured in terms of dietary energy supply) within countries. More details can be found at: http://typo3.fao.org/fileadmin/templates/es/SOFI_2012/sofi_technical_note.pdf

9
published after 200517. This is crucial because the rate of decline of DCI until 2005 was not fast enough to reach the MDG target, suggesting that accelerating progress to meet calorie adequacy in the general population could still require close attention – and this is supported by data on average calorie intakes which have risen by just 4 calories per year since 1995 (see Section 3.4 for the data).
BDHS data on both underweight and stunting show declines compared to the PoA baseline. In the longer-run, prevalence of child underweight and child stunting both declined sharply in the 1990s, with underweight declining more, then slowed down after 2000 but finally picked up again after 2005. Overall, Bangladesh appears to be on track to meet the child underweight MDG target and a comparable decline is also observed for stunting.
To monitor overall progress toward the NFP goal, this report also considers four indicators included in the Results Framework of the SFYP: growth of agricultural GDP is included as an indicator of progress in availability, spending on social protection as an indicator of social access to food, while poverty and wages in kilograms of rice as indicators of economic access to food. Poverty declined since the PoA baseline – from 40% to 32% - although an estimate does not exist for the most recent year. Agricultural GDP growth and change in the rice-wage are both positive but below targets for the year. A slight drop is also recorded in the share of Government’s spending on social protection, which is budgeted to continue to decline in 2012/13 to 2.18%, a fair way short of its 2015 target.
In sum, what can be said about progress towards NFP goals in 2011/12, the specific monitored year? Improvements in children’s nutritional well-being continued up to 2011, the last year for which data is available. Undernourishment is estimated to have fallen slightly for the 2010-12 period, inverting a rising trend in previous years. Agricultural growth and rice-wage continued to gain, though at significantly lower speed than previously. Spending on social protection increased in nominal terms, but contracted as a share of GDP making more difficult the achievement of the target in 2015.
Looking at longer term trends, since the MDG baseline year, malnutrition improved at a slower pace than poverty (see Figure 3). However, trends were markedly different during the two decades. Indeed, over the 90s’, malnutrition improved significantly faster than poverty18, while the speeds of improvements were opposite over the last decade: CBN-based poverty incidence declined yearly by 4.3%, child underweight by 1.4% and child stunting by 1.9% showing that while socioeconomic drivers are necessary for improving nutrition, they are not per-se sufficient to achieve the desired nutrition outcome of the NFP. ___________________________________________________________________________ 17 This issue is discussed in detail in the PoA and CIP Monitoring Report 2012, pg. 8. 18 Poverty declined by less than 1.5% per year over the period 1989-2000, against 3.7% per year for underweight and 2.7% for stunting, over the period 1990-2000.
Figure 3: Poverty, underweight and stunting trends
30
35
40
45
50
55
60
65
70
198
Perc
ent o
f the
pop
ulati
on
-2.0%
-2.5%
-2.8%
1990 1995 2000 2005 2010
Stunting Underweight Poverty
Source: HIES and BDHS various years

10
Stunting is caused by poor diet and frequent infections including gastro enteropathy that generally occurs before age 2 years19.
While sustained efforts are needed to promote food security in all its dimensions, including reinvigoration of agricultural growth and scaling up of social protection interventions, nutrition needs to be promoted by direct nutrition interventions as well as through indirect interventions requiring mainstreaming nutrition across all relevant sectors. This, in turn, requires reinforced awareness and multi-sector collaboration in formulation, implementation and monitoring of interventions20.
3.2. NFP Objective 1 outcomes 3.2.1. Assessment
Objective 1 of the NFP is to ensure adequate and stable supply of safe and nutritious food. Progress towards this objective is assessed though the indicators in Table 2. Growth of agricultural GDP in constant prices is an aggregate measure of supply21. Stability of food availability and import dependency are measured with reference to rice considering data availability and the role of rice as a food staple. A reduction of the share of rice in food value added is taken as indicating an increase in diversification. Food safety and quality are considered under Objective 3 and Programme 12 of the CIP.
Table 2: NFP Objective 1: Selected performance indicators
2007/08 2009/10 2010/11 2011/12 Target Source
Rate of growth of agricultural GDP in constant prices
3.00% 5.22% 5.24% 2.99% 4.50% (2011/12)
Yearbook of Agricultural Statistics, BBS
Rice import dependency (3-years moving average)22
4.20% 3.31% 2.53% 2.37% 0% FPMU/MIS, BBS
Instability of rice production23 4.09% 4.07% 3.39% 3.04% 0% Yearbook of Agricultural
Statistics, BBS
Share of rice value added in total food value added in current price
41.52% 42.17% 42.44% 41.71% Decreasing over time
Yearbook of Agricultural Statistics, BBS and
communications with BBS
Growth of agricultural GDP decelerated Agricultural GDP24 grew by 2.99% in 2011/12, compared to 3.00% in 2007/08, 5.22% in 2009/10 and 5.24% in 2010/11. The slower growth is mainly explained by the deceleration of the crop sector which grew by 1.95% in 2011/12, compared to 5.65% in 2010/11. ___________________________________________________________________________ 19 Milman A et. al. (2005). Differential improvement among countries in child stunting is associated with long term development and specific interventions, Journal of Nutrition, 135 (6): 1415-1422. 20 FPMU Policy Brief 9. 21 Monitoring adequacy and stability of food supply is challenging because of data limitations. For example, in the case of the wheat the comparison as of 2010 of consumption as per the HIES (26g per day per capita) with total wheat availability (imports + production) yields a huge differential, with supply being three times more than consumption. This clearly questions the suitability of the available information for calculating consistent food balance sheets. 22 Imports/ (net production+ imports – exports). 23 Measured by the coefficient of variation of the difference between annual production and its 10-year rolling linear trend. 24 Excluding forestry and including fisheries.
11
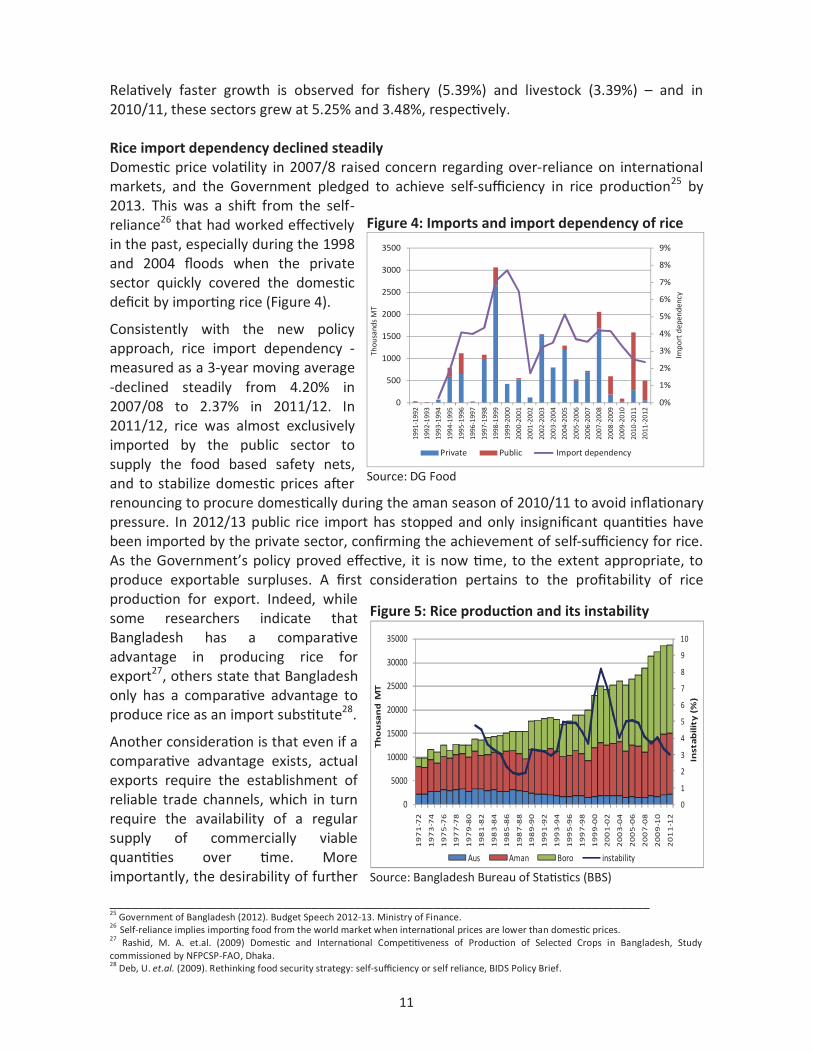
Relatively faster growth is observed for fishery (5.39%) and livestock (3.39%) – and in 2010/11, these sectors grew at 5.25% and 3.48%, respectively. Rice import dependency declined steadily Domestic price volatility in 2007/8 raised concern regarding over-reliance on international markets, and the Government pledged to achieve self-sufficiency in rice production25 by 2013. This was a shift from the self-reliance26 that had worked effectively in the past, especially during the 1998 and 2004 floods when the private sector quickly covered the domestic deficit by importing rice (Figure 4).
Consistently with the new policy approach, rice import dependency -measured as a 3-year moving average -declined steadily from 4.20% in 2007/08 to 2.37% in 2011/12. In 2011/12, rice was almost exclusively imported by the public sector to supply the food based safety nets, and to stabilize domestic prices after renouncing to procure domestically during the aman season of 2010/11 to avoid inflationary pressure. In 2012/13 public rice import has stopped and only insignificant quantities have been imported by the private sector, confirming the achievement of self-sufficiency for rice. As the Government’s policy proved effective, it is now time, to the extent appropriate, to produce exportable surpluses. A first consideration pertains to the profitability of rice production for export. Indeed, while some researchers indicate that Bangladesh has a comparative advantage in producing rice for export27, others state that Bangladesh only has a comparative advantage to produce rice as an import substitute28.
Another consideration is that even if a comparative advantage exists, actual exports require the establishment of reliable trade channels, which in turn require the availability of a regular supply of commercially viable quantities over time. More importantly, the desirability of further
___________________________________________________________________________ 25 Government of Bangladesh (2012). Budget Speech 2012-13. Ministry of Finance. 26 Self-reliance implies importing food from the world market when international prices are lower than domestic prices. 27 Rashid, M. A. et.al. (2009) Domestic and International Competitiveness of Production of Selected Crops in Bangladesh, Study commissioned by NFPCSP-FAO, Dhaka. 28 Deb, U. et.al. (2009). Rethinking food security strategy: self-sufficiency or self reliance, BIDS Policy Brief.
Figure 4: Imports and import dependency of rice
0%
1%
2%
3%
4%
5%
6%
7%
8%
9%
0
500
1000
1500
2000
2500
3000
3500
1991
-199
2
1992
-199
3
1993
-199
4
1994
-199
5
1995
-199
6
1996
-199
7
1997
-199
8
1998
-199
9
1999
-200
0
2000
-200
1
2001
-200
2
2002
-200
3
2003
-200
4
2004
-200
5
2005
-200
6
2006
-200
7
2007
-200
8
2008
-200
9
2009
-201
0
2010
-201
1
2011
-201
2
Impo
rt d
epen
denc
y
Thou
sand
s M
T
Private Public Import dependency
Source: DG Food
Figure 5: Rice production and its instability
0
1
2
3
4
5
6
7
8
9
10
0
5000
10000
15000
20000
25000
30000
35000
19
71
-72
19
73
-74
19
75
-76
19
77
-78
19
79
-80
19
81
- 82
19
83
-84
19
85
-86
19
87
-88
19
89
-90
19
91
-92
19
93
-94
19
95
-96
19
97
-98
19
99
-00
20
01
-02
20
03
-04
20
05
-06
20
07
-08
20
09
-10
20
11
-12
Inst
ab
ilit
y (
%)
Tho
usa
nd
MT
Aus Aman Boro instability Source: Bangladesh Bureau of Statistics (BBS)

12
expanding rice production should be assessed vis-à-vis the objective of increasing diversification (see below). Instability of rice production decreased in recent years The instability of rice production - measured by the coefficient of variation of the difference between production and its rolling linear trend over a ten year period - continued to decline and reached the minimum level at 3.04% in 2011/12. This is due to stability in rice production in 2011/12, especially for aman and boro which increased marginally (0.05% for aman and 0.77% for boro) in 2011/12 compared to the previous year (4.78% for aman and 1.50% for boro). Overall, rice production was more stable during the last decade compared to the 1990s29 (Figure 5). Share of rice value added declined The share of rice value added in total food value added (in current price) has decreased in 2011/12 compared to the previous year (-0.73%) but it is still above the level registered in 2007/08. Overall, this indicator does not show any clear trend since 2000/0130, as both rice and total food value added grew on average by almost 10% per annum in nominal terms (Figure 6). This indicates that no significant food production diversification has taken place despite the significant growth observed for some non-rice products such as fishery and poultry (see Programmes 4 & 5). In other words, the faster growth observed in some agricultural sub-sectors has taken place to the detriment of others, such as pulses and fruits (see Programme 1), leaving unchallenged the predominance of rice. The achievement of self-sufficiency in rice offers the opportunity to use production gains from
further intensification to gradually release land and other resources as required to diversify food production towards higher value-added and more nutritious foods.
Recent foodgrain price volatility calls for scaling up domestic production and public stocking capacity. Bangladesh has experienced sharp price volatility of rice and wheat, especially during and after the 2007/08 food price crisis. Figure 7 shows the real prices of wheat and rice in Bangladesh over different
___________________________________________________________________________ 29 Instability decreased from 2.5% during 1990/91-1999/2000 to 1.7% during 2000/01-2011/12. 30 Share of rice value added changed from 43.15% in 2000/01 to 42.00% in 2011/12.
Figure 6: Food value added, rice and others
20%
25%
30%
35%
40%
45%
0
100
200
300
400
500
600
700
800
900
Sh
are
of rice
Billio
nTa
ka
Rice Non-rice food share of rice
Source: Bangladesh Bureau of Statistics (BBS)
Figure 7: Real prices of rice and wheat
1000
2000
3000
4000
5000
6000
7000
taka
per
qui
ntal
wheat real price Rice real price
Period IV Period VPeriod IIIPeriod IIPeriod I
Source: DAM

13
periods since 197531. These trends are in line with those observed in the main rice exporting countries32. It is possible to note that both prices declined in real terms, but the decline was more pronounced for rice, which reached a historical minimum in early 2013. Table 3 shows rice price volatility over the five periods considered above. It shows a long term declining trend in price volatility (with only a limited exception for wheat over period III) that was inverted by the 2007/08 rice price crises. However, volatility remains below the level observed in the first decades considered. Table 3: Price volatility of rice and wheat
Whole period (Jul75-Dec 12)
Period I (Jul 75-Dec 85)
Period II (Jan 86-Dec 91)
Period III (Jan 92-Dec99)
Period IV (Jan 2000-Dec 06)
Period V (Jan 07-Dec 12)
Rice 19.23% 24.11% 19.87% 16.99% 13.67% 17.74%
Wheat 24.26% 33.23% 20.85% 22.95% 13.43% 20.56%
Source: Calculation using DAM data Note: Volatility is measured by the standard deviation of the changes in the logarithms of monthly price averages at an annualized rate. Agricultural trade balance deteriorated, mainly due to non-cereal products Agricultural trade deficit increased between 2007 and 2010, but less than the overall merchandise trade balance. Indeed, the trade deficit for all merchandized products rose by 124%, while agricultural trade deficit increased by only 47%, from −3421 million USD to −5034 million USD (Figure 8).
However, the trade balance for non-cereal products deteriorated markedly. Indeed, the trade deficit of fruits and vegetables, dairy products and eggs, and meat rose by 305%, 131% and 71%, respectively compared to only 39% for cereal (Figure 9). Over the longer period since 2000, the agricultural trade deficit has grown faster (+218%) than the total merchandise deficit (+163%). Faster growing deficits were recorded for meat (+633%), fruit and vegetables (+516%), cereals (+241%), while the deficit for dairy products deteriorated at a slower pace (+172%). Overall, the deficit of the agricultural trade balance showed a tendency to accelerate, especially for non-cereal food products such as fruit and vegetables. Considerable consumption diversification occurred over the last two decades, and since production diversification could not keep pace, the agricultural trade ___________________________________________________________________________ 31 Based on volatility level, five periods have been identified: July 1975 to December 1985 (Period I), January 1986 to December 1991 (Period II), January 1992 to December 1999 (Period III), January 2000 to December 2006 (Period IV) and January 2007 to December 2012 (Period V). 32 The recent NFPCSP supported study by Raha, S. K. et.al. (2013). on “Structure, conduct and performance of the rice market and the impact of technological changes in milling” has produced new evidence confirming the integration between the price in Bangladesh and in main rice exporting countries in Asia.
Figure 8: Total, agricultural and food trade deficit
-9000
-7500
-6000
-4500
-3000
-1500
0
2000 2001 2002 2003 2004 2005 2006 2007 2008 2009 2010
Mill
ion
USD
Total trade Agril products Food & animal prod Source: FAOSTAT

14
deficit increased. The share of cereal on total per capita intake of food decreased from 80% to 70% between 1990 and 2010, while intakes of practically all other foods have increased - with the main exception of legumes - albeit at different speeds. For example, consumption of potato in 2010 exceeded the nutritional norm, while fruit and vegetable were still almost at half of the norm.
Compared to consumption, domestic production has not diversified fast
enough to prevent the surge in imports, despite the fact that various studies show that production of non-rice commodities is more profitable than rice. In terms of profitability, perennial fruit production leads followed by pulses, spices, oilseed, vegetables, livestock and fisheries. Diversification of agricultural production, measured by agricultural diversification index (ADI), increased marginally during the last two decades: from 0.51 in 1992/93 to 0.58 in 2009/10, and remained almost unchanged in the more recent years33. Exports would require meeting food quality standards, and for this promotion of good agricultural practices should complement support to promote production diversification.
3.2.2. Issues and policy challenges
Intensification, sustainability and resilience of rice production Rice consumption is expected to increase mainly due to population growth. Indeed, the evolving food consumption pattern indicates that per capita rice consumption will, on average, most likely decline. Considering that the population growth rate is approaching 1% per year (Figure 10) per capita consumption is declining and considering loss of agricultural land in the order of half percent annually, an annual increase in rice productivity of 2% or more could allow releasing of land and other resources as required for diversification. This calls for sustaining efforts to promote intensification, sustainability and resilience of rice production.
___________________________________________________________________________ 33 Miah, M. A. M. and A. K. E. Haque (2013). Policy option for supporting agricultural diversification in Bangladesh. Draft final report, study supported by the NFPCSP.
Figure 9: Trade deficit for main foods
-3000
-2500
-2000
-1500
-1000
-500
0
2000 2001 2002 2003 2004 2005 2006 2007 2008 2009 2010M
illio
n U
SD
Cereal Sugar Fruits & Veg Meat Dairy Prod & Egg
Source: FAOSTAT
Figure 10: Rice production and population changes
0%
1%
2%
3%
4%
5%
6%
Ch
ange
Rice pod change Population change
Source: Bangladesh Bureau of Statistics (BBS)
15
Bringing more fallow land under cultivation in coastal areas The southern belt covers 30% of the arable lands of the country, but 15% of the available cultivated land in this area is either left fallow and/or not utilized because of soil salinity, water salinity, and water logging. This area is viewed by the Government as a possible ‘rice bowl’ considering the availability of abundant land, and good potential to increase coverage and productivity of transplanted aus rice. The total potential transplanted aus area is estimated at 740,346 ha of which 38% would be suitable and 40% moderately suitable. Moreover, the potential boro area under surface water irrigation in the region is estimated at 695,200 ha34. To match the salinity levels, new rice varieties are being developed (see programme 1), which farmers have started adopting. Preserving farmers’ incentive under rice self-sufficiency Self-sufficiency in rice production in 2012/13 calls for reconsidering the support provided to rice producers through input subsidies - especially fertilizers - and procurement of rice at the time of harvest, as these interventions become less effective and more expensive in presence of an exportable surplus. While there is a need to protect farmers from the effect of price slumps that usually occur at harvest time, it is unfeasible to avoid the fall of domestic prices in the presence of a systematic excess supply relative to domestic demand if it is not only of a seasonal nature. To effectively address the fall of price in this case, the Government has been considering the possibility of allowing rice exports, which will become increasingly feasible as the structural surplus will consolidate and functional export channels will be established. In presence of exports, however, the benefit of input subsidies will be transferred to foreign consumers from domestic producers and consumers. This questions both the feasibility and opportunity of subsidizing rice production and calls for redirecting the resources currently devoted to promote the use of fertilizers and water for rice production, to the multiple interventions required to promote diversification and greater self-reliance for non-rice foods. Promoting diversification of food production As the increase in consumption of non-cereal foods results in increasing trade imbalances, promotion of agricultural diversification becomes increasingly valuable. Import substitution of higher value-added produce, such as fruits and vegetables, legumes, fishery and livestock products, while reducing trade imbalances, also contributes to accelerate agricultural income growth and poverty reduction. In this regard, the National Perspective Plan (2010-2021) stressed the importance of agro-ecological zoning to identify and disseminate information on suitability of different areas to different crops. Efforts have been made to promote diversification through appropriate packages of seed-fertilizer-irrigation along with other improved technologies. Scaling up agricultural diversification also requires public and private investments in making available suitable technologies, such as seeds and other inputs, certification of inputs and produce, agricultural services such as extension and veterinary services, rural infrastructures, processing and marketing facilities, enhanced credit, crop insurance, associative marketing structures, etc.35
___________________________________________________________________________ 34 MoA (2012). Master plan for agricultural development in southern region of Bangladesh. 35 Miah and Haque (2013) op. cit.
16
Increased fragmentation calls for more efforts to integrate small and marginal farmers As discussed in the Monitoring Report 201236 rural landlessness has reduced between late ‘80s and late ‘90s and the number of farm holding continued increasing, so that the average size of cultivated area per farm has decreased from 0.81 to 0.51 hectares between 1984 and 2008. While this reduced inequality of land holding, it increased part-time farming and the contribution of non-farm rural activities as sources of income for small and marginal farmers. Small farmers have an advantage in productive activities requiring close supervision of labour, such as fruit and vegetables, but to exploit this advantage they need to be able to effectively participate in the market, which in turn requires tailoring the type of interventions required for agricultural diversification to small farmers. In particular, this includes the direct interactions between the public administrative system and small farmers for the delivery of agricultural services, such as extension and the distribution of subsidies, but also the procurement of foodgrain, requires the promotion of more decentralized forms of interventions based on diversified associative structures and market mechanisms. Coping with climate change Bangladesh has been classified as highly vulnerable to climate change. The amount of rainfall in Bangladesh is expected to increase by 10% to 15% by 2030 and 27% by 2075. Sea-level rise is expected to inundate directly or indirectly 120,000 km2. An additional 14.3% of the country would become extremely prone to floods by 2030.
Cyclones in the Bay of Bengal will occur more frequently due to increasing temperature, and the peak intensity of cyclones may increase by 5% to 10%. Cyclones hit throughout May and between mid-October and mid-November, and these can coincide with the harvesting time of boro and aman rice. The development and adoption of shorter duration rice varieties could protect these two crops by advancing the maturity time out of cyclone-risk periods.
Salinity problems in coastal areas are expected to further exacerbate as a result of the reduced dry-season freshwater supply from upstream sources due to the change in rain pattern. The area severely affected by drought in the rabi season could increase from 4000 km2
to 12000 km2 under severe climate change scenario.
Overall, crop production might be reduced by 30% by the end of the century, especially rice and wheat production might be reduced between 8% and 32% by 2050. Winter crop production would be seriously hampered due to warmer and drier environment, while moisture stress might force farmers to reduce the area under boro cultivation37. Climate change adaptation requires investments in agricultural research and extension with a particular emphasis on development and diffusion of stress resistant high yielding varieties. Conservation of natural resource base: arable land, soil fertility and groundwater Conversion of arable land to non-agricultural purposes, depletion of soil fertility and the groundwater tables are major challenges. Depletion of soil fertility is mainly due to intensive land use without appropriate soil management and inadequate replenishment of plant nutrients in soils. The situation is more severe in areas where HYVs are being cultivated using low and unbalanced doses of mineral fertilizers with little or no organic recycling.
___________________________________________________________________________ 36 FPMU (2012). Monitoring Report 2012 of the National Food Policy Plan of Action and Country Investment Plan, pp.15-16. 37 Awal, M. A. (2013). Adapting social safety net programs to climate change shock: issue and options for Bangladesh, Draft final report, NFPCSP financed project.
17
Conversion of land to non-agricultural uses is another increasing problem, with land available for agriculture having decreased by 0.49% between 2000 and 2010 per annum38. Similarly alarming is the depletion of groundwater. In the northern districts of Bangladesh, the depth of groundwater increased by about 80%, up from 3.7 meters in 1981 to 6.6 meters in 201139.. Against this backdrop, the existing policies - the Land Use Policy 2001 which provides guidelines for protection of agricultural land and water bodies, and the 1999 National Water Policy which provides policy direction for the water sector - need to be updated with further attention given to their implementation. Promoting agricultural mechanization to cope with labour scarcity Labour shortage is becoming an increasingly frequent phenomenon during peak periods (e.g. sowing/planting, harvesting etc.) due to the increasing employment opportunities in rural non-farm activities and labour migration. A recent study40 showed that 22%, 12% and 2% of rural households sent internal, external and mixed (both internal and external) migrants during 2011/12. As a result, real agricultural wages are increasing: the quantity of rice that can be purchased with one day labour in agriculture increased by 68%, up from 5.6 kg in 2002 to 9.5 kg in 201241. While the increasing salary is certainly a welcome development for its impacts on rural poverty and food security, further progress in agricultural mechanization is required to prevent negative impact on production. At present, while 80% of land preparation is mechanized, other operations are still prevalently done manually due to land fragmentation, limited availability of quality machines, lack of knowledge and skills, tariff difference on machines and spare parts, etc. Addressing these issues requires detailed analysis of each issue to formulate a mechanization policy, including interventions such as formation of strong farmers group, strengthening custom-hire services of agri-machinery, promoting machinery research, reactivation of the National Standardization Committee and review and rationalization of current tariff rates 42.
3.3. NFP Objective 2 outcomes
Objective 2 of the NFP is to increase purchasing power and access to food. The objective encompasses transitory shock management, targeted food assistance programmes and employment generating income growth. These are intended to strengthen factors that underpin stable food access by individuals, such as household income, gifts, borrowing and transfers, in the first instance – and in the longer-run, increases in the levels of economic, social and human assets, and their productivity – as well as reductions in social discrimination, such as due to gender, disability or ethnicity.
___________________________________________________________________________ 38 Hassan, N. (2013). Trends in the availability of agricultural land in Bangladesh, Draft final report, NFPCSP. financed project. 39 Estimated by NFPCSP based on data obtained from BADC. 40 Hossain, M. Z. et. al. (2013). Rural-urban migration and its implications for food security in Bangladesh, Draft final report, NFPCSP financed project. 41 NFPCSP calculation. 42 Islam, M. S. (2009). Farm Mechanization for sustainable agriculture in Bangladesh: problems and prospects, FMPE Division, BARI, Joydebpur, Gazipur, Presented at the Fifth Session of the Technical Committee (TC) of UNAPCAEM & Exp ert Group Meeting on Application of Agricultural Machinery for Sustainable Agriculture in the Asia-Pacific Region, 14-16 October 2009, Los Banos, the Philippines.
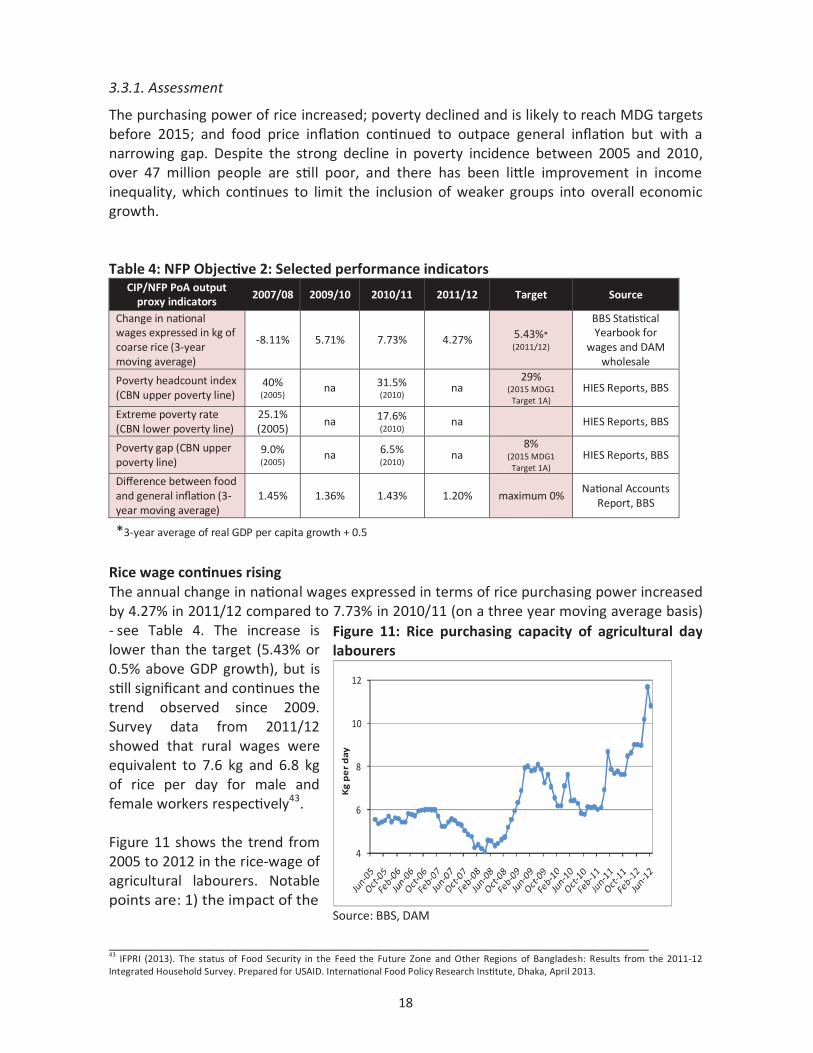
18
Figure 11: Rice purchasing capacity of agricultural daylabourers
4
6
8
10
12
Kg
pe
r d
ay
Source: BBS, DAM
3.3.1. Assessment
The purchasing power of rice increased; poverty declined and is likely to reach MDG targets before 2015; and food price inflation continued to outpace general inflation but with a narrowing gap. Despite the strong decline in poverty incidence between 2005 and 2010, over 47 million people are still poor, and there has been little improvement in income inequality, which continues to limit the inclusion of weaker groups into overall economic growth. Table 4: NFP Objective 2: Selected performance indicators
CIP/NFP PoA output proxy indicators
2007/08 2009/10 2010/11 2011/12 Target Source
Change in national wages expressed in kg of coarse rice (3-year moving average)
-8.11% 5.71% 7.73% 4.27% 5.43%* (2011/12)
BBS Statistical Yearbook for
wages and DAM wholesale
Poverty headcount index (CBN upper poverty line)
40% (2005) na 31.5%
(2010) na 29%
(2015 MDG1 Target 1A)
HIES Reports, BBS
Extreme poverty rate (CBN lower poverty line)
25.1% (2005)
na 17.6% (2010) na
HIES Reports, BBS
Poverty gap (CBN upper poverty line)
9.0% (2005) na 6.5%
(2010) na 8%
(2015 MDG1 Target 1A)
HIES Reports, BBS
Difference between food and general inflation (3-year moving average)
1.45% 1.36% 1.43% 1.20% maximum 0% National Accounts
Report, BBS
*3-year average of real GDP per capita growth + 0.5
Rice wage continues rising The annual change in national wages expressed in terms of rice purchasing power increased by 4.27% in 2011/12 compared to 7.73% in 2010/11 (on a three year moving average basis) - see Table 4. The increase is lower than the target (5.43% or 0.5% above GDP growth), but is still significant and continues the trend observed since 2009. Survey data from 2011/12 showed that rural wages were equivalent to 7.6 kg and 6.8 kg of rice per day for male and female workers respectively43. Figure 11 shows the trend from 2005 to 2012 in the rice-wage of agricultural labourers. Notable points are: 1) the impact of the
___________________________________________________________________________ 43 IFPRI (2013). The status of Food Security in the Feed the Future Zone and Other Regions of Bangladesh: Results from the 2011-12 Integrated Household Survey. Prepared for USAID. International Food Policy Research Institute, Dhaka, April 2013.
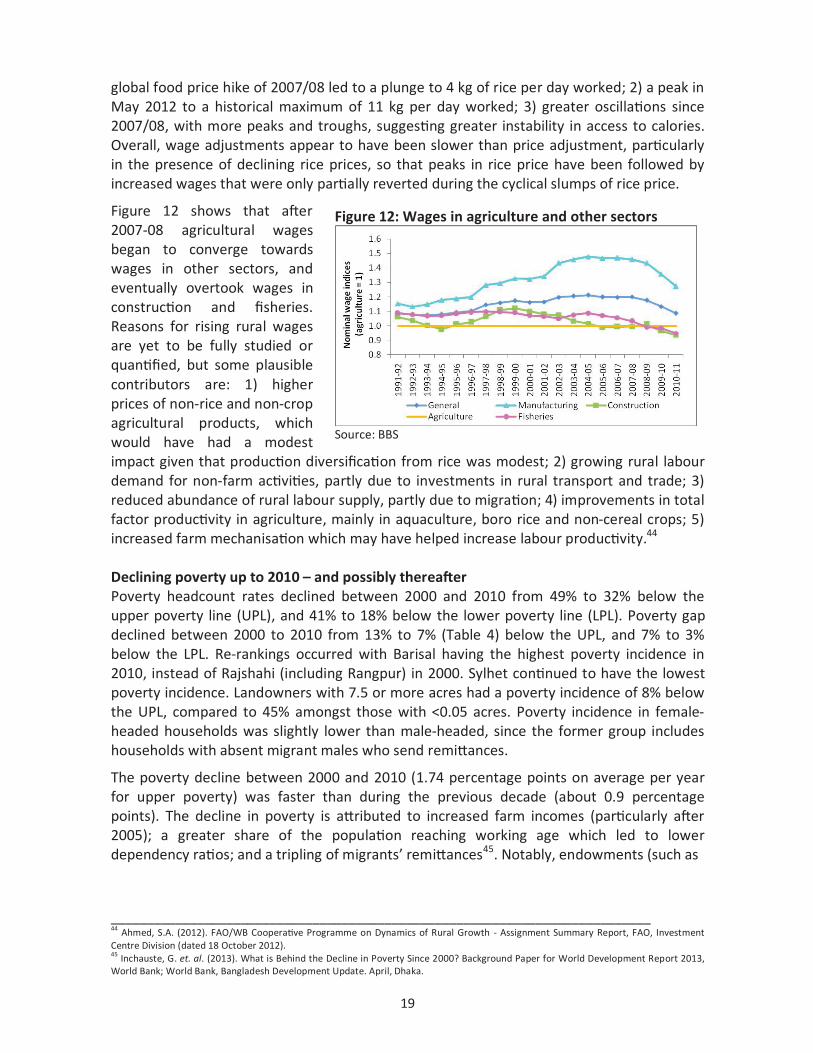
19
global food price hike of 2007/08 led to a plunge to 4 kg of rice per day worked; 2) a peak in May 2012 to a historical maximum of 11 kg per day worked; 3) greater oscillations since 2007/08, with more peaks and troughs, suggesting greater instability in access to calories. Overall, wage adjustments appear to have been slower than price adjustment, particularly in the presence of declining rice prices, so that peaks in rice price have been followed by increased wages that were only partially reverted during the cyclical slumps of rice price.
Figure 12 shows that after 2007-08 agricultural wages began to converge towards wages in other sectors, and eventually overtook wages in construction and fisheries. Reasons for rising rural wages are yet to be fully studied or quantified, but some plausible contributors are: 1) higher prices of non-rice and non-crop agricultural products, which would have had a modest impact given that production diversification from rice was modest; 2) growing rural labour demand for non-farm activities, partly due to investments in rural transport and trade; 3) reduced abundance of rural labour supply, partly due to migration; 4) improvements in total factor productivity in agriculture, mainly in aquaculture, boro rice and non-cereal crops; 5) increased farm mechanisation which may have helped increase labour productivity.44 Declining poverty up to 2010 – and possibly thereafter Poverty headcount rates declined between 2000 and 2010 from 49% to 32% below the upper poverty line (UPL), and 41% to 18% below the lower poverty line (LPL). Poverty gap declined between 2000 to 2010 from 13% to 7% (Table 4) below the UPL, and 7% to 3% below the LPL. Re-rankings occurred with Barisal having the highest poverty incidence in 2010, instead of Rajshahi (including Rangpur) in 2000. Sylhet continued to have the lowest poverty incidence. Landowners with 7.5 or more acres had a poverty incidence of 8% below the UPL, compared to 45% amongst those with <0.05 acres. Poverty incidence in female-headed households was slightly lower than male-headed, since the former group includes households with absent migrant males who send remittances.
The poverty decline between 2000 and 2010 (1.74 percentage points on average per year for upper poverty) was faster than during the previous decade (about 0.9 percentage points). The decline in poverty is attributed to increased farm incomes (particularly after 2005); a greater share of the population reaching working age which led to lower dependency ratios; and a tripling of migrants’ remittances45. Notably, endowments (such as
___________________________________________________________________________ 44 Ahmed, S.A. (2012). FAO/WB Cooperative Programme on Dynamics of Rural Growth - Assignment Summary Report, FAO, Investment Centre Division (dated 18 October 2012). 45 Inchauste, G. et. al. (2013). What is Behind the Decline in Poverty Since 2000? Background Paper for World Development Report 2013, World Bank; World Bank, Bangladesh Development Update. April, Dhaka.
Figure 12: Wages in agriculture and other sectors
Source: BBS

20
assets or education), public transfers and greater equality were not major pathways in poverty reduction in that decade.
In the absence of evidence to the contrary, we expect that poverty continued to decline after 2010, the most recent year with an official estimate, because since then the economy grew with no marked escalation in inequality detected. Other indicators are supportive of this position. Real wages rose (as discussed above); domestic migration continued to help smooth inter-sectoral and inter-temporal imbalances in growth and consumption; and remittances from international migration increased and is forecasted to reach USD 14.7 billion in 2012-13, a 17% year-on-year rise. The Bangladesh Integrated Household Survey (IFPRI 2013)46 shows DCI rural poverty (calorie intake less than 2122 kcals) at 35.3% in 2011-12 compared to 39.5% registered in the HIES 2005.
However, the pace of poverty-reduction could slow somewhat because of: 1) weak outlook in agricultural output growth, the main driver of rural consumption growth; 2) negative wealth effects resulting from deflating asset markets (stocks, housing and land); 3) forecasted slight slowing of GDP growth due to the impacts of the Euro-crisis and Bangladesh’s parliamentary elections47. Pro-poor extension services, community protection of natural resources, new seeds and affordable inputs to address climate change, and access to water and land continue to constrain the extent to which the poor share in economic growth and stabilise their access to food. The Government targets by 2021 a fall of poverty incidence below 15% under its Vision 202148. Trends in food versus general prices Figure 13 shows that since 2006 food price inflation generally exceeded non-food price inflation with the exception of two periods: 1) February to August 2009 and 2) December 2011 to December 2012. In 2012, food price inflation declined, as a continuation of a longer trend started from a peak in March 2011; but since October 2012, food price inflation has increased again, whilst non-food price inflation continued to decline. The food price inflation has closely followed the trend in rice price given the weight of the latter in CPI.
Figure 13 also shows that since the food price crisis, food price inflation has experienced a cyclical trend of almost 3 year duration, with peaks in early 2008 and late 2010 and slumps in mid-2009 and late 2012. Unpredicted volatility in food prices heightens food insecurity because
___________________________________________________________________________ 46 IFPRI (2013), op. cit. 47 World Bank (2013). Bangladesh Development Update. April, Dhaka. 48 Muhammad Abdur Razzaque (2013). Vision 2021: Bangladesh Charts a Path toward Food Security, http://southasia.ifpri.info/files/2013/03/Book_2013_GFPR_w80.pdf
Figure 13: Point to point general, food and non-foodinflation
0
3
6
9
12
15
De
c-0
5
May
-06
Oct
-06
Mar
-07
Au
g-0
7
Jan
-08
Jun
-08
No
v-0
8
Ap
r-0
9
Sep
-09
Feb
-10
Jul-
10
De
c-1
0
May
-11
Oct
- 11
Mar
-12
Au
g-1
2
% p
rice
infl
atio
n
General Food Non food
Source: BBS

21
many households are not adequately insured or otherwise protected, neither as consumers nor as producers. Volatility can also have knock-on effects on agricultural labour supply. Recent reports suggest the fall in rice price of early harvested boro can make labour migration less attractive, as wages are sometimes paid in paddy instead of cash, in haor and beel areas (with consequent shortage of labour for the harvest)49. On the other hand, low or reducing food price inflation harms producers and benefits consumers. According to HIES 2010, food constitutes 71% of total expenditure for the lowest expenditure decile of households, compared to 41% for the highest decile, implying that the poor benefit more from reducing food prices. Many poor rural households switch between being net producers and net consumers depending on the season, though they remain net consumers on a yearly basis. The share of food on total expenditure for the lowest decile is not significantly different between urban (75%) rural households (70%) so that the impact of price changes is not significantly different for urban and rural poor. 3.3.2 Issues and policy challenges
Progressive achievement of the right to food The normative framework for the right to food in Bangladesh is provided by Article 15(a) of the Bangladesh Constitution; Article 11 of the International Covenant on Economic, Social and Cultural Rights; Article 6 of the International Covenant on Civil and Political Rights; Articles 24 and 27 of the Convention on the Rights of the Child; and Articles 12 and 14 on the Convention on the Elimination of All Forms of Discrimination Against Women. These commit Bangladesh to “respect”, “protect” and “fulfil” the right to food – each implying a different level of obligation. Recently, several NGOs, including Oxfam, Action Aid, Angikar Bangladesh Foundation and Campaign for Sustainable Rural Livelihoods, have held national forums and briefings with parliamentarians on the right to food.50
Food, as a human right, means that it should be accessible regardless of purchasing power. Although the Government runs many food and non-food based safety net programmes to alleviate poverty and food insecurity, they are not run within an explicit rights-based framework, which implies a weaker entitlement whereby a person has the possibility, but not the right, to receive support to access food.
A strength of the rights-based approach is its systematic attention to inclusion, and in this regard, an NGO-umbrella organisation, called Shiree, launched on 30 November 2012 a Manifesto for the Extreme Poor. Involving stakeholders from Government, civil society, donors and the extreme poor, the manifesto includes recommendations to reduce extreme poverty, with potentially great practical relevance for addressing rights to food, by highlighting and substantiating the social and economic challenges to be addressed with respect to this particularly vulnerable group. Migration as self-protection Migration continues to be a major means to protect food access by households. International remittances exceeded 1.0 billion USD for 16 consecutive months until March
___________________________________________________________________________ 49 Wardad Y. (2013). Rice price fall hits migratory farm workers. Financial Express, 30 April 2012, http://www.thefinancialexpress-bd.com/more.php?news_id=128292&date=2012-04-30. 50 Analysis: The right to food in Bangladesh, http://www.irinnews.org/Report/97303/Analysis-The-right-to-food-in-Bangladesh.

22
2013, and amounted to over a tenth of GDP.51 Whilst there is some policy recognition concerning international migration, the policy issues regarding internal migration remain far less clearly articulated. This stands against the much greater importance for poorer households of internal migration rather than international migration. Migration is costly and risky, and the risks are largely uninsured and privately borne, and therefore international migration, although potentially more rewarding, is undertaken by better-off households. The cost structure of internal migration is accessible to a wider population, ranging from a reported zero cost for around a fifth of migrants and under-1500 taka cost for another third of migrants52.
Migrants on average consumed over 2.7% more calories per capita than non-migrants, and their family members left behind in rural areas consumed 3.3% more calories than those without a migrant in the family53. Whilst overall 2.8 times as much remittance comes from international migrants than internal migrants, amongst the poorest expenditure quintile this is reversed with 2.5 times as much remittance money coming from internal migrants than international migrants54. Remittances amount to 4.1% of household expenditure in the poorest quintile, in which internal migration is 2.9%55. Remittances are least in poorer divisions, Khulna, Rajshahi and Rangpur56. Randomised control trials in Bangladesh show that more households would migrate if the risks of migration were insured. Insurance mechanisms are policy measures that support migration such as special schemes for credit provision and cash incentives to help households avoid financially risky coping strategies such as borrowing from money-lenders or liquidation of assets.57 Promoting decent work through employment and skill development Earnings from employment are the main pathway to access food for households, especially poor households whose main asset is their labour. Public safety nets do not reach many poor households, and for many that do receive benefits, the amounts are vital for survival but often too little to help much beyond that, and therefore work remains the main ladder out of poverty for most households.
The Labour Force Survey Report 2011 estimates the number of unemployed at 2.6 million, of which 1.7 million are in rural areas and 0.9 million in urban areas. Domestic employment generation is projected to be just enough to absorb new workers – at the current employment elasticity of growth (0.4), around 1.3 to 1.6 million jobs could be generated per year until 2017, leading to a slightly declining unemployment rate from 13.6% in 2012 to 11.6% in 2017.58
The informal sector remains a large source of employment with consequent impacts on reliable access to food. The share of employment in the informal sector has declined from 80% in 2000 to 71% in 2010 – the figures in rural employment are 86% and 82%
___________________________________________________________________________ 51 Bangladesh Bank (2013). Selected Macroeconomic Indicators of Bangladesh, Monetary Policy Department, 10 April. 52 Hossain, M. Z., J. U. Ahmed and M. H. Kazal (2013). Rural-urban Migration and its Implications for Food Security in Bangladesh. NFPCSP supported Research Report. FAO, Dhaka. 53 Hossain, M. Z., J. U. Ahmed and M. H. Kazal (2013). Ibid. 54 IFPRI (2013). Bangladesh Integrated Household Survey 2011-12. 55 IFPRI (2013). ibid. 56 IFPRI (2013). ibid. 57 Khandker, S. R and W. Mahmud (2012). Seasonal Hunger and Public Policies: Evidence from Northwest Bangladesh. World Bank 58 World Bank (2013). Bangladesh Development Update, April.
23
respectively, and for urban employment are 54% and 44%59. The informal sector accounted for more than 40% of the total gross value added of Bangladesh in 2010, with the highest contributions in agriculture, fishery, trade, and industries where capitalization is relatively lower.60 Casual/irregularly paid workers work an average of 54 hours a week, while the unpaid family worker works 35 hours per week.
Skills development for participation in economic activities at home and abroad will contribute to higher productivity and incomes. The policy framework in this regard has been strengthened. The National Education Policy 2010 promotes skills development, introduces pre-vocational education and the need to adjust formal education to job market needs. The National Skills Development Policy 2011 expands the scope to include pre-employment training and job-centred courses. The National Education Act is under development. However, problems remain in disseminating the Skills Development Policy across all sub-sectors, closing huge coordination gaps and monitoring change.61 Income inequality high but slightly improved The results of HIES 2010 showed that 24.6% of total income is concentrated in the top 5% of households, while the bottom 5% accounts for 0.78% of the total income. Income inequality (measured by Gini coefficient) improved only marginally nationwide from 0.467 in 2005 to 0.458 in 2010, as a result of increasing disparity between urban and rural areas62: income distribution deteriorated in rural areas (Gini coefficient increasing from 0.428 to 0.431), while improving significantly in urban areas (Gini coefficient decreasing from 0.497 to 0.452). Gini coefficient higher than 0.40 indicated that gross income inequality exists both in rural and urban areas63. This needs to be addressed by promoting a more pro-poor, inclusive growth pattern and a reinforced focus on rural development.
A great deal of disparity was also observed across the Divisions of the country. The highest average monthly household income was recorded in Chittagong Division at 14,092 taka followed by Dhaka Division at 13,226 taka. The regions having lower monthly household incomes were Rangpur, Rajshahi and Khulna. Monthly income in Rangpur was almost half than in Chittagong Division (HIES 2010). Beside the greater Rangpur region, areas along the southern coastal belt have now emerged as new poverty pockets because of changes in agro climatic environment, including salinity intrusion and increased frequency, severity and unpredictability of natural disasters64.
The Bangladesh Demographic and Health Survey (BDHS) conducted in 2011 reveals the distribution of assets in terms of a household wealth index. In urban areas, 55% of the assets are owned by the wealthiest quintile and 6% by the poorest one; the corresponding figures in rural areas are 9% and 26%.
Regarding food consumption, national average per capita daily food intake increased from 952 grams in 2005 to 1000 grams in 2010, following a similar trend in rural and urban locations. Per capita rice consumption declined to 441.6 grams in rural areas and 344.2
___________________________________________________________________________ 59 Zhang, X. et. al. (2013). Rising Wages in Bangladesh. IFPRI Discussion Paper 01249, Washington DC. 60 ADB (2012). The Informal Sector and Informal Employment in Bangladesh, Asian Development Bank Manila. 61 Ahmed, T. (2013). Skills Development in Bangladesh Presented to the LCG on Education, 11 April. 62 In absolute term, monthly household expenditure was 62% higher for urban than for rural households. 63 IFPRI (2013), however, found significantly lower income inequality: Gini coefficient was 0.307 at national level, varying from 0.273 in Rangpur and 0.319 in Sylhet region. 64 Khandker, S. R and W. Mahmud (2012) op.cit.

24
grams in urban areas65. Consumption of relatively expensive food items such as milk and dairy, edible oil, meat, egg, fish, fruits and spices were higher in urban than in rural areas. As a result, the rural diet is significantly more unbalanced than the urban one with clear implications for nutritional outcomes. Access to food remains unstable Food security is achieved only when food is accessible all the time in adequate quantity and quality. The BDHS (2011) found a fifth of ever-married women aged 15-49 reporting that inthe 12 months before survey they ‘sometimes’, ‘rarely’ or ‘never’ had three square meals, defined as “full stomach” meals– and this rose to nearly half in the least wealthy quintile. Greater stability of access to food is indicated by those reporting ‘mostly’, as was the case for nearly everybody in the richest wealth quintile. In other words, about 20% of the adult women could not secure stable access to food neither through the market nor through public protective provisioning.
World Bank (2012)66 showed that in Rangpur the incidence of starvation varied across districts from 2% to 17% in the non-monga period and 26% to 58% during the monga period, the hungry season. The extent of full meals varied from 30% to 60% in the non-monga period and from 1% to 13% during the monga period67. The study suggests that in designing poverty alleviation and food security programmes, all seasonal, regional and intra-regional dimensions need to be taken into consideration. Access to food is also increasingly constrained by civil disturbances which cause disruption in mobility and slow down of business activities causing income losses68. For day labourers, it can cause the loss of dailyrevenue, threatening food security of the family 69.
3.4. NFP Objective 3 outcomes 3.4.1. Assessment Objective 3 of the NFP is to ensure adequate nutrition for all individuals, especially women and children. The assessment gives particular attention to dietary energy supply and intake, chronic energy deficiency among women, complementary feeding and micronutrient status. Dietary energy supply The share of cereals on Dietary Energy Supply (DES) hardly declined since the mid -90s; from 79.6% in 1995/96, to 78.1% in 2005-07 and 78.3% in 2007-09 (Table 5). This indicates that the supply of rice and wheat increased in line with the supply of other sources of calories.
___________________________________________________________________________ 65 The IFPRI (2013) study focusing exclusively on rural people, reported on average higher rice consumption (495.5 grams per capita per day) compared to the HIES 2010 results, with the lowest expenditure quintile consuming 427.3 grams compared to 565.2 grams in the top quintile. However, total per capita calorie consumption was estimated at 2243 kcal per capita per da y, significantly below the 2344.6 kcal per capita per day estimated for rural people in the 2010 HIES survey. Thus the IFPRI study points out an even more unbalanced composition of the rural diet than the HIES survey. 66 Khandker, S. R. and W. Mahmud (2012), op. cit. 67 It needs to be mentioned that the World Bank study of 2012 is based on data from household survey conducted by the Institute of Microfinance in the year 2006. Anecdotal evidence suggest that the severity of food deprivation in the monga-prone areas has been minimized to a considerable extent through introduction of short duration aman rice varieties such as BRRI Dhan 33, BINA 7 and also through intensification of safety net measures under public and private initiatives. 68 UNDP (2005). Beyond Hartals: Towards Democratic Dialogue in Bangladesh. UNDP, Bangladesh. March 2005. 69 The Financial Express, Dhaka. 30 April, 2012.

25
Per capita calorie supply is correlated with reduced undernutrition, especially at the lowest daily per capita energy supplies (below 2300 kcal/person)70. However, caloric adequacy is necessary but insufficient to address under-nutrition. Among countries meeting the MDG target to halve undernourishment, an indicator of caloric adequacy, less than a third are on track to meet the MDG target to halve child underweight. The trends in DES and dietary energy intake by food groups are discussed in more detail under section 6.1. Table 5: NFP Objective 3: Selected performance indicators
*This was 42% in 2007 and 37% in 2011 using the less restricted definition of minimum acceptable diet as per WHO recommendations.
Dietary energy intake Undernourishment, i.e. inadequate caloric intakes, still requires considerable attention. In the last 15 years (Table 6), per capita caloric intakes increased by slightly more than 4 calories per year. At this rate, 28 years would be needed to close the gap of 112 kcal between current per capita calorie consumption and the average normative requirement of 2,430 kcal. Consumption of cereals, including rice, decreased, both in absolute and relative terms, and had positive impact on dietary diversity (also see Programme 10). Indeed, as incomes grow, consumption patterns evolve towards more energy dense foods, such as animal products and edible oils.
Table 6: Intake of dietary energy, cereals and rice, 1995 - 2010
Source: HIES various years
The double burden of malnutrition among women A woman’s nutritional status results from her current food consumption, level of health, dietary composition, care received since childhood and past demands on health, such as during pregnancies. Low pre-pregnancy body mass index (BMI)71 and short stature are
___________________________________________________________________________ 70 Smith LC and L Haddad (2000). Explaining child malnutrition in developing countries: A cross country analysis, IFPRI, Washington DC. 71 By normalizing the weight of an individual over their height, the Body Mass Index (BMI) gives an indication of the thinness or obesity of
CIP/NFP PoA output proxy indicators 2007/08 2009/10 2010/11 2011/12 Target Source
National dietary energy supply from cereals (%)
78.1% (av. 2005-07)
78.3% (av.2007-09)
na na 60% (recommended) FAO - RAP
National dietary energy intake from cereals (%)
73% (2005)
na 70 na 60% (recommended) BBS, HIES
Chronic energy deficiency prevalence among women (BMI <18.5) (%)
33%
na
na 24.2% 20%
by 2015 BDHS
Proportion of children receiving minimum acceptable diet at 6-23 months of age (%)
na* na na 21% 52 by 2016
(HPNSDP MoHFW)
BDHS
Proportion of households consuming iodized salt (%)
na na na 82.3% 100% BDHS
Source/Year Energy intake (kcal) Cereals, g (En%) Rice, g (En%) HIES 1995 -96 2254 509 (78%) 464 (71%) HIES 2000 2240 487 (75%) 458 (71%) HIES 2005 2238 469 (73%) 440 (68%) HIES 2010 2318 464 (70%) 416 (62%)
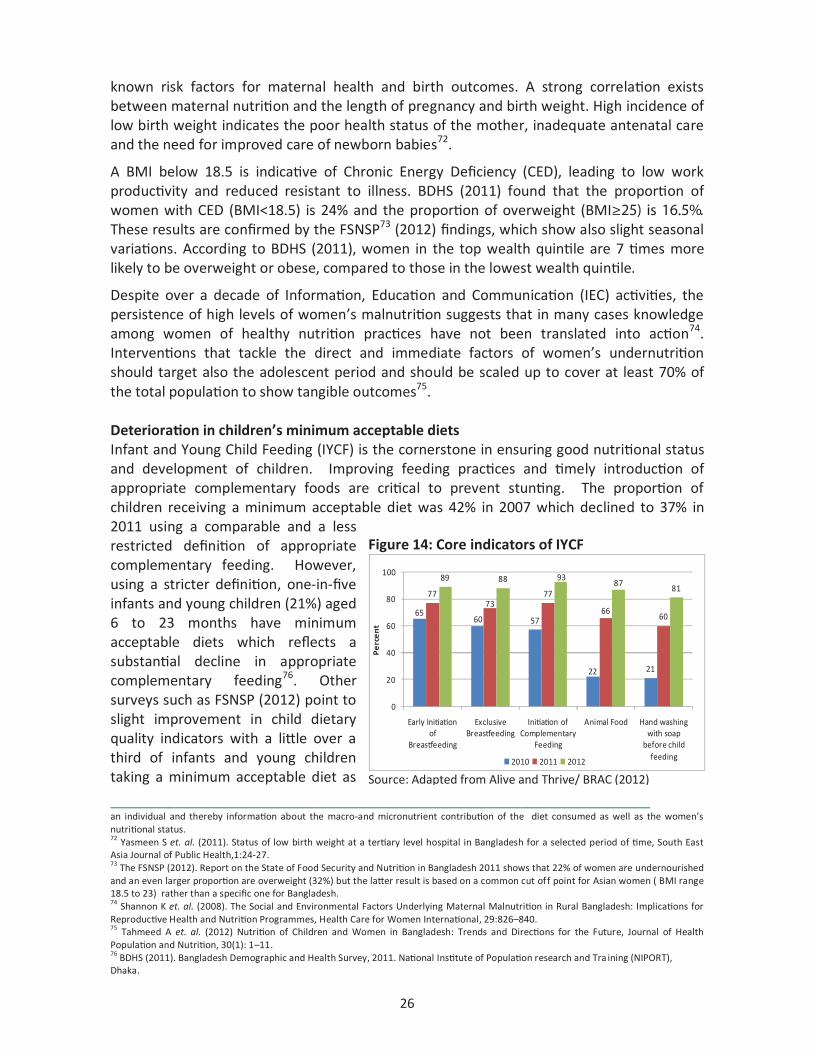
26
known risk factors for maternal health and birth outcomes. A strong correlation exists between maternal nutrition and the length of pregnancy and birth weight. High incidence of low birth weight indicates the poor health status of the mother, inadequate antenatal care and the need for improved care of newborn babies72.
A BMI below 18.5 is indicative of Chronic Energy Deficiency (CED), leading to low work productivity and reduced resistant to illness. BDHS (2011) found that the proportion of women with CED (BMI<18.5) is 24% and the proportion of overweight (BMI≥25) is 16.5%. These results are confirmed by the FSNSP73 (2012) findings, which show also slight seasonal variations. According to BDHS (2011), women in the top wealth quintile are 7 times more likely to be overweight or obese, compared to those in the lowest wealth quintile.
Despite over a decade of Information, Education and Communication (IEC) activities, the persistence of high levels of women’s malnutrition suggests that in many cases knowledge among women of healthy nutrition practices have not been translated into action74. Interventions that tackle the direct and immediate factors of women’s undernutrition should target also the adolescent period and should be scaled up to cover at least 70% of the total population to show tangible outcomes75. Deterioration in children’s minimum acceptable diets Infant and Young Child Feeding (IYCF) is the cornerstone in ensuring good nutritional status and development of children. Improving feeding practices and timely introduction of appropriate complementary foods are critical to prevent stunting. The proportion of children receiving a minimum acceptable diet was 42% in 2007 which declined to 37% in 2011 using a comparable and a less restricted definition of appropriate complementary feeding. However, using a stricter definition, one-in-five infants and young children (21%) aged 6 to 23 months have minimum acceptable diets which reflects a substantial decline in appropriate complementary feeding76. Other surveys such as FSNSP (2012) point to slight improvement in child dietary quality indicators with a little over a third of infants and young children taking a minimum acceptable diet as
___________________________________________________________________________ an individual and thereby information about the macro-and micronutrient contribution of the diet consumed as well as the women’s nutritional status. 72 Yasmeen S et. al. (2011). Status of low birth weight at a tertiary level hospital in Bangladesh for a selected period of time, South East Asia Journal of Public Health,1:24-27. 73 The FSNSP (2012). Report on the State of Food Security and Nutrition in Bangladesh 2011 shows that 22% of women are undernourished and an even larger proportion are overweight (32%) but the latter result is based on a common cut off point for Asian women ( BMI range 18.5 to 23) rather than a specific one for Bangladesh. 74 Shannon K et. al. (2008). The Social and Environmental Factors Underlying Maternal Malnutrition in Rural Bangladesh: Implications for Reproductive Health and Nutrition Programmes, Health Care for Women International, 29:826–840. 75 Tahmeed A et. al. (2012) Nutrition of Children and Women in Bangladesh: Trends and Directions for the Future, Journal of Health Population and Nutrition, 30(1): 1–11. 76 BDHS (2011). Bangladesh Demographic and Health Survey, 2011. National Institute of Population research and Tra ining (NIPORT), Dhaka.
Figure 14: Core indicators of IYCF
6560 57
22 21
7773
77
6660
89 88 9387
81
0
20
40
60
80
100
Early Initiation of
Breastfeeding
Exclusive Breastfeeding
Initiation of Complementary
Feeding
Animal Food Hand washing with soap
before child feeding
Pe
rce
nt
2010 2011 2012 Source: Adapted from Alive and Thrive/ BRAC (2012)

27
per the strict definition complying with WHO recommendations77. Over the last three years, community-based interventions and national media campaigns are improving IYCF practices among 8.5 million households with children less than 2 years of age78 - see Figure 14. An important gap for the enhancement of IYCF practices has been the absence of adequate tools. To fill this gap the Bangladesh Breastfeeding Foundation (BBF) has developed a complementary feeding manual using a “trials of improved practices” (TIPS) methodology79. It provides science-based guidance for mothers and care givers on types and quantities of foods, recipes, preparation and processing methods for appropriate complementary feeding80. Consumption of iodized salt BDHS 201181 showed that 82% of households consumed iodized salt, but the adequacy of iodization has not been reported. Trends in the usage of iodized salt in 109 programme upazilas of the NNP from 2004 to 2010 are shown in Figure 15. As of 2010, 92% of households in these upazilas consumed iodized salt, compared to 61% in 2004. However, there are concerns regarding the adequacy of iodine content in the salt sold and consumed. The 2011-2012 National Micronutrient Survey found that 80% of households use iodized salt (≥5%) while a meagre 57.6%82 on average take adequately iodized salt (≥ 15 ppm), with variability from 52% to 65% across socioeconomic groups (Table 7). The same survey shows that 76% of households use ‘brand salt’ while around a fourth use open salt. Moreover, there is a concern regarding how the salt is stored at household level, given that iodine is easily lost when salt is not kept in closed containers.
Table 7: Use of adequately iodized salt
Income category Percent Poorest 51.9 Poorer 56.3 Middle 57.8 Richer 64.8 Richest 65.1
Source: National Micronutrient Status Survey 2012
___________________________________________________________________________ 77 James P Grant School of Public Health (JPGSPH) and Hellen Keller International (HKI) (2012). State of Food Security and Nutrition in Bangladesh: 2011, JPGSPH and HKI, Dhaka, Bangladesh. 78 http://www.aliveandthrive.org/where-we-work/country/bangladesh 79 http://www.fao.org/ag/humannutrition/nutritioneducation/70106/en/ 80 BBF/FPMU/NFPCSP/FAO (2013) A Complementary Feeding Manual for Bangladesh. 81 NFP PoA and CIP Monitoring Report 2012. 82 National Micronutrient Status Survey, 2012.
Figure 15: Households using iodized salt in 109 National Nutrition Programme Upazilas
61
8285 86
94 92 92
50
60
70
80
90
100
2004 2005 2006 2007 2008 2009 2010
Perc
ent
Source: Health Bulletin 2012

28
Prevalence of anaemia and intake of iron rich foods Iron-deficiency anaemia (IDA) is a common anaemia (haemoglobin levels <12g/dl) caused by insufficient dietary intake and absorption of iron, and/or iron loss from bleeding which can be from a variety of sources such as intestinal, uterine or from the urinary tract.
The national prevalence of anaemia is 33.1% amongst preschool children, 19.1% amongst 6-11 year olds, 17.1% amongst 12-14 year olds and 26% amongst non-pregnant, non-lactating women (NPNL). The current prevalence of anaemia appears to be lower than the earlier nationally representative estimates. The exact reasons for the decline are unclear. However, a number of interventions have been put in place to address maternal anemia through iron and folic acid supplementation during pregnancy, antenatal care and nutrition counselling. Findings also pointed to very high iron levels in groundwater consumed through drinking water. Further, the current survey made use of a different assessment method compared to the one previously used which has varying reliability and accuracy.
Recent estimates report that dietary iron provides 41-82% of the RDA across population groups by age and sex. The dietary pattern of adolescent girls in Dhaka indicates poor consumption of milk, liver and leafy vegetables. The prevalence of anaemia among adolescents was 23% - and the results suggest that the majority knew what they needed to do to improve their nutrition, but not how to do it. Sixty five percent had correct knowledge about the causes of anaemia, 72% about its prevention and 80% about its treatment, but 74% were unaware of the sources of iron-rich foods.83 Given the overall poor nutritional status of urban adolescent girls, there is need for appropriate nutrition interventions to overcome the problem.
3.4.2 Issues and policy challenges Over the last three decades, Bangladesh put nutrition high on its development agenda. A multisectoral approach involving agriculture, social protection and education is required to provide entry points for improving nutrition outcomes84. Figure 16 shows an analytical framework for the range of required interventions, distinguishing between nutrition specific interventions and nutrition sensitive interventions, which mutually reinforce each other. Without attention to sustainable integrated programming and resilience, food productivity improvements may not result in desirable nutritional outcomes. Explicit attention must be given to the relationships between household agricultural opportunities and decisions, on one hand, and nutritional outcomes on the other. Integration with food safety, water, hygiene, sanitation, vector control and immunization will reduce the impact of disease on nutritional status. This approach is embedded in the AoIs identified in the PoA.
In Bangladesh, the mainstreaming of nutrition is guided by two principles:
1. Intervening at the different stages of the life cycle through the National Nutrition Services, MoHFW with a focus on the first 1000 days of life;
___________________________________________________________________________ 83 Kabir Y. et. al. (2010). Dietary pattern, nutritional status, anaemia and anaemia-related knowledge in urban adolescent college girls of Bangladesh, J Pak Med Assoc. 60(8): 633-8. 84 AED and FAO (2011). Deepening the dialogue: agriculture and nutrition collaboration to enhance global food security. Summary Report from the Open Forum held on November 1, 2010, Washington DC: AED.
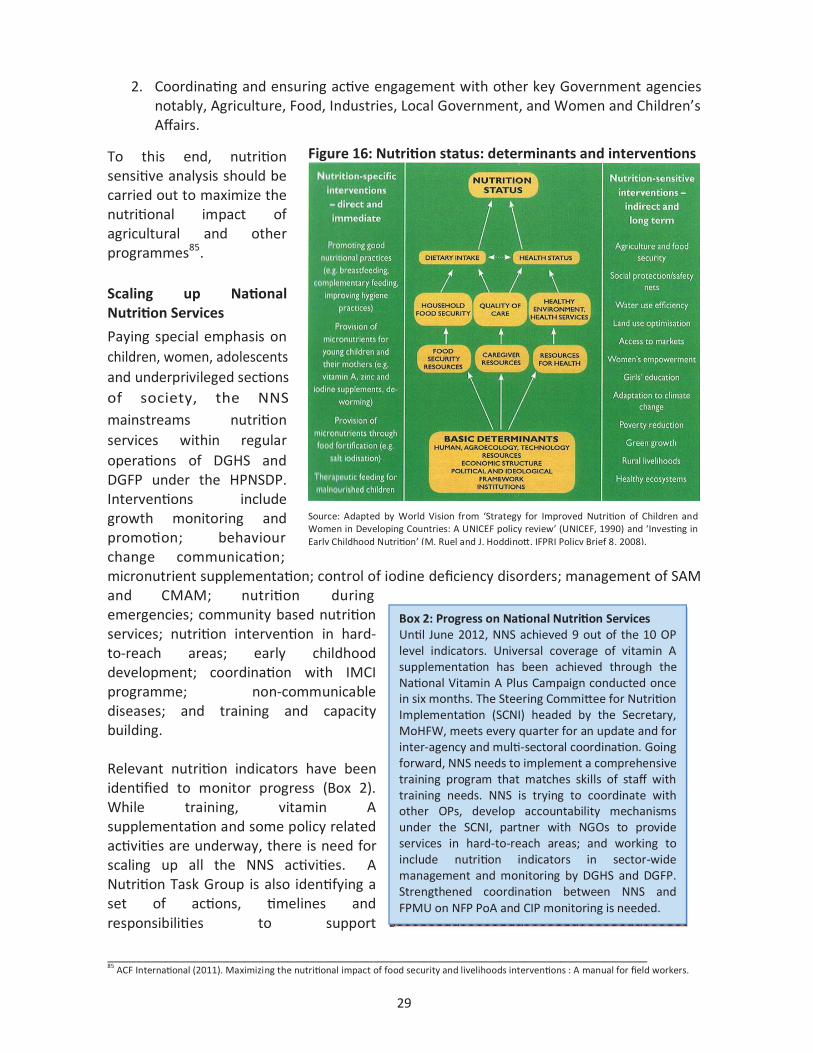
29
2. Coordinating and ensuring active engagement with other key Government agencies notably, Agriculture, Food, Industries, Local Government, and Women and Children’s Affairs.
To this end, nutrition sensitive analysis should be carried out to maximize the nutritional impact of agricultural and other programmes85. Scaling up National Nutrition Services
Paying special emphasis on children, women, adolescents and underprivileged sections of society, the NNS mainstreams nutrition services within regular operations of DGHS and DGFP under the HPNSDP. Interventions include growth monitoring and promotion; behaviour change communication; micronutrient supplementation; control of iodine deficiency disorders; management of SAM and CMAM; nutrition during emergencies; community based nutrition services; nutrition intervention in hard-to-reach areas; early childhood development; coordination with IMCI programme; non-communicable diseases; and training and capacity building. Relevant nutrition indicators have been identified to monitor progress (Box 2). While training, vitamin A supplementation and some policy related activities are underway, there is need for scaling up all the NNS activities. A Nutrition Task Group is also identifying a set of actions, timelines and responsibilities to support
___________________________________________________________________________ 85 ACF International (2011). Maximizing the nutritional impact of food security and livelihoods interventions : A manual for field workers.
Figure 16: Nutrition status: determinants and interventions
Source: Adapted by World Vision from ‘Strategy for Improved Nutrition of Children and Women in Developing Countries: A UNICEF policy review’ (UNICEF, 1990) and ‘Investing in Early Childhood Nutrition’ (M. Ruel and J. Hoddinott, IFPRI Policy Brief 8, 2008).
Box 2: Progress on National Nutrition Services Until June 2012, NNS achieved 9 out of the 10 OP level indicators. Universal coverage of vitamin A supplementation has been achieved through the National Vitamin A Plus Campaign conducted once in six months. The Steering Committee for Nutrition Implementation (SCNI) headed by the Secretary, MoHFW, meets every quarter for an update and for inter-agency and multi-sectoral coordination. Going forward, NNS needs to implement a comprehensive training program that matches skills of staff with training needs. NNS is trying to coordinate with other OPs, develop accountability mechanisms under the SCNI, partner with NGOs to provide services in hard-to-reach areas; and working to include nutrition indicators in sector-wide management and monitoring by DGHS and DGFP. Strengthened coordination between NNS and FPMU on NFP PoA and CIP monitoring is needed.
30
implementation. Issues of enhancing coverage and outreach are being carefully reviewed and addressed in the implementation. Preparations for an Annual Programme Review 2013 are underway. There is need to strengthen linkages between NNS and maternal, neonatal, child and adolescent health services to maximize impact. Enhance the role of women in agriculture and nutrition There is need to acknowledge and maximize the role of women in agriculture, which is not mainly confined to weeding, post-harvesting, processing, and preservation, but to promote technologies that allow balancing agricultural tasks and family care and to strengthen women focused nutrition-sensitive agriculture interventions. Evidence from integrated food and nutrition projects shows that engagement in homestead poultry rearing can increase egg production and consumption by children and reproductive-age women86. Similarly, in a vegetable and polyculture fish production programme there was an increase in vitamin A consumption, improvements in weight-for-age z-scores for children, a decrease in stunting by 28 percentage points among girls and 43 percentage points among boys, and increases in body mass index for women, despite the absence of long-term income effects.87 Implement the Non Communicable Disease (NCD) strategy NCDs88 are becoming increasingly common because of increasing longevity and high prevalence of contributing factors such as tobacco use, obesity, physical inactivity and unhealthy diets. The NCD risk factor survey 2011 revealed that 99% of the population in Bangladesh has at least one risk factor. Prevention programmes are in their early phase as priority is still given to control of infectious diseases. The Non Communicable Disease Control (NCDC) strategy, under the HPNSDP 2011-2016, aims to strengthen health service delivery; promote healthy lifestyle and practices and develop an effective public health surveillance system89. One of the first steps is to facilitate screening of diabetes and hypertension at community clinics in addition to mass awareness campaigns and school curricula update. Multisectoral initiatives that mobilize other sectors like LGRD & C and Ministry of Youth are urgently warranted. Affordable recreational facilities, public parks and nutrition behaviour change clinics and centres to promote healthy life styles and diets need to be established. Improve food safety, hygiene and sanitation There is a need to increase awareness regarding the interconnections between unsafe food and water, unhygienic practices, diseases and malnutrition. Consumer supply and demand for safe and healthy food along with hygiene education, centered on a number of simple messages, are essential to break the cycle of food and water-borne diseases. One of the major determinants in stunting is the access to improved sanitation facilities. According to the BDHS (2011), stunting, particularly among children aged 18 to 23 months is high, perhaps because young children come into contact with faeces in their environment daily and face the risk of infections90, with only 33.7% of households having improved toilet ___________________________________________________________________________ 86 Institute of Nutrition and Food Science (2003). Dhaka University, Tufts University Friedman School of Nutrition Science and Policy. Bangladesh Integrated Nutrition Project Garden and Poultry Projects: Process and Impact Study. 87 Kumar N, Quisumbing A (2010). Access, Adoption, and Diffusion: Understanding the Long-term Impacts of Improved Vegetable and Fish Technologies in Bangladesh. Discussion Paper 00995. Washington, DC: International Food Policy Research Institute. 88 Includes coronary heart disease, stroke, hypertension, diabetes, cancer and chronic respiratory disease and others. 89 MoHFW/WHO (2011). Strategic Plan for Surveillance and Prevention of Non Communicable Diseases in Bangladesh 2011-2015. 90Bill and Melinda Gates Foundation (2012). Water, Sanitation & Hygiene: Strategy Overview. Seattle, USA.

31
facilities. There is also a need to create demand for safe water and sanitation facilities. WASH Projects91 that are working on improving access to safe water, sanitation and hygiene practice in hard to reach areas and vulnerable groups, including women and children, need to be scaled up.
___________________________________________________________________________ 91 Water, Sanitation and Hygiene (WASH) 2011, UNICEF/WaterAid/others.


33
4. Availability: progress towards CIP and NFP PoA outputs
A number of socio-economic and environmental factors such as the reduction of the natural resource base per capita, the increasing threat of climate change, as well as insufficient availability of high quality agricultural inputs reduce the country's potential to achieve adequate and stable supply of safe and nutritious food. The interventions proposed in the CIP address food availability through Programmes 1 to 5, covering agricultural production in the broader sense (crop, fisheries, livestock, agro-forestry, water management and climate change adaptation). These Programmes correspond to eight Areas of Intervention of the NFP PoA. A detailed synoptic description of the interventions planned under the two strategic documents is provided in the following paragraphs. 4.1. Programme 1: Sustainable and diversified agriculture through integrated research and extension
Programme 1 of the CIP focuses on promoting intensification, diversification and resilience to climate change of crop production through the generation and propagation of sustainable technologies. It covers the investments needed to operationalize the NFP PoA AoI 1.1 on research and extension activities and AoI 1.4 on agricultural diversification for crops, and is also relevant for the implementation of the PoA AoI 1.9 on developing early warning systems and AoI 2.1 on agricultural disaster management. 4.1.1. Progress towards achievements
The widespread use of modern or high yielding varieties has helped Bangladesh to move away from serious import dependence to self-sufficiency in rice, despite a substantial increase in population and a decrease in arable land since its independence in 197192. Given a population growth already below 1.3% and projected to reach 1% in the next decade, in presence of declining per capita consumption of rice, a comparable annual growth of rice production should be sufficient to provide adequate supply. However, considering that cultivable land is being lost at an annual rate of 0.5%93, increase in rice yield of at least 2% per year is required in order to maintain the current level of self-sufficiency and allow releasing land and other resources as required for diversifying agricultural production.
Development of new crop varieties accelerated In 2011/12, the Bangladesh Rice Research Institute (BRRI) released three new stress tolerant(BRRI Dhan 55, 56 and 57) and one short duration (BRRI Dhan 58) rice varieties. BRRI Dhan 55, is a moderate salinity and cold-tolerant variety with a per hectare yield of seven tons, particularly suitable for cultivation both in the salinity-prone southern region and in the cold-hit northern region. BRRI Dhan 56 and BRRI Dhan 57 are capable of surviving without rain for up to one month. The short duration BRRI Dhan 58 matures about 7 days earlier than the widely accepted BRRI Dhan 29 and can be particularly suited for haor and flash-
___________________________________________________________________________ 92 Hossain, M., M. L. Bose, and B.A. Mustafi. (2006). Adoption and Productivity Impact of Modern Rice Varieties in Bangladesh. TheDeveloping Economies 44(2): 149–166. 93 Hassan, N. (2013). Trends in the availability of agricultural land in Bangladesh, Draft final report, NFPCSP financed project.
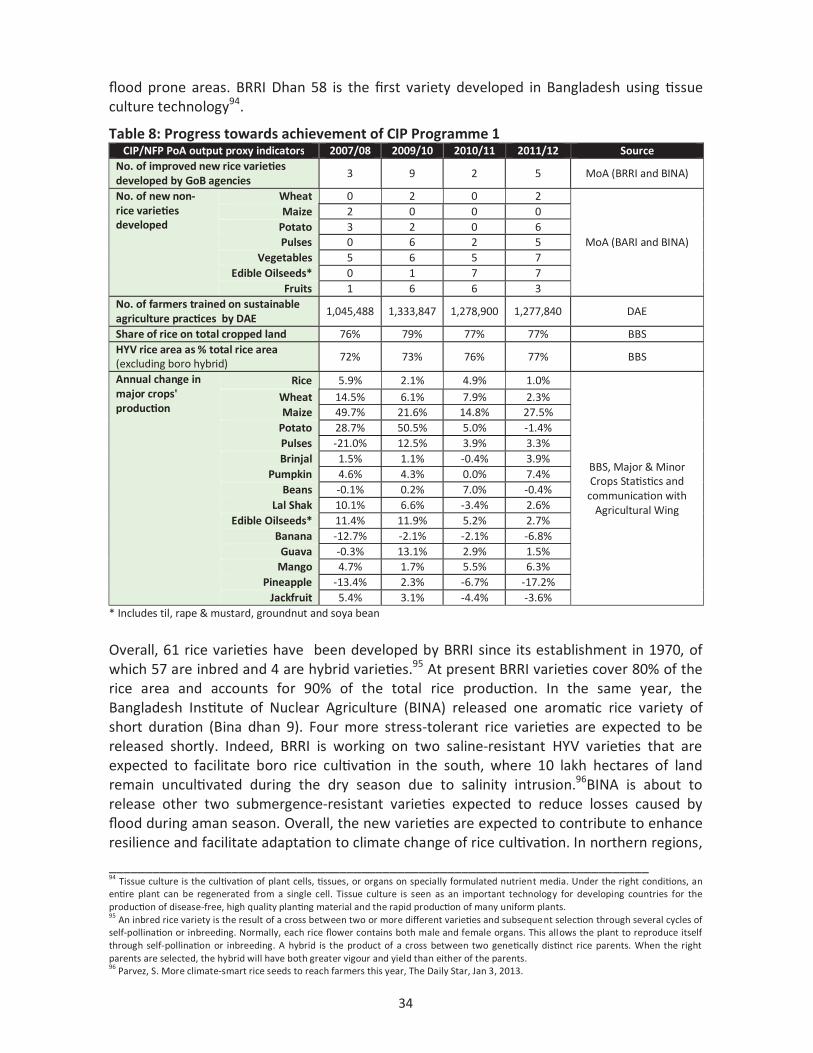
34
flood prone areas. BRRI Dhan 58 is the first variety developed in Bangladesh using tissue culture technology94.
Table 8: Progress towards achievement of CIP Programme 1 CIP/NFP PoA output proxy indicators 2007/08 2009/10 2010/11 2011/12 Source
No. of improved new rice varieties developed by GoB agencies
3 9 2 5 MoA (BRRI and BINA)
No. of new non-rice varieties developed
Wheat 0 2 0 2
MoA (BARI and BINA)
Maize 2 0 0 0 Potato 3 2 0 6 Pulses 0 6 2 5
Vegetables 5 6 5 7 Edible Oilseeds* 0 1 7 7
Fruits 1 6 6 3 No. of farmers trained on sustainable agriculture practices by DAE
1,045,488 1,333,847 1,278,900 1,277,840 DAE
Share of rice on total cropped land 76% 79% 77% 77% BBS HYV rice area as % total rice area (excluding boro hybrid)
72% 73% 76% 77% BBS
Annual change in major crops' production
Rice 5.9% 2.1% 4.9% 1.0%
BBS, Major & Minor Crops Statistics and
communication with Agricultural Wing
Wheat 14.5% 6.1% 7.9% 2.3% Maize 49.7% 21.6% 14.8% 27.5%
Potato 28.7% 50.5% 5.0% -1.4% Pulses -21.0% 12.5% 3.9% 3.3% Brinjal 1.5% 1.1% -0.4% 3.9%
Pumpkin 4.6% 4.3% 0.0% 7.4% Beans -0.1% 0.2% 7.0% -0.4%
Lal Shak 10.1% 6.6% -3.4% 2.6% Edible Oilseeds* 11.4% 11.9% 5.2% 2.7%
Banana -12.7% -2.1% -2.1% -6.8% Guava -0.3% 13.1% 2.9% 1.5%
Mango 4.7% 1.7% 5.5% 6.3% Pineapple -13.4% 2.3% -6.7% -17.2%
Jackfruit 5.4% 3.1% -4.4% -3.6% * Includes til, rape & mustard, groundnut and soya bean
Overall, 61 rice varieties have been developed by BRRI since its establishment in 1970, of which 57 are inbred and 4 are hybrid varieties.95 At present BRRI varieties cover 80% of the rice area and accounts for 90% of the total rice production. In the same year, the Bangladesh Institute of Nuclear Agriculture (BINA) released one aromatic rice variety of short duration (Bina dhan 9). Four more stress-tolerant rice varieties are expected to be released shortly. Indeed, BRRI is working on two saline-resistant HYV varieties that are expected to facilitate boro rice cultivation in the south, where 10 lakh hectares of land remain uncultivated during the dry season due to salinity intrusion.96BINA is about to release other two submergence-resistant varieties expected to reduce losses caused by flood during aman season. Overall, the new varieties are expected to contribute to enhance resilience and facilitate adaptation to climate change of rice cultivation. In northern regions,
___________________________________________________________________________ 94 Tissue culture is the cultivation of plant cells, tissues, or organs on specially formulated nutrient media. Under the right conditions, an entire plant can be regenerated from a single cell. Tissue culture is seen as an important technology for developing countries for the production of disease-free, high quality planting material and the rapid production of many uniform plants. 95 An inbred rice variety is the result of a cross between two or more different varieties and subsequent selection through several cycles of self-pollination or inbreeding. Normally, each rice flower contains both male and female organs. This allows the plant to reproduce itself through self-pollination or inbreeding. A hybrid is the product of a cross between two genetically distinct rice parents. When the right parents are selected, the hybrid will have both greater vigour and yield than either of the parents. 96 Parvez, S. More climate-smart rice seeds to reach farmers this year, The Daily Star, Jan 3, 2013.

35
cold resistant varieties of wheat would be helpful. In addition, BRRI is also working to develop vitamin and iron fortified rice varieties.
For other crops, in 2011/12, the Bangladesh Agricultural Research Institute (BARI) developed 2 disease resistant varieties of wheat, 3 high yielding varieties of pulses, 5 of vegetables including 3 hybrids for brinjal and tomato, 6 of potato and 3 of fruits. BINA developed 2 pulses, 7 oilseeds and 1 vegetable variety. Research activities related to development of wheat, potato, pulses and vegetables varieties have accelerated in 2011/12 as 20 new varieties have been developed compared to only 7 in 2010/11 (Table 8). This progress can have positive impacts on crop diversification if the corresponding extension services are also developed. In addition to NARS institutes, other institutions such as the Bangladesh Agricultural University and BRAC are contributing to developing varieties. At present BRAC is researching on rice, maize and vegetables in its nine agricultural farms in different agro-ecological zones of the country in collaboration with national and international organizations.97 No increase in numbers of farmers trained The Department of Agricultural Extension (DAE) with 12,875 Sub-Assistant Agricultural Officers (SAAOs) operating all over the country is the main provider of training to farmers, although various other government and non-government agencies also provide training to promote environmentally sustainable practices in the use of soil, water and chemical inputs. The number of farmers trained by DAE decreased slightly to 12.78 lakh in 2011/12 from 12.79 lakh in 2010/11, mainly due to reduction in project based formal training from 7.1 lakh farmers in 2010/11 to 6.0 lakh farmers in 2011/1298. The effectiveness of DAE is constrained by the availability of resources to finance costs additional to salaries, such as transportation, communications, fiscal infrastructure and others, which are often financed through projects.99 Area planted to rice remained stable, productivity increased The share of rice on total cropped land remained stable at 77% in 2011/12 after 2 years of slow decline. This indicates that production growth was only driven by intensification. Indeed, the share of HYV rice on total rice area increased slightly to 77% in 2011/12 from 76% in 2010/11 with a steady increase since 2007/08. This shift contributed to increase average rice yield. However, the utilization of hybrid rice varieties during the boro season continues its downward trend after the breakthrough registered in the aftermath of the food price crises (Figure 17). Reportedly, available hybrid varieties ___________________________________________________________________________ 97 http://www.brac.net/content/bangladesh-agriculture-food-security-agriculture-research-and-development#.UVEVQcr2rPY 98 DAE delivers two types of trainings: the informal day to day advice provided by the SAAOs and the formal training imparted through different projects under DAE. 99 USAID (2011). Transformation of agricultural research, education and extension in Bangladesh. Bangladesh Agricultural Transformation Program Publication 9, Washington DC.
Figure 17: Boro rice varieties
2.7% 2.6% 2.3% 1.7% 1.5%
80.1% 80.2% 83.1% 84.6% 85.1%
17.2% 17.3% 14.6% 13.8% 13.4%
0%
20%
40%
60%
80%
100%
2007/08 2008/09 2009/10 2010/11 2011/12
% o
f to
tal B
oro
are
a
Local HYV Hybrid Source: BBS

36
have unattractive physicochemical characteristics, while problems have emerged in terms of high seed cost compared to grain quality and price, inconsistent yield performance, acceptability by some public sector extensionists, researchers and to some extent policy makers.100 Production growth slowed down for rice and wheat, but is picking up for vegetables The growth of foodgrain production has slowed down in 2011/12 with an annual increase of 1.0% and 2.3% for rice and wheat, respectively, compared to 4.9% and 7.9% a year earlier (Table 8). Maize production registered a record yearly increase of 27.5%. Potato production marginally declined, contributing, jointly with the increasing storage costs, to sustain prices, while new export opportunities are being explored101. Pulses and oilseeds production continued to rise though at a reduced rate compared to the previous year. Vegetable production accelerated, but fruits exhibit mixed trends: mango and guava maintained the upward trend while banana, pineapple and jackfruit production declined. Some crop diversification but no significant recent agricultural diversification Over the last 10 years, area under wheat, oilseeds, pulses, sugarcane and fruits declined, while maize, vegetables, spices and potato expanded. Between 2007/08 and 2010/11, wheat, maize, sugarcane and fruits area dropped respectively by 4%, 26%, 10% and 5% (Figure 18). By contrast, pulses, oilseeds, vegetables, spices and potato area rose by 11%, 6%, 29%, 7% and 15%, respectively. In other words, pulses and oilseeds area rebounded from a negative trend. For maize the decline is explained by the record expansion in area planted, registered in 2007/08, but -except for this special year- the growing trend continues. Vegetables area increased steadily, while fruits area declined, though at a slower pace in the last few years. Wheat area continues declining, albeit at a slower pace in more recent years, whilst potato area continued expanding at sustained rates. Different factors contributed to this development, including the change in evolution of demand and change in relative profitability of the various crops, as well as the availability of newly developed modern varieties -especially for pulses and oilseeds- and related extension services.
___________________________________________________________________________ 100 Rashid, H. et.al. (2011). A study on hybrid rice in Bangladesh, report submitted to IFPRI. 101 It is reported that Agri concern Bangladesh, a NGO, started exporting quality potatoes to different foreign countries, particularly Malaysia and Singapore. http://www.thedailystar.net/beta2/news/quality-potatoes-for-export-but-priced-too-low/
Figure 18: Area under major non-rice crops
0
15
30
45
60
75
90
Lakh
acr
e
Jute
Spices
Vegetables
Fruits
Sugarcane
Potato
Pulses
Oilseeds
Maize
Wheat
Source: Bangladesh Bureau of Statistics

37
Agricultural diversification improved in the earlier part of the last decade but deteriorated thereafter (Figure 19) as shown by the fact that the share of rice on total agricultural value added after falling by over 5% between 2000/01 and 2006/07 has partly recovered thereafter. Conversely, the increase in minor crops registered in the first part of the decade has partly reversed, though there are some limited sign of recovery in the last few years. Animal production has similarly expanded till 2006/07, but has slowly declined thereafter. The share of fishery has remained quite stable at about 22% of agricultural GDP, while forestry has slowly but consistently expanded. Overall, it appears that in terms of share on GDP, the relative share of rice during the first part of the last decade has been reverted by the food price crises, which gave new impetus to rice production and price. This trend seems however, to have reached a maximum.
4.1.2. Policy developments/programmes underway and needs for further action
Enhance research and knowledge generation in a sustainable manner The CIP (2011) subprogramme 1.1 emphasizes the role of research and technology development to increase productivity in varied ecosystems. This requires strengthening human, physical and institutional capacities of key research players. Under this subprogramme, the CIP 2013 includes 4 completed, 28 ongoing and 2 pipeline projects, for the enhancement of knowledge generation and adoption to increase agricultural productivity and diversity in a sustainable manner. Out of the ongoing projects, 15 were initiated in 2010-11 and eight more in 2011-12. Total financing under this subprogramme stands at 144.2 million USD or 2.3% of the total financed CIP, out of which 94.5 million USD are financed by the government and the remaining 46.6 million USD by various Development Partners.
Subprogramme 1.3 “Promote the development of responses to adapt agricultural systems to climate change” includes 4 ongoing projects specifically focusing on research and extension for climate adaptation, of which 2 were started in FY 2011-12. The subprogramme has a financed budget of 112.7 million USD (1.8% of total CIP), out of which 58.4 million USD is financed by DPs. More importantly, the pipeline now consists of 13 projects for a total of 389.1 million USD.
In order to strengthen research capacity, the Government has increased the budget for the research institutes under NARS (including BARC) from 4.03 billion taka in 2011/12 to 4.90 billion taka in 2012/13102 with an increased share in total National Budget from 0.25% to ___________________________________________________________________________ 102 MTBF, MoA. http://www.mof.gov.bd/en/budget/12_13/mtbf/en/MBF_43_Agriculture_English.pdf
Figure 19: Share of subsectors in agricultural GDP
40
39
39
39
36
36
35
35
37
36
36
16
17
16
17
19
19
19
19
17
18
19
12
12
12
13
13
13
13
13
13
13
13
7
8
8
8
8
8
8
8
9
9
9
22
23
22
22
22
22
22
22
22
22
22
0 20 40 60 80 100
2000-01
2001-02
2002-03
2003-04
2004-05
2005-06
2006-07
2007-08
2008-09
2009-10
2010-11
% of Agricultural GDP
Paddy
Other major cropsMinor crops Animal farming
ForestryFishing
Source: BBS

38
0.26%. The SFYP emphasized the need to re-examine focus and priorities of the present research system so as to avoid fragmentation and duplications, re-orient its focus from commodity to farming system; and promote problem solving research tailored to different agro-ecological zones. Equally important is to reinforce the link between research and extension.
Bangladesh Agricultural Research Vision-2030103 has identified the following research priorities: ensuring food security and consumption of safe and nutritious food; enhancing capacity on knowledge generation and management; exploiting the potentials of bio-technology; valorizing breeding options for crop improvement; identifying technological interventions required in unfavorable agri-ecosystems; enhancing efficiency of natural resources management; strengthening mechanization; fostering adaption to climate change and bio-risk management; promoting agricultural diversification; and improving post-harvest management and value addition. A variety development policy for the development of stress resistant, early-maturity and short duration crop variety has been drafted by BARC104.
The “Bangladesh Agricultural Research Council Act” approved in 2011 aims at fostering coordination of research activities conducted by different institutes. This Act strengthens BARC’s coordinating role making it responsible for allocating financial resources to the various NARS institutes and for the approval of the research programmes conducted by all of the institutes which, however, remain under the supervision of different ministries. This is expected to reduce duplication of research efforts and enhance accountability.105 Improvement of agricultural extension services The PoA and CIP stressed on improvement of extension services to propagate knowledge and practices, supported by community based experimentation and learning and indigenous knowledge. Interventions are needed in the areas of technology adoption and community-based learning (farmers’ skill training, soil health improvement, cultivation of quick growing fruits and vegetables, farm mechanization, vaccines, treatment of animals, etc.) and promotion of sustainable agriculture, livestock and fishery, including implementation of the Southern Delta Master Plan. For the success of these interventions, human and infrastructural capacities of organizations engaged in the delivery of extension services, including DAE, DLS and DoF, require strengthening. In this regard, the CIP 2013 under subprogramme 1.2 “Improve extension service to propagate knowledge and practices, supported by community-based experimentation and learning and indigenous knowledge" includes, in addition to 7 completed projects, 24 ongoing projects, of which 9 started in FY 2010 -11 and 6 in 2011-12. Completed and ongoing projects account for a budget of 204.5 million USD, of which 158 are financed by the government and the rest by DPs. The subprogramme absorbs 3.3% of the total CIP financed budget. Additional 12 projects are in the pipeline and expect financing for a total of 227 million USD.
___________________________________________________________________________ 103 BARC (2012). Agricultural Research Vision 2030, Final Report (http://www.pcu-natp.gov.bd/pdf/20120503041218_FinalAgriculturalResearchVision-2030.pdf) 104 http://www.moa.gov.bd/Flood_Damage/policy_converted.pdf 105 Rahija, M. et.al. (2011).Bangladesh: recent development in Public agricultural research, country note, ASTI.

39
As mentioned above, DAE with a force of 12,875 extension workers and 2000 extension personnel remains the largest public extension agency with presence at national, divisional, district, upazila and village levels. Along with DAE, a variety of other agents is involved in the delivery of extension services. These include public research cum extension organizations, Agricultural Universities, donor supported rural development programmes, non-government organizations, private agro-chemical input suppliers, public community development and agricultural extension service providers, etc. However, this plurality of agents is not always able to address all farmers' needs, especially in marginal areas such as char, haor and river bank areas. To coordinate, enhance capacity and maximize impacts of the extension system, the government has recently revised the New Agricultural Extension Policy (1996) adopting the National Agricultural Extension Policy (NAEP, 2012). The main facets of the new policy are: coordination and integration of the extension services; implementation of a market-led, demand responsive, pluralistic and decentralized bottom-up approach to extension; support to farmers groups and promotion of public-private partnerships; strengthening the one-stop service centres; digitalization of agricultural services; reinforcing research-extension-farmers’ linkages and farmers’ linkages with marketing and processing; promotion and adoption of biotechnology, organic and green farming, homestead gardening and farm mechanization; supporting urban agriculture; enhanced disaster management and adaptation to climate change; supply of quality seeds and other inputs; addressing gender issues in agriculture by valorizing and encourage women’s participation; and strengthening monitoring and evaluation.
The needs for further action in this area include:
Focusing on coordinated, demand-driven and integrated research: In line with the SFYP, the research system needs to be focused on coordination and integration for avoiding fragmentation and duplicating of its efforts. The research approach needs to be increasingly focused on farming systems or integrated production systems rather than individual commodities. Its planning, programme monitoring and coordination must be strengthened. The Bangladesh Agricultural Research Council Act, approved in 2011, and the Bangladesh Agricultural Research Vision 2030, adopted in 2012, are important steps in this direction and need to be fully implemented.
Allocating of larger budget for agricultural research: Public spending in agricultural research is very low in Bangladesh compared to even neighbouring countries such as India. Bangladesh’s agricultural research intensity measured by agricultural R&D spending as a share of agricultural GDP stood at 0.32% in 2009 against 0.4% in India106. Research funding needs to be scaled up in order to allow the technological breakthrough needed to secure the required intensification, diversification, sustainability and resilience to climate change and natural disasters of national agriculture. In presence of a tight budget constraint, a trade-off emerges between funding allocation to research versus other agricultural expenditures such as input subsidies.
Strengthening of human, physical and institutional capacities of key research institutes: The number of researchers and their skills are significantly below requirement. In 2010, more than 20% of scientific positions remained unfilled107. In 2011/12, only 43% of total budget allocated to research institutes under NARS is
___________________________________________________________________________ 106 http://www.ifpri.org/sites/default/files/publications/astisouthasiasynthesis.pdf 107 Rahija, M. et.al. op.cit.

40
identified as the development budget and is mainly used for financing research projects, while the rest is classified as revenue budget and covers the cost of staff and other running expenses108. Training and mentoring of junior scientists remains an urgent priority, while the system of incentives, e.g. salary structure and promotion system, need to be updated. Also, research facilities such as laboratories and other infrastructure need to be modernized.
Strengthening linkages among research, extension, education and farmers: In Bangladesh agricultural research, education and extension are not adequately linked. Stronger linkages would reduce yield gaps. Field officers stated that new technology normally takes 5-7 years to be successfully popularized109. The recently adopted NAEP (2012) in line with the SFYP emphasizes the need to strengthen these linkages. To this effect researchers need to be involved in planning extension activities based on demand for on-farm technology validation; extension service providers need to be trained on technologies newly developed by research institutes; participatory action research needs to be undertaken involving extension service providers and farmers; and empowerment of farmers is important. Other suitable initiatives include the organization of participatory annual technology review workshops complemented by a feedback procedure involving all relevant actors.
Strengthening the One Stop Service Centre: In line with NAEP (2012), all field extension personnel of DAE, DLS, DoF, in collaboration with NGO and private companies need to provide integrated services for all farmers. The Farmers Information and Advice Centre (FIAC) housed in UP complex can work as the reference for the one stop service center.
Increasing farmers’ participation and use of ICT in extension service: Extension services should be problem solving, able to address genuine demands of the farmers, rather than supply-driven. In line with NAEP (2012), ICT can be used to facilitate farmers’ participation and better linking the marketing and production system through web and mobile based technologies. Digitized databases and management information systems may be set up at upazila, district and national levels. Mobile based text messages and voice messages may be utilized for early warning on pest and disease outbreaks, natural disasters as well as to disseminate critical information.
Increasing the number and efficiency of extension workers: At present each Sub-Assistant Agricultural Officer (SAAO) is responsible to visit 1000-1200 farmers, compared to 280 in countries like China and Vietnam110. Beside the number, the gender balance between extension workers requires attention to more effectively reach out to rural women and maximize their role in agricultural production and in activities that have a key role for maximizing nutrition outcomes of agricultural activities such as homestead gardening and specific food utilization practices. Indeed, available evidence shows that female household heads are less likely to get extension services and are less likely to access quality services than their male counterparts111. Besides, the efficiency of extension services can be improved through training, skill development, institutional strengthening and logistic support. Insufficient extension services may jeopardize the implementation
___________________________________________________________________________ 108 MTBF, MoA. 109 Haque, J. T. Agrarian transition and livelihoods of rural poor: agricultural extension services, Draft Report, Unnayan Onneshan. 110 http://www.farmingfirst.org/wordpress/wp-content/uploads/2012/06/Global-Forum-for-Rural-Advisory-Services_Fact-Sheet-on-Extension-Services.pdf 111 http://www.ifpri.org/sites/default/files/publications/essprn21.pdf

41
of good programmes112. Coordination among different extension agencies (GO, NGO and private) is essential to increase efficiency and effectiveness.
4.2. Programme 2: Improved water management and infrastructure for irrigation purposes
Programme 2 of the CIP aims to ensure sustainable and efficient water management to address farmers’ needs. It covers the investments required under the NFP PoA 1.2, which deals with the use and management of water resources, advocating for the expansion of irrigation coverage, improved efficiency, delivery and safety of water use and reduced dependency on groundwater irrigation. Programme 2 is articulated along 3 subprogrammes focusing on (1) improve water management and water distribution systems at farm level, (2) improve and increase efficiency of surface water irrigation particularly in the south, (3) reduce impacts of saline water intrusion in the south, and (4) enhance river flow to the south. 4.2.1 Progress towards achievements Table 9: Progress towards achievement of CIP programme 2
Irrigation coverage continues expanding The share of cropped area under irrigation continued expanding since the approval of the PoA, increasing from 44% in 2007/08 to 47% in 2011/12 of the total cropped area (Table 9), as a result of continuous small scale infrastructure development mainly carried out by the Bangladesh Water Development Board (BWDB) and the Bangladesh Agriculture Development Corporation (BADC). Dependency on groundwater did not increase Irrigation remains largely dependent on groundwater as only a little more than one-fifth of
___________________________________________________________________________ 112 For instance, the Ministry of Agriculture has reduced the targeted coverage of the African drought tolerant variety 'Nerica' this aus season, following crop failure last year, partly due to poor extension service: http://www.thefinancialexpress-bd.com/index.php?ref=MjBfMDRfMDlfMTNfMV8yXzE2NTg5MQ==
CIP/NFP PoA output proxy indicators 2007/08 2009/10 2010/11 2011/12 Source
% of cropped area under irrigation 44.2% 45.3% 45.8% 46.8%
BBS Major & Minor Crops Statistics and
communication with Agricultural Wing
Water table depth in Northern region, average yearly change over last 20 years (cm/year)
7.0 (2007)
8.3 (2009)
13.7 (2010)
11.6 (2011) BADC
Water table depth in Northern region, average yearly change over last 3 years (cm/year)
14.1 (2007)
27.1 (2009)
45.9 (2010)
31.0 (2011) BADC
Surface water irrigation area as % of total irrigation area
23.3% 22.0% 21.3% 21.3%
BBS Major & Minor Crops Statistics and
communication with Agricultural Wing
Irrigation cost per acre as % of total boro production cost
16.3% 15.8% 14.2% 13.6% MoA

42
the cropped area is irrigated by surface water. The share of surface water irrigation in total irrigated area remained unchanged in 2011/12 after continuous decline since 2007/08. Groundwater table depth reduced in 2011 contrary to the trend Pressure on groundwater is reflected in declining aquifer levels. This is of particular concern in the northern districts of Bangladesh. Figure 20 shows how the groundwater table depth deepened from 3.7 m in 1981 to 6.6 m in 2011, as a result of over exploitation of groundwater relative to the recharging capacity of the aquifer113, which is reduced by the lower rainfall during the short monsoon season114. Average yearly change in water table depth over last 20 years and over the last three years are calculated as indicators for measuring the trends in the depth of the water table in the long and short run.
For both indicators, a significant improvement has been observed in 2011 compared to 2010, when the water table deepened due to the lowest rainfall since 1995. However, since 2007 both indicators confirm the declining trend: changes in depth of water table have increased from 14cm to 31cm considering a 3 year moving average and from 7cm to 12cm considering the 20 year moving average. The significant and increasing difference between the short and long term indicators can be considered as confirmation that the water table decline is accelerating and that recovering from the exceptional low level registered in 2010 provides no space for complacency. Share of irrigation on boro production cost declined The share of irrigation cost in total boro production cost has continued declining from 16.3% in 2007/08 to 13.6% in 2011/12. This is the result of slower growth of irrigation costs (+10%) relative to total production cost (+32%). It is reasonable to assume that over the last year, the increase in irrigation cost has been driven by the spike in prices of fuel and electricity, although official data are not yet available that fully document this. Overall, irrigation cost remains a concern particularly for marginal and small farmers who pay higher prices compared to medium and large farmers. Price of irrigation water per m3 was estimated at 0.58 taka and 0.52 taka for marginal and small farmers, compared to 0.26 taka for medium
farmers 115.
___________________________________________________________________________ 113 Dey, N. C. et. al.(2013). Sustainability of groundwater use for irrigation in Northwest Bangladesh, Draft final report of the study commissioned by NFPCSP; and Mamunul, A. H. M. et. al. (2012). Hydro geological condition and assessment of groundwater resource using visual mudflow modelling, Rajshahi City Aquifer, Bangladesh.Journal Geological Society of India. Vol. 79, pp. 77-84. 114 Jahan C.S. et.al. (2010). Impact of irrigation in Barind area, NW Bangladesh-an evaluation based on the meteorological parameters and fluctuation trend in groundwater table, Journal Geological Society of India. Vol. 76, pp. 134 - 142. 115 http://www.webmeets.com/files/papers/ERE/WC3/24/Disc202.pdf
Figure 20: Depth of the groundwater table in Northern Bangladesh
-7.50
-7.00
-6.50
-6.00
-5.50
-5.00
-4.50
-4.00
-3.50
GW
T D
epth
(m)
Source:BADC

43
4.2.2. Policy developments/programmes underway and needs for further action
The perspective plan (2010-2021) defines the following long term objectives for irrigation: increasing water use efficiency116 from 30% to 50%; increasing the irrigation area from 5 million hectares in 2009 to 7 million hectares by 2021 by using water saved from improvements in irrigation efficiency; effectively addressing overwhelming dependence on groundwater, focusing on increasing use of surface water; and monitoring quality and quantity of groundwater through continuous surveys and investigation. Within this framework, an Integrated Minor Irrigation Policy 2012117 was approved by the Ministry of Agriculture. It emphasizes the need to promote efficiency of surface water utilization by developing necessary infrastructure, maintaining minimum distance between tube-wells, harvesting and preserving rain water, updating groundwater mapping, etc.
The Bangladesh Water Act 2012 has been approved by the Cabinet in May 2012 as a legal framework for better management and use of water resources. The issues of ownership of water, right to use, price as well as overall guidelines for water management sources, retention of rivers and river recovery have been addressed in the Act.
The Government has taken initiatives with India to negotiate water sharing treaties for Teesta and other rivers based on the Ganges water sharing model signed in 1996 with a validity of 30 years. A similar agreement was signed in 1977 for five years, and followed by a Memorandum of Understanding signed in 1982 with validity up to 1988. Between 1989 and 1996 no treaty was in force on the sharing of the Ganges water which allowed India to divert water at Farakka and upstream. The GoB is also committed to reactivating river dredging, including dredging of the Gorai River so as to ensure fresh water availability in the South-West region.
Programme 2 of the CIP has a budget of 1696.7 million USD for completed and ongoing projects, of which 1433.2 million USD are financed by GoB and the rest 263.5 million USD by DPs. Overall, this programme accounts for 27.4% of total CIP budget, of which nearly one-half is allocated for the activities related to dredging of rivers. Additionally, 15 projects worth 291.8 million USD are in pipeline under this programme. Subprogramme 2.1, aiming to improve water management in water distribution systems and at farm level, includes 3 completed, 11 ongoing and 4 in pipeline projects with a budget of 317.1 million USD or 5.1% of total CIP budget. Four completed, 25 ongoing and 11 pipeline projects are included under subprogramme 2.2, which aim to improve and increase efficiency of surface water irrigation particularly in the south, with a budget a 586.5 million USD or 9.5% of the total CIP budget.One project worth 45.4 million USD has started in 2012 and another one is in the pipeline under subprogramme 2.3 on reducing the impact of saline water intrusion in the south; while subprogramme 2.4, which aims to enhance river water flow to the south, includes 1 completed and 9 ongoing projects for 747.7 million USD or 12.1% of the total CIP budget.
Needs for further action in this area include:
Enhancing of river water flow: Water scarcity in the dry season is one of the key challenges in Bangladesh. The Himalayan River Basin is seriously threatened by water stress with implications for internal and cross-boundary development and security in
___________________________________________________________________________ 116 The ratio between irrigation water actually utilized by growing crops and water diverted from a source in order to supply such irrigation water. 117 http://www.moa.gov.bd/Flood_Damage/irrigation_policy.pdf
44
the region. Climate-related water challenges make Bangladesh one of the most vulnerable countries. During the last 37 years the country has lost about 18,000 km of river routes. During the rainy season only 6000 km of river of routes become active for navigability and it falls to 3,800 km during the dry season. Water flow of rivers can be increased in the dry season by river dredging and by signing and enforcing water sharing treaties with neighbouring countries. There are 9 ongoing projects worth 52.2 billion taka under the BWDB for the different activities related to dredging of different rivers. The important projects are: Buriganga River Restoration Project; Capital Dredging of River System in Bangladesh; Gorai River Restoration Project; Excavation of Chanda-Barasia River; and Re-excavation of Bemelia, Lagan Balbhadra River and Kalni-Kusiara River Management. Use of manual labor to excavate small rivers and canals during the lean season can be considered as part of the government initiative to promote productive safety nets.
Sustainably and efficiently using groundwater for irrigation: The major impediments to the sustainable use of groundwater are (i) excessive extraction, especially related to the expansion of boro area; and (ii) decreased groundwater recharging due to decreased river water level and discharge, and reduced wetland areas. The National Commission on Agriculture estimated in 1996 that the maximum sustainable level of extraction through Shallow Tube Wells (STWs) had already been reached. Since then, the further expansion of STWs and Deep Tube Wells (DTWs) resulted in over-exploitation. Over-extraction of groundwater has adverse impacts on drinking water supply and contributes to arsenic contamination. To promote sustainability it is important to have detailed water budgets (recharge, extraction and change in storage) for main water basins; farmers should be encouraged to gradually shift from boro cultivation to higher value crops, such as pulses and oilseeds, in critical basins; managed aquifer recharge should be promoted nationwide; and harvesting of surface and rain water should be encouraged, especially through excavation of existing canals, ponds, khals, and water bodies118. Increased efficiency of water use could be promoted through research into varieties that consume less water; expansion of drip irrigation techniques (although high installation costs may make this inappropriate for poorer farmers); and improved water management practices, including Alternate Wetting and Drying irrigation technology (currently being experimented in northern Bangladesh as part of a collaboration between DAE, BMDA, BRRI, NGOs and the Cereal System Initiative for South Asia, with reportedly reductions in water use of up to 30% during boro cultivation)119.
Enhancing availability and use of surface water: In line with sixth five year plan, excavation/re-excavation programmes and promotion of effective utilization of canals, ponds and other water bodies should be scaled up to enhance conservation and utilization of surface water and encourage groundwater recharge through water-shed management, rainwater harvesting and establishment of water reservoirs and other surface water storage systems. To this end, rubber dams may be set up in different parts of the country. BADC recently established two rubber dams in Mymensingh (Haluaghat) and Suanmgonj (Chhatak) areas for ensuring more irrigation water after creating surface water reservoirs. As mentioned above, CIP
___________________________________________________________________________ 118 Dey, N. C. et. al.(2013), op.cit. 119 http://economy-bd.blogspot.com/2011/04/awd-irrigation-technolocy-benefitting.html
45
subprogramme 2.2 has a budget of 586.5 million USD including 4 completed and 25 ongoing projects. Moreover, 11 new projects are in pipeline awaiting financing for a total of 270.9 million USD. These projects are expected to expand the role of surface water irrigation, inverting the declining trend observed over the past years (Table 9).
Making quality groundwater available for irrigation: Arsenic contamination of groundwater in Bangladesh affects 59 out of 64 districts and 85% of the total area of Bangladesh120. Excessive groundwater extraction may be a main cause for the increasing arsenic contamination. The risks for human health of arsenic entering the food chain are well known. Less well-known are the implications for crop production: build-up of arsenic in the soil from contaminated irrigation water reduces crop yields. It has been estimated that water extraction from the shallow aquifer for irrigation adds 1 million kg of arsenic per year to the arable soil in Bangladesh, mainly in the paddy fields. A positive correlation between arsenic in groundwater resources, soil and rice has been reported, indicating that food chain contamination may take place as a result of prolonged irrigation with contaminated water. Arsenic in irrigation water can result in land degradation that in turn affects food safety and crop production121. It is important to support initiatives to quantify and qualify the problem for arsenic and other physical, chemical and biological contaminants. Options to prevent and mitigate contamination need to be further explored.
Controlling flood and river erosion: Flood is a common climatic risk in Bangladesh. Flood affects approximately 20% of the country in normal years and up to 68% in extreme years. Flood also causes serious river bank erosion. The BWDB estimated that about 1,200 km river bank is eroded and another 500 km is under threat to collapse. In the flood years of 1988, 1998 and 2004, 61%, 68% and 38% of land was inundated, which caused large scale destruction of infrastructure, loss of crops and lives. In 2004, over 6.5 lakh ha of crop land were fully damaged and another 4.2 lakh ha partly damaged by flood122. Factors that contribute to increased floods are unplanned urbanization, soil erosion, sea-level rise, inadequate sediment accumulation, subsidence and compaction of land, riverbed aggradations, and deforestation. Interventions to mitigate flooding propensity include floodplain zoning, planned urbanization, restoration of abundant channels, dredging of rivers and streams, increased elevations of roads and village platforms, building of efficient storm sewer systems, establishment of buffer zones along rivers, conservation tillage, controlled runoff near construction sites, adjustment of life-style and crop patterns, good governance, and improvement in flood warning/preparedness
Reducing salinity and its impact in the South: The main obstacle to intensification of crop production in the coastal areas is seasonally high content of salts in the soil. According to salinity survey findings and salinity monitoring information, about 1.02 million ha (about 70%) of the cultivated land in coastal areas are affected by varying degrees of soil salinity124. Climate change exacerbates salinity through the intrusion
___________________________________________________________________________ 120 Saifuddin, M. and M. M. Karim (2001). Groundwater arsenic contamination in Bangladesh: cause, effect and remediation. University of Windsor, Canada. 121 Heikens, A. (2006). Arsenic contamination of irrigation water, soil and crops in Bangladesh, office for Asia and the Pacific, FAO, Bangkok. 122 Awal, M. A. (2013). Adapting social safety net programs to climate change shocks: issues and options for Bangladesh, draft final report, NFPCSP financed project. 123 http://www.lhup.edu/mkhalequ/research/floods-bd-bmps-ben.pdf 124 Haque, S. A. (2006). Salinity problems and crop production in coastal regions of Bangladesh, Pak. J. Bot., 38(5).
systems123.

46
of the saline waterfront in the rivers, saline water interface in the groundwater aquifers, percolation from the increased saline surface waters into the groundwater systems, and increased storm surges, which carry sea water inland. Between 1973 and 2009, salinity prone area increased from 0.83 million ha to 1.06 million ha125. Salinity is also stimulated by shrimp cultivation as the intrusion of saline water during high tide is used to stimulate production. In the dry season, a vast area is left fallow until the salinity concentration is reduced by rain. The problem is expected to further exacerbate due to reduced dry-season freshwater supply from upstream sources resulting from climate change and from the reduction of water flow from India. Although one project named "Rehabilitation of BWDB infrastructures affected by Aila cyclone in coastal area" is underway and other two “Char kukri-mukri flood control, drainage and prevention of saline water intrusion project in the district of Bhola" and "Rehabilitation of coastal infrastructures damaged by Aila (south-western zone)" are in pipeline aiming at reducing salinity, more interventions are needed, including protection of embankments and sluice gates; dredging of rivers; storing of excess rainwater; adoption of saline resistant varieties; increased use of organic fertilizers, etc.
4.3. Programme 3: Improved quality of input and soil fertility
Programme 3 aims to improve the quality of inputs and soil fertility through four subprogrammes to: (1) enhance availability of agricultural inputs, tested and certified for quality and diversified crops; (2) develop public-private partnership through capacity development; (3) improve and increase sustainability of soil fertility management; (4) facilitate access to credit and other financial services by smallholders and the poor. CIP investments in this programme closely support NFP PoA Areas of Interventions 1.3 and 1.5 which deal with supply and sustainable use of agricultural inputs and agricultural credit and insurance, respectively.
___________________________________________________________________________ 125 Awal, M. A. (2013). op.cit.

47
4.3.1 Progress towards achievements
Table 10: Progress towards achievement of CIP programme 3 CIP/NFP PoA output proxy indicators 2007/08 2009/10 2010/11 2011/12 Source
Annual change in improved rice, wheat and maize seeds production
9.8% 127.8% 25.8% 2.9% MoA
Improved seeds supply (BADC, DAE and private companies) as % agronomic requirements
Rice 40% 44% 58% 59%
MoA
Wheat 41% 67% 55% 72%Maize 93% 84% 100% 96%
Potato 5% 3% 4% 12%Pulses 1% 3% 5% 12%
Vegetables 36% 32% 33% 20%Edible Oilseeds* 4% 4% 8% 12%
Supply of urea as % of estimated requirements 98% 82% 94% 77% MoA, Fertilizer Monitoring and
Management Unit
Supply of TSP as % of estimated requirements 82% 63% 79% 81%
Supply of MoP as % of estimated requirements 66% 53% 89% 77%
Change in crop yields (moving average over 3 previous years)
Rice 3.11% 3.78% 2.08% 2.95%
BBS Statistical Yearbooks and
communications with BBS
Agricultural Wing
Wheat 7.53% 9.58% 6.26% 5.10% Maize 3.18% -0.70% 0.86% 5.02%
Potato 2.85% 9.30% 5.55% 1.80% Pulses 2.13% 3.73% 0.52% 3.60% Brinjal 5.47% 0.77% 1.03% 2.15%
Pumpkin 3.35% 1.61% 2.87% 3.70% Beans 3.66% -0.18% 1.01% 3.30%
Lal Shak 0.19% 2.73% 0.85% -0.40% Edible Oilseeds* 4.53% 2.26% 1.37% 3.95%
Banana -1.39% -3.89% -2.70% -3.66% Guava 0.45% 10.77% 15.83% 5.81%
Mango -2.22% 0.03% 8.85% 4.50% Pineapple -4.11% -0.95% 1.27% -7.19%
Jackfruit -15.47% 2.27% -2.08% -1.60% Agricultural credit disbursement
billion taka 85.81 111.17 121.84 131.32 Bangladesh Bank Annual Report % of target 103% 97% 97% 95%
* Includes til, rape, mustard, groundnut and soya bean Availability of improved variety and quality seed Annual changes in the production of improved cereals seeds has fluctuated widely since 2007/8, and declined to 2.9% in 2011/12. However, as a percentage of agronomic requirements, improved seeds supply increased for all crops, except maize and vegetables. For rice and wheat, in 2011/12 this reached 59% and 72% respectively, with a substantial increase for wheat. For maize, the decline of 4 percentage points to 96% should not be considered as a source of concern as the economic optimum level might be below the agronomic requirement. The reduced supply for vegetables deserves attention, which decreased from 33% to 20% confirming high volatility along a negative trend. For other non-cereals, a slow upward trend prevails, but the supply is still quite low. Indeed, the share has increased to 12% from 4% for potato; to 12% from 5% for pulses; and to 12% from 8% for oilseeds. Fertilizer supply Fertilizer supply as a share of agronomic requirements has declined for both urea (to 77% in 2011/12 from 94% in 2010/11) and MoP (to 77% in 2011/12 from 89% in 2010/11). On the contrary, supply of TSP in 2011/12 increased to 81% of agronomic requirements from 79% in 2010/11. As no major scarcity of fertilizers is recorded in the market, supply below the estimated requirement can be explained by the divergence between agronomic and

48
economic optimal requirements. Compared to the baseline year a substantial rebalancing of fertilizer supply is recorded, with supply declining for urea and increasing for TSP and MoP. This is an important result of the rebalancing of subsidies on the various micronutrients that is discussed below. Change in crop yield Yields have increased since 2007/08 for almost all crops. Rice yields have grown steadily registering an increase of almost 3% in 2011/12 compared to 2% in 2010/11. As mentioned above, rice yield annual growth exceeding 1.5% should be seen as a favourable condition for crop diversification, as it allows releasing land for other uses without impacting on self-sufficiency. Wheat yields show a high growth rate although the growth has gradually decelerated. This can be interpreted in connection with the reduction of wheat area planted that concentrated production on the most suitable land with positive impacts on yields and profitability. Maize yields increased in 2011/12 by 5.02%, which is well above the growth registered in previous years. A significant increase is also registered for the yield of pulses. Potato yields increased by 1.8% and have shown high variability over recent years, determining high price volatility. Most vegetables yields show consistent growth and good performance in 2011/12. Also relatively stable is the growth of yield of edible oilseeds that registered a quite good growth (3.95%) in 2010/11. Among fruits, relatively high yield variability is observed: while growth prevailed for guava and mango, yields declined for pineapple, jackfruit and, quite consistently for banana. Agricultural credit The Bangladesh Bank has expanded credit supply in recent years, with disbursements reaching 121.8 billion taka in 2011/12, an increase of 8% on the previous year, in line with inflation. In 2008/09 disbursements increased by about 20% compared to the previous year. Disbursement relative to the annual target has steadily declined since 2007/08. Targeting small farmers and sharecroppers cultivating under 200 decimals, the Bangladesh Bank provided 5 billion taka to BRAC’s Borga Chashi Unnayan Programme, which provides agricultural credit at 5% interest rate, through village organizations that manage the credit and promote savings126. Loan duration varies between six and ten months; and one third of the loan is repaid in monthly instalments and the rest at the end of the crop season or just after harvest. The number of beneficiaries rose from 238,071 in 2010 to 578,210 in 2013 and disbursement rose up to 83,406 lakh taka in March 2013127.
A recent study found that access to formal credit is significantly correlated to agricultural production and food security, particularly to marginal and smallholder farmers128. Farmers took credit for modern boro rice production, where irrigation and other input costs surpass equity financing. Home-based and commercial poultry, fishery and livestock rearing use credit financing. Access to credit has also made the lease of additional land possible and helped communities to expand non-farm activities and social development.
___________________________________________________________________________ 126 Alam, M. Shahe (2011). Agricultural Census Report on Borga Chashi Unnayan Programme (BCUP) of BRAC, Research and Evaluation Division, BRAC, Dhaka. 127 Rahman. A. (2013). Credit Programme for Share Croppers: Impact and Evaluation. Paper presented in the conference on Bangladesh Bank credit programs, held at BRAC Centre, 75 Mohakhali, Dhaka, 4 April.2013. 128 Khondker.B.H, S.H. Bidisha and G.M. Suhrawardy (2013). Role of Credit in Food Production and Food Security in Bangladesh. NFPCSP-FAO, Dhaka.

49
4.3.2 Policy development /programmes underway and needs for further ac on
Programme 3 of the CIP includes 26 financed projects of which 10 are completed and 16 are ongoing for a total financing of 1055 million USD, equivalent to 17% of the financed budget as of June 2012. In the financial year 2011/12, six projects moved from the pipeline to ongoing for a total value of 161.1 million USD. The lion share of financing under programme 3 (1002 million USD) is allocated to finance 20 projects under subprogramme 1.1. BCIC has three major ongoing projects to improve and expand the production of fertilizers. Shahjalal Fertilizer project is the largest one, with 778 million USD which is financed by China. The residual 53 million USD finances 2 ongoing projects under subprogramme 3.1 and four projects (of which three are completed) under subprogramme 3.3. No program has so far been financed under subprogramme 3.4, which focuses on agricultural credit.
The updated pipeline in CIP 2013 includes 14 projects for a total value of 1069 million USD. Also in the pipeline subprogramme 3.1 still received overwhelming attention with 995 million USD to finance 8 projects, while the other 3 subprogrammes have in the pipeline three, two, and one project, respectively. Total delivery in programme 3 now stands at 170.5 million USD out of which 95.9 million USD is financed by DPs and 74.6 million USD by the government.
Table 11: Fertilizer subsidies, urea and non-urea
Source: MoA
Changes in fertilizer subsidies, prices and sales Fertilizer subsidies represent the largest element of public expenditure in agriculture. As shown in Table 11, fertilizer subsidies doubled from 35.3 billion taka in 2007/08 to 69.5 billion taka in 2011/12, and accounted for 4.3% of Government spending. Substantial rebalancing occurred with urea accounting for only one-third of the total subsidy, compared to 89% in 2007/08. Whilst urea subsidies were cut by a quarter, non-urea subsidies were 12 times as large since 2007/08.
Table 12: Trends in fertilizer prices and sales
Source: MoA
Year
Subsidies (in billion taka)
Change from previous financial year Fertilizer subsidies as %
of national budget Urea subsidies as % of
fertilizers subsidies Urea
Non urea Total Urea
Non urea Total
2007/08 31.55 3.79 35.34 na na na 4.1% 89%
2008/09 42.73 8.01 50.74 35.4% 111.3% 43.6% 5.1% 84%
2009/10 19.79 20.99 40.78 -53.7% 162.0% -19.6% 3.6% 49%
2010/11 25.71 29.71 55.42 29.9% 41.5% 35.9% 4.2% 46%
2011/12 23.28 46.24 69.52 -2.43 16.53 14.1 4.3% 33%
Price (Tk/kg) Sales (lakh MT) Before
4 Jan, 2009 Effective
Nov, 2009 EffectiveOct, 2010
In 2011
In2012
2008/09 2009/10 2010/11 2011/12
Urea 12 12 12 20 20 25.33 24.09 26.55 22.96
TSP 80 22 22 22 22 1.65 4.2 5.91 6.41
MoP 70 25 15 16 15 0.82 2.63 5.07` 6.03 DAP 90 30 27 27 27 0.18 1.36 3.53 4.08
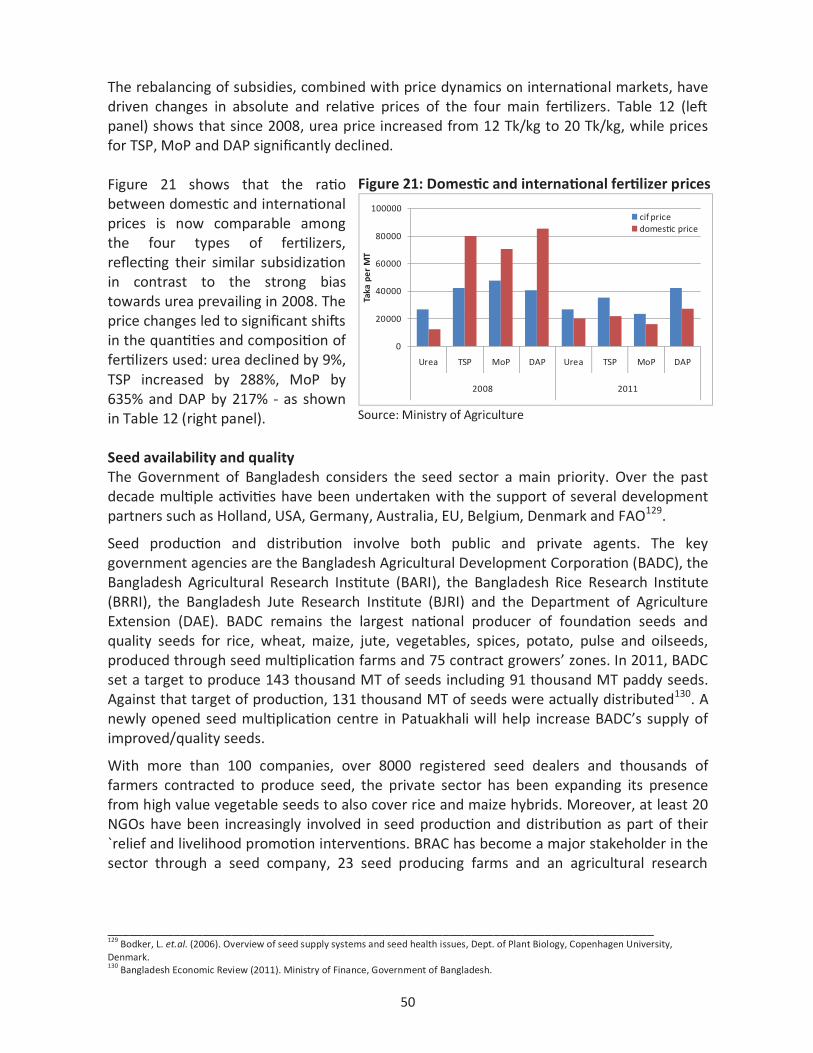
50
The rebalancing of subsidies, combined with price dynamics on international markets, have driven changes in absolute and relative prices of the four main fertilizers. Table 12 (left panel) shows that since 2008, urea price increased from 12 Tk/kg to 20 Tk/kg, while prices for TSP, MoP and DAP significantly declined. Figure 21 shows that the ratio between domestic and international prices is now comparable among the four types of fertilizers, reflecting their similar subsidization in contrast to the strong bias towards urea prevailing in 2008. The price changes led to significant shifts in the quantities and composition of fertilizers used: urea declined by 9%, TSP increased by 288%, MoP by 635% and DAP by 217% - as shown in Table 12 (right panel). Seed availability and quality The Government of Bangladesh considers the seed sector a main priority. Over the past decade multiple activities have been undertaken with the support of several development partners such as Holland, USA, Germany, Australia, EU, Belgium, Denmark and FAO129.
Seed production and distribution involve both public and private agents. The key government agencies are the Bangladesh Agricultural Development Corporation (BADC), the Bangladesh Agricultural Research Institute (BARI), the Bangladesh Rice Research Institute (BRRI), the Bangladesh Jute Research Institute (BJRI) and the Department of Agriculture Extension (DAE). BADC remains the largest national producer of foundation seeds and quality seeds for rice, wheat, maize, jute, vegetables, spices, potato, pulse and oilseeds, produced through seed multiplication farms and 75 contract growers’ zones. In 2011, BADC set a target to produce 143 thousand MT of seeds including 91 thousand MT paddy seeds. Against that target of production, 131 thousand MT of seeds were actually distributed130. A newly opened seed multiplication centre in Patuakhali will help increase BADC’s supply of improved/quality seeds.
With more than 100 companies, over 8000 registered seed dealers and thousands of farmers contracted to produce seed, the private sector has been expanding its presence from high value vegetable seeds to also cover rice and maize hybrids. Moreover, at least 20 NGOs have been increasingly involved in seed production and distribution as part of their `relief and livelihood promotion interventions. BRAC has become a major stakeholder in the sector through a seed company, 23 seed producing farms and an agricultural research
___________________________________________________________________________ 129 Bodker, L. et.al. (2006). Overview of seed supply systems and seed health issues, Dept. of Plant Biology, Copenhagen University, Denmark. 130 Bangladesh Economic Review (2011). Ministry of Finance, Government of Bangladesh.
Figure 21: Domestic and international fertilizer prices
0
20000
40000
60000
80000
100000
Urea TSP MoP DAP Urea TSP MoP DAP
2008 2011
Taka
per
MT
cif price domestic price
Source: Ministry of Agriculture

51
centre with an annual capacity to produce 5200 MT of certified quality seeds of hybrid maize, rice, onion, pulses, oil crops and potatoes.
Quality remains an issue. It has been estimated that some 85% of seeds used are untested, unlabelled or of unknown quality to farmers131. The National Agricultural policy has emphasised the development of quality seeds proposing to encourage the private sector in undertaking breeding programmes and import of foundation/breeder seeds for notified crops. Moreover, it calls for strengthening the seed certification process, so as to provide a fair playing field for the private sector in its endeavours to cater quality seeds to satisfy the increasing demand.
The Seed Certification Agency (SCA), established in 1974, is the statutory body authorized to provide certification of Breeder, Foundation and Certified classes seeds. The Agency certifies and maintains seed quality through field inspection, seed testing and variety testing under the guidance of the National Seed Board (NSB) and regulations provided by the National Seed Policy 1993, The Seeds (Amendment) Act 1997, Seeds Ordinance 1997, and the Seed Rules 1998. The SCA is responsible for their implementation through its three technical wings in charge of variety testing, field inspection and seed testing. Initially, the SCA was only in charge of certifying seed produced by the public sector only but from the early nineties, its jurisdiction has been extended to testing and certification of seeds produced by public, private and NGO agents. The SCA generally certifies seeds of five ‘notified’ crops namely rice, wheat, jute, potato and sugarcane132. Government incentives for enhancing productivity Given the declines in planted area of aus in recent years, in 2012 the Government attempted to encourage farmers by providing subsidised seed and fertilizers up to a maximum one bigha (33 decimals) per farmer, with seeds supplied by BADC and fertilizers by BCIC. Table 13 reports the coverage and cost of subsidy for these interventions.
Table 13: Subsidy for aus production in 2012 Modern aus variety Districts covered Number of farmers Subsidy (lakh taka) BRRI Dhan 28 BRRI Dhan29 308,956 2894
Nerica 30 56,250 606 Total 86 365,206 3500
Source: DAE
Leveraging the private sector to foster production and use of stress tolerant seeds As part of its commitment to promote climate resilient agricultural practices in Bangladesh, the International Finance Corporation (IFC) is working with four large private seed companies to demonstrate the business case for stress tolerant seeds. IFC targets to support farmers in adapting to climate change as well as strengthening food security and social inclusion by increasing the production, distribution and adoption of stress tolerant seed varieties; including rural women in seed production in remote areas and linking them to the seed supply chain. This initiative has so far resulted in training for more than 40,000 farmers and more than 600 dealers and retailers on how stress tolerant seeds work, while about
___________________________________________________________________________ 131 Bangladesh Seed Grower, Dealer and Merchants Association (BSGDMA) (2007). Bangladesh Seed Industry at a Glance. Asian Seed Congress. Manila, Philippines. 132 Ministry of Agriculture: http://www.sca.gov.bd/
56

52
1200 women received training to become seed micro-entrepreneurs133.
Needs for further action in this area include:
Strengthening production and distribution of quality seed: The available statistics indicate that institutional sources supply only a proportion of the total national seed requirements. The Bangladesh Agricultural Development Corporation (BADC) is the main public body responsible for producing and supplying improved seeds. Its production capacity, especially for foundation seeds, needs to be enhanced. Furthermore, the participation of the private sector in production and marketing of quality seeds need to be encouraged and improved. The Seed Certification Agency and other public agencies involved in promoting seed quality need to be strengthened to maximize their role in ensuring effective enforcement of relevant regulation. Also important is to promote collaboration among main private sector companies to establish voluntary quality certifications and controls as well as branding to make easily distinguishable seeds (and other inputs) that respect minimum quality standards.
Moving from rebalancing fertilizer use to promoting fertilizers’ quality: An over use of urea and sub-optimal use of other plant nutrients has been attributed to imbalanced subsidies and insufficient farmers’ awareness on appropriate usage. The substantial rebalancing of subsidies taking place over the past few years, coupled with continued efforts by DAE and other public and private extension providers, are showing positive impacts on yields and overall efficiency. However, as agriculture diversifies and production, marketing and use of different types and grades of fertilizers –such as the mixed nitrogen, phosphorus, potassium, sulphur (NPKS)- expands, ensuring quality and preventing adulteration of fertilizer becomes more difficult. This calls for renewed efforts to enforce standards through public regulations and controls as well as by promoting initiatives within the private sector to establish self-certification and controls that allow, for example through appropriate branding and packaging, to easily identify fertilizers (as well as other agro-chemicals) supplied by reliable producers and distributors. Strengthened agricultural waste management would be supportive by increasing availability of organic fertiliser.
Using Urea Super Granule (USG) and deep placement technology: Research indicates that consumption of urea could be reduced by 25-30% using Urea Super Granules (USG) in rice cultivation, but this practice is labor-intensive134,135. The agricultural machinery development programs of BARI, BRRI and other institutions developed a urea applicator machine that could substantially reduce labour requirements and boost adoption of USG. DAE is implementing motivational programmes for farmers to use USG. Agricultural credit should be made available to increase the number of USG making machines.
___________________________________________________________________________ 133 IFC Bulletin (2012). Agri-seed: Making Bangladesh’s agricultural sector more sustainable http://www1.ifc.org/wps/wcm/connect/topics_ext_content/ifc_external_corporate_site/ifc+sustainability/sustainable+business+advisory+services/project+examples/sba-project-agriseed 134 Jahiruddin, M.R. Islam and M.A. Miah (2010). Constraints of farmers’ access to fertilizer for food production, study commissioned by NFPCSP. 135 Alam, M. Shahe., M.S. Islam and M.A. Islam (2009). Farmers’ efficiency enhancement through input management :The issue of USG application in modern rice production. Bangladesh Journal of Agricultural Research, Vol. XXIII (2).

53
Improving pest management: Farmers often use insecticides and pesticides without adequate knowledge of its impact on human health, plant biology and the environment. Integrated pest management (IPM) and other environmentally friendly practices are being promoted by DAE and other extension agencies. These efforts need to be scaled up to minimize impact on producers and the environment and maximize safety of food.
Reintroducing crop insurance: Crop insurance (CI) is a potential risk management strategy against extreme events, like cyclone, flood and drought, which can overwhelm the protection from microcredit and savings of poor farmers with no other safety nets. The UN Climate Convention and the Kyoto Protocol included the provision of insurance to address risks from climate change. In 1977 Bangladesh introduced crop insurance through the state owned Sadharan Bima Corporation (SBC), but it was stopped in 1996 after experiencing huge losses due to moral hazard based on individual loss assessment, adverse selection, bad program design, poor monitoring at grass root level, covariant risks, etc.136. Weather index-based crop insurance, which incorporates historical weather and crop production data, can reduce farm-level monitoring and transaction costs. A pilot crop insurance project was introduced in Madhabpur Upazila, Habiganj District, with the sponsorship of SBC137. Recently the Asian Development Bank and the Government of Japan agreed to provide 2 million USD, and the GoB 0.42 million USD in-kind support, towards a 3-year pilot weather index-based crop insurance project in selected districts, with the goal of covering at least 12,000 farm households138. Past experiences suggest a partnership between private, public and NGO actors would improve implementation. Reputed insurance companies can offer CI, where SBC can serve as a re-insurer and the Directorate of Insurance can regulate and monitor the process, including dispute resolution. NGOs can serve as the go-between and mobilizer of communities. Additionally, in order to increase its coverage, the Government may make CI mandatory for farmers who take agricultural loans.
4.4. Programme 4: Fisheries and aquaculture development
Programme 4 seeks to sustainably increase fishery production through 4 subprogrammes to (1) develop small scale aquaculture, through access to quality inputs, advice and skills; (2) improve the management of fishery resources; (3) develop public private partnerships in support of infrastructure and services development; and (4) promote production in the South through sustainable shrimp and prawn development and community based management of wetland. Programme 4 relates to NFP PoA area of intervention 1.4 which strives to diversify agriculture through production of fish among other things.
___________________________________________________________________________ 136 Climate Change Cell (2009). Crop Insurance as a Risk Management Strategy in Bangladesh. DoE, MoEF. 137 Government of Bangladesh (2011). Budget Speech 2012-13. Ministry of Finance. 138 http://www.adb.org/news/bangladesh/adb-japan-seek-affordable-crop-insurance-bangladesh-farmers

54
4.4.1. Progress towards achievements
Table 14: Progress towards achievement of CIP programme 4
CIP/NFP PoA output proxy indicators 2007/08 2009/10 2010/11 2011/12 Source
GDP from fishery sector as % of agriculture GDP (excluding forest), at constant price 1995-1996
24.39% 24.18% 24.18% 24.75% Bangladesh Economic
Review
Annual change in national fish production
5.04% 7.33% 5.66% 6.50% Fisheries Statistical
Yearbook (DOF)
Fishery expanded faster than other agricultural subsectors in 2011/12 The fishery subsector accounts for 4.4% of GDP, provides about 60% of animal protein and contributes to the livelihoods of about 16 million people. With its high value products, the sector has a significant potential for income and employment growth. Fisheries and aquaculture also contribute to dietary diversification by increasing the availability of protein rich food. The sector significantly helps to balance trade through the export of high value foods such as shrimps. Given the acceleration in production growth, over the last year the share of fishery value added in agricultural GDP increased by nearly 0.6 percentage points, and reached almost a quarter of the total. This is an encouraging sign of diversification after many years in which the share remained quite static. Figure 22 shows that the subsector had substantially increased its relative importance till the '90s and remained quite static thereafter. Fish production growth rate sustained The fishery sector has quite distinct features in its three main subsectors -aquaculture, inland capture and marine capture- engaging households and the community with quite diverse income levels, livelihoods, technology and socio-cultural settings. In 2011/12 fish production registered one of the best performances since the PoA baseline year, with a growth of 6.5%, which is almost 1% higher than the previous year. Export of shrimp and other fish and fishery products reached 0.96 lakh MT or 4604 crore taka in the FY
Figure 22: Fishery in agricultural GDP
5
15
25
35
45
% s
har
e
Rice Forest & related services Animal farming Fishery
Source: BBS
Figure 23: Fish production by subsectors
0
0.5
1
1.5
Aquaculture Capture Fisheries
MarineFisheries
Mill
ion
MT
Fish category
2009/102010/112011/12
Source: DoF, MoFL

55
2010-11 almost 23% higher export compared to that of 2009/10 and 31% higher than that of 2008/09139. Figure 23 shows the disaggregation of total fishery production by its three subsectors over two recent years. Aquaculture is the most important subsector and continues expanding its share by growing faster than capture and marine fishery production.
4.4.2 Policy development/programmes underway and needs for further action Programme 4 of the CIP has so far mobilized 178.8 million USD, accounting for only 0.29% of the CIP. These resources have financed 27 projects of which 24 are currently ongoing. In the financial year up to June 2012, two projects were completed and 4 initiated. The 3 projects completed since 2010/11 had a total value of 5.2 million USD, which indicates that the average project size is substantially increasing (from 1.7 million USD of the completed to 7.2 million USD for the ongoing).
No project has so far been financed or is in the pipeline under subprogrammes 4.3 (developing public private partnerships) and only one project is financed under subprogramme 4.4 (focusing on the south and community based management of wetlands), which has in the pipeline two projects awaiting financing. Total delivery as of June 2012 stands at 72 million USD of which 35.4 million USD was delivered during the last fiscal year compared to almost 36.5 million USD over the previous year. Delivery of DPs financed activities is higher (24.1 delivered versus 33.1 financed) compared to GoB financed activities (14.7 million USD delivered against 144.9 financed). Overall, program 4 requires formulation and financing of additional investments especially in programme 4.3 and programme 4.4.
Fishermen were trained on fish farming, and illegal nets were confiscated, under the Jatka Protection law. Fish sanctuaries were created for the conservation of indigenous fish varieties. The Hazard Analysis for Critical Control Point (HACCP) compliance is being pursued to ensure quality of fishery exports. Market visits have been introduced to prevent the use of formalin and other adulterants in preserving fish. Water body management is being improved by providing training to small fish farmers and fishermen with the involvement of NGOs. Poor households received support for fish culture in paddy fields and floodplains were developed to improve the socio-economic conditions of fishermen140.
Over the last three years, the Bangladesh Fishery Research Institute (BFRI) developed three new fish varieties: Thai climbing fish, gugi and nona tengra. In addition to this, Super Tilapia, improved nursery for galda shrimp, aquaculture at hilly Ghona, and fish drying using solar dryer technology were also developed. Four technologies were transferred to the field level. Trainings were conducted on modern aquaculture developed by the Institute, on the production of mono-sex tilapia, fish fry, shrimp cultivation management, and conservation of hilsha, etc. Moreover, the establishment of a research sub-station, establishment of a PCR laboratory with modern equipment and the modernization of two research laboratories were completed. A programme for sale of fish in insulated fish vans in Dhaka city has started. Market building in Barisal fish landing station and wholesale market was expanded141.
___________________________________________________________________________ 139 Bangladesh Economic Review (2011). op cit. 140 MoFLS, MTBF. 141 Ibid.

56
Due to climate change and man-made interventions such as construction of unplanned flood dams, excessive use of insecticides in crop fields and water pollution, production and collection of fingerlings/fry from natural sources has declined. In response to this problem, DoF developed facilities in 33 Government farms and raised brood stock to collect fries from the natural stocks. These brood fish are distributed to private hatchery owners at a concessional price. At present, 122 government hatcheries (fish seed multiplication farms) along with 862 private hatcheries are operational to meet the increasing demand of the fingerlings. As a result of government efforts, a total of 222 MT of fish fries have been released in FY 2010-11. Similarly, 137 MT of fish fries have been released in Padma, greater haor areas of Jessore and Faridpur, and Kaptai Lake under various projects and programmes.142
The Fish and Livestock Feed Act 2010 covers the production, processing, quality control, import, export, transportation, marketing, sales and distribution of fish and livestock feed, and Section VI of the Act stipulates the need for a license to carry out these activities. The Department of Fisheries (DoF) and the Department of Livestock Services (DLS) are responsible for the quality of fish and livestock feed, respectively, through laboratory tests on samples from producers and importers. Antibiotics, growth hormones, steroids and pesticides and other harmful chemicals are prohibited.
The Fish Hatchery Act 2010 covers the establishment of fish and shrimp hatcheries for production of larvae, post-larvae and fingerlings, and related activities. Under the Act hatcheries must be registered with the Department of Fisheries, and hatchery operators must have legal documents giving rights to use the hatcheries either as owner or as leaseholder. The hatcheries are prohibited from using banned antibiotics, drugs and other chemicals, and are required to establish health monitoring and control procedures to minimize the risk of disease.
The DoF officials reported that the Fish and Livestock Feed Act 2010, has been under implementation and all the livestock and fish feed producing and processing organizations/ enterprises have been advised to get registered under the law. All the organizations involved in producing, processing, quality control and marketing of fish, and livestock feed had to obtain a license from the concerned authority. For fish feed, monitoring of the activities are done centrally by DoF, but implemented by a team consisting of several DoF staff at the Upazila level. About the quality control issue of the Fish Hatchery Act, the DoF officials reported that there were some complications with respect to certification of the imported items by the BSTI. There are also complications related to issuance and renewal of licenses for the importers which need to be resolved.
Needs for further action in this area include:
Increasing productivity: There is wide scope for improving productivity of fish species in the country through improved technology, better management and further investment in the sector143. A main obstacle in increasing aquaculture production is genetic deterioration of the hatchery –produced seeds of various farmed fish species. The poor quality of fish seed is largely attributed to inbreeding and the resultant indiscriminate use of inferior quality of brood fish. As pointed out
___________________________________________________________________________ 142 Bangladesh Economic Review (2011). op cit. 143 BER, ibid.

57
in the CIP 2011, proper implementation of the National Breeding Plan and the Law on Carp/Shrimp Hatchery Management would ensure the quality seed production through genetic management of brood stock in the hatcheries and equitable dissemination of improved breeds to the target groups for sustainable enhancement of aquaculture production in the country. Reducing water pollution would help increase productivity.
Enhancing extension and training: Research144 suggests that high impact on fish quality preservation can be obtained from awareness programmes, making use of traditional and electronic media. All market actors (fishers, fishermen and women, fish farmers, shrimp farmers, aratdars, wholesalers, transporters, depot holders, processors, retailers, fish vendors, etc.) in the fish distribution chain should be defined in the fisheries policy with specific roles. Similarly, provisions need to be made in the policy to make them responsible through enforcement of regulations. Assessment and monitoring of post-harvest losses in the fishery sector/industry needs to be intensified by regulatory agencies, and a manual should be prepared and disseminated. Greater extension services should be provided to increase production through homestead ponds.
Strengthening the Bangladesh Fisheries Research Institute: BFRI has a vital role to play in developing and disseminating technological innovations needed to modernize and sustainably intensify fishery production. Out of 43 projects included under Programme 4 of the CIP (of which 27 are already financed), BFRI is implementing five projects and two are in pipeline to improve inputs for small scale fisheries and improve management of fishery resources. It is important to secure funding for the 44.6 million USD required for these projects and proceed with formulation of additional initiatives. An important direction of activity for BFRI is research to maintain/improve productivity of the native fish species. Research is needed to develop saline tolerant fish species.
Minimizing the impacts of shrimp culture on soil quality and biodiversity: Construction of coastal embankments by the Bangladesh Water Development Board (BWDB) has prevented inflow of saline water useful for brackish water shrimp culture. The shrimp farmers on the other hand, are alleged to be flushing out the available saline water to the neighbouring paddy fields with a view to compelling paddy farmers to lease out paddy lands for shrimp culture. They are also alleged to be aggressively encroaching the mangrove forest areas to expand their shrimp Ghers. These phenomena have given rise to serious conflict of land use in the coastal areas which need to be resolved. The BWDB filed various cases against shrimp producers who dismantled some of the embankments to allow intrusion of saline water in the shrimp Ghers. Steps have been taken by DoF to minimize the litigations between the BWDB and shrimp farmers. It is important to classify lands according to comparative suitability for shrimp culture and other agricultural uses, and adopt regulations for compliance to the use of lands. To this effect, the Government has declared 172 thousand hectares of land in the Southern-coastal belt of the country as special shrimp producing zone.145 As zoning based on comparative advantage can
___________________________________________________________________________ 144 Nowsad. A. A. K. M. (2010). Post harvest Loss Reduction in Fisheries in Bangladesh: A Way Forward to Food Security. NFPCSP-FAO, Dhaka. 145 Concerns of shrimp exportation, The Daily Prothom Alo, 24 April 2013.

58
be an important tool to balance conflicting interest of farmers and shrimp producers, impacts of this initiative need to be assessed and eventually scaled up.
Utilizing roadside canals and ditches for increasing fish production: Utilization of roadside ditches and canals including flood control, drainage and irrigation canals calls for policy attention, as their effective use is closely related to the definition and enforcement of community use rights. A related dimension is the ‘pen’ and ‘cage’ culture in some floodplains and open water bodies where use rights of water resources should be ensured through legal and institutional support146.
Promoting rice-fish farming system: The CIP emphasizes the need to mobilize and coordinate multiple stakeholders in sustainable intensification of rice-fish systems, which require appropriate technologies and infrastructures and efficient markets. There is need to further prioritize investments in scientific research and market development to capitalize on the sustainability and profitability of concurrent and alternate rice-fish cultures that favour the poor and small holders in Bangladesh. The national agricultural research system (NARS) needs to step up applied research, particularly on the alternating rice-fish system. Research, extension agents, and non-governmental organizations should prioritize an integrated approach cognizant of the interactions between rice cultivation, other crop cultivation, and fish farming in line with small holder livelihood strategies. To date, analysis of the social, economic, and policy issues of Bangladesh’s rice-fish systems has been limited. There is an immediate need to scale up research on issues such as technologies and practices for rice-fish systems, fish value chains, the distribution of economic value within those value chains, and the policy interventions that can encourage efficiency and equity147.
Effectively managing open water fisheries resources: Bangladesh has a vast potential for open water fishing. The annual rainy season inundates up to 60% of the total land surface. About 70% of the total water resource is identified as floodplains which remain under water for 4-6 months. Yet fish production from inland capture has increased only marginally over recent years (DoF 2012a)148. Community-based fisheries management (CBFM) is recognized as a fundamental step in creating sustainable co-management of fisheries resources. According to DoF, 6 out of 16 ongoing development projects under implementation includes community based fisheries management, involving more than 0.2 million project beneficiaries (DoF 2012a)149. Further depletion of fish stock in the perennial and seasonal water bodies should be prevented through stricter enforcement of the ban on indiscriminate fishing during the breeding season, more breeding grounds declared as fish sanctuaries with adequate protection, and expansion of employment and other support measures for fisher communities during the fishing ban periods.
___________________________________________________________________________ 146 Karim, M., M. Ahmed, R. K. Talukder, M. A. Taslim, H. Z. Rahman (2006). Policy Working Paper: Dynamic Agribusiness-Focussed Aquaculture for Poverty Reduction and Economic Growth in Bangladesh. World Fish Center Discussion Series No. 1. World Fish Centre, Penang, Malaysia. 147 Dey et.al. (2012). Change and Diversity in Small holder Rice-Fish Systems: Recent Evidence from Bangladesh. IFPRI Discussion paper 01220, IFPRI, Dhaka, Bangladesh. 148 DoF (2012a). Annual Report 2011. Department of Fisheries. Ministry of Fisheries and Livestock, Government of Bangladesh, Dhaka. 149 DoF (2012a). ibid.

59
4.5. Programme 5: Livestock development with a focus on poultry and dairy production
Programme 5 of the CIP deals with livestock development with a focus on poultry and dairy production. It contributes to the implementation of the NFP PoA AoI 1.4 on agricultural diversification which has a number of provisions for fostering the development of livestock and livestock products. Programme 5 is articulated along the following four subprogrammes: (1) strengthening animal health services, including better diagnosis and surveillance systems to mitigate diseases outbreak; (2) Strengthening husbandry capacity at household level though community based improved knowledge and advisory services; (3) improve availability and quality of inputs through public private partnerships; and (4) research on livestock developments, including genetic improvements.
4.5.1. Progress towards achievements
Table 15: Progress towards achievement of CIP programme 5 CIP/NFP PoA output proxy indicators 2007/08 2009/10 2010/11 2011/12 Source
GDP from livestock sector as % of agricultural GDP (excluding forest, at constant price 1995-96)
14.6% 14.4% 14.1% 14.1% BBS Statistical Yearbooks
Total production (quantity) of
Eggs (million) 5653.2 5742.4 6078.5 7304 MoF, Bangladesh Economic Review
Milk (million MT) 2.65 2.37 2.97 3.47 Meat (million MT) 1.04 1.26 1.99 2.33
Annual change in artificial insemination 1.56% 15.25% 7.67% 10.11% DLS, MoFL Annual change in number of poultry deaths
due to avian flu 333% 274% 231% -75.4%
Livestock production increasing and share of agricultural GDP no longer reducing The share of livestock value added in agriculture GDP (excluding forestry) remained unchanged at 14.1% in 2011/12, in contrast with the slow decline observed since 2007/08 (Table 15). There has been an encouraging growth of virtually all main livestock products: between 2010/11 and 2011/12, production of eggs increased by 20%, while milk and meat each rose by 17%. Overall, this represents an encouraging response to the increasing diversification of food consumption that is taking place mainly in urban areas150 and is increasingly impacting on the trade balance. Between 2007 and 2010, the trade deficit of dairy products and eggs increased by 130%, up from -102.36 million USD to -236.01 million USD151. While contributing to contain the trade deficit, the production of eggs, milk and poultry boost nutritional outcomes in low-income households, especially in rural areas. Poultry death dropped and artificial insemination accelerated Poultry death due to highly pathogenic avian influenza (HPAI) dropped markedly (-75%) in 2011/12 after increasing in 2009/10 and 2010/11. Improved animal health has allowed the poultry industry to substantially accelerate growth after the massive blow experienced during the repeated outbreaks of avian influenza that forced nearly half of the country's 150,000 farms to suspend their activities. It appears that outbreak of HPAI has reduced heavily because of different actions taken by the Government. Increased consciousness on bio-security measures among farmers and reduced prices of soybean meal, an important
___________________________________________________________________________ 150 NFPCSP (2012). Strengthen diversification to further improve food and nutrition security, Policy brief no. 7. 151 Calculated from data obtained from FAOStat.

60
poultry feed ingredient, also supported the rebound in farming152. The extension of vaccination coverage also accelerated the industry's recovery153. Artificial insemination, a key factor for improving livestock breeds, accelerated in 2011/12, after the slow-down observed in 2010/11, confirming an overall satisfactory progress since 2007/08.
4.5.2. Policy developments/programmes underway and needs for further action
The Sixth Five Year Plan (2011-15) emphasizes the importance of ensuring adequate feed supply; imparting training to veterinary technicians for identifying and treating common diseases and administering vaccines; cross-breeding of imported and domestic animals; improving livestock management practices for farmers; improving the breed of goats while retaining its disease resistance and skin quality; removing barriers that constrain the poor’s ownership of large animals; protecting the livestock sector from avian flu, anthrax etc.; and conducting research on production of vaccines according to climate and weather of the country.
In line with the SFYP, the final draft of the National Livestock Extension Policy (2013)154 has been prepared taking into account the rapidly changing context characterized by increasing demand for livestock products including organic products, increasing trends in production and investment. The policy focuses on veterinary public health and food safety issues; producers’ organizations; one stop livestock extension services; supply chain development; popularization of successful models and technologies; linkage among research, extension, education and farmers; constraints to farmers’ access to extension services; development of family level small scale livestock farming.
An Animal Slaughter and Meat Quality Control Act (2011)155, aiming at ensuring the slaughter of livestock and poultry in hygienic environments, has been approved by Parliament. The Government has published user manuals and introduced microcredit programmes for small, marginal and poor livestock and poultry farmers. The Bangladesh Dairy Development Council has been established156.
Between July 2009 and June 2012, 27.7 livestock and 600.6 million poultry were vaccinated and 6.7 million cattle were artificially inseminated. One buffalo breeding farm and one sheep development farm were established. Moreover, a Veterinary Drug Administration Cell has been established. The National Reference Laboratory for Avian Influenza was upgraded to international standards Bio-safety Level-2 Plus (BSL-II+) and SAARC has approved it as a regional reference laboratory. For the first time with the assistance of JICA, a new variety of commercial layer (named “Shubhra”) has been developed. It can lay 280 to 295 eggs per year. Thanks to long preservation efforts and genetic research, a domestic cattle breed (“Red Chittagong Cattle”) has been protected from extinction with possible positive impact on productivity of milk157.
___________________________________________________________________________ 152 Between January 2011 and January 2012, soybean meal price declined by 16%, from 412 USD/MT to 347 USD. http://www.indexmundi.com/commodities/?commodity=soybean-meal&months=60 153 The Daily Star, 22 February 2013. 154 http://www.dls.gov.bd/Final%20Draft%20%20of%20National%20Extension%20Policy.pdf 155 http://www.dls.gov.bd/files/Slaughter%20Act%20-2011.pdf 156 MoFLS, MTBF. 157 MoFLS, MTBF.

61
Programme 5 of the CIP has a financed budget of only 68.2 million USD, equivalent to a share of 1.1% of the total resources mobilized so far. Of the 16 projects financed as of June 2012, 3 were completed and 13 ongoing. Among the ongoing projects, 1 was initiated in FY 2010/11 and 3 in FY 2011/12. The 3 projects completed since 2010/11 had a total value of 14.5 million USD, which indicates that the average project size has slightly decreased from 4.8 million USD of the completed to 4.2 million USD for the ongoing.
It should be highlighted that no project has so far been financed under subprogrammes 5.3 (improving availability and quality of inputs through public private partnerships) while 2 projects are currently in pipeline. The total number of projects in pipeline is 10 with an average value of almost 14 million USD.
Total delivery between July 2010 and June 2012 is 38.8 million USD of which 10.3 was delivered during the last fiscal year and 13.7 over 2010/11. Overall, programme 4 requires additional attention in order to scale up public services in research, extension and animal health to the level required to sustain and accelerate the growing livestock sector. Particular attention is needed for subprogramme 5.3.
Needs for further action in this area include:
Ensuring supply of quality and safe feed and fodder: Feed is a key factor for animal production.158 The poor quality and high price of feed and scarcity of fodder constitute the main constraint for the growth of livestock and poultry farming. A study found out that in Bangladesh livestock feeds are inferior with substandard nutrition value.159 In 2010, although the Government approved the Animal and Fish Feed Act, poor quality feed is still produced and marketed by different companies due to an absence of proper monitoring. Bangladesh needs to set up testing laboratories at main feed producing centres to ensure quality feed. In line with NLEP (2013), fodder production can be augmented by using government fallow land, roadside slopes, riverside slopes and newly accreted char land. It is noticeable that in order to expand grass cultivation technology, 4260 exhibitions were arranged at farm level by the Government over the period 2010–2012. Moreover, 35 million cuttings of 3 newly innovated fodder were distributed among farmers in different regions during the last three years160. Among the CIP pipeline projects requiring attention is the "Establishment of cattle feed plant for enhancing milk production".
Diversifying supply and monitoring private sector production and marketing of vaccines: Only a small amount of vaccines is produced in the country by one veterinary vaccine production laboratory under DLS. In the private sector, pharmaceutical companies either manufacture or import livestock vaccines. Government should continuously monitor vaccine production and marketing by the private sector and take initiative to further diversify availability. For this purpose, capacity of DLS personnel needs to be up scaled. Besides, there is urgent need to develop pipeline projects to improve availability and quality of inputs through public private partnerships. More broadly, the CIP subprogramme 5.3 aiming to “improve availability and quality of inputs through public private partnerships" requires additional efforts in formulation and financing.
___________________________________________________________________________ 158 Makkar, H. Feed and Fodder Challenges for Asia and the Pacific, Animal Production and Health Division, FAO. 159 http://www.studymode.com/essays/Livestock-Feed-Marketing-In-Bangladesh-Problems-598715.html 160 MoFLS, MTBF.

62
Breed management for livestock: Productivity of milk in Bangladesh is the lowest with average 206 kg/ head/ year compared to 1087 kg for India, 1253 kg for Pakistan and 9118 kg for the USA161. The most common local cow has very low productivity. Although productivity has improved significantly by creating various cross breeds in the country, a selective breeding program is needed to obtain the best possible lines for milk production. Artificial insemination services are provided by a number of organizations, including DLS, Milk Vita and BRAC. However there is no breeding programme to selectively breed a few generations of acclimatized cows. The Bangladesh Livestock Research Institute (BLRI) is tasked with developing appropriate technologies and breeds that are suitable to our environment. However, BLRI has also been hampered by a shortage of manpower and finances. Since 2001 the BLRI’s budget has been almost completed devoted to salaries with only 6.5% on average left over for financing research related expenditure162. The private sector in Bangladesh has not reached the technological sophistication nor has the financial power to conduct research on improving the genetic potentiality of the animals, while it is desirable that the benefits of genetic improvements are publicly available rather than appropriated by single corporations. Thus, the government and universities should take the initiative to conduct research on improving the quality of livestock. Properly funded and monitored cross-breeding and selective breeding programmes are essential to create climatized breeds that will be produced optimally in the Bangladesh environment. The budget allocation for subprogramme on research on livestock development which accounts for only 0.55% of the total CIP budget is very limited for genetic development of livestock in the country. Financing and implementation of the three pipeline projects on “Establishment of Post-graduate Training and Research Facilities on Livestock”, “Establishment of Buffalo Breeding Station for Enhancing Milk Production” and “Buffalo Dairy Development through Selective Breeding Project” may contribute to reduce the gap.
Conserving of Black Bengal goat species: The goat is the most neglected, but important species of livestock in Bangladesh. Among the Asiatic countries, Bangladesh possesses the third largest repository of goats, with a population of more than 34 million heads. More than 90% of the goats of the country are of the Black Bengal breed. Local black Bengal goats are disease resistant and able to live off scavenged food. The skins of these goats are also of high quality and a major source of export earnings. Each year goat provides 127,000 MT of meat, accounting for 25% of total red meat. It is also important for uplifting income of the rural poor as more than 98% of goats are owned by the small, marginal and landless farmers in rural areas163. Therefore, goat productivity must be increased to meet the growing demand for meat in the future. Efforts should be made to improve the breed to increase meat (and milk) production, while retaining its disease resistance and skin quality. One obstacle to meeting this requirement is that programmes for scientific breeding are practically absent. Therefore, a comprehensive programme of genetic improvement and conservation of local goat needs to be initiated. For genetic improvement of indigenous cattle like Black Bengal goats in the existing situation, an
___________________________________________________________________________ 161 http://statinfo.biz/Geomap.aspx?region=154&act=6243&lang=2162 http://www.undp.org.bd/library/policypapers/Dev%20of%20Dairy%20Indus(English).pdf 163 http://www-naweb.iaea.org/nafa/aph/stories/2006-black-bengal.html

63
Open Nucleus Breeding Scheme (ONBS) may be undertaken as it is the most suitable system for a country like Bangladesh164. Under the CIP, no project in connection with goat development has been initiated.
Improving bio-security in poultry farms as well as in the marketing chain: Poultry is a major contributor to the growth of the livestock sector. In recent years producers have borne tremendous losses due to the highly pathogenic avian influenza (HPAI), although its attack has reduced substantially in the last year. Official figures are not always reliable as many farmers try to hide HPAI outbreaks because the compensation they receive for culled birds is less than what they receive from selling the birds. Outbreaks of HPAI can be limited through the improvement of bio-security in poultry farms and in the marketing chain, and by involving all stakeholders, including farmers, feed millers, processors, traders and consumers. Principles of bio-security plans are to increase the ability of animals to resist diseases; minimize the contact that might result in diseases; and eliminate sources of infection. For this purpose, the Government and private sector should undertake joint initiatives.
Scaling up budget allocation in the livestock sub-sector: Instead of scaling up, budget allocation for fishery and livestock sector has reduced from 9.789 billion taka in FY2011/12 to 9.497 billion taka in FY2012/13165. Moreover, only 1.1% of total CIP budget is allocated for the livestock development programme. Budget allocation to the livestock sector is limited and needs to be scaled up through the formulation and financing of projects in activities that can support the growth of private investments such as veterinary services and disease control, improvement of breeds and production of animal feeds, improvement of processing and marketing facilities so as to accelerate growth of the sub-sector and realize its potential for the improvement of income and the food security status of the population.
Improving marketing of livestock and livestock products and development of value chain: In line with NAEP (2013), adoption of technologies in marketing of livestock and its products should be market driven rather than technology driven. Production of livestock products like milk, meat and eggs are seriously hampered by the inadequate development of the marketing system and market infrastructure for these perishable products. Without adequate access to organized markets, technological innovation will not take place as required for a real breakthrough in productivity. For example, in the dairy industry, collection and processing of milk is normally conducted by private enterprises, but it cannot work effectively without a marketing network that coordinated the multitude of producers involved. Value chain is the full range of activities which are required to bring a product or service from conception, through the intermediary phases of design, production, delivery to final consumers, and final disposal after use166. Constraints hindering value chain development should be identified and government should provide an enabling environment, opening opportunities, reducing risks and vulnerability for harnessing full potential of the livestock sector.
___________________________________________________________________________ 164 In open Nucleus Breeding System Gene flow from both way viz., downward from nucleus to other lower herd (multiplier & commercial) and upward from lower to upper herd (nucleus) by introduction of superior animals from other herds. 165 The Financial Express, June 8, 2012. 166 Kaplinsky, R (2000). Globalization and Unequalization: What can be learned from value chain analysis. Journal of Development Studies 37 (2): 117-146.

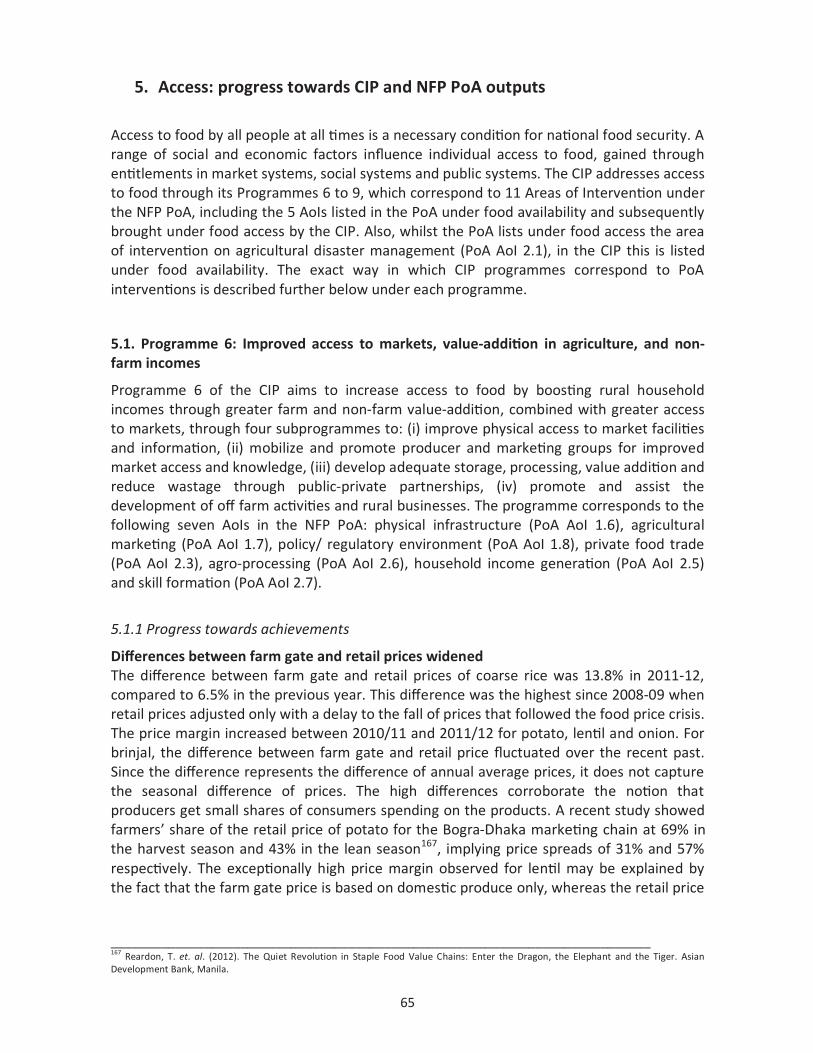
65
5. Access: progress towards CIP and NFP PoA outputs
Access to food by all people at all times is a necessary condition for national food security. A range of social and economic factors influence individual access to food, gained through entitlements in market systems, social systems and public systems. The CIP addresses access to food through its Programmes 6 to 9, which correspond to 11 Areas of Intervention under the NFP PoA, including the 5 AoIs listed in the PoA under food availability and subsequently brought under food access by the CIP. Also, whilst the PoA lists under food access the area of intervention on agricultural disaster management (PoA AoI 2.1), in the CIP this is listed under food availability. The exact way in which CIP programmes correspond to PoA interventions is described further below under each programme.
5.1. Programme 6: Improved access to markets, value-addition in agriculture, and non-farm incomes
Programme 6 of the CIP aims to increase access to food by boosting rural household incomes through greater farm and non-farm value-addition, combined with greater access to markets, through four subprogrammes to: (i) improve physical access to market facilities and information, (ii) mobilize and promote producer and marketing groups for improved market access and knowledge, (iii) develop adequate storage, processing, value addition and reduce wastage through public-private partnerships, (iv) promote and assist the development of off farm activities and rural businesses. The programme corresponds to the following seven AoIs in the NFP PoA: physical infrastructure (PoA AoI 1.6), agricultural marketing (PoA AoI 1.7), policy/ regulatory environment (PoA AoI 1.8), private food trade (PoA AoI 2.3), agro-processing (PoA AoI 2.6), household income generation (PoA AoI 2.5) and skill formation (PoA AoI 2.7).
5.1.1 Progress towards achievements
Differences between farm gate and retail prices widened The difference between farm gate and retail prices of coarse rice was 13.8% in 2011-12, compared to 6.5% in the previous year. This difference was the highest since 2008-09 when retail prices adjusted only with a delay to the fall of prices that followed the food price crisis. The price margin increased between 2010/11 and 2011/12 for potato, lentil and onion. For brinjal, the difference between farm gate and retail price fluctuated over the recent past. Since the difference represents the difference of annual average prices, it does not capture the seasonal difference of prices. The high differences corroborate the notion that producers get small shares of consumers spending on the products. A recent study showed farmers’ share of the retail price of potato for the Bogra-Dhaka marketing chain at 69% in the harvest season and 43% in the lean season167, implying price spreads of 31% and 57% respectively. The exceptionally high price margin observed for lentil may be explained by the fact that the farm gate price is based on domestic produce only, whereas the retail price
___________________________________________________________________________ 167 Reardon, T. et. al. (2012). The Quiet Revolution in Staple Food Value Chains: Enter the Dragon, the Elephant and the Tiger. Asian Development Bank, Manila.

66
is based on a mix of domestic and imported produce, in which the imported component has an increasing share, with higher quality and prices. Table 16: Progress towards achievement of CIP programme 6
CIP/NFP PoA output proxy indicators 2007/08 2009/10 2010/11 2011/12 Source
Difference between farm gate and retail price of selected goods as % of farm gate
Coarse rice 4.8% 1.0% 6.5% 13.8%
DAM Lentil 39.3% 66.5% 105.9% 129.9%
Onion 13.7% 39.1% 14.9% 63.4% Brinjal 67.0% 45.9% 24.2% 29.7% Potato 21.0% 25.3% 41.1% 54.5%
Difference between dealers’ and farmers’ prices of fertilizers as % dealers price
Urea 19% - 25% 20% 20%, 11%
11% MoA Circular on mill gate price and maximum farmers' price
TSP 3% - 6% 10% 10% 10% MoP 17% - 31% 9% 15% 15%
Number of growth centers, rural markets, women market centers, and Union Parishad Complexes developed by LGED
442 350 580 413 LGED M&E
Wage differential between male and female in agriculture
48% 43% 41% 40% Yearbook of Agricultural Statistics and Monthly Statistical Bulletin, BBS
Real GDP growth of small scale manufacturing
7.1% 7.8% 5.8% 6.5% Bangladesh Economic Review (Bangla), BBS
Number of students enrolled in Technical and Vocational Education and Training (TVET) institutions
89,637 125,594 139,374 144,904 Bangladesh Economic Review and BANBEIS Ratio of TVET students in year t to
secondary and higher secondary school enrolment in year t-1
1.21% 1.84% 1.90% 1.94%
Difference between dealers’ and farmers’ prices of fertilizers remain relatively stable Table 16 shows that the difference between dealers’ and farmers’ prices of different types of fertilizers ranged between 10% and 15% which is a reasonable range of difference. For urea this is equivalent to 1 taka. The higher difference for urea price observed in the past was explained by weight loss (about 2-3 kg from a bag of 50 kg) mainly due to the fact that bags were often opened to sell in small quantities to small farmers. According to DAE Officials, such loss has been minimized to a good extent by encouraging farmers to buy whole bags of urea by a single or more than one buyer. Fewer new growth centres and rural markets developed The number of growth centres, rural markets, women market centres and UP complexes developed fell from the exceptional number of 580 in 2010/11 to 413 in 2011/12, which is in line with the average performance recorded since 2007/08. Improved markets and rural transport infrastructure is needed to widen market access. Farm products are transported within rural areas, and from rural to urban areas, using mainly unpaved roads. The Roads and Highways Department constructed more than 400 kilometers of roads between 2007 and 2010, and paved and unpaved roads maintained by the Local Government Institutions increased by 6,366 kilometers and 18,307 kilometers, respectively between 2007/08 and 2009/10168. With a view to strengthening the rural economy, 28,086 km out of 37,763 km of Upazila roads have been brought under development work169. ___________________________________________________________________________ 168 BBS: Statistical Pocket Book of Bangladesh 2011. 169 Budget Speech (2011-12) of the Finance Minister, Ministry of Finance, Government of Bangladesh.
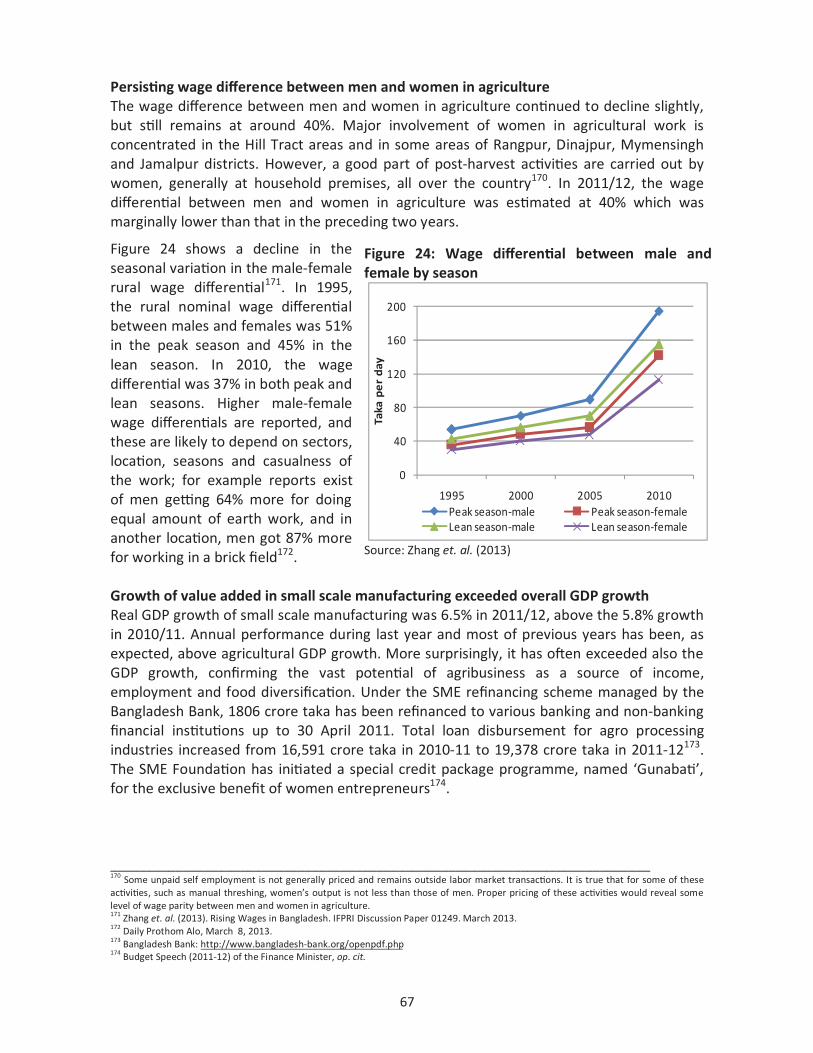
67
Persisting wage difference between men and women in agriculture The wage difference between men and women in agriculture continued to decline slightly, but still remains at around 40%. Major involvement of women in agricultural work is concentrated in the Hill Tract areas and in some areas of Rangpur, Dinajpur, Mymensingh and Jamalpur districts. However, a good part of post-harvest activities are carried out by women, generally at household premises, all over the country170. In 2011/12, the wage differential between men and women in agriculture was estimated at 40% which was marginally lower than that in the preceding two years.
Figure 24 shows a decline in the seasonal variation in the male-female rural wage differential171. In 1995, the rural nominal wage differential between males and females was 51% in the peak season and 45% in the lean season. In 2010, the wage differential was 37% in both peak and lean seasons. Higher male-female wage differentials are reported, and these are likely to depend on sectors, location, seasons and casualness of the work; for example reports exist of men getting 64% more for doing equal amount of earth work, and in another location, men got 87% more for working in a brick field172. Growth of value added in small scale manufacturing exceeded overall GDP growth Real GDP growth of small scale manufacturing was 6.5% in 2011/12, above the 5.8% growth in 2010/11. Annual performance during last year and most of previous years has been, as expected, above agricultural GDP growth. More surprisingly, it has often exceeded also the GDP growth, confirming the vast potential of agribusiness as a source of income, employment and food diversification. Under the SME refinancing scheme managed by the Bangladesh Bank, 1806 crore taka has been refinanced to various banking and non-banking financial institutions up to 30 April 2011. Total loan disbursement for agro processing industries increased from 16,591 crore taka in 2010-11 to 19,378 crore taka in 2011-12173. The SME Foundation has initiated a special credit package programme, named ‘Gunabati’, for the exclusive benefit of women entrepreneurs174.
___________________________________________________________________________ 170 Some unpaid self employment is not generally priced and remains outside labor market transactions. It is true that for some of these activities, such as manual threshing, women’s output is not less than those of men. Proper pricing of these activities would reveal some level of wage parity between men and women in agriculture. 171 Zhang et. al. (2013). Rising Wages in Bangladesh. IFPRI Discussion Paper 01249. March 2013. 172 Daily Prothom Alo, March 8, 2013. 173 Bangladesh Bank: http://www.bangladesh-bank.org/openpdf.php 174 Budget Speech (2011-12) of the Finance Minister, op. cit.
Figure 24: Wage differential between male and female by season
0
40
80
120
160
200
1995 2000 2005 2010
Taka
pe
r da
y
Peak season-male Peak season-femaleLean season-male Lean season-female
Source: Zhang et. al. (2013)

68
Skill development training increased Technical and Vocational Education and Training (TVET) institutes are engaged in developing skilled manpower by offering both short and medium term training in engineering, commerce and other vocations. Table 16 shows that enrolment in these institutes registered an impressive increase from 89,637 in 2007/08 to 144,904 in 2011/12, representing an annual average increase of about 12%. Also, the ratio of TVET enrolment to lagged secondary education enrolment has increased, showing that the opportunity to continue with technical or vocational education has increased despite the increase in population. Technical training leading to diploma and certificates are being offered by both public and private institutions. Several other institutions contribute to train personnel for technology generation and dissemination, including the Central Extension Resources Development Institute (CERDI) at Joydevpur, the Graduate Training Institute (GTI) attached to the Agricultural University at Mymensingh and 12 Agricultural Training Institutes (ATIs) located throughout the country. During the Sixth Five Year Plan period, two more ATIs will be established to meet the growing needs of extension agents. The Academies for Rural Development in Comilla and Bogra train agricultural personnel including model farmers and managers of village cooperative societies on various aspects of technology generation and dissemination. On a regional basis, women farmers will be trained on crop cultivation including homestead agriculture, with emphasis on new technologies such as compost making and other organic manure production175. Rural women’s skills development can be enhanced through increased training in cottage industries, and employment opportunities can be expanded by establishing more cottage industries through public and private initiatives. 5.1.2 Policy developments/programmes underway and need for further action The financed and pipeline budget for Programme 6 increased from 1,318 million USD to 1,711 million USD, while the number of projects increased from 49 to 52. In terms of financed projects (completed and ongoing), Programme 6 accounts for 18.8% of the CIP, and has 1,168 million USD.
Subprogramme 6.1, focusing on infrastructure development, absorbs an overwhelming part of the total budget, and as of June 2012, has financed eight projects already completed and 21 ongoing projects. The major ongoing projects are: ‘Marketing of agricultural products through development of rural communication system’ and ‘Construction of village road, bridge/culvert and other infrastructure of underdeveloped Upazilas of North-West Bangladesh’. An additional six projects are in the pipeline with a total budget of 250 million USD. Subprogramme 6.2 has so far mobilized only 8.6 million USD under a project completed in 2011/12, and two that are ongoing. There is a good pipeline with five projects for a total of 10 million USD. Under subprogramme 6.3, despite the attention devoted during the CIP consultations, no investment has taken place in public-private partnerships as a means to develop storage, processing and value addition. The 10 pipeline projects considered in the CIP 2011 have not been sponsored by any institution, and only one remained in CIP 2012. However, two new projects have been formulated in the course of the last fiscal year, bringing the total pipeline awaiting financing to three projects for a total ___________________________________________________________________________ 175 The Sixth Five Year Plan (2011-15). Part-2: Sectoral Strategies, Programs and Policies. Planning Commission. Ministry of Planning, Governance of Bangladesh, Dhaka, July 2011.

69
value of 47.2 million USD. Subprogramme 6.4 promotes the development of off- farm activities and rural businesses with a total financing of 78.8 million USD already secured for 10 completed projects and 26 currently being implemented. There is also a significant pipeline including 16 projects for a total cost of 46.5 million USD.
Delivery over the first 2 years of the CIP has totalled 462 million USD, decreasing from 246 million USD in 2010/11 to 216 million USD in 2011/12. This is essentially due to the reduced expenditure under the DPs financed activities under subprogramme 6.1, which is consistent with reduction in the number of ongoing projects from 25 in FY 2010-11 to 21 in FY 2011-12.
For programme 6 as a whole, the most important pipeline projects are ‘Strengthening capacity building of the Department of Agricultural Marketing (DAM) in research and policy analysis on agriculture marketing information’, ‘Improving marketing efficiency through value chain linkage development in 6 selected districts’ and ‘Ensuring food security through enhancing value addition and processing activities in 10 selected districts’. Part of the budget increase is accounted for by one large project “Construction of small bridges/culverts on the rural roads (3rd Phase)” that entered the pipeline in the original CIP and was further expanded in the following years.
For improving the rail communication system, a Ministry for Railway was established in 2012 and the 20 Year Master Plan for Railway is nearly finalised. Under the Railway Sector Improvement Project, construction of a double line rail track along Tongi-Bhairab Bazaar has been started. To improve the water transportation system by enhancing the navigability of rivers, dredging activities have been intensified and 3 new dredgers have been procured176.
The Government has introduced training for Upazila Parishad Chairpersons and Vice Chairpersons as part of strengthening local government institutions. The Government has also constructed 652 Union Parishad complexes during the period 2009-11177.
On the policy and regulatory front, the Agricultural Produce Markets Regulation Act 1964 (revised in 1985) is being reformulated as the new Agricultural Marketing and Agribusiness Management Act (2011). The proposed legislation is expected to improve the legal framework governing agricultural price information, agribusiness and marketing. It has incorporated new license fees and license renewal fees for wholesalers, aratdars and commission agents. The Government enacted the Consumer Right Protection Act 2009 to determine, promote and protect the rights of consumers through fair and honest trade practices by manufacturers and traders of goods and services. However, implementation of the Act has been fraught with difficulties.
Recently the Government has formulated a draft Food Safety Act 2013, with provision for establishing a National Food Safety Management Advisory Council and an independent Bangladesh Food Safety Authority. The draft Act is expected to be placed before Parliament soon. Improvement of food safety and quality regulations is important not only for public health and nutrition, but also for establishing a normative framework for the development of agribusiness from the farm to the consumer. Indeed, the possibility to easily recognize and trust the quality and safety of food can be seen as a very important contribution to the reduction of transaction costs.
___________________________________________________________________________ 176 Budget speech (2011-12) of the Finance Minister op. cit. 177 Budget speech (2011-12) ibid.
70
Need for further action in this area include:
Sustaining development and maintenance of rural transportation and market infrastructures: Although there has been substantial expansion of rural road networks over the past years, some areas still face constraints in accessing markets with negative impact on the growth of perishable, high value products. The further development of the road network should also ensure quality of construction to prevent deterioration of rural roads shortly after construction. Beside the road network, attention needs to be given to water transport, so as to valorise the country’s network of rivers, canals and haors. Also important is the rail transportation system, which has been neglected in the past. The Government has recently established the Rail Ministry, which is expected to enhance this transportation system. Equally important is to sustain the development of growth centres, rural markets, women market centres and UP complexes.
Integrating rural infrastructure development with safety net programmes: Safety net programmes are increasingly being refocused towards productive and promotional directions. Such focus can conveniently be integrated with construction, repair and maintenance of rural transportation infrastructure and other asset creation. The Food/Cash for work and Employment Generation Programme for the Ultra poor can be integrated with rural infrastructure building and asset creation. In doing so, a great deal of care needs to be taken in identifying and designing the appropriate rural infrastructure projects178.
Developing cold storage and transportation facilities: Most fruits and horticultural products are perishable and need to be preserved for short or long durations before marketing. Potato is the produce stored for a relatively longer period. Hossain and Miah (2009)179 estimated total post-harvest loss of potato at 28% for traditionally stored potatoes and 23% for cold stored potatoes. Hassan and Raha (2013)180 identified several measures for improving cold storage facilities for potato including regularity of electricity supply, technical skill development of cold storage operators and maintenance of multi-chamber cold storage providing different levels of temperatures for table and seed potatoes. Some fruits and vegetables are stored for shorter duration before transporting and marketing. In addition to cold storage facilities, there is a growing need for refrigerated transport. These is particularly relevant for fruits, vegetables and milk. While some large corporates, such as PRAN, BRAC, Milk Vita and Aftab maintain their own chilling plants and refrigerated vehicles, such facilities are not available for smaller traders and processors. Exemption from duties for some years can boost the import of vehicles and other essential facilities.
Developing processing for value addition and wastage minimization: While large private companies such as PRAN, BRAC, Square and Aftab Groups are increasingly active in agro-processing, none of the projects included in the pipeline for subprogramme 6.3 have so far been implemented. As part of this effort it is also
___________________________________________________________________________ 178 Field visits by the NFPCSP Team in 2008 revealed that some projects of the 100 Day Employment Generation programme (2008-09) were not properly designed, and hence faced a lot of constraints in their implementation. 179 Hossain, M. A and M. A. M. Miah (2009). Post harvest Losses and Technical Efficiency of Potato Storage Systems in Bangladesh. Final Report No. 2/08. NFPCSP Research Grant Initiative. FAO/MoF, Dhaka. 180 Hassan, M. K. and S. K. Raha (2013). Improving Marketing System Performance for Fruits and Vegetables in Bangladesh. Research completed through NFPCSP/FAO support, Dhaka, Bangladesh.

71
possible to minimize wastage and valorize by-products. A Department of Agriculture Marketing (DAM) report presents evidence on producing edible oil from rice bran in different locations of Bangladesh181. Rashidpur Oil Mill at Pabna uses 40 metric tons and Amarend Oil Industry uses 25 metric tons of rice bran per day for producing edible oil. More of such initiatives are required to stimulate value addition in the interests of farmers, processors and consumers.
Developing technical skills: With increasing technological developments and mechanization of agricultural activities, the need for technically skilled personnel is increasing rapidly. As has been mentioned, skill development training activities are increasing rapidly. Such activities need to be further expanded along the lines of non-crop and non-agricultural activities including fisheries, livestock, agro-processing and manufacturing/repairing of farm implements.
Promoting farmers’ organizations in marketing farm products: Small and marginal farmers generally sell their agricultural produce immediately after harvest, more often at the farm gate. Their poor bargaining power means they are deprived of the remunerative prices of their products. Small and marginal farmers cannot access the Government procurement centres for selling paddy at the incentive prices offered by the Government. In the case of other products such as vegetables and fruits, they can reach only up to local markets where they fall in the grip of middlemen to whom they are generally compelled to sell at lower prices because of perishability of the products. Hossain and Miah (2009)182 studied the marketing chain of 12 fruits and vegetables and found the percentage difference between harvest and retail prices at 120% for tomato, 116% for papaya and 129% each for pineapple and jackfruits. Concerted efforts are needed for promoting farmers’ organizations for marketing farm products, particularly in remote areas.
Reducing wage differentials between men and women: Although national level data have shown some improvement over time, wage differential is still in the order of 40%. More recent location-specific anecdotal reports exist of even wider difference in male-female wages. More research and analyses are needed to identify if the main determinants of the wage differential are productivity differences or others- and identify suitable interventions to minimize it.
5.2. Programme 7: Strengthened capacities for implementation and monitoring of the NFP and CIP actions
Programme 7 aims to strengthen organisational and human capacities to design, implement and monitor the NFP PoA and the CIP. It is articulated in 3 subprogrammes focusing on strengthening capacities of: 1) the Government in policy implementation, coordination and monitoring; 2) the Government in design, management and operation of CIP operations; and 3) civil society organisations to contribute to CIP development and implementation. The insititutional setting for the NFP PoA and CIP and the monitoring framework are explained in Chapter 2.
___________________________________________________________________________ 181 Hossain, J. (2012). Prospects and Imperatives for Production of Edible Oil from Rice Bran (in Bangla). Department of Agriculture Marketing. Khamarbari, Dhaka. 182 Hossain, M. A. and M. A. M. Miah (2009). op. cit.

72
5.2.1 Progress towards achievements
Progress under Programme 7 is measured by three indicators in Table 17. Table 17: Progress towards achievement of CIP programme 7
CIP/NFP PoA output proxy indicators 2007/08 2009/10 2010/11 2011/12 Source
Additional resources mobilized for CIP183 na na 1,616 million
USD 1,712 million
USD CIP
monitoring Increase in ongoing projects Number
na na 83 65
CIP monitoring Value
1,647 million USD
1,591 million USD
CIP available budget execution performance na na 47.8% 50.6% CIP
monitoring
CIP Monitoring Reports produced na na Produced Produced FPMU
Additional resources mobilized for CIP During 2011/12, an additional 1,712 million USD were mobilized in projects previously in the pipeline or newly identified. This compares to 1,616 million USD in FY 2010/11, with an increase in fund mobilization of 96 million USD. Increase in projects implemented under the CIP Implementation of 65 projects (new or previously in pipeline) was initiated in 2011/12, valued at 1,591 million USD, out of a total additional financing of 1,712 million USD, with the balance of 121 million USD accounted for by revisions to the budgets of ongoing projects. This compares with 83 new projects in 2010/11, valued at 1,647 million USD, indicating that 18 fewer projects entered into implementation, but that the average size of projects increased from about 20 to 25 million USD.
Table 18 shows that the number of newly initiated projects decreased for the availability component from 50 in 2010/11 to 37 in 2011/12, although the value of projects increased from 841.8 million USD to 1211.7 million USD, an increase of 369.9 million USD. Table 18: Increase in number and value of projects implemented
Component
FY 2010/11 (revised)
FY 2011/12 Changes between FY 2011/12
and FY 2010/11
No. of Projects
Project Cost (million USD)
No. of Projects
Project cost (million USD)
No. of Projects
Project cost (million USD)
Total GoB DPs Total GoB DPs Total GoB DPs
Availability 50 841.8 57.3 784.5 37 1211.7 512.6 699.2 -13 369.9 455.3 -85.3
Access 18 666.1 147 519 14 272.1 102.2 169.9 -4 -394 -44.8 -349.1
Utilization 15 139.5 114.3 25.2 14 107.5 31.8 75.7 -1 -32 -82.5 50.5
Total 83 1647.3 318.6 1328.7 65 1591.3 646.5 944.8 -18 -56 327.9 -383.9
Source: CIP 2012 and CIP 2013
Under access, 14 new projects were initiated, compared to 18 projects in 2010/11, with the value of newly initiated projects decreasing by 394 million USD. The utilisation component shows a similar trend with 14 new projects initiated in 2011/12 compared to 15 in 2010/11, with the value of newly initiated projects decreasing by 32 million USD. DP contributions to newly initiated projects under availability and access decreased, whilst they increased under ___________________________________________________________________________ 183Additional resources mobilized for the CIP is calculated as the total of ongoing and completed projects as of June of each financial year.
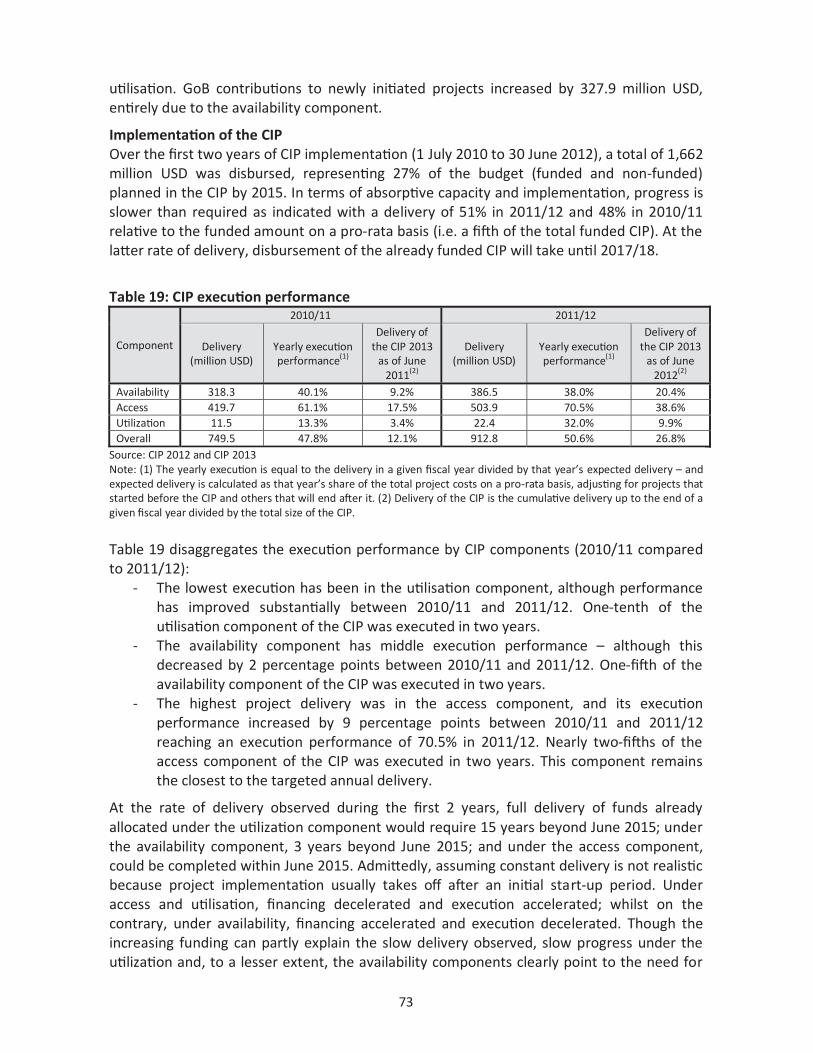
73
utilisation. GoB contributions to newly initiated projects increased by 327.9 million USD, entirely due to the availability component.
Implementation of the CIP Over the first two years of CIP implementation (1 July 2010 to 30 June 2012), a total of 1,662 million USD was disbursed, representing 27% of the budget (funded and non-funded) planned in the CIP by 2015. In terms of absorptive capacity and implementation, progress is slower than required as indicated with a delivery of 51% in 2011/12 and 48% in 2010/11 relative to the funded amount on a pro-rata basis (i.e. a fifth of the total funded CIP). At the latter rate of delivery, disbursement of the already funded CIP will take until 2017/18.
Table 19: CIP execution performance
Component
2010/11 2011/12
Delivery (million USD)
Yearly execution performance(1)
Delivery of the CIP 2013
as of June 2011(2)
Delivery (million USD)
Yearly execution performance(1)
Delivery of the CIP 2013
as of June 2012(2)
Availability 318.3 40.1% 9.2% 386.5 38.0% 20.4% Access 419.7 61.1% 17.5% 503.9 70.5% 38.6% Utilization 11.5 13.3% 3.4% 22.4 32.0% 9.9% Overall 749.5 47.8% 12.1% 912.8 50.6% 26.8%
Source: CIP 2012 and CIP 2013 Note: (1) The yearly execution is equal to the delivery in a given fiscal year divided by that year’s expected delivery – and expected delivery is calculated as that year’s share of the total project costs on a pro-rata basis, adjusting for projects that started before the CIP and others that will end after it. (2) Delivery of the CIP is the cumulative delivery up to the end of a given fiscal year divided by the total size of the CIP.
Table 19 disaggregates the execution performance by CIP components (2010/11 compared to 2011/12):
- The lowest execution has been in the utilisation component, although performance has improved substantially between 2010/11 and 2011/12. One-tenth of the utilisation component of the CIP was executed in two years.
- The availability component has middle execution performance – although this decreased by 2 percentage points between 2010/11 and 2011/12. One-fifth of the availability component of the CIP was executed in two years.
- The highest project delivery was in the access component, and its execution performance increased by 9 percentage points between 2010/11 and 2011/12 reaching an execution performance of 70.5% in 2011/12. Nearly two-fifths of the access component of the CIP was executed in two years. This component remains the closest to the targeted annual delivery.
At the rate of delivery observed during the first 2 years, full delivery of funds already allocated under the utilization component would require 15 years beyond June 2015; under the availability component, 3 years beyond June 2015; and under the access component, could be completed within June 2015. Admittedly, assuming constant delivery is not realistic because project implementation usually takes off after an initial start-up period. Under access and utilisation, financing decelerated and execution accelerated; whilst on the contrary, under availability, financing accelerated and execution decelerated. Though the increasing funding can partly explain the slow delivery observed, slow progress under the utilization and, to a lesser extent, the availability components clearly point to the need for

74
additional efforts to increase the number and capacity of personnel involved in implementation, and to enhance implementation arrangements and procedures.
The slow execution of funds within the GoB is attributed to delays in procurement, land acquisition, recruitment of project staff and unrealistic aid estimates. Delays in contract approvals and delays in fund release are some of the challenges from the DP side. Nevertheless, performance of the ADP portfolio is a matter of concern184. Incremental budgeting and the tendency to add new projects while continuing with existing projects, has led to the practice of stretching scarce resources to cover new projects at the expense of inadequate maintenance of ongoing ones. Implications of poor management include time and cost overruns, deferral of project benefits to the future, and declining returns on investment. Consequently, the ADP has carried a significant backlog of incomplete projects each successive year, resulting in low rates of project completion and implementation185. Active institutional framework Under the arrangements in place for implementing, coordinating and monitoring the NFP PoA and CIP, inter-ministerial collaboration and information exchange continued to be enhanced through regular Thematic Team (TTs) meetings held at FPMU under the guidance of the Food Policy Working Group. This monitoring report is a direct outcome of this collaboration, as is the substantial inter-ministerial data sharing that underlies it. The report is expected to feed into the planning and implementation processes in individual ministries and divisions so as to enhance coherence, coordination and effectiveness.
During the last year, efforts have been made to maximize consistency and synergies with the mechanisms in place for Scaling Up Nutrition. In particular, the CIP framework has been used as a main reference in the costing of direct and indirect nutrition interventions in the country. Attention has also been devoted to maximize consistency between the NFP and CIP process and the ongoing debate for the assessment of progress toward the MDGs –especially MDG 1- and formulating the post MDG vision and goals. 5.2.2 Policy development/programmes underway and needs for further ac on
Programme 7 consists of technical assistance funded exclusively by development partners. It accounts for 0.28% of the funded CIP as of June 2012, with 2 completed, 3 ongoing and 3 pipeline projects. Programme 7.1 has two completed, one ongoing and two pipeline projects. Programmes 7.2 and 7.3 share one ongoing project of 13.8 million USD, which is the Integrated Agriculture Productivity Project financed by the GAFSP and implemented by the Ministry of Agriculture. Three pipeline projects await funding of a total of 47.5 million USD. Two pipeline projects are ideas for interventions identified as part of the consultation for the revision of the CIP. Enhancing monitoring information across ministries As with previous years, data to monitor the PoA and CIP, as presented in this report, was provided and endorsed by the TTs. The capacity of TTs in monitoring input data and outcomes has been strengthened through training under the NFPCSP and participation in
___________________________________________________________________________ 184 Khan, A. (2012). Presentation to the LCG on Improving Aid Effectiveness in Bangladesh. 185 World Bank (2010). Bangladesh Public Expenditure and Institutional Review. Report No. 47767-BD.

75
producing this report. Project classification in the CIP database was enhanced in terms of (i) programmes and subprogrammes, (ii) implementing agency, and (iii) completed, ongoing or pipeline projects. The quality and reliability of CIP financial data has been also improved. The CIP Database, initially created on MS Excel was converted and updated to Access. Data from July 2010 to June 2012 has been validated against the ADP official records published by the Programming Division and IMED of the Ministry of Planning dating from 2010 to 2012/13. The results of these efforts are presented in detail in Chapter 7 and Annex 3 of this report. Ongoing capacity support by FAO, USAID and EU through the NFPCSP The NFPCSP will continue in close liaison with FPMU, to strengthen national capacities to formulate, implement and monitor equitable, pro-poor and gender sensitive food security and nutrition policies and investments until September 2014. NFPCSP actively supported FPMU to formulate and monitor the NFP PoA and CIP, and to produce publications on food and nutrition security. FPMU’s technical and institutional capacities have been enhanced by supporting the revision of its mandate, structure and staffing, strengthening its information systems and outreach capacity. The Unit’s ability to promote inter-ministerial collaborations has been reinforced through reform of the composition and operation modalities of four Thematic Teams and a Food Policy Working Group. Technical capacities of FPMU increased considerably through postgraduate study, specialised formal training in-country and abroad, and on-the-job training. To support sustainability, NFPCSP has invested in the capacities of academics to deliver university-level training on food and nutrition security. Support to the FPMU has increased the level of policy and research debate in the country and significantly strengthened the FPMU as the food and nutrition security hub of the GoB. Generating knowledge in support of decision making The FPMU and NFPCSP Research Grants Scheme (RGS) financed 16 policy-related studies executed by national academic institutions and non-government organizations, of which 14 will be completed before June 2013 and the other 2 before December 2013. Issues covered include the natural resources availability, diversification of agriculture, safety nets, formulation of food composition tables, dietary requirements and food safety. FPMU commissioned a study by BIDS to estimate parameters required for the national food budget and planning of public food operations. The GoB-WFP-UNDP study on social safety net transfer modalities (cash vs. food) is ongoing, with a baseline survey completed and the outcome survey ongoing. The MDG Fund has provided training to MoHFW staff on acute malnutrition and to DAE and DoLS staff on vegetable production and nutrition186. IFPRI’s Poverty Research and Strategy Support Programme supported studies on food policy research capacity, wages in Bangladesh and women’s employment in agriculture. Ongoing capacity support by FAO and GAFSP through the IAPP/TA The IAPP, implemented in collaboration with the MoA, is progressing. A mapping exercise of farmers’ organisations has been completed, and 261 community facilitators have been trained on community mobilization and facilitation. A study tour to India has been
___________________________________________________________________________ 186 Mid-term evaluation of the MDGF available online at http://www.mdgfund.org/sites/default/files/Bangladesh%20-%20Nutrition%20-%20Mid-term%20Evaluation%20Report_0.pdf.

76
undertaken to expose IAPP officials to community mobilization activities by two World Bank financed projects. Development of a National Aid Policy and web-based Aid Information Management System (AIMS) A proposal has been put forth by the Aid Effectiveness Unit (AEU) of the Economic Relations Division, Ministry of Finance to develop a National Aid Policy to provide policy direction on aid management issues and donor coordination. The GoB has produced a draft policy which is still to be released for consultation. The development of an aid information management system (AIMS) to coordinate development partners and effectively manage aid flows within the country has also been proposed by the AEU. The AIMS will facilitate the provision of timely and accurate data to enable informed decision making with development partners, leading to more effective aid utilisation within the development context as a whole, and certainly within the CIP.187 Plans to enhance aid utilisation by streamlining the DPP/TPP process The Economic Relations Division of the Ministry of Finance in consultation with development partners has prepared a scoping study on the GoB Project Approval Process which set out recommendations to the Ministry of Planning for streamlining the DPP/TPP process. Although the recommendations are yet to be implemented, there is significant commitment from government to simplify the project revision and approval process. Progress to streamline the TPP/DPP process includes steps to create an online project planning system (PPS) for preparation, submission, review and approval of projects. A project called “Strengthening Public Expenditure Management Programme” (SPEMP) has been initiated with a TA component funded by the World Bank to be jointly implemented by the GED and the Programming Division of the Planning Commission. An inter-ministerial committee has been formed in the Planning Division headed by Joint Chief (ECNEC) to provide recommendations for modification of the existing approval procedure and formats for the DPP/TPP188.
Needs for further action in this area include:
Increasing efforts to scale up and strengthen implementation capacities: Insufficient organisational and human capacities remain a challenge to effective implementation of investment operations. National systems are not yet able to absorb fully the increased resources flowing into the CIP, which negatively affects the disbursement rates and timely implementation of projects. Multiple ministries are involved in project administration and numerous agencies are directly involved in programming, budgeting and even in project implementation. The complexity of the process leads to delays, loss of efficiency and reduces transparency and accountability. Enhancement of ADP management, including capacity building for planning and monitoring, and improvement of the procurement system is required to accelerate the rate of implementation and delivery of the CIP. Given that the rate
___________________________________________________________________________ 187 Aid Management in Bangladesh (2011). A Review of Policies and Procedures: Aid Effectiveness Unit, Economic Relations Division, Ministry of Finance, Government of Bangladesh, Dhaka. 188 Ministry of Planning (2012). Presentation to the LCG on Streamlining the TPP/DPP Process.

77
of implementation for 2011/12 is 50.6%, significant improvement in disbursement capacities is required to accelerate delivery of ongoing and planned interventions.
Increasing efforts to institutionalise the annual monitoring process: Although incremental progress has been made in consolidating financial and technical capacity to monitor annual commitments under the NFP, significant technical assistance was required to produce this monitoring report. Capacity needs to be strengthened in FPMU to gather, store, retrieve and analyse data through a systematic database – and to maintain and manage the database, these include skills in financial tracking and analysis (see Programme 11 on developments underway). While TT meetings are active and participatory, the role of TT meetings in routine monitoring require further institutionalisation to strengthen monitoring of input data and draw implications for the implementation of the CIP. Linkages need to be reinforced between delivery and outcomes at the level of beneficiaries. Accuracy and consistency of financial (input) data collated from the GoB has to be improved. Data from various government agencies are collated through TT members, validated in TT meetings and cross-checked with the ADP publications from the Planning Commission, which are the final source of verified input data. Closer links between CIP and ADP monitoring needs to be forged. Capacity building of TT members on the CIP and PoA and in collecting and verifying input data should be provided annually, particularly because of turnover of TT members.
Facilitating development partners and aid effectiveness: DPs have a central role to play in terms of supporting government activities under Programme 7. As partners in the CIP, DPs are a crucial source of accurate and consistent financial data on ongoing and planned investments in the CIP. Despite awareness-raising in the LCG and the development of reporting templates and guidelines, timely and accurate reporting is yet to be achieved. DP roles are also crucial in valorising lessons learned from the CIP monitoring process and incorporating findings in future planning and priority setting. The inclusion of capacity development components in main development projects financed by DPs could serve to enhance delivery and effectiveness as well as to increase sustainability of national capacities.
Strengthening capacities for inclusion of civil society and community based organisations in the CIP: To date, the FPMU and the Thematic Teams have started to coordinate the CIP within government. Though civil society and the private sector are represented in the National Committees for the CIP, a demand driven process, inclusive of civil society and community based organisations is yet to be achieved. Although the CIP foresees initiatives under programme 7 to strengthen operational, technical and institutional capacity of civil society and communities to participate in CIP implementation, a good part of these are still in the pipeline, requiring formulation and financing commitments. Capacity strengthening of the GoB maybe necessary to construct participatory processes to bring together multiple stakeholders, to develop regulatory frameworks and ensure accountability and transparency.

78
5.3. Programme 8: Enhanced public food management system
Public food management involves procurement of domestic and imported foodgrains, storage of grain in good condition and distribution of grains through various channels, to complement the overall objective of maintaining and improving food and nutrition security in the country. Domestic procurement has double objectives of supplying the public food distribution system and sustaining prices received by farmers during harvesting time when market prices generally go down. The government supports poor consumers through targeted non-monetized distribution such as VGF and TR, and through monetized distribution such as OMS. The latter has also a broad objective of stabilizing consumer prices of coarse rice and wheat during the lean season. Another main objective of the public food distribution system (PFDS) is to maintain strategic reserves able to secure supply at times of natural calamities and market shocks.
5.3.1 Progress towards achievements
Table 20: Progress towards achievement of CIP programme 8 CIP/NFP PoA output proxy indicators 2007/08 2009/10 2010/11 2011/12 Source
Effective grain storage capacity at close of fiscal year (thousand MT)
1,493 1,529 1,572 1,620 ITDS, Food Directorate
Average use of effective Government foodgrain storage capacity
38% 65% 52% 80% MISM, Food Division
Actual procurement (thousand MT) 706 1,196 563 978 MISM, Food Division Achievement of public boro procurement target
59% 100% 49% 99% MISM, Food Division
Wholesale price during the boro procurement period as % of boro per unit cost production
145% 86% 129% 117% Wholesale price (DAM); Production cost ( MoA)
Opening stock as % of budget target 64% 114% 47% 107% National Budget and
FPMU
Quantity of rice distributed through OMS as % of total domestic supply
0.90% 0.96% 2.96% 1.00% MISM, DG Food; BBS
Programme 8 aims to enhance the efficiency and effectiveness of the public food management system. It corresponds to two PoA AoIs: enhanced public procurement system to support producer prices (PoA AoI 1.10) and improved management of public stocks and price stabilization (PoA AoI 1.11). Major actions to be monitored are the modernizing of public storage, determining procurement price and quantity, and ensuring effectiveness of OMS operation. Programme 8 is articulated in 3 subprogrammes to: (1) enhance efficiency and effectiveness of public food management system and improve its impacts on price stabilization, (2) build capacities of the Ministry of Food and DG Food to better manage the food system and (3) increase and modernise public storage and handling capacity, including in disaster prone areas. Table 20 shows the relevant output indicators and their status of achievement. Increased public foodgrain storage capacity Effective grain storage capacity reached 1.62 million tons in 2011/12 with a significant increase on the previous year. There has been a consistently increasing trend since the food price crisis pointed out the need to reinforce government capacity to intervene in foodgrain markets in response to market volatility and natural calamities, including those induced by

79
climate change, by scaling up food based safety net programmes, emergency food distribution and price stabilization interventions.
The Government plans to increase foodgrain storage capacity up to 1.9 million tons by 2013, 2.2 million tons by 2015 and 3.0 million tons by the year 2021. Over the past two years 140 godowns with storage capacity of 1.10 lakh metric tons have been built. Construction of 261 godowns with total storage capacity of 2.19 lakh metric tons is under way in different parts of the country. Works are in progress for construction of a concrete grain silo of 50 thousand metric ton capacity at Mongla Port. Besides, a feasibility study for 8 big modern storage facilities equipped with small silos with storage capacity of 5.5 lakh metric tons has been finalized counting on financial support from the World Bank. The new technologies being considered will allow grain storage for a longer period, minimizing quality losses in such a way to reduce the need to rotate the stock. The same project foresees the promotion of low cost storage facilities at farmer level to enhance resilience of foodgrain consumption and production, in response to the increasing climatic vulnerability. Fully utilized foodgrain storage capacity Average utilization of effective foodgrain storage capacity was 80% in 2011/12 and 52% in 2010/11. An annual average capacity utilization of 80% should be considered as full capacity utilization given the seasonality of procurement and the impossibility of using 100% of the capacity for more than short periods in the traditional storage facilities. On the contrary in 2011/12, the Government maximized procurement (978,000 MT) as a way to sustain farmers’ incomes and profitability of rice production in a situation of declining market price that resulted in estimated average production cost exceeding the wholesale market price189. In this year, the available storage capacity limited the possibility of procuring larger quantities. Domestic procurement of foodgrains Boro accounts for the overwhelming share of total foodgrain procurement. The government announces the procurement price and procurement target ahead of the harvest. Se ng procurement targets depends on a number of factors: domestic and international prices, cost of production, requirement for distribution and impact of the procurement operations on price expectations and marketing behavior. Actual annual domestic procurement has varied over the past years. In 2011/12, total procurement was 0.98 million metric tons (mmt) compared to 0.56 mmt in 2010/11 and 1.20 mmt in 2009/10.
Table 21 shows a short historical profile of domestic procurement price, wholesale price and cost of production of aman and boro rice. The lowest domestic procurement in 2010/11 (0.56 mmt, see Table 20) coincides with higher wholesale prices of both aman and boro rice during the year (Table 21). As farmers were already obtaining remunerative prices from the market, the Government procured less rice during boro and did not procure during the aman harvest of 2010/11 so as to prevent further rise in price that would have impacted on consumers’ welfare. Adequate supply for public food operations was guaranteed through public imports190. Although boro procurement target was relatively higher, the Government
___________________________________________________________________________ 189 Recent experience corroborates this fact as the government had to slow down boro rice procurement in 2012 due to shortage of storage facilities in the country. 190 Total food grain import in 2010/11 was 5.38 mmt of which 1.60 mmt was rice. Of the total rice import, 1.30 mmt was imported by the Government alone to compensate for the lesser domestic procurement.

80
eventually procured less boro for the same reason, and consequently the achievement of boro procurement target was quite low in 2010/11 compared to the other recent past years (Table 21).
Table 21: Procurement and wholesale price and production cost of aman and boro (Tk/kg)
Cost/Price 2007-08 2008-09 2009-10 2010-11 2011-12
aman boro aman boro aman boro aman boro aman boro
Cost of production (CP) 16.73 19.98 20.75 21.17 20.71 21.65 22.41 23.06 24.75 24.27
Procurement price (PP) 20.00 28.00 26.00 22.00 22.00 22.00 na 29.00 28.00 28.00
Wholesale price (WP) 24.10 29.60 24.70 18.00 21.80 25.40 31.01 28.96 25.81 23.65
Source: MoFoodNotes: 1. Wholesale price of aman rice represents three months average price of coarse rice from November to January and that of boro represents three months average price from April to June of each fiscal year. 2. There was no procurement of aman rice in 2010-11.
Increased procurement through open tender was emphasized in the NFP PoA. In recent years, 0.347 mmt of foodgrains were procured through open tenders in 2007/08. The practice has since then not been operative over the past four years. Fluctuating public stock of foodgrains The Government makes the food distribution plan by keeping in view certain stipulated quantities to be distributed through different channels during different periods of a year. Actual procurement and distribution quite often varies substantially due to changed circumstances on the domestic and international markets. Consequently, the actual opening or closing stock may differ from the targeted stock for any month of the year. Table 20 shows that opening public foodgrain stock191 exceeded the budget target by 7% in 2011/12. Although actual distribution during 2010/11 reached the record high level of 2.29 million MT, public import alone supplied 2.28 million MT of foodgrain, which was the record public import since 1991/92. Similarly, the lowest opening stock of 47% of the budget target for 2010/11 can also be attributed to one of the highest volumes of distribution (1.96 million MT) during the preceding year 2009/10 in presence of significantly lower public import (0.55 million MT) and a domestic procurement of 0.80 million MT during the year.192 Consumer price stabilization through Open Market Sales To minimize the negative effects of price hikes since 2007/08, most South Asian countries resorted to selective trade policy measures such as abolishing import tariffs, restricting exports, and expanding public grain reserves and extending social protection measures, including introduction of new social protection programmes193.
The Government of Bangladesh adopted a variety of measures to bring about stabilizing effect on the prices of foodgrains. In the production front, the measures taken were timely delivery of crucial inputs such as seeds, fertilizers and electricity, and maintenance of subsidies on chemical fertilizers and diesel for irrigation. In the trade front, tariffs were abolished for foodgrain import and rice export was banned. Public food distribution was ___________________________________________________________________________ 191 The opening stock in a certain year is equal to the closing stock of the previous year. The latter, in turn, is determined by the balance between total distribution on the one side, and total procurement, both from domestic and internatio nal sources, during the year and the opening stock of the year, on the other side. 192 Database on monthly government stock, procurement, import and off take maintained at FPMU, Ministry of Food. 193 World Bank (2010). Food Price increases in South Asia: National Responses and Regional Dimensions. World Bank, South Asia Region. June 2010.
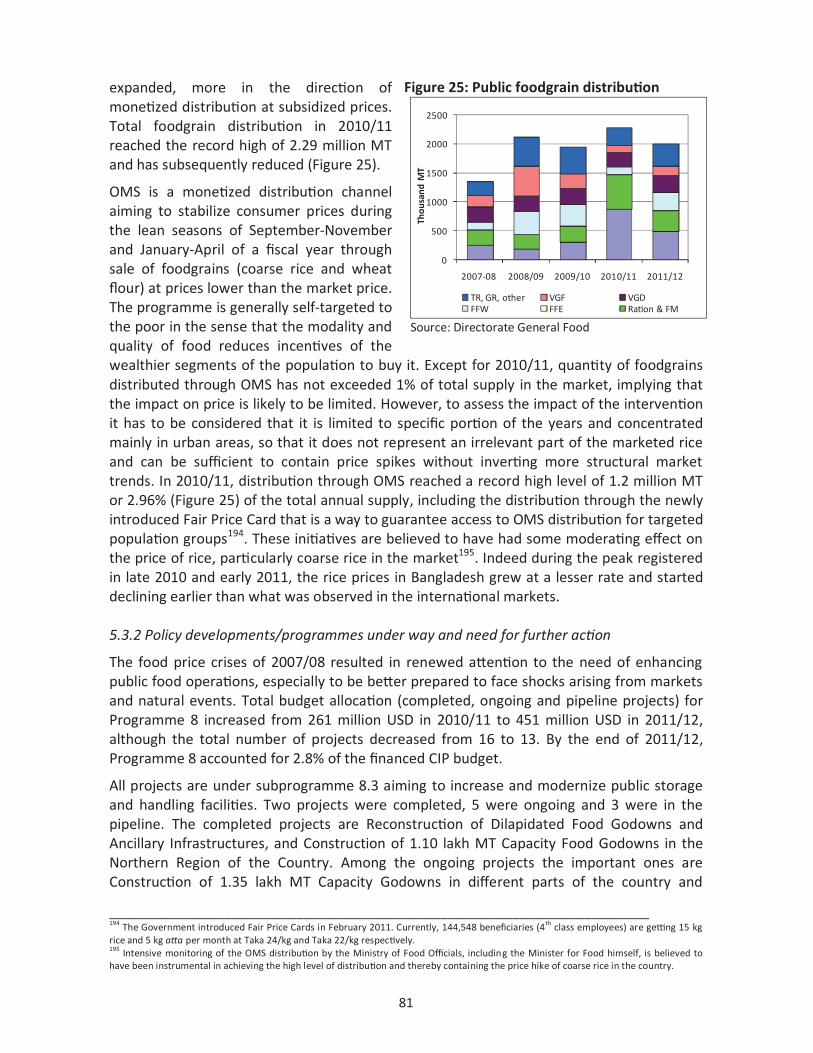
81
expanded, more in the direction of monetized distribution at subsidized prices. Total foodgrain distribution in 2010/11 reached the record high of 2.29 million MT and has subsequently reduced (Figure 25).
OMS is a monetized distribution channel aiming to stabilize consumer prices during the lean seasons of September-November and January-April of a fiscal year through sale of foodgrains (coarse rice and wheat flour) at prices lower than the market price. The programme is generally self-targeted to the poor in the sense that the modality and quality of food reduces incentives of the wealthier segments of the population to buy it. Except for 2010/11, quantity of foodgrains distributed through OMS has not exceeded 1% of total supply in the market, implying that the impact on price is likely to be limited. However, to assess the impact of the intervention it has to be considered that it is limited to specific portion of the years and concentrated mainly in urban areas, so that it does not represent an irrelevant part of the marketed rice and can be sufficient to contain price spikes without inverting more structural market trends. In 2010/11, distribution through OMS reached a record high level of 1.2 million MT or 2.96% (Figure 25) of the total annual supply, including the distribution through the newly introduced Fair Price Card that is a way to guarantee access to OMS distribution for targeted population groups194. These initiatives are believed to have had some moderating effect on the price of rice, particularly coarse rice in the market195. Indeed during the peak registered in late 2010 and early 2011, the rice prices in Bangladesh grew at a lesser rate and started declining earlier than what was observed in the international markets. 5.3.2 Policy developments/programmes under way and need for further action
The food price crises of 2007/08 resulted in renewed attention to the need of enhancing public food operations, especially to be better prepared to face shocks arising from markets and natural events. Total budget allocation (completed, ongoing and pipeline projects) for Programme 8 increased from 261 million USD in 2010/11 to 451 million USD in 2011/12, although the total number of projects decreased from 16 to 13. By the end of 2011/12, Programme 8 accounted for 2.8% of the financed CIP budget.
All projects are under subprogramme 8.3 aiming to increase and modernize public storage and handling facilities. Two projects were completed, 5 were ongoing and 3 were in the pipeline. The completed projects are Reconstruction of Dilapidated Food Godowns and Ancillary Infrastructures, and Construction of 1.10 lakh MT Capacity Food Godowns in the Northern Region of the Country. Among the ongoing projects the important ones are Construction of 1.35 lakh MT Capacity Godowns in different parts of the country and
___________________________________________________________________________ 194 The Government introduced Fair Price Cards in February 2011. Currently, 144,548 beneficiaries (4th class employees) are ge ng 15 kg rice and 5 kg a a per month at Taka 24/kg and Taka 22/kg respectively. 195 Intensive monitoring of the OMS distribution by the Ministry of Food Officials, including the Minister for Food himself, is believed to have been instrumental in achieving the high level of distribution and thereby containing the price hike of coarse rice in the country.
Figure 25: Public foodgrain distribution
0
500
1000
1500
2000
2500
2007-08 2008/09 2009/10 2010/11 2011/12
Thou
sand
MT
TR, GR, other VGF VGDFFW FFE Ration & FM
Source: Directorate General Food

82
Construction of 50,000 MT Capacity Concrete Grain Silo at Mongla Port with Ancillary Facilities. There are no completed or ongoing projects under subprogrammes 8.1 and 8.2 so far, but one programme is now included in the pipeline under each subprogramme and both of them are expected to be financed by the World Bank. With the completed, ongoing and pipeline projects, Bangladesh would be able achieve a public foodgrain storage capacity of 20.8 lakh MT within 2014/15.
The largest increase is due to the inclusion of the Bangladesh Modern Food Storage Facilities Project (BMFSP). As a result, the average project budget under Programme 8 almost doubled reaching 34.7 million USD in 2011/12. Delivery was 29 million USD in 2010/11 and 32 million USD in 2011/12 with respectively 5 and 7 projects in these two years, all under subprogramme 8.3. It is important to note that all the completed/ongoing projects were completely financed by GoB funds, with no DP spending.
On the policy front, as documented above, the Government has enhanced its flexibility in procurement management, procuring more from the domestic source in periods of lower domestic prices and more from international markets during periods of higher domestic prices. To enhance food planning, the government has commissioned and recently completed a study that provides fresh estimates of the parameters needed to refine estimates of the national food budget196. Though not all issues involved in reconciling ex-ante estimation with ex-post records of foodgrain production, consumption, trade and stocking have been completely solved, the study certainly represents a significant step forward.
Needs for further action in this field include:
Expediting construction of enhanced storage facilities: As mentioned above, effective grain storage capacity has been increased from 1.53 million tons in 2009/10 to 1.62 million tons in 2011/12 as part of the government plan to increase storage capacity up to 2.2 million tons by 2015 and 3.0 million tons by 2021. The new technologies considered under the World Bank supported initiative will increase the shelf life of the stock compared to conventional godowns, improve nutritional quality of the grains distributed, and enhance efficiency of the public food distribution system. It is important to move speedily from design to the implementation of this project.
Increasing effectiveness of domestic procurement: An important stated objective of the domestic food distribution system is to procure during main harvests to prevent seasonal price falls that hamper farmers’ incomes and incentives to produce. The government can carefully examine the procurement system and other support modalities pursued in various Asian countries to explore options for enhancing effectiveness, including an assessment of the benefits of paddy procurement from farmers. The study recently completed by BIDS (2012) for the government includes some suggestions to make domestic procurement more farmer-friendly and cost-effective. Another study on ‘Effectiveness of the procurement system and possible alternatives’, commissioned by the NFPCSP, is also ongoing and is expected to provide information on the functioning and effectiveness of the procurement
___________________________________________________________________________ 196 Bangladesh Institute of Development Study (BIDS) (2012). Estimation of Parameters Needed for Integrated and Effective PFDS Planning in Bangladesh. A study conducted for the Ministry of Food. Government of Bangladesh, Dhaka.

83
systems in support of farmers and PFDS operations. Procurement rules and guidelines need to be updated to reflect the new evidence available.
Estimating private stock for effective food planning and management: Regular annual estimations of private stock are an important pre-requisite for food planning and related public interventions. The study completed by the Government through BIDS has shown that most of the rice stock is kept by farmers and most of the wheat is kept by traders. The rice stock kept by farmers varies between 16% and 43% of gross production in different months. Among private traders, the larger share of the stock is kept by millers for rice and by retailers for wheat. Estimation for 2011 revealed that 6 million tons of rice and 1 million tons of wheat remained with the private sector at the end of the year. Based on the findings, the study concluded that there was a need for rethinking the public foodgrain procurement policy, which is currently procuring from millers and large traders. It claimed that market interventions can be more effective if conducted at growers’ level. However, it is appropriate to explore both feasibility of such a proposal, including the extent of procurement issues and modalities, given the large numbers of small and marginal farmers.
Introducing country-wide computerized food stock monitoring: Public food stock monitoring is still done in traditional methods, using mainly fax and telephonic information transfer. This system leaves scope for errors which at times can give wrong signals for public interventions, particularly in periods of disasters and emergencies. Computerized on-line stock monitoring can help expedite decision making in food management. The government has recently piloted computerized stock monitoring in Tangail district through one ADB supported project. The use of modern information and communication technologies needs to be introduced throughout the country exploiting the experience gained through the piloting.
Developing an effective early warning food information system: For effective food planning, early warning information about production, stock and price formation at national and international levels are the essential prerequisites. Attempts to build an effective early warning food information system have so far been sporadic197. Design and implementation of an early warning system for forecasting demand, supply and price of food commodities is considered under the already mentioned “Bangladesh Modern Food Storage Facilities” project. The establishment of an effective early warning system needs to be expedited, giving due consideration to its integration with global early warning systems such as Global Information and Early Warning System (GIEWS) and Famine Early Warning System (FEWS).
5.4. Programme 9: Institutional development and capacity development for more effective safety nets
Programme 9 aims to improve the effectiveness and targeting of social safety nets by investing in institutional and capacity development. The program is articulated in two subprogrammes: 1) to strengthen institutional capacities to effectively operate social safety
___________________________________________________________________________ 197 Some early warning exercises with respect to crop production were done through the Early Warning and Food Information System (EWFIS) project, executed by the Ministry of Food during the period 2000-2002.

84
Figure 26: Safety nets relative to total and social protection spending
0
20
40
60
80
100
Revised 2008-09
Revised 2009-10
Revised 2010-11
Revised 2011-12
Budget 2012-13
Perc
ent
Safety nets as % of total government budgetSafety nets as % social protection budget
Source: Ministry of Finance
nets programs and to formulate a new integrated strategy; 2) invest in income and employment generation through social safety nets. Programme 9 in the CIP corresponds to two AoIs in the PoA: improvements in coverage and effectiveness of emergency food distribution from public stocks (PoA AoI 2.2) and improvements in targeting, leakage, coverage and adequacy of food-based safety-net programmes (PoA AoI 2.4).
5.4.1 Progress towards achievements
Table 22: Progress towards achievement of CIP Programme 9
CIP/NFP PoA output proxy indicators 2007/08 2009/10 2010/11 2011/12 Source
Budgeted coverage of VGF and VGD, million cards
VGF (lakh person) na 366.67 122.22 88.00
(Revised) National Budget, MoF
VGD (lakh person month) na 88.33 88.33 88.33
Safety net programmes expenditure as % of GDP198
na 1.95% 2.12% 1.88% Finance Division,
MoF Budgeted coverage of employment generation program for the poor (in million person month)
na 4.9 4.2 2.0 National Budget
Quantity of VGF and GR distributed (in MT) 225,755 285,384 147,853 209,367 MIS,M, DG Food
Shrinking safety nets Social safety net spending has shrunk as a share of GDP, total Government spending and total social protection spending. Following year-on-year increases of 18%, 25% and 2% since 2008/09, safety net spending reached 172 billion taka in 2011/12. However, it is budgeted to fall to 169 billion taka in 2012/13 – and as these are in nominal taka, the real decline will be even larger after inflation is accounted for (Table 22). As a percentage of GDP, spending on social safety nets increased to 2.12% in 2010/11 but decreased to 1.88% in 2011/12 – and is projected to fall further to 1.63% in 2012/13. Figure 26 shows that social safety nets as a percentage of total government spending decreased from 12.9% in 2010/11 to 10.7% in 2011/12 – and is budgeted to decrease further to 8.8% in 2012/13. Social safety net spending and social empowerment spending together make up the Government’s social protection spending – and on this, the figure shows that safety nets had a shrinking share from 80% in 2010/11 to 78% in 2011/12, and is budgeted to fall to 74% in 2012/13. This is an important re-structuring of the social protection budget because
___________________________________________________________________________ 198The definition of safety net used here includes cash and non-cash transfers and food-for-work – and it corresponds to the definition used in budgetary reports by the MoF called “Social Protection”.

85
while 4.05 taka was spent on safety nets per taka spent in social empowerment in 2010/11, this fell to 3.64 taka in 2011/12 – and is budgeted to fall to 2.91 taka. This restructuring is taking place while the National Social Protection Strategy, intended as the vehicle to rationalise programmes, is still under formulation. Decreased VGF coverage and steady VGD coverage The budgeted coverage of VGF decreased from 367 lakh persons in 2009/10 to 88 lakh persons in 2011/12, reflecting that recent years were without major natural disasters or price hikes. Budgeted VGD coverage was steady for the last four monitored years at 88 lakh person months. The quantity of food distributed under VGF and GR increased from 148 MT in 2010/11 to 209 MT in 2011/12, both allocations being far less than those in 2008/09 and 2009/10, the years coinciding with domestic and international price crises. Decreased coverage of Employment Generation Programme (EGP) The Employment Generation Programme (EGP) is a cash-for-work program originally piloted to enhance poor people’s capacity to cope with the food price crises. EGP has been scaled back significantly from a nationwide programme in 2008/09 with an allocated budget of 20 billion taka. EGP now operates in selected locations only, with allocated budgets of 10 billion taka in each of 2010/11 and 2011/12, and based on evidence on the difficulties of providing 100 days of work during the lean season without adversely affecting the labour market, the number of days of work was reduced to 80 person days per year taka. Budgeted coverage of EGP decreased further to 2.0 million person months in 2011/12, which is 22% of its coverage in 2008/09. Given the proven effectiveness of the programme in achieving both protection and promotion objectives increasing allocation and expanded geographical coverage of the programme needs to be considered .199 Inadequacy of social safety net benefits Using HIES 2010 data, 24.6% of households received safety net benefits, of whom 60% received 100 taka or less per month; 33% received between 100 taka and 300 taka, and 4% received between 301 taka and 500 taka200. If the benefit is deducted from the income of beneficiary households, the poverty rate would increase by only 2.1 percentage points using the UPL and 2.6 percentage points using the LPL. Varied inclusion and exclusion errors across safety net programmes Figure 27 shows that 9.9% are poor beneficiary households and 56.6% are non-poor non-beneficiary households – and these are well targeted groups. However, 14.5% are non-poor beneficiary households and 19.0% are poor non-beneficiary households – and these are mistargeted households, indicating respectively inclusion and exclusion errors201.
___________________________________________________________________________ 199During its implementation in 2008/09, the EGP contributed to creation of a good number of community assets such as compost heap and levelling of school grounds. 200 Analysis of HIES 2010 data by Barkat et. al. (2013) op. cit. 201 Barkat et. al. (2013) op.cit.

86
Figure 27: SSNP inclusion and exclusion errors
Source: Barkat et. al. (2013) using HIES 2010 data Note: poverty is defined as below the UPL
Inclusion error is highest in the secondary and higher secondary school stipend programme (59%), followed by the Allowance for Financially Insolvent Disabled (43%) and the Old Age Allowance (31%). Inclusion error is lowest in the EGP for Hardcore Poor (7%), followed by Gratuitous Relief (13%) and Vulnerable Group Development (15%). While 89% of focus group respondents believed the poor were receiving SSNP benefit, most respondents believed that the ‘poorest of the poor’ did not receive any benefit202. 5.4.2 Policy developments/programmes underway and needs for further action Programme 9 constitutes 16.6% of the financed CIP budget. Subprogramme 9.2 has the bulk of this investment of 1,028.7 million USD, compared to subprogramme 9.1, with total value of just 5.3 million USD. Over a three year period, the overall financed budget of programme 9 increased from 615 million USD in 2009/10 to 816 million USD in 2010/11 to 1,034 million USD in 2010/12. In total, programme 9 has 22 ongoing projects (1 in subprogramme 9.1 and 21 in subprogramme 9.2) with a total value of 969.7 million USD and 7 completed projects in Programme 9.2 as of June 2012, with a total value of 64.2 million USD.
Four projects moved from the pipeline to ongoing in the fiscal year 2011/12- these include the Chars Development and Settlement Project 4 implemented by the DAE (675 lakh taka) and LGED (23361 lakh taka), Food and Livelihood Security (FLS) implemented by DWA (22333 lakh taka), the Operation Support to the Employment Generation Programme for the Poorest (EGPP) implemented by MoDMR (3660 lakh taka) and the Create Employment Opportunities of Char Dwellers in Greater Rangpur District through Sugarcane Cultivation implemented by BSRI (821 lakh taka). There are 10 pipeline projects, with a total value of 237.7 million USD. Total delivery in the financial year 2011/12 was 252.2 million USD, compared to 141.2 million USD in 2010/11, which demonstrates a significant capacity to scale up delivery of safety net programmes. Delivery of funds financed by development partners was higher in 2010/11 (83.8 million USD) and 2011/12 (134.4 million USD) compared to the GoB spending of 57.4 million USD and 117.7 million USD respectively in the two fiscal years.
In 2011/12 the Government introduced 12 new development programmes with total allocation of 246 crore taka. Programmes with notable allocations are Maternal, Child, Reproductive and Adolescent Health (118 crore taka), Community Based Health Care (118
___________________________________________________________________________ 202 Barkat et. al. (2013) op. cit.
87
crore taka), Community Based Health Care (36 crore taka) and Food and Livelihood Security programme (47 crore taka).
National Social Protection Strategy In line with the objective stated in the SFYP, an Action Plan for the Formulation of a National Social Protection Strategy has been drafted, led by the General Economics Division with an inter-ministerial committee established by the Cabinet Division, and supported by UNDP, WFP, AusAID and DFID. The strategy will address both protection and promotional aspects of safety nets, streamlining of programmes, and design and coordination with emphasis on coverage and sustainability. UNDP has delivered training of government officials, and will assist in drafting the strategy, holding consultations and providing background research. DFID and AusAID will support activities to strengthen the national social protection system through improved coordination. The Social Protection Policy and Reform (SPPR) programme will strengthen the capacity to deliver social protection programmes by core ministries, engage in the policy and budgeting process, update the evidence-base, and develop plans to strengthen priority social protection schemes. Integration of social protection with nutrition programmes can enhance human capital and productivity and break the intergenerational transmission of poverty203. For example, growth monitoring and expanding school feeding programmes for adolescent girls can reduce undernutrition.
Social protection to cover health care The Government of Bangladesh has taken a new initiative on expanding social protection for health through the newly formulated Health Care Financing Strategy (HCFS) 2012-2032. The strategy is aligned with the vision of the Health, Population and Nutrition Sector Development Program (HPNSDP) 2011-16. The goal of the national health financing strategy is to strengthen financial protection and extend health services to the poor and vulnerable segment of the population, with the long term aim to achieve universal coverage. The proposed 20 year health financing strategy devises ways to combine funds from tax-based budgets with proposed social health protection schemes, existing community based and other payment schemes and donor funding to ensure financial protection against health expenditure for all segments of the population, starting with the poorest. The strategy will be implemented in three phases – short, medium and long term. The short term one will be up to the end of HPNSDP. The medium term will be up to 2021 when the activities launchedduring the preceding phase will be appropriately scaled up. In the long term, covering the next 11 years, Bangladesh will move ahead to achieving universal health coverage through implementation of the strategic interventions proposed in the three phases. The HCFS is claimed to be comprehensive in its inclusion of a logical framework and a set of indicators. This framework will make it easy for all stakeholders to assess the ongoing and proposed interventions in the light of the defined objectives and strategies.204
Integrated system of safety-net administration The Ministry of Disaster Management and Relief (MoDMR), with funding from the World Bank, will implement a project called “Bangladesh Safety Net Systems for the Poorest Project”. The broad objective of the proposed project is to assist the MoDMR in developing
___________________________________________________________________________ 203 The World Bank (2013). Improving Nutrition through Multisectoral Approaches. Available online at http://pascal.iseg.utl.pt/~cesa/files/Comunicacoes/sonialima1.pdf. 204 Expanding Social Protection for Health: Towards Universal Coverage. Health Care Financing Strategy 2012-2032, Health Economics Unit. Ministry of Health and Family Welfare, Government of Bangladesh, September 2012.

88
an integrated system of safety nets administration that focuses on improved targeting, and efficient and transparent implementation. Investing in these systems for implementing large safety nets would help to increase coverage of the poor in the short term and help GoB improve the quality of a large amount of public expenditure earmarked for social protection in the medium term. The MoDMR and the Statistics and Informatics Division (through BBS) will jointly implement the proposed project. Five of the largest SSN programs are implemented by the MoDMR, around a third of the total social protection budget, including the EGPP, FFW, TR, GR and VGF, and together these programs received an allocation of 678 million USD in 2012/13 .205
Needs for further action in this area include:
Simplifying targeting criteria: Existing targeting criteria are several, overlapping and sometimes impractical. Complex targeting criteria, based on household and geographical characteristics, have a greater chance of including the non-poor rather than the poor. When participants are selected by community members or village leaders on these criteria, some households are incorrectly classified and excluded. There has been increased interest in the possibility of using biometric technology, such as fingerprint or iris scans, to provide authentication and identification. Biometric technology can assist in including marginalised groups in entitlement programmes but it can also increase the risk of exclusion206. Although this technology can assist in organising the sector- by providing a profile of beneficiaries in terms of numbers, demographic information of beneficiaries, etc for the technology to be effectively used, it has to be part of wider policy reform.
Reducing leakages through innovations and lessons learned from well performing programmes: The administration of food based programmes is difficult and costly, and a movement towards cash based transfers would improve program efficiency. Leakage increases with the number of intermediaries involved. A cash versus food transfer study is currently being finalized by the World Food Programme and is expected to be released in 2013. In the case of the VGD and VGF, local government officials are responsible for collecting grains from the local depot and making deliveries to beneficiaries. The cost of collecting and distributing food is not fully paid by the programme which means that further leakage occurs as costs are deducted from the transfer. In the case of public works, part of the benefit is used often for non-wage costs associated with small infrastructure project implementation. One of the innovations brought about by the EGPP was the introduction of allocating non-wage costs to minimize the leakage in program allocations. The EGPP has strict eligibility criteria relative to the other programs and uses a direct bank-transfer payment system. The EGPP has an estimated leakage of less than 5% of total allocation because it has few intermediaries, or at least none that are able to intervene in the cash transfer process until it reaches the beneficiaries’ accounts207. However, informal fee charges are deducted by individuals collecting the money on behalf of the beneficiary for travel expenses208.
___________________________________________________________________________ 205 World Bank (2013). Project Information Document on the Bangladesh Safety Net Systems for the Poorest Project (P132634) 206 Gelb and Clark (2013). Identification for Development: The Biometrics Revolution. CGD Working Paper 315. Washington, DC. 207 World Bank (2013) Op. cit 208 Rahman and Choudhury (2012). Op. cit.

89
Finalizing the National Social Protection Strategy: The National Social Protection Strategy has not yet been finalized and adopted. Finalization of the strategy will be crucial for guiding and coordinating efforts to raise the effectiveness of the social protection system in the country, minimizing overlapping between programmes and establishing common priorities to convey a vision for Bangladesh’s social protection for the future. The PPRC, with support from UNDP, has completed a comprehensive study on social safety nets in Bangladesh: Volume 1 covering A Review of Issues and Analytical Inventory of Programmes and Volume 2 focusing on Ground Realities and Policy Challenges. Three related studies are about to be completed under the NFPCSP to provide a better understanding of (i) Targeting Effectiveness of Social Safety Nets, (ii) Social Safety Nets and Productive Outcomes, and (iii) Role of Social Safety Nets in Climate Change Adaptation. Results of these studies are expected to provide background information for the formulation of National Social Protection Strategy. In addition, a minimum of six papers (of which one is expected to cover nutritional aspects) will be produced by a service provider contracted by UNDP to inform policy formulation of the strategy.
Developing capacity for implementation and monitoring: Effective implementation of safety net programmes is constrained by lack of adequate and skilled manpower for administering and monitoring the programmes, both at national and grass root levels. Quite often the overall coordination activities are assigned to persons with other major responsibilities (such as the Deputy Commissioners at district level and Upazila Nirbahi Officer at Upazila level). Sometimes monitoring responsibilities are assigned to local level officers without transport facilities/allowances which result in poor monitoring of the programmes209. Recording and transmission of data with respect to implementation and monitoring is constrained by lack of equipment (such as computers) and the associated trained manpower. Provision of monitoring (particularly result monitoring) should be consistently incorporated as a built-in element in the design of the safety net programmes.
Adjusting safety net interventions to enhance resilience to climate change: Impacts of safety nets on beneficiary households’ consumption and human development outcome are evident210. Evidence on economic impacts of safety net is however scarce. These impacts come from changes in productive and income-generating activities at the household and at the community levels. At the household level, the main variables of interest include labor allocation, investment in income generating activities and risk management abilities. At the community level, the main variables of interest are building of local infrastructure, stimulation of local goods and some multiplier effects. In the contemporary environment, these variables are closely related to resilience to climate change. Greater provisions are needed for creating employment opportunities in local infrastructure improvements, including repair and maintenance of transport and irrigation infrastructures, river bank protection works and social forestry activities.
Enhancing safety nets operations during lean seasons: Six social safety net programmes address seasonal food and livelihood distress (VGF, FFW, Test Relief,
___________________________________________________________________________ 209 This situation was observed by the NFPCSP Team during evaluation of the 100 day Employment Generation Programme in selected locations in 2008. 210 Hulme, D. and K. Moore (2010). Assisting the poorest in Bangladesh: Learning from BRAC’s “Targeting the ultra-poor programme".

90
Gratuitous Relief, RERMP, and the EGRP). Apart from the VGF and Gratuitous Relief, that provides foodgrain with no work requirement, the other four seasonal safety nets require physical work in activities such as infrastructure repair and road maintenance. The timing of the four labour-related seasonal safety nets is crucial especially if the objectives of the programme are to mitigate seasonal hunger. In this case, labour- based safety net programmes have a reduced impact as they are not implemented during the peak of the lean season which also happens to partly coincide with the rainy season. Most labour-related social safety net programmes are thus implemented in the dry season, which is just after the harvesting of the aman crop. This issue calls for designing innovative safety net programmes to address the naturally unfavourable lean periods.211
Integrating graduation strategies into safety net programmes: Income Generating Vulnerable Group Development, Food Security Vulnerable Group Development, REOPA and CFPR/TUP have embraced graduation in their design and reach to suatainably increase household income, skills and human capital thereby promoting long term welfare and poverty reduction212. For example, REOPA beneficiaries have demonstrated significant nutrition outcomes. 81% of REOPA women who graduated from the programme and live off earnings from their own micro-enterprises were found to have acceptable food security levels with a balanced diet, acceptable calorie and protein intakes, and sufficient micro-nutrients, as compared to 87%of women still within the programme213.
Maximizing benefits of migration: Seasonal migration and migration during shocks helps protect against transitory hunger. Access to employment opportunities during the lean season can alleviate food insecurity in other seasons as well, as demonstrated in the period immediately following the monga when migrants return home with their savings. For households who are not open to migration, the provision of microcredit programmes provides a means of reducing the risk associated with the monga season. Therefore, safety nets programmes need to be designed to include mechanisms of resource provision to migrant households to facilitating migration and microcredit schemes to vulnerable households who no longer have the capability to engage in seasonal migration.
___________________________________________________________________________ 211 Khandker, S R and Mahmud, W (2012) op.cit. 212 World Bank (undated). Available online at http://siteresources.worldbank.org/SAFETYNETSANDTRANSFERS/Resources/281945-1291746977764/7-graduation.pdf. ; Rahman, H.Z. and Chowdhury, L.A. (2011). Social Safety Nets in Bangladesh: Ground Realities and Policy Challenges. PPRC-UNDP, Dhaka. 213 UNDP Capacity Strengthening Team (2011). Food Security of REOPA Women: Report on findings from a survey using the WFP Food Consumption Score.

91
6. Utilization: progress towards CIP and NFP PoA outputs
This chapter deals with improving food utilization for better food and nutrition security, the third pillar of National Food Policy, its Plan of Action, and the CIP programmes 10, 11 and 12. An update is provided on community based nutrition programmes and services; food security and nutrition information and data; and food safety, quality and control including consumer protection and public health. The three programmes are in alignment with the eight areas of intervention under the third objective of the NFP PoA (see Annex 1).
6.1. Programme 10: Community based nutrition programmes and services
Programme 10 is concerned with community based nutrition programmes that are linked to and supported by government services, delivered primarily through the NNS. The aim is to implement a comprehensive package of direct nutrition services, along with strengthened coordination of sectors engaged in nutrition. Mainstreaming nutrition into health and other related sectors to deliver a package of low-cost interventions will lead to major gains in nutritional status214. This programme corresponds to the NFP PoA AoIs 3.2, 3.3, 3.4, 3.7 and 3.8 on promoting balanced and nutritious food for vulnerable people; food based programmes and growth monitoring of children; nutrition education on dietary diversification; food supplementation and fortification; women and children’s health; and protection and promotion of breastfeeding and appropriate complementary feeding.
6.1.1. Progress towards achievements
Table 23: Progress towards achievement of CIP programme 10
CIP/NFP PoA output proxy indicators 2007/08 2009/10 2010/11 2011/12 Source
Proportion of infants under six months exclusively breastfed
42.9% na na 64.1% BDHS
Poor households raising home gardening and backyard poultry
na na na 42% FSNSP
Share of total dietary energy supply for consumption from:
Cereal 78.6% (2005)
79.3% (2007)
79.0% (2008)
78.3% (2009) FAO, Selected
Indicators of Food and
Agricultural Development
in the Asia-Pacific Region
Sugar and sweeteners 4.1% (2005) 3.5% (2007) 3.4% (2008) 3.3% (2009) Oil and oil crops 6.5% (2005) 5.6% (2007) 5.7% (2008) 5.8% (2009)
Roots and tubers 2.5% (2005) 2.5% (2007) 3.3% (2008) 2.5% (2009) Pulses 1.7% (2005) 2%(2007) 1.1% (2008) 2.6% (2009)
Fruits and vegetables 1.6% (2005) 2%(2007) 2.2% (2008) 2.2% (2009) Meat, fish, eggs and milk 3.3% (2005) 3.4% (2007) 3.5% (2008) 3.6% (2009)
Others* 1.7% (2005) 1.7% (2007) 1.8% (2008) 1.7% (2009) Prevalence of global acute malnutrition (GAM) among children < 5 years < -2SD
17.4% na na 15.6% BDHS
Prevalence of severe acute malnutrition (SAM) among children < 5 years < -3SD
2.9% na na 4.0% BDHS
Proportion of women ANC coverage of at least 4 visits
22.0% na na 25.5% BDHS
*Others - Includes stimulants, spices, alcoholic beverages, offal, animal fats, aquatic products and miscellaneous.
___________________________________________________________________________ 214 Committee on World Food Security (2012). Nurturing the Movement for Scaling Up Nutrition: A Proposition.

92
Exclusive breastfeeding during the first 6 months of life is increasing Mothers should breastfeed exclusively on demand until six months, and thereafter appropriate complementary and solid foods should be introduced alongside continued breastfeeding until at least two years of age, as per WHO recommendations. Exclusive breastfeeding for the first six months remarkably increased from 43% in 2007 to 64 % in 2011, largely helped by intensive media campaigns, maternal and child health programmes and continuous encouragement by the Honourable Prime Minister on the World Breastfeeding Weeks of 2009, 2010 and 2011. Bangladesh has adopted paid maternity leave for 6 months, part time work arrangements, facilities for expressing and storing breast milk and breastfeeding breaks. Breastfeeding rates are much better in Bangladesh than in neighbouring countries (Figure 28).
However, FSNSP 2010 and 2011 have lower estimates215 of exclusive breastfeeding at around 51%, while the 2012-NHDSDBD preliminary report shows that recent progress has been static at 63.4%. Given the strong causal links between exclusive breastfeeding, reduced risk of infections and infant morbidity and mortality, further raising exclusive breastfeeding rates remains crucial. Indeed, amongst infants aged 1-11 months, nearly 13% died because of diarrhoea and malnutrition – and 1% of all children born in Bangladesh died between 1-11 months216. Integrated home gardening, and farming systems for nutrition Integrated home gardens fall within the national concept of “Ekti Bari, Ekti Khamar” (“One household, One farm”). In rural areas, 75% of households reportedly have a home garden217. A range of 25 fruit crops,
___________________________________________________________________________ 215 State of Food Security and Nutrition in Bangladesh 2010, 2011, JPG School of Public Health, HKI and BBS. 216 BDHS (2011). ibid. 217 Khan KU (2011). Homestead gardening in Bangladesh: enhancing the nutritional and economic status of the rural population, Khulna University, Khula, Bangladesh.
Figure 28: Six months exclusive breastfeeding
46.853
75.8
58.5
50.5
37
54.3
64.1
0
20
40
60
80
Pe
rce
nt
Source: World Breastfeeding Trend Initiative (2012)
Box 3: Linking home gardens, climate change and extension A tenth of the gardens surveyed in Shyamnagar Union in Sathkira district were destroyed completely by soil salinity; 38% showed high levels of soil salinity; and 34% moderate soil salinity. Better off households had adopted salinity coping practices and knowledge. Around 50% of households implemented coping practices, such as organic compost and planting in pits leached with water. Mulching with rice straw, coconut coir and other locally available organic materials were used to increase water retention of the soil and develop compost. Greater resilience to salinity was found among vegetable crops -including Indian spinach (pui shak), sweet gourd, okra and kang kong (kolmi shak)- which are good sources of micronutrients. Kang kong is one of the most saline resistant crop but is relatively new to Southern Bangladesh. Such practices can be integrated into agriculture extension to promote integrated home gardening, particularly in climate affected areas. Source: HKI/WFP/Kraft Foods (2012) Helping homestead gardeners mitigate the impact of soil salinity, Bulletin # 8.
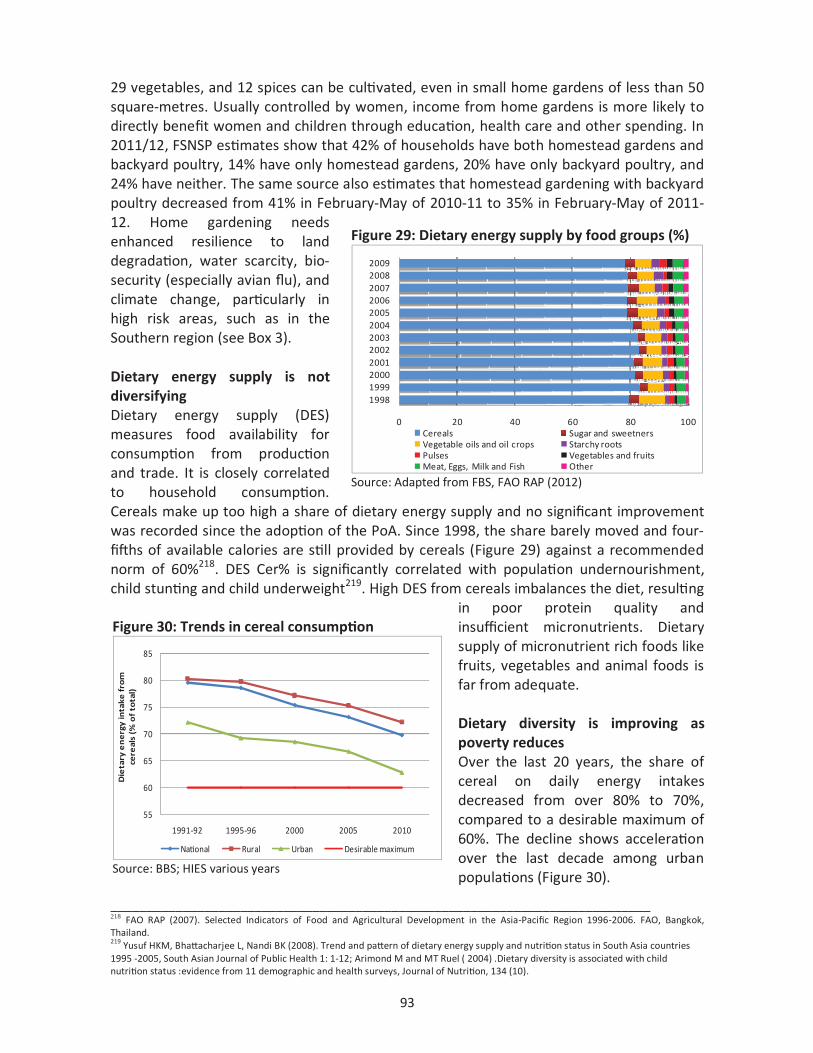
93
29 vegetables, and 12 spices can be cultivated, even in small home gardens of less than 50 square-metres. Usually controlled by women, income from home gardens is more likely to directly benefit women and children through education, health care and other spending. In 2011/12, FSNSP estimates show that 42% of households have both homestead gardens and backyard poultry, 14% have only homestead gardens, 20% have only backyard poultry, and 24% have neither. The same source also estimates that homestead gardening with backyard poultry decreased from 41% in February-May of 2010-11 to 35% in February-May of 2011-12. Home gardening needs enhanced resilience to land degradation, water scarcity, bio-security (especially avian flu), and climate change, particularly in high risk areas, such as in the Southern region (see Box 3). Dietary energy supply is not diversifying Dietary energy supply (DES) measures food availability for consumption from production and trade. It is closely correlated to household consumption. Cereals make up too high a share of dietary energy supply and no significant improvement was recorded since the adoption of the PoA. Since 1998, the share barely moved and four-fifths of available calories are still provided by cereals (Figure 29) against a recommended norm of 60%218. DES Cer% is significantly correlated with population undernourishment, child stunting and child underweight219. High DES from cereals imbalances the diet, resulting
in poor protein quality and insufficient micronutrients. Dietary supply of micronutrient rich foods like fruits, vegetables and animal foods is far from adequate. Dietary diversity is improving as poverty reduces Over the last 20 years, the share of cereal on daily energy intakes decreased from over 80% to 70%, compared to a desirable maximum of 60%. The decline shows acceleration over the last decade among urban populations (Figure 30).
___________________________________________________________________________ 218 FAO RAP (2007). Selected Indicators of Food and Agricultural Development in the Asia-Pacific Region 1996-2006. FAO, Bangkok, Thailand. 219 Yusuf HKM, Bhattacharjee L, Nandi BK (2008). Trend and pattern of dietary energy supply and nutrition status in South Asia countries 1995 -2005, South Asian Journal of Public Health 1: 1-12; Arimond M and MT Ruel ( 2004) .Dietary diversity is associated with child nutrition status :evidence from 11 demographic and health surveys, Journal of Nutrition, 134 (10).
Figure 29: Dietary energy supply by food groups (%)
0 20 40 60 80 100
199819992000200120022003200420052006200720082009
Cereals Sugar and sweetnersVegetable oils and oil crops Starchy rootsPulses Vegetables and fruitsMeat, Eggs, Milk and Fish Other
Source: Adapted from FBS, FAO RAP (2012)
Figure 30: Trends in cereal consumption
55
60
65
70
75
80
85
1991-92 1995-96 2000 2005 2010
Die
tary
en
erg
y in
take
fro
m
cere
als
(% o
f to
tal)
National Rural Urban Desirable maximum Source: BBS; HIES various years

94
Average per capita consumption of all food groups, except cereals, increased between 1995 and 2010 (Table 24). Importantly, the accelerated decline of rice was partly compensated by other cereals (especially wheat) so that the overall decline in cereal consumption slowed down -4% to -1%. Intakes of animal foods, vegetables and fruits declined from 1995 to 2000, but increased thereafter, signalling a significant improvement in dietary diversification between 2000 and 2010. The sustained reduction of poverty has certainly contributed to this result, and also the slower progress in diversification in rural areas can be related to the slower progress in poverty reduction (see Section 3.3 above, and Monitoring Report 2012, p 22).
The proportion of children aged 6-23 months in the poorest 20% of households by wealth, which consumed foods rich in vitamin A 24 hours prior to survey, was just 53% - and foods rich in iron just 41%. These figures rise in the richest 20% of households to 70% and 61%, confirming that wealth is clearly a driver of diversification though dietary practices are critical .220
Increased intakes of sugar and edible oils contribute to improving the energy gap for those in deficit, but intakes should be moderate in order to prevent and control associated health concerns. The rapid increases observed since 1995 warrant attention in terms of understanding the type of foods (e.g. sugary, fried, high energy, nutrient poor) and population groups involved. Nearly a quarter of men age 35 years and older in the richest 20% of the population are overweight and obese, compared to 1% in the poorest quintile; and notably even amongst the poorest women ever married of age 15-49, a sizeable 5% are overweight or obese. Table 24: Trends in food intake (grams/capita/day and year-on-year % change)
Food group 1995 2000 2005 2010 Desirable % of dietary
energy intake 1995-2000, % change
2000-2005, % change
2005-2010, % change
Cereals 509 487 469 464 400 56 -4% -4% -1% - of which rice 464 459 440 416 350 49 -1% -4% -5%Fruits and vegetables
180 169 190 211 400 7 -6% 12% 11%
Potatoes 49 55 63 70 100 4 12% 15% 11%Legumes 14 16 14 14 35 6.5 14% -13% 0%Animal foods including milk
91 87 95 109 260 10.5 -4% 9% 15%
Fats and oils 10 13 17 21 30 11 30% 31% 24%Sugar 9 7 8 8 20 3 -22% 14% 0%Spices 37 50 53 66 20 2 35% 6% 25%
Source: Adapted from HIES 1995 -2010 and Desirable Dietary Pattern, BIRDEM 2013
Decline in global acute malnutrition (GAM - global wasting) According to the BDHS, GAM decreased by almost 2 percentage points in 4 years down to 15.6% of under-5 children in 2011. FSNSP reports a lower estimate of 12% for the same year (FSNSP 2011)221. Wasting is related to macro and micro nutrient intakes. The latter also play a catalytic role in food utilisation and in supporting immune competence for which dietary ___________________________________________________________________________ 220 BDHS (2011). op. cit. 221 Timing of surveys could explain some, though possibly not all, of the difference in estimates because, in contrast to stunting and underweight, wasting is more sensitive to short-run changes in food intakes, feeding practices, hygiene, sanitation and morbidity. BDHS was conducted in the latter half of 2011, including the longer lean season, whilst FSNSP was conducted in three surveys throughout the year.

95
diversity is the key. According to BDHS (2011), this complexity might help explain why the socioeconomic gradient in inequalities in GAM is not sharper – 12.1% of children in the richest wealth quintile of households are wasted, compared to 17.7% in the middle quintile and 17.5% in poorest quintile; or 11.1% of children with mothers with secondary or higher education are wasted, compared to 17.7% with no education at all. Rising severe acute malnutrition (SAM - severe wasting) Whilst global acute malnutrition slightly decreased, severe acute malnutrition increased by a third reaching 4% in 2011. Any increase in SAM is of great concern because it closely linked to child survival. At present, treatment for SAM is primarily in-patient, making it difficult for poor rural households to obtain the health care needed for their children.
The NNS provides screening for acute malnutrition (using MUAC, W/H growth monitoring) along with nutrition advice and referrals to appropriate health facilities. SAM units including training in medical college and district hospitals, UHC, Maternal and Child Welfare Center, and other medical health facilities are being established. Community management of acute malnutrition (CMAM) guidelines and training modules, weighing scales have been supplied to the community clinics under the NNS. The effectiveness and feasibility of SAM treatment as part of the community case management (CCM) is summarized in Box 4. Improving antenatal care (ANC) coverage Utilization of pregnancy related health services remains generally low, but some improvement is registered in women’s ANC coverage access. It is noteworthy, that the percentage of women who had no ANC visit declined from 44% in 2004 to 32% in 2011 and at the same time the percentage of women who had at least 4 or more ANC visits increased from 16% in 2004 to 26% in 2011222. Greater proportions (45%) of urban women tend to access ANC services compared to rural women (20%). Antenatal care visits have been associated with increased facility-based delivery in public hospitals and health facilities223. The success relies on delivery of an integrated package of basic services, which need to be strengthened. To be most effective, there should be regular ANC throughout pregnancy so as to ensure favourable birth outcomes and facility delivery care to maximize health benefits to mothers and new-borns.
___________________________________________________________________________ 222 BDHS 2011 op.cit. 223 Jesmin Pervin et. al. (2012). Association of antenatal care with facility delivery and peri-natal survival – a population-based study in Bangladesh, BMC Pregnancy and Childbirth, 12:111.
Box 4: Community management of SAM in Bhola When SAM is diagnosed and treated by community health workers (CHW) at the community level, more malnourished children can access care and they are more likely to recover. In Lalmohan of Bhola district, most children referred for facility-based care were appropriately attended to and went home before completing treatment. In Borhanuddin of Bhola district, out of 724 children with SAM treated by CHWs, 92% recovered, 7.5% did not attend the treatment and only 0.1% (1 child) died. At 89% by April 2010, coverage was one of the highest ever recorded for CMAM programmes. All outcomes recorded in Borhanuddin were significantly better than those commonly seen in traditional facility-based care centres. Source: Sadler K. et al. (2011). Community Cas e Ma nagement of SA M i n S out her n Ba nglades h, Tu s University, SC US, IPHN, Sher-E-Bangla Medical College & Hospital, and DGHS, Bangladesh

96
6.1.2 Policy developments/programmes underway and needs for further action
Nutrition programmes provided through the government service delivery infrastructure should be appropriately linked to community-based mechanisms224. NNS operates countrywide through 12,568 community clinics established in the existing DGHS and DGFP delivery systems. As reported in Section 3.4 of this report, progress is noted in NNS activities covered under the AoI 3.2, 3.3. 3.4 in the NFP PoA and CIP Programme 10. NNS recently implemented the National Vitamin A Plus campaign targeting children 12-59 months.
Programme 10 of the CIP accounts for 363 million USD in 2011-12 (3.7% of the total CIP budget), of which 311 million USD are already financed. It includes 3 subprogrammes with 23 ongoing projects and 6 in the pipeline. Most of the ongoing projects are components of NNS and cover community based nutrition activities. The budget increased by 11% from 327 million USD in 2010/11 to 363 million USD in 2011/12. All 12 pipeline projects of 2010/11 moved to ongoing in 2011/12, and 6 new projects were added to the pipeline. By 30 June 2012, 3 projects were completed costing 24.4 million USD. The average budget for individual projects decreased from 29.5 million USD in 2009/10 to 12.6 million USD in 2010/11 and to 11.4 million USD in 2011/12.
Subprogramme 10.2 to support homestead gardening, small livestock rearing, aquaculture and awareness creation is under-funded with only one completed project and none ongoing. This is attributable partly to the fact that homestead gardening is o en covered as a component under agriculture or livelihood projects. The lack of funding is equally noticeable for subprogramme 10.3, on the treatment of acute malnutrition through therapeutic and supplementary feeding, with only one project ongoing and no provision for other initiatives in the pipeline reflecting the fact that treatment of acute malnutrition through therapeutic feeding is seen as efficacious but not effective. Efforts are ongoing to explore if community-based therapeutic care costs can be reduced through production of local foods to be provided in the community with one-to-one counselling of the mother for home feeding and follow up to prevent relapse. Feasibility studies and piloting of low-cost product development are underway by the Government and research institutions.
Total delivery of programme 10 was 62.4% in 2011/12 compared to 37.6% in 2010/11. This is attributed to the delayed start of the NNS, deployment of staff, programme orientation and other start-up arrangements.
Scaling Up Nutrition (SUN) Since 2010, Bangladesh joined 27 other countries in the SUN Movement to scale up nutrition interventions with a focus on the first 1000 days of life, in partnership with donors, UN, NGOs and the private sector. This includes the design of comprehensive and costed strategies and action plans for food, agriculture and nutrition as well as institutional developments. The Bangladesh SUN Framework for Action is in alignment with the NNS and CIP. With a focal point in the MoHFW and two civil society alliances supporting the SUN movement, Bangladesh is an exemplary case, with the highest level of support evident with Her Excellency the Prime Minister and also the Founder of BRAC being represented on the Global SUN movement. ___________________________________________________________________________ 224 Tontisirin K and Bhattacharjee L (2008). Community based nutrition programmes, International Encyclopaedia of Public Health, Eds. Heggenhougen HK, Vol 1. San Diego: Academic Press; 2008. pp. 791-799.

97
Regular SUN Movement Country Network meetings are held by teleconference every quarter to share country updates with the Global SUN Secretariat. UN REACH and development partners are working together with the relevant ministries to provide technical support and facilitate multisectoral action. A REACH focal point in the MoF supports the process for engagement of non health sectors in strengthening nutrition sensitive interventions and food and nutrition security policies within a comprehensive context. Reactivating the Office of the PM to provide supportive leadership in multisectoral coordination needs to be explored. Nutrition sensitive agriculture There is increasing attention to address under-nutrition through agriculture. Doubling per capita agricultural income is associated with approximately 15-21% decline in stunting on average and increasing small scale production of nutrient dense foods. Nutrition education enhances potential consumer demand and impacts on nutrition225. Joint government and research initiatives, notably the CGIAR research programme, LANSA, SAFANSI, MDGF Programme and SPRING are some examples of nutrition sensitive interventions (Box 5).
Improved management of wetland and seasonal floodplains can lead to increased fish production, especially nutrient rich small fish226. It is estimated that a small production of 10kg/pond/year of vitamin A rich fish mola (Ambylpharyngodon mola), in the 4 million small, seasonal ponds can meet the vitamin A annual recommended intake of over 6 million children. Low cost technologies for production, management, conservation and accessibility of nutrient rich fish must be promoted with efforts to enhance fish intake in the diets of young children.
Needs for further action in this area include:
Scaling up implementation of appropriate IYCF: Improving CF practices and dietary quality is an essential component of IYCF guidelines that need to be implemented on a nationwide basis. Locally appropriate dietary recommendations and season specific recipes using the Trial of Improved Practices (TIPS) methodology need to be popularized. As mentioned in Section 3.4.1, BBF has developed CF guidelines and recipes based on TIPS formative research and have generated appropriate nutrition
___________________________________________________________________________ 225 WB/DFID/Government of Japan and Rapid Social Response (2013). Improving nutrition through multisectoral approaches: Agriculture and Rural Development. 226 Roos N, Islam MM and Thilsted SH (2003). Small indigenous fish species in Bangladesh: contribution to vitamin A, calcium and iron intakes. Journal of Nutrition. 133:4021S -4026S.
Box 5: Farmer field schools (FFS) integrating agriculture, nutrition and hygiene through SPRING
Resource poor households with pregnant and lactating women and children under the age of two are being targeted through the FFS learning process to enhance access to diversified nutrient-rich vegetables, fish and poultry. Poultry rearing is harnessed for its important nutritional value to the household diet and its potential as an income generating activity for women. SPRING field facilitators ensure appropriate vegetable, poultry and fish production practices are adopted and link agricultural topics to household food consumption, intra-household food distribution and appropriate household dietary diversity, particularly for women and children. FFS participants are supported to breed poultry and fish and to grow up to five nutritious vegetables and fruits per planting season. FFS incorporate key messages on essential nutrition and hygiene actions into all vegetable, fish and poultry production activities. FFS are designed to respond to farmers’ needs and towards encouraging creativity and independence. Source: Agriculture and Nutrition Global Learning and Evidence Exchange Case Study (2013), SPRING/USAID Bangladesh

98
messages for improving child feeding behaviour and food intake. Monitoring the BMS code is also central to scaling up IYCF activities.
Strengthening biodiversity for healthy diets and nutrition: Indigenous foods and species are important to health besides having an important role in ecologically based production systems. In poor rural households in Kishoreganj, small indigenous fish species contributed 40% and 31% of the total recommended intakes of vitamin A and calcium, respectively.227 Darkina (Esomus danricus) a common local fish has a high content of heme iron, calcium as well as zinc and these fish are eaten with bones which makes it a ‘package source’ of micronutrients. Support for increasing the production of small fish and promoting its consumption needs scaling up. Innovative farmer techniques to improve productivity, efficiency and efficacy of the food production base should be systematically investigated. Appropriate choice of species including plant and animal biodiversity to diversify the nutrition base in the garden and traditional resource use need to be strengthened for sustainable diets.
Promoting school feeding and nutrition gardens: Less than 65% of the approximately 20 million children of primary school age attend school and around 40% are hungry during their lessons. Good quality nutrition is critical for physical and intellectual development. The Ministry of Primary and Mass Education of the Government of Bangladesh is implementing a pilot programme to improve the school attendance and nutrition of children 5 to 11 years from vulnerable families in approximately 45 schools in the Dhaka and Mymensingh District. Central kitchen models are operational and are being considered for replication to other districts. Following up on previous DAE–FAO efforts, integrated initiatives on school gardening coupled with nutrition education and food supplements are being supported by a joint UN MDGF Programme in Monpura and Char Fasson Upazilas in Bhola District, and Bamna Upazila in Barguna District. Results show that nutrition knowledge among rural school students improved from 47.2% to 75%, while 120 schools established a school garden.
Ensuring implementation of the BMS228 code: As part of IYCF policy development, BBF in collaboration with IPHN and UNICEF helped to establish for monitoring system for implementation of the BMS code229. BMS manufacturers, distributors, health professionals and general public have been violating the code either due to intentional or unintentional reasons, conflict of interest and/or lack of knowledge. Mothers are influenced by doctors, relatives, and BMS product advertisements that make claims of ensuring healthy growth of babies. Strict implementation of the BMS code is mandatory in addition to enhancing public awareness and alerting marketers about the implications of the BMS code.
Revitalising the Baby Friendly Hospital (BFH) Initiative: To promote, protect and support breastfeeding is an activity being spearheaded by BBF and supported by the MoHFW. To date, 499 hospitals have been certified as ‘Baby Friendly’ and the Government has revitalized BFH activities in 63 hospitals. In 2012, BBF and IPHN conducted Training of Trainers and BFH training at 15 Medical College Hospitals and
___________________________________________________________________________ 227 Roos N, Wahab A, Hossain MAR, Thilsted SH (2007). Linking human nutrition and fisheries: incorporating micronutrient dense, small indigenous species in carp polyculture production in Bangladesh. Food and Nutrition Bulletin, 28 (2): s280 –S 293. 228 BMS code is a system of rules and regulations outlining the responsibilities in marketing breast milk substitutes (BMS) by the manufacturers and distributors of such products adopted by WHO in 1981. 229 BBF (2012). Report of the Pilot Project on BMS Code Monitoring.
99
BFH training at 3 Medical College Hospitals and 21 Upazilas health complexes. For the sustainability of BFH status of the hospitals, built-in monitoring and evaluation is required.
Strengthening fortification initiatives and the National Fortification Alliance (NFA): Universal salt iodization is being pursued for the last two decades. Legal and organizational measures include: enactment of the Prevention of IDD Act in 1989, framing of the Prevention of IDD Regulation in 1993; constitution of national, district and sub district level salt committees; establishment of 8 zonal offices along with eight salt iodine testing laboratories and adoption of a National Salt Policy in 2011. A total of 267 salt mills have been equipped with salt iodization plants and 105 salt mills have their own laboratories. Vitamin A fortification of refined soybean oil is undertaken with private sector support. Micronutrient powders (MNPs) are also being promoted through retailer and grocery outlets at low cost. The BRAC community network in collaboration with MoHFW is disseminating messages to promote MNP usage in diets of 6 to 24 months old children to meet the need of micronutrients for this vulnerable period. Pilot rice fortification initiatives are underway, wherein milled rice is fortified with micronutrients. Inclusion of fortified rice in social safety nets is being explored by the Ministry of Disaster Management and Relief in collaboration with relevant ministries and development partners to address micronutrient deficiencies. The NFA needs to be reactivated to provide strategic guidance and governance for national fortification programmes.
6.2. Programme 11: Orienting food and nutrition programmes through data
Programme 11 aims to utilise up-to-date data and analyses to strengthen planning, monitoring and evaluation of nutrition interventions and policies, and corresponds to NFP PoA AoI 3.1. Improvement of statistics is essential for evidence-based decision making. The last two years have seen important new datasets made available. Data is collected according to established methodologies and criteria governing food and nutrition security and provides update on indicators and elements that serve as reference for monitoring food and nutrition policies.
6.2.1. Progress towards achievements
Programme 11 of the CIP identifies key interventions in updating national food composition tables, conducting food consumption and dietary assessments, validating dietary diversity methodologies and capacity strengthening in nutrition survey and analysis to facilitate evidence-based decision making. Table 25 shows the progress in relation to these interventions.
Increased Behavioural Change Communication (BCC) efforts The key to BCC is empowering the communities towards health and nutrition seeking behaviour. Bangladesh has been implementing health education as part of its health promotion and protection interventions since 1958 through networks articulated down to

100
the grass root level230. Table 25: Progress towards achievement of CIP programme 11 CIP/NFP PoA output proxy indicators
2007/08 2009/10 2010/11 2011/12 Source
Number of mass media activities for behavioural change communication
na 635 575 685 Health Bulletin
2011, DG Health Services
Desirable dietary pattern established and updated
BIRTAN/FPMU/ DGHS
na Research initiated
Research ongoing
BIRDEM/FPMU/ NFPCSP/FPMU
Food composition tables (FCT) updated
FCT work ongoing
FCT on indigenous
foods prepared
Research initiated
Updated FCT ongoing
INFS/CARS/DU/ FPMU/NFPCSP –FAO, INFOODS
Food security and nutrition databases/ surveillance systems
BDHS MICS; FSNSP HIES; FSNSP BDHS, NMSS,
FSNSP, NHDSBD
FPMU
The number of BCC activities has increased in recent years. The NNS is implementing mass media campaigns, social mobilization and BCC activities at the health facility and community clinic levels. The Operational Plan (OP) on Health Education and Promotion also implements health education under the Directorate General of Health Services (DGHS), as a precondition for successful health care delivery. The Bureau of Health Education (BHE) under DGHS is implementing jointly with DGFP the OP for Information, Education and Communication (IEC/BCC) of the HPNSDP carrying out comprehensive Health Education Promotion to the target population at all levels.
BCC tools like TV or radio spots, posters, leaflets and flip charts address behaviors and generate demand for health, family planning and nutrition services. More recently eHealth tools have also been introduced. Billboards on health have been supplied to 114 Upazilas, indoor display boards have been supplied to 240 schools and 460 UHCs through the NNS. IYCF TV spots are being aired jointly with IYCF Alliance and some innovative strategies are initiated. BCC activities are also being implemented within the context of the National IYCF Communication Implementation Framework.
As part of scaling up national coverage of IYCF communication, BRAC has been promoting community based approaches. The programmes are being implemented in partnership with NNS and development partners along with strong support of multimedia like journalism, press and TV spots that act as a pla orm for advocacy and lead to an improved national coverage (Figure 31).
___________________________________________________________________________ 230 HPNSDP (2011 -2016). PIP, Vol 1, Planning Wing MoHFW, July 2011.
Figure 31: Vision for national coverage on IYCF
Source: Sanghvi T (2013). The Vision: Alive and Thrive, FHI 360.

101
Establishment of Desirable Dietary Pattern (DDP) Following up on previous estimates of desirable food intake,231 a Desirable Dietary Pattern and dietary guidelines for Bangladesh have been established by the Department of Biochemistry and Cell Biology, BIRDEM, in collaboration with FPMU and supported by NFPCSP–FAO. This is in line with NFP PoA AoI 3.1 ‘long term planning for balanced food.’ The DDP was based on an assessment of the adequacy of food and nutrient intake using the HIES 2010 household food consumption data.
Energy requirements were estimated using FAO/WHO methodology,232 based on physical activity levels in rural and urban areas classified by age, sex, occupational status (including sedentary, moderate and heavy work) and physiological status (i.e, pregnancy and lactation). The recommendend dietary allowances for macronutrients and micronutrients are compiled based on FAO/WHO (2006) and ICMR 2010 recommendations233. Diet plans formulated identify types and quantities of foods with an emphasis on local food habits, food availability and biodiversity building upon the 2000 Dietary Guidelines produced by BNNC, MoHFW. The dietary pattern and dietary guidelines have been reviewed by and shared with stakeholders in MoF, MoHFW and related institutions. Updated Bangladesh Food Composition Tables (FCT) Food composition tables (FCTs) are an essential tool for planning interventions in food security, nutrition and health. FCTs provide information on the nutrient composition of foods with specific reference to energy, nutrients (e.g. protein, fat, carbohydrate, vitamins and minerals) and other nutritionally significant food constituents (e.g. total dietary fibre, anti-nutrients, phytonutrients, etc). The Bangladesh FCTs have been updated and revised by INFS and CARS, Dhaka University with technical support from NFPCSP-FAO.
A key foods approach was used to identify and prioritize the foods for primary nutrient analysis.234 Food consumption data from HIES 2010 was used to identify the key food list, for rationalizing the food consumption indicators and other normative nutrition standards. The nutrient values have been derived from chemical analyses performed in accredited analytical laboratories or have been compiled from secondary sources in compliance with the Global INFOODS Guidelines for which FAO serves as Secretariat.235 A robust methodology and quality assurance review was employed in the development of the Food Composition Data Base (FCDB) and the updated FCT. The nutrient composition of 381 foods representing 15 food groups including 20 key foods that represent 75% of the nutrient intake and 11 cooked recipes are included in the new food composition database and FCT. The nutrient composition of 75 ethnic foods that had been earlier analyzed236 was also considered in the update of the national FCT. This initiative has been the first of its kind in the country. The Bangladesh FCT is also part of its larger contribution to the South Asian
___________________________________________________________________________ 231 BAN- HRDB, FPMU and MoHFW (2007). National Food Basket of Bangladesh 2007 -2012. 232 FAO/WHO (2004) Human energy requirements, Report of a Joint FAO/WHO/UNU Expert Consultation, Rome 17 -24 October 2001, Food and Nutrition Technical Report Series # 1. 233 Indian Council of Medical Research (2010). Nutrient Requirements and Recommended Dietary Allowances for Indians. 234 Haytowitz et. al. (2002). The identification of key foods for food composition research. J ournal of Food Composition Analysis, 15:2, 183-194. 235 INFOODS (2003). The International Network of Food Data Systems (available at http:// www.fao.org/infoods). 236 Islam S.N., M.N.I. Khan, and M. Akhtaruzzaman (2010). A Food Composition database for Bangladesh with special reference to selected ethnic foods, INFS-NFPCSP-FAO, Dhaka, Bangladesh.
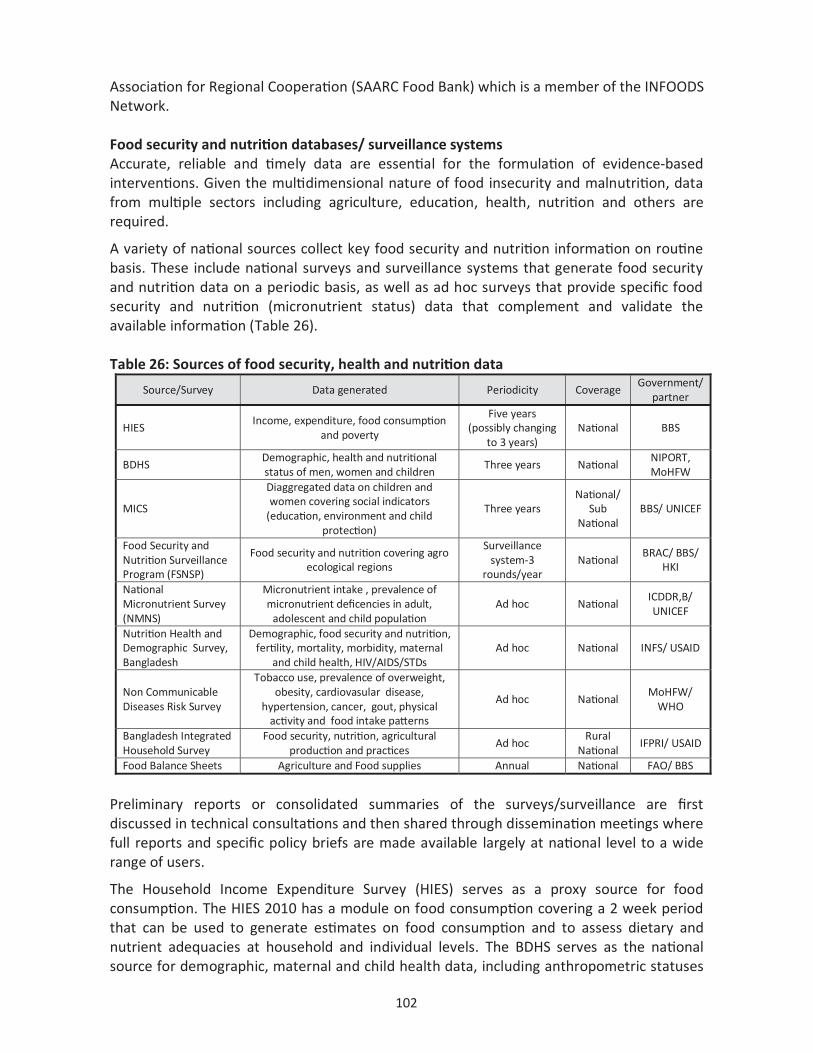
102
Association for Regional Cooperation (SAARC Food Bank) which is a member of the INFOODS Network. Food security and nutrition databases/ surveillance systems Accurate, reliable and timely data are essential for the formulation of evidence-based interventions. Given the multidimensional nature of food insecurity and malnutrition, data from multiple sectors including agriculture, education, health, nutrition and others are required.
A variety of national sources collect key food security and nutrition information on routine basis. These include national surveys and surveillance systems that generate food security and nutrition data on a periodic basis, as well as ad hoc surveys that provide specific food security and nutrition (micronutrient status) data that complement and validate the available information (Table 26). Table 26: Sources of food security, health and nutrition data
Source/Survey Data generated Periodicity Coverage Government/
partner
HIES Income, expenditure, food consumption
and poverty
Five years (possibly changing
to 3 years) National BBS
BDHS Demographic, health and nutritional status of men, women and children
Three years National NIPORT, MoHFW
MICS
Diaggregated data on children and women covering social indicators
(education, environment and child protection)
Three years National/
Sub National
BBS/ UNICEF
Food Security and Nutrition Surveillance Program (FSNSP)
Food security and nutrition covering agro ecological regions
Surveillance system-3
rounds/year National
BRAC/ BBS/ HKI
National Micronutrient Survey (NMNS)
Micronutrient intake , prevalence of micronutrient deficencies in adult,
adolescent and child population Ad hoc National
ICDDR,B/ UNICEF
Nutrition Health and Demographic Survey, Bangladesh
Demographic, food security and nutrition, fertility, mortality, morbidity, maternal
and child health, HIV/AIDS/STDs Ad hoc National INFS/ USAID
Non Communicable Diseases Risk Survey
Tobacco use, prevalence of overweight, obesity, cardiovasular disease,
hypertension, cancer, gout, physical activity and food intake patterns
Ad hoc National MoHFW/
WHO
Bangladesh Integrated Household Survey
Food security, nutrition, agricultural production and practices
Ad hoc Rural
National IFPRI/ USAID
Food Balance Sheets Agriculture and Food supplies Annual National FAO/ BBS
Preliminary reports or consolidated summaries of the surveys/surveillance are first discussed in technical consultations and then shared through dissemination meetings where full reports and specific policy briefs are made available largely at national level to a wide range of users.
The Household Income Expenditure Survey (HIES) serves as a proxy source for food consumption. The HIES 2010 has a module on food consumption covering a 2 week period that can be used to generate estimates on food consumption and to assess dietary and nutrient adequacies at household and individual levels. The BDHS serves as the national source for demographic, maternal and child health data, including anthropometric statuses
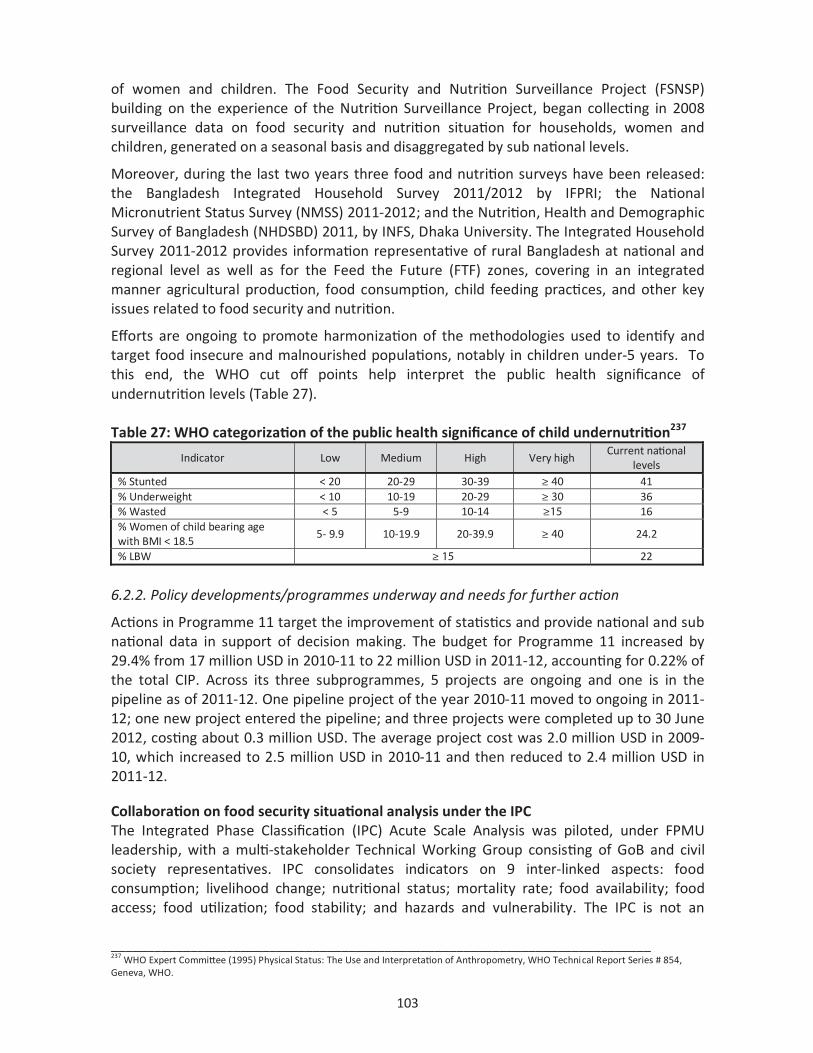
103
of women and children. The Food Security and Nutrition Surveillance Project (FSNSP) building on the experience of the Nutrition Surveillance Project, began collecting in 2008 surveillance data on food security and nutrition situation for households, women and children, generated on a seasonal basis and disaggregated by sub national levels.
Moreover, during the last two years three food and nutrition surveys have been released: the Bangladesh Integrated Household Survey 2011/2012 by IFPRI; the National Micronutrient Status Survey (NMSS) 2011-2012; and the Nutrition, Health and Demographic Survey of Bangladesh (NHDSBD) 2011, by INFS, Dhaka University. The Integrated Household Survey 2011-2012 provides information representative of rural Bangladesh at national and regional level as well as for the Feed the Future (FTF) zones, covering in an integrated manner agricultural production, food consumption, child feeding practices, and other key issues related to food security and nutrition.
Efforts are ongoing to promote harmonization of the methodologies used to identify and target food insecure and malnourished populations, notably in children under-5 years. To this end, the WHO cut off points help interpret the public health significance of undernutrition levels (Table 27). Table 27: WHO categorization of the public health significance of child undernutrition237
Indicator Low Medium High Very high Current national
levels % Stunted < 20 20-29 30-39 ≥ 40 41 % Underweight < 10 10-19 20-29 ≥ 30 36 % Wasted < 5 5-9 10-14 ≥15 16 % Women of child bearing age with BMI < 18.5
5- 9.9 10-19.9 20-39.9 ≥ 40 24.2
% LBW ≥ 15 22
6.2.2. Policy developments/programmes underway and needs for further action
Actions in Programme 11 target the improvement of statistics and provide national and sub national data in support of decision making. The budget for Programme 11 increased by 29.4% from 17 million USD in 2010-11 to 22 million USD in 2011-12, accounting for 0.22% of the total CIP. Across its three subprogrammes, 5 projects are ongoing and one is in the pipeline as of 2011-12. One pipeline project of the year 2010-11 moved to ongoing in 2011-12; one new project entered the pipeline; and three projects were completed up to 30 June 2012, costing about 0.3 million USD. The average project cost was 2.0 million USD in 2009-10, which increased to 2.5 million USD in 2010-11 and then reduced to 2.4 million USD in 2011-12.
Collaboration on food security situational analysis under the IPC The Integrated Phase Classification (IPC) Acute Scale Analysis was piloted, under FPMU leadership, with a multi-stakeholder Technical Working Group consisting of GoB and civil society representatives. IPC consolidates indicators on 9 inter-linked aspects: food consumption; livelihood change; nutritional status; mortality rate; food availability; food access; food utilization; food stability; and hazards and vulnerability. The IPC is not an
___________________________________________________________________________ 237 WHO Expert Committee (1995) Physical Status: The Use and Interpretation of Anthropometry, WHO Technical Report Series # 854, Geneva, WHO.
104
information system, but a situation analysis and assessment of the future. The IPC is seen as a precursor to a more fully fledged Early Warning System, given its similarities with the Acute Future Projection, in terms of information on the potential severity, likelihood and timing of impending crises, and implications on livelihoods. The Nutrition and Food Security Clusters238 are also engaged in food security and nutrition mapping, analysis and capacity building during emergency and rehabilitation following disasters. Development of food and nutrition security information systems Two initiatives have been implemented to strengthen and mainstream data management. First, FPMU, with support from the NFPCSP, developed a Beta Version of the FPMU Data Management System, as part of a larger Food Security and Nutrition Information System (FSNIS) that encompasses a website and a virtual library. Nutrition data incorporated into this database draws on the most recent FSNSP, BHDS and HIES results, data on food availability, markets and public distribution are drawn from BBS, DAE, DAM, MIS of DG Food and various other sources. Data can be entered or imported via data linkages with DAM, MISM and FSNSP, and has helped to automate production of FPMU’s daily, fortnightly and quarterly food reports. Development of the FPMU FSNIS will continue in 2013 and 2014. A second initiative in the health sector, under the mandate of the IPHN/NNS, seeks to create a nutrition information system (NIS). A Nutrition Information & Planning Unit (NIPU) is also in process of development with support from DFID, UNICEF, MI, WHO, FAO, HKI, Brac University, FHI and other organisations in an effort to consolidate information from diverse sources for comprehensive nutrition situational analysis in Bangladesh. National Strategy for the Development of Statistics (NSDS) BBS will introduce the NSDS to strengthen the National Statistical System (NSS) of Bangladesh. NSDS is a global concept which emerged in 2004 under PARIS 21 (Partnership in Statistics for Development in the 21st Century) to improve the performance of statistical systems of developing countries. The goal is for NSS to produce timely, reliable and accurate statistics for planning and development processes. The Statistical Development Strategy, has the aim of establishing statistical cells within relevant ministries/agencies; enhancing statistical capacity through human resource development and improving the data dissemination policy. NSDS is a holistic approach which will cover the entire NSS. It involves situation analysis, formulation of policies, time-bound and result-based action plans, monitoring and evaluation. Institutionalize food security and nutrition surveillance FSNSP is now working towards a sustainable institutionalization plan to integrate surveillance into the activities of BBS, FPMU, NNS and related partners involved in food security and nutrition monitoring. Areas identified for institutionalization include: participatory governance mechanisms; mobilization of sustained finances; data collection and management capacity embedded in lead national agencies; analysis and timely reporting of results; and use of findings for policy and programming by government (including the Ministry of Health and Family Welfare, Ministry of Food, NGOs, UN Agencies and development partners) and NGOs.
___________________________________________________________________________ 238 Food Security Cluster is co-chaired by WFP and FAO; Nutrition Cluster is chaired by UNICEF.
105
Needs for further action in this area include:
Maximizing impacts on nutrition through programme formulation and monitoring: Explicit nutrition targets and indicators should be included in the formulation of new projects and should be regularly monitored during implementation, also for projects that are implementing nutrition sensitive actions. Monitoring impacts can contribute to demonstrate the benefits of mainstreaming nutrition in multi-sectoral interventions. In this connection, a mapping of nutrition actions has been initiated by HKI to review the range of interventions and consistency and harmonization of indicators. It is envisaged that the nutrition data and information will be included in the Health Information System database of DGHS and also shared with FSNIS in FPMU so as to feed into national level policy monitoring processes such as the NFP PoA and CIP monitoring.
Promoting convergence among information systems: Given that nutrition and food security information is generated and used by multiple sectors, convergence, collaboration and coordination between different information systems should be seen as an important opportunity to better inform decision making. This is the case for example of the NIS in Nutrition Information Planning Unit (NIPU) and FSNIS in FPMU. Data sharing and, possibly, integration of the data repositories should be promoted to enhance data coverage and use.
Institutionalizing food security and nutrition surveillance: Under the new National Strategy for the Development of Statistics (NSDS), the BBS budget has ear marked resources for nutritional surveillance. NSDS provides a framework to institutionalize the processes for consultation, negotiation, mediation, and consensus building on priority issues apart from improving the quality, coverage and use of core statistics required for national planning. FSNSP has commenced with the transition; the project components have shifted from the HKI to BRAC University and BBS as part of the local ownership process.
Using evidence from research for promoting BCC programmes: Core BCC messages should be validated using science based guidance and a common understanding of the nutrition needs of the community. Studies on the desirable dietary pattern, complementary feeding manual and tested recipes, updated FCT with the macro and micronutrient content of the foods provide useful background to inform BCC programmes and nutrition education.
Promoting the use of food based dietary guidelines to inform policies and actions: Food Based Dietary Guidelines (FBDGs) should be used by a plurality of actors within multiple sectors, a working group on dietary guidelines’ implementation should be constituted. It should include key ministries (MoHFW, MoA, MoFLS, MoF, Ministry of Primary Education and Mass Communication), government agencies, academic institutions and private sector. The working group should define a timed plan for dissemination of the FBDGs to all relevant users.

106
6.3. Programme 12: Food safety and quality improvement
Programme 12 aims to improve food safety and quality, including the national system for the assurance and surveillance of food safety and quality. It finances actions foreseen under NFP PoA AoIs 3.5 and 3.6 which aim to enhance access to safe and quality food supply for national consumption and international trade; and also to provide safe drinking water and improved sanitation facilities for all. Programme 12 is articulated along the following three subprogrammes: (1) improve surveillance system of food-borne diseases; (2) develop and enhance capacities of laboratories and systems for food quality assurance and control of food; and (3) support the development of a modern food control management system.
6.3.1. Progress towards achievements
Table 28: Progress towards achievement of CIP programme 12
CIP/NFP PoA output proxy indicators 2007/08 2009/10 2010/11 2011/12 Source
No. of compulsory food items standardized by BSTI
58 64 64 12 BSTI, MoI
Prevalence of diarrhoea in under-5 children (in two week period)
10% na na 5 % BDHS
Proportion of population served with safe water supply for domestic use
97% 98% 98% 98.4% DPHE
Proportion of population having access to safe drinking water in arsenic affected areas
na 86% 87% 88% DPHE
Food safety activities are implemented under several line ministries given the multisectoral nature of food safety and its articulations along the food supply chain from ‘farm to fork’. For example, the department of Plant Protection under DAE of MoA is the focal point vested with responsibilities for activities covered under the International Plant Protection Convention (IPPC) including the Sanitary and Phytosanitary (SPS) Standards and Measures in Bangladesh; the Directorate of Food is responsible for supply of food stuffs and essential commodities to the consumers, assessing grain quality and standards and to align the draft Food Safety Policy with the disaster management/relief distribution system; the Institute of Public Health under DGHS, MoHFW is responsible for testing various food items including drinking water sold in the market for public consumption. BSTI,239 under Ministry of Industries deals with all government regulated standards and certification of food commodities and products and food fortification initiatives. Certification and food standards Consumers have been demanding legislative action to ensure that only safe food of acceptable quality be sold and that the risk of food borne health hazards be minimized. BSTI has approved 250 food related standards, both mandatory and voluntary. Of these 64 are under the mandatory certification marks scheme covered by issuing statutory regulatory orders (SROs) under Clause 24 of the BSTI Ordinance 1985. The number of compulsory standardized food items increased from 58 in 2007/08 to 61 in 2008/09, 64 in 2009/10 and remained static at 64 in 2010/11 (Table 28). However, only 12 new food items have been standardized in 2011/12. Among the standardized products, many foods are still sold
___________________________________________________________________________ 239 BSTI was established by the Government through an Ordinance passed in July 1985. The Ordinance has been amended as the BSTI (Amendment) Act, 2003.

107
without standard bearing seals or with false seals due to weak enforcement. The slow progress in the certification of foods is attributed to limited capacities in BSTI and compliance with stricter regulations. Beside safeguarding consumers and health, standardization and certifcation of foods also influence trade. Prevention and control of diarrhoea The incidence of diarrhoea has declined over time but still persists as a major cause of infant mortality, morbidity and acute child malnutrition. It caused 2%of under-5 deaths during 2007-11 in Bangladesh. Greater mortality was averted by sustained use of oral rehydration salts (ORS) by about 77-78% of all children sick with diarrhoea since 2007240.
There has been a decline in prevalence of diarrhoea from 10% in 2007 to 5% in 2011. The use of zinc along with ORS increased from 20% in 2007 to 34% in 2011 which could be one of the reasons for this achievement. On the other hand, FSNSP 2011 shows a different picture where the diarrhoea prevalence improved less markedly (from 14% in 2010 to 12% in 2011), though the difference can be partly due to seasonal factors241 242. Prevalence of diarrhoea is highest at the age of 6 to 23 months, a period when solid foods are first introduced into the child’s diet. This pattern is believed to be associated with increased exposure to illness as result of faulty complementary feeding, greater mobility of the child as well as the immature immune system of children in this age group.243 Very little data is available on the prevalence and severity of food-borne illnesses. Work is underway in setting up a national food-borne illness surveillance system with the Institute of Epidemiology and Disease Control Research (IEDCR) of the MoHFW under the purview of the Project, ‘Improving Food Safety in Bangladesh’, being implemented by the MoHFW with technical support from FAO and funding from the Government of the Netherlands.
Hygienic practices play an important role in the prevention of diseases related to water and sanitation. An average of 65% of mortality caused by diarrheal diseases could be reduced if good hygiene practices are coupled with the provision of water and sanitation244. A gap between perception and practice of proper hand washing with soap was identified in a BRAC conducted study. At 2006 baseline, 8% reported to wash their hands with soap, which increased to 22% in 2010. The study also revealed that WASH interventions improved the water, sanitation and hygiene situation in Bangladesh; reduced diarrhoeal prevalence associated with lower number of faecal-colony forming bacteria on hands. Multivariate analysis showed that socio-economic factors including education of household head and respondent, water availability and access to media have strong positive association with hand washing with soap. The LGRD & C has taken initiatives to achieve the full coverage of hygiene and sanitation in collaboration with BRAC’s Water, Sanitation and Hygiene (WASH) programme to achieve the target set by the Millennium Development Goal (MDGs).
___________________________________________________________________________ 240 Policy Briefs, Bangladesh Demographic and Health Survey 2011, p.10. 241 The figures in diarrhoea prevalence vary between the BDHS, HFSNA and FSNSP surveys which could be attributed to seasonality factors. 242 State of Food Security and Nutrition in Bangladesh 2011. 243 Faruque ASG et. al. (2008). J Health Popul Nutr. 26(3): 325–339. 244 Rabbi S., and Dey N., (2013). Exploring the gap between hand washing knowledge and practices in Bangladesh: a cross-sectional comparative study, BMC Public Health, 13:89.

108
Safe water supply Safe water supply is essential for maintaining good health and nutrition. The water supplied and used for households influences hygiene and therefore public health. Bangladesh attained almost universal coverage of safe water supply. The coverage was 75% in 2002 and reached 97% by 2007-08 and 98% in 2009-10. Recently (2011/12) DPHE estimated that the safe water supply for domestic use among households is 98.4%. Significant health gains occur when water is available at household level for child-care, food preparation and other productive activities. Access to safe drinking water in arsenic affected areas Ninety per cent of the rural population relies on tube wells for drinking water and deaths from diarrhoea have dropped dramatically. The establishment of tube well facilities at the household level was a main achievement, but it led to the emergence of arsenic contamination as a new challenge. Arsenic has no taste, odour or colour, and poses only long-term health risks, unlike the immediate risks of diarrhoea. Accordingly, arsenic mitigation is being mainstreamed into broad water and sanitation programmes. Many of the shallow tube wells with arsenic contaminated water are now marked with red colours245 and access to safe drinking water in arsenic affected areas has gradually increased to reach 88% of the population in 2012. Consumption of unsafe foods Problems of food safety can arise at any point of the food chain, from production, manufacture, transport, storage, or processing to preparation and consumption. Globalization of the food trade, mass production and increase in the complexity of the food chain has further multiplied the risk of food contamination. Consumption of unsafe food is an important factor in malnutrition, along with morbidity, notably diarrhoea along with other permanent consequences for the human body. Total diet studies can be used as part of food safety monitoring for chemicals in food.
Dietary risk exposures to heavy metals and other elements can be used to assess the safety of foods consumed. Recent research carried out by the INFS and supported by NFPCSP-FPMU assessed the heavy metals content of 20 prioritised key foods. Among the key foods, three have been found to contain heavy metals beyond the safe ___________________________________________________________________________ 245 UNICEF (2008). Arsenic Mitigation in Bangladesh; the red colour could enable the tube well users to visually know if the water is arsenic contaminated.
Box 6: Assessment of food safety using a total diet study The concentration of heavy metals in foods varies depending on where food is grown and marketed. Rice and vegetables grown in Rajshahi and Jessore have elevated concentration of arsenic (As) while rice and vegetables grown in Savar, Hazaribagh and Mymensingh had lower As levels. Males from over three-fourths of poor and non-poor households have cadmium (Cd) intake above the MPL. Both poor and non-poor households have high intake of As and lead (Pb) from different foods. The dietary risk exposure calculations point to a risk of all males of poor and non-poor households from As and Pb contamination. Mercury and antimony intake through different foods consumed by males from both poor and non-poor households are safely below Provisional Minimum Tolerable Intake (PMTI). In particular, the estimates of high dietary risk exposure to As and Pb have health implications, given that the Joint FAO/WHO Expert Committee on Food Additives (JECFA) in 2010 has withdrawn the Provisional Tolerable Weekly Intakes (PTWI) of As and Pb. Source: Islam, R. et al. (2013). Consumption of Unsafe Foods: Evidence from Heavy Metal, Mineral and Trace Element Contamination, BAU (NFPCSP-FAO study)
109
limit recommended by FAO/WHO.
Tilapia fish (arsenic content: 1.486 ppm), milk (lead content: 0.04 ppm) and mango (lead content: 0.642 ppm) are unsafe considering the safe limits of 1 ppm arsenic in fish, and 0.02 ppm and 0.1 ppm of lead in milk and fruit, respectively246. Another research carried out by the Department of Soil Science of BAU247 and supported by NFPCSP-FPMU evaluated the dietary risk exposure to specific minerals, trace elements and heavy metals among poor and non-poor households of Dhaka city (Box 6).
6.3.2 Policy developments/programmes underway and needs for further action
Programme 12 has a budget of 43 million USD or 0.44% of the total CIP budget, allocated to 5 ongoing, 1 completed and 3 pipeline projects as of June 2012, which is about 6.5% below the level registered in 2010-11. During the last fiscal year 1 project was completed, no new projects initiated and the number of pipeline projects reduced from 4 to 3. The average size of the projects gradually decreased from 12.7 million USD in 2009-10 to 4.6 million USD in 2010-11 and to 4.7 million USD in 2011-12. Delivery under the programme was 22.4 million USD in 2011/12, almost double than in 2010-11. The FAO Food Safety Project with a budget of 12.5 million USD is incorporated under the operational plan of the National Nutrition Services of the MoHFW. It follows up on an earlier project technically supported by FAO and funded by the EU with a budget of 10 million USD over the period 2009-12.
Food safety is now a major national priority with the government committed to establish a comprehensive, update legislation framework and implementing science-based approaches harmonized with international standards. The Prime Minister, in an inter-ministerial meeting in late 2012, instructed the Ministry of Food to elaborate a Food Safety Act since the Pure Food Law 1959 and its amendment in 2005 is out-dated, largely ineffective and requires major amendment. Under the provisions of the draft Act, an independent Bangladesh Food Safety Authority will be established and the National Food Safety Management Advisory Council will be reorganised with representation of all relevant ministries.
In line with the priority activities identified in the CIP, a National Food Safety Laboratory (NFSL) has been set up with well resourced modern instrumentation, equipment and facilities with support from FAO and EU. Qualified and trained core analysts are required to run the laboratory. The FAO Food Safety Project is supporting the capacity development activities for the analysts of the NFSL as well as other food testing laboratories in the country. There is a strong need for collaboration between Ministries particularly the MoHFW and the Ministry of Food in this critical initiative. Recognizing that the NFSL alone cannot meet the food safety analysis needs of the nation, the FAO Food Safety Project is also setting up the Bangladesh Food Safety Laboratory Network for sharing scientific and technical information and promoting partnerships. Concomitantly, capacity development activities are being supported for food and sanitary inspectors to undertake risk-based inspection and proper sample collection. Collaboration with the private sector is also envisaged, building on the successful partnerships between the public laboratories and ___________________________________________________________________________ 246 Shaheen, N., et al. (2013). Heavy Metals Content of Selected Key Foods in Bangladesh. Annual Meeting, Experimental Biology, Boston Convention and Exhibition Centre, Boston, April 20-24. 247 Islam R et. al. (2013). Consumption of unsafe foods: Evidence from heavy metal, mineral and trace element contamination in Bangladesh, Department of Soil Science, BAU, NFPCSP-FAO/FPMU supported Research Study.

110
exporters that have resulted in a positive turn around for Bangladeshi fish and shrimp exports to EU.
The PoA Area of Intervention 3.5 on safe drinking water and sanitation facilities available and accessible for all is yet to be met. The strategic planning for water supply and sanitation projects for all urban areas and installing piped water supply for the urban poor needs to be further geared up. Besides, there is need for increasing the number of improved tube wells in rural areas to minimize impacts of arsenic contamination, excessive iron and salinity. There is also need for introducing water quality monitoring and surveillance programmes as well as mass hygiene awareness campaigns including the importance of hand washing. Research and development on appropriate and affordable technologies for safe drinking water and improved sanitation, construction of sanitary latrines for every household and for every school, strengthening the capacity of the local authoritative bodies through training of the concerned officials, strengthening/developing urban solid waste management through improved water and sanitation services are needed.
The PoA Area of Intervention 3.6 emphasised the enhanced access to safe and quality food, for domestic consumption and international trade. It covers activities including the strategic development framework at the national level and the need for a food control system to ensure nutritious, safe and wholesome food for consumers. The adoption of Good Agriculture Practices (GAP) at the field level and food safety management systems (such as GHP, GMP and HACCP) from post-harvest to retail; the remodelling of concerned IEC/BCC programmes on food safety and safe food practices to target actors in the food chain from farm-to-table, women particularly at the household level and school children; supporting the development of national food standards on the basis of risk assessment studies and strengthening the National Codex Committee and the National Codex Contact Point located in the BSTI are important priorities for FAO in its support to national food safety efforts.
Needs for further action in this area include:
Activating CODEX focal point and ensure compliance to standards: There is need to support capacity development for the National Codex Committee and the National Codex Contact Point so that they can participate in standard setting activities, regional and international, of the Codex Alimentarius Commission. As the government is now actively responding to food safety as a national priority, there is need for strengthening food control agencies and systems to monitor compliance with regulations to protect consumer health. Additionally, issues related to international trade and the SPS and TBT Agreements of WTO should be addressed by relevant departments in collaboration with the CODEX focal point.
Finalizing and enacting the new Food Safety Act, 2013: As mentioned above, the government in consultation with different ministries and stakeholders decided to enact a new Food Safety Act, 2013 under which a National Food Safety Management Advisory Council and an independent Bangladesh Food Safety Authority is being established to co-ordinate all functions related to food safety in the country. The National Food Safety Management Advisory Council will continue to be the apex policy making body on this issue. The Food Safety Act is being finalized and is expected to be placed soon before the Parliament for enactment. The approval and implementation of the Act will constitute a key step forward for improving food safety and food control in the country. This would need to be followed up with the development of the rules and regulations including measures for standards
111
development and to align the various ministries and agencies involved in the new structure so that it incorporates all vital elements of food control.
Seeking approval of the National Food Safety and Quality Policy and National Food Safety Emergency Response Plan: The draft National Food Safety and Quality Policy prepared by different concerned ministries and stakeholders is currently being reviewed, thereafter awaiting approval. This will need to be followed by the development of a Plan of Action. A National Food Safety Emergency Response Plan drafted by a multi-sectoral committee and facilitated by the (then) MoFDM and related ministries, also awaits approval. Given that food safety emergency responses are generally built on an effective food control system, there is need to collect and review experiences of food related outbreaks and incidents through food-borne illness surveillance and develop a profiling of the system to address food safety emergencies. This is an area of policy priority that is being followed up.
Promoting effective utilization of national food safety testing facilities: As mentioned above, a state-of-the-art NFSL has been established at the Institute of Public Health under MoHFW. Support for building national food analysis at the NFSL is being provided by FAO with funding from the Government of Netherlands. The Institute of Food Science and Technology of BCSIR has also established a food safety laboratory with modern sophisticated instruments and equipment with the financial support of the Ministry of Science and Technology. This laboratory has well trained food scientists and analysts. It is important to promote collaboration and coordination among all laboratories, and streamline their role within the food control system in order to maximize impact of the investments. A laboratory network is being established for this purpose.
Scaling up safe and healthy street food vending: Healthy street food vending is gaining momentum. In particular, the urban workforce need convenient foods because of their individual household circumstances which may not permit them to prepare home cooked meals. A large part of the urban population in Bangladesh, particularly from the lower income groups, meets a subtantial part of its dietary and nutritional needs through meals and beverages offered by outdoor vendors. Institutionalization of safe and hygienic street food vending was initiated as part of NFP Strategy # 3.5, PoA AoI # 3.6 : Safe, quality food supply. Following up from an NFPCSP-FPMU supported pilot research on Street Foods248, MoHFW with support from the FAO Food Safety Project implemented a safe street food vending initiative in collaboration with the Khulna City Corporation. This initiative also set up clean and hygienic street food kitchens to support the modern food carts. Model healthy markets for the sale of fresh produce were established within existing markets in Khulna. A training manual for street food vendors and handlers on food hygiene is being used by the vendors and other participants.249 This model that has resulted in healthier, safer food in Khulna and higher vendor incomes, awaits extension and scaling up in other urban areas of the country.
___________________________________________________________________________ 248 FPMU Food Security Policy Brief (2011). Safer Street Foods, NFPCSP-FAO/USAID/EU. 249 FAO (2012). Training Manual for Street Food Vendors on Food Hygiene.


113
7. Food security and CIP financing
The CIP tracks resources channelled through the Annual Development Programme to finance a comprehensive set of priority investments consistent with the NFP Plan of Action. Some financing has been committed already for completed and ongoing projects, which are recorded as “financed” within the CIP monitoring framework. Other financing requirements are yet to be committed, and are recorded as “pipeline” in the CIP monitoring framework. The pipeline is classified by the GoB into priority and non-priority funding in order to facilitate phased and sustained commitments.
The CIP is articulated in 12 programmes and 40 subprogrammes that identify the priority investments required under the various Areas of Interventions (AoIs) of the PoA (see Annex 1) to address the issues targeted in the National Food Policy. The CIP “focuses on those investments that have a direct impact on food availability, access and nutrition, leaving out broader items for which other mechanisms are more adequate” (CIP 2011, Section 2 pg. 3). For example, not included in the CIP are donor contributions outside the ADP, private investments, and public sector current expenditure (such as direct transfers, fertilizer subsidies, food distribution and other safety nets) as well as on broader interventions, such as family planning and reshaping the education system.
This chapter is organised as follows. Section 1 reviews budgetary allocations across key ministries and divisions involved in the NFP PoA implementation. This does not exactly show financing of the PoA, since other areas of the Government’s work are also financed from these budgets, but it does show the relative importance of key PoA partners in the country’s overall fiscal space. Section 2 provides background information for understanding the CIP tables presented, including discussion of the project data that has been monitored for this report and improvements made to the budgets of 2011 and 2012 (see Annex 3 for details). Section 3 discusses the financial situation of the CIP updated for 2013, and reports the overall budget; financed actions disaggregated by government and development partner contributions; total and priority pipeline; and delivery articulated by programmes and subprogrammes. The analysis of the CIP financial situation is followed by recommendations, focusing on trends and distribution of current financing, the gap still to be financed and delivery so far. Updated data on completed and ongoing projects are presented in Annex 3.4, and on pipeline projects in Annex 3.5. 7.1. Fiscal space for food security: budgets of key NFP partner ministries
The NFP is a multi-ministerial policy, with 13 lead ministries and a multitude of other agencies expected to play key roles in its implementation. The budgets of these key ministries and divisions are spent mainly on PoA interventions, and partly on other objectives. Their total budget, however, can be taken as a measure of the fiscal space for food security and nutrition interventions.
Table 29 shows that in 2011/12, key NFP partner ministries and divisions together spent 424 billion taka on PoA and non-PoA interventions out of the GoB’s total expenditure of 1,445 billion taka. This represents shrinkage of the fiscal space for food security and nutrition investments to its lowest share (29%) since the start of PoA implementation – and moreover the shrinking share is planned to continue to 27% in 2012/13. Although the nominal taka

114
spending in 2011/12 by key partner ministries and divisions increased by 8%, this year-on-year increase was one of lowest and was outpaced by general inflation at 10.6%– which means the fiscal space shrank in real terms too. The planned budgetary increase of 11% in 2012/13 is larger than the inflation target of 7.5% announced in the 2013 Budget.
The MoA, LGD and MoHFW together accounted for around 66% of spending in 2011/12 by NFP partner ministries and divisions, making them the three largest – and this share is planned to remain the same in 2012/13. Key NFP partner ministries and divisions revised their planned budgets for 2011/12 by between +31% and -8%. Of total GoB expenditure in 2011/12, 9% went to agriculture, 8% to rural development and 7% to social security and welfare – and these are planned to be 8%, 8% and 6% respectively in 2012/13.
As cross-cutting and mainstreaming issues, gender and poverty are specific reporting items in BC-1 (Budget Circular 1), which in late-September is the first step in the strategic phase of the annual cycle before detailed budgets are prepared. The Ministry of Finance publishes a Gender Budget Report, which in the latest round included 25 ministries, and also reports budgets on antipoverty spending. Data from this reporting process shows there has been over four-fold increase in planned gender-spending over the past six years by key NFP partner ministries and divisions, with gender-spending planned to account for half of their total spending in 2012/13. Box 7 reports more detailed information.
Poverty spending follows the Poverty Reduction Strategy Paper classification, and comprises projects directly benefiting and mostly-targeting incomes and human capital of the poor, and also projects indirectly benefiting and not mostly-targeting the poor, but which are pro-growth, such as infrastructure, agriculture and institutional capacity. Figure 32 shows a declining trend in the share of total government spending on poverty, although the absolute amounts are steadily increasing. Between 2009/10 and 2010/11 the nominal increase was 19% and between 2010/11 and 2011/12 it was 11% - both of which exceeded inflation. Poverty spending is planned to increase by 19% to 97,440 crore taka in 2012/13.
Figure 32: Public spending on anti-poverty
Source: Ministry of Finance

115 Tabl
e 29
: Act
ual a
nd p
lann
ed e
xpen
ditu
res
(in b
illio
n Tk
) of k
ey p
artn
er m
inis
trie
s an
d di
visi
ons
in t
he N
FP
Revised Budget
Change FY07-08/FY06-07 (revised)
Change revised/ initial
% of total exp
Revised Budget
Change FY08-09/FY07-08 (revised)
Change revised/ initial
% of total exp
Revised Budget
Change FY09-10/FY08-09 (revised)
Change revised/ initial
% of total exp
Revised Budget
Change FY10-11/FY09-10 (revised)
Change revised/ initial
% of total exp
Revised Budget
Change FY11-12 (revised)/ FY10-11 (revised)
Change revised/ initial
% of total exp
Planned budget
Change FY12-13/ FY11-12 revised
% of total exp
MoA
6193
%41
%7%
76.4
25%
18%
7%73
.5-4
%23
%7%
84.4
15%
25%
7%92
.610
%25
%6%
89.1
20%
5%
MoF
L5.
110
%-7
%1%
618
%-8
%1%
6.4
5%-1
1%1%
7.9
25%
-8%
1%9.
318
%-5
%1%
9.5
-3%
1%
MoW
R14
.529
%3%
2%14
.92%
8%1%
18.4
24%
24%
2%21
.316
%4%
2%22
.66%
1%2%
28.9
30%
2%
Subt
otal
agr
icul
ture
80.6
70%
28%
10%
97.3
21%
14%
9%98
.21%
20%
10%
113.
616
%18
%9%
124.
510
%17
%9%
127.
520
%8%
LGD
60.7
-8%
-9%
7%64
.16%
1%7%
76.5
19%
-4%
8%93
.422
%-3
%8%
103.
911
%-5
%7%
124.
314
%7%
RDCD
4.1
25%
0%0%
4.7
16%
18%
0%3.
8-1
9%-3
%0%
659
%-1
2%0%
10.5
75%
31%
1%11
.139
%1%
MCH
TA4.
713
%0%
1%5.
518
%-4
%1%
4.3
-22%
9%0%
5.5
28%
-3%
0%5.
73%
1%0%
6.7
20%
0%
Subt
otal
rura
l dev
elop
men
t69
.5-5
%-8
%8%
74.3
7%2%
8%84
.614
%-3
%8%
104.
924
%-4
%9%
120.
114
%-2
%8%
142.
216
%8%
MoS
W8
14%
-1%
1%10
.126
%2%
1%12
.625
%-3
%1%
17.7
40%
-8%
1%19
.510
%-5
%1%
20.6
1%1%
MoW
CA11
.167
%0%
1%12
.29%
-10%
1%12
.10%
-10%
1%11
.9-1
%-4
%1%
12.4
4%0%
1%13
.15%
1%
MoF
ood/
a26
79%
21%
3%51
.799
%-9
%6%
41.8
-19%
-72%
4%69
.366
%15
%6%
11.0
NA
NA
1%10
.8-2
1%1%
MoD
M/b
NA
NA
NA
NA
NA
NA
NA
NA
NAN
AN
ANA
NA
NA
NAN
A54
.5N
AN
A4%
58.3
2%3%
Subt
otal
soc
ial s
ecur
ity a
nd w
elfa
re45
.160
%11
%6%
7464
%-8
%9%
66.5
-10%
-62%
7%98
.949
%8%
8%97
.4-2
%-6
%7%
102.
7-1
%6%
MoH
FW su
b-to
tal
52.6
6%-4
%6%
6218
%2%
7%62
.71%
-10%
6%76
.221
%-6
%6%
81.5
7%-8
%6%
93.3
5%6%
Subt
otal
hea
lth a
nd n
utriti
on52
.66%
-4%
6%62
18%
2%7%
62.7
1%-1
0%6%
76.2
21%
-6%
6%81
.57%
-8%
6%93
.35%
6%
TOTA
L FO
OD
SEC
URI
TY24
7.8
25%
6%30
%30
7.5
24%
3%33
%31
21%
-24%
31%
393.
626
%4%
32%
423.
58%
1%29
%46
5.7
11%
27%
Tota
l GoB
exp
endi
ture
(dev
elop
men
t +
non
deve
lopm
ent)
81
7.8
20%
918.
412
%1,
004
9%1,
213
21%
1,44
519
%1,
693
12%
\a: u
ntil F
Y 20
12-1
3, M
oFoo
d in
clud
es a
lso th
e bu
dget
of t
he M
oDM
\b: M
oDM
est
ablis
hed
in F
Y 20
12-1
3
Sour
ce: B
udge
t in
Brie
f, M
oF (htt
p://
ww
w.m
of.g
ov.b
d/en
/)
Plan
ned
Expe
nditu
res i
nclu
de d
evel
opm
ent e
xpen
ditu
res (
expe
nditu
res
unde
r the
Ann
ual D
evel
opm
ent P
rogr
am (A
DP)
but
also
non
-ADP
exp
endi
ture
on
Food
for W
ork
(kin
d or
cas
h) a
nd th
e tr
ansf
er fr
om fo
od sa
le p
roce
eds f
or D
evel
opm
ent a
ctivitie
s, a
s w
ell a
s em
ploy
men
t gen
erati
on p
rogr
ams/
deve
lopm
ent p
rogr
ams fin
ance
d ou
t of
non-
deve
lopm
ent /
reve
nue
budg
et; n
on d
evel
opm
ent e
xpen
ditu
res
incl
ude
reve
nue
expe
nditu
re p
ay a
nd a
llow
ance
s, go
ods a
nd se
rvic
es, int
eres
t pay
men
ts, s
ubsid
ies
and
tran
sfer
s, b
lock
al
locatio
ns),
non-
deve
lopm
ent c
apita
l exp
endi
ture
(e.g
. acq
uisitio
n of
ass
ets,
equi
ty in
vest
men
ts),
see
Budg
et in
Brie
f, M
oF, v
ario
us y
ears
(htt
p://
ww
w.m
of.g
ov.b
d/en
/ind
ex.p
hp?o
ption
=com
_con
tent
&vi
ew= a
rticl
e&id
=115
&Ite
mid
=1);
Tota
l exp
endi
ture
exc
lude
s loa
ns a
nd
adva
nces
(D),
dom
estic
and
fore
ign
debt
, foo
d ac
coun
t ope
ratio
ns (C
) and
stru
ctur
al a
djus
tmen
t exp
endi
ture
s (E
).
FY07
-08
FY08
-09
FY09
-10
FY10
-11
FY12
-13
FY11
-12
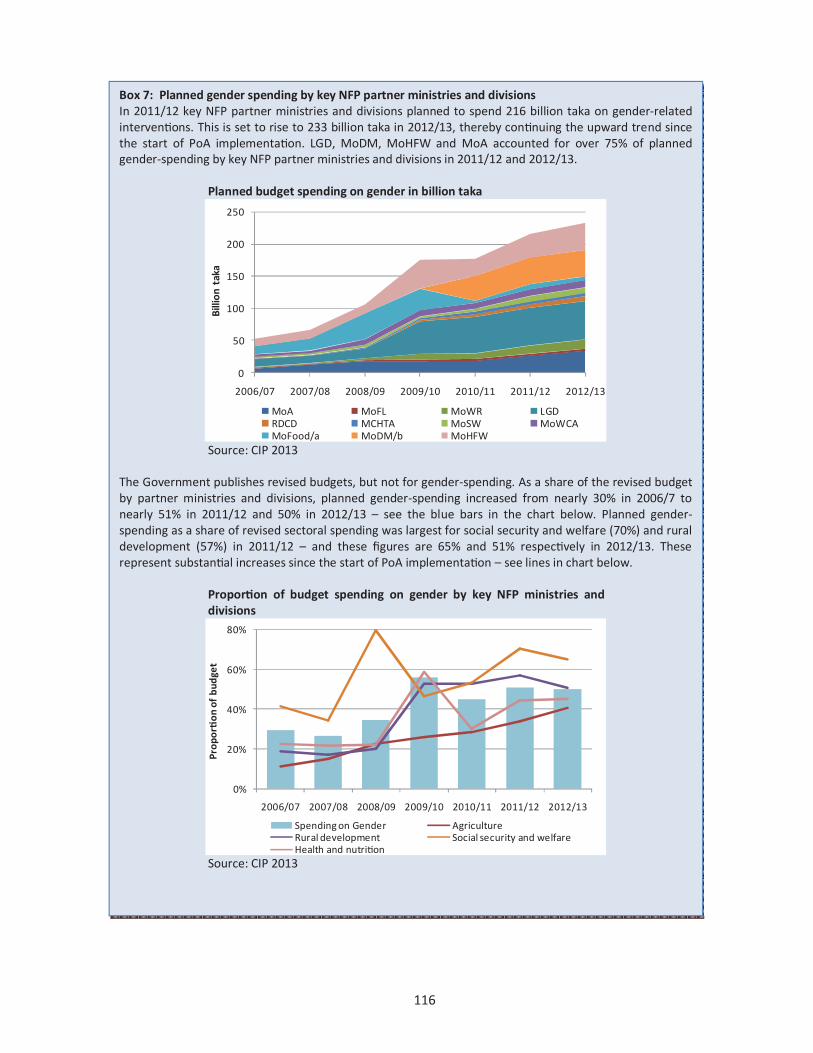
116
Box 7: Planned gender spending by key NFP partner ministries and divisions In 2011/12 key NFP partner ministries and divisions planned to spend 216 billion taka on gender-related interventions. This is set to rise to 233 billion taka in 2012/13, thereby continuing the upward trend since the start of PoA implementation. LGD, MoDM, MoHFW and MoA accounted for over 75% of planned gender-spending by key NFP partner ministries and divisions in 2011/12 and 2012/13.
Planned budget spending on gender in billion taka
0
50
100
150
200
250
2006/07 2007/08 2008/09 2009/10 2010/11 2011/12 2012/13
Billi
on t
aka
MoA MoFL MoWR LGDRDCD MCHTA MoSW MoWCAMoFood/a MoDM/b MoHFW
Source: CIP 2013
The Government publishes revised budgets, but not for gender-spending. As a share of the revised budget by partner ministries and divisions, planned gender-spending increased from nearly 30% in 2006/7 to nearly 51% in 2011/12 and 50% in 2012/13 – see the blue bars in the chart below. Planned gender-spending as a share of revised sectoral spending was largest for social security and welfare (70%) and rural development (57%) in 2011/12 – and these figures are 65% and 51% respectively in 2012/13. These represent substantial increases since the start of PoA implementation – see lines in chart below.
Proportion of budget spending on gender by key NFP ministries and divisions
0%
20%
40%
60%
80%
2006/07 2007/08 2008/09 2009/10 2010/11 2011/12 2012/13
Prop
orti
on o
f bu
dget
Spending on Gender AgricultureRural development Social security and welfareHealth and nutrition
Source: CIP 2013

117
7.2 CIP financing
The CIP budget aggregates a large number of ADP projects into 12 programmes and 40 subprogrammes of investments towards the PoA. For each project, its status (completed, ongoing or pipeline), start date, end date, cost (total, GoB and DP) and annual delivery is recorded. All these characteristics, except project start dates, can change from year to year as a result of changes in project management, and therefore require annual monitoring.
The 2013 version of the CIP financial status (Table 30 and Table 31) includes the annual update for the latest fiscal year for which data is available (2011/12) and also through backward revisions for the previous two fiscal years. Annex 3 explains in detail the changes made.
Backward revision was necessary because the CIP financial data are collated project by project across all relevant government agencies and development partners using specialised formats. Information collated in this way are then cross-checked against previous CIP records and published information from ADP planning and reporting documents (usually published between March and April) at individual project level, with numerous inconsistencies detected and resolved by re-verifying data with the original source. The necessity for backward revision of the CIP financial data may remain in future until a centralised project management system is made accessible in ways that allow it to be tailored for monitoring multi-sectoral investment programmes – similar to what is done currently for public expenditure on poverty and gender.
The CIP project inventory was updated by including newly started projects, and by tracking changes in status of other projects (pipeline, ongoing, completed, or a few projects excluded from the CIP upon reconsideration) – and as part of backward revision, this was done for each year following the start of the CIP. Particular attention was made to avoid double-counting of projects involving – and therefore reported – by more than one agency.
A second step to update the project inventory was to prioritise the pipeline. The pipeline consists of projects whose funding still needs to be secured and projects for which funds have already been pledged but implementation has not yet started. In other words, the pipeline includes both project ideas looking for a sponsor and projects that have already secured financing but are still completing the formulation stage. The pipeline was recalculated maintaining the criteria for prioritization applied in 2010-11, as determined in a participatory manner during extensive consultations. These criteria are applied at the level of subprogramme (not individual projects) as follows:
- TOP priority: 90% of the financial requirement prioritized; - HIGH priority: 70% of the financial requirement prioritized; - MEDIUM priority: 50% of the financial requirement prioritized; - LOWER priority: 40% of the financial requirement prioritized; - These criteria were applied by subprogramme to pipeline projects.
Where required, the exchange rate used was 69.5 taka per USD, the rate used at the start of the CIP, thus allowing comparisons. Other currencies were converted to USD using the rate at the time of disbursement, or the rate provided by the respective DP. Further details are in Annex 3.

118
The CIP investment window runs from 1 July 2010 to 30 June 2015. The cost of projects that started before the investment window, or will end after the investment window, entered the CIP on a pro-rata basis according to their project durations250.
The revised financial data in this monitoring report include backward revised data for the CIP 2011, the CIP 2012, and the CIP 2013, the latter including the most recent financial data. As a result:
- CIP 2011 refers to projects to be implemented during 1 July 2010 and 30 June 2015 using (revised) data as of June 2010.
- CIP 2012 refers to projects to be implemented during 1 July 2010 and 30 June 2015 using (revised) data as of June 2011.
- CIP 2013 refers to projects to be implemented during 1 July 2010 and 30 June 2015 using (newly collected) data as of June 2012.
An inevitable consequence of backward revision of the database is that financial aggregates published in the previous two monitoring reports have been revised too. Revised tables are published in this report, along with updates for 2011/12.
7.3 CIP 2013 budget
As shown in Table 30, the CIP 2013 totals 9.8 billion USD, of which 6.2 billion USD is completed or ongoing, and 3.6 billion USD is in the pipeline of which 2.5 billion is marked as priority. Availability accounts for 56% of the value of financed projects and 65% of the value of pipeline projects – the respective figures of access are 39% and 33%, and for utilisation 6% and 2%, respectively. The GoB has invested into the CIP 1.65 dollars for every dollar invested by DPs, but interestingly for availability this ratio is 2, for access it is 1.62 and for utilisation it is just 0.26. For several years nutrition has been riding high in global development priorities, and has gained concrete recognition amongst policy makers in Bangladesh especially in the recent two years. Priority projects make up 70% of the pipeline, and of total priority projects, 68% is for availability, 29% for access and 3% for utilisation. Table 30: Summary of CIP 2013 budget (as of June 2012, in million USD)
CIP programme Total CIP
Financed (ongoing and completed) Pipeline projectsGoB DPs Total Total Priority
A=D+E B C D E FAvailability 5,790 2,306 1,153 3,459 2,331 1,712
Access 3,560 1,482 913 2,395 1,165 728
Utilization 428 70 272 342 86 64
Total 9,777 3,859 2,338 6,196 3,581 2,505
CIP 2013: changes year-on-year and against baseline Table 31 compares the CIP budget 2013 with CIP budget 2012 to show the year-on-year change, and against the CIP budget 2011 to show changes against the baseline.
___________________________________________________________________________ 250 For example, a project with 20% of its duration overlapping the CIP window was taken to contribute 20% of its project cost to the CIP.

119
Tabl
e 31
: CIP
Bud
get 2
013
and
revi
sed
Budg
et 2
011
and
2012
(in
mill
ion
USD
)
CI
P 20
11
CIP
2012
CI
P 20
13
CIP
prog
ram
me
Tota
l CI
P
Fina
nced
(ong
oing
) Pi
pelin
e pr
ojec
ts
To
tal
CIP
Fina
nced
(ong
oing
and
co
mpl
eted
) Pi
pelin
e pr
ojec
ts
To
tal
CIP
Fina
nced
(ong
oing
and
co
mpl
eted
) Pi
pelin
e pr
ojec
ts
GoB
D
Ps
Tota
l To
tal
Prio
rity
GoB
D
Ps
Tota
l To
tal
Prio
rity
GoB
D
Ps
Tota
l To
tal
Prio
rity
A=D
+E
B C
D
E F
A
=D+E
B
C D
E
F
A=D
+E
B C
D
E F
1 Su
stai
nabl
e an
d di
vers
ified
ag
ricu
ltur
e 68
6 60
76
13
6 55
1 40
4
916
173
75
248
668
543
1,
097
307
154
461
635
523
2 Im
prov
ed w
ater
man
agem
ent
1,65
3 53
3 23
3 76
6 88
7 63
2
1,99
0 1,
303
262
1,56
4 42
6 29
2
1,98
9 1,
433
264
1,69
7 29
2 20
0
3 Im
prov
ed q
ualit
y of
inp
ut a
nd
soil
ferti
lity
610
332
19
351
259
197
1,
106
141
51
193
913
655
2,
124
395
660
1,05
5 1,
069
762
4 Fi
sher
ies
and
aqua
cult
ure
deve
lopm
ent
470
100
29
129
342
219
36
7 12
2 29
15
1 21
6 14
8
374
145
33
178
196
133
5 Li
vest
ock
deve
lopm
ent
760
21
40
61
699
426
19
2 25
38
63
12
9 90
207
26
42
68
139
95
A
vaila
bilit
y 4,
180
1,04
7 39
5 1,
443
2,73
8 1,
877
4,
571
1,76
4 45
4 2,
219
2,35
3 1,
728
5,
790
2,30
6 1,
153
3,45
9 2,
331
1,71
2
6 Im
prov
ed a
cces
s to
mar
kets
1,
318
439
202
641
677
380
1,
711
788
276
1,06
5 64
6 33
6
1,77
2 87
1 29
8 1,
169
603
315
7 Im
plem
entatio
n an
d m
onit
orin
g of
NFP
and
CIP
actio
ns
112
0 10
10
10
2 71
91
0 14
14
77
54
65
0 17
17
47
33
8 En
hanc
ed P
ublic
Foo
d M
anag
emen
t Sy
stem
s 36
8 63
-
63
305
220
26
1 13
5 -
135
126
88
45
1 14
4 30
17
5 27
6 19
9
9 Eff
ectiv
e sa
fety
net
s 1,
009
303
312
615
394
287
1,
129
404
412
816
314
234
1,
272
466
568
1,03
4 23
8 18
1
A
cces
s 2,
807
806
524
1,33
0 1,
477
959
3,
192
1,32
8 70
2 2,
030
1,16
2 71
2
3,56
0 1,
482
913
2,39
5 1,
165
728
10
Com
mun
ity
base
d nu
triti
on
590
11
71
81
508
454
32
7 32
17
8 20
9 11
7 10
6
363
60
251
311
52
47
11
Ori
ent f
ood
and
nutr
ition
pr
ogra
m t
hrou
gh d
ata
22
1 0
1 21
13
17
2 8
11
6 3
22
6
9 15
6
3
12
Food
saf
ety
and
qual
ity
impr
ovem
ent
190
1 12
13
17
8 91
46
4 12
15
30
16
43
4 12
15
27
14
Uti
lizati
on
802
12
82
95
707
557
38
9 38
19
8 23
5 15
4 12
5
428
70
272
342
86
64
To
tal
7,79
0 1,
866
1,00
2 2,
868
4,92
2 3,
393
8,
153
3,13
0 1,
354
4,48
4 3,
669
2,56
5
9,77
7 3,
859
2,33
8 6,
196
3,58
1 2,
505

120
The main findings are:
CIP budget increased by 1,624 million USD between 1 July 2011 and 30 June 2012, with a total increase of 1,987 million USD between 1 July 2010 and 30 June 2012;
Financed CIP budget (ongoing and completed projects) increased by 1,712 million USD between 1 July 2011 and 30 June 2012 to 6,196 million USD, resulting in a total increase of 3,328 million USD between 1 July 2010 and 30 June 2012. The increase recorded in 2013 (1,712 million USD) is slightly above the increase recorded in 2012 (1,616 million USD);
The financial gap (pipeline projects awaiting finance) decreased by 88 million USD between 1 July 2011 and 30 June 2012, leaving 3,581 million USD in the pipeline; however, the financial gap decreased by a much more substantial 1,341 million USD between 1 July 2010 and 30 June 2012. It is important to highlight that the slow decline in pipeline is not due to a slow movement of projects from pipeline to financing, but rather to the formulation of new projects added to the pipeline that almost equated the value of those that moved out of the pipeline - the pipeline is discussed in more detail below;
Prioritized finance gap decreased by 61 million USD between 1 July 2011 and 30 June 2012; and by a total of 889 million USD between 1 July 2010 and 30 June 2012.
Figure 33 compares the total budget - distinguishing between the financed portion and gap to be financed - in the CIP 2011, 2012 and 2013, disaggregating by availability, access and utilisation. The total CIP budget 2013 increased relative to both 2012 and 2011 for availability and access, while for utilization the budget increased relative to 2012 but reduced compared to the baseline. This is mainly the result of the substantial decrease in the gap to be financed (pipeline) registered between the 2011 and 2012 budgets. The financed portion of the CIP budget increased for all three pillars of the NFP. The financial gap (pipeline) shrank for all three pillars but, as noted above, most markedly for utilisation. While in all pillars financing has been substantially scaled-up, under the utilization pillar there has been only limited formulation of new pipeline projects. Changes in the financed part of the CIP Table 32 provides more details on the changes observed in the financed part of the CIP. The total costs of projects completed between 1 July 2010 and 30 June 2012, with pro-rata costs for projects starting before 1 July 2010 (CIP start), added to the total cost of projects
Figure 33: CIP 2011, 2012 and 2013 by NFP objective
-
2,000
4,000
6,000
Ava
ilabi
lity
Acc
ess
Util
izati
on
Ava
ilabi
lity
Acc
ess
Util
izati
on
Ava
ilabi
lity
Acc
ess
Util
izati
on
2011 2012 2013
Mill
ion
USD
GapFinanced
Source: CIP 2013

121 Tabl
e 32
: Evo
luti
on o
f fin
ance
d CI
P bu
dget
(in
mill
ion
USD
)
CIP
prog
ram
me
Fina
nced
bu
dget
in
CIP
2011
Proj
ect
cost
ch
ange
s in
FY
201
1
New
ly
finan
ced
in
FY 2
011
Tota
l ch
ange
in
FY 2
011
Fina
nced
bu
dget
in
CIP
2012
Proj
ect
cost
ch
ange
s in
FY
201
2
New
ly
finan
ced
in
FY 2
012
Tota
l ch
ange
in
FY 2
012
Fina
nced
bu
dget
in
CIP
2013
Tota
l in
crea
se in
fin
anci
ng
betw
een
CI
P 20
11
and
CI
P 20
13
a
b c
d=b+
c e=
a+d
f g
h=f+
g i=
e+h
j
1 Su
stai
nabl
e an
d di
vers
ified
agr
icul
ture
13
5.6
1.4
110.
9 11
2.3
247.
9 28
.4
185.
0 21
3.0
461.
0 32
6.0
2 Im
prov
ed w
ater
man
agem
ent
766.
2 13
3.6
664.
4 79
8.0
1,56
4.2
(0.6
) 13
3.2
133.
0 1,
697.
0 93
1.0
3 Im
prov
ed q
ualit
y of
inp
ut a
nd s
oil f
ertil
ity
351.
1 (2
03.7
) 45
.3
(158
.4)
192.
7 0.
9 86
1.4
862.
0 1,
055.
0 70
4.0
4 Fi
sher
ies
and
aqua
cultu
re d
evel
opm
ent
128.
8 3.
0 18
.9
21.9
15
0.7
(0.0
) 27
.2
27.0
17
8.0
49.0
5 Li
vest
ock
deve
lopm
ent
61.0
(0
.2)
2.2
2.1
63.0
0.
2 4.
9 5.
0 68
.0
7.0
Ava
ilabi
lity
1,44
2.7
(65.
8)
841.
8 77
5.9
2,21
8.6
28.9
1,
211.
7 1,
241.
0 3,
459.
0 2,
017.
0
6 Im
prov
ed a
cces
s to
mar
kets
64
1.3
27.4
39
6.0
423.
4 1,
064.
7 16
.6
87.6
10
4.0
1,16
9.0
528.
0
7 Im
plem
entatio
n an
d m
onit
orin
g of
NFP
and
CIP
acti
ons
10.2
4.
1 -
4.1
14.2
-
3.7
4.0
18.0
8.
0
8 En
hanc
ed P
ublic
Foo
d M
anag
emen
t Sy
stem
s 63
.3
- 72
.2
72.2
13
5.5
(0.0
) 39
.3
39.0
17
5.0
111.
0
9 Eff
ectiv
e sa
fety
net
s 61
5.4
2.5
197.
3 19
9.8
815.
2 16
0.0
59.2
21
9.0
1,03
4.0
419.
0
Acc
ess
1,33
0.1
34.0
66
5.5
699.
5 2,
029.
6 17
6.7
189.
7 36
6.0
2,39
5.0
1,06
5.0
10
Com
mun
ity
base
d nu
triti
on
81.4
(0
.2)
128.
0 12
7.8
209.
1 0.
0 10
2.2
102.
0 31
1.0
230.
0
11
Ori
ent f
ood
and
nutr
ition
pro
gram
thr
ough
dat
a 0.
6 1.
0 9.
1 10
.1
10.7
(0
.8)
5.3
5.0
15.0
15
.0
12
Food
saf
ety
and
qual
ity im
prov
emen
t 12
.9
- 2.
4 2.
4 15
.3
(0.0
) -
(0)
15.0
2.
0
Uti
lizati
on
94.9
0.
8 13
9.5
140.
2 23
5.2
(0.8
) 10
7.5
107.
0 34
2.0
247.
0
Tota
l 2,
868
(31)
1,
647
1,61
6 4,
483
205
1,50
9 1,
713
6,19
7 3,
329
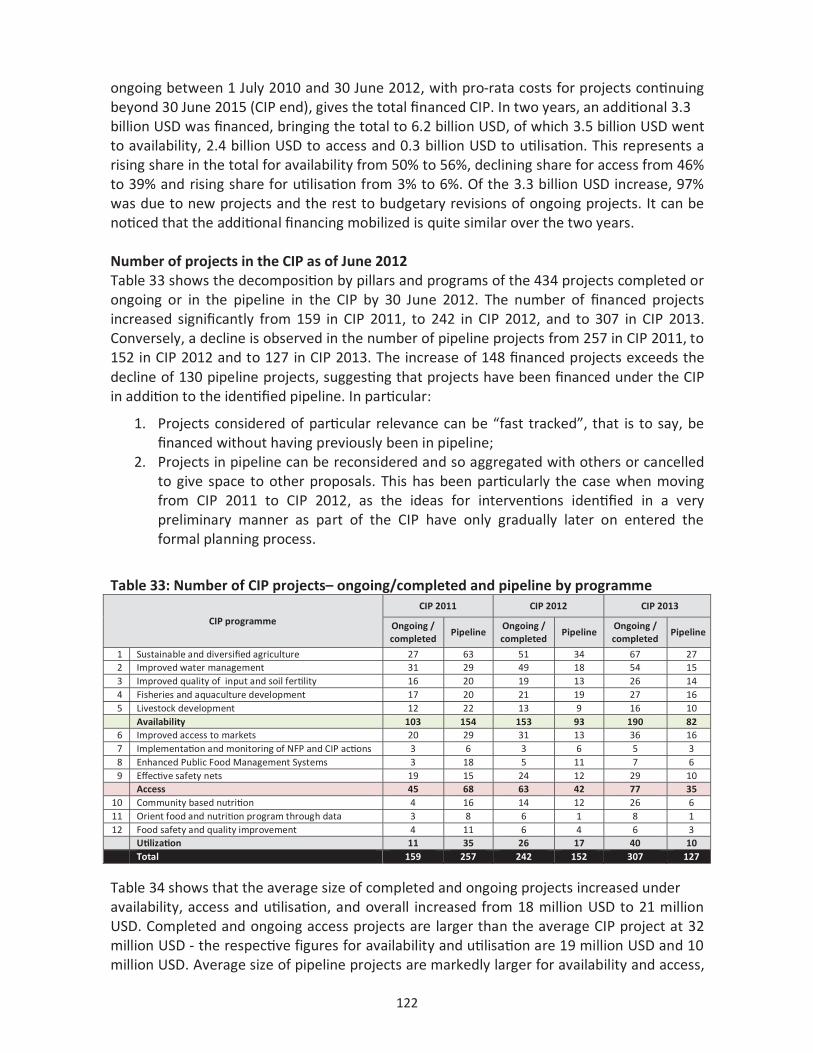
122
ongoing between 1 July 2010 and 30 June 2012, with pro-rata costs for projects continuing beyond 30 June 2015 (CIP end), gives the total financed CIP. In two years, an additional 3.3 billion USD was financed, bringing the total to 6.2 billion USD, of which 3.5 billion USD went to availability, 2.4 billion USD to access and 0.3 billion USD to utilisation. This represents a rising share in the total for availability from 50% to 56%, declining share for access from 46% to 39% and rising share for utilisation from 3% to 6%. Of the 3.3 billion USD increase, 97% was due to new projects and the rest to budgetary revisions of ongoing projects. It can be noticed that the additional financing mobilized is quite similar over the two years. Number of projects in the CIP as of June 2012 Table 33 shows the decomposition by pillars and programs of the 434 projects completed or ongoing or in the pipeline in the CIP by 30 June 2012. The number of financed projects increased significantly from 159 in CIP 2011, to 242 in CIP 2012, and to 307 in CIP 2013. Conversely, a decline is observed in the number of pipeline projects from 257 in CIP 2011, to 152 in CIP 2012 and to 127 in CIP 2013. The increase of 148 financed projects exceeds the decline of 130 pipeline projects, suggesting that projects have been financed under the CIP in addition to the identified pipeline. In particular:
1. Projects considered of particular relevance can be “fast tracked”, that is to say, be financed without having previously been in pipeline;
2. Projects in pipeline can be reconsidered and so aggregated with others or cancelled to give space to other proposals. This has been particularly the case when moving from CIP 2011 to CIP 2012, as the ideas for interventions identified in a very preliminary manner as part of the CIP have only gradually later on entered the formal planning process.
Table 33: Number of CIP projects– ongoing/completed and pipeline by programme
CIP programme
CIP 2011 CIP 2012 CIP 2013
Ongoing / completed
Pipeline Ongoing / completed
Pipeline Ongoing / completed
Pipeline
1 Sustainable and diversified agriculture 27 63 51 34 67 27 2 Improved water management 31 29 49 18 54 15 3 Improved quality of input and soil fertility 16 20 19 13 26 14 4 Fisheries and aquaculture development 17 20 21 19 27 16 5 Livestock development 12 22 13 9 16 10
Availability 103 154 153 93 190 82 6 Improved access to markets 20 29 31 13 36 16 7 Implementation and monitoring of NFP and CIP actions 3 6 3 6 5 3 8 Enhanced Public Food Management Systems 3 18 5 11 7 6 9 Effective safety nets 19 15 24 12 29 10
Access 45 68 63 42 77 35 10 Community based nutrition 4 16 14 12 26 6 11 Orient food and nutrition program through data 3 8 6 1 8 1 12 Food safety and quality improvement 4 11 6 4 6 3
Utilization 11 35 26 17 40 10 Total 159 257 242 152 307 127
Table 34 shows that the average size of completed and ongoing projects increased under availability, access and utilisation, and overall increased from 18 million USD to 21 million USD. Completed and ongoing access projects are larger than the average CIP project at 32 million USD - the respective figures for availability and utilisation are 19 million USD and 10 million USD. Average size of pipeline projects are markedly larger for availability and access,

123
but smaller for utilisation in 2013. The largest increase in average size of ongoing projects is registered between 2012 and 2013 under programme 3, mainly as result of the shift from pipeline to ongoing of a large fertilizer production project. Amongst pipeline projects, the largest increase is recorded under programme 8 mainly as an effect of the formulation of a new project for construction of additional food storage capacity awaiting approval for funding from the World Bank. Table 34: Average CIP project budget– ongoing/completed and pipeline by programme
Managing many small projects in a large investment portfolio requires greater project management, implementation and monitoring capacities than a few large projects in a small investment portfolio, at least at central government level, Figure 34 plots each programme’s average project size against its investment in the CIP, with the vertical line marking the average project size in the whole CIP and the horizontal line marking the CIP budget divided by 12, the average portfolio size. In the top right quadrant, programmes 2, 3, 6 and 9 have larger portfolios composed of larger projects, whilst in the bottom left quadrant, programmes 1, 4, 5, 7, 10, 11 and 12 have smaller portfolios composed of smaller project sizes. Changes in the CIP pipeline (gap to be financed) Table 35 shows the changes in total gap and prioritized gap by programme (details of the prioritisation criteria are in Section 7.2). The financing gap decreased by 27% and the prioritized gap decreased by 26% - with the greatest decrease in the utilisation pillar at 88%. The presence of a large pipeline should not be seen as a sign of difficulty when the number
CIP programme
CIP 2011 CIP 2012 CIP 2013
Ongoing / completed
Pipeline Ongoing / completed
Pipeline Ongoing / completed
Pipeline
1 Sustainable and diversified agriculture 5.0 8.7 4.9 26.0 7.7 30.4 2 Improved water management 24.7 30.6 32.5 24.9 32.0 21.0 3 Improved quality of input and soil fertility 21.9 13.0 10.6 70.4 40.9 77.8 4 Fisheries and aquaculture development 7.6 17.1 7.2 17.7 6.6 19.6 5 Livestock development 5.1 31.8 4.8 14.4 4.3 13.9
Availability 14.0 17.8 14.8 29.2 18.7 32.6 6 Improved access to markets 32.1 23.3 35.0 64.6 33.1 51.1
7 Implementation and monitoring of NFP and CIP actions
3.4 16.9 4.7 12.9 3.6 15.8
8 Enhanced Public Food Management Systems 21.1 16.9 27.1 12.7 25.0 71.6 9 Effective safety nets 32.4 26.2 34.0 29.5 37.0 24.6
Access 29.6 21.7 32.5 33.6 31.9 44.0 10 Community based nutrition 20.3 31.8 17.0 11.1 14.1 8.7 11 Orient food and nutrition program through data 0.2 2.6 2.1 6.5 2.3 6.5 12 Food safety and quality improvement 3.2 16.1 2.6 7.6 2.5 9.1
Utilization 8.6 20.2 10.2 10.0 10.0 8.6 Total 18.0 19.2 18.9 28.3 20.9 33.9
Figure 34: Average project size versus por olio size, by programme
1
2
3
4
5
6
7
8
9
10
11 120
200
400
600
800
1000
1200
1400
1600
1800
0 5 10 15 20 25 30 35 40 45
Inve
stm
ent p
orol
io s
ize,
mill
ion
USD
Average project size, million USD Source: CIP 2013

124
and value of financed projects are increasing. Indeed, this can be interpreted as a sign of positive dynamics of formulation of new initiatives waiting for financing. In other words, the large pipeline in presence of increasing financing can be interpreted as a sign that the CIP is indeed working as a “living document” as originally conceived (CIP, 2011, pp. 5 and 8). On the contrary, a stagnating pipeline in the presence of significant financing can be interpreted as lack of new initiatives, where areas of interventions remain unfinished. With this in mind, the utilisation pipeline could be reviewed to see if there is need to replenish it as it has declined from 707 million USD to 86 million USD, although such a review would need to pay explicit consideration to any potential capacity constraints to implementation. More modest reductions in the pipeline occurred for availability and access pillars, at 15% and 21% respectively. Worth noticing is that most of the reduction occurred during the first year of the CIP; the reduction of pipeline projects for availability was greater for non-priority projects; and within a declining overall pipeline for availability, the pipeline increased for subprogrammes 1 and 3 (the only subprogrammes with increases). Table 35: Changes in CIP pipeline, total and priority projects
CIP programme Pipeline CIP 2011
Change from CIP 2011 to
CIP 2012
Pipeline CIP 2012
Change from CIP 2012 to
CIP 2013
Pipeline CIP 2013
Change from CIP 2011 to CIP
2013 Total Priority Total Priority Total Priority Total Priority Total Priority Total Priority
1 Sustainable and diversified agriculture
551 404 21% 34% 668 543 -5% -4% 635 523 15% 29%
2 Improved water management 887 632 -52% -54% 426 292 -32% -31% 292 200 -67% -68%
3 Improved quality of input and soil fertility
259 197 252% 233% 913 655 17% 16% 1,069 762 312% 287%
4 Fisheries and aquaculture development
342 219 -37% -32% 216 148 -10% -10% 196 133 -43% -39%
5 Livestock development 699 426 -82% -79% 129 90 8% 5% 139 95 -80% -78% Availability 2,738 1,877 -14% -8% 2,353 1,728 -1% -1% 2,331 1,712 -15% -9%
6 Improved access to markets 677 380 -5% -12% 646 336 -7% -6% 603 315 -11% -17%
7 Implementation and monitoring of NFP and CIP actions
102 71 -24% -24% 77 54 -38% -38% 47 33 -53% -53%
8 Enhanced Public Food Management Systems
305 220 -59% -60% 126 88 120% 126% 276 199 -9% -10%
9 Effective safety nets 394 287 -20% -18% 314 234 -24% -23% 238 181 -40% -37% Access 1,477 959 -21% -26% 1,162 712 0% 2% 1,165 728 -21% -24%
10 Community based nutrition 508 454 -77% -77% 117 106 -56% -56% 52 47 -90% -90%
11 Orient food and nutrition program through data
21 13 -69% -75% 6 3 0% 0% 6 3 -69% -75%
12 Food safety and quality improvement
178 91 -83% -82% 30 16 -10% -13% 27 14 -85% -85%
Utilization 707 557 -78% -78% 154 125 -44% -49% 86 64 -88% -89% Total 4,922 3,393 -25% -24% 3,669 2,565 -2% -2% 3,581 2,505 -27% -26%
CIP delivery between July 2010 and June 2012 CIP delivery refers to actual rather than budgeted expenditures. Usually expenditures are unequally spaced throughout a project’s life, and actual project expenditures can differ from budgeted costs. Table 36 shows increased delivery from 750 million USD to 913 million USD, making a cumulative delivery of 1,662 million USD out of the 6,196 million USD financed. This indicates 27% delivery in 40% of elapsed time (two of the five years of the CIP). Access component had a larger year-on-year increase as compared to availability – and then utilisation. Programme 3 (improved quality of input and soil fertility) and programme 10 (community-based nutrition) had large year-on-year increases in delivery, by 66% and 100% respectively. The GoB’s share in total delivery dropped from 63% in CIP 2012 to 57% in CIP

125
Figure 35: Delivery versus additional financing
Source: CIP 2013
2013 – giving a share of 60% of the cumulative delivery against a share of 62% on finance budget. Table 36: Year-on-year and cumulative delivery (million USD)
Comparing cumulative expenditure and additional financing since the start of the CIP, Figure 35 shows that additional resources made available are significantly above the resources utilized. This highlights a need to accelerate implementation and to scale up delivery capacity. Delivery relative to additional resources is smallest in utilisation.
Development Partners’ contribution to the CIP Monitoring of DP contributions allows identification of their ongoing and future commitments in the 12 areas of the CIP. Data collected from DPs on their ongoing and completed commitments should tally with the GoB’s report of DP’s ongoing and completed contributions. Considering the scale of the CIP and its complexity across many ministries, the two totals do tally relatively closely with just a +292 million USD discrepancy in a 9.8 billion USD investment portfolio – and this acts as an important quality assurance for this
CIP programme Delivery in FY 2010/11 Delivery in FY 2011/12 Cumulative Delivery
GoB DPs Total GoB DPs Total GoB DPs Total
1 Sustainable and diversified agriculture 36.9 15.0 51.9 48.0 20.4 68.4 84.9 35.4 120.3
2 Improved water management 125.2 28.6 153.8 118.1 31.3 149.4 243.3 59.9 303.2
3 Improved quality of input and soil fertility
48.0 7.4 55.4 26.5 88.5 115.0 74.6 95.9 170.5
4 Fisheries and aquaculture development
32.7 3.8 36.5 27.6 7.8 35.4 60.4 11.6 72.0
5 Livestock development 6.9 13.7 20.6 7.9 10.3 18.2 14.7 24.1 38.8
Availability 250 69 318 228 158 386 478 227 705
6 Improved access to markets 132.9 113.2 246.0 136.0 80.3 216.3 268.9 193.5 462.4
7 Implementation and monitoring of NFP and CIP actions
0.0 3.3 3.3 - 3.3 3.3 0.0 6.5 6.5
8 Enhanced Public Food Management Systems
29.2 - 29.2 32.2 - 32.2 61.3 - 61.3
9 Effective safety nets 57.4 83.8 141.2 117.7 134.4 252.2 175.2 218.2 393.4
Access 220 200 420 286 218 504 505 418 924
10 Community based nutrition 2.8 6.9 9.7 2.4 13.6 16.1 5.2 20.6 25.8
11 Orient food and nutrition program through data
0.3 0.8 1.1 0.0 0.8 0.8 0.3 1.6 1.8
12 Food safety and quality improvement 0.1 0.7 0.8 1.1 4.5 5.5 1.1 5.2 6.3
Utilization 3 8 12 4 19 22 7 27 34
Total 472 277 750 518 395 913 990 672 1,662

126
monitoring exercise. Reasons for the discrepancy include differences in classifying statuses of projects, exchange rates applied, and the elements included in project costs. DP monitoring is also important for keeping track of their near funding intentions, and their contributions outside the ADP. Similarly to what was done for data from the GoB, the DP data reported in CIP 2011 and CIP 2012 was backward revised for some inconsistencies and omissions to allow valid comparisons through time. There are 258 completed, ongoing and pipeline projects in the DP database as of 30 June 2012. ADP projects Annex 3.6a shows the financing reported by DPs through the ADP in projects that are ongoing or have been completed since the beginning of the CIP. The total contribution by DPs to the CIP is 2.6 billion USD, of which 55% went to the availability pillar, 37% to the access pillar and 8% to the utilisation pillar. China, DFID, World Bank, ADB, JICA and EU were large contributors, greater than 100 million USD – with important differences in the allocation of their investments. For example, China’s contribution of 560 million USD is entirely in programme 3; and of these six DPs, utilisation is a large share of only the EU’s investment portfolio (see Table 37). Table 37: Financing structure of DPs contributing more than 100 M USD through the ADP
CIP programme China DFID
World Bank
ADB JICA EU
Ava
ilabi
lity
1. Sustainable and diversified agriculture
21% 16% 9%
2%
2. Improved water management
22% 21% 23%
3. Improved quality of input and soil fertility 100% 8% 8% 12%
4. Fisheries and aquaculture development 0% 5. Livestock development 18% 4% 2% 1% 0%
sub total Availability 100% 39% 52% 40% 24% 14%
Acc
ess
6. Improved access to markets
7%
60% 69%
7. Implementation and monitoring of NFP and CIP actions
0%
2%
8. Enhanced Public Food Management Systems 7%
9. Effective safety nets
29% 48%
43%
sub total Access 37% 48% 60% 76% 45%
Util
izati
on 10. Community based nutrition 25% 27%
11. Orient food and nutrition program through data
7%
12. Food safety and quality improvement 7%
sub total Utilization 25% 41%
100% 100% 100% 100% 100% 100%
Annex 3.6a shows changes between CIP 2011 and CIP 2013. Funding by DPs to the CIP increased by 1.2 billion USD, of which 397 million USD was committed between 1 July 2010 and 30 June 2011 and 835 million USD was committed between 1 July 2011 and 30 June 2012 – indicating a substantial slowdown in investments.
While 94 DP-funded ADP projects were ongoing at the start of the CIP on 1 July 2010, there were 212 projects ongoing or completed by 30 June 2012. Amongst projects that moved from the pipeline to ongoing status were the China funded ‘Shajalal Fertiliser Project’ under

127
Table 38: DP contributions by programme, ADP, non-ADP and future commitments
CIP programme ADP
Non-ADP
Future
Ava
ilabi
lity
1. Sustainable and diversified agriculture 11% 14% 12%
2. Improved water management 11% 0% 7%
3. Improved quality of input and soil fertility 26% 3% 2%
4. Fisheries and aquaculture development 1% 3% 0%
5. Livestock development 6% 22% 1%
sub total Availability 55% 43% 22%
Acc
ess
6. Improved access to markets 19% 10% 45%
7. Implementation and monitoring of NFP and CIP 1% 3% 1%
8. Enhanced Public Food Management Systems 1% 3% 18%
9. Effective safety nets 16% 23% 4%
sub total Access 37% 39% 68%
Util
izati
on 10. Community based nutrition 8% 18% 8%
11. Orient food and nutrition program through data 0% 0% 0%
12. Food safety and quality improvement 0% 0% 1%
sub total Utilization 8% 18% 9%
100% 100% 100%
Programme 3 with a cost of 560 million USD (China’s entire contribution to the CIP). Two new donor agencies have been added to the CIP DP database in 2013. These were UNICEF which contributed 4 million USD in three projects under Programme 10, and Italy which contributed 3 million USD under Programme 6 with a project called ‘Food Security through Enhanced Agricultural Production Diversified Sources of Income, Value Addition and Marketing in Bangladesh’. Non-ADP projects
In addition, DPs have committed food and nutrition security projects outside the ADP – and therefore, outside the CIP – to a total of 738 million USD – see Annex 3.6b. This means that
78% of DP investments come under the CIP’s coordinatingframework. USAID, DFID and AusAid make up 79% of the non-ADP investments, whilst 9 DPs with ADP projects have no non-ADP projects. Since the CIP began, DP funding outside the ADP increased by 220 million USD, of which 191 million USD was committed between 1 July 2010 and 30 June 2011 and 28 million was committed between 1 July 2011 and 30 June 2012 -
which represents a significant deceleration of DP activities outside the CIP. As of June 2012, 77 non-ADP projects were ongoing or completed and 11 were in the pipeline. Four new non-ADP projects started in the financial year 2011/12. Possible future DP contributions Annex 3.6c shows that future potential contributions to the CIP, indicated as of 1 July 2012 by DPs, totalled 1.6 billion USD, of which 22% was towards availability, 68% towards access and 9 % towards nutrition. If this were to be all channelled through the ADP, which it might not be, it would lead to 17% expansion of the CIP. Major future contributors include ADB, the World Bank, IFAD, USAID and DFID. These agencies are projected to invest more than 100 million USD in the CIP, followed by Spain which might finance an additional 90 million USD. ADB’s possible investments are concentrated on Programme 6. The World Bank considers making major investments under Programmes 8 and 9, and to support with smaller amounts most programmes under the availability component. IFAD will mainly concentrate on Programme 6 and Programme 1, while USAID will invest in a wide range of

128
Table 39: Post-CIP budget through the ADP (million USD)
CIP programme Beyond 30/6/2015
GOB DPs Total
1 Sustainable and diversified agriculture 26.0 27.7 53.8
2 Improved water management 9.1 24.3 33.4
3 Improved quality of input and soil fertility 1.9 6.7 8.6
4 Fisheries and aquaculture development 0.1 1.1 1.2
5 Livestock development 0.3 0.9 1.2
Availability 37.4 60.8 98.2
6 Improved access to markets 8.1 13.8 21.9
7 Implementation and monitoring of NFP and CIP - 0.7 0.7
8 Enhanced Public Food Management Systems - - -
9 Effective safety nets 2.3 37.7 40.0
Access 10.4 52.2 62.6
10 Community based nutrition 10.7 43.5 54.2
11 Orient food and nutrition program through data 1.3 1.9 3.1
12 Food safety and quality improvement - - -
Utilization 12.0 45.4 57.3
Total 59.8 158.3 218.1
Table 38 summarises the preceding discussion on DP financing through the ADP, outside the ADP, and future potential commitments. ADP projects have a relatively greater emphasis on availability, whilst non-ADP projects have relatively greater emphasis on utilisation. Furthermore, if all potential commitments are realised, and they are channelled through the ADP, it would represent a significant adjustment of the CIP portfolio across its programmes. Financing through ADP beyond 2015
The analysis so far refers to the CIP investment window from 1 July 2010 to 30 June 2015, with projects that started before or after these dates included on a pro-rata basis. Table 39 shows that 218 million USD of investments are already committed to ongoing projects continuing beyond 2015, of which 73% has been committed by DPs251. The investment structure post-2015 is 45% for availability, 29% for access and 26% for utilisation – and this is significantly different from the financed CIP up to 2015, at 56%, 39% and 6% respectively (see Section 7.3).
Recommendations from the CIP analysis
Based on the above analysis, a number of recommendations may be made:
Sustain the investments: The pace of increase in CIP investments is felt to be adequate overall, and should continue as it is. Within this, an increase in the GoB share of spending under the utilisation pillar could be considered – currently at just 0.26 USD per 1 USD from DPs.
Stronger integration of cross-cutting themes on nutrition, gender and climate change: Integration is an overarching necessity. Women have key roles spanning across food production, access and utilization. Needs for climate change adaption cut across
___________________________________________________________________________ 251Whilst Table 39 is based on the GoB’s ADP project monitoring data, Annex 3.6a reports the same post-2015 calculation based on project data reported by DPs, at 186 million USD rather than 159 million USD.
programmes under all 3 components of CIP. Spain has partnered with IFAD to jointly fund the Haor Infrastructure and Livelihood Improvement Project under Programmes 1, 2 and 6.

129
availability and access. Nutrition should be integrated into availability and access in addition to the stand-alone interventions under the third pillar of the CIP. The large share of the availability pillar in the CIP, at 59%, underscores the need to ensure more effective mainstreaming of nutrition, gender and climate change. Offering the potential for large spill-over benefits for access and utilisation pillars, often integration is about conception, design and execution, rather than resources and project costs.
Enhance capacity to deliver: Government agencies and DPs need to focus on implementation capacities, particularly for the availability and utilization components.
Focus on CIP areas lagging behind: At subprogramme level, some issues have an absence of projects or very limited resources, which could imply a less balanced investment portfolio. Note however that for some programmes and subprogrammes (e.g. Programmes 7 and 11), a lower level of financing is due to the immaterial nature of the investments considered therein.
Review the formulation of new initiatives: The pipeline for the utilisation pillar is small, and so there is a need to investigate whether the existing financed commitments are sufficient to execute all the PoA interventions related to this pillar, subject to considerations of capacity constraints in order to ensure efficient usage of funds. For availability and access most of the reduction in the pipeline occurred in the first year of the CIP, indicating that project formulation has taken momentum thereafter.
Exploit synergies between DP initiatives inside and outside the ADP: DPs with greater emphasis on utilisation in their portfolios outside the ADP should ensure that lessons and experiences are used, wherever possible, to inform GoB activities in the ADP – this is important especially because funding has been scaled up in that pillar.


131
8. Overall assessment and recommendations
The National Food Policy (NFP) provides strategic guidance for achieving food and nutrition security. The NFP Plan of Action (PoA) translates this into 26 Areas of Intervention (AoI) for the period 2008 to 2015. The Bangladesh Country Investment Plan: A road map towards investment in agriculture, food security and nutrition (CIP) identifies 12 investment programmes to ensure implementation of the PoA. Implementation mechanisms and responsibilities across Government are specified in the NFP PoA Section I.4 and Part II, respectively. 8.1 Overall assessment
Good achievements but recent mixed signals Progress towards the NFP goal is measured using overall undernourishment, child underweight and child stunting. Nearly 17% of the population is undernourished, 36% of children are underweight and 41% of children are stunted. The target set for undernourishment has been met, underweight is on track and stunting might well reach, or come close to, its target. This positive prognosis presumes that what happened in the past will happen in the future at the same rate. Recent data gives mixed signals and reasons for concern about maintaining the rate of progress. Having met its target, undernourishment has risen slowly, albeit with a slight decline towards the monitored year. Other signals on core drivers of change, include slowdowns in agricultural growth, rice-wage growth and forecasted GDP growth, all of which are positive but lower than previous years. This is combined with a lower share of social protection spending in GDP, and planned decline in real spending on safety nets, the main public protection against short-run slowdowns in progress. Anti-poverty spending, a broader concept to social protection, including infrastructure and other pro-growth investments, also has declined as a share of total government spending since 2008/9. Banking on past successes in food availability, with few new successes The growth of agricultural GDP slowed down significantly, but rice import became insignificant, and instability in rice production declined. No significant progress in food production diversification was detected. Development of new crop varieties accelerated; however farmer’s training and capacities has not improved. Growth of cereal production slowed down although rice productivity increased. Irrigated area continued expanding and the share of irrigation on rice production cost share declined. Groundwater table depth reduced in 2011 contrary to the trend. As share of value added to agriculture GDP, the fisheries sector increased by nearly 0.6 percentage points and the livestock sector remained unchanged. Finally, poultry deaths due to avian influenza dropped markedly. Food access: quantity needed with quality, diversity and stability Whilst millions remain unable to access adequate quantities of food, the trend is that more and more people can access greater amounts of food – so that quality, diversity and stability of food supply receive increasing attention. Rural wages have increased, and can buy more rice. Poverty continued to decline until 2010, the last household survey year. Given continued economic growth, poverty has likely declined further in recent years. An Extreme

132
Poverty Manifesto was launched. Food access remains of concern with economic inequality remaining largely unchallenged, a youthful population requiring many more decent jobs, and annual instability in food access for millions. Newer risks have emerged from rapid urbanization, climate change and global economic integration, including migration. The country is increasingly exposed to natural calamities and catastrophes. A comprehensive social protection strategy and its implementation have become priority in order to help organise protective and promotional responses to these challenges. Address stunting and ensure safe and sustainable diets At 41%, the prevalence of stunting of under-5 year olds is very high, despite the significant progress registered over the last two decades. In the poorest fifth of the population, child stunting is at 54%: every other child. Keeping children well-nourished during the first 1000 days prevents irreversible damage that can put at risk longer-term objectives in economic development, poverty reduction and human development. Exclusive breastfeeding in the first six months - one of the key factors in addressing chronic malnutrition- increased from 43% in 2007/8 to 64% in 2011/12, helped in part by 6 months paid maternity leave. Prevalence of anaemia has declined for both mothers and children. Progress in these indicators is expected to have positive impacts on prevalence of stunting in the coming years. Sustaining progress also requires improved maternal nutrition and care, and appropriate and timely infant and young child feeding. The increasing attention to food safety and quality can improve nutrition status for both children and adults. Significant improvement in dietary diversification has been observed especially in urban areas. This needs to be sustained, while the emerging double burden of malnutrition calls for increasing attention to both insufficient and excessive caloric intakes. Despite widespread recognition, progress remains limited in integrating nutrition with agriculture, health, education and other relevant sectors, with too many interventions still implemented in silos. Growing CIP signals sustained financing for food and nutrition security The CIP as of 30 June 2012 was a 9.8 billion USD investment mechanism, having grown by 2.0 billion USD since it was initiated on 1 July 2010, reflecting sustained dynamics in the formulation of new initiatives. The CIP growth was achieved at a time when the overall fiscal space for food and nutrition security investments shrunk to its lowest since the start of PoA implementation, in terms of the share of NFP partner ministries and divisions in the Government’s total budget. Food availability takes 56% of the CIP, food access takes 39% and utilisation takes 6%.
Two years into its five years, additional financing mobilized stands at 3.3 billion USD, of which 1.7 billion USD was mobilized in FY 2011/12. Of the total 9.8 billion CIP 2013 budget, 6.2 billion USD or 63% has already been financed. As of 30 June 2012, there were 307 financed projects, up from 159 projects, totalling 2.9 billion USD at the start. The pipeline reduced by 27% from 4.9 billion USD to 3.6 billion USD.
As a co-financing mechanism, the GoB has invested 1.65 dollars for every dollar invested by DPs – 3,859 million USD from the GoB and 2,338 million USD from DPs.
DPs have invested into food and nutrition security 2,669 million USD inside the CIP compared to 762 million USD outside the CIP, and have indicated the possibility to invest an additional 1,792 million USD.

133
Delivery over the first two years stands at 1,662 million USD. Lowest execution has been in the utilisation component at 10%, followed by the availability component at 20% and the access component at 39%. At these rates, full delivery of funds allocated under the utilization component would require 15 years beyond June 2015; under the availability component 3 years beyond June 2015; whereas the access component could be completed within June 2015.
8.2 Recommendations
NFP Objective 1: Availability Considering the population growth rate, rice productivity should increase by at least 1.5% per year through intensification. Faster yield growth would allow release of land and other resources required for diversification, while preserving self-sufficiency in rice. More fallow land needs to be brought under cultivation in coastal areas through strategies for reducing salinity and technologies for developing saline tolerant varieties. Scaling up agricultural diversification is required through availability and dissemination of improved technologies and extension services. Increased fragmentation of land holding calls for increasing efforts to integrate small and marginal farmers. Climate change adaptation requires investment in agricultural research and extension with an emphasis on development and diffusion of stress resistant crop varieties. Agricultural extension must be improved through strengthening the capacity of organizations that deliver extension services. Irrigation area as well as water use efficiency should be increased, while dependency on groundwater needs to be reduced. Emphasis should be on ensuring adequate feed supply, cross-breeding of imported and local animals, improving the breeding of goat, One Stop Extension Service, supply chain management, development of family level small scale livestock farming, and protecting livestock from various diseases including avian flu, amongst other actions. For conservation of the natural resource base, existing policies need to be updated giving due attention to implementation. Agricultural mechanization is key to cope with the challenges of scarce manpower and labour. Supply of improved seeds in 2011/12 increased for rice, wheat, potato and pulses, while for maize it decreased. A new seed multiplication centre opened in the south. Supply in 2011/12 of urea and MoP decreased. Yields of wheat and maize increased faster than for rice. Agricultural credit distribution expanded by almost 8% in 2011/12 compared to that of 2010/11. Programme 1 on sustainable and diversified agriculture through research and extension
Focus on coordinated, demand-driven and integrated research; Allocate a larger budget for agricultural research; Strengthen human, physical and institutional capacities of key research institutions; Strengthen linkages among research, extension, education and farmers; Strengthen the One Stop Service Centre; Increase farmers’ participation and use of ICT in extension services; Increase the number and efficiency of extension workers.
Programme 2 on improved water management and infrastructure for irrigation purposes
Enhance river water flow by dredging of rivers and signing the Water Share Treaty; Scale up efforts to promote sustainable and efficient use of groundwater for irrigation;

134
Enhance availability and use of surface water; Make available arsenic free groundwater for irrigation; Control flood and river erosion; Reduce salinity and its impact in the South.
Programme 3 on improved quality of inputs
Strengthen production and distribution of quality seed, including strengthening relevant agencies and departments, notably the Seed Certification Agency and BADC, and promoting voluntary certifications; Move from rebalancing fertilizer use to promoting fertilizer quality; Use of Urea Super Granule (USG) and deep placement technology; Improve pest management; Reintroduce crop insurance as a potential risk management strategy.
Programme 4 on fisheries and aquaculture development
Increase productivity; Enhance extension and training; Strengthen the Bangladesh Fisheries Research Institute; Minimize the impacts of shrimp culture on soil quality and biodiversity; Utilize of roadside canals and ditches for increasing fish production; Promote alternate rice-fish farming system; Effectively manage open water fisheries resources.
Programme 5 on livestock development, with a focus on poultry and dairy production
Ensure supply of quality and safe feed and fodder; Diversify supply and monitor private sector production and marketing of vaccines; Initiate properly funded and monitored cross breeding and selective breeding programmes; Improve the productivity of goats; Improve bio-security in poultry farms and the marketing chain; Scale up budget allocation in the livestock sector; Improve marketing of livestock and livestock products and development of the value chain.
NFP Objective 2: Access Safety nets programmes can be further integrated with construction, repair and maintenance of rural transportation infrastructure and other asset creation activities. While there has been notable progress in grain storage facilities, little progress has been made in cold storage facilities at farms and transport vehicles to increase the market value of perishable foods which will ultimately improve farmer prices and farm-gate bargaining power. Transport to bring goods to markets needs to be strengthened, including expanding the road network and its quality, and water transport in Hoars and other areas lacking proper road networks. Further investment is needed in promoting public private partnerships to develop adequate storage, processing and value addition, and waste reduction initiatives. The difference between wages earned by men and women remains quite high. The need for information systems for stock-level monitoring and early warning should be given more attention, especially given the country’s vulnerability to food price

135
hikes. While safety nets are intended to mainly help the poor and vulnerable through food and cash based programmes, errors of inclusion and exclusion, including leakages during transfer of benefits still prevent the very poor from accessing their full entitlement. Despite the strong decline in poverty incidence and also the substantial decline in the depth of poverty, over 47 million people are still poor. There has not been any appreciable improvement in income inequality which restricts the share of the poor in economic growth. Plans are underway with development partners to implement projects that strengthen the administration of safety net programmes, and the overall utilisation of foreign aid to improve public delivery and livelihood outcomes. Programme 6 on improved access to markets, value addition in agriculture and to non- farm incomes
Sustain development and maintenance of rural transportation and marketing infrastructures;
Integrate rural infrastructure development with safety net programmes; Promote the development of cold storage and transportation, allowing duty free
import of required equipment; Develop processing and reducing wastage, also through public-private partnership; Technical skill development and strengthening of mechanization of agricultural
activities; Promote farmers’ organizations in marketing of farm products to ensure
remunerative prices for farmers; Reduce wage differentials between men and women in agriculture.
Programme 7 on strengthened capacities for implementation and monitoring of the NFP and CIP actions
Increase efforts to scale up and strengthen implementation capacities; Increase efforts to institutionalise the annual monitoring process; Enhance aid effectiveness by improving reporting of consistent and accurate data; Strengthen capacities for engaging civil society and community based organisations
in the CIP; Build necessary capacity to increase coordination and quality of food security
information systems. Programme 8 on enhanced public food management
Expedite the construction of enhanced public storage facilities and capacities for safe and effective grain storage;
Ensure incentive producer prices through improved modalities of domestic procurement in a cost-effective manner;
Develop mechanisms for estimating private stock for effective food planning and management;
Introduce country-wide computerized food stock monitoring; Develop an effective early warning food information system.
Programme 9 on institutional development and capacity development for more effective safety nets
Simplify targeting criteria and reduce leakages;

136
Finalise the National Social Protection Strategy; Enhance capacity to implement safety nets; Adjust safety net interventions to enhance resilience to climate change; Enhance safety nets operations during lean seasons; Integrate graduation strategies into safety net programmes; Design social protection interventions to support migration.
NFP Objective 3: Utilization and nutrition Dietary diversification, nutrition behaviour change, infant and young child feeding, and food hygiene and sanitation should remain priorities. Anaemia has reduced, although deficiencies in iron, zinc - and vitamin A at subclinical levels – need to be tackled through food fortification, behaviour change and micronutrient supplementation. Quality assurance of iodized salt and cost reduction require attention, along with universal usage. National nutrition services should be strengthened with community based mechanisms and links with multiple sectors. Harmonization of indicators in nutrition-specific and nutrition-sensitive interventions is necessary. The existing governance and institutional arrangements should be strengthened to maximize coordination across sectors. Improvement of food safety, quality and control requires further attention, and the priorities are an independent Food Safety Authority and the enactment and enforcement of the Food Safety Act. Water and sanitation projects need further scaling up to achieve universal coverage and access. Programme 10 on community based nutrition programmes and services
Scale up the implementation of appropriate infant and young child feeding; Strengthen biodiversity for healthy diets and nutrition; Promote school feeding and nutrition gardens; Ensure implementation of the Breast Milk Substitutes code; Revitalize the Baby Friendly Hospital Initiative (BFHI); Strengthen fortification initiatives and the National Fortification Alliance.
Programme 11 on orienting food and nutrition programmes through data
Maximize impacts on nutrition through appropriate formulation and monitoring of nutrition specific interventions;
Promote convergence among information systems; Institutionalize food security and nutrition surveillance; Use evidence from research for promoting BCC programmes; Promote food based dietary guidelines to inform policies and actions.
Programme 12 on food safety and quality improvement
Activate CODEX focal point and ensure compliance to standards; Finalize and enact the new Food Safety Act, 2013; Seek approval of the National Food Safety and Quality Policy and National Food
Safety Emergency Plan; Promote effective utilization of national food safety testing laboratories; Scale up safe healthy street food vending.

137
Annexes
Annex 1. Comparison of the CIP and PoA output monitoring indicators Annex 2. Composition of Thematic Teams Annex 3. Cost and financing of the CIP - Annex 3.1 CIP Budget Revisions - Annex 3.2 Number and average budget of projects in CIP 2013 by subprogramme - Annex 3.3 CIP budget 2013 and delivery in FY 2011/12 by subprogramme - Annex 3.4 Ongoing and completed CIP projects as of June 2012 - Annex 3.5 Projects in the CIP pipeline as of June 2012 - Annex 3.6 Development partners contributions -

138
Annex 1. Comparison of the CIP and PoA output monitoring indicators This annex shows the correspondence between CIP programmes and NFP PoA Areas of Interventions and the indicators used to monitor performance at output level. A few indicators have been refined, e.g. the coefficient of variation of rice production over the last 10 years has been taken rather than the variability of foodgrain production, or adjusted slightly for data availability reasons.
AVAILABILITY ACCESS
UTILISATION
CIP Programme title and expected aggregate output
Corresponding NFP PoA Area of Intervention
PROGRAMME 1 Sustainable and diversified agriculture through integrated research and extension: Productivity is enhanced, food production is diversified and resilience to climate change is increased through effective generation and propagation of sustainable technical solutions
1.1. Agricultural research and extension: Demand-driven crop and non-crop new technologies developed and disseminated; demand led and pro-poor extension service expanded
1.9. Early Warning Development: Well functioning domestic Early Warning System established and integrated/coordinated with Global Early Warning System
2.1. Agricultural Disaster Management: Enhanced disaster preparedness and post disaster rehabilitation in agricultural systems
CIP Programme title and expected aggregate output
Corresponding NFP PoA Area of Intervention
PROGRAMME 2 Improved Water Management and Infrastructure for Irrigation
1.2 Use and management of water resources: Increased irrigation coverage; Improved delivery and efficient use of safe irrigation
CIP/NFP PoA output proxy indicators
No. of improved new rice varieties developed by GoB agencies No. of new non-rice varieties developed
Wheat Maize
Potato Pulses
Vegetables Edible Oilseeds
Fruits No. of farmers trained on sustainable agriculture practices by DAE
Share of rice on total cropped land, %
HYV rice area as % total rice area (excluding boro hybrid)
Annual change in major crops' production, %
Rice
Wheat
Maize Potato Pulses Brinjal
Pumpkin Beans
Lal Shak Edible Oilseeds
Banana Guava
Mango Pineapple
Jackfruit
CIP/NFP PoA output proxy indicators
% of cropped area under irrigation Water table depth in Northern region, average yearly change over last 20 years (cm/year)
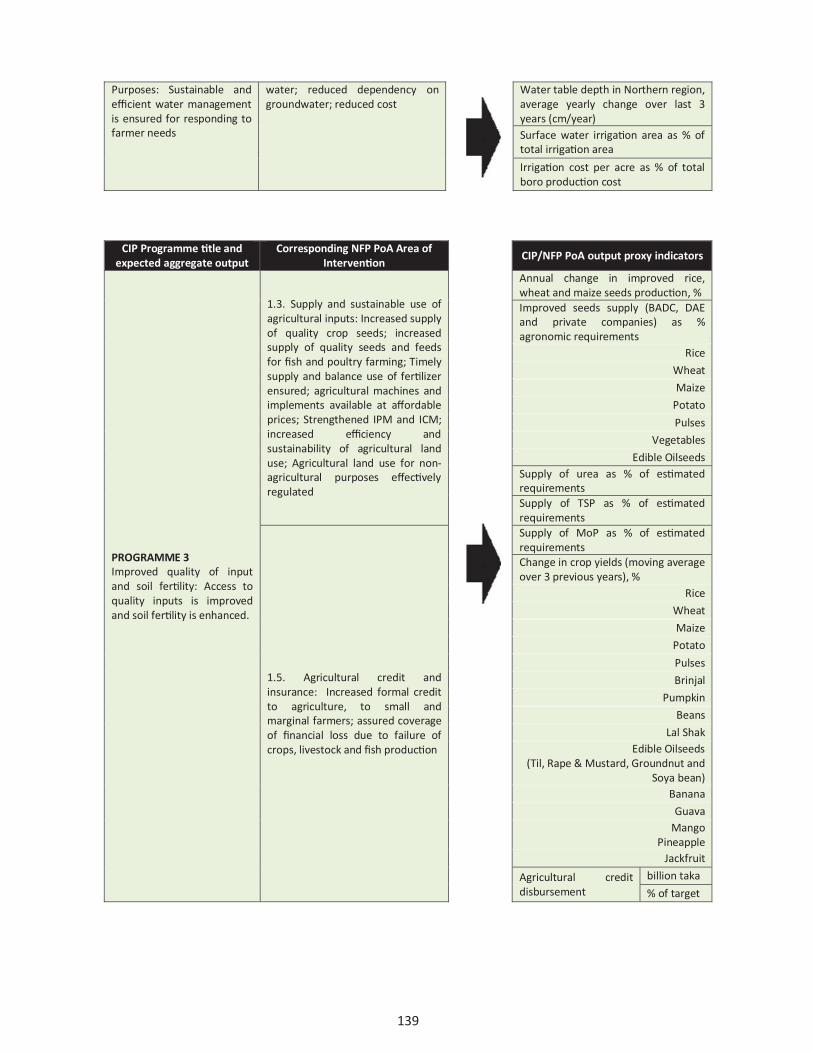
139
Purposes: Sustainable and efficient water management is ensured for responding to farmer needs
water; reduced dependency on groundwater; reduced cost
Water table depth in Northern region, average yearly change over last 3 years (cm/year) Surface water irrigation area as % of total irrigation area
Irrigation cost per acre as % of total boro production cost
CIP Programme title and expected aggregate output
Corresponding NFP PoA Area of Intervention
CIP/NFP PoA output proxy indicators
PROGRAMME 3 Improved quality of input and soil fertility: Access to quality inputs is improved and soil fertility is enhanced.
1.3. Supply and sustainable use of agricultural inputs: Increased supply of quality crop seeds; increased supply of quality seeds and feeds for fish and poultry farming; Timely supply and balance use of fertilizer ensured; agricultural machines and implements available at affordable prices; Strengthened IPM and ICM; increased efficiency and sustainability of agricultural land use; Agricultural land use for non-agricultural purposes effectively regulated
Annual change in improved rice, wheat and maize seeds production, %
Improved seeds supply (BADC, DAE and private companies) as % agronomic requirements
Rice
Wheat
Maize
Potato
Pulses
Vegetables
Edible Oilseeds Supply of urea as % of estimated requirements Supply of TSP as % of estimated requirements
1.5. Agricultural credit and insurance: Increased formal credit to agriculture, to small and marginal farmers; assured coverage of financial loss due to failure of crops, livestock and fish production
Supply of MoP as % of estimated requirements Change in crop yields (moving average over 3 previous years), %
Rice
Wheat
Maize
Potato
Pulses
Brinjal
Pumpkin
Beans
Lal Shak
Edible Oilseeds (Til, Rape & Mustard, Groundnut and
Soya bean) Banana
Guava
Mango
Pineapple Jackfruit
Agricultural credit disbursement
billion taka
% of target
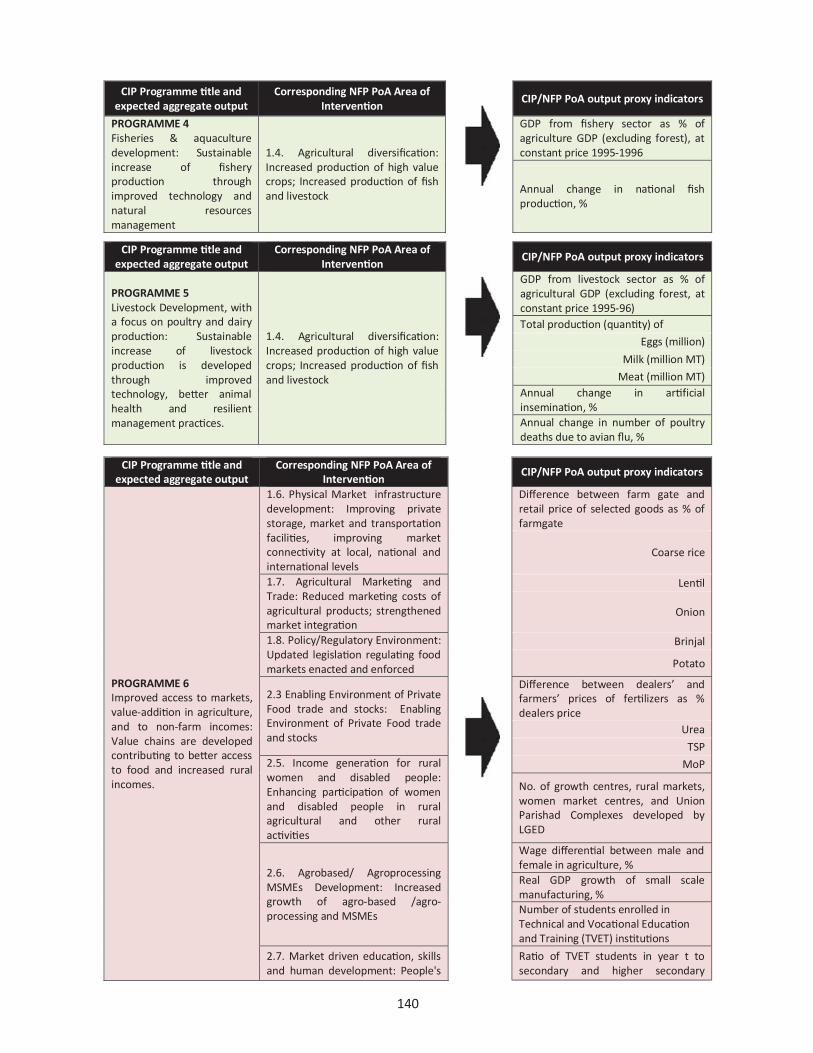
140
CIP Programme title and expected aggregate output
Corresponding NFP PoA Area of Intervention
CIP/NFP PoA output proxy indicators
PROGRAMME 4 Fisheries & aquaculture development: Sustainable increase of fishery production through improved technology and natural resources management
1.4. Agricultural diversification: Increased production of high value crops; Increased production of fish and livestock
GDP from fishery sector as % of agriculture GDP (excluding forest), at constant price 1995-1996
Annual change in national fish production, %
CIP Programme title and
expected aggregate output Corresponding NFP PoA Area of
Intervention CIP/NFP PoA output proxy indicators
PROGRAMME 5 Livestock Development, with a focus on poultry and dairy production: Sustainable increase of livestock production is developed through improved technology, better animal health and resilient management practices.
1.4. Agricultural diversification: Increased production of high value crops; Increased production of fish and livestock
GDP from livestock sector as % of agricultural GDP (excluding forest, at constant price 1995-96) Total production (quantity) of
Eggs (million)
Milk (million MT)
Meat (million MT) Annual change in artificial insemination, % Annual change in number of poultry deaths due to avian flu, %
CIP Programme title and
expected aggregate output Corresponding NFP PoA Area of
Intervention CIP/NFP PoA output proxy indicators
PROGRAMME 6 Improved access to markets, value-addition in agriculture, and to non-farm incomes: Value chains are developed contributing to better access to food and increased rural incomes.
1.6. Physical Market infrastructure development: Improving private storage, market and transportation facilities, improving market connectivity at local, national and international levels
Difference between farm gate and retail price of selected goods as % of farmgate
Coarse rice
1.7. Agricultural Marketing and Trade: Reduced marketing costs of agricultural products; strengthened market integration
Lentil
Onion
1.8. Policy/Regulatory Environment: Updated legislation regulating food markets enacted and enforced
Brinjal
Potato
2.3 Enabling Environment of Private Food trade and stocks: Enabling Environment of Private Food trade and stocks
Difference between dealers’ and farmers’ prices of fertilizers as % dealers price
Urea
TSP 2.5. Income generation for rural women and disabled people: Enhancing participation of women and disabled people in rural agricultural and other rural activities
MoP
No. of growth centres, rural markets, women market centres, and Union Parishad Complexes developed by LGED
2.6. Agrobased/ Agroprocessing MSMEs Development: Increased growth of agro-based /agro-processing and MSMEs
Wage differential between male and female in agriculture, %
Real GDP growth of small scale manufacturing, %
Number of students enrolled inTechnical and Vocational Education and Training (TVET) institutions
2.7. Market driven education, skills and human development: People's
Ratio of TVET students in year t to secondary and higher secondary

141
skills developed based on domestic and international market requirements
school enrolment in year t-1, %
CIP Programme title and expected aggregate output
Corresponding NFP PoA Area of Intervention
CIP/NFP PoA output proxy indicators
PROGRAMME 7 Strengthened capacities for implementation and monitoring of NFP and CIP actions: National capacities to design, implement and monitor NFP PoA and investment operations are strengthened
Additional resources mobilized for CIP, USD
Increase in number and value of ongoing projects
CIP available budget execution performance175
CIP Monitoring Reports produced
CIP Programme title and
expected aggregate output Corresponding NFP PoA Area of
Intervention CIP/NFP PoA output proxy indicators
PROGRAMME 8 Enhanced Public Food Management Systems: Enhanced efficiency and effectiveness of Public Food Management Systems
1.10. Producer price support: Enhanced effectiveness of public procurement system; producer effectively supported during post-harvest
Effective grain storage capacity atclose of fiscal year, thousand MT Average use of effective Governmentfoodgrain storage capacity, % Actual procurement, thousand MT Achievement of public boroprocurement target, %
1.11. Public Stock Management/ Price stabilization: Improved public stock management and enhanced effectiveness of OMS
Wholesale price during the boroprocurement period as % of boro per unit cost production Opening stock as % of budget target Quantity of rice distributed through OMS as % of total domestic supply
CIP Programme title and
expected aggregate output Corresponding NFP PoA Area of
Intervention CIP/NFP PoA output proxy indicators
PROGRAMME 9 Institutional Development and Capacity Development for more effective safety nets: Effectiveness and targeting of social safety net programmes are improved through strengthened institutional capacities to design and implement them.
2.2. Emergency Food Distribution from Public stocks: Improved coverage and effectiveness of emergency distribution programmes
Budgeted coverage of VGF and VGD, million cards
VGF (lakh person)
VGD (lakh person month)
2.4. Effectiveness of targeted food based programmes and safety nets: Improved coverage of vulnerable and disadvantaged people and areas, improved targeting, reduced leakage, enhanced adequacy to vulnerable people's needs
Safety net programmes expenditure as % of GDP Budgeted coverage of employment generation program for the poor, million person month
Quantity of VGF and GR distributed,MT

142
CIP Programme title and
expected aggregate output Corresponding NFP PoA Area of
Intervention CIP/NFP PoA output proxy indicators
PROGRAMME 10 Community based nutrition programmes and services: Nutrition and health are improved at community level through integrated short and long term interventions.
3.2 Balanced and nutritious food for vulnerable people: Increased availability through local production of low cost foods for balanced nutrition; Poor, distressed and vulnerable women and children (including those from monga areas) effectively covered by food based nutrition programmes and growth monitoring and promotion (GMP) programmes.
Proportion of infants under six months exclusively breastfed, %
Poor households raising home gardening and backyard poultry, %
3.3 Nutrition education on dietary diversification: Increased % of women educated in nutrition and primary health care activities through formal and non-formal education; Increased home gardening and backyard poultry raising activities by poor households
% of total dietary energy supply for consumption from:
Cereal
3.4 Food supplementation and fortification: Increased coverage of Vitamin A, coverage and compliance of iron-folate supplementation and coverage of HH with adequately iodized salt; Increased coverage of food items for fortification with important micronutrients, e.g. vitamin A, iron and zinc
Sugar and sweeteners
Oil and oil crops
Roots and tubers
3.7 Women and children health: Improved child and mother health; Improved adolescents’ and women’s general health; Reduced neonatal (NMR); Infant (IMR), child (CMR) and maternal (MMR) mortality rates; Reduced total fertility rate (TFR)
Pulses
Fruits and vegetables
Meat, fish, eggs and milkOthers (includes stimulants, spices,
alcoholic beverages, offal, animal fats, aquatic products and miscellaneous)
3.8 Protection and promotion of breastfeeding and complementary feeding: Strengthened exclusive breastfeeding practices; Expanded practice of breastfeeding; Ensured safe and nutritious complementary feeding; Strengthened baby-friendly hospital initiative; Increased maternity leave, particularly post-partum; BMS Codes respected by the breast milk substitutes marketers
Prevalence of global acute malnutrition among children < 5 years < -2SD, %
Prevalence of severe acute malnutrition among children < 5 years < -3SD, %
Proportion of women ANC coverage of at least 4 visits, %

143
CIP Programme tle and
expected aggregate output Corresponding NFP PoA Area of
Interven on CIP/NFP PoA output proxy indicators
PROGRAMME 11 Orient food and nutrition programmes through data: Effective information supports planning, monitoring and evaluation of food security policies and interventions.
3.1. Long term planning for balanced food: Long-term targets for physical growth established; Standard food intake established for different population groups; integrated plan for a aining standard food intake targets established
Number of mass media activities for Behavioural change communication Desirable Dietary Pa ern established and updated Food Composition Tables updated
Food security and nutrition databases/ surveillance systems
CIP Programme tle and
expected aggregate output Corresponding NFP PoA Area of
Interven on
PROGRAMME 12 Food Safety and Quality Improvement: National food safety control management, and food borne illness surveillance services are strengthened
3.5. Safe drinking water and improved sanitation: Safe water and sanitation facilities available and accessible for all by 2010
No. of compulsory food items standardized by BSTI Prevalence of diarrhoea in under-5 children (in two week period), %
3.6 Safe, quality food supply: Enhanced access to safe and quality food, for domestic consumption and also for international trade
Proportion of population served with safe water supply for domestic use, %
Proportion of population having access to safe drinking water in arsenic affected areas, %

144
Annex 2. Composi on of Thema c Teams
TT
Agency T
hem
atic
Tea
m A
: fo
od a
vail
abil
ity
1 Food Planning & Monitoring Unit (FPMU), Ministry of Food 2 Bangladesh Chemical Industries Corporation (BCIC), Ministry of Industry 3 Ministry of Agriculture4 Ministry of Food 5 Ministry of Fisheries and Livestock6 Ministry of Water Resources 7-8 Food Planning & Monitoring Unit (FPMU), Ministry of Food 9-10 National Food Policy Capacity Strengthening Programme-FAO
Th
emat
ic T
eam
B:
food
acc
ess
11 Food Planning & Monitoring Unit (FPMU), Ministry of Food 12 Ministry of Disaster Management and Relief 13 Ministry of Social Welfare 14 Local Government Division, Ministry of Local Government and Rural Development & Cooperatives 15 Rural Development Cooperatives Division, Ministry of Local Government and Rural Development & Cooperatives 16-17 Food Planning & Monitoring Unit (FPMU), Ministry of Food 18-19 National Food Policy Capacity Strengthening Programme-FAO
Th
emat
ic T
eam
C:
food
uti
liza
tion
20 Food Planning & Monitoring Unit (FPMU), Ministry of Food 21 Ministry of Primary and Mass Education 22 Institute of Public Health and Nutrition, Ministry of Health and Family Welfare 23 Ministry of Women and Children Affairs24 Local Government Division, Ministry of Local Government and Rural Development & Cooperatives 25-26 Food Planning & Monitoring Unit (FPMU), Ministry of Food 27 National Food Policy Capacity Strengthening Programme-FAO
Th
emat
ic T
eam
D:
dat
a ex
chan
ge
28 Food Planning Monitoring Unit (FPMU), Ministry of Food 29 Department of Agriculture Extension, Ministry of Agriculture 30 Bangladesh Bureau of Statistics 31 Department of Agriculture Marketing, Ministry of Agriculture 32 Directorate General of Food, Ministry of Food 33 Implementation Monitoring and Evaluation Division, Ministry of Planning 34 Finance Division, Ministry of Finance 35-36 Food Planning & Monitoring Unit (FPMU), Ministry of Food 37-38 National Food Policy Capacity Strengthening Programme-FAO

145
Annex 3. Cost and financing of the CIP
This annex provides the background data and tables used to estimate the CIP budget. The Term ‘project’ is used to describe ongoing and planned investment interventions. Virtually all funds provided by Government projects are included in the Annual Development Plan. In turn, part of the DP contribution is channelled through projects included in the ADP, while another part is channelled outside of the ADP, e.g. when DPs fund NGOs, international organizations or private contractors directly to implement projects. The CIP relates to projects in the ADP only but as part of the monitoring exercise, funding and commitments provided by the DPs outside the CIP are also monitored based on DPs reporting. This data was used in the analysis presented in Chapter 7.
The annex is divided into six sections: - Annex 3.1 shows the effect of backward revisions to the CIP Budgets. In particular,
Annex 3.1.a shows the effect of backward revisions on the original budget (CIP 2011), while Annex 3.1.b shows the effect of the backward revisions on the CIP budget updated after one year of implementation (CIP 2012). The CIP 2011 is the baseline CIP at its inception. It includes projects to be implemented during 1 July 2010 and 30 June 2015, using data as of 30 June 2010. Annex 3.1.a shows the effect of backward revisions undertaken in 2012 and 2013. The baseline CIP was revised backwards from a total of 7,834 million USD to 8,194 USD in 2012 and to 7,790 million USD in 2013. Annex 3.1.b shows the effect of the backward revisions on the CIP 2012. The CIP 2012 is the CIP budget produced as part of the monitoring exercise conducted in 2012 after completion of the first year of implementation. It includes projects to be implemented during 1 July 2010 and 30 June 2015, using data as of 30 June 2011. Annex 3.1.b shows the effect of backward revisions undertaken in 2013. The CIP 2012 was revised backwards from a total of 9,141 million USD to 8,153 million USD.
- Annex 3.2 shows the priority ranking assigned by the Government to each subprogramme based on the consultation (top, high, medium and low priorities, as explained in Section 7.2) and, separately for ongoing or financed activities and for those still in pipeline, the number of projects and their average budget in CIP 2013.
- Annex 3.3 summarizes by CIP component, programme and subprogrammes, the budget for completed, ongoing and pipeline projects, and total delivery up to June 2012.
- Annex 3.4 lists by CIP component, programme and subprogramme, completed and ongoing projects in the CIP (updating Annex 4.5 of original CIP) providing details on previous and current status of the project, title, implementing agency, beginning and ending period, budget, delivery during the last fiscal year, total delivery and funding DP, if any.
- Annex 3.5 lists by CIP component, programme and subprogramme, projects in the pipeline, their status in previous versions of the CIP, and fund requirements.
- Annex 3.6 summarizes information on financing obtained from the DPs. In particular: Annex 3.6a reports DPs’ financing to completed and ongoing projects through the ADP.
Annex 3.6b reports DPs’ financing to completed and ongoing projects outside the ADP. Annex 3.6c reports DPs’ possible future contribution within or outside the ADP.
For the CIP financing, the monitoring report maintains account a fixed exchange rate of 69.5 BDT per USD, which was prevailing when the CIP was originally formulated. Other currencies (e.g. DPs’ contributions) were converted to USD at the actual rate at the moment of

146
disbursement or at the rate provided by the respective DPs: the respective exchange rates have been made constant, too, and then the amounts converted to BDT. The choice of such exchange rate is further motivated by the fact that the main source for the inventory of projects relevant to CIP is the ADP book, for which an exchange rate is not available, but probably has used an exchange rate prior to the more significant devaluation. Why the CIP budget is revised each year Monitoring investments on food security under the Country Investment Plan is a demanding exercise involving directly and indirectly around 60 governmental agencies and more than 20 development partners, including bilateral and multilateral donors and other funding agencies. With each successive Monitoring Report, FPMU has accessed a wider set of data sources to increase its data collection and accuracy; refined definitions used to classify projects by programme and subprogramme, and by status; strengthened systems for managing data; and improved methodology for analysing and summarising the data. All of these factors have contributed to why the CIP budget has been revised backwards, analysed with some slight differences, and presented with some new features. The purpose of these enhancements has been to enable the monitoring process to provide a picture closer to the complex reality, increase transparency of the process for all stakeholders (within and outside GoB) and support sustainability by simplifying the process. A summary of the revisions produced (for total and pipeline budgets) is provided in Table 40. The table refers by column to the reference year for the budget and by row the year and source in which the revision was published. Table 40: Overview of CIP budget revisions - total and pipeline (million USD)
CIP Budget
Revision
CIP Budget 2011 (details in Annex 3.1.a)
CIP Budget 2012 (details in Annex 3.1.b)
CIP Budget 2013
Total Pipeline Total Pipeline Total Pipeline
CIP (June 2011) 7,834 5,061 - - - -
Monitoring Report 2012 8,194 5,128 9,141 3,906 - -
Monitoring Report 2013 (details in Table 31)
7,790 4,922 8,153 3,669 9,777 3,581
As the monitoring process consolidated, there has been greater use of published GoB sources, especially from the Ministry of Finance, IMED and the Programming Division of the Ministry of Planning. These have been used to complement, validate and support information obtained from direct consultations with key NFP partner ministries and divisions. In the initial stages of CIP formulation, the emphasis was on the identification of new initiatives and plans, but with gradual institutionalization of the CIP process, improved access to data and alignment of Government ministries and divisions to the CIP, the focus has shifted to stock-taking of actual changes in interventions and planning.
147
Some of the main changes are: - The financed budget now reflects only projects that have received funding, and for
which implementation started by 1 July 2010 or for which implementation was completed after 1 July 2010. Previously this category included projects for which a credible pledge had been identified, and now such projects are placed in the pipeline.
- The pipeline reflects more accurately actual identification/formulation of projects. This has been traced back to the original CIP to avoid duplication between preliminary ideas for intervention and actual formulation of initiatives awaiting financing. The pipeline is closely constructed from the Green Pages of the published ADP book and from information received from partner ministries and divisions. Changes in project statuses were tracked closely to identify projects that left the pipeline to become ongoing, and projects that were dropped from the pipeline.
- The budget now reflects more accurately the level of initiative already undertaken (as the financed budget for completed or ongoing projects) and the level of initiatives being formulated and awaiting financing or finalization of the financing agreements (as part of the pipeline).
- Some projects continue after the CIP ends. The CIP budget has been revised to exclude on a pro-rata basis the portion of the budgets of these projects that will be implemented beyond 30 June 2015, the end date of the CIP.
- Few projects relevant to the CIP were previously not included because they were operational since before 1 July 2010, the start of the CIP. More of these have been identified and included, with their project costs taken on a pro-rata basis only for the period of implementation after 1 July 2010.
- A few duplicate projects across pipeline and financed categories and within the pipeline have been identified and eliminated.
- Some projects contribute to several CIP subprogrammes. Previously these projects costs were disaggregated using figurative percentages in the hope of maintaining an accurate picture at subprogramme level. However given a lack of accurate disaggregated project data, this idea has been dropped as it contributes to a risk of duplication and/or inconsistent methodology. Projects are now classified under one single subprogramme, the most relevant to the interventions of the project, and as per indication of the coordinating agency.

148
Ann
ex 3
.1. C
IP b
udge
t rev
isio
ns
Ann
ex 3
.1.a
: Ori
gina
l and
rev
ised
CIP
bud
get 2
011
O
rigin
al C
IP b
udge
t 201
1 Re
vise
d (in
201
2) C
IP b
udge
t 201
1Re
vise
d (in
201
3) C
IP b
udge
t 201
1
CIP
prog
ram
me
Tota
l CI
P Fi
nanc
ed (o
ngoi
ng)
Pi
pelin
e pr
ojec
ts
Tota
lCI
P Fi
nanc
ed (o
ngoi
ng)
Pipe
line
proj
ects
Tota
lCI
P Fi
nanc
ed (o
ngoi
ng)
Pipe
line
proj
ects
GoB
D
Ps
Tota
l To
tal
Prio
rity
G
oB
DPs
To
tal
Tota
l Pr
iori
tyG
oB
DPs
To
tal
Tota
l Pr
iori
tyA
=D+E
B
C D
E
F A
=D+E
BC
DE
FA
=D+E
BC
DE
F
1 Su
stai
nabl
e an
d di
vers
ified
agr
icul
ture
78
1 34
14
3 17
7 60
4 44
1 79
7 62
92
15
4 64
3 46
8 68
6 60
76
13
6 55
1 40
4
2 Im
prov
ed w
ater
man
agem
ent
1,63
0 41
1 36
1 77
2 85
8 58
4 1,
642
424
348
772
870
589
1,65
3 53
3 23
3 76
6 88
7 63
2
3 Im
prov
ed q
ualit
y of
inp
ut a
nd s
oil f
ertil
ity
343
28
83
111
232
170
439
122
82
204
235
172
610
332
19
351
259
197
4 Fi
sher
ies
and
aqua
cultu
re d
evel
opm
ent
393
20
17
37
356
212
456
74
20
94
362
216
470
100
29
129
342
219
5 Li
vest
ock
deve
lopm
ent
835
22
38
60
775
440
842
24
38
62
779
443
760
21
40
61
699
426
Ava
ilabi
lity
3,98
3 51
5 64
3 1,
157
2,82
6 1,
846
4,17
6 70
6 58
0 1,
286
2,88
9 1,
889
4,18
0 1,
047
395
1,44
3 2,
738
1,87
7
6 Im
prov
ed a
cces
s to
mar
kets
1,
258
417
206
623
635
368
1,23
2 40
3 19
5 59
7 63
5 36
8 1,
318
439
202
641
677
380
7 Im
plem
entatio
n an
d m
onit
orin
g of
NFP
an
d CI
P actio
ns
113
- 14
15
99
69
10
8 0
5 6
102
72
112
0 10
10
10
2 71
8 En
hanc
ed P
ublic
Foo
d M
anag
emen
t Sy
stem
s 63
7 14
2 20
2 34
4 29
3 21
2 65
9 16
3 20
2 36
5 29
3 21
2 36
8 63
-
63
305
220
9 Eff
ectiv
e sa
fety
net
s 1,
065
117
476
593
472
341
1,24
2 29
4 47
6 77
0 47
2 34
0 1,
009
303
312
615
394
287
A
cces
s 3,
073
676
899
1,57
5 1,
499
990
3,24
1 86
0 87
8 1,
738
1,50
2 99
3 2,
807
806
524
1,33
0 1,
477
959
10
Com
mun
ity
base
d nu
triti
on
558
5 16
21
53
7 48
0 55
8 5
15
21
537
480
590
11
71
81
508
454
11
Ori
ent f
ood
and
nutr
ition
pr
ogra
mm
esth
roug
h da
ta
33
1 10
11
22
13
33
1
10
11
22
13
22
1 0
1 21
13
12
Food
saf
ety
and
qual
ity
impr
ovem
ent
187
1 8
9 17
8 91
18
6 1
8 9
178
91
190
1 12
13
17
8 91
U
liza
on
778
8 33
41
73
7 58
4 77
8 8
33
41
737
584
802
12
82
95
707
557
Tota
l 7,
834
1,19
8 1,
575
2,77
3 5,
061
3,42
0 8,
194
1,57
4 1,
491
3,06
5 5,
128
3,46
5 7,
790
1,86
6 1,
002
2,86
8 4,
922
3,39
3

149
Ann
ex 3
.1b:
Ori
gina
l and
rev
ised
CIP
bud
get 2
012
(mill
ion
USD
)
Orig
inal
CIP
bud
get 2
012
Revi
sed
CIP
budg
et 2
012
CIP
prog
ram
me
Tota
l CI
P
Fina
nced
(ong
oing
and
co
mpl
eted
) Pi
pelin
e pr
ojec
ts
Tota
l CI
P
Fina
nced
(ong
oing
and
co
mpl
eted
) Pi
pelin
e pr
ojec
ts
GoB
D
Ps
Tota
l To
tal
Prio
rity
G
oB
DPs
To
tal
Tota
l Pr
iori
ty
A=D
+E
B C
D
E F
A=D
+E
B C
D
E F
1 Su
stai
nabl
e an
d di
vers
ified
agr
icul
ture
1,
170
189
110
299
871
720
916
173
75
248
668
543
2 Im
prov
ed w
ater
man
agem
ent
2,06
8 1,
369
354
1,72
3 34
5 23
5 1,
990
1,30
3 26
2 1,
564
426
292
3 Im
prov
ed q
ualit
y of
inp
ut a
nd s
oil f
ertil
ity
1,11
4 14
5 12
4 27
0 84
4 59
9 1,
106
141
51
193
913
655
4 Fi
sher
ies
and
aqua
cultu
re d
evel
opm
ent
466
100
31
131
335
231
367
122
29
151
216
148
5 Li
vest
ock
deve
lopm
ent
297
26
44
70
227
139
192
25
38
63
129
90
A
vaila
bilit
y 5,
115
1,82
9 66
4 2,
493
2,62
2 1,
924
4,57
1 1,
764
454
2,21
9 2,
353
1,72
8
6 Im
prov
ed a
cces
s to
mar
kets
1,
759
781
271
1,05
2 70
6 36
9 1,
711
788
276
1,06
5 64
6 33
6
7 Im
plem
entatio
n an
d m
onit
orin
g of
NFP
and
CIP
acti
ons
10
8 -
5 6
103
72
91
0 14
14
77
54
8 En
hanc
ed P
ublic
Foo
d M
anag
emen
t Sy
stem
s 53
8 15
7 20
2 35
9 17
9 12
6 26
1 13
5 -
135
126
88
9 Eff
ectiv
e sa
fety
net
s 1,
150
454
534
988
162
129
1,12
9 40
4 41
2 81
6 31
4 23
4
A
cces
s 3,
555
1,39
2 1,
012
2,40
5 1,
151
695
3,19
2 1,
328
702
2,03
0 1,
162
712
10
Com
mun
ity
base
d nu
triti
on
384
57
243
300
84
76
327
32
178
209
117
106
11
Ori
ent f
ood
and
nutr
ition
pro
gram
mes
thr
ough
dat
a 30
5
19
24
6 3
17
2 8
11
6 3
12
Food
saf
ety
and
qual
ity im
prov
emen
t 56
4
10
14
42
21
46
4 12
15
30
16
U
liza
on
471
66
272
338
133
100
389
38
198
235
154
125
To
tal
9,14
1 3,
287
1,94
8 5,
235
3,90
6 2,
719
8,15
3 3,
130
1,35
4 4,
484
3,66
9 2,
565
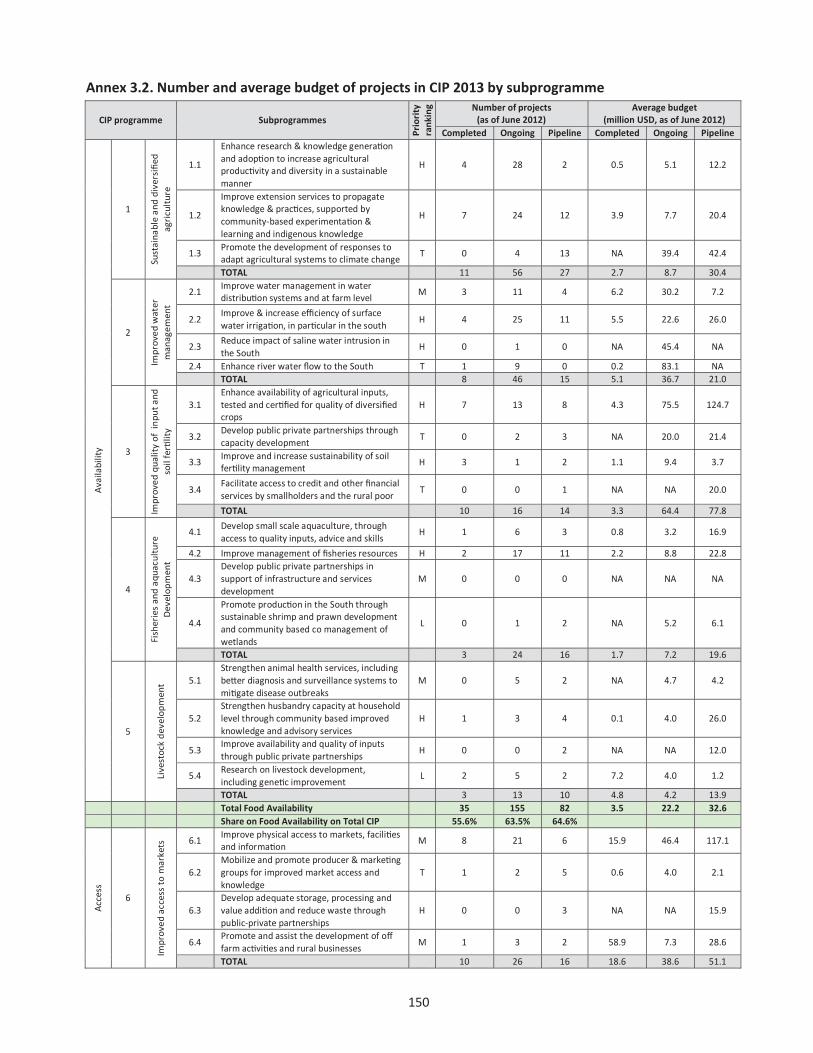
150
Annex 3.2. Number and average budget of projects in CIP 2013 by subprogramme
CIP programme Subprogrammes
Prio
rity
ra
nkin
g Number of projects (as of June 2012)
Average budget (million USD, as of June 2012)
Completed Ongoing Pipeline Completed Ongoing Pipeline
Ava
ilabi
lity
1
Sust
aina
ble
and
dive
rsifi
ed
agri
cult
ure
1.1
Enhance research & knowledge generation and adoption to increase agricultural productivity and diversity in a sustainable manner
H 4 28 2 0.5 5.1 12.2
1.2
Improve extension services to propagate knowledge & practices, supported by community-based experimentation & learning and indigenous knowledge
H 7 24 12 3.9 7.7 20.4
1.3 Promote the development of responses to adapt agricultural systems to climate change
T 0 4 13 NA 39.4 42.4
TOTAL 11 56 27 2.7 8.7 30.4
2
Impr
oved
wat
er
man
agem
ent
2.1 Improve water management in water distribution systems and at farm level
M 3 11 4 6.2 30.2 7.2
2.2 Improve & increase efficiency of surface water irrigation, in particular in the south
H 4 25 11 5.5 22.6 26.0
2.3 Reduce impact of saline water intrusion in the South
H 0 1 0 NA 45.4 NA
2.4 Enhance river water flow to the South T 1 9 0 0.2 83.1 NA TOTAL 8 46 15 5.1 36.7 21.0
3
Impr
oved
qua
lity
of i
nput
and
so
il fe
rtilit
y
3.1 Enhance availability of agricultural inputs, tested and certified for quality of diversified crops
H 7 13 8 4.3 75.5 124.7
3.2 Develop public private partnerships through capacity development
T 0 2 3 NA 20.0 21.4
3.3 Improve and increase sustainability of soil fertility management
H 3 1 2 1.1 9.4 3.7
3.4 Facilitate access to credit and other financial services by smallholders and the rural poor
T 0 0 1 NA NA 20.0
TOTAL 10 16 14 3.3 64.4 77.8
4
Fish
erie
s an
d aq
uacu
ltur
e D
evel
opm
ent
4.1 Develop small scale aquaculture, through access to quality inputs, advice and skills
H 1 6 3 0.8 3.2 16.9
4.2 Improve management of fisheries resources H 2 17 11 2.2 8.8 22.8
4.3 Develop public private partnerships in support of infrastructure and services development
M 0 0 0 NA NA NA
4.4
Promote production in the South through sustainable shrimp and prawn development and community based co management of wetlands
L 0 1 2 NA 5.2 6.1
TOTAL 3 24 16 1.7 7.2 19.6
5
Live
stoc
k de
velo
pmen
t 5.1 Strengthen animal health services, including be er diagnosis and surveillance systems to mitigate disease outbreaks
M 0 5 2 NA 4.7 4.2
5.2 Strengthen husbandry capacity at household level through community based improved knowledge and advisory services
H 1 3 4 0.1 4.0 26.0
5.3 Improve availability and quality of inputs through public private partnerships
H 0 0 2 NA NA 12.0
5.4 Research on livestock development, including genetic improvement
L 2 5 2 7.2 4.0 1.2
TOTAL 3 13 10 4.8 4.2 13.9 Total Food Availability 35 155 82 3.5 22.2 32.6 Share on Food Availability on Total CIP 55.6% 63.5% 64.6%
Acc
ess
6
Impr
oved
acc
ess
to m
arke
ts 6.1
Improve physical access to markets, facilities and information
M 8 21 6 15.9 46.4 117.1
6.2 Mobilize and promote producer & marketing groups for improved market access and knowledge
T 1 2 5 0.6 4.0 2.1
6.3 Develop adequate storage, processing and value addition and reduce waste through public-private partnerships
H 0 0 3 NA NA 15.9
6.4 Promote and assist the development of off farm activities and rural businesses
M 1 3 2 58.9 7.3 28.6
TOTAL 10 26 16 18.6 38.6 51.1
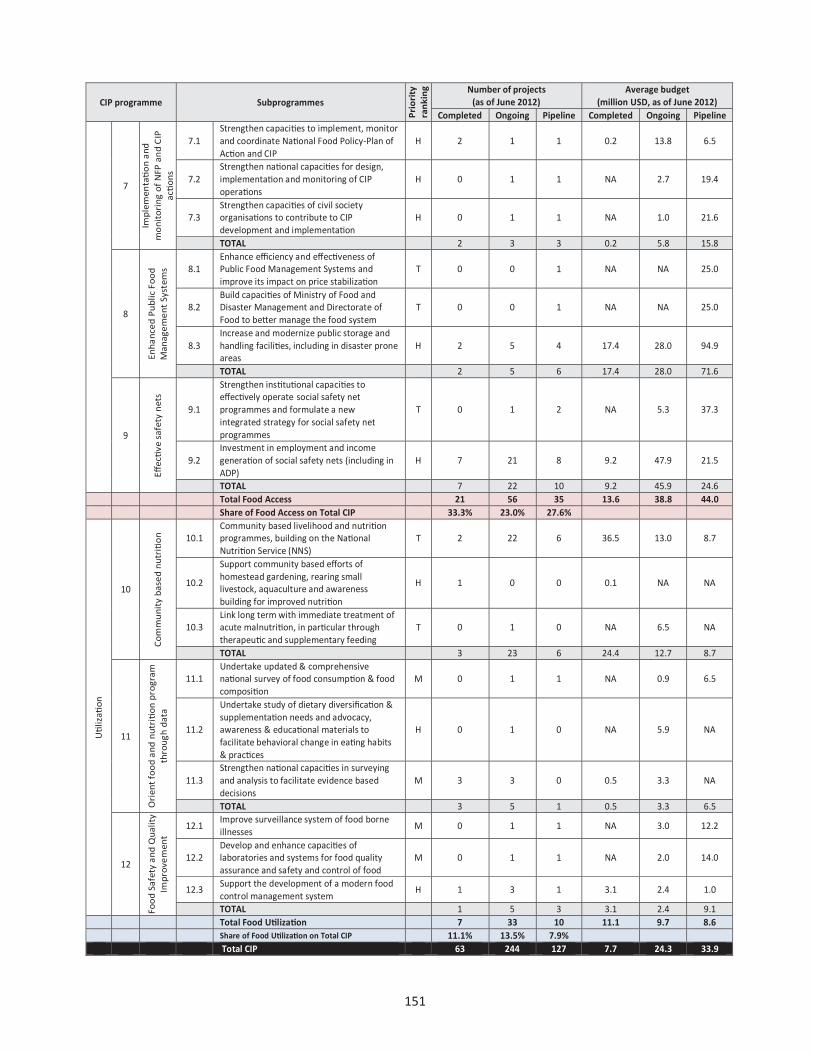
151
CIP programme Subprogrammes
Prio
rity
ra
nkin
g Number of projects (as of June 2012)
Average budget (million USD, as of June 2012)
Completed Ongoing Pipeline Completed Ongoing Pipeline
7
Impl
emen
tati
on
and
mon
itor
ing
of N
FP a
nd C
IP
acti
ons
7.1 Strengthen capacities to implement, monitor and coordinate National Food Policy-Plan of Action and CIP
H 2 1 1 0.2 13.8 6.5
7.2 Strengthen national capacities for design, implementation and monitoring of CIP operations
H 0 1 1 NA 2.7 19.4
7.3 Strengthen capacities of civil society organisations to contribute to CIP development and implementation
H 0 1 1 NA 1.0 21.6
TOTAL 2 3 3 0.2 5.8 15.8
8
Enha
nced
Pub
lic F
ood
Man
agem
ent
Syst
ems 8.1
Enhance efficiency and effectiveness of Public Food Management Systems and improve its impact on price stabilization
T 0 0 1 NA NA 25.0
8.2 Build capacities of Ministry of Food and Disaster Management and Directorate of Food to better manage the food system
T 0 0 1 NA NA 25.0
8.3 Increase and modernize public storage and handling facilities, including in disaster prone areas
H 2 5 4 17.4 28.0 94.9
TOTAL 2 5 6 17.4 28.0 71.6
9
Effecti
ve s
afet
y ne
ts
9.1
Strengthen institutional capacities to effectively operate social safety net programmes and formulate a new integrated strategy for social safety net programmes
T 0 1 2 NA 5.3 37.3
9.2 Investment in employment and income generation of social safety nets (including in ADP)
H 7 21 8 9.2 47.9 21.5
TOTAL 7 22 10 9.2 45.9 24.6 Total Food Access 21 56 35 13.6 38.8 44.0 Share of Food Access on Total CIP 33.3% 23.0% 27.6%
Uti
lizati
on
10
Com
mun
ity
base
d nu
triti
on
10.1 Community based livelihood and nutrition programmes, building on the National Nutrition Service (NNS)
T 2 22 6 36.5 13.0 8.7
10.2
Support community based efforts of homestead gardening, rearing small livestock, aquaculture and awareness building for improved nutrition
H 1 0 0 0.1 NA NA
10.3 Link long term with immediate treatment of acute malnutrition, in particular through therapeutic and supplementary feeding
T 0 1 0 NA 6.5 NA
TOTAL 3 23 6 24.4 12.7 8.7
11
Ori
ent
food
and
nut
riti
on p
rogr
am
thro
ugh
data
11.1 Undertake updated & comprehensive national survey of food consumption & food composition
M 0 1 1 NA 0.9 6.5
11.2
Undertake study of dietary diversification & supplementation needs and advocacy, awareness & educational materials to facilitate behavioral change in eating habits & practices
H 0 1 0 NA 5.9 NA
11.3 Strengthen national capacities in surveying and analysis to facilitate evidence based decisions
M 3 3 0 0.5 3.3 NA
TOTAL 3 5 1 0.5 3.3 6.5
12
Food
Saf
ety
and
Qua
lity
Impr
ovem
ent
12.1 Improve surveillance system of food borne illnesses
M 0 1 1 NA 3.0 12.2
12.2 Develop and enhance capacities of laboratories and systems for food quality assurance and safety and control of food
M 0 1 1 NA 2.0 14.0
12.3 Support the development of a modern food control management system
H 1 3 1 3.1 2.4 1.0
TOTAL 1 5 3 3.1 2.4 9.1 Total Food Utilization 7 33 10 11.1 9.7 8.6 Share of Food Utilization on Total CIP 11.1% 13.5% 7.9% Total CIP 63 244 127 7.7 24.3 33.9

152
Ann
ex 3
.3. C
IP B
udge
t 201
3 an
d de
liver
y in
fisc
al y
ear 2
011/
12 b
y su
bpro
gram
me
Su
bpro
gram
mes
Priority ranking
Tota
l CIP
Co
mpl
eted
and
ong
oing
pro
ject
s Pi
pelin
e pr
ojec
ts
Del
iver
y in
201
1/12
MU
SD
%
GoB
D
Ps
Tota
l %
Re
quir
es
%
Prio
rity
G
OB
DPs
To
tal
Availability
1
Sustainable and diversified agriculture
1.1
Enha
nce
rese
arch
& k
now
ledg
e ge
neratio
n an
d ad
optio
n to
incr
ease
agr
icul
tura
l pr
oductiv
ity a
nd d
iver
sity
in a
sus
tain
able
m
anne
r
H
163.
2 1.
7%
94.5
49
.6
144.
2 2.
3%
19.0
0.
5%
13.3
18
.8
8.6
27.4
1.2
Impr
ove
exte
nsio
n se
rvic
es to
pro
paga
te
know
ledg
e &
pra
ctice
s, s
uppo
rted
by
com
mun
ity-b
ased
exp
erim
entatio
n &
le
arni
ng a
nd in
dige
nous
kno
wle
dge
H
431.
8 4.
4%
158.
0 46
.4
204.
5 3.
3%
227.
3 6.
3%
159.
1 28
.9
10.2
39
.1
1.3
Prom
ote
the
deve
lopm
ent o
f res
pons
es to
ad
apt a
gric
ultu
ral s
yste
ms
to c
limat
e ch
ange
T
501.
8 5.
1%
54.3
58
.4
112.
7 1.
8%
389.
1 10
.9%
35
0.2
0.2
1.6
1.9
13
TOTA
L
1,09
6.8
11.2
%
306.
9 15
4.4
461.
3 7.
4%
635.
4 17
.7%
52
2.6
48.0
20
.4
68.4
2
Improved water management
2.1
Impr
ove
wat
er m
anag
emen
t in
wat
er
dist
ribu
tion
syst
ems
and
at fa
rm le
vel
M
337.
9 3.
5%
203.
3 11
3.8
317.
1 5.
1%
20.8
0.
6%
10.4
29
.9
13.0
42
.9
2.2
Impr
ove
& in
crea
se effi
cien
cy o
f sur
face
w
ater
irri
gatio
n, in
partic
ular
in th
e so
uth
H
857.
5 8.
8%
461.
1 12
5.4
586.
5 9.
5%
270.
9 7.
6%
189.
7 43
.7
18.3
62
.0
2.3
Redu
ce im
pact
of s
alin
e w
ater
intr
usio
n in
th
e So
uth
H
45.4
0.
5%
45.4
-
45.4
0.
7%
- 0.
0%
- 9.
3 -
9.3
2.4
Enha
nce
rive
r wat
er fl
ow to
the
Sout
h T
747.
7 7.
6%
723.
4 24
.4
747.
7 12
.1%
-
0.0%
-
35.2
-
35.2
14
TOTA
L
1,98
8.5
20.3
%
1,43
3.2
263.
5 1,
696.
7 27
.4%
29
1.8
8.1%
20
0.1
118.
1 31
.3
149.
4
3
Improved quality of input and soil fertility
3.1
Enha
nce
avai
labi
lity
of a
gric
ultu
ral i
nput
s,
test
ed a
nd c
ertifi
ed fo
r qu
ality
of d
iver
sifie
d cr
ops
H
1,99
7.7
20.4
%
354.
5 64
7.9
1,00
2.4
16.2
%
995.
3 27
.8%
69
6.7
25.3
85
.6
110.
9
3.2
Dev
elop
pub
lic p
riva
te p
artn
ersh
ips
thro
ugh
capa
city
dev
elop
men
t T
86.4
0.
9%
40.0
-
40.0
0.
6%
46.5
1.
3%
41.8
0.
9 -
0.9
3.3
Impr
ove
and
incr
ease
sus
tain
abili
ty o
f soi
l fe
rtilit
y m
anag
emen
t H
20
.0
0.2%
0.
9 11
.7
12.7
0.
2%
7.4
0.2%
5.
2 0.
4 2.
9 3.
3
3.4
Faci
litat
e ac
cess
to c
redi
t and
oth
er
finan
cial
ser
vice
s by
sm
allh
olde
rs a
nd th
e ru
ral p
oor
T 20
.0
0.2%
-
- -
0.0%
20
.0
0.6%
18
.0
- -
-
15
TOTA
L
2,12
4.1
21.7
%
395.
4 65
9.6
1,05
5.0
17.0
%
1,06
9.1
29.9
%
761.
7 26
.5
88.5
11
5.0
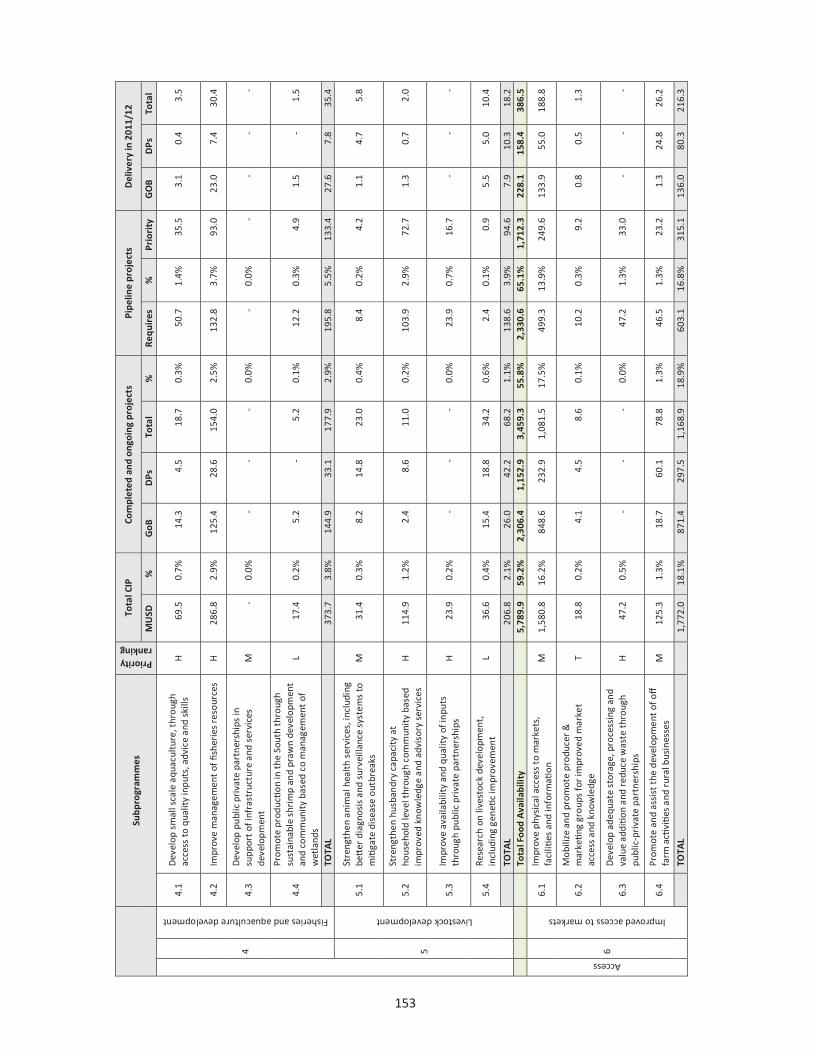
153
Su
bpro
gram
mes
Priority ranking
Tota
l CIP
Co
mpl
eted
and
ong
oing
pro
ject
s Pi
pelin
e pr
ojec
ts
Del
iver
y in
201
1/12
MU
SD
%
GoB
D
Ps
Tota
l %
Re
quir
es
%
Prio
rity
G
OB
D
Ps
Tota
l
4
Fisheries and aquaculture development
4.1
Dev
elop
sm
all s
cale
aqu
acul
ture
, thr
ough
ac
cess
to
qual
ity
inpu
ts, a
dvic
e an
d sk
ills
H
69.5
0.
7%
14.3
4.
5 18
.7
0.3%
50
.7
1.4%
35
.5
3.1
0.4
3.5
4.2
Impr
ove
man
agem
ent
of fi
sher
ies
reso
urce
s H
28
6.8
2.9%
12
5.4
28.6
15
4.0
2.5%
13
2.8
3.7%
93
.0
23.0
7.
4 30
.4
4.3
Dev
elop
pub
lic p
riva
te p
artn
ersh
ips
in
supp
ort
of in
fras
truc
ture
and
ser
vice
s de
velo
pmen
t M
-
0.0%
-
- -
0.0%
-
0.0%
-
- -
-
4.4
Prom
ote
prod
uctio
n in
the
Sou
th t
hrou
gh
sust
aina
ble
shri
mp
and
praw
n de
velo
pmen
t an
d co
mm
unit
y ba
sed
co m
anag
emen
t of
w
etla
nds
L 17
.4
0.2%
5.
2 -
5.2
0.1%
12
.2
0.3%
4.
9 1.
5 -
1.5
16
TOTA
L
373.
7 3.
8%
144.
9 33
.1
177.
9 2.
9%
195.
8 5.
5%
133.
4 27
.6
7.8
35.4
5
Livestock development
5.1
Stre
ngth
en a
nim
al h
ealt
h se
rvic
es, i
nclu
ding
be
tter
dia
gnos
is a
nd s
urve
illan
ce s
yste
ms
to
miti
gate
dis
ease
out
brea
ks
M
31.4
0.
3%
8.2
14.8
23
.0
0.4%
8.
4 0.
2%
4.2
1.1
4.7
5.8
5.2
Stre
ngth
en h
usba
ndry
cap
acit
y at
ho
useh
old
leve
l thr
ough
com
mun
ity
base
d im
prov
ed k
now
ledg
e an
d ad
viso
ry s
ervi
ces
H
114.
9 1.
2%
2.4
8.6
11.0
0.
2%
103.
9 2.
9%
72.7
1.
3 0.
7 2.
0
5.3
Impr
ove
avai
labi
lity
and
qual
ity
of in
puts
th
roug
h pu
blic
pri
vate
par
tner
ship
s H
23
.9
0.2%
-
- -
0.0%
23
.9
0.7%
16
.7
- -
-
5.4
Rese
arch
on
lives
tock
dev
elop
men
t,
incl
udin
g ge
netic
impr
ovem
ent
L 36
.6
0.4%
15
.4
18.8
34
.2
0.6%
2.
4 0.
1%
0.9
5.5
5.0
10.4
17
TOTA
L
206.
8 2.
1%
26.0
42
.2
68.2
1.
1%
138.
6 3.
9%
94.6
7.
9 10
.3
18.2
Tota
l Foo
d A
vaila
bilit
y
5,78
9.9
59.2
%
2,30
6.4
1,15
2.9
3,45
9.3
55.8
%
2,33
0.6
65.1
%
1,71
2.3
228.
1 15
8.4
386.
5
Access
6
Improved access to markets
6.1
Impr
ove
phys
ical
acc
ess
to m
arke
ts,
faci
lities
and
info
rmati
on
M
1,58
0.8
16.2
%
848.
6 23
2.9
1,08
1.5
17.5
%
499.
3 13
.9%
24
9.6
133.
9 55
.0
188.
8
6.2
Mob
ilize
and
pro
mot
e pr
oduc
er &
m
arketin
g gr
oups
for
impr
oved
mar
ket
acce
ss a
nd k
now
ledg
e T
18.8
0.
2%
4.1
4.5
8.6
0.1%
10
.2
0.3%
9.
2 0.
8 0.
5 1.
3
6.3
Dev
elop
ade
quat
e st
orag
e, p
roce
ssin
g an
d va
lue
additio
n an
d re
duce
was
te t
hrou
gh
publ
ic-p
riva
te p
artn
ersh
ips
H
47.2
0.
5%
- -
- 0.
0%
47.2
1.
3%
33.0
-
- -
6.4
Prom
ote
and
assi
st t
he d
evel
opm
ent
of off
fa
rm a
ctivitie
s an
d ru
ral b
usin
esse
s M
12
5.3
1.3%
18
.7
60.1
78
.8
1.3%
46
.5
1.3%
23
.2
1.3
24.8
26
.2
18
TOTA
L
1,77
2.0
18.1
%
871.
4 29
7.5
1,16
8.9
18.9
%
603.
1 16
.8%
31
5.1
136.
0 80
.3
216.
3

154
Su
bpro
gram
mes
Priority ranking
Tota
l CIP
Co
mpl
eted
and
ong
oing
pro
ject
s Pi
pelin
e pr
ojec
ts
Del
iver
y in
201
1/12
MU
SD
%
GoB
D
Ps
Tota
l %
Re
quir
es
%
Prio
rity
G
OB
D
Ps
Tota
l
7
Implementation and monitoring of NFP and CIP
actions
7.1
Stre
ngth
en c
apac
ities
to
impl
emen
t,
mon
itor
and
coo
rdin
ate
Nati
onal
Foo
d Po
licy-
Plan
of A
ction
and
CIP
H
20
.7
0.2%
0.
2 14
.1
14.2
0.
2%
6.5
0.2%
4.
5 -
3.1
3.1
7.2
Stre
ngth
en n
ation
al c
apac
ities
for
desi
gn,
impl
emen
tatio
n an
d m
onit
orin
g of
CIP
op
erati
ons
H
21.6
0.
2%
- 2.
2 2.
2 0.
0%
19.4
0.
5%
13.6
-
0.1
0.1
7.3
Stre
ngth
en c
apac
ities
of c
ivil
soci
ety
orga
nisatio
ns t
o co
ntri
bute
to C
IP
deve
lopm
ent
and
impl
emen
tatio
n
H
22.4
0.
2%
- 0.
8 0.
8 0.
0%
21.6
0.
6%
15.1
-
0.1
0.1
19
TOTA
L
64.6
0.
7%
0.2
17.0
17
.2
0.3%
47
.5
1.3%
33
.2
- 3.
3 3.
3
8
Enhanced Public Food Management Systems
8.1
Enha
nce
effici
ency
and
eff
ectiv
enes
s of
Pu
blic
Foo
d M
anag
emen
t Sy
stem
s an
d im
prov
e it
s im
pact
on
pric
e st
abili
zatio
n T
13.4
0.
1%
- -
- 0.
0%
13.4
0.
4%
12.1
-
- -
8.2
Build
cap
aciti
es o
f Min
istr
y of
Foo
d an
d D
isas
ter
Man
agem
ent
and
Dir
ecto
rate
of
Food
to b
etter
man
age
the
food
sys
tem
T
13.4
0.
1%
- -
- 0.
0%
13.4
0.
4%
12.1
-
- -
8.3
Incr
ease
and
mod
erni
ze p
ublic
sto
rage
and
ha
ndlin
g fa
ciliti
es, i
nclu
ding
in d
isas
ter
pron
e ar
eas
H
424.
2 4.
3%
144.
4 30
.3
174.
7 2.
8%
249.
4 7.
0%
174.
6 32
.2
- 32
.2
20
TOTA
L
451.
0 4.
6%
144.
4 30
.3
174.
7 2.
8%
276.
2 7.
7%
198.
7 32
.2
- 32
.2
9
Effective safety nets
9.1
Stre
ngth
en in
stitutio
nal c
apac
ities
to
effectiv
ely
oper
ate
soci
al s
afet
y ne
t pr
ogra
mm
es a
nd fo
rmul
ate
a ne
w
inte
grat
ed s
trat
egy
for
soci
al s
afet
y ne
t pr
ogra
mm
es
T 80
.0
0.8%
0.
1 5.
2 5.
3 0.
1%
74.7
2.
1%
67.2
0.
0 1.
8 1.
8
9.2
Inve
stm
ent i
n em
ploy
men
t and
inco
me
gene
ratio
n of
soc
ial s
afet
y ne
ts (i
nclu
ding
in
AD
P)
H
1,19
2.2
12.2
%
466.
4 56
2.8
1,02
9.2
16.6
%
163.
0 4.
6%
114.
1 11
7.7
132.
6 25
0.4
21
TOTA
L
1,27
2.1
13.0
%
466.
5 56
8.0
1,03
4.4
16.7
%
237.
7 6.
6%
181.
3 11
7.7
134.
4 25
2.2
To
tal F
ood
Acc
ess
3,
559.
8 36
.4%
1,
482.
4 91
2.8
2,39
5.3
38.7
%
1,16
4.5
32.5
%
728.
4 28
5.9
218.
0 50
3.9
Utilization
10
Community based nutrition
10.1
Co
mm
unit
y ba
sed
livel
ihoo
d an
d nu
triti
on
prog
ram
mes
, bui
ldin
g on
the
Nati
onal
N
utritio
n Se
rvic
e (N
NS)
T
358.
0 3.
7%
58.5
24
7.6
306.
0 4.
9%
52.0
1.
5%
46.8
2.
4 13
.6
16.0
10.2
Supp
ort
com
mun
ity
base
d eff
orts
of
hom
este
ad g
arde
ning
, rea
ring
sm
all
lives
tock
, aqu
acul
ture
and
aw
aren
ess
build
ing
for
impr
oved
nut
ritio
n
H
0.1
0.0%
0.
1 -
0.1
0.0%
-
0.0%
-
- -
-
10.3
Li
nk lo
ng t
erm
wit
h im
med
iate
trea
tmen
t of
ac
ute
mal
nutr
ition
, in
parti
cula
r th
roug
h th
erap
eutic
and
sup
plem
enta
ry fe
edin
g T
5.2
0.1%
1.
7 3.
5 5.
2 0.
1%
- 0.
0%
- -
0.1
0.1
22
TOTA
L
363.
3 3.
7%
60.3
25
1.0
311.
3 5.
0%
52.0
1.
5%
46.8
2.
4 13
.6
16.1
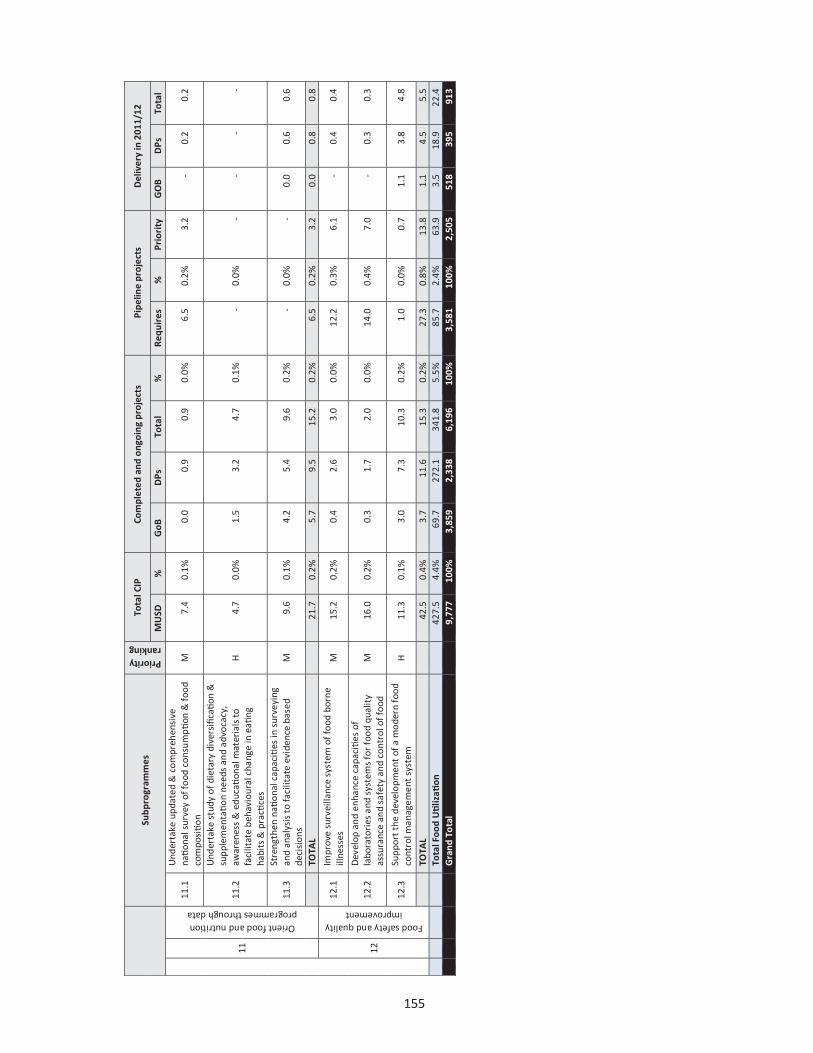
155 Su
bpro
gram
mes
Priority ranking
Tota
l CIP
Co
mpl
eted
and
ong
oing
pro
ject
s Pi
pelin
e pr
ojec
ts
Del
iver
y in
201
1/12
MU
SD
%
GoB
D
Ps
Tota
l %
Re
quir
es
%
Prio
rity
G
OB
D
Ps
Tota
l
11
Orient food and nutrition programmes through data
11.1
U
nder
take
upd
ated
& c
ompr
ehen
sive
na
tiona
l sur
vey
of fo
od c
onsu
mpti
on &
food
co
mpo
sitio
n M
7.
4 0.
1%
0.0
0.9
0.9
0.0%
6.
5 0.
2%
3.2
- 0.
2 0.
2
11.2
Und
erta
ke s
tudy
of d
ieta
ry d
iver
sific
ation
&
supp
lem
entatio
n ne
eds
and
advo
cacy
, aw
aren
ess
& e
ducatio
nal m
ater
ials
to
faci
litat
e be
havi
oura
l cha
nge
in e
ating
ha
bits
& p
racti
ces
H
4.7
0.0%
1.
5 3.
2 4.
7 0.
1%
- 0.
0%
- -
- -
11.3
St
reng
then
nati
onal
cap
aciti
es in
sur
veyi
ng
and
anal
ysis
to
faci
litat
e ev
iden
ce b
ased
de
cisi
ons
M
9.6
0.1%
4.
2 5.
4 9.
6 0.
2%
- 0.
0%
- 0.
0 0.
6 0.
6
23
TOTA
L
21.7
0.
2%
5.7
9.5
15.2
0.
2%
6.5
0.2%
3.
2 0.
0 0.
8 0.
8
12
Food safety and quality improvement
12.1
Im
prov
e su
rvei
llanc
e sy
stem
of f
ood
born
e ill
ness
es
M
15.2
0.
2%
0.4
2.6
3.0
0.0%
12
.2
0.3%
6.
1 -
0.4
0.4
12.2
D
evel
op a
nd e
nhan
ce c
apac
ities
of
labo
rato
ries
and
sys
tem
s fo
r fo
od q
ualit
y as
sura
nce
and
safe
ty a
nd c
ontr
ol o
f foo
d M
16
.0
0.2%
0.
3 1.
7 2.
0 0.
0%
14.0
0.
4%
7.0
- 0.
3 0.
3
12.3
Su
ppor
t th
e de
velo
pmen
t of
a m
oder
n fo
od
cont
rol m
anag
emen
t sy
stem
H
11
.3
0.1%
3.
0 7.
3 10
.3
0.2%
1.
0 0.
0%
0.7
1.1
3.8
4.8
24
TOTA
L
42.5
0.
4%
3.7
11.6
15
.3
0.2%
27
.3
0.8%
13
.8
1.1
4.5
5.5
Tota
l Foo
d Uti
lizati
on
42
7.5
4.4%
69
.7
272.
1 34
1.8
5.5%
85
.7
2.4%
63
.9
3.5
18.9
22
.4
Gra
nd T
ota
l
9,77
7 10
0%
3,85
9 2,
338
6,19
6 10
0%
3,58
1 10
0%
2,50
5 51
8 39
5 91
3
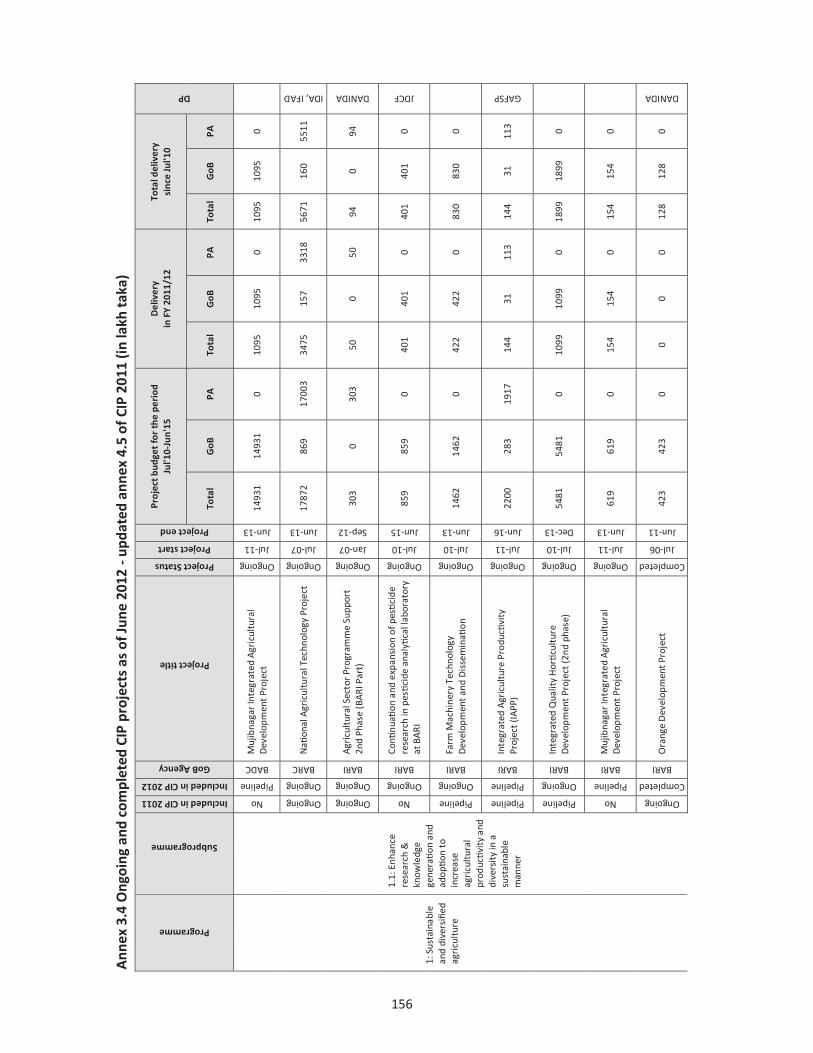
156 Ann
ex 3
.4 O
ngoi
ng a
nd c
ompl
eted
CIP
pro
ject
s as
of J
une
2012
- up
date
d an
nex
4.5
of C
IP 2
011
(in
lakh
taka
) Programme
Subprogramme
Included in CIP 2011 Included in CIP 2012
GoB Agency
Project title
Project Status Project start Project end
Proj
ect b
udge
t fo
r th
e pe
riod
Ju
l'10-
Jun'
15
Del
iver
y
in F
Y 20
11/1
2 To
tal d
eliv
ery
si
nce
Jul'1
0
DP
Tota
l G
oB
PA
Tota
l G
oB
PA
Tota
l G
oB
PA
1: S
usta
inab
le
and
dive
rsifi
ed
agri
cult
ure
1.1:
Enh
ance
re
sear
ch &
kn
owle
dge
gene
ratio
n an
d ad
optio
n to
in
crea
se
agri
cult
ural
pr
oductiv
ity
and
dive
rsit
y in
a
sust
aina
ble
man
ner
No
Pipeline
BADC
Muj
ibna
gar
Inte
grat
ed A
gric
ultu
ral
Dev
elop
men
t Pr
ojec
t
Ongoing
Jul-11
Jun-13
1493
1 14
931
0 10
95
1095
0
1095
10
95
0
Ongoing
Ongoing
BARC
Nati
onal
Agr
icul
tura
l Tec
hnol
ogy
Proj
ect
Ongoing
Jul-07
Jun-13
1787
2 86
9 17
003
3475
15
7 33
18
5671
16
0 55
11
IDA, IFAD
Ongoing
Ongoing
BARI
Agr
icul
tura
l Sec
tor
Prog
ram
me
Supp
ort
2nd
Phas
e (B
ARI
Par
t)
Ongoing
Jan-07
Sep-12
303
0 30
3 50
0
50
94
0 94
DANIDA
No
Ongoing
BARI
Conti
nuati
on a
nd e
xpan
sion
of p
estic
ide
rese
arch
in p
estic
ide
anal
ytica
l lab
orat
ory
at B
AR
I
Ongoing
Jul-10
Jun-15
859
859
0 40
1 40
1 0
401
401
0
JDCF
Pipeline
Ongoing
BARI
Farm
Mac
hine
ry T
echn
olog
y D
evel
opm
ent
and
Dis
sem
inati
on
Ongoing
Jul-10
Jun-13
1462
14
62
0 42
2 42
2 0
830
830
0
Pipeline
Pipeline
BARI
Inte
grat
ed A
gric
ultu
re P
rodu
ctivi
ty
Proj
ect
(IA
PP)
Ongoing
Jul-11
Jun-16 22
00
283
1917
14
4 31
11
3 14
4 31
11
3
GAFSP
Pipeline
Ongoing
BARI
Inte
grat
ed Q
ualit
y H
ortic
ultu
re
Dev
elop
men
t Pr
ojec
t (2
nd p
hase
)
Ongoing
Jul-10
Dec-13
5481
54
81
0 10
99
1099
0
1899
18
99
0
No
Pipeline
BARI
Muj
ibna
gar
Inte
grat
ed A
gric
ultu
ral
Dev
elop
men
t Pr
ojec
t
Ongoing
Jul-11
Jun-13
619
619
0 15
4 15
4 0
154
154
0
Ongoing
Completed
BARI
Ora
nge
Dev
elop
men
t Pr
ojec
t
Completed
Jul-06
Jun-11
423
423
0 0
0 0
128
128
0
DANIDA
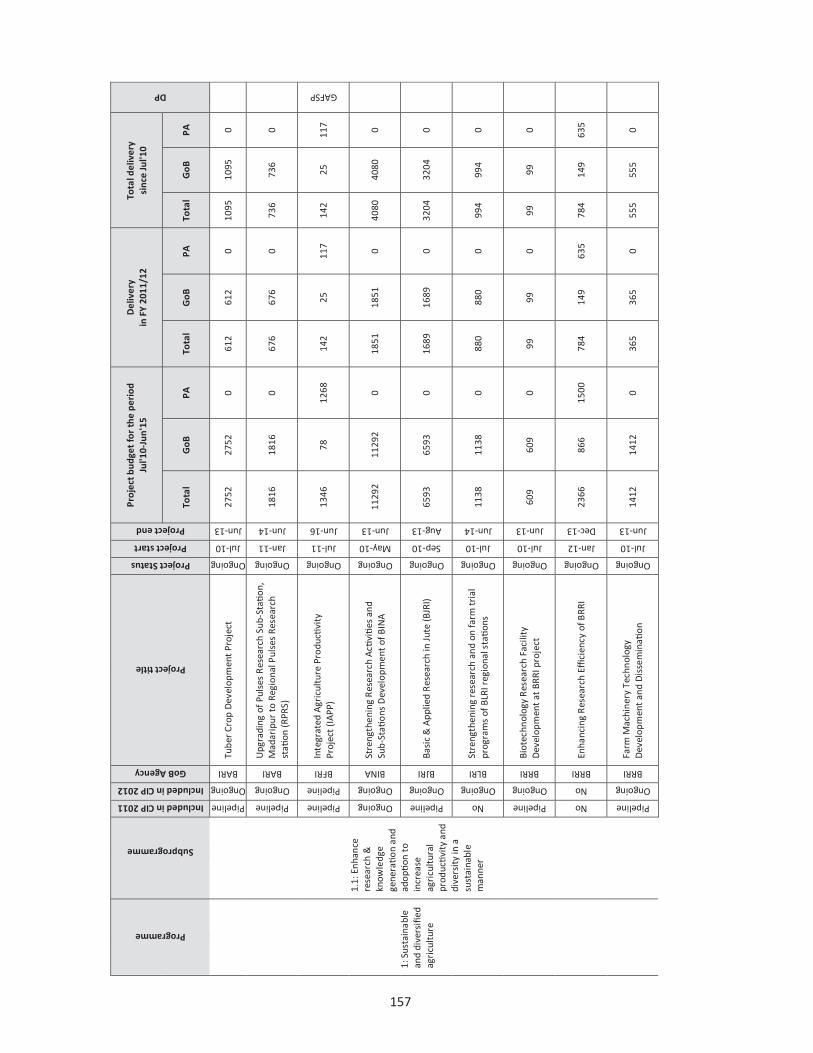
157 Programme
Subprogramme
Included in CIP 2011 Included in CIP 2012
GoB Agency
Project title
Project Status Project start Project end
Proj
ect b
udge
t fo
r th
e pe
riod
Ju
l'10-
Jun'
15
Del
iver
y
in F
Y 20
11/1
2 To
tal d
eliv
ery
si
nce
Jul'1
0
DP
Tota
l G
oB
PA
Tota
l G
oB
PA
Tota
l G
oB
PA
1: S
usta
inab
le
and
dive
rsifi
ed
agri
cult
ure
1.1:
Enh
ance
re
sear
ch &
kn
owle
dge
gene
ratio
n an
d ad
optio
n to
in
crea
se
agri
cult
ural
pr
oductiv
ity
and
dive
rsit
y in
a
sust
aina
ble
man
ner
Pipeline
Ongoing
BARI
Tube
r Cr
op D
evel
opm
ent
Proj
ect
Ongoing
Jul-10
Jun-13
2752
27
52
0 61
2 61
2 0
1095
10
95
0
Pipeline
Ongoing
BARI
Upg
radi
ng o
f Pul
ses
Res
earc
h Su
b-St
ation
, M
adar
ipur
to
Regi
onal
Pul
ses
Rese
arch
st
ation
(RPR
S)
Ongoing
Jan-11
Jun-14
1816
18
16
0 67
6 67
6 0
736
736
0
Pipeline
Pipeline
BFRI
Inte
grat
ed A
gric
ultu
re P
rodu
ctivi
ty
Proj
ect
(IA
PP)
Ongoing
Jul-11
Jun-16
1346
78
12
68
142
25
117
142
25
117
GAFSP
Ongoing
Ongoing
BINA
Stre
ngth
enin
g R
esea
rch
Acti
vitie
s an
d Su
b-St
ation
s D
evel
opm
ent
of B
INA
Ongoing
May-10
Jun-13
1129
2 11
292
0 18
51
1851
0
4080
40
80
0
Pipeline
Ongoing
BJRI
Basi
c &
App
lied
Res
earc
h in
Jute
(BJR
I)
Ongoing
Sep-10
Aug-13
6593
65
93
0 16
89
1689
0
3204
32
04
0
No
Ongoing
BLRI
Stre
ngth
enin
g re
sear
ch a
nd o
n fa
rm tr
ial
prog
ram
s of
BLR
I reg
iona
l statio
ns
Ongoing
Jul-10
Jun-14
1138
11
38
0 88
0 88
0 0
994
994
0
Pipeline
Ongoing
BRRI
Biot
echn
olog
y R
esea
rch
Faci
lity
Dev
elop
men
t at
BRR
I pro
ject
Ongoing
Jul-10
Jun-13 60
9 60
9 0
99
99
0 99
99
0
No
No
BRRI
Enha
ncin
g R
esea
rch
Effici
ency
of B
RRI
Ongoing
Jan-12
Dec-13
2366
86
6 15
00
784
149
635
784
149
635
Pipeline
Ongoing
BRRI
Farm
Mac
hine
ry T
echn
olog
y D
evel
opm
ent
and
Dis
sem
inati
on
Ongoing
Jul-10
Jun-13
1412
14
12
0 36
5 36
5 0
555
555
0

158
Programme
Subprogramme
Included in CIP 2011 Included in CIP 2012
GoB Agency
Project title
Project Status Project start Project end
Proj
ect b
udge
t fo
r th
e pe
riod
Ju
l'10-
Jun'
15
Del
iver
y
in F
Y 20
11/1
2 To
tal d
eliv
ery
si
nce
Jul'1
0
DP
Tota
l G
oB
PA
Tota
l G
oB
PA
Tota
l G
oB
PA
1: S
usta
inab
le
and
dive
rsifi
ed
agri
cult
ure
1.1:
Enh
ance
re
sear
ch &
kn
owle
dge
gene
ratio
n an
d ad
optio
n to
in
crea
se
agri
cult
ural
pr
oductiv
ity
and
dive
rsit
y in
a
sust
aina
ble
man
ner
Pipeline
Pipeline
BRRI
Inte
grat
ed A
gric
ultu
re P
rodu
ctivi
ty
Proj
ect
(IA
PP)
Ongoing
Jul-11
Jun-16
2056
35
9 16
97
195
105
90
195
105
90
GAFSP
Pipeline
Ongoing
BRRI
Min
imiz
ing
Rice
Yie
ld G
ap
Ongoing
Jan-11
Dec-13
252
252
0 99
99
0
124
124
0
Pipeline
Pipeline
BRRI
Muj
ibna
gar
Inte
grat
ed A
gric
ultu
ral
Dev
elop
men
t Pr
ojec
t
Ongoing
Jul-11
Jun-13
958
958
0 14
8 14
8 0
148
148
0
Ongoing
Completed
BRRI
Rese
arch
and
Dev
elop
men
t o
f Hyb
rid
Rice
in B
angl
ades
h
Completed
Jul-05
Jun-11
758
758
0 0
0 0
275
275
0
Ongoing
Ongoing
BRRI
Stre
ngth
enin
g an
d Ca
paci
ty B
uild
ing
of
Biot
echn
olog
y La
bora
tory
in B
RRI
Completed
Jul-07
Jun-12
1004
10
04
0 92
92
0
349
349
0
JDCF
Pipeline
Ongoing
BSRI
Dat
e pa
lm, P
alm
yra
Palm
and
Gol
pata
D
evel
opm
ent
Pilo
t Pr
ojec
t
Ongoing
Nov-10
Dec-13 86
2 86
2 0
224
224
0 28
3 28
3 0
No
Pipeline
BSRI
Pilo
t pro
ject
for
deve
lopm
ent
of
suga
rbee
t cultiv
ation
tech
nolo
gies
in
Bang
lade
sh
Ongoing
Jul-11
Jun-14
345
345
0 98
98
0
98
98
0
Pipeline
Ongoing
BSRI
Stre
ngth
enin
g of
Bio
tech
nolo
gy o
f Su
garc
ane
Rese
arch
Insti
tute
Ongoing
Jul-10
Dec-13
884
884
0 19
1 19
1 0
464
464
0
Pipeline
Ongoing
DAE
Cons
tructio
n of
Agr
icul
tura
lists
In
stitutio
n, B
angl
ades
h C
ompl
ex (K
IB)
Ongoing
Mar-10
Jun-13
7632
76
32
0 19
91
1991
0
2046
20
46
0

159
Programme
Subprogramme
Included in CIP 2011 Included in CIP 2012
GoB Agency
Project title
Project Status Project start Project end
Proj
ect b
udge
t fo
r th
e pe
riod
Ju
l'10-
Jun'
15
Del
iver
y
in F
Y 20
11/1
2 To
tal d
eliv
ery
si
nce
Jul'1
0
DP
Tota
l G
oB
PA
Tota
l G
oB
PA
Tota
l G
oB
PA
Ongoing
Ongoing
DAE
Mod
erni
zatio
n an
d ca
paci
ty u
pgra
ding
pr
ojec
t for
nati
onal
agr
icul
tura
l tra
inin
g in
stitu
te (N
ATA
- for
mer
SER
DI)
Completed
Jul-07
Jun-12
800
800
0 29
5 29
5 0
368
368
0
No
Ongoing
DAE U
pgra
datio
n of
Aar
aiha
jar
Hortic
ultu
re
Cent
er t
o tr
aini
ng in
stitu
te
Ongoing
Jul-10
Jun-13
1778
17
78
0 15
15
0
15
15
0
Ongoing
Ongoing
KGF
Nati
onal
Agr
icul
tura
l Tec
hnol
ogy
Proj
ect
(KG
F)
Ongoing
Jul-07
Dec-13
7991
18
4 78
07
887
69
818
1891
69
18
22
IDA, IFAD
Ongoing
Ongoing
MoA
Nati
onal
Agr
icul
tura
l Tec
hnol
ogy
Proj
ect
(PCU
)
Ongoing
Jul-07
Dec-12
7344
40
9 69
35
849
32
817
1162
60
11
02
IDA, IFAD
No
Ongoing
SRDI
Min
imiz
ing
Rice
Yie
ld G
ap
Ongoing
Jan-11
Dec-13
93
93
0 27
27
0
50
50
0
Sub
tota
l Sub
prog
ram
me
1.1
1062
30
6780
0 38
430
1904
8 13
090
5958
29
573
2008
8 94
85
1: S
usta
inab
le
and
dive
rsifi
ed
agri
cult
ure
1.2:
Impr
ove
exte
nsio
n se
rvic
es
to p
ropa
gate
kn
owle
dge
&
practic
es,
supp
orte
d by
co
mm
unit
y-ba
sed
expe
rim
entatio
n &
lear
ning
and
in
dige
nous
kn
owle
dge
Ongoing
Completed
AIS
Agr
icul
ture
Sec
tor
Prog
ram
me
Supp
ort
Completed
Jul-07
Jun-11 28
9 4
285
0 0
0 0
0 0
DANIDA
Ongoing
Ongoing
AIS
Inte
nsifi
catio
n of
agr
icul
ture
info
rmati
on
serv
ice
in 1
0 ag
ricu
ltur
e re
gion
s
Ongoing
Jul-08
Jun-13
1544
15
44
0 28
8 28
8 0
315
315
0
Pipeline
Pipeline
BADC
Chi
agon
g H
ill T
ract
s In
tegr
ated
A
gric
ultu
ral D
evel
opm
ent
Proj
ect
(Pha
se
III)
Ongoing
Jul-11
Jun-14
2121
21
21
0 20
0 20
0 0
200
200
0
Ongoing
Ongoing
BADC
Gre
ater
Bog
ra-R
angp
ur-D
inaj
pur
Inte
grat
ed A
gric
ultu
ral D
evel
opm
ent
Proj
ect
( Pha
se II
)
Ongoing
Jul-09
Jun-14
2311
23
11
0 58
7 58
7 0
1174
11
74
0

160 Programme
Subprogramme
Included in CIP 2011 Included in CIP 2012
GoB Agency
Project title
Project Status Project start Project end
Proj
ect b
udge
t fo
r th
e pe
riod
Ju
l'10-
Jun'
15
Del
iver
y
in F
Y 20
11/1
2 To
tal d
eliv
ery
si
nce
Jul'1
0
DP
Tota
l G
oB
PA
Tota
l G
oB
PA
Tota
l G
oB
PA
1: S
usta
inab
le
and
dive
rsifi
ed
agri
cult
ure
1.2:
Impr
ove
exte
nsio
n se
rvic
es
to p
ropa
gate
kn
owle
dge
&
practic
es,
supp
orte
d by
co
mm
unit
y-ba
sed
expe
rim
entatio
n &
lear
ning
and
in
dige
nous
kn
owle
dge
Ongoing
Ongoing
BADC
Gre
ater
Khu
lna-
Jess
ore-
Kushtia
In
tegr
ated
Agr
icul
tura
l Dev
elop
men
t Pr
ojec
t ( P
hase
II)
Ongoing
Jul-09
Jun-14
2405
24
05
0 72
4 72
4 0
1622
16
22
0
Ongoing
Ongoing
BADC G
reat
er M
ymen
sing
h-Ta
ngai
l Agr
icul
tura
l D
evel
opm
ent
Proj
ect-
2nd
Phas
e
Ongoing
Jul-09
Jun-14
2334
23
34
0 58
6 58
6 0
1148
11
48
0
Pipeline
Ongoing
BADC
Inte
grat
ed Q
ualit
y H
ortic
ultu
re
Dev
elop
men
t Pr
ojec
t (2
nd p
hase
)
Ongoing
Jul-10
Dec-13
3635
36
35
0 77
4 77
4 0
1277
12
77
0
Pipeline
Ongoing
BADC
Tube
r Cr
op D
evel
opm
ent
Proj
ect
Ongoing
Jul-10
Jun-13
3855
3 38
553
0 24
98
2498
0
4897
48
97
0
Ongoing
Ongoing
DAE
Agr
icul
ture
Sec
tor
Prog
ram
me
Supp
ort
(1st
rev
ised
) Agr
icul
tura
l Ext
ensi
on
Com
pone
nt (A
EC) u
nder
ASP
S-II
Ongoing
Oct-06
Dec-12
1091
8 13
46
9572
22
62
506
1756
31
63
513
2649
DANIDA
Ongoing
Ongoing
DAE
Cons
tructio
n of
Rub
ber
Dam
s in
Sm
all &
m
ediu
m R
iver
for
Incr
easi
ng F
ood
Prod
uctio
n
Ongoing
Jul-09
Jun-14 84
3 84
3 0
261
261
0 36
2 36
2 0
Ongoing
Ongoing
DAE
Enha
ncem
ent
of C
rops
Pro
ducti
on
thro
ugh
Farm
Mec
hani
zatio
n
Completed
Jan-10
Jun-12
1634
1 16
341
0 57
57
5757
0
1325
6 13
256
0
Pipeline
Ongoing
DAE
Farm
Mac
hine
ry T
echn
olog
y D
evel
opm
ent
and
Dis
sem
inati
on
Ongoing
Jul-10
Jun-13
320
320
0 86
86
0
187
187
0

161
Programme
Subprogramme
Included in CIP 2011 Included in CIP 2012
GoB Agency
Project title
Project Status Project start Project end
Proj
ect b
udge
t fo
r th
e pe
riod
Ju
l'10-
Jun'
15
Del
iver
y
in F
Y 20
11/1
2 To
tal d
eliv
ery
si
nce
Jul'1
0
DP
Tota
l G
oB
PA
Tota
l G
oB
PA
Tota
l G
oB
PA
1: S
usta
inab
le
and
dive
rsifi
ed
agri
cult
ure
1.2:
Impr
ove
exte
nsio
n se
rvic
es
to p
ropa
gate
kn
owle
dge
&
practic
es,
supp
orte
d by
co
mm
unit
y-ba
sed
expe
rim
entatio
n &
lear
ning
and
in
dige
nous
kn
owle
dge
Pipeline
Pipeline
DAE
Farm
er’s
Tra
inin
g at
Upa
zila
lev
el fo
r Tr
ansf
er o
f Tec
hnol
ogy
(2nd
Pha
se)
Ongoing
Jul-11
Jun-14
9885
98
85
0 42
9 42
9 0
429
429
0
Ongoing
Ongoing
DAE G
reat
er R
angp
ur A
gric
ultu
re &
Rur
al
Dev
elop
men
t (D
AE-
LGED
)
Completed
Jul-06
Jun-12
4153
85
9 32
94
69
0 69
65
5 20
3 45
2
IDB
Ongoing
Ongoing
DAE
Impr
ovem
ent
of A
TI( q
ualit
y de
velo
pmen
t pr
ojec
t) in
She
rpur
, Gai
band
ha, a
nd
Khul
na (d
oula
tpur
)
Completed
Jul-08
Jun-12
2272
22
72
0 46
8 46
8 0
1375
13
75
0
Ongoing
Completed
DAE
Incr
ease
pro
ducti
on a
nd c
reati
on o
f em
ploy
men
t fo
r ru
ral p
eopl
e th
roug
h en
gine
erin
g te
chno
logy
exp
ansi
on
Completed
Jul-10
Jun-11
5777
57
77
0 0
0 0
605
605
0
No
Ongoing
DAE
Inte
grat
ed A
gric
ultu
ral E
xten
sion
A
ppro
ach
for
pov
erty
Red
uctio
n an
d Fo
od S
ecur
ity
Proj
ect
(IA
PRFP
)
Ongoing
Jul-11
Jun-13
1500
15
00
0 58
8 58
8 0
588
588
0
Pipeline
Pipeline
DAE
Inte
grat
ed A
gric
ultu
re P
rodu
ctivi
ty
Proj
ect
(IA
PP)
Ongoing
Jul-11
Jun-16
1099
1 49
24
6067
77
1 42
3 34
8 77
1 42
3 34
8
AFSTF
Pipeline
Ongoing
DAE
Inte
grat
ed P
est
Man
agem
ent
(2nd
pha
se,
1st r
evis
ed)
Ongoing
Jul-10
Dec-12 21
25
2125
0
904
904
0 13
91
1391
0
Pipeline
Ongoing
DAE
Inte
grat
ed Q
ualit
y H
ortic
ultu
re
Dev
elop
men
t Pr
ojec
t (2
nd p
hase
)
Ongoing
Jul-10
Dec-13
7863
78
63
0 13
51
1351
0
2469
24
69
0
Pipeline
Ongoing
DAE
Min
imiz
ing
Rice
Yie
ld G
ap P
roje
ct (1
st
revi
sed)
Ongoing
Jan-11
Dec-13
1995
19
95
0 75
9 75
9 0
1033
10
33
0

162 Programme
Subprogramme
Included in CIP 2011 Included in CIP 2012
GoB Agency
Project title
Project Status Project start Project end
Proj
ect b
udge
t fo
r th
e pe
riod
Ju
l'10-
Jun'
15
Del
iver
y
in F
Y 20
11/1
2 To
tal d
eliv
ery
sinc
e Ju
l'10
DP
Tota
l G
oB
PA
Tota
l G
oB
PA
Tota
l G
oB
PA
1: S
usta
inab
le
and
dive
rsifi
ed
agri
cult
ure
1.2:
Impr
ove
exte
nsio
n se
rvic
es
to p
ropa
gate
kn
owle
dge
&
practic
es,
supp
orte
d by
co
mm
unit
y-ba
sed
expe
rim
entatio
n &
lear
ning
and
in
dige
nous
kn
owle
dge
Pipeline
Pipeline
DAE
Muj
ibna
gar
Inte
grat
ed A
gric
ultu
re
Dev
elop
men
t Pr
ojec
t
Ongoing
Jul-11
Jun-16
3829
38
29
0 46
6 46
6 0
466
466
0
Ongoing
Ongoing
DAE
Nati
onal
Agr
icul
tura
l Tec
hnol
ogy
Proj
ect,
Ph
ase
I, 2n
d re
vise
d
Ongoing
Jul-07
Dec-13
1238
9 93
6 11
453
2163
13
5 20
28
4401
25
4 41
47
FAO
Ongoing
Completed
DAE
Ora
nge
Dev
elop
men
t Pr
ojec
t
Completed
Jul-06
Jun-11
1912
19
12
0 0
0 0
490
490
0
Ongoing
Ongoing
DAE
Stre
ngth
enin
g M
ushr
oom
Dev
elop
men
t Pr
ojec
t
Ongoing
Jan-09
Jun-13
5451
54
51
0 87
1 87
1 0
2176
21
76
0
JDCF
Ongoing
Ongoing
DAE
Supp
ort
to A
ssis
t La
ndle
ss, M
argi
nal a
nd
Smal
l Far
mer
s to
Ove
rcom
e So
arin
g In
put
and
Food
Pri
ces
in Im
pove
rish
ed A
reas
of
Bang
lade
sh
Completed
Jan-10
Aug-11
4858
0
4858
0
0 0
320
0 32
0
EU
Pipeline
Ongoing
DAE
Tube
r Cr
op D
evel
opm
ent
Proj
ect
Ongoing
Jul-10
Jun-13
837
837
0 31
9 31
9 0
376
376
0
Pipeline
Ongoing
DAM
Inte
grat
ed Q
ualit
y H
ortic
ultu
re (s
tand
ard
gard
en) D
evel
opm
ent
Proj
ect
(2nd
ph
ase)
Ongoing
Jul-10
Dec-13 24
70
2470
0
265
265
0 37
8 37
8 0
No
No
DAM
Muj
ibna
gar
Inte
grat
ed A
gric
ultu
ral
Dev
elop
men
t Pr
ojec
t
Ongoing
Jul-11
Jun-16
773
773
0 44
44
0
44
44
0
Ongoing
Ongoing
LGED
Com
mun
ity
Base
d Re
sour
ce M
anag
emen
t Pr
ojec
t.
Ongoing
Jul-02
Jun-14
2182
1 29
61
1886
0 32
19
787
2432
60
28
1062
49
66
IFAD

163
Programme
Subprogramme
Included in CIP 2011 Included in CIP 2012
GoB Agency
Project title
Project Status Project start Project end
Proj
ect b
udge
t fo
r th
e pe
riod
Ju
l'10-
Jun'
15
Del
iver
y
in F
Y 20
11/1
2 To
tal d
eliv
ery
sinc
e Ju
l'10
DP
Tota
l G
oB
PA
Tota
l G
oB
PA
Tota
l G
oB
PA
Pipeline
Pipeline
MoA
Inte
grat
ed A
gric
ultu
re P
rodu
ctivi
ty
Proj
ect
(IA
PP)
Ongoing
Jul-11
Jun-16
9291
52
1 87
70
467
20
445
467
20
445
GAFSP
Sub
tota
l Sub
prog
ram
me
1.2
1918
06
1286
46
6316
0 27
175
2009
6 70
78
5206
0 38
731
1332
7
1: S
usta
inab
le
and
dive
rsifi
ed
agri
cult
ure
1.3:
Pro
mot
e th
e de
velo
pmen
t of
re
spon
ses
to
adap
t ag
ricu
ltur
al
syst
ems
to c
limat
e ch
ange
Ongoing
Ongoing
DoForestry Co
mm
unit
y ba
sed
adap
tatio
n to
clim
ate
chan
ge t
hrou
gh C
oast
al Aff
ores
trati
on in
Ba
ngla
desh
Ongoing
Jul-09
Nov-12
3977
68
3 32
94
1168
17
1 99
7 15
77
171
1406
UNDP
No
Pipeline
LGED
Dis
aste
r M
itigatio
n un
der
WFP
(Enh
anci
ng
Resi
lienc
e to
Dis
aste
r an
d th
e eff
ect
the
Clim
ate
Chan
ge)
Ongoing
Jan-12
Dec-16
1038
00
5294
0 50
860
0
0
WFP
No
Pipeline
MoEF
Clim
ate
chan
ge C
apac
ity
build
ing
and
know
ledg
e m
anag
emen
t - a
tech
nica
l as
sist
ance
gra
nt p
roje
ct
Ongoing
Jan-12
Jun-13
454
83
371
0 0
0 0
0 0
Ongoing
Ongoing
MoEF
Supp
ortin
g Im
plem
entatio
n of
the
Ba
ngla
desh
Clim
ate
Chan
ge S
trat
egy
&
Acti
on P
lan
– a
tech
nica
l ass
ista
nce
gran
t pr
ojec
t BCC
SP
Ongoing
Jul-09
Jun-13
1724
0
1724
14
9 0
149
419
0 41
9
ADB
Sub
tota
l Sub
prog
ram
me
1.3
1099
55
5370
6 56
249
1317
17
1 11
46
1996
17
1 18
25
Sub
tota
l Pro
gram
me
140
7992
25
0152
15
7839
47
540
3335
7 14
181
8362
8 58
990
2463
7
2: Im
prov
ed
wat
er
man
agem
ent
2.1:
Impr
ove
wat
er
man
agem
ent
in
wat
er d
istr
ibuti
on
syst
ems
and
at
farm
leve
l
Pipeline
Ongoing
BADC
Enha
ncin
g A
gric
ultu
ral P
rodu
ction
and
Po
vert
y A
llevi
ation
by
intr
oduc
ing
For
ce
mod
e Tu
bew
ell I
rrig
ation
Ongoing
Jul-10
Jun-14 23
52
2352
0
1077
10
77
0 16
93
1693
0
Pipeline
Pipeline
BADC
Inte
grat
ed A
gric
ultu
re P
rodu
ctivi
ty
Proj
ect
(BA
DC-
see
d an
d w
ater
m
anag
emen
t co
mpo
nent
)
Ongoing
Jul-11
Jun-16
1037
6 49
65
5411
30
4 20
4 10
1 30
4 20
4 10
1
GAFSP
Pipeline
Ongoing
BADC
Pabn
a-N
ator
e- S
iraj
gang
Irri
gatio
n A
rea
Dev
elop
men
t Pr
ojec
t (3
rd P
hase
)
Ongoing
Mar-11
Jun-14
1517
4 15
174
0 21
00
2100
0
2100
21
00
0
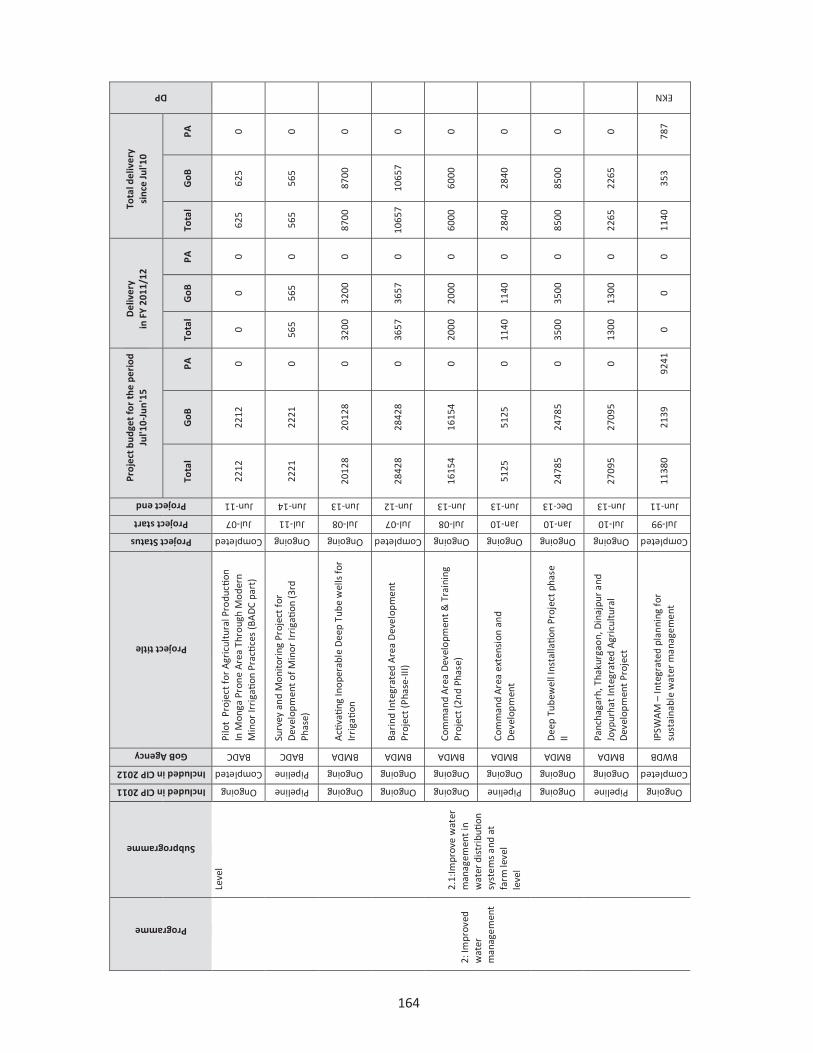
164
Programme
Subprogramme
Included in CIP 2011 Included in CIP 2012
GoB Agency
Project title
Project Status Project start Project end
Proj
ect b
udge
t fo
r th
e pe
riod
Ju
l'10-
Jun'
15
Del
iver
y
in F
Y 20
11/1
2 To
tal d
eliv
ery
si
nce
Jul'1
0
DP
Tota
l G
oB
PA
Tota
l G
oB
PA
Tota
l G
oB
PA
2: Im
prov
ed
wat
er
man
agem
ent
Leve
l 2.
1:Im
prov
e w
ater
m
anag
emen
t in
w
ater
dis
trib
ution
sy
stem
s an
d at
fa
rm le
vel
leve
l
Ongoing
Completed
BADC
Pilo
t Pr
ojec
t for
Agr
icul
tura
l Pro
ducti
on
In M
onga
Pro
ne A
rea
Thro
ugh
Mod
ern
Min
or Ir
rigatio
n Pr
actic
es (B
AD
C pa
rt)
Completed
Jul-07
Jun-11
2212
22
12
0 0
0 0
625
625
0
Pipeline
Pipeline
BADC
Surv
ey a
nd M
onit
orin
g Pr
ojec
t fo
r D
evel
opm
ent
of M
inor
Irri
gatio
n (3
rd
Phas
e)
Ongoing
Jul-11
Jun-14
2221
22
21
0 56
5 56
5 0
565
565
0
Ongoing
Ongoing
BMDA
Acti
vatin
g In
oper
able
Dee
p Tu
be w
ells
for
Irri
gatio
n
Ongoing
Jul-08
Jun-13
2012
8 20
128
0 32
00
3200
0
8700
87
00
0
Ongoing
Ongoing
BMDA
Bari
nd In
tegr
ated
Are
a D
evel
opm
ent
Proj
ect
(Pha
se-I
II)
Completed
Jul-07
Jun-12
2842
8 28
428
0 36
57
3657
0
1065
7 10
657
0
Ongoing
Ongoing
BMDA
Com
man
d A
rea
Dev
elop
men
t &
Tra
inin
g Pr
ojec
t (2
nd P
hase
)
Ongoing
Jul-08
Jun-13
1615
4 16
154
0 20
00
2000
0
6000
60
00
0
Pipeline
Ongoing
BMDA
Com
man
d A
rea
exte
nsio
n an
d D
evel
opm
ent
Ongoing
Jan-10
Jun-13
5125
51
25
0 11
40
1140
0
2840
28
40
0
Ongoing
Ongoing
BMDA
Dee
p Tu
bew
ell I
nsta
llatio
n Pr
ojec
t ph
ase
II
Ongoing
Jan-10
Dec-13 24
785
2478
5 0
3500
35
00
0 85
00
8500
0
Pipeline
Ongoing
BMDA
Panc
haga
rh, T
haku
rgao
n, D
inaj
pur
and
Joyp
urha
t Int
egra
ted
Agr
icul
tura
l D
evel
opm
ent
Proj
ect
Ongoing
Jul-10
Jun-13
2709
5 27
095
0 13
00
1300
0
2265
22
65
0
Ongoing
Completed
BWDB
IPSW
AM
– In
tegr
ated
pla
nnin
g fo
r su
stai
nabl
e w
ater
man
agem
ent
Completed
Jul-99
Jun-11
1138
0 21
39
9241
0
0 0
1140
35
3 78
7
EKN
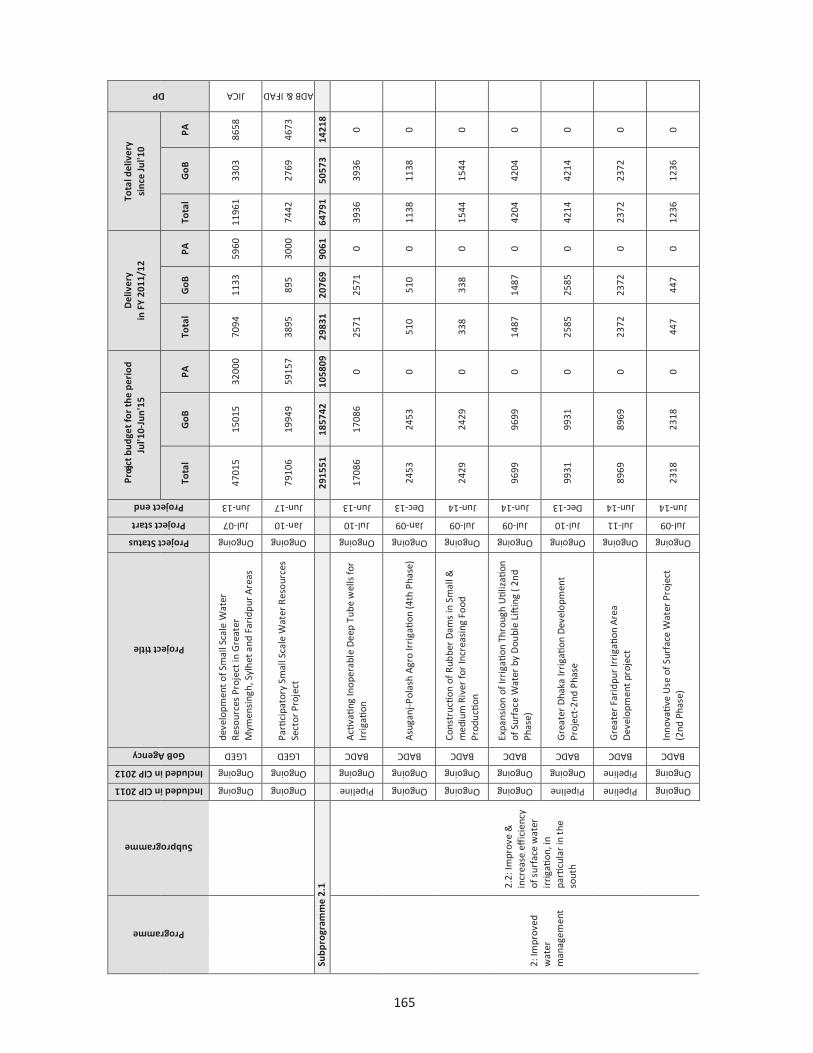
165
Programme
Subprogramme
Included in CIP 2011 Included in CIP 2012
GoB Agency
Project title
Project Status Project start Project end
Proje
ct b
udge
t fo
r th
e pe
riod
Ju
l'10-
Jun'
15
Del
iver
y
in F
Y 20
11/1
2 To
tal d
eliv
ery
si
nce
Jul'1
0
DP
Tota
l G
oB
PA
Tota
l G
oB
PA
Tota
l G
oB
PA
Ongoing
Ongoing
LGED
deve
lopm
ent
of S
mal
l Sca
le W
ater
Re
sour
ces
Proj
ect i
n G
reat
er
Mym
ensi
ngh,
Syl
het a
nd F
arid
pur
Are
as
Ongoing
Jul-07
Jun-13
4701
5 15
015
3200
0 70
94
1133
59
60
1196
1 33
03
8658
JICA
Ongoing
Ongoing
LGED Pa
rtici
pato
ry S
mal
l Sca
le W
ater
Res
ourc
es
Sect
or P
roje
ct
Ongoing
Jan-10
Jun-17
7910
6 19
949
5915
7 38
95
895
3000
74
42
2769
46
73
ADB & IFAD
Subp
rogr
amm
e 2.
1 29
1551
18
5742
10
5809
29
831
2076
9 90
61
6479
1 50
573
1421
8
2: Im
prov
ed
wat
er
man
agem
ent
2.2:
Impr
ove
&
incr
ease
eff
icie
ncy
of s
urfa
ce w
ater
ir
rigatio
n, in
pa
rticu
lar
in t
he
sout
h
Pipeline
Ongoing
BADC
Acti
vatin
g In
oper
able
Dee
p Tu
be w
ells
for
Irri
gatio
n
Ongoing
Jul-10
Jun-13
1708
6 17
086
0 25
71
2571
0
3936
39
36
0
Ongoing
Ongoing
BADC
Asu
ganj
-Pol
ash
Agr
o Ir
rigatio
n (4
th P
hase
)
Ongoing
Jan-09
Dec-13
2453
24
53
0 51
0 51
0 0
1138
11
38
0
Ongoing
Ongoing
BADC
Cons
tructio
n of
Rub
ber
Dam
s in
Sm
all &
m
ediu
m R
iver
for
Incr
easi
ng F
ood
Prod
uctio
n
Ongoing
Jul-09
Jun-14
2429
24
29
0 33
8 33
8 0
1544
15
44
0
Ongoing
Ongoing
BADC
Expa
nsio
n of
Irri
gatio
n Th
roug
h Util
izati
on
of S
urfa
ce W
ater
by
Dou
ble
Lift
ing
( 2nd
Ph
ase)
Ongoing
Jul-09
Jun-14
9699
96
99
0 14
87
1487
0
4204
42
04
0
Pipeline
Ongoing
BADC
Gre
ater
Dha
ka Ir
rigatio
n D
evel
opm
ent
Proj
ect-
2nd
Phas
e
Ongoing
Jul-10
Dec-13
9931
99
31
0 25
85
2585
0
4214
42
14
0
Pipeline
Pipeline
BADC
Gre
ater
Far
idpu
r Ir
rigatio
n A
rea
Dev
elop
men
t pr
ojec
t
Ongoing
Jul-11
Jun-14
8969
89
69
0 23
72
2372
0
2372
23
72
0
Ongoing
Ongoing
BADC
Inno
vativ
e U
se o
f Sur
face
Wat
er P
roje
ct
(2nd
Pha
se)
Ongoing
Jul-09
Jun-14
2318
23
18
0 44
7 44
7 0
1236
12
36
0
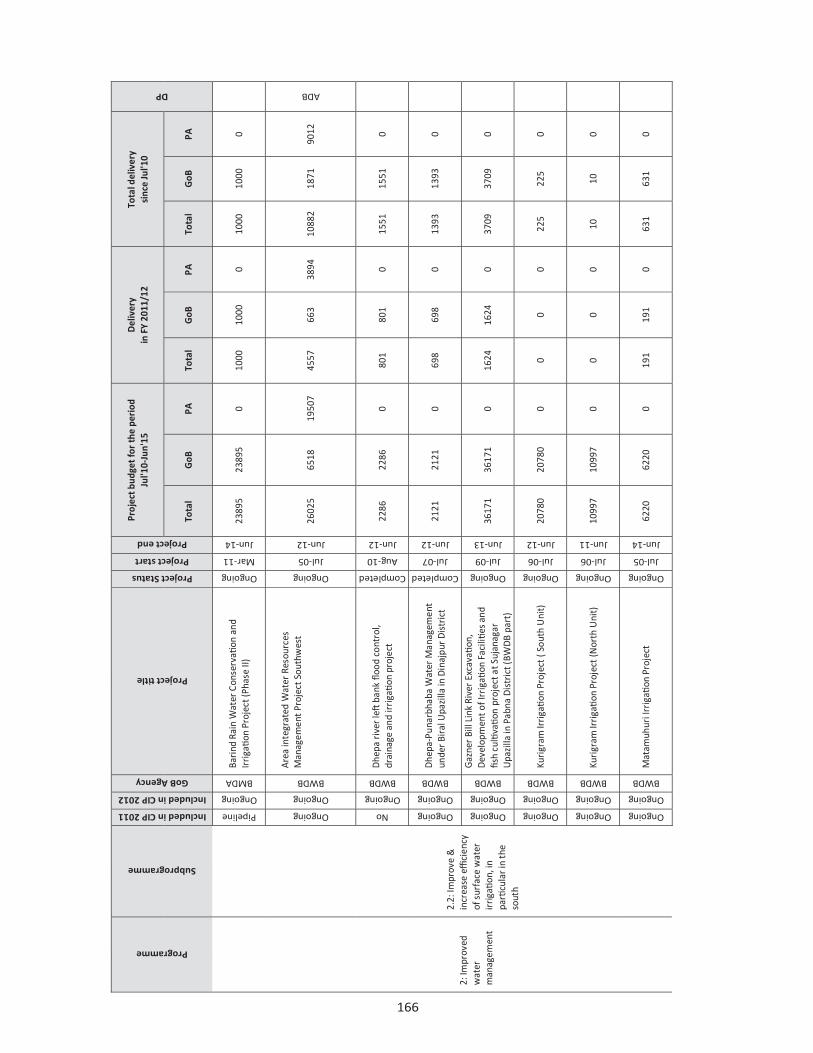
166 Programme
Subprogramme
Included in CIP 2011 Included in CIP 2012
GoB Agency
Project title
Project Status Project start Project end
Proj
ect b
udge
t for
the
peri
od
Jul'1
0-Ju
n'15
D
eliv
ery
in
FY
2011
/12
Tota
l del
iver
y
sinc
e Ju
l'10
DP
Tota
l G
oB
PA
Tota
l G
oB
PA
Tota
l G
oB
PA
2: Im
prov
ed
wat
er
man
agem
ent
2.2:
Impr
ove
&
incr
ease
effi
cien
cy
of s
urfa
ce w
ater
ir
rigati
on, i
n pa
rticu
lar i
n th
e so
uth
Pipeline
Ongoing
BMDA
Bari
nd R
ain
Wat
er C
onse
rvati
on a
nd
Irri
gatio
n Pr
ojec
t (Ph
ase
II)
Ongoing
Mar-11
Jun-14
2389
5 23
895
0 10
00
1000
0
1000
10
00
0
Ongoing
Ongoing
BWDB Ar
ea in
tegr
ated
Wat
er R
esou
rces
M
anag
emen
t Pro
ject
Sou
thw
est
Ongoing
Jul-05
Jun-12
2602
5 65
18
1950
7 45
57
663
3894
10
882
1871
90
12
ADB
No
Ongoing
BWDB
Dhe
pa ri
ver l
eft b
ank flo
od c
ontr
ol,
drai
nage
and
irri
gatio
n pr
ojec
t
Completed
Aug-10
Jun-12
2286
22
86
0 80
1 80
1 0
1551
15
51
0
Ongoing
Ongoing
BWDB
Dhe
pa-P
unar
bhab
a W
ater
Man
agem
ent
unde
r Bir
al U
pazi
lla in
Din
ajpu
r Dis
tric
t
Completed
Jul-07
Jun-12
2121
21
21
0 69
8 69
8 0
1393
13
93
0
Ongoing
Ongoing
BWDB
Gaz
ner
Bill
Link
Riv
er E
xcav
ation
, D
evel
opm
ent o
f Irr
igati
on F
acilitie
s an
d fis
h cu
ltivatio
n pr
ojec
t at S
ujan
agar
U
pazi
lla in
Pab
na D
istr
ict (
BWD
B pa
rt)
Ongoing
Jul-09
Jun-13
3617
1 36
171
0 16
24
1624
0
3709
37
09
0
Ongoing
Ongoing
BWDB
Kuri
gram
Irri
gatio
n Pr
ojec
t ( S
outh
Uni
t)
Ongoing
Jul-06
Jun-12
2078
0 20
780
0 0
0 0
225
225
0
Ongoing
Ongoing
BWDB
Kuri
gram
Irri
gatio
n Pr
ojec
t (N
orth
Uni
t)
Ongoing
Jul-06
Jun-11
1099
7 10
997
0 0
0 0
10
10
0
Ongoing
Ongoing
BWDB
Mat
amuh
uri I
rrig
ation
Pro
ject
Ongoing
Jul-05
Jun-14
6220
62
20
0 19
1 19
1 0
631
631
0

167 Programme
Subprogramme
Included in CIP 2011 Included in CIP 2012
GoB Agency
Project title
Project Status Project start Project end
Proj
ect b
udge
t for
the
peri
od
Jul'1
0-Ju
n'15
D
eliv
ery
in
FY
2011
/12
Tota
l del
iver
y
sinc
e Ju
l'10
DP
Tota
l G
oB
PA
Tota
l G
oB
PA
Tota
l G
oB
PA
2: Im
prov
ed
wat
er
man
agem
ent
2.2:
Impr
ove
&
incr
ease
effi
cien
cy
of s
urfa
ce w
ater
ir
rigati
on, i
n pa
rticu
lar i
n th
e so
uth
Ongoing
Ongoing
BWDB
Muh
uri-K
ahua
Flo
od C
ontr
ol, D
rain
age
and
Irri
gatio
n Pr
ojec
t
Completed
Jul-04
Jun-12
1506
0 15
060
0 35
78
3578
0
9378
93
78
0 No
Pipeline
BWDB Pr
e-m
onso
on fl
ood
prot
ectio
n an
d dr
aina
ge im
prov
emen
t in
haor
are
as
Ongoing
Jul-11
Jun-15
6849
4 68
494
0 73
5 73
5 0
735
735
0
No
Pipeline
BWDB
Surm
a ri
ght b
ank flo
od c
ontr
ol, d
rain
age
and
irri
gatio
n pr
ojec
t
Ongoing
Jul-11
Jun-14
4571
45
71
0 25
0 25
0 0
250
250
0
Ongoing
Ongoing
BWDB
Tara
il Pa
chur
ia F
lood
con
trol
, Dra
inag
e an
d Ir
rigatio
n Pr
ojec
t
Ongoing
Mar-09
Jun-13
2814
5 28
145
0 35
11
3511
0
5157
51
57
0
Ongoing
Ongoing
BWDB
Tees
ta B
arra
ge P
roje
ct,2
nd P
hase
Ongoing
Jul-06
Jun-13
2486
3 24
863
0 12
89
1289
0
5697
56
97
0
Ongoing
Ongoing
BWDB
Wat
er M
anag
emen
t Im
prov
emen
t Pro
ject
(s
peci
al re
vise
d)
Ongoing
Jul-04
Jun-14 98
301
1972
2 78
578
9033
21
5 88
18
2100
5 26
09
1839
6
IDA
No
Ongoing
DAE
Re-e
xcav
ation
of c
onne
cting
rive
rs,
Dev
elop
men
t of i
rrig
ation
faci
lities
and
Fi
sh c
ultu
re p
roje
ct o
f Gaz
ner
Beel
are
a an
d Su
jana
gar U
pazi
lla in
Pab
na D
istr
ict
Ongoing
Jan-10
Mar-13
877
877
0 0
0 0
0 0
0
Ongoing
Ongoing
DLS
Re-e
xcav
ation
of c
onne
cting
rive
rs,
Dev
elop
men
t of i
rrig
ation
faci
lities
and
Fi
sh c
ultu
re p
roje
ct o
f Gaz
ner
Beel
are
a an
d Su
jana
gar U
pazi
lla in
Pab
na D
istr
ict
Ongoing
Mar-10
Jun-13
165
165
0 90
90
0
100
100
0
Ongoing
Ongoing
DOFish
Re-e
xcav
ation
of c
onne
cting
rive
rs,
Dev
elop
men
t of i
rrig
ation
faci
lities
and
Fi
sh c
ultu
re p
roje
ct o
f Gaz
ner
Beel
are
a an
d Su
jana
gar U
pazi
lla in
Pab
na D
istr
ict
Ongoing
Jan-10
Jun-13
491
491
0 86
86
0
93
93
0
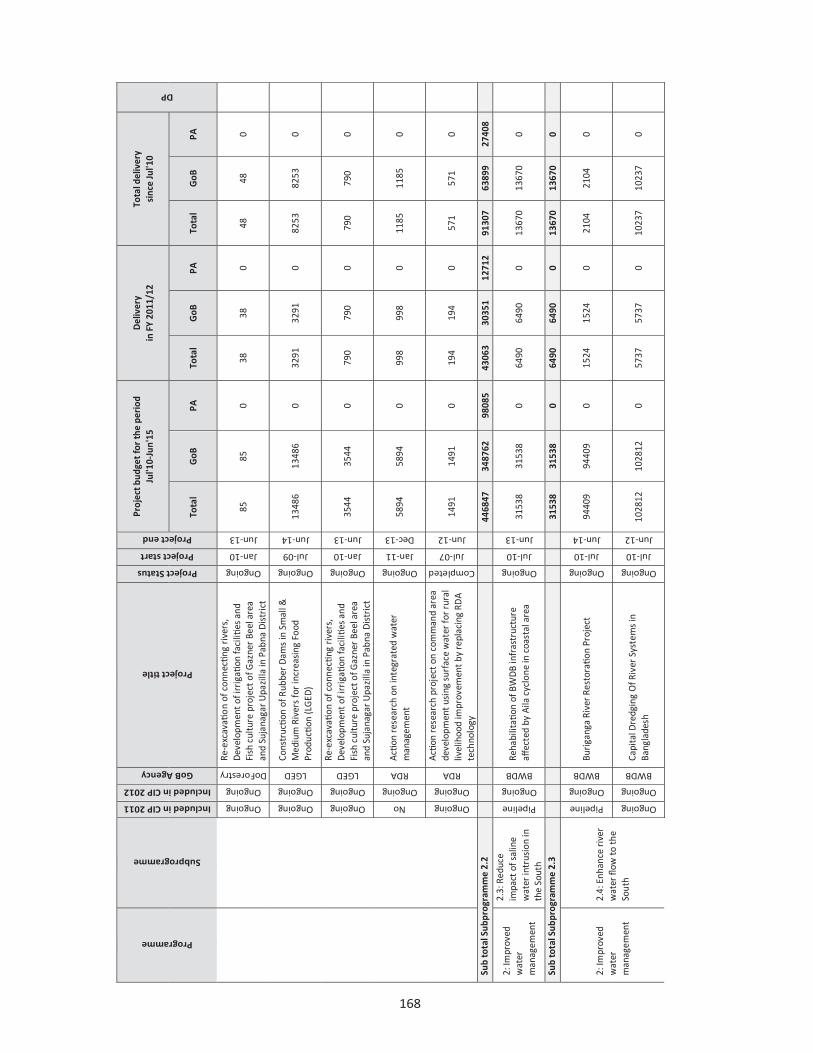
168
Programme
Subprogramme
Included in CIP 2011 Included in CIP 2012
GoB Agency
Project title
Project Status Project start Project end
Proj
ect b
udge
t for
the
peri
od
Jul'1
0-Ju
n'15
D
eliv
ery
in
FY
2011
/12
Tota
l del
iver
y
sinc
e Ju
l'10
DP
Tota
l G
oB
PA
Tota
l G
oB
PA
Tota
l G
oB
PA
Ongoing
Ongoing
DoForestry
Re-e
xcav
ation
of c
onne
cting
rive
rs,
Dev
elop
men
t of i
rrig
ation
faci
lities
and
Fi
sh c
ultu
re p
roje
ct o
f Gaz
ner
Beel
are
a an
d Su
jana
gar U
pazi
lla in
Pab
na D
istr
ict
Ongoing
Jan-10
Jun-13
85
85
0 38
38
0
48
48
0
Ongoing
Ongoing
LGED Co
nstr
uctio
n of
Rub
ber
Dam
s in
Sm
all &
M
ediu
m R
iver
s fo
r inc
reas
ing
Food
Pr
oductio
n (L
GED
)
Ongoing
Jul-09
Jun-14
1348
6 13
486
0 32
91
3291
0
8253
82
53
0
Ongoing
Ongoing
LGED
Re-e
xcav
ation
of c
onne
cting
rive
rs,
Dev
elop
men
t of i
rrig
ation
faci
lities
and
Fi
sh c
ultu
re p
roje
ct o
f Gaz
ner
Beel
are
a an
d Su
jana
gar U
pazi
lla in
Pab
na D
istr
ict
Ongoing
Jan-10
Jun-13
3544
35
44
0 79
0 79
0 0
790
790
0
No
Ongoing
RDA
Actio
n re
sear
ch o
n in
tegr
ated
wat
er
man
agem
ent
Ongoing
Jan-11
Dec-13
5894
58
94
0 99
8 99
8 0
1185
11
85
0
Ongoing
Ongoing
RDA
Actio
n re
sear
ch p
roje
ct o
n co
mm
and
area
de
velo
pmen
t usi
ng s
urfa
ce w
ater
for r
ural
liv
elih
ood
impr
ovem
ent b
y re
plac
ing
RDA
tech
nolo
gy Completed
Jul-07
Jun-12
1491
14
91
0 19
4 19
4 0
571
571
0
Sub
tota
l Sub
prog
ram
me
2.2
4468
47
3487
62
9808
5 43
063
3035
1 12
712
9130
7 63
899
2740
8
2: Im
prov
ed
wat
er
man
agem
ent
2.3:
Red
uce
impa
ct o
f sal
ine
wat
er in
trus
ion
in
the
Sout
h
Pipeline
Ongoing
BWDB
Reha
bilit
ation
of B
WD
B in
fras
truc
ture
aff
ecte
d by
Aila
cyc
lone
in c
oast
al a
rea
Ongoing
Jul-10
Jun-13 31
538
3153
8 0
6490
64
90
0 13
670
1367
0 0
Sub
tota
l Sub
prog
ram
me
2.3
3153
8 31
538
0 64
90
6490
0
1367
0 13
670
0
2: Im
prov
ed
wat
er
man
agem
ent
2.4:
Enh
ance
rive
r w
ater
flow
to th
e So
uth
Pipeline
Ongoing
BWDB
Buri
gang
a Ri
ver R
esto
ratio
n Pr
ojec
t
Ongoing
Jul-10
Jun-14
9440
9 94
409
0 15
24
1524
0
2104
21
04
0
Ongoing
Ongoing
BWDB
Capi
tal D
redg
ing
Of R
iver
Sys
tem
s in
Ba
ngla
desh
Ongoing
Jul-10
Jun-12
1028
12
1028
12
0 57
37
5737
0
1023
7 10
237
0

169 Programme
Subprogramme
Included in CIP 2011 Included in CIP 2012
GoB Agency
Project title
Project Status Project start Project end
Proj
ect b
udge
t for
the
peri
od
Jul'1
0-Ju
n'15
D
eliv
ery
in
FY
2011
/12
Tota
l del
iver
y
sinc
e Ju
l'10
DP
Tota
l G
oB
PA
Tota
l G
oB
PA
Tota
l G
oB
PA
No
Ongoing
BWDB
Exca
vatio
n of
Cha
nda-
Bara
sia
rive
r
Ongoing
Jul-10
Jun-12
5953
59
53
0 16
99
1699
0
2037
20
37
0
Ongoing
Ongoing
BWDB Fe
asib
ility
Stu
dy a
nd D
etai
l Des
ign
of
Gan
ges
Barr
age
proj
ect
Ongoing
Jul-04
Jun-13
4564
45
64
0 82
2 82
2 0
1801
18
01
0
No
Ongoing
BWDB
Feas
ibili
ty s
tudy
and
sur
vey
of S
uras
har
FCD
I pro
ject
Completed
May-10
Jun-12
156
156
0 64
64
0
141
141
0
Ongoing
Ongoing
BWDB
Gor
ai R
iver
Res
toratio
n Pr
ojec
t
Ongoing
Jul-10
Jun-13
9421
5 94
215
0 14
104
1410
4 0
2413
9 24
139
0
No
Ongoing
BWDB
Kaln
i-Kus
hiar
a ri
ver m
anag
emen
t
Ongoing
Apr-11
Jun-14
6098
3 60
983
0 16
7 16
7 0
167
167
0
No
Ongoing
BWDB
Proc
urem
ent o
f 6 d
redg
ers
and
anci
llary
cr
afts
and
acce
ssor
ies
for M
oWR
and
MoS
hipp
ing
Ongoing
Aug-10
Jun-12 23
782
6848
16
934
0 0
0 0
0 0
Pipeline
Ongoing
BWDB
Proc
urem
ent o
f dre
dger
s an
d an
cilla
ries
fo
r riv
er d
redg
ing
Ongoing
Jul-10
Jun-12
1309
88
1309
88
0 13
9 13
9 0
139
139
0
No
Ongoing
BWDB
Re-e
xcav
ation
of B
emel
ia, L
agan
Ba
lbha
dra
rive
r un
der N
asir
naga
r upa
zila
in
Bra
hman
bari
a an
d H
abig
anj D
istr
ict
Ongoing
Jul-10
Jun-13
4242
42
42
0 19
2 19
2 0
194
194
0
Sub
tota
l Sub
prog
ram
me
2.4
5221
04
5051
70
1693
4 24
447
2444
7 0
4095
7 40
957
0
Sub
tota
l Pro
gram
me
212
9204
0 10
7121
2 22
0828
10
3831
82
058
2177
3 21
0725
16
9099
41
626

170
Programme
Subprogramme
Included in CIP 2011 Included in CIP 2012
GoB Agency
Project title
Project Status Project start Project end
Proj
ect b
udge
t for
the
peri
od
Jul'1
0-Ju
n'15
D
eliv
ery
in
FY
2011
/12
Tota
l del
iver
y
sinc
e Ju
l'10
DP
Tota
l G
oB
PA
Tota
l G
oB
PA
Tota
l G
oB
PA
3: Im
prov
ed
qual
ity o
f in
put a
nd s
oil
ferti
lity
3:
Impr
oved
qu
ality
of
inpu
t and
soi
l fe
rtilit
y
3.1:
Enh
ance
av
aila
bilit
y of
ag
ricu
ltura
l inp
uts,
te
sted
and
ce
rtifie
d fo
r qu
ality
of
dive
rsifi
ed c
rops
3.
1: E
nhan
ce
avai
labi
lity
of
agri
cultu
ral i
nput
s,
test
ed a
nd
certifie
d fo
r qu
ality
of
dive
rsifi
ed c
rops
No
Ongoing
BADC
Dev
elop
men
t and
multip
licati
on o
f ag
ricu
ltura
l see
ds (P
hase
II)
Ongoing
Jul-10
Jun-14
551
551
0 25
0 25
0 0
433
433
0
Pipeline
Pipeline
BADC
Enha
ncin
g qu
ality
see
d s
uppl
y pr
ojec
t
Ongoing
Jul-11
Jun-14
1788
7 38
00
1408
7 89
6 80
0 96
89
6 80
0 96
IDA
Ongoing
Ongoing
BADC
Impr
ovem
ent a
nd q
ualit
y se
ed p
rodu
ction
of
rice
, whe
at a
nd m
aize
Ongoing
Mar-09
Dec-13
1867
1 18
671
0 34
35
3435
0
1364
3 13
643
0
Ongoing
Completed
BADC
Mod
erni
zatio
n Fa
ciliti
es to
incr
ease
Su
pply
of Q
ualit
y Se
ed -
COM
PLET
ED
Completed
Jul-06
Jun-11
3061
3 30
613
0 0
0 0
3540
35
40
0
No
Ongoing
BADC
Priv
ate
sect
or s
eed
deve
lopm
ent
Ongoing
Jan-11
Dec-13
1816
18
16
0 50
0 50
0 0
519
519
0
Ongoing
Ongoing
BADC
Puls
e an
d O
ils S
eed
(2nd
Pha
se)
Ongoing
Jul-09
Jun-14 98
82
9882
0
1808
18
08
0 37
49
3749
0
Pipeline
Pipeline
BARI
Enha
ncin
g Q
ualit
y Se
ed S
uppl
y
Ongoing
Jul-11
Jun-14
5803
14
73
4330
22
5 20
0 25
22
5 20
0 25
Ongoing
Ongoing
BCIC
Rest
orin
g or
igin
al ra
ted
prod
uctio
n ca
paci
ty b
y re
pair
ing
of P
olas
h U
rea
Ferti
lizer
Fac
tory
Ltd
.
Completed
Jan-08
Jul-11
5533
55
33
0 80
0 80
0 0
3403
34
03
0
Ongoing
Ongoing
BCIC
Seco
nd p
hase
reha
bilit
ation
of N
atur
al
Gas
Fertil
izer
Fac
tory
Ltd
Completed
Jul-06
Dec-11
7011
70
11
0 15
82
1582
0
4720
47
20
0
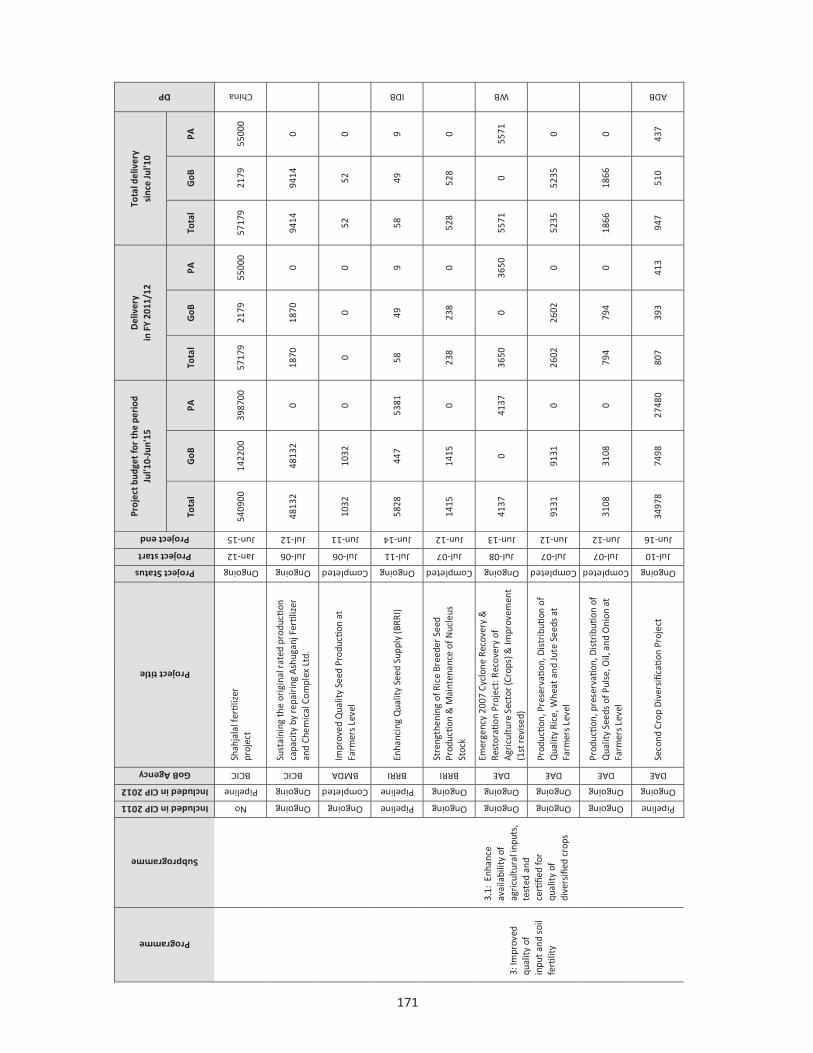
171
Programme
Subprogramme
Included in CIP 2011 Included in CIP 2012
GoB Agency
Project title
Project Status Project start Project end
Proj
ect b
udge
t for
the
peri
od
Jul'1
0-Ju
n'15
D
eliv
ery
in
FY
2011
/12
Tota
l del
iver
y
sinc
e Ju
l'10
DP
Tota
l G
oB
PA
Tota
l G
oB
PA
Tota
l G
oB
PA
3: Im
prov
ed
qual
ity o
f in
put a
nd s
oil
ferti
lity
3.1:
Enh
ance
av
aila
bilit
y of
ag
ricu
ltura
l inp
uts,
te
sted
and
ce
rtifie
d fo
r qu
ality
of
dive
rsifi
ed c
rops
No
Pipeline
BCIC
Shah
jala
l fertil
izer
pr
ojec
t
Ongoing
Jan-12
Jun-15
5409
00
1422
00
3987
00
5717
9 21
79
5500
0 57
179
2179
55
000
China
Ongoing
Ongoing
BCIC Su
stai
ning
the
orig
inal
rate
d pr
oductio
n ca
paci
ty b
y re
pair
ing
Ashu
ganj
Fertil
izer
an
d Ch
emic
al C
ompl
ex L
td.
Ongoing
Jul-06
Jul-12
4813
2 48
132
0 18
70
1870
0
9414
94
14
0
Ongoing
Completed
BMDA
Impr
oved
Qua
lity
Seed
Pro
ducti
on a
t Fa
rmer
s Le
vel
Completed
Jul-06
Jun-11
1032
10
32
0 0
0 0
52
52
0
Pipeline
Pipeline
BRRI
Enha
ncin
g Q
ualit
y Se
ed S
uppl
y (B
RRI)
Ongoing
Jul-11
Jun-14
5828
44
7 53
81
58
49
9 58
49
9
IDB
Ongoing
Ongoing
BRRI
Stre
ngth
enin
g of
Ric
e Br
eede
r Se
ed
Prod
uctio
n &
Mai
nten
ance
of N
ucle
us
Stoc
k
Completed
Jul-07
Jun-12
1415
14
15
0 23
8 23
8 0
528
528
0
Ongoing
Ongoing
DAE
Emer
genc
y 20
07 C
yclo
ne R
ecov
ery
&
Rest
orati
on P
roje
ct: R
ecov
ery
of
Agri
cultu
re S
ecto
r (Cr
ops)
& Im
prov
emen
t (1
st re
vise
d)
Ongoing
Jul-08
Jun-13 41
37
0 41
37
3650
0
3650
55
71
0 55
71
WB
Ongoing
Ongoing
DAE
Prod
uctio
n, P
rese
rvati
on, D
istr
ibuti
on o
f Q
ualit
y Ri
ce, W
heat
and
Jute
See
ds a
t Fa
rmer
s Le
vel
Completed
Jul-07
Jun-12
9131
91
31
0 26
02
2602
0
5235
52
35
0
Ongoing
Ongoing
DAE
Prod
uctio
n, p
rese
rvati
on, D
istr
ibuti
on o
f Q
ualit
y Se
eds
of P
ulse
, Oil,
and
Oni
on a
t Fa
rmer
s Le
vel
Completed
Jul-07
Jun-12
3108
31
08
0 79
4 79
4 0
1866
18
66
0
Pipeline
Ongoing
DAE
Seco
nd C
rop
Div
ersific
ation
Pro
ject
Ongoing
Jul-10
Jun-16
3497
8 74
98
2748
0 80
7 39
3 41
3 94
7 51
0 43
7
ADB

172
Programme
Subprogramme
Included in CIP 2011 Included in CIP 2012
GoB Agency
Project title
Project Status Project start Project end
Proj
ect b
udge
t for
the
peri
od
Jul'1
0-Ju
n'15
D
eliv
ery
in
FY
2011
/12
Tota
l del
iver
y
sinc
e Ju
l'10
DP
Tota
l G
oB
PA
Tota
l G
oB
PA
Tota
l G
oB
PA
Ongoing
Ongoing
MoA
Agri
cultu
re S
ecto
r Pro
gram
me
Supp
ort
(See
d W
ing)
Ongoing
Jul-07
Sep-12
726
0 72
6 29
8 0
298
491
0 49
1
DANIDA
Pipeline
Pipeline
SCA In
tegr
ated
Agr
icul
ture
Pro
ducti
vity
Pr
ojec
t (IA
PP)
Ongoing
Jul-11
Jun-16
600
270
330
92
84
8 92
84
8
GAFSP
Sub
tota
l Sub
prog
ram
me
3.1
7477
54
2925
83
4551
71
7708
3 17
584
5949
9 11
2559
50
923
6163
6
3: Im
prov
ed
qual
ity o
f in
put a
nd s
oil
ferti
lity
3.2:
Dev
elop
pu
blic
pri
vate
pa
rtne
rshi
ps
thro
ugh
capa
city
de
velo
pmen
t
Pipeline
Pipeline
BADC
Esta
blis
hing
see
d au
gmen
tatio
n (m
ultip
licati
on) f
arm
in th
e So
uth
Wes
t Co
asta
l reg
ion
Ongoing
Jan-12
Jun-14
2449
6 24
496
0 30
5 30
5 0
305
305
0
No
Pipeline
BADC
Kuri
gram
Inte
grat
ed s
eed
cold
sto
rage
es
tabl
ishm
ent p
roje
ct
Ongoing
Jul-11
Jun-14
3286
32
86
0 29
8 29
8 0
298
298
0
Sub
tota
l Sub
prog
ram
me
3.2
2778
2 27
782
0 60
3 60
3 0
603
603
0
3: Im
prov
ed
qual
ity o
f in
put a
nd s
oil
ferti
lity
3.3:
Impr
ove
and
incr
ease
su
stai
nabi
lity
of
soil
ferti
lity
man
agem
ent
Ongoing
Completed
DAE
Gra
nula
r Ure
a Te
chno
logy
Ext
ensi
on
Proj
ect i
n 80
add
ition
al U
pazi
las
Completed
Sep-08
Jun-11
800
0 80
0 0
0 0
500
0 50
0
USDA
Ongoing
Completed
DoE
Coas
tal a
nd W
etla
nd B
iodi
vers
ity
Man
agem
ent P
roje
ct (C
WBM
P)
Completed
Apr-02
Jun-11
3958
29
9 36
59
0 0
0 80
5 24
78
1
UNDP
Ongoing
Ongoing
DoE
Sust
aina
ble
Land
Man
agem
ent P
roje
ct
Completed
Jul-07
Jun-12
699
237
462
291
235
55
654
235
419
UNDP
Ongoing
Ongoing
SRDI
Food
Sec
urity
Pro
gram
me
2006
, Soi
l Fe
rtilit
y Co
mpo
nent
Ongoing
Jan-08
Dec-12
8455
23
7 82
18
1978
13
19
65
3367
35
33
32
EU
Sub
tota
l Sub
prog
ram
me
3.3
1391
2 77
3 13
139
2269
24
8 20
20
5326
29
4 50
32
Sub
tota
l Pro
gram
me
3 78
9448
32
1138
46
8310
79
955
1843
5 61
519
1184
88
5182
0 66
668
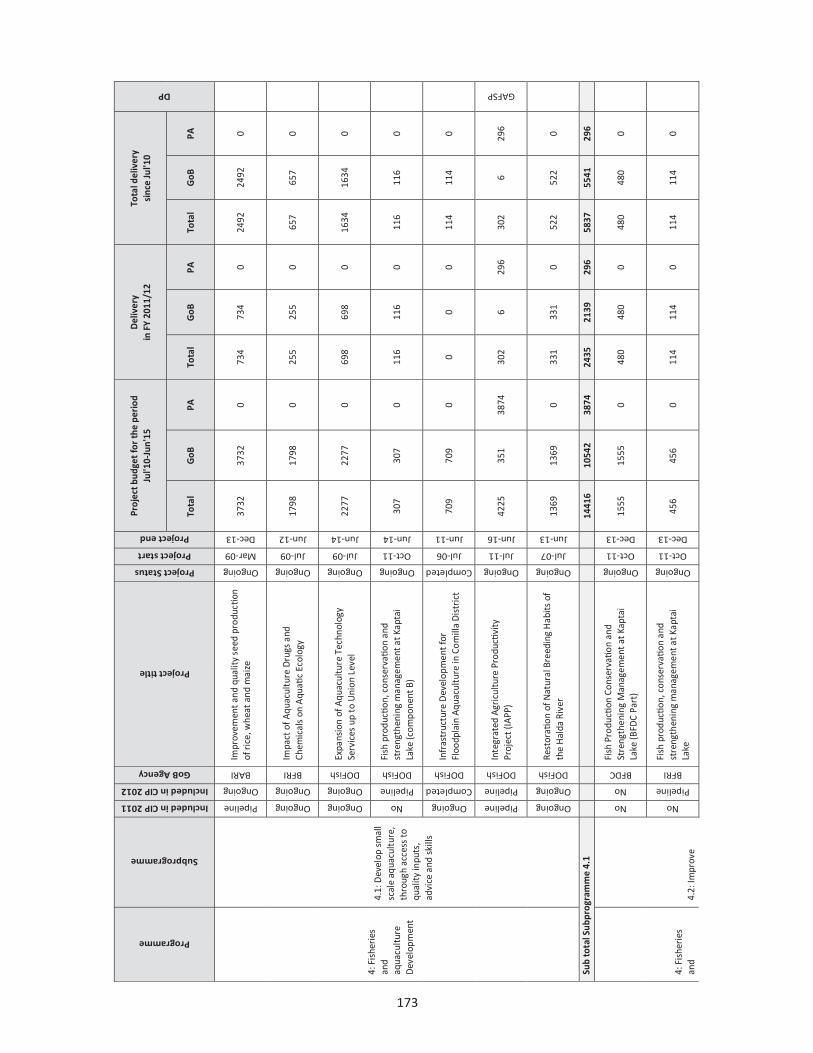
173 Programme
Subprogramme
Included in CIP 2011 Included in CIP 2012
GoB Agency
Project title
Project Status Project start Project end
Proj
ect b
udge
t for
the
peri
od
Jul'1
0-Ju
n'15
D
eliv
ery
in
FY
2011
/12
Tota
l del
iver
y
sinc
e Ju
l'10
DP
Tota
l G
oB
PA
Tota
l G
oB
PA
Tota
l G
oB
PA
4: F
ishe
ries
an
d aq
uacu
lture
D
evel
opm
ent
4.1:
Dev
elop
sm
all
scal
e aq
uacu
ltur
e,
thro
ugh
acce
ss to
qu
ality
inpu
ts,
advi
ce a
nd s
kills
Pipeline
Ongoing
BARI
Impr
ovem
ent a
nd q
ualit
y se
ed p
rodu
ction
of
rice
, whe
at a
nd m
aize
Ongoing
Mar-09
Dec-13
3732
37
32
0 73
4 73
4 0
2492
24
92
0
Ongoing
Ongoing
BFRI Im
pact
of A
quac
ultu
re D
rugs
and
Ch
emic
als
on A
quati
c Ec
olog
y
Ongoing
Jul-09
Jun-12
1798
17
98
0 25
5 25
5 0
657
657
0
Ongoing
Ongoing
DOFish
Expa
nsio
n of
Aqu
acul
ture
Tec
hnol
ogy
Serv
ices
up
to U
nion
Lev
el
Ongoing
Jul-09
Jun-14
2277
22
77
0 69
8 69
8 0
1634
16
34
0
No
Pipeline
DOFish
Fish
pro
ducti
on, c
onse
rvati
on a
nd
stre
ngth
enin
g m
anag
emen
t at K
apta
i La
ke (c
ompo
nent
B)
Ongoing
Oct-11
Jun-14
307
307
0 11
6 11
6 0
116
116
0
Ongoing
Completed
DOFish
Infr
astr
uctu
re D
evel
opm
ent f
or
Floo
dpla
in A
quac
ultu
re in
Com
illa
Dis
tric
t
Completed
Jul-06
Jun-11
709
709
0 0
0 0
114
114
0
Pipeline
Pipeline
DOFish
Inte
grat
ed A
gric
ultu
re P
rodu
ctivi
ty
Proj
ect (
IAPP
)
Ongoing
Jul-11
Jun-16 42
25
351
3874
30
2 6
296
302
6 29
6
GAFSP
Ongoing
Ongoing
DOFish
Rest
orati
on o
f Nat
ural
Bre
edin
g H
abits
of
the
Hal
da R
iver
Ongoing
Jul-07
Jun-13
1369
13
69
0 33
1 33
1 0
522
522
0
Sub
tota
l Sub
prog
ram
me
4.1
1441
6 10
542
3874
24
35
2139
29
6 58
37
5541
29
6
4: F
ishe
ries
an
d
4.2:
Impr
ove
No
No
BFDC
Fish
Pro
ducti
on C
onse
rvati
on a
nd
Stre
ngth
enin
g M
anag
emen
t at K
apta
i La
ke (B
FDC
Part
)
Ongoing
Oct-11
Dec-13
1555
15
55
0 48
0 48
0 0
480
480
0
No
Pipeline
BFRI
Fish
pro
ducti
on, c
onse
rvati
on a
nd
stre
ngth
enin
g m
anag
emen
t at K
apta
i La
ke
Ongoing
Oct-11
Dec-13
456
456
0 11
4 11
4 0
114
114
0

174 Programme
Subprogramme
Included in CIP 2011 Included in CIP 2012
GoB Agency
Project title
Project Status Project start Project end
Proj
ect b
udge
t for
the
peri
od
Jul'1
0-Ju
n'15
D
eliv
ery
in
FY
2011
/12
Tota
l del
iver
y
sinc
e Ju
l'10
DP
Tota
l G
oB
PA
Tota
l G
oB
PA
Tota
l G
oB
PA
aqua
cultu
re
Dev
elop
men
t
4: F
ishe
ries
an
d aq
uacu
lture
D
evel
opm
ent
man
agem
ent o
f fis
heri
es r
esou
rces
4.
2: Im
prov
e m
anag
emen
t of
fishe
ries
res
ourc
es
Ongoing
Ongoing
BFRI
Jatk
a Co
nser
vatio
n, A
ltern
ate
Inco
me
Gen
erati
on fo
r th
e Ja
tka
Fish
ers
and
Rese
arch
Pro
ject
(BFR
I par
t)
Ongoing
Jul-08
Jun-13
406
406
0 66
66
0
237
237
0
Ongoing
Ongoing
BFRI Su
ppor
t to
Sust
aina
ble
Dev
elop
men
t of
the
Bay
of B
enga
l Lar
ge M
arin
e Ec
osys
tem
(BO
BLM
E)
Ongoing
Sep-05
Aug-13
499
499
0 92
92
0
162
162
0
Ongoing
Ongoing
DOFish
Aqua
cultu
re a
nd F
ishe
ries
Man
agem
ent
in B
habo
dha
Area
, Jes
sore
Ongoing
Jul-09
Jun-14
986
986
0 25
5 25
5 0
525
525
0
Pipeline
Ongoing
DOFish
Aqua
cultu
re a
nd fi
sher
ies
man
agem
ent
proj
ect i
n ha
or a
rea
Ongoing
Oct-10
Jun-14
2229
22
29
0 60
0 60
0 0
659
659
0
Ongoing
Ongoing
DOFish
Bang
lade
sh m
arin
e fis
heri
es c
apac
ity
build
ing
proj
ect
Ongoing
Jul-09
Jun-13
1194
7 45
57
7390
20
8 11
4 94
27
8 11
4 16
5
IDB, GDM
Ongoing
Ongoing
DOFish
Broo
d Ba
nk E
stab
lishm
ent P
roje
ct
Completed
Jul-07
Jun-12 12
50
1250
0
183
183
0 43
3 43
3 0
Ongoing
Ongoing
DOFish
Emer
genc
y 20
07 (S
idr)
Cyc
lone
Rec
over
y an
d Re
stor
ation
Pro
ject
(ECR
RP)
Ongoing
Jul-08
Jun-13
3448
0
3448
59
8 0
598
1340
0
1340
FAO, WB
No
Ongoing
DOFish
Fish
erie
s de
velo
pmen
t and
man
agem
ent
of id
entifi
ed d
egra
ded
wat
er b
odie
s an
d co
nser
vatio
n of
sm
all i
ndig
enou
s fis
hes
Ongoing
Jul-10
Jun-14
3584
35
84
0 17
41
1741
0
2473
24
73
0
Ongoing
Ongoing
DOFish
Gre
ater
Far
idpu
r Fi
sher
ies
Dev
elop
men
t Pr
ojec
t
Ongoing
Jan-10
Jun-14
6114
61
14
0 11
50
1150
0
3449
34
49
0
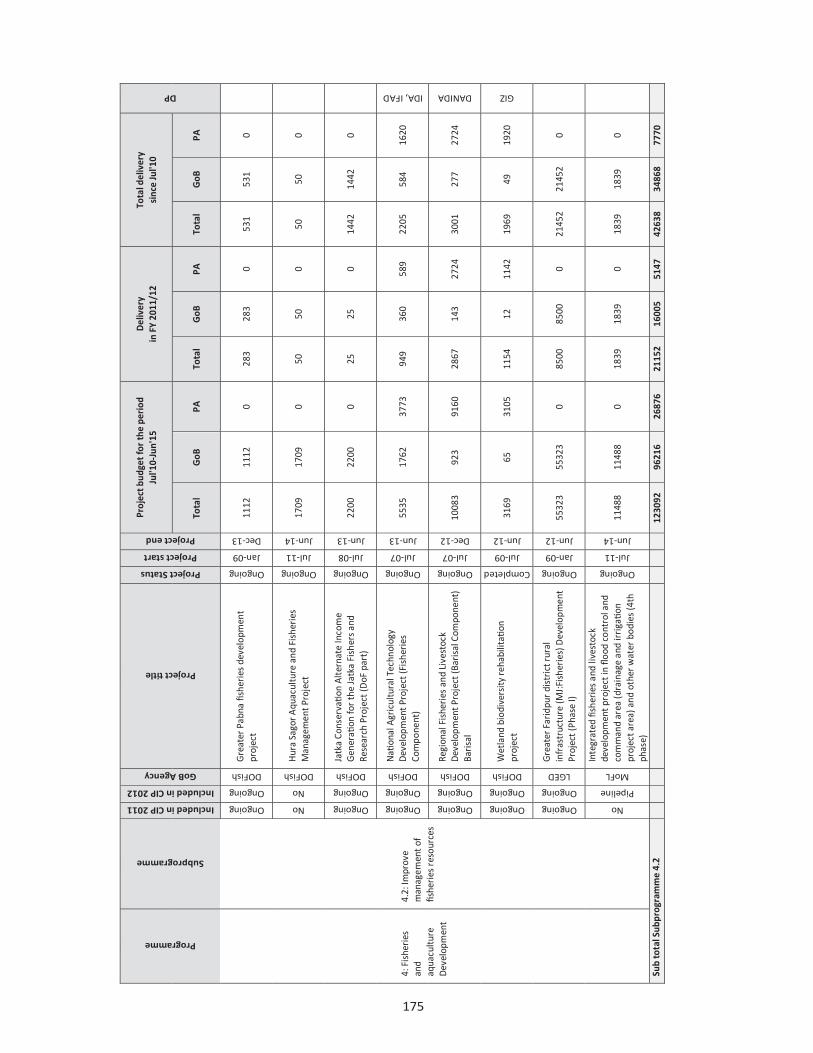
175
Programme
Subprogramme
Included in CIP 2011 Included in CIP 2012
GoB Agency
Project title
Project Status Project start Project end
Proj
ect b
udge
t for
the
peri
od
Jul'1
0-Ju
n'15
D
eliv
ery
in
FY
2011
/12
Tota
l del
iver
y
sinc
e Ju
l'10
DP
Tota
l G
oB
PA
Tota
l G
oB
PA
Tota
l G
oB
PA
4: F
ishe
ries
an
d aq
uacu
lture
D
evel
opm
ent
4.2:
Impr
ove
man
agem
ent o
f fis
heri
es r
esou
rces
Ongoing
Ongoing
DOFish
Gre
ater
Pab
na fi
sher
ies
deve
lopm
ent
proj
ect
Ongoing
Jan-09
Dec-13
1112
11
12
0 28
3 28
3 0
531
531
0
No
No
DOFish
Hur
a Sa
gor A
quac
ultu
re a
nd F
ishe
ries
M
anag
emen
t Pro
ject
Ongoing
Jul-11
Jun-14
1709
17
09
0 50
50
0
50
50
0
Ongoing
Ongoing
DOFish
Jatk
a Co
nser
vatio
n Al
tern
ate
Inco
me
Gen
erati
on fo
r th
e Ja
tka
Fish
ers
and
Rese
arch
Pro
ject
(DoF
par
t)
Ongoing
Jul-08
Jun-13
2200
22
00
0 25
25
0
1442
14
42
0
Ongoing
Ongoing
DOFish
Nati
onal
Agr
icul
tura
l Tec
hnol
ogy
Dev
elop
men
t Pro
ject
(Fis
heri
es
Com
pone
nt)
Ongoing
Jul-07
Jun-13
5535
17
62
3773
94
9 36
0 58
9 22
05
584
1620
IDA, IFAD
Ongoing
Ongoing
DOFish
Regi
onal
Fis
heri
es a
nd L
ives
tock
D
evel
opm
ent P
roje
ct (B
aris
al C
ompo
nent
) Ba
risa
l Ongoing
Jul-07
Dec-12
1008
3 92
3 91
60
2867
14
3 27
24
3001
27
7 27
24
DANIDA
Ongoing
Ongoing
DOFish
Wet
land
bio
dive
rsity
reha
bilit
ation
pr
ojec
t
Completed
Jul-09
Jun-12 31
69
65
3105
11
54
12
1142
19
69
49
1920
GIZ
Ongoing
Ongoing
LGED
Gre
ater
Far
idpu
r di
stri
ct ru
ral
infr
astr
uctu
re (M
J:Fi
sher
ies)
Dev
elop
men
t Pr
ojec
t (Ph
ase
I)
Ongoing
Jan-09
Jun-12
5532
3 55
323
0 85
00
8500
0
2145
2 21
452
0
No
Pipeline
MoFL
Inte
grat
ed fi
sher
ies
and
lives
tock
de
velo
pmen
t pro
ject
in fl
ood
cont
rol a
nd
com
man
d ar
ea (d
rain
age
and
irri
gatio
n pr
ojec
t are
a) a
nd o
ther
wat
er b
odie
s (4
th
phas
e)
Ongoing
Jul-11
Jun-14
1148
8 11
488
0 18
39
1839
0
1839
18
39
0
Sub
tota
l Sub
prog
ram
me
4.2
1230
92
9621
6 26
876
2115
2 16
005
5147
42
638
3486
8 77
70

176 Programme
Subprogramme
Included in CIP 2011 Included in CIP 2012
GoB Agency
Project title
Project Status Project start Project end
Proj
ect b
udge
t for
the
peri
od
Jul'1
0-Ju
n'15
D
eliv
ery
in
FY
2011
/12
Tota
l del
iver
y
sinc
e Ju
l'10
DP
Tota
l G
oB
PA
Tota
l G
oB
PA
Tota
l G
oB
PA
4: F
ishe
ries
an
d aq
uacu
lture
D
evel
opm
ent
4.4:
Pro
mot
e pr
oductio
n in
the
Sout
h th
roug
h su
stai
nabl
e sh
rim
p an
d pr
awn
deve
lopm
ent a
nd
com
mun
ity b
ased
co
man
agem
ent
of
wet
land
s
Pipeline
Ongoing
BFRI
Infr
astr
uctu
ral D
evel
opm
ent a
nd
Rese
arch
Str
engt
heni
ng o
f Fis
heri
es
Rese
arch
Insti
tute
Bag
erha
t
Ongoing
Jul-10
Jun-13
3597
35
97
0 10
50
1050
0
1542
15
42
0
Sub
tota
l Sub
prog
ram
me
4.4
3597
35
97
0 10
50
1050
0
1542
15
42
0 Su
b to
tal P
rogr
amm
e 4
1411
05
1103
56
3075
0 24
637
1919
4 54
43
5001
7 41
952
8066
5: L
ives
tock
de
velo
pmen
t
5.1:
Str
engt
hen
anim
al h
ealth
se
rvic
es, i
nclu
ding
be
tter
dia
gnos
is
and
surv
eilla
nce
syst
ems
to
miti
gate
dis
ease
ou
tbre
aks
No
No
BLRI
Foot
and
mou
th d
isea
se a
nd P
PR re
sear
ch
in B
angl
ades
h
Ongoing
Jul-11
Jun-16
691
691
0 50
50
0
50
50
0
Ongoing
Ongoing
DLS
Avia
n Influ
enza
Pre
pare
dnes
s &
Res
pons
e Pr
ojec
t
Ongoing
Jul-07
Jun-12
1073
0 10
30
9700
30
36
536
2500
50
11
661
4350
WB
No
No
DLS
Esta
blis
hmen
t of U
pazi
la L
ives
tock
D
evel
opm
ent C
entr
e (3
rd P
hase
)
Ongoing
Jul-11
Jun-16
358
358
0 66
66
0
66
66
0
Ongoing
Ongoing
DLS
Mod
erni
zatio
n of
Vac
cine
Pro
ducti
on
Tech
nolo
gy &
Ext
ensi
on o
f Lab
orat
ory
Faci
lities
Pro
ject
Ongoing
Jul-08
Jun-13
5687
56
87
0 99
99
0
2117
21
17
0
Ongoing
Ongoing
DLS
Stre
ngth
enin
g of
Sup
port
of c
omba
ting
Avia
n Influ
enza
(HPA
1) in
Ban
glad
esh
Proj
ect
Ongoing
Jan-08
Dec-11
3581
92
34
89
782
0 78
2 16
74
0 16
74
USAID
Sub
tota
l Sub
prog
ram
me
5.1
2104
7 78
58
1318
9 40
33
751
3282
89
18
2894
60
24
5: L
ives
tock
de
velo
pmen
t
5.2:
Str
engt
hen
husb
andr
y ca
paci
ty a
t ho
useh
old
leve
l
Ongoing
Completed
DLS
Cons
ervatio
n an
d im
prov
emen
t of n
ative
sh
eep
thro
ugh
com
mun
ity fa
rmin
g sy
stem
(com
pone
nt A
)
Completed
Jul-06
Jun-11
456
456
0 0
0 0
82
82
0
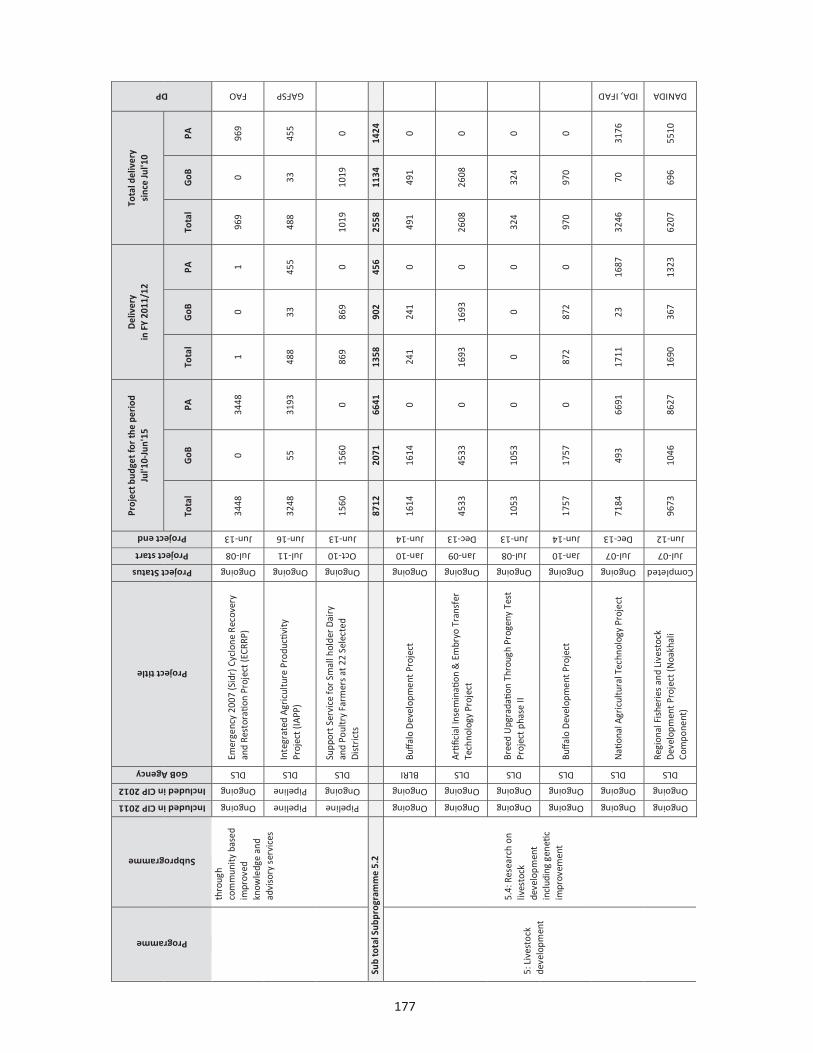
177
Programme
Subprogramme
Included in CIP 2011 Included in CIP 2012
GoB Agency
Project title
Project Status Project start Project end
Proj
ect b
udge
t for
the
peri
od
Jul'1
0-Ju
n'15
D
eliv
ery
in
FY
2011
/12
Tota
l del
iver
y
sinc
e Ju
l'10
DP
Tota
l G
oB
PA
Tota
l G
oB
PA
Tota
l G
oB
PA
thro
ugh
com
mun
ity b
ased
im
prov
ed
know
ledg
e an
d ad
viso
ry s
ervi
ces
Ongoing
Ongoing
DLS
Emer
genc
y 20
07 (S
idr)
Cyc
lone
Rec
over
y an
d Re
stor
ation
Pro
ject
(ECR
RP)
Ongoing
Jul-08
Jun-13
3448
0
3448
1
0 1
969
0 96
9
FAO
Pipeline
Pipeline
DLS In
tegr
ated
Agr
icul
ture
Pro
ducti
vity
Pr
ojec
t (IA
PP)
Ongoing
Jul-11
Jun-16
3248
55
31
93
488
33
455
488
33
455
GAFSP
Pipeline
Ongoing
DLS
Supp
ort S
ervi
ce fo
r Sm
all h
olde
r Dai
ry
and
Poul
try
Farm
ers
at 2
2 Se
lect
ed
Dis
tric
ts
Ongoing
Oct-10
Jun-13
1560
15
60
0 86
9 86
9 0
1019
10
19
0
Sub
tota
l Sub
prog
ram
me
5.2
8712
20
71
6641
13
58
902
456
2558
11
34
1424
5: L
ives
tock
de
velo
pmen
t
5.4:
Res
earc
h on
liv
esto
ck
deve
lopm
ent
incl
udin
g ge
netic
im
prov
emen
t
Ongoing
Ongoing
BLRI
Buffa
lo D
evel
opm
ent P
roje
ct
Ongoing
Jan-10
Jun-14
1614
16
14
0 24
1 24
1 0
491
491
0
Ongoing
Ongoing
DLS
Artifi
cial
Inse
min
ation
& E
mbr
yo T
rans
fer
Tech
nolo
gy P
roje
ct
Ongoing
Jan-09
Dec-13
4533
45
33
0 16
93
1693
0
2608
26
08
0
Ongoing
Ongoing
DLS
Bree
d U
pgra
datio
n Th
roug
h Pr
ogen
y Te
st
Proj
ect p
hase
II
Ongoing
Jul-08
Jun-13 10
53
1053
0
0 0
0 32
4 32
4 0
Ongoing
Ongoing
DLS
Buffa
lo D
evel
opm
ent P
roje
ct
Ongoing
Jan-10
Jun-14
1757
17
57
0 87
2 87
2 0
970
970
0
Ongoing
Ongoing
DLS
Nati
onal
Agr
icul
tura
l Tec
hnol
ogy
Proj
ect
Ongoing
Jul-07
Dec-13
7184
49
3 66
91
1711
23
16
87
3246
70
31
76
IDA, IFAD
Ongoing
Ongoing
DLS
Regi
onal
Fis
heri
es a
nd L
ives
tock
D
evel
opm
ent P
roje
ct (N
oakh
ali
Com
pone
nt)
Completed
Jul-07
Jun-12
9673
10
46
8627
16
90
367
1323
62
07
696
5510
DANIDA

178
Programme
Subprogramme
Included in CIP 2011 Included in CIP 2012
GoB Agency
Project title
Project Status Project start Project end
Proj
ect b
udge
t for
the
peri
od
Jul'1
0-Ju
n'15
D
eliv
ery
in
FY
2011
/12
Tota
l del
iver
y
sinc
e Ju
l'10
DP
Tota
l G
oB
PA
Tota
l G
oB
PA
Tota
l G
oB
PA
Ongoing
Ongoing
DLS
Seco
nd P
artic
ipat
ory
Live
stoc
k D
evel
opm
ent P
roje
ct
Completed
Jul-04
Dec-11
3764
22
52
1512
10
53
616
438
1646
10
47
599
ADB
Sub
tota
l Sub
prog
ram
me
5.4
2957
8 12
748
1683
0 72
61
3812
34
49
1549
3 62
07
9286
Sub
tota
l Pro
gram
me
5 59
337
2267
7 36
660
1265
1 54
64
7187
26
968
1023
5 16
733
6: Im
prov
ed
acce
ss to
m
arke
ts
6: Im
prov
ed
acce
ss to
m
arke
ts
6.1:
Impr
ove
phys
ical
acc
ess
to
mar
kets
, fac
ilitie
s an
d in
form
ation
6.
1: Im
prov
e ph
ysic
al a
cces
s to
m
arke
ts, f
acilitie
s an
d in
form
ation
No
Ongoing
AIS
Enha
ncem
ent o
f Rur
al C
omm
unic
ation
se
rvic
e th
roug
h co
mm
unity
Rad
io fo
r D
evel
opm
ent o
f Agr
icul
ture
Ongoing
Jul-10
Dec-12
386
67
319
7 0
7 27
8 25
25
3
FAO
No
Ongoing
BMDA
Mar
ketin
g of
Agr
icul
tura
l Pro
duct
s th
roug
h D
evel
opm
ent
of R
ural
Co
mm
unic
ation
Pro
ject
Ongoing
Oct-10
Jun-13
2998
0 29
980
0 13
00
1300
0
2800
28
00
0
No
Ongoing
DDM
Cons
tructio
n of
multip
urpo
se c
yclo
ne
shel
ter i
n th
e co
asta
l bel
t of B
angl
ades
h
Ongoing
Mar-11
Dec-13
1816
8 18
168
0 19
0 19
0 0
190
190
0
No
Ongoing
DRR
Cons
tructio
n of
bri
dge/
culv
ert (
up to
12
m lo
ng) o
n th
e ru
ral r
oads
at C
hitt
agon
g H
ill T
ract
s re
gion
Ongoing
Jul-10
Jun-13
9910
99
10
0 27
61
2761
0
5203
52
03
0
Ongoing
Ongoing
LGED
Agri
cultu
re S
ecto
r Pro
gram
me
Supp
ort
(ASP
S) P
hase
-II R
ural
Roa
d &
Mar
ket
Acce
ss In
fras
truc
ture
Dev
elop
men
t Pr
ojec
t (3)
Pat
uakh
ali,
Borg
una,
Noa
khal
i, La
xmip
ur
Ongoing
Jul-07
Jun-13
4255
2 21
302
2125
0 57
54
4074
16
80
1391
2 87
32
5180
DANIDA
Ongoing
Ongoing
LGED
Cons
tructio
n an
d Re
cons
tructio
n of
Rur
al
Road
, Bri
dges
and
Cul
vert
s in
Rur
al a
reas
on
Pri
ority
Bas
is
Completed
Jul-01
Jun-11
2128
16
2128
16
0 48
56
4856
0
7745
77
45
0
Pipeline
Ongoing
LGED
Cons
tructio
n of
two
brid
ges
on th
e ri
ver
Brah
map
utra
und
er Is
lam
pur
Upa
zila
of
Jam
alpu
r D
istr
ict
Ongoing
Aug-10
Jun-13
7305
73
05
0 35
35
0
121
121
0
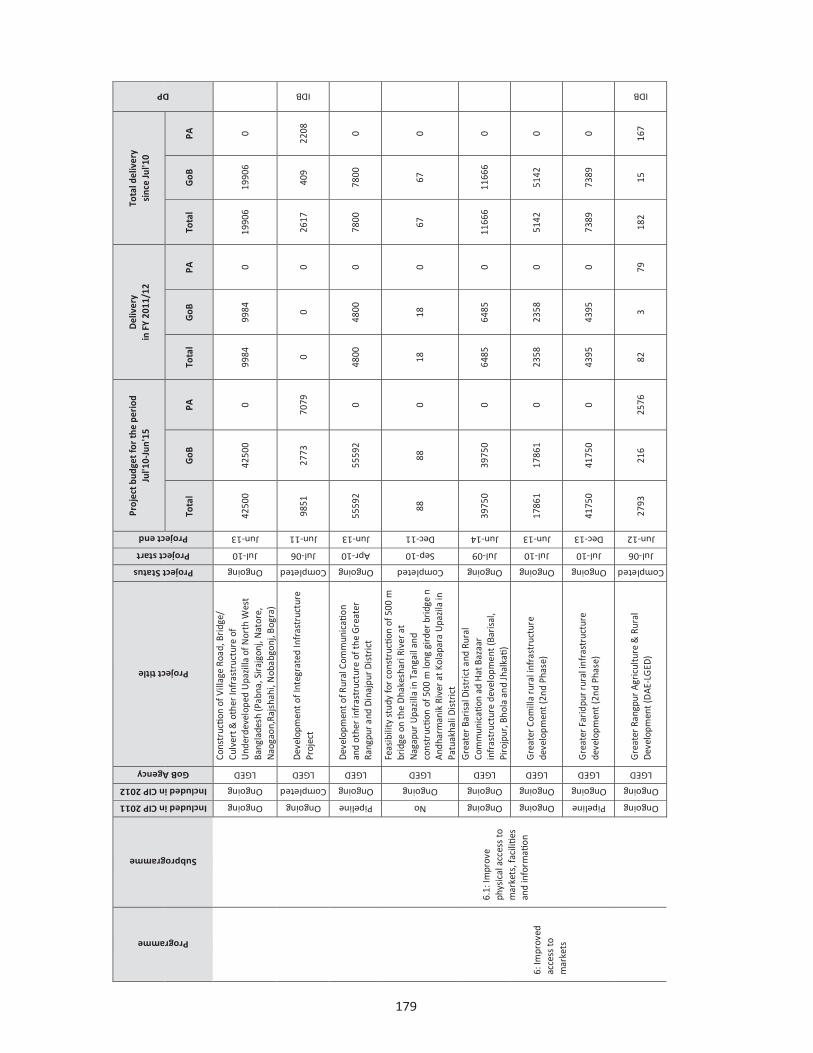
179 Programme
Subprogramme
Included in CIP 2011 Included in CIP 2012
GoB Agency
Project title
Project Status Project start Project end
Proj
ect b
udge
t for
the
peri
od
Jul'1
0-Ju
n'15
D
eliv
ery
in
FY
2011
/12
Tota
l del
iver
y
sinc
e Ju
l'10
DP
Tota
l G
oB
PA
Tota
l G
oB
PA
Tota
l G
oB
PA
6: Im
prov
ed
acce
ss to
m
arke
ts
6.1:
Impr
ove
phys
ical
acc
ess
to
mar
kets
, fac
ilitie
s an
d in
form
ation
Ongoing
Ongoing
LGED
Cons
tructio
n of
Vill
age
Road
, Bri
dge/
Cu
lver
t & o
ther
Infr
astr
uctu
re o
f U
nder
deve
lope
d U
pazi
lla o
f Nor
th W
est
Bang
lade
sh (P
abna
, Sir
ajgo
nj, N
ator
e,
Nao
gaon
,Raj
shah
i, N
obab
gonj
, Bog
ra)
Ongoing
Jul-10
Jun-13
4250
0 42
500
0 99
84
9984
0
1990
6 19
906
0 Ongoing
Completed
LGED
Dev
elop
men
t of I
nteg
rate
d In
fras
truc
ture
Pr
ojec
t
Completed
Jul-06
Jun-11
9851
27
73
7079
0
0 0
2617
40
9 22
08
IDB
Pipeline
Ongoing
LGED
Dev
elop
men
t of R
ural
Com
mun
icati
on
and
othe
r in
fras
truc
ture
of t
he G
reat
er
Rang
pur a
nd D
inaj
pur D
istr
ict
Ongoing
Apr-10
Jun-13
5559
2 55
592
0 48
00
4800
0
7800
78
00
0
No
Ongoing
LGED
Feas
ibili
ty s
tudy
for
cons
tructio
n of
500
m
brid
ge o
n th
e D
hake
shar
i Riv
er a
t N
agap
ur U
pazi
lla in
Tan
gail
and
cons
tructio
n of
500
m lo
ng g
irde
r bri
dge
n An
dhar
man
ik R
iver
at K
olap
ara
Upa
zila
in
Patu
akha
li D
istr
ict
Completed
Sep-10
Dec-11
88
88
0 18
18
0
67
67
0
Ongoing
Ongoing
LGED
Gre
ater
Bar
isal
Dis
tric
t and
Rur
al
Com
mun
icati
on a
d H
at B
azaa
r in
fras
truc
ture
dev
elop
men
t (Ba
risa
l, Pi
rojp
ur, B
hola
and
Jhal
kati)
Ongoing
Jul-09
Jun-14
3975
0 39
750
0 64
85
6485
0
1166
6 11
666
0
Ongoing
Ongoing
LGED
Gre
ater
Com
illa
rura
l inf
rast
ruct
ure
deve
lopm
ent (
2nd
Phas
e)
Ongoing
Jul-10
Jun-13
1786
1 17
861
0 23
58
2358
0
5142
51
42
0
Pipeline
Ongoing
LGED
Gre
ater
Far
idpu
r rur
al in
fras
truc
ture
de
velo
pmen
t (2n
d Ph
ase)
Ongoing
Jul-10
Dec-13
4175
0 41
750
0 43
95
4395
0
7389
73
89
0
Ongoing
Ongoing
LGED
Gre
ater
Ran
gpur
Agr
icul
ture
& R
ural
D
evel
opm
ent (
DAE
-LG
ED)
Completed
Jul-06
Jun-12
2793
21
6 25
76
82
3 79
18
2 15
16
7
IDB

180
Programme
Subprogramme
Included in CIP 2011 Included in CIP 2012
GoB Agency
Project title
Project Status Project start Project end
Proj
ect b
udge
t for
the
peri
od
Jul'1
0-Ju
n'15
D
eliv
ery
in
FY
2011
/12
Tota
l del
iver
y
sinc
e Ju
l'10
DP
Tota
l G
oB
PA
Tota
l G
oB
PA
Tota
l G
oB
PA
6: Im
prov
ed
acce
ss to
m
arke
ts
6.1:
Impr
ove
phys
ical
acc
ess
to
mar
kets
, fac
ilitie
s an
d in
form
ation
Ongoing
Ongoing
LGED
Mar
ket I
nfra
stru
ctur
e D
evel
opm
ent
Proj
ect i
n Ch
arla
nd R
egio
ns
Ongoing
Feb-06
Jun-13
2733
9 51
35
2220
4 66
90
969
5721
16
957
6046
10
911
IFAD & GON
Ongoing
Ongoing
LGED Pu
blic
pri
ority
Rur
al C
omm
unic
ation
and
H
at-B
azar
Dev
elop
men
t & R
ehab
ilitatio
n
Ongoing
Jul-05
Jun-13
5000
0 50
000
0 79
91
7991
0
1489
1 14
891
0
Ongoing
Ongoing
LGED
Publ
ic p
rior
ity R
ural
Com
mun
icati
on a
nd
Hat
-Baz
ar D
evel
opm
ent &
Reh
abili
tatio
n pa
rt 2
Ongoing
Jul-05
Jun-13
9950
0 99
500
0 42
00
4200
0
1019
2 10
192
0
No
Ongoing
LGED
Reha
bilit
ation
of A
ila affe
cted
rura
l in
fras
truc
ture
Ongoing
Jan-11
Jun-13
1402
5 14
025
0 0
0 0
2199
21
99
0
Ongoing
Ongoing
LGED
Rura
l (U
nion
) Inf
rast
ruct
ure
Dev
elop
men
t Pr
ojec
t (Kh
ulna
, Bag
erha
t & S
atkh
ira
Dis
tric
t)
Ongoing
Jul-08
Jun-13
1628
6 16
286
0 17
93
1793
0
3311
33
11
0
Ongoing
Ongoing
LGED
Rura
l Dev
elop
men
t Pro
ject
: Inf
rast
ruct
ure
Dev
elop
men
t-26
(2nd
Rev
ised
)
Completed
Jul-03
Jun-12 26
0259
92
109
1681
50
1593
9 93
64
6576
52
995
1854
4 34
451
IDA
Ongoing
Completed
LGED
Rura
l Inf
rast
ruct
ure
Dev
elop
men
t in
East
ern
Regi
on o
f Ban
glad
esh:
Gre
ater
Ch
ittag
ong,
Noa
khal
i and
Syl
het D
istr
ict
Completed
Jul-04
Jun-11
9949
7 23
065
7643
2 0
0 0
7552
18
71
5681
JICA
Ongoing
Completed
LGED
Rura
l Inf
rast
ruct
ure
Dev
elop
men
t Pro
ject
(G
IDP)
(2nd
Rev
ised
)
Completed
Jul-02
Jun-11
4465
0 44
650
0 0
0 0
6930
69
30
0
No
Ongoing
LGED
Rura
l inf
rast
ruct
ure
deve
lopm
ent
proj
ect
(Gre
ater
Dha
ka, T
anga
il an
d Ki
shor
ganj
D
istr
ict)
Ongoing
Mar-11
Jun-13
4410
0 44
100
0 22
79
2279
0
2279
22
79
0

181 Programme
Subprogramme
Included in CIP 2011 Included in CIP 2012
GoB Agency
Project title
Project Status Project start Project end
Proj
ect b
udge
t for
the
peri
od
Jul'1
0-Ju
n'15
D
eliv
ery
in
FY
2011
/12
Tota
l del
iver
y
sinc
e Ju
l'10
DP
Tota
l G
oB
PA
Tota
l G
oB
PA
Tota
l G
oB
PA
Ongoing
Ongoing
LGED
Seco
nd R
ural
Infr
astr
uctu
re D
evel
opm
ent
(RIIP
-II)
Ongoing
Jul-06
Dec-12
1475
90
5388
8 93
702
3739
3 15
000
2239
3 72
372
2565
4 46
718
ADB, KFW & GTZ
No
Ongoing
LGED Su
stai
nabl
e ru
ral i
nfra
stru
ctur
e im
prov
emen
t pr
ojec
t (SR
IIP)
Ongoing
Jan-11
Jun-16
7525
1 22
535
5271
6 20
01
266
1735
20
01
266
1735
ADB, FfW, JFBR
No
Pipeline
LGED
Sylh
et D
ivis
ion
Rura
l Inf
rast
ruct
ure
Dev
elop
men
t Pro
ject
Ongoing
Jul-11
Dec-14
4472
3 44
723
0 97
8 97
8 0
978
978
0
Ongoing
Ongoing
LGED
Uni
on in
fras
truc
ture
Dev
elop
men
t Pro
ject
(D
inaj
pur,
Pan
chag
arh,
Tha
kurg
aon,
Ra
ngpu
r, L
alm
onir
hat,
Kur
igra
m,
Gai
band
ha a
nd N
ilpha
mar
i).
Completed
Jul-07
Jun-12
1537
7 15
377
0 53
85
5385
0
7684
76
84
0
Ongoing
Ongoing
LGED
Villa
ge R
oad
and
Hat
Baz
ar D
evel
opm
ent
Proj
ect :
Gre
ater
Syl
het
Ongoing
Jul-08
Jun-14
1963
5 19
635
0 35
73
3573
0
7054
70
54
0
Sub
tota
l Sub
prog
ram
me
6.1
1489
533
1045
105
4444
28
1312
50
9305
8 38
191
2924
12
1851
07
1073
05
6: Im
prov
ed
acce
ss to
m
arke
ts
6.2:
Mob
ilize
and
pr
omot
e pr
oduc
er
& m
arketin
g gr
oups
for
impr
oved
mar
ket
acce
ss a
nd
know
ledg
e
Ongoing
Ongoing
BFDC
Esta
blis
hmen
t of F
ish
Mar
ketin
g Fa
ciliti
es
in D
haka
Met
ropo
lis
Completed
Jul-08
Dec-11 88
7 88
7 0
97
97
0 26
1 26
1 0
Pipeline
Pipeline
DOC
Ensu
ring
Coo
perativ
e ba
sed
Milk
Pr
oductio
n
Ongoing
Jul-11
Jun-15
2302
23
02
0 46
8 46
8 0
468
468
0
Ongoing
Ongoing Hortex
foundation
Nati
onal
Agr
icul
tura
l Tec
hnol
ogy
Proj
ect
(Hor
tex)
Ongoing
Jul-07
Dec-12
3613
16
4 34
49
353
9 34
3 64
4 18
62
6
IDA, IFAD
Sub
tota
l Sub
prog
ram
me
6.2
6802
33
53
3449
91
8 57
4 34
3 13
72
746
626

182
Programme
Subprogramme
Included in CIP 2011 Included in CIP 2012
GoB Agency
Project title
Project Status Project start Project end
Proj
ect b
udge
t for
the
peri
od
Jul'1
0-Ju
n'15
D
eliv
ery
in
FY
2011
/12
Tota
l del
iver
y
sinc
e Ju
l'10
DP
Tota
l G
oB
PA
Tota
l G
oB
PA
Tota
l G
oB
PA
6: Im
prov
ed
acce
ss to
m
arke
ts
6.3:
Pro
mot
e an
d as
sist
the
deve
lopm
ent o
f off
farm
acti
vitie
s an
d ru
ral
busi
ness
es
No
Pipeline
BRDB
Pove
rty
redu
ction
thro
ugh
min
or c
rop
prod
uctio
n, p
rese
rvati
on, p
roce
ssin
g an
d m
arketin
g pr
ogra
m (2
nd p
hase
)
Ongoing
Jul-11
Jun-14
5258
52
58
0 56
56
0
56
56
0
No
No
DAE Fo
od S
ecur
ity th
roug
h En
hanc
ed
Agri
cultu
re P
rodu
ction
Div
ersifie
d So
urce
s of
Inco
me
Valu
e A
dditi
on a
nd M
arketin
g in
Ban
glad
esh
(FSM
SP)
Ongoing
Jul-11
Jun-15
2604
48
0 21
24
158
7 15
1 15
8 7
151
Italy
Ongoing
Ongoing
DAM
Agri
busi
ness
Dev
elop
men
t Pro
ject
in
Bang
lade
sh
Completed
Jan-06
Dec-11
4094
4 12
74
3966
9 17
629
516
1711
3 27
005
637
2636
8
ADB
No
Pipeline
RDA
Inte
grat
ed e
mpl
oym
ent s
uppo
rt p
rogr
am
for p
oor w
omen
(IRE
SPPW
)
Ongoing
Jul-11
Jun-16
7455
74
55
0 33
2 33
2 0
332
332
0
Sub
tota
l Sub
prog
ram
me
6.4
5626
1 14
467
4179
3 18
174
911
1726
4 27
551
1032
26
519
Sub
tota
l Pro
gram
me
6 15
5259
6 10
6292
6 48
9670
15
0342
94
543
5579
9 32
1335
18
6886
13
4450
7:
Impl
emen
tatio
n an
d m
onito
ring
of
NFP
and
CIP
actio
ns
7.1:
Str
engt
hen
capa
citie
s to
im
plem
ent,
m
onito
r and
co
ordi
nate
N
ation
al F
ood
Polic
y-Pl
an o
f Ac
tion
and
CIP
Ongoing
Completed
DG Food
Stre
ngth
enin
g th
e G
over
nmen
t In
stitutio
nal C
apac
ity o
f DG
Foo
d fo
r Im
prov
ing
Food
Sec
urity
(Com
pone
nt-A
)
Completed
Sep-08
Dec-10
274
25
249
0 0
0 12
5 5
119
ADB
Ongoing
Ongoing
FPMU
Nati
onal
Foo
d Po
licy
Capa
city
S
tren
gthe
ning
Pro
gram
(II)
Ongoing
Jan-10
Dec-13
1016
3 90
10
073
2141
0
2141
42
30
0 42
30
EU & USAID
Ongoing
Completed
MoA
Stre
ngth
enin
g th
e G
over
nmen
t In
stitutio
nal C
apac
ity o
f MoA
for
Impr
ovin
g Fo
od S
ecur
ity (C
ompo
nent
-B)
Completed
Sep-08
Dec-10
178
16
162
0 0
0 59
3
57
ADB
Sub
tota
l Sub
prog
ram
me
7.1
1061
5 13
1 10
485
2141
0
2141
44
14
8 44
06
7:
Impl
emen
tatio
n an
d m
onito
ring
of
NFP
and
CIP
7.2:
Str
engt
hen
natio
nal c
apac
ities
fo
r des
ign,
im
plem
entatio
n an
d m
onit
orin
g of
Pipeline
Pipeline
MoA
Inte
grat
ed A
gric
ultu
re P
rodu
ctivi
ty
Proj
ect (
IAPP
)
Ongoing
Jul-11
Jun-16
1870
0
1870
94
0
95
94
0 95

183 Programme
Subprogramme
Included in CIP 2011 Included in CIP 2012
GoB Agency
Project title
Project Status Project start Project end
Proj
ect b
udge
t for
the
peri
od
Jul'1
0-Ju
n'15
D
eliv
ery
in
FY
2011
/12
Tota
l del
iver
y
sinc
e Ju
l'10
DP
Tota
l G
oB
PA
Tota
l G
oB
PA
Tota
l G
oB
PA
actio
ns
CIP
oper
ation
s
Sub
tota
l Sub
prog
ram
me
7.2
1870
0
1870
94
0
95
94
0 95
7:Im
plem
enta
tio
n an
d m
onito
ring
of
NFP
and
CIP
actio
ns
7.3:
Str
engt
hen
capa
citie
s of
civ
il so
ciet
y or
gani
satio
ns to
co
ntri
bute
to C
IP
deve
lopm
ent a
nd
impl
emen
tatio
n
Pipeline
Pipeline
MoA
Inte
grat
ed A
gric
ultu
re P
rodu
ctivi
ty
Proj
ect (
IAPP
)
Ongoing
Jul-11
Jun-16
695
0 69
5 35
0
35
35
0 35
Sub
tota
l Sub
prog
ram
me
7.3
695
0 69
5 35
0
35
35
0 35
Su
b to
tal P
rogr
amm
e 7
1318
0 13
1 13
049
2270
0
2271
45
43
8 45
36
8: E
nhan
ced
Publ
ic F
ood
Man
agem
ent
Syst
ems
8.1:
Incr
ease
and
m
oder
nize
pub
lic
stor
age
and
hand
ling
faci
lities
, in
clud
ing
in
disa
ster
pro
ne
area
s
Pipeline
Pipeline
DG Food
Bang
lade
sh M
oder
nize
d Fo
od S
tora
ge
Stud
y Pr
ojec
t (BM
SFP)
Ongoing
Feb-12
Sep-13
840
0 84
0 0
0
WB
Pipeline
Ongoing
DG Food
Cons
tructio
n of
0.8
4 la
kh M
T C
apac
ity
Food
God
own
at H
alis
har C
SD c
ampu
s Ongoing
Jul-10
Jun-12
2187
1 21
871
0 67
86
6786
0
8279
82
79
0
Ongoing
Ongoing
DG Food
Cons
tructio
n of
1.1
0 la
kh M
T C
apac
ity
Food
God
own
in th
e N
orth
ern
regi
on o
f th
e Co
untr
y
Completed
Jul-09
Jun-12
2410
0 24
100
0 33
92
3392
0
1714
6 17
146
0
Pipeline
Ongoing
DG Food
Cons
tructio
n of
1.3
5 la
kh M
T ca
paci
ty
God
owns
Ongoing
Jul-10
Jun-13
2830
1 28
301
0 11
372
1137
2 0
1437
2 14
372
0
No
Pipeline
DG Food
Cons
tructio
n of
25,
000
mt c
apac
ity
multis
tori
ed w
areh
ouse
at S
anta
har
Silo
Pr
emis
es, B
ogra
Ongoing
Jan-12
Jun-14
2645
6 62
19
2023
7 0
0 0
0 0
0

184 Programme
Subprogramme
Included in CIP 2011 Included in CIP 2012
GoB Agency
Project title
Project Status Project start Project end
Proj
ect b
udge
t for
the
peri
od
Jul'1
0-Ju
n'15
D
eliv
ery
in
FY
2011
/12
Tota
l del
iver
y
sinc
e Ju
l'10
DP
Tota
l G
oB
PA
Tota
l G
oB
PA
Tota
l G
oB
PA
Ongoing
Ongoing
DG Food
Cons
tructio
n of
a C
oncr
ete
Gra
in S
ilo o
f 50
,000
MT
capa
city
at M
ongl
a Po
rt w
ith
Anci
llary
Fac
ility
Ongoing
Jan-10
Dec-13
1994
6 19
946
0 79
5 79
5 0
1594
15
94
0
IDCF
Ongoing
Completed
DG Food Re
cons
tructio
n of
Dila
pida
ted
Food
G
odow
ns a
nd A
ncill
ary
Infr
astr
uctu
res
of
DO
F
Completed
Jul-09
Jun-11
2244
22
44
0 0
0 0
1245
12
45
0
Sub
tota
l Sub
prog
ram
me
8.3
1237
58
1026
81
2107
7 22
344
2234
4 0
4263
5 42
635
0 Su
b to
tal P
rogr
amm
e 8
1237
58
1026
81
2107
7 22
344
2234
4 0
4263
5 42
635
0
9: Effe
ctive
sa
fety
net
s
9.1:
Str
engt
hen
insti
tutio
nal
capa
citie
s to
eff
ectiv
ely
oper
ate
soci
al s
afet
y ne
t pr
ogra
mm
es a
nd
form
ulat
e a
new
in
tegr
ated
st
rate
gy fo
r soc
ial
safe
ty n
et
prog
ram
mes
Pipeline
Ongoing
DRR
Ope
ratio
n Su
ppor
t to
the
empl
oym
ent
gene
ratio
n pr
ogra
mm
e fo
r th
e po
ores
t (E
GPP
)
Ongoing
Jan-11
Dec-13
3660
37
36
23
1257
11
12
46
1270
16
12
55
WB
Sub
tota
l Sub
prog
ram
me
9.1
3660
37
36
23
1257
11
12
46
1270
16
12
55
9: Effe
ctive
sa
fety
net
s
9.2:
Inve
stm
ent i
n em
ploy
men
t and
Ongoing
Ongoing
BRDB
Empl
oym
ent G
uara
ntee
Sch
eme
for
Har
dcor
e Po
or o
f Nor
ther
n Re
gion
Ongoing
Jul-07
Jun-11
4647
46
47
0 58
9 58
9 0
1303
13
03
0
Pipeline
Pipeline
BSRI
Crea
te E
mpl
oym
ent O
ppor
tuni
ty o
f Cha
r D
wel
lers
in G
reat
er R
angp
ur D
istr
ict
thro
ugh
Suga
rcan
e Cu
ltivatio
n
Ongoing
Jul-11
Jun-15
821
821
0 25
0 25
0 0
250
250
0
JDCF
No
Pipeline
DAE
Char
dev
elop
men
t and
sett
lem
ent
proj
ect-
4
Ongoing
Jan-11
Dec-16
675
69
606
102
19
84
102
19
84
IFAD

185 Programme
Subprogramme
Included in CIP 2011 Included in CIP 2012
GoB Agency
Project title
Project Status Project start Project end
Proj
ect b
udge
t for
the
peri
od
Jul'1
0-Ju
n'15
D
eliv
ery
in
FY
2011
/12
Tota
l del
iver
y
sinc
e Ju
l'10
DP
Tota
l G
oB
PA
Tota
l G
oB
PA
Tota
l G
oB
PA
9: Effe
ctive
sa
fety
net
s
inco
me
gene
ratio
n of
so
cial
saf
ety
nets
(in
clud
ing
in A
DP)
9.
2: In
vest
men
t in
empl
oym
ent a
nd
inco
me
gene
ratio
n of
so
cial
saf
ety
nets
(in
clud
ing
in A
DP)
Ongoing
Ongoing
DMB
ECRR
P-D
isas
ter R
isk
Miti
gatio
n an
d Re
ducti
on
Ongoing
Aug-08
Jun-13
6895
0
6895
15
22
0 15
22
2008
0
2008
WB
Ongoing
Ongoing
DOC Li
velih
ood
impr
ovem
ent o
f the
Gar
o co
mm
unity
Completed
Jan-10
Jun-12
825
825
0 65
65
0
629
629
0
JDCF
Pipeline
Ongoing
DOFish
Pove
rty
redu
ction
and
live
lihoo
d se
curi
ty
for t
he p
eopl
e of
eco
nom
ical
ly d
epre
ssed
ar
eas
Ongoing
Apr-10
Dec-13
8319
83
19
0 26
35
2635
0
4070
40
70
0
Ongoing
Ongoing
DoForestry
Pove
rty
redu
ction
thro
ugh
soci
al fo
rest
ry
Ongoing
Mar-10
Dec-13
5235
52
35
0 31
85
3185
0
3335
33
35
0
Ongoing
Ongoing
DPE
EC A
ssis
ted
Scho
ol F
eedi
ng P
rogr
amm
e
Ongoing
Jan-09
Dec-14
2033
6 75
37
1280
0 67
20
39
6681
80
89
75
8013
EU, WFP
Pipeline
Ongoing
DPE
Scho
ol fe
edin
g pr
ogra
mm
e in
pov
erty
pr
one
area
s
Ongoing
Jul-10
Jun-14
1142
80
5977
1 54
509
2343
3 98
83
1355
0 32
323
9883
22
440
WFP
Ongoing
Ongoing
DSS
Serv
ices
for C
hild
ren
at R
isk
(SCA
R)
Ongoing
Jan-09
Dec-14
8930
38
88
92
120
8 11
2 19
3 14
17
9
WB
Ongoing
Ongoing
DSS
Trai
ning
and
Reh
abili
tatio
n Ce
ntre
for
Destit
ute
and
Orp
han
Child
ren
Completed
Jan-10
Jun-12
938
938
0 63
9 63
9 0
739
739
0
Pipeline
Pipeline
DWA
Food
and
Liv
elih
ood
Secu
rity
(FLS
)
Ongoing
Jan-12
Jun-14
2233
3 54
0 21
793
4446
16
0 42
86
4446
16
0 42
86
EU

186 Programme
Subprogramme
Included in CIP 2011 Included in CIP 2012
GoB Agency
Project title
Project Status Project start Project end
Proj
ect b
udge
t for
the
peri
od
Jul'1
0-Ju
n'15
D
eliv
ery
in
FY
2011
/12
Tota
l del
iver
y
sinc
e Ju
l'10
DP
Tota
l G
oB
PA
Tota
l G
oB
PA
Tota
l G
oB
PA
9: Effe
ctive
sa
fety
net
s
9.2:
Inve
stm
ent i
n em
ploy
men
t and
in
com
e ge
neratio
n of
so
cial
saf
ety
nets
(in
clud
ing
in A
DP)
Ongoing
Ongoing
DWA
Vuln
erab
le G
roup
Dev
elop
men
t of u
ltra
poor
wom
en (V
GD
UP)
Completed
Jan-07
Dec-11
1983
6 35
2 19
484
1606
70
15
36
6969
18
3 67
87
EU
Ongoing
Ongoing Jatio Mahila
SangsthaU
rban
Bas
ed M
argi
nal W
omen
D
evel
opm
ent
Ongoing
Jan-09
Sep-13
1882
18
82
0 12
5 12
5 0
253
253
0
Ongoing
Ongoing
LGD
Rura
l Em
ploy
men
t Opp
ortu
nity
for
publ
ic
Asse
ts (R
EOPA
)
Completed
Jul-06
Jun-12
2852
2 50
0 28
022
941
5 93
6 69
41
18
6923
EU, UNDP
Ongoing
Completed
LGED
CDSP
- Cha
r Dev
elop
men
t & S
ettle
men
t pr
ojec
t 3
Completed
Jul-05
Dec-10
3418
50
8 29
10
0 0
0 0
0 0
IFAD, EKN
No
Pipeline
LGED
Char
Dev
elop
men
t & S
ettle
men
t Pro
ject
-4
Ongoing
Jan-11
Dec-16
2336
1 49
96
1836
5 11
18
279
839
1118
27
9 83
9
Ongoing
Ongoing
LGED
Enha
ncin
g Re
silie
nce
unde
r Ba
ngla
desh
Co
untr
y Pr
ogra
mm
e
Completed
Jul-08
Jun-12 21
393
1038
1 11
012
4655
24
74
2181
13
196
3688
95
08
WFP
Ongoing
Ongoing
LGED
Pove
rty
alle
viati
on p
roje
ct th
roug
h ur
ban
parti
cipa
tion
(par
tner
ship
)
Ongoing
Jul-07
Jun-15
8260
2 56
45
7695
7 14
600
262
1433
8 27
753
1328
26
425
DFID, UNDP
Ongoing
Ongoing
LGED
Rura
l Em
ploy
men
t and
Roa
d m
aint
enan
ce
Prog
ram
me
(RER
MP)
Ongoing
Jul-08
Jun-13
9430
0 94
300
0 14
438
1443
8 0
2842
8 28
428
0
Ongoing
Ongoing
MoDMR
Com
preh
ensi
ve D
isas
ter
Man
agem
ent
Prog
ram
me
(2nd
Pha
se)
Ongoing
Jan-10
Dec-14
3610
0 60
1 35
500
5683
60
56
23
1006
7 11
2 99
55
SIDA, Norway, AUSAID,

187
Programme
Subprogramme
Included in CIP 2011 Included in CIP 2012
GoB Agency
Project title
Project Status Project start Project end
Proj
ect b
udge
t for
the
peri
od
Jul'1
0-Ju
n'15
D
eliv
ery
in
FY
2011
/12
Tota
l del
iver
y
sinc
e Ju
l'10
DP
Tota
l G
oB
PA
Tota
l G
oB
PA
Tota
l G
oB
PA
No
Ongoing
MoSW
Supp
ort S
ervi
ce P
rogr
am fo
r the
Soc
ially
D
isad
vant
age
Wom
en a
nd G
irls
Ongoing
Jul-10
Dec-12
642
0 64
2 22
9 0
229
339
0 33
9
UNFPA
Ongoing
Ongoing
RDA Ac
tion
rese
arch
pro
ject
on
'Pov
erty
al
levi
ation
thro
ugh
RDA'
s IG
A tr
aini
ng a
nd
mic
rocr
edit
for
lives
tock
man
agem
ent,
bo
ttlin
g of
bio
gas
and
orga
nic
man
ure
prod
uctio
n at
mon
ga a
reas
'
Ongoing
Jul-09
Jun-14
5156
51
56
0 98
5 98
5 0
1447
14
47
0
Ongoing
Completed
RDCD
Char
Liv
elih
oods
Pro
gram
me
- 1st
revi
sed
Completed
Jul-03
Jun-11
6675
0 90
4 65
846
0 0
0 0
0 0
DFID
No
Pipeline
RDCD
Char
Liv
elih
oods
Pro
gram
me
(CLP
II)
Ongoing
Jul-11
Dec-16
7948
8 12
53
7823
5 28
955
193
2876
2 28
955
193
2876
2
DFID
No
Ongoing
RDCD
Com
preh
ensi
ve V
illag
e D
evel
opm
ent
Prog
ram
2nd
pha
se
Ongoing
Jul-09
Jun-13
1059
3 10
593
0 14
27
1427
0
2793
27
93
0
DFID
Ongoing
Ongoing
RDCD
Econ
omic
Em
pow
erm
ent o
f the
Poo
rest
in
Ban
glad
esh
Ongoing
Feb-08
Jun-15 88
719
319
8840
0 11
532
33
1149
9 23
935
106
2382
9
DFID
Ongoing
Ongoing
RDCD
One
Hou
se O
ne F
arm
Ongoing
Jul-09
Jun-14
1492
92
1492
92
0 44
003
4400
3 0
6243
3 62
433
0
Sub
tota
l Sub
prog
ram
me
9.2
9062
89
3754
22
5308
67
1740
03
8182
3 92
179
2721
14
1217
37
1503
77
Sub
tota
l Pro
gram
me
990
9949
37
5459
53
4490
17
5259
81
834
9342
6 27
3385
12
1753
15
1632

188
Programme
Subprogramme
Included in CIP 2011 Included in CIP 2012
GoB Agency
Project title
Project Status Project start Project end
Proj
ect b
udge
t for
the
peri
od
Jul'1
0-Ju
n'15
D
eliv
ery
in
FY
2011
/12
Tota
l del
iver
y
sinc
e Ju
l'10
DP
Tota
l G
oB
PA
Tota
l G
oB
PA
Tota
l G
oB
PA
10:
Com
mun
ity
base
d nu
triti
on
10:
Com
mun
ity
base
d nu
triti
on
10.1
: Com
mun
ity
base
d liv
elih
ood
and
nutr
ition
pr
ogra
mm
es,
build
ing
on th
e N
ation
al N
utritio
n Se
rvic
e (N
NS)
Pipeline
Pipeline
DGFP
Com
mun
ity B
ased
Hea
lth C
are
(CBH
C)
(HPN
SDP-
OP
3)
Ongoing
Jul-11
Jun-16
2734
4 68
30
2051
4 40
9 0
409
409
0 40
9
GAVI
Pipeline
Pipeline
DGFP
Info
rmati
on, E
ducatio
n an
d Co
mm
unic
ation
(IEC
) (H
PNSD
P-O
P 23
Ongoing
Jul-11
Jun-16
2619
99
4 16
25
374
215
160
374
215
160
Pipeline
Pipeline
DGFP
Mat
erna
l, Ch
ild, R
epro
ducti
ve a
nd
Adol
esce
nt H
ealth
(MCR
AH) (
HPN
SDP-
OP
18)
Ongoing
Jul-11
Jun-16
1485
6 33
83
1147
3 20
22
511
1512
20
22
511
1512
No
Ongoing
DGHS
NN
S-Co
mm
unity
bas
ed N
utritio
n (C
BN) i
n se
lect
ed a
rea
Ongoing
Jul-11
Jun-16
4915
7 14
40
4771
7 0
0 0
0 0
0
No
No
DGHS
NN
S-Co
nsul
tanc
y Se
rvic
e
Ongoing
Jul-11
Jun-16
2154
15
4 20
00
0 0
0 0
0 0
No
Ongoing
DGHS
NN
S-Co
ntro
l & p
reve
ntion
of A
naem
ia
Ongoing
Jul-11
Jun-16 78
00
1800
60
00
12
0 12
12
0
12
No
Ongoing
DGHS
NN
S-Co
ntro
l of I
odin
e de
ficie
ncy
Dis
orde
r
Ongoing
Jul-11
Jun-16
2920
72
0 22
00
0 0
0 0
0 0
No
Ongoing
DGHS
NN
S-Co
ntro
l of V
itam
in-A
defi
cien
cy
diso
rder
Ongoing
Jul-11
Jun-16
1370
0 52
00
8500
18
11
212
1599
18
11
212
1599
No
Ongoing
DGHS
NN
S-Es
tabl
ishm
ent o
f nut
ritio
n Se
rvic
e in
CC
& G
MP
Ongoing
Jul-11
Jun-16
1262
1 50
0 12
121
0 0
0 0
0 0

189
Programme
Subprogramme
Included in CIP 2011 Included in CIP 2012
GoB Agency
Project title
Project Status Project start Project end
Proj
ect b
udge
t for
the
peri
od
Jul'1
0-Ju
n'15
D
eliv
ery
in
FY
2011
/12
Tota
l del
iver
y
sinc
e Ju
l'10
DP
Tota
l G
oB
PA
Tota
l G
oB
PA
Tota
l G
oB
PA
10:
Com
mun
ity
base
d nu
triti
on
10.1
: Com
mun
ity
base
d liv
elih
ood
and
nutr
ition
pr
ogra
mm
es,
build
ing
on th
e N
ation
al N
utritio
n Se
rvic
e (N
NS)
No
No
DGHS
NN
S-Fo
od fo
rtific
ation
(Sal
t Iod
izati
on,
fortific
ation
of o
il/ot
her
food
with
Vi
tam
in ‘A
’, ir
on e
tc.)
Ongoing
Jul-11
Jun-16
1400
10
0 13
00
0 0
0 0
0 0
No
No
DGHS N
NS-
Food
Qua
lity
and
Food
Saf
ety
Ongoing
Jul-11
Jun-16
2500
54
0 19
60
0 0
0 0
0 0
No
No
DGHS
NN
S-H
uman
res
ourc
e de
velo
pmen
t (H
RD)-
HN
PSP
Ongoing
Jul-11
Jun-16
8930
31
30
5800
18
7 0
187
187
0 18
7
No
No
DGHS
NN
S-In
stitutio
nal C
apac
ity D
evel
opm
ent
a) O
rien
tatio
n an
d A
dvoc
acy
of d
ivis
ion/
di
stri
ct u
pazi
la m
anag
ers
Ongoing
Jul-11
Jun-16
8658
64
46
2212
62
9 36
59
3 62
9 36
59
3
No
No
DGHS
NN
S-M
ulti
sect
oral
col
labo
ratio
n
Ongoing
Jul-11
Jun-16
2012
14
0 18
72
0 0
0 0
0 0
Pipeline
Pipeline
DGHS
NN
S-N
on-C
omm
unic
able
Dis
ease
s an
d ot
her p
ublic
hea
lth in
terv
entio
n (N
CD)
(HPN
SDP-
OP
7)-H
NPS
P
Ongoing
Jul-11
Jun-16
6645
17
69
4875
96
2 41
1 55
1 96
2 41
1 55
1
No
Ongoing
DGHS
NN
S-N
utritio
n in
em
erge
ncy
Ongoing
Jul-11
Jun-16
2736
20
0 25
36
0 0
0 0
0 0
No
Ongoing
DGHS
NN
S-O
ther
Mic
ronu
trie
nt p
robl
ems
of
Publ
ic H
ealth
impo
rtan
ce (
zinc
, vita
min
‘D
,’ ca
lciu
m e
tc.)
Ongoing
Jul-11
Jun-16
1700
18
0 15
20
0 0
0 0
0 0
Pipeline
Pipeline
DGHS
NN
S-Pl
anni
ng, M
onito
ring
and
Res
earc
h
Ongoing
Jul-11
Jun-16
5300
10
00
4300
51
1 10
4 40
7 51
1 10
4 40
7

190
Programme
Subprogramme
Included in CIP 2011 Included in CIP 2012
GoB Agency
Project title
Project Status Project start Project end
Proj
ect b
udge
t for
the
peri
od
Jul'1
0-Ju
n'15
D
eliv
ery
in
FY
2011
/12
Tota
l del
iver
y
sinc
e Ju
l'10
DP
Tota
l G
oB
PA
Tota
l G
oB
PA
Tota
l G
oB
PA
No
Ongoing
DGHS
NN
S-Pr
otectio
n, P
rom
otion
& S
uppo
rt o
f Br
eastf
eedi
ng/
Infa
nt a
nd Y
oung
Chi
ld
Feed
ing
(IYCF
) inc
ludi
ng B
FHI &
BM
S Co
de
Ongoing
Jul-11
Jun-16
3911
57
0 33
41
158
0 15
8 15
8 0
158
No
No
DGHS N
NS-
Scho
ol N
utritio
nal e
ducatio
n Pr
ogra
m
Ongoing
Jul-11
Jun-16
6416
48
0 59
36
142
0 14
2 14
2 0
142
No
Ongoing
DOFish
Stre
ngth
enin
g of
fish
erie
s an
d aq
uacu
lture
food
saf
ety
and
qual
ity
man
agem
ent s
yste
m in
Ban
glad
esh
Ongoing
Jul-10
Dec-14
9760
49
68
4792
16
18
215
1403
27
01
752
1950
EU
Ongoing
Ongoing
ERD
Prot
ectin
g an
d Pr
omoti
ng F
ood
Secu
rity
an
d N
utritio
n fo
r Fa
mili
es a
nd C
hild
ren
in
Bang
lade
sh
Ongoing
Mar-10
Mar-13
5549
0
5549
22
92
0 22
92
2292
0
2292
MDG-F (Spain)
Ongoing
Completed
MoHFW
Mic
ro N
utri
ent S
uppl
emen
tatio
n-H
NPS
P
Completed
Jul-03
Jun-11
1049
2 27
56
7736
0
0 0
1855
29
9 15
56
Ongoing
Completed
MoHFW
Nati
onal
Nut
ritio
n Pr
ogra
mm
e N
NP
Completed
Jul-03
Jun-11
1250
52
1434
4 11
0708
0
0 0
3731
10
11
2720
Sub
tota
l Sub
prog
ram
me
10.1
3342
32
5764
3 27
6589
11
127
1702
94
24
1779
7 35
49
1424
8
10:
Com
mun
ity
base
d nu
triti
on
10.2
: Sup
port
co
mm
unity
bas
ed
effor
ts o
f ho
mes
tead
ga
rden
ing,
rear
ing
smal
l liv
esto
ck,
aqua
cultu
re a
nd
awar
enes
s bu
ildin
g fo
r im
prov
ed
nutr
ition
Ongoing
Completed
DLS
Cons
ervatio
n &
Impr
ovem
ent o
f Nati
ve
Shee
p Th
roug
h Co
mm
unity
Far
min
g &
Co
mm
erci
al F
arm
ing
Proj
ect (
com
pone
nt
B)
Completed
Jul-06
Jun-11
385
385
0 0
0 0
74
74
0
Sub
tota
l Sub
prog
ram
me
10.2
385
385
0 0
0 0
74
74
0
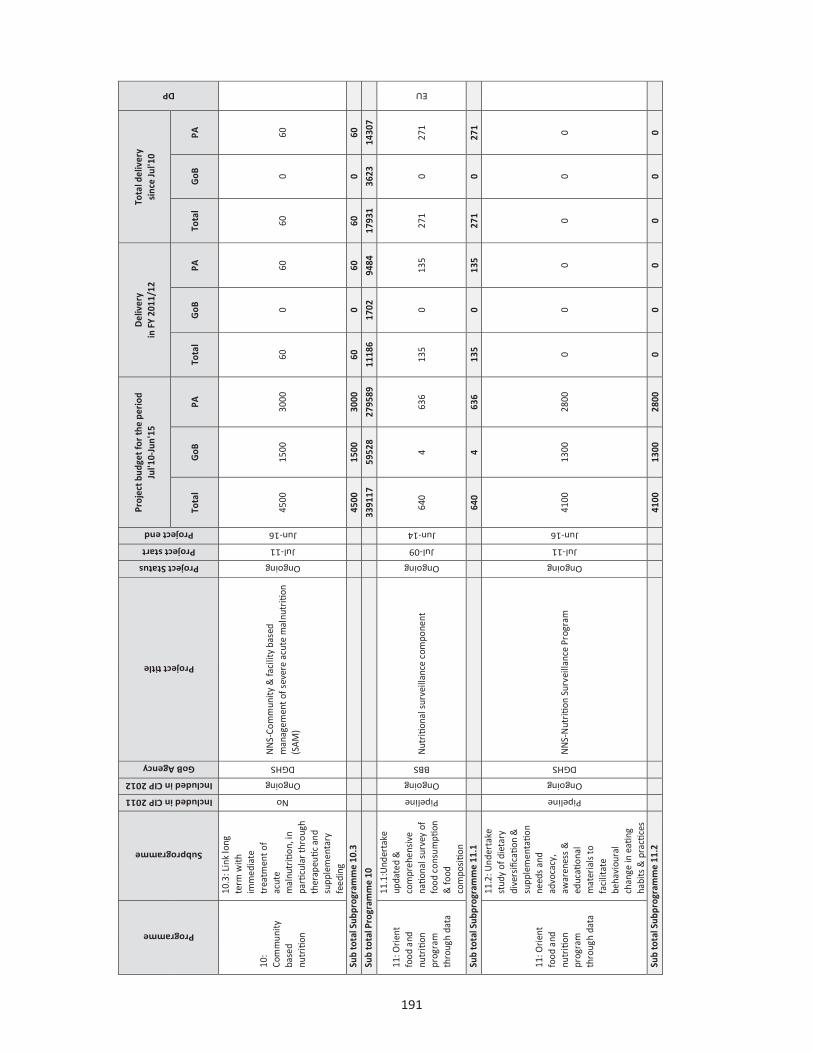
191 Programme
Subprogramme
Included in CIP 2011 Included in CIP 2012
GoB Agency
Project title
Project Status Project start Project end
Proj
ect b
udge
t for
the
peri
od
Jul'1
0-Ju
n'15
D
eliv
ery
in
FY
2011
/12
Tota
l del
iver
y
sinc
e Ju
l'10
DP
Tota
l G
oB
PA
Tota
l G
oB
PA
Tota
l G
oB
PA
10:
Com
mun
ity
base
d nu
triti
on
10.3
: Lin
k lo
ng
term
with
im
med
iate
tr
eatm
ent o
f ac
ute
mal
nutr
ition
, in
parti
cula
r thr
ough
th
erap
eutic
and
su
pple
men
tary
fe
edin
g
No
Ongoing
DGHS N
NS-
Com
mun
ity &
faci
lity
base
d m
anag
emen
t of s
ever
e ac
ute
mal
nutr
ition
(S
AM)
Ongoing
Jul-11
Jun-16
4500
15
00
3000
60
0
60
60
0 60
Sub
tota
l Sub
prog
ram
me
10.3
45
00
1500
30
00
60
0 60
60
0
60
Sub
tota
l Pro
gram
me
10
3391
17
5952
8 27
9589
11
186
1702
94
84
1793
1 36
23
1430
7
11: O
rient
fo
od a
nd
nutr
ition
pr
ogra
m
thro
ugh
data
11.1
:Und
erta
ke
upda
ted
&
com
preh
ensi
ve
natio
nal s
urve
y of
fo
od c
onsu
mpti
on
& fo
od
com
positio
n
Pipeline
Ongoing
BBS
Nut
ritio
nal s
urve
illan
ce c
ompo
nent
Ongoing
Jul-09
Jun-14
640
4 63
6 13
5 0
135
271
0 27
1
EU
Sub
tota
l Sub
prog
ram
me
11.1
64
0 4
636
135
0 13
5 27
1 0
271
11: O
rient
fo
od a
nd
nutr
ition
pr
ogra
m
thro
ugh
data
11.2
: Und
erta
ke
stud
y of
die
tary
di
vers
ificatio
n &
su
pple
men
tatio
n ne
eds
and
advo
cacy
, aw
aren
ess
&
educ
ation
al
mat
eria
ls to
fa
cilit
ate
beha
viou
ral
chan
ge in
eati
ng
habi
ts &
pra
ctice
s
Pipeline
Ongoing
DGHS
NN
S-N
utritio
n Su
rvei
llanc
e Pr
ogra
m
Ongoing
Jul-11
Jun-16
4100
13
00
2800
0
0 0
0 0
0
Sub
tota
l Sub
prog
ram
me
11.2
41
00
1300
28
00
0 0
0 0
0 0

192 Programme
Subprogramme
Included in CIP 2011 Included in CIP 2012
GoB Agency
Project title
Project Status Project start Project end
Proj
ect b
udge
t for
the
perio
d Ju
l'10-
Jun'
15
Del
iver
y
in F
Y 20
11/1
2 To
tal d
eliv
ery
si
nce
Jul'1
0
DP
Tota
l G
oB
PA
Tota
l G
oB
PA
Tota
l G
oB
PA
11: O
rient
fo
od a
nd
nutr
ition
pr
ogra
m
thro
ugh
data
11.3
: Str
engt
hen
natio
nal c
apac
ities
in
surv
eyin
g an
d an
alys
is to
fa
cilit
ate
evid
ence
ba
sed
deci
sion
s
Ongoing
Completed
BBS
Agric
ultu
re C
ensu
s Pr
ojec
t-20
07
Completed
Jul-07
Jun-11
3995
39
95
0 0
0 0
170
170
0
FAO
Ongoing
Completed
BBS As
sist
ance
in th
e da
ta p
roce
ssin
g an
d an
alys
is o
f the
Ban
glad
esh
cens
us o
f ag
ricul
ture
Completed
Jul-09
Jun-11
11
0 11
0
0 0
11
0 11
FAO
Ongoing
Ongoing
BBS
Mon
itorin
g th
e si
tuati
on o
f Chi
ldre
n an
d W
omen
(Pha
se 2
)
Completed
Jul-07
Dec-11
1062
58
10
04
41
6 35
45
8 17
44
1
UNICEF
No
No
BBS
Mon
itorin
g th
e si
tuati
on o
f Chi
ldre
n an
d W
omen
(Pha
se 3
)
Ongoing
Jan-12
Dec-13
94
8 86
0
0
UNICEF
No
No
DGHS
NN
S-Es
tabl
ishm
ent o
f nut
rition
uni
t (N
U)
and
stre
ngth
enin
g of
exi
stin
g N
U
Ongoing
Jul-11
Jun-16
4494
26
28
1866
36
6 0
366
366
0 36
6
No
Ongoing
DGHS
NN
S-M
onito
ring,
Eva
luati
on, O
peratio
ns
Rese
arch
, Sur
vey
Ongoing
Jul-11
Jun-16 23
00
500
1800
0
0 0
0 0
0
Sub
tota
l Sub
prog
ram
me
11.3
11
956
7189
47
67
407
6 40
1 10
04
187
817
Sub
tota
l Pro
gram
me
11
1669
6 84
93
8203
54
3 6
537
1275
18
7 10
89
12: F
ood
Safe
ty a
nd
Qua
lity
Impr
ovem
ent
12.1
: Im
prov
e su
rvei
llanc
e sy
stem
of f
ood
born
e ill
ness
es
Ongoing
Ongoing
MoHFW
Impr
ovin
g Fo
od S
afet
y, Q
ualit
y an
d Fo
od
Cont
rol i
n Ba
ngla
desh
Ongoing
Jan-09
Dec-12
2393
27
4 21
19
293
0 29
3 45
6 15
44
1
EU
Sub
tota
l Sub
prog
ram
me
12.1
23
93
274
2119
29
3 0
293
456
15
441
12: F
ood
Safe
ty a
nd
Qua
lity
Impr
ovem
ent
12.2
: Dev
elop
and
en
hanc
e ca
pacitie
s of
la
bora
torie
s and
sy
stem
s for
food
Ongoing
Ongoing
MoHFW
Impr
ovin
g Fo
od S
afet
y, Q
ualit
y an
d Fo
od
Cont
rol i
n Ba
ngla
desh
Ongoing
Jan-09
Dec-12
1595
18
3 14
13
195
0 19
5 30
4 10
29
4
EU

193
Programme
Subprogramme
Included in CIP 2011 Included in CIP 2012
GoB Agency
Project title
Project Status Project start Project end
Proj
ect b
udge
t for
the
perio
d Ju
l'10-
Jun'
15
Del
iver
y
in F
Y 20
11/1
2 To
tal d
eliv
ery
si
nce
Jul'1
0
DP
Tota
l G
oB
PA
Tota
l G
oB
PA
Tota
l G
oB
PA
qual
ity a
ssur
ance
an
d sa
fety
and
co
ntro
l of f
ood
Sub
tota
l Sub
prog
ram
me
12.2
15
95
183
1413
19
5 0
195
304
10
294
12: F
ood
Safe
ty a
nd
Qua
lity
Impr
ovem
ent
12.3
: Sup
port
the
deve
lopm
ent o
f a
mod
ern
food
co
ntro
l m
anag
emen
t sy
stem
No
Ongoing
BARI
Deve
lopm
ent o
f saf
e ve
geta
ble
prod
uctio
n te
chno
logy
util
izin
g m
unic
ipal
or
gani
c w
aste
in p
eri u
rban
are
as
Ongoing
Jan-11
Jun-13
919
919
0 39
5 39
5 0
395
395
0
JDCF
No
Ongoing
DOFish
Cont
rol o
f for
mal
in u
se in
fish
pr
eser
vatio
n an
d m
ass a
war
enes
s
Ongoing
Mar-11
Jun-14
699
699
0 33
0 33
0 0
330
330
0
Ongoing
Ongoing
DPHE
Stre
ngth
enin
g ca
paci
ty fo
r wat
er q
ualit
y an
alys
is a
nd m
onito
ring
syst
em in
Ba
ngla
desh
Completed
Apr-09
Mar-12
2143
20
21
23
2142
19
21
23
2142
19
21
23
EU
Ongoing
Ongoing
MoHFW
Impr
ovin
g Fo
od S
afet
y, Q
ualit
y an
d Fo
od
Cont
rol i
n Ba
ngla
desh
Ongoing
Jan-09
Dec-12
3989
45
7 35
31
488
0 48
8 76
0 25
73
5
EU
Sub
tota
l Sub
prog
ram
me
12.3
77
49
2095
56
54
3354
74
4 26
10
3626
76
9 28
57
Sub
tota
l Pro
gram
me
12
1173
8 25
52
9186
38
42
744
3098
43
86
794
3592
To
tal p
roje
ct c
ost
5656
955
3387
304
2269
651
6344
00
3596
82
2747
18
1155
317
6879
81
4673
35

194 Anne
x 3.
5 Pr
ojec
ts in
the
CIP
pipe
line
as o
f Jun
e 20
12 (u
pdat
ed T
able
4.6
of C
IP 2
011)
Prog
ram
me
Subp
rogr
amm
e
Included in CIP 2011
Included in CIP 2012
GoB Agency
Proj
ect ti
tle
Fund
s re
quire
d
betw
een
2012
-15
(lakh
taka
)
Suggested DP
Fund
s re
quire
d
betw
een
2012
-15
(mill
ion
USD
)
Tota
l G
oB
PA
Tot
al
GoB
PA
1.1:
Enh
ance
rese
arch
& k
now
ledg
e ge
neratio
n an
d ad
optio
n to
incr
ease
ag
ricul
tura
l pro
ducti
vity
and
div
ersit
y in
a
sust
aina
ble
man
ner
No
No
BARI
Im
prov
ing
the
Rese
arch
and
Re
sear
ch in
fras
truc
ture
of B
ARI
1600
0
1600
0 0
23
23
0
Yes
Yes
BJRI
De
velo
pmen
t and
Dis
sem
inati
on
of A
gric
ultu
ral
Tech
nolo
gies
for
Jute
and
Alli
ed F
iber
Cro
ps
988
98
8 0
1 1
0
Sub
tota
l sub
prog
ram
me
1.1
16
988
16
988
0 24
24
0
1: S
usta
inab
le
and
dive
rsifi
ed
agric
ultu
re
1.2:
Impr
ove
exte
nsio
n se
rvic
es to
pr
opag
ate
know
ledg
e &
pra
ctice
s, su
ppor
ted
by c
omm
unity
-bas
ed
expe
rimen
tatio
n &
lear
ning
and
indi
geno
us
know
ledg
e
Yes
Yes
AIS
Prom
otion
of
Digi
tal K
rishi
and
Li
velih
ood
Impr
ovem
ent t
hrou
gh
Agric
ultu
re &
com
mun
icati
on
Cent
er
1880
18
80
0
3 3
0
No
Yes
BADC
M
agur
a-Je
ssor
e- N
oril-
Khul
na-
Satk
hira
Inte
grat
ed A
gric
ultu
ral
Deve
lopm
ent P
roje
ct
2499
3
2499
3 0
36
36
0
Yes
Yes
BADC
Sy
lhet
Div
isio
n In
tegr
ated
Irr
igati
on D
evel
opm
ent P
roje
ct
8429
84
29
0
12
12
0
Yes
Yes
DAE
Gre
ater
Mym
ensin
gh In
tegr
ated
Ag
ricul
tura
l Dev
elop
men
t Pro
ject
53
310
53
310
0
77
77
0
No
Yes
DAE
Inte
grat
ed a
gric
ultu
ral
deve
lopm
ent p
roje
ct o
f Eas
t re
gion
20
37
0 20
37
3 0
3
Yes
Yes
DAE
Land
Util
izati
on a
nd C
rop
Inte
nsifi
catio
n in
Syl
het R
egio
n (P
hase
I)
4750
0
4750
0 0
68
68
0
No
Yes
DAE
Piro
jpur
Gop
alga
nj B
ager
hat
inte
grat
ed a
gric
ultu
ral
deve
lopm
ent p
roje
ct
2588
6
2588
6 0
37
37
0
No
Yes
DAE
Po
pula
risati
on o
f use
lea f
colo
ur
char
t and
sav
ing
urea
thro
ugh
its
use
0
0 0
0
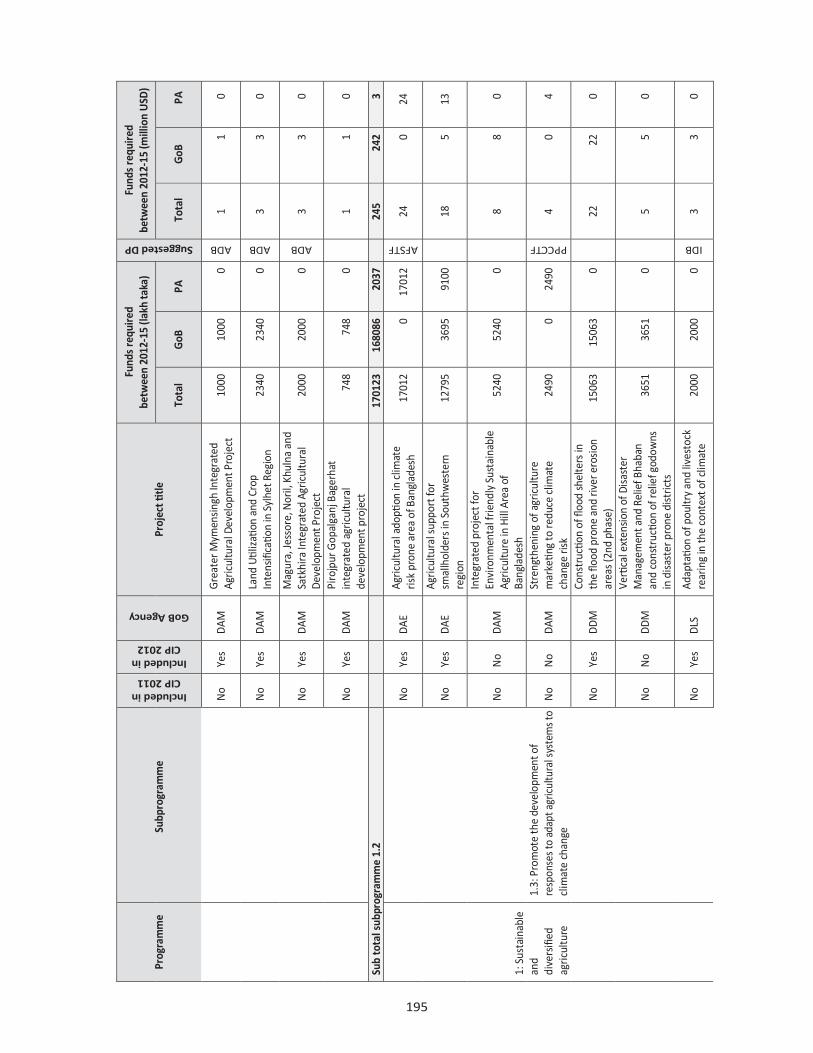
195 Prog
ram
me
Subp
rogr
amm
e
Included in CIP 2011
Included in CIP 2012
GoB Agency
Proj
ect ti
tle
Fund
s re
quire
d
betw
een
2012
-15
(lakh
taka
)
Suggested DP
Fund
s re
quire
d
betw
een
2012
-15
(mill
ion
USD
)
Tota
l G
oB
PA
Tot
al
GoB
P
A
No
Yes
DAM
G
reat
er M
ymen
singh
Inte
grat
ed
Agric
ultu
ral D
evel
opm
ent P
roje
ct
1000
10
00
0
ADB
1 1
0
No
Yes
DAM
La
nd Util
izati
on a
nd C
rop
Inte
nsifi
catio
n in
Syl
het R
egio
n
2340
23
40
0
ADB
3 3
0
No
Yes
DAM
M
agur
a, Je
ssor
e, N
oril,
Khu
lna
and
Satk
hira
Inte
grat
ed A
gric
ultu
ral
Deve
lopm
ent P
roje
ct
2000
20
00
0
ADB
3 3
0
No
Yes
DAM
Pi
rojp
ur G
opal
ganj
Bag
erha
t in
tegr
ated
agr
icul
tura
l de
velo
pmen
t pro
ject
74
8
748
0
1 1
0
Sub
tota
l sub
prog
ram
me
1.2
1701
23
1680
86
2037
245
242
3
1: S
usta
inab
le
and
dive
rsifi
ed
agric
ultu
re
1.3:
Pro
mot
e th
e de
velo
pmen
t of
resp
onse
s to
adap
t agr
icul
tura
l sys
tem
s to
clim
ate
chan
ge
No
Yes
DAE
Agric
ultu
ral a
dopti
on in
clim
ate
risk
pron
e ar
ea o
f Ban
glad
esh
1701
2
0
1701
2
AFSTF
24
0
24
No
Yes
DAE
Agric
ultu
ral s
uppo
rt fo
r sm
allh
olde
rs in
Sou
thw
este
rn
regi
on
1279
5
3695
91
00
18
5
13
No
No
DAM
Inte
grat
ed p
roje
ct fo
r En
viro
nmen
tal f
riend
ly S
usta
inab
le
Agric
ultu
re in
Hill
Are
a of
Ba
ngla
desh
5240
52
40
0
8 8
0
No
No
DAM
St
reng
then
ing
of a
gric
ultu
re
mar
ketin
g to
redu
ce c
limat
e ch
ange
risk
24
90
0
2490
PPCCTF
4 0
4
No
Yes
DDM
Co
nstr
uctio
n of
floo
d sh
elte
rs in
th
e flo
od p
rone
and
rive
r ero
sion
ar
eas (
2nd
phas
e)
1506
3
1506
3
0
22
22
0
No
No
DDM
Verti
cal e
xten
sion
of D
isas
ter
Man
agem
ent a
nd R
elie
f Bha
ban
and
cons
tructio
n of
relie
f god
owns
in
dis
aste
r pro
ne d
istric
ts
3651
36
51
0
5 5
0
No
Yes
DLS
Adap
tatio
n of
pou
ltry
and
lives
tock
re
arin
g in
the
cont
ext o
f clim
ate
2000
20
00
0
IDB
3 3
0

196
Prog
ram
me
Subp
rogr
amm
e
Included in CIP 2011
Included in CIP 2012
GoB Agency
Proj
ect ti
tle
Fund
s re
quire
d
betw
een
2012
-15
(lakh
taka
)
Suggested DP
Fund
s re
quire
d
betw
een
2012
-15
(mill
ion
USD
)
Tota
l G
oB
PA
Tot
al
GoB
P
A
chan
ge
No
Yes
LGED
Co
nstr
uctio
n of
Inte
grat
ed d
isast
er
shel
ter p
roje
ct
2400
00
0
2400
00
IDA
345
0 34
5
No
Yes
Mo
Food
Cl
imati
c ch
ange
rela
ted
drou
ght
man
agem
ent p
roje
ct
1380
0
0
1380
0
20
0 20
No
No
MoA
In
tegr
ated
Env
ironm
enta
l Frie
ndly
Pr
ojec
t for
Hill
Tra
cts
2500
0
0
2500
0
36
0 36
No
No
MoD
MR
Esta
blis
hmen
t of B
angl
ades
h Di
sast
er M
anag
emen
t Tra
inin
g an
d Re
sear
ch In
stitu
te
1404
0
1404
0
0
20
20
0
No
No
MoD
MR
Proc
urem
ent o
f sal
ine
w
ater
trea
tmen
t pla
nt
1800
0
1800
0
0
26
26
0
No
Yes
RDA
Multip
urpo
se u
se o
f sw
eet w
ater
fo
r clim
ate
victi
ms f
or li
velih
ood
impr
ovem
ent
1380
0
1031
6
3484
20
15
5
Sub
tota
l sub
prog
ram
me
1.3
38
2891
72
005
31
0886
551
104
447
Su
b to
tal P
rogr
amm
e 1
57
0001
25
7078
31
2923
820
370
450
2: Im
prov
ed
wat
er
man
agem
ent
2.1:
Impr
ove
wat
er m
anag
emen
t in
wat
er
dist
ributi
on sy
stem
s and
at f
arm
leve
l
No
No
BADC
Ea
ster
n In
tegr
ated
Irrig
ated
Are
a De
velo
pmen
t Pro
ject
11
400
11
400
0
16
16
0
No
Yes
BADC
Proj
ect f
or ir
rigati
on e
xpan
sion
in
pove
rty
pron
e ar
eas u
nder
Gre
ater
Ra
ngpu
r dist
rict t
hrou
gh m
oder
n m
inor
irrig
ation
pra
ctice
s
4234
42
34
0
6 6
0
Yes
Yes
BMDA
M
easu
ring
usag
e an
d en
ergy
of
pre-
paid
pum
p ba
sed
on sm
art
card
24
85
2485
0
4 4
0
No
Yes
BRDB
Irr
igati
on e
xpan
sion
prog
ram
me
1983
19
83
0
3 3
0
Sub
tota
l sub
prog
ram
me
2.1
20
102
20
102
0
2929
0

197
Prog
ram
me
Subp
rogr
amm
e
Included in CIP 2011
Included in CIP 2012
GoB Agency
Proj
ect ti
tle
Fund
s re
quir
ed
betw
een
2012
-15
(lakh
taka
)
Suggested DP
Fund
s re
quir
ed
betw
een
2012
-15
(mill
ion
USD
)
Tota
l G
oB
PA
Tot
al
GoB
P
A
2: Im
prov
ed
wat
er
man
agem
ent
2.2:
Impr
ove
& in
crea
se effi
cien
cy o
f su
rfac
e w
ater
irrig
ation
, in
parti
cula
r in
the
sout
h
No
No
BMD
A Im
prov
ing
surf
ace
wat
er ir
rigati
on
thro
ugh
rech
arge
wel
l and
m
aint
enan
ce o
f old
dee
p tu
bew
ell
0
0 0
0
Yes
Yes
BMD
A Ir
rigati
on P
rogr
amm
e Th
roug
h Su
rfac
e W
ater
Aug
men
tatio
n 50
00
5000
0
7 7
0
Yes
Yes
BWDB
Ch
andp
ur-C
omill
a In
tegr
ated
Fl
ood
Cont
rol,
Dra
inag
e an
d Ir
rigati
on P
roje
ct
1223
8 12
238
0
18
18
0
No
Yes
BWDB
Char
Kuk
ri-M
ikri flo
od c
ontr
ol,
drai
nage
and
pre
venti
on o
f sal
ine
wat
er in
trus
ion
proj
ect i
n th
e di
stric
t of B
hola
1326
1 13
261
0
19
19
0
No
Yes
BWDB
Fl
ood
cont
rol a
nd d
evel
opm
ent o
f Ka
mra
ngir
Char
10
805
1080
5 0
16
16
0
No
Yes
BWDB
Inte
grat
ed w
ater
reso
urce
s m
anag
emen
t of C
hala
n be
el a
rea
incl
udin
g be
el H
aloti
dev
elop
men
t pr
ojec
t
3640
5 36
405
0
52
52
0
No
Yes
BWDB
Ku
rigra
m Ir
rigati
on P
roje
ct (N
orth
U
nit)
53
700
0 53
700
IDB
77
0
77
No
Yes
BWDB
Re
-exc
avati
on o
f Kum
ar ri
ver
5294
52
94
0
IDB
8 8
0
No
Yes
BWDB
Re-e
xcav
ation
/dre
dgin
g of
M
ahan
anda
rive
r fro
m K
halg
at to
N
asip
ur a
t Sad
ar U
pazi
lla in
Ch
apai
naw
abga
nj D
istr
ict
7674
76
74
0
11
11
0
No
Yes
BWDB
Re
habi
litati
on o
f Rak
tada
h-Lo
hach
ura
beel
dra
inag
e sc
hem
e in
Nao
gaon
Dis
tric
t 17
20
1720
0
2 2
0
No
Yes
BWDB
Ri
ver b
ank
prot
ectio
n, fl
ood
cont
rol a
nd ir
rigati
on u
mbr
ella
pr
ojec
t (64
sub
-pro
ject
s)
5297
4 0
5297
4
76
0
76

198
Prog
ram
me
Subp
rogr
amm
e
Included in CIP 2011
Included in CIP 2012
GoB Agency
Proj
ect ti
tle
Fund
s re
quir
ed
betw
een
2012
-15
(lakh
taka
)
Suggested DP
Fund
s re
quir
ed
be
twee
n 20
12-1
5 (m
illio
n U
SD)
Tota
l G
oB
PA
Tot
al
GoB
P
A
Sub
tota
l sub
prog
ram
me
2.2
1990
71
9239
6
1066
75
286
133
15
3
Sub
tota
l Pro
gram
me
2
21
9173
11
2498
10
6675
315
162
15
3
3: Im
prov
ed
qual
ity o
f in
put a
nd s
oil
ferti
lity
3.1:
Enh
ance
ava
ilabi
lity
of a
gric
ultu
ral
inpu
ts, t
este
d an
d ce
rtifie
d fo
r qua
lity
of
dive
rsifi
ed c
rops
Yes
Yes
BAD
C In
tegr
ated
Agr
icul
ture
Pro
ducti
vity
Pr
ojec
t (IA
PP)
1610
69
2
917
GAFSP
2 1
1
No
No
BCIC
As
hugo
nj F
ertil
izer
Pro
ject
-II
0
0 0
0
No
No
BCIC
BM
R of
TSP
Com
plex
Ltd
. (TS
PCL)
45
000
45
000
0
65
65
0
No
No
BCIC
Co
nstr
uctio
n of
13
new
buff
er
godo
wns
at d
iffer
ent d
istr
icts
for
faci
litati
ng fe
rtiliz
er d
istr
ibuti
on
1380
6
1380
6
0
20
20
0
No
No
BCIC
N
orth
-wes
t fertil
izer
pro
ject
(N
WFP
) 54
9259
12
4219
42
5040
790
179
61
2
No
No
BCIC
Seng
up
of a
Mod
ern,
ene
rgy
effici
ent w
ith h
ighe
r cap
acity
ure
a fe
rtiliz
er fa
ctor
y in
the
vaca
nt la
nd
of U
FFL
& P
UFF
L
0
0 0
0
No
No
BCIC
Sust
aini
ng th
e In
stal
led
rate
d pr
oductio
n ca
paci
ty b
y re
pairi
ng o
f Ch
iag
ong
urea
Fertil
izer
Ltd
. (C
UFL
)
8000
0
8000
0
0
115
115
0
Yes
Yes
BMD
A En
hanc
ing
seed
pro
duci
ng c
apac
ity
of B
MD
A 34
16
3416
0
5 5
0
Sub
tota
l sub
prog
ram
me
3.1
6930
91
2671
33
4259
57
997
384
61
3
3: Im
prov
ed
qual
ity o
f in
put a
nd s
oil
ferti
lity
3.2:
Dev
elop
pub
lic p
rivat
e pa
rtne
rshi
ps
thro
ugh
capa
city
dev
elop
men
t
No
No
BAD
C
Esta
blis
hing
See
d Pr
oces
sing
Ce
nter
and
Enh
anci
ng S
eed
multip
licati
on fa
rm a
t Sub
arna
char
in
Noa
khal
i
2400
24
00
0
3 3
0
No
No
BAD
C
Mai
nten
ance
and
reha
bilit
ation
of
existin
g fe
rtiliz
er s
tora
ge a
nd
stre
ngth
enin
g fe
rtiliz
er
man
agem
ent
2828
6
2828
6
0
41
41
0
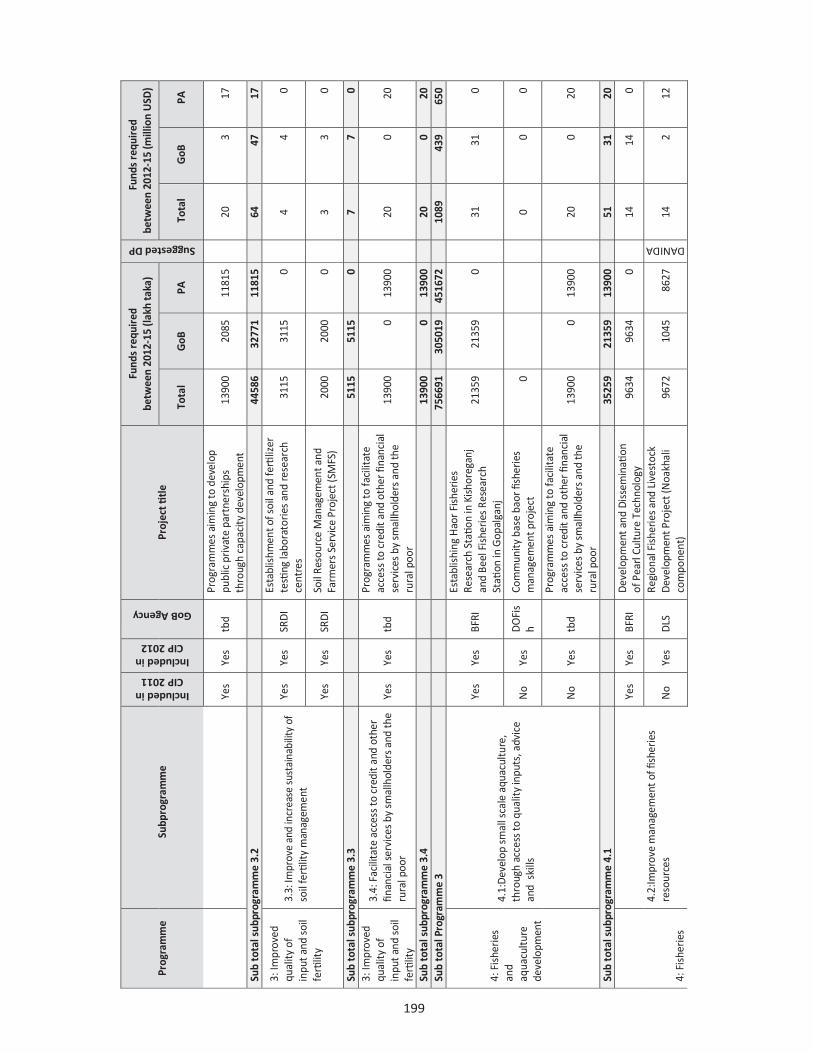
199
Prog
ram
me
Subp
rogr
amm
e
Included in CIP 2011
Included in CIP 2012
GoB Agency
Proj
ect ti
tle
Fund
s re
quir
ed
betw
een
2012
-15
(lakh
taka
)
Suggested DP
Fund
s re
quir
ed
betw
een
2012
-15
(mill
ion
USD
)
Tota
l G
oB
PA
Tot
al
GoB
P
A
Yes
Yes
tbd
Prog
ram
mes
aim
ing
to d
evel
op
publ
ic p
rivat
e pa
rtne
rshi
ps
thro
ugh
capa
city
dev
elop
men
t 13
900
2085
11
815
20
3 17
Sub
tota
l sub
prog
ram
me
3.2
4458
6 32
771
1181
5
6447
17
3: Im
prov
ed
qual
ity o
f in
put a
nd s
oil
ferti
lity
3.3:
Impr
ove
and
incr
ease
sus
tain
abili
ty o
f so
il fe
rtilit
y m
anag
emen
t
Yes
Yes
SRD
I Es
tabl
ishm
ent o
f soi
l and
ferti
lizer
te
sting
labo
rato
ries
and
rese
arch
ce
ntre
s
3115
31
15
0
4 4
0
Yes
Yes
SRD
I So
il Re
sour
ce M
anag
emen
t and
Fa
rmer
s Se
rvic
e Pr
ojec
t (SM
FS)
2000
20
00
0
3 3
0
Sub
tota
l sub
prog
ram
me
3.3
5115
51
15
0
77
0 3:
Impr
oved
qu
ality
of
inpu
t and
soi
l fe
rtilit
y
3.4:
Fac
ilita
te a
cces
s to
cre
dit a
nd o
ther
fin
anci
al s
ervi
ces
by s
mal
lhol
ders
and
the
rura
l poo
r Ye
s Ye
s tb
d
Prog
ram
mes
aim
ing
to fa
cilit
ate
acce
ss to
cre
dit a
nd o
ther
fina
ncia
l se
rvic
es b
y sm
allh
olde
rs a
nd th
e ru
ral p
oor
1390
0 0
1390
0
20
0 20
Sub
tota
l sub
prog
ram
me
3.4
1390
0 0
1390
0
200
20
Sub
tota
l Pro
gram
me
3
75
6691
30
5019
45
1672
1089
439
650
4: F
ishe
ries
and
aqua
cultu
re
deve
lopm
ent
4.1:
Dev
elop
sm
all s
cale
aqu
acul
ture
, th
roug
h ac
cess
to q
ualit
y in
puts
, adv
ice
and
ski
lls
Yes
Yes
BFRI
Esta
blis
hing
Hao
r Fis
herie
s Re
sear
ch S
tatio
n in
Kis
hore
ganj
an
d Be
el F
ishe
ries
Rese
arch
St
ation
in G
opal
ganj
2135
9 21
359
0
31
31
0
No
Yes
DO
Fis
h Co
mm
unity
bas
e ba
or fi
sher
ies
man
agem
ent p
roje
ct
0
0 0
0
No
Yes
tbd
Prog
ram
mes
aim
ing
to fa
cilit
ate
acce
ss to
cre
dit a
nd o
ther
fina
ncia
l se
rvic
es b
y sm
allh
olde
rs a
nd th
e ru
ral p
oor
1390
0 0
1390
0
20
0 20
Sub
tota
l sub
prog
ram
me
4.1
3525
9 21
359
1390
0
5131
20
4:
Fis
herie
s
4.2:
Impr
ove
man
agem
ent o
f fish
erie
s re
sour
ces
Yes
Yes
BFRI
D
evel
opm
ent a
nd D
isse
min
ation
of
Pea
rl Cu
lture
Tec
hnol
ogy
9634
96
34
0
14
14
0
No
Yes
DLS
Re
gion
al F
ishe
ries
and
Live
stoc
k D
evel
opm
ent P
roje
ct (N
oakh
ali
com
pone
nt)
9672
10
45
8627
DANIDA
14
2 12
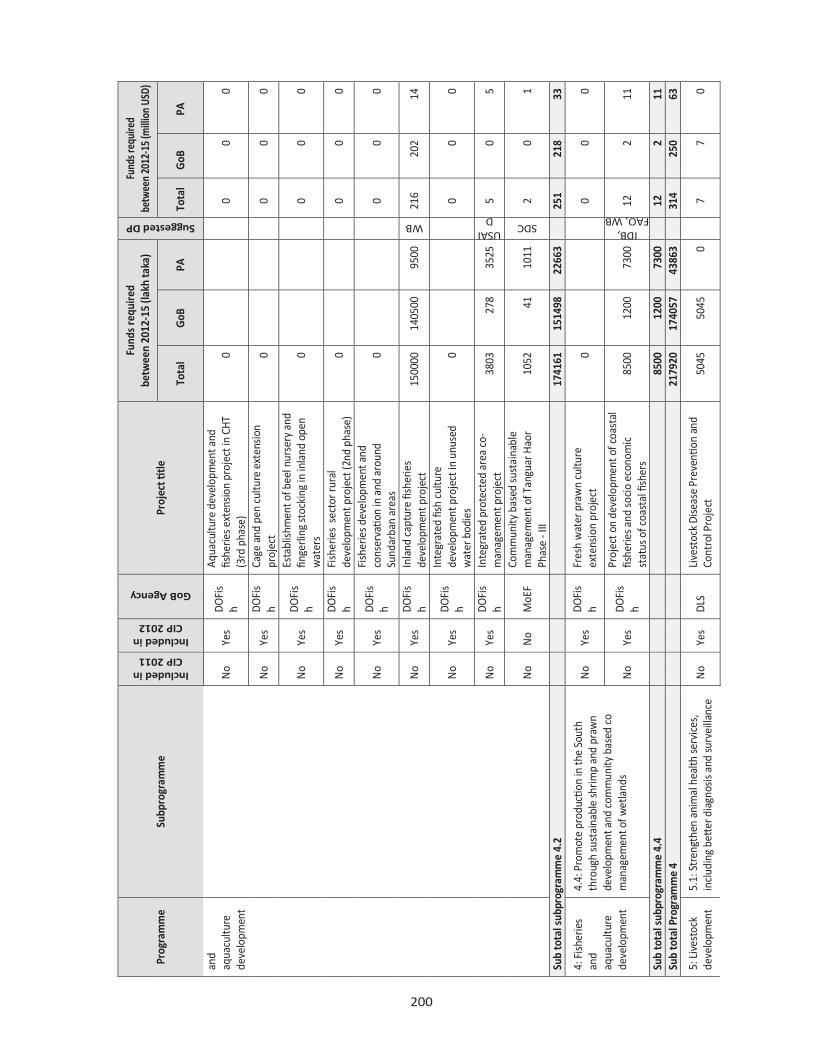
200 Prog
ram
me
Subp
rogr
amm
e
Included in CIP 2011
Included in CIP 2012
GoB Agency
Proj
ect ti
tle
Fund
s re
quire
d
betw
een
2012
-15
(lakh
taka
)
Suggested DP
Fund
s req
uire
d be
twee
n 20
12-1
5 (m
illio
n US
D)
Tota
l G
oB
PA
To
tal
GoB
P
A
and
aqua
cultu
re
deve
lopm
ent
No
Yes
DOFi
sh
Aqua
cultu
re d
evel
opm
ent a
nd
fishe
ries e
xten
sion
proj
ect i
n CH
T (3
rd p
hase
) 0
0 0
0
No
Yes
DOFi
sh
Cage
and
pen
cul
ture
ext
ensi
on
proj
ect
0
0 0
0
No
Yes
DOFi
sh
Esta
blis
hmen
t of b
eel n
urse
ry a
nd
finge
rling
stoc
king
in in
land
ope
n w
ater
s 0
0 0
0
No
Yes
DOFi
sh
Fish
erie
s se
ctor
rura
l de
velo
pmen
t pro
ject
(2nd
pha
se)
0
0 0
0
No
Yes
DOFi
sh
Fish
erie
s dev
elop
men
t and
co
nser
vatio
n in
and
aro
und
Sund
arba
n ar
eas
0
0 0
0
No
Yes
DOFi
sh
Inla
nd c
aptu
re fi
sher
ies
deve
lopm
ent p
roje
ct
1500
00
1405
00
9500
WB
216
202
14
No
Yes
DOFi
sh
Inte
grat
ed fi
sh c
ultu
re
deve
lopm
ent p
roje
ct in
unu
sed
wat
er b
odie
s 0
0 0
0
No
Yes
DOFi
sh
Inte
grat
ed p
rote
cted
are
a co
-m
anag
emen
t pro
ject
38
03
278
35
25
USAID
5 0
5
No
No
MoE
F Co
mm
unity
bas
ed su
stai
nabl
e m
anag
emen
t of T
angu
ar H
aor
Phas
e - I
II 10
52
41
1011
SDC
2 0
1
Sub
tota
l sub
prog
ram
me
4.2
1741
61
1514
98
2266
3
251
218
33
4: F
ishe
ries
and
aqua
cultu
re
deve
lopm
ent
4.4:
Pro
mot
e pr
oductio
n in
the
Sout
h th
roug
h su
stai
nabl
e sh
rimp
and
praw
n de
velo
pmen
t and
com
mun
ity b
ased
co
man
agem
ent o
f wet
land
s
No
Yes
DOFi
sh
Fres
h w
ater
pra
wn
cultu
re
exte
nsio
n pr
ojec
t 0
0 0
0
No
Yes
DOFi
sh
Proj
ect o
n de
velo
pmen
t of c
oast
al
fishe
ries a
nd s
ocio
eco
nom
ic
stat
us o
f coa
stal
fish
ers
8500
12
00
7300
IDB, FAO, WB
12
2
11
Sub
tota
l sub
prog
ram
me
4.4
8500
12
00
7300
12
2
11
Sub
tota
l Pro
gram
me
4
21
7920
17
4057
43
863
314
250
63
5: L
ives
tock
de
velo
pmen
t 5.
1: S
tren
gthe
n an
imal
hea
lth se
rvic
es,
incl
udin
g be
tter d
iagn
osis
and
surv
eilla
nce
No
Yes
DLS
Live
stoc
k Di
seas
e Pr
even
tion
and
Cont
rol P
roje
ct
5045
50
45
0
7 7
0

201 Prog
ram
me
Subp
rogr
amm
e
Included in CIP 2011
Included in CIP 2012
GoB Agency
Proj
ect ti
tle
Fund
s re
quire
d
betw
een
2012
-15
(lakh
taka
)
Suggested DP
Fund
s re
quire
d be
twee
n 20
12-1
5 (m
illio
n U
SD)
Tota
l G
oB
PA
Tot
al
GoB
P
A
sy
stem
s to
miti
gate
dise
ase
outb
reak
s
Yes
Yes
DLS
Stre
ngth
enin
g of
the
Insti
tutio
nal
Capa
city
and
pol
icy
refo
rm o
f DLS
78
4
58
726
1 0
1
Sub
tota
l sub
prog
ram
me
5.1
5829
51
03
726
8 7
1
5: L
ives
tock
de
velo
pmen
t
5.2:
Str
engt
hen
husb
andr
y ca
paci
ty a
t ho
useh
old
leve
l thr
ough
com
mun
ity b
ased
im
prov
ed k
now
ledg
e an
d ad
viso
ry se
rvice
s
No
Yes
BLRI
Co
mm
unity
bas
ed c
attle
rear
ing
for e
mpl
oym
ent g
ener
ation
and
po
vert
y re
ducti
on p
roje
ct
0
0 0
0
Yes
Yes
DLS
Com
mun
ity B
ased
Fod
der &
Oth
er
Unc
onve
ntion
al F
eed
Prod
uctio
n an
d De
velo
pmen
t for
Ani
mal
N
utriti
on P
roje
ct
1100
0
1000
10
000
16
1
14
Yes
Yes
DLS
Dairy
& B
eef D
evel
opm
ent f
or
Empl
oym
ent G
ener
ation
and
Po
vert
y Re
ducti
on
5500
0
5000
50
000
79
7
72
Yes
Yes
DLS
Smal
lhol
der d
airy
dev
elop
men
t pr
ojec
t in
milk
pot
entia
l are
as
6194
0
61
94
IDB
9 0
9
Sub
tota
l sub
prog
ram
me
5.2
7219
4
6000
66
194
104
9
95
5: L
ives
tock
de
velo
pmen
t
5.3:
Impr
ove
avai
labi
lity
and
qual
ity o
f in
puts
thro
ugh
publ
ic p
rivat
e pa
rtne
rshi
ps
No
No
Milk
Vi
ta
Esta
blis
hmen
t of C
attle
Fee
d Pl
ant
for E
nhan
cing
Milk
Pro
ducti
on
2728
27
28
0
4 4
0
Yes
Yes
tbd
Prog
ram
mes
aim
ing
to im
prov
e av
aila
bilit
y an
d qu
ality
of i
nput
s th
roug
h pu
blic
priv
ate
part
ners
hips
1390
0
2085
11
815
20
3
17
Sub
tota
l sub
prog
ram
me
5.3
1662
8
4813
11
815
24
7
17
5.4:
Liv
esto
ck
deve
lopm
ent
5.4:
Res
earc
h on
live
stoc
k de
velo
pmen
t, in
clud
ing
gene
tic im
prov
emen
t
No
Yes
BLRI
Te
chno
logy
dev
elop
men
t of
stra
tegi
c co
ntro
l of f
oot a
nd
mou
th d
isea
se
0
0 0
0
No
No
Milk
Vi
ta
Esta
blis
hmen
t of B
uffal
o Br
eadi
ng
Stati
on fo
r Enh
anci
ng M
ilk
Prod
uctio
n 16
50
1650
0
2 2
0
Sub
tota
l sub
prog
ram
me
5.4
1650
16
50
0
2 2
0
Su
b to
tal P
rogr
amm
e 5
9630
2
1756
6
7873
5
139
25
113

202 Prog
ram
me
Subp
rogr
amm
e
Included in CIP 2011
Included in CIP 2012
GoB Agency
Proj
ect ti
tle
Fund
s re
quire
d
betw
een
2012
-15
(lakh
taka
)
Suggested DP
Fund
s re
quire
d
betw
een
2012
-15
(mill
ion
USD
)
Tota
l G
oB
PA
Tot
al
GoB
P
A
6: Im
prov
ed
acce
ss to
m
arke
ts
6.1:
Impr
ove
phys
ical
acc
ess t
o m
arke
ts,
faci
lities
and
info
rmati
on
No
No
DAM
En
surin
g Su
stai
nabl
e Ag
ricul
tura
l De
velo
pmen
t thr
ough
Acc
ess t
o M
arke
t and
Fin
ance
11
920
56
0
1136
0
IDB
17
1
16
No
No
DAM
Ex
tens
ion
and
deve
lopm
ent o
f e-
gove
rnan
ce o
f Dep
artm
ent o
f Ag
ricul
ture
Mar
ketin
g 82
3
823
0
1 1
0
No
No
DAM
Stre
ngth
enin
g ca
paci
ty b
uild
ing
of
depa
rtm
ent o
f agr
icul
ture
m
arketin
g (D
AM) i
n re
sear
ch a
nd
polic
y an
alys
is o
f agr
icul
ture
m
arketin
g in
form
ation
980
0
98
0
FAO
1 0
1
Yes
Yes
DRR
Cons
tructio
n of
sm
all
brid
ge/c
ulve
rt (u
p to
12
m lo
ng) o
n th
e ru
ral r
oads
(3rd
pha
se)
6950
0
6950
0
0
100
100
0
Yes
Yes
LGED
In
tegr
ated
Foo
d Se
curit
y th
roug
h Ru
ral I
nfra
stru
ctur
e De
velo
pmen
t 70
700
37
75
6692
5
102
5
96
No
Yes
LGED
Ru
ral T
rans
port
Impr
ovem
ent
Proj
ect (
RTIP
-2)
3343
05
9262
3
2416
81
IDA
481
133
34
8
Sub
tota
l sub
prog
ram
me
6.1
4882
28
1672
81
3209
46
702
241
46
2
6: Im
prov
ed
acce
ss to
m
arke
ts
6.2:
Mob
ilize
and
pro
mot
e pr
oduc
er &
m
arketin
g gr
oups
for i
mpr
oved
mar
ket
acce
ss a
nd k
now
ledg
e
No
No
DAM
Impr
ovin
g m
arketin
g
effici
ency
thro
ugh
valu
e ch
ain
linka
ge d
evel
opm
ent i
n 6
sele
cted
di
stric
ts
1000
0
10
00
FAO
1 0
1
No
No
DAM
Stre
ngth
enin
g m
arketin
g se
rvic
es
of n
orth
-sou
ther
n re
gion
al
mar
kets
by
stre
ngth
enin
g Fa
rmer
s M
arketin
g G
roup
(FM
G) (
Bang
la)
400
40
0
0
1 1
0
No
Yes
DOC
Deve
lopm
ent o
f coo
perativ
es
base
d di
rect
mar
ketin
g sy
stem
of
agric
ultu
ral p
rodu
cts
2145
21
45
0
3 3
0
Yes
Yes
DOC
Expa
nsio
n of
Milk
Pro
duce
rs
Coop
erati
ve in
gre
ater
Far
idpu
r, Ba
risal
and
Khu
lna
Dist
rict f
or
3924
39
24
0
6 6
0
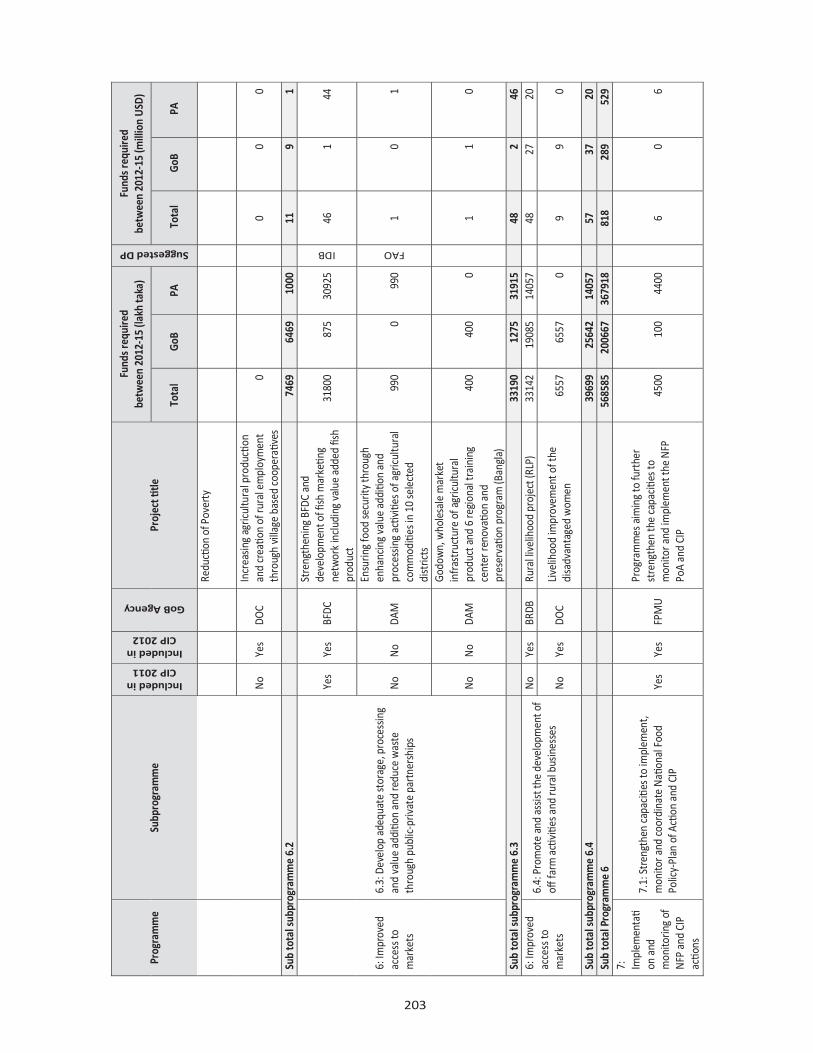
203 Prog
ram
me
Subp
rogr
amm
e
Included in CIP 2011
Included in CIP 2012
GoB Agency
Proj
ect ti
tle
Fund
s req
uire
d
betw
een
2012
-15
(lakh
taka
)
Suggested DP
Fund
s req
uire
d
betw
een
2012
-15
(mill
ion
USD
)
Tota
l Go
B PA
T
otal
G
oB
PA
Redu
ction
of P
over
ty
No
Yes
DOC
Incr
easin
g ag
ricul
tura
l pro
ducti
on
and
creatio
n of
rura
l em
ploy
men
t th
roug
h vi
llage
bas
ed c
oope
rativ
es
0
0 0
0
Sub
tota
l sub
prog
ram
me
6.2
7469
64
69
1000
11
9
1
6: Im
prov
ed
acce
ss to
m
arke
ts
6.3:
Dev
elop
ade
quat
e st
orag
e, p
roce
ssin
g an
d va
lue
additio
n an
d re
duce
was
te
thro
ugh
publ
ic-pr
ivat
e pa
rtne
rshi
ps
Yes
Yes
BFDC
Stre
ngth
enin
g BF
DC a
nd
deve
lopm
ent o
f fish
mar
ketin
g ne
twor
k in
clud
ing
valu
e ad
ded fis
h pr
oduc
t
3180
0
875
30
925
IDB
46
1
44
No
No
DAM
Ensu
ring
food
secu
rity
thro
ugh
enha
ncin
g va
lue
additio
n an
d pr
oces
sing
activ
ities
of a
gric
ultu
ral
com
mod
ities
in 1
0 se
lect
ed
dist
ricts
990
0
99
0
FAO
1 0
1
No
No
DAM
Godo
wn,
who
lesa
le m
arke
t in
fras
truc
ture
of a
gric
ultu
ral
prod
uct a
nd 6
regi
onal
trai
ning
ce
nter
reno
vatio
n an
d pr
eser
vatio
n pr
ogra
m (B
angl
a)
400
40
0
0
1 1
0
Sub
tota
l sub
prog
ram
me
6.3
3319
0
1275
31
915
48
2
46
6: Im
prov
ed
acce
ss to
m
arke
ts
6.4:
Pro
mot
e an
d as
sist t
he d
evel
opm
ent o
f off
farm
acti
vitie
s and
rura
l bus
ines
ses
No
Yes
BRDB
Ru
ral l
ivel
ihoo
d pr
ojec
t (RL
P)
3314
2
1908
5
1405
7
48
27
20
No
Yes
DOC
Live
lihoo
d im
prov
emen
t of t
he
disa
dvan
tage
d w
omen
65
57
6557
0
9 9
0
Sub
tota
l sub
prog
ram
me
6.4
3969
9
2564
2
1405
7
57
37
20
Sub
tota
l Pro
gram
me
6
56
8585
20
0667
36
7918
818
289
52
9
7:
Impl
emen
tati
on a
nd
mon
itorin
g of
N
FP a
nd C
IP
actio
ns
7.1:
Str
engt
hen
capa
cities
to im
plem
ent,
mon
itor a
nd co
ordi
nate
Nati
onal
Foo
d Po
licy-
Plan
of A
ction
and
CIP
Ye
s Ye
s FP
MU
Prog
ram
mes
aim
ing
to fu
rthe
r st
reng
then
the
capa
cities
to
mon
itor a
nd im
plem
ent t
he N
FP
PoA
and
CIP
4500
10
0
4400
6 0
6

204
Prog
ram
me
Subp
rogr
amm
e
Included in CIP 2011
Included in CIP 2012
GoB Agency
Proj
ect ti
tle
Fund
s re
quire
d
betw
een
2012
-15
(lakh
taka
)
Suggested DP
Fund
s re
quire
d
betw
een
2012
-15
(mill
ion
USD
)
Tota
l G
oB
PA
Tot
al
GoB
P
A
Sub
tota
l sub
prog
ram
me
7.1
45
00
100
4400
60
6
7:
Impl
emen
tati
on a
nd
mon
itorin
g of
N
FP a
nd C
IP
actio
ns
7.2:
Str
engt
hen
natio
nal c
apac
ities
for
desig
n, im
plem
entatio
n an
d m
onito
ring
of
CIP
oper
ation
s Ye
s Ye
s tb
d
Prog
ram
mes
aim
ing
to s
tren
gthe
n na
tiona
l cap
aciti
es fo
r des
ign,
co
ordi
natio
n, m
onito
ring
and
impl
emen
tatio
n of
CIP
pro
ject
s
1350
0 50
0 13
000
19
1 19
Sub
tota
l sub
prog
ram
me
7.2
13
500
500
1300
0
191
19
7:
Impl
emen
tati
on a
nd
mon
itorin
g of
N
FP a
nd C
IP
actio
ns
7.3:
Str
engt
hen
capa
citie
s of
civ
il so
ciet
y or
gani
zatio
ns to
con
trib
ute
to C
IP
deve
lopm
ent a
nd im
plem
entatio
n Ye
s Ye
s tb
d
Prog
ram
mes
aim
ing
to s
tren
gthe
n th
e ca
pacitie
s of c
ivil
soci
ety
orga
nizatio
ns to
con
trib
ute
to C
IP
deve
lopm
ent a
nd im
plem
entatio
n
1500
0 0
1500
0
22
0 22
Sub
tota
l sub
prog
ram
me
7.3
15
000
0 15
000
220
22
Sub
tota
l Pro
gram
me
7
3300
0 60
0 32
400
471
47
8: E
nhan
ced
Publ
ic F
ood
Man
agem
ent
Syst
ems
8.1:
Enh
ance
effi
cien
cy a
nd effe
ctive
ness
of
Publ
ic F
ood
Man
agem
ent S
yste
ms
and
impr
ove
its im
pact
on
pric
e st
abili
zatio
n N
o N
o DG
Fo
od
Bang
lade
sh M
oder
n Fo
od S
tora
ge
faci
lities
Pro
ject
(BM
FSP)
- Co
mpo
nent
B
1737
5 0
1737
5
25
0 25
Sub
tota
l sub
prog
ram
me
8.1
17
375
0 17
375
250
25
8: E
nhan
ced
Publ
ic F
ood
Man
agem
ent
Syst
ems
8.2:
Bui
ld c
apac
ities
of M
inist
ry o
f Foo
d an
d Di
sast
er M
anag
emen
t and
Dire
ctor
ate
of
Food
to b
etter
man
age
the
food
sys
tem
N
o N
o DG
Fo
od
Bang
lade
sh M
oder
n Fo
od S
tora
ge
faci
lities
Pro
ject
(BM
FSP)
- Co
mpo
nent
C
1737
5 0
1737
5
25
0 25
Sub
tota
l sub
prog
ram
me
8.2
17
375
0 17
375
250
25
8: E
nhan
ced
Publ
ic F
ood
Man
agem
ent
Syst
ems
8.3:
Incr
ease
and
mod
erni
ze p
ublic
sto
rage
an
d ha
ndlin
g fa
ciliti
es, i
nclu
ding
in d
isas
ter
pron
e ar
eas
No
No
DG
Food
Bang
lade
sh M
oder
n Fo
od S
tora
ge
faci
lities
Pro
ject
(BM
FSP)
- Co
mpo
nent
A
1737
50
0 17
3750
WB
250
0 25
0
Yes
Yes
DG
Food
Cons
tructio
n of
100
,000
mt
capa
city
Vertic
al G
rain
Silo
at
Chitt
agon
g S
ilo P
rem
ises
, Ch
ittag
ong
4022
3 40
223
0
58
58
0
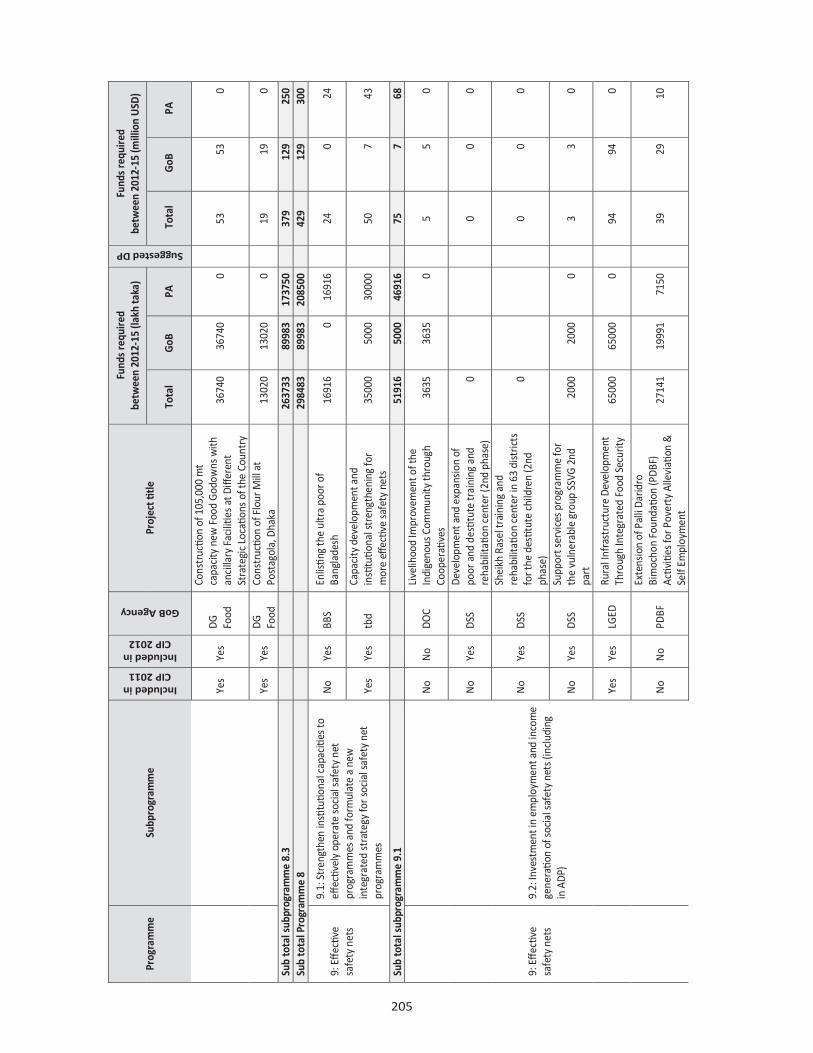
205 Prog
ram
me
Subp
rogr
amm
e
Included in CIP 2011
Included in CIP 2012
GoB Agency
Proj
ect ti
tle
Fund
s re
quire
d
betw
een
2012
-15
(lakh
taka
)
Suggested DP
Fund
s re
quire
d
betw
een
2012
-15
(mill
ion
USD
)
Tota
l G
oB
PA
Tot
al
GoB
P
A
Yes
Yes
DG
Food
Cons
tructio
n of
105
,000
mt
capa
city
new
Foo
d G
odow
ns w
ith
anci
llary
Fac
ilitie
s at
Diff
eren
t St
rate
gic
Locatio
ns o
f the
Cou
ntry
3674
0
3674
0
0
53
53
0
Yes
Yes
DG
Food
Co
nstr
uctio
n of
Flo
ur M
ill a
t Po
stag
ola,
Dha
ka
1302
0
1302
0
0
19
19
0
Sub
tota
l sub
prog
ram
me
8.3
2637
33
8998
3
1737
50
379
129
25
0
Sub
tota
l Pro
gram
me
8
29
8483
89
983
20
8500
429
129
30
0
9: Effe
ctive
sa
fety
net
s
9.1:
Str
engt
hen
insti
tutio
nal c
apac
ities
to
effectiv
ely
oper
ate
soci
al sa
fety
net
pr
ogra
mm
es a
nd fo
rmul
ate
a ne
w
inte
grat
ed st
rate
gy fo
r soc
ial s
afet
y ne
t pr
ogra
mm
es
No
Yes
BBS
Enlistin
g th
e ul
tra
poor
of
Bang
lade
sh
1691
6
0
1691
6
24
0
24
Yes
Yes
tbd
Capa
city
dev
elop
men
t and
in
stitutio
nal s
tren
gthe
ning
for
mor
e eff
ectiv
e sa
fety
net
s 35
000
50
00
3000
0
50
7
43
Sub
tota
l sub
prog
ram
me
9.1
5191
6
5000
46
916
75
7
68
9: Effe
ctive
sa
fety
net
s
9.2:
Inve
stm
ent i
n em
ploy
men
t and
inco
me
gene
ratio
n of
soc
ial s
afet
y ne
ts (i
nclu
ding
in
ADP
)
No
No
DOC
Live
lihoo
d Im
prov
emen
t of t
he
Indi
geno
us C
omm
unity
thro
ugh
Coop
erati
ves
3635
36
35
0
5 5
0
No
Yes
DSS
Deve
lopm
ent a
nd e
xpan
sion
of
poor
and
destit
ute
trai
ning
and
re
habi
litati
on c
ente
r (2n
d ph
ase)
0
0 0
0
No
Yes
DSS
Shei
kh R
asel
trai
ning
and
re
habi
litati
on c
ente
r in
63 d
istric
ts
for t
he d
estit
ute
child
ren
(2nd
ph
ase)
0
0 0
0
No
Yes
DSS
Supp
ort s
ervi
ces p
rogr
amm
e fo
r th
e vu
lner
able
gro
up S
SVG
2nd
pa
rt
2000
20
00
0
3 3
0
Yes
Yes
LGED
Ru
ral I
nfra
stru
ctur
e De
velo
pmen
t Th
roug
h In
tegr
ated
Foo
d Se
curit
y 65
000
65
000
0
94
94
0
No
No
PDBF
Exte
nsio
n of
Pal
li Da
ridro
Bi
moc
hon
Foun
datio
n (P
DBF)
Ac
tiviti
es fo
r Pov
erty
Alle
viati
on &
Se
lf Em
ploy
men
t
2714
1
1999
1
7150
39
29
10

206 Prog
ram
me
Subp
rogr
amm
e
Included in CIP 2011
Included in CIP 2012
GoB Agency
Proj
ect ti
tle
Fund
s re
quire
d
betw
een
2012
-15
(lakh
taka
)
Suggested DP
Fund
s re
quire
d
betw
een
2012
-15
(mill
ion
USD
)
Tota
l G
oB
PA
Tot
al
GoB
P
A
No
Yes
RDCD
Co
mpr
ehen
sive
Villa
ge
Deve
lopm
ent P
rogr
am 3
rd p
hase
15
000
1500
0
0
22
22
0
No
No
SFDF
Li
velih
ood
Impr
ovem
ent o
f Eth
nic
and
Mar
gina
l Pop
ulati
on
6562
65
62
0
9 9
0
Sub
tota
l sub
prog
ram
me
9.2
1193
38
1121
88
7150
172
161
10
Sub
tota
l Pro
gram
me
9
17
1254
11
7188
54
066
246
169
78
10:
Com
mun
ity
base
d nu
triti
on
10.1
: Com
mun
ity b
ased
live
lihoo
d an
d nu
triti
on p
rogr
amm
es, b
uild
ing
on th
e N
ation
al N
utriti
on S
ervi
ce (N
NS)
No
Yes
MoS
W
Pove
rty
Redu
ction
and
Liv
elih
ood
Secu
rity
for o
f the
Peo
ple
of
Econ
omic
ally
Dep
ress
ed A
reas
83
19
8319
0
12
12
0
Yes
Yes
tbd
Inve
stm
ent i
n ag
ricul
tura
l res
earc
h to
impr
ove
prod
uctiv
ity o
f non
st
aple
food
s tha
t hav
e va
lue
additio
n an
d hi
gh n
utrie
nt v
alue
fo
r ens
urin
g im
prov
ed d
iet q
ualit
y
5560
55
60
0
8 8
0
Yes
Yes
tbd
Inve
stm
ent i
n so
cial
pro
tecti
on,
agric
ultu
re a
nd p
rice
polic
ies t
o im
prov
e su
pply
, ac
cess
and
de
man
d fo
r foo
ds c
onta
inin
g hi
gh
nutr
ient
val
ues n
otab
ly n
on c
erea
l cr
ops
5560
55
60
0
8 8
0
Yes
Yes
tbd
Mon
itorin
g an
d ev
aluatio
n fr
amew
ork
of h
ealth
, agr
icul
ture
, fo
od a
nd o
ther
rele
vant
sect
ors.
55
60
5560
0
8 8
0
Yes
Yes
tbd
Stre
ngth
enin
g an
d up
datin
g nu
triti
on b
ehav
ior c
hang
e co
mm
unic
ation
str
ateg
ies f
or
impr
ovin
g nu
triti
onal
stat
us,
espe
cial
ly w
omen
and
chi
ldre
n
5560
55
60
0
8 8
0
Yes
Yes
tbd
Trai
ning
and
cap
acity
bui
ldin
g of
fa
rmer
s and
ext
ensio
n w
orke
rs o
n fo
od b
ased
nut
rition
and
hea
lth
acro
ss a
ge g
roup
s alo
ng w
ith
parti
cipa
tory
fiel
d m
onito
ring
and
eval
uatio
n.
5560
55
60
0
8 8
0

207
Prog
ram
me
Subp
rogr
amm
e
Included in CIP 2011
Included in CIP 2012
GoB Agency
Proj
ect
tle
Fund
s re
quire
d
betw
een
2012
-15
(lakh
taka
)
Suggested DP
Fund
s re
quire
d
betw
een
2012
-15
(mill
ion
USD
)
Tota
l G
oB
PA
Tot
al
GoB
P
A
Sub
tota
l sub
prog
ram
me
10.1
36
119
36
119
0
52
52
0
Sub
tota
l Pro
gram
me
10
3611
9
3611
9
0
52
52
0
11: O
rient
fo
od a
nd
nutr
ition
pr
ogra
m
thro
ugh
data
11.1
: Und
erta
ke u
pdat
ed &
com
preh
ensiv
e na
tiona
l sur
vey
of fo
od c
onsu
mpt
ion
&
food
com
positi
on
Yes
Yes
tbd
Und
erta
ke u
pdat
ed &
co
mpr
ehen
sive
natio
nal s
urve
y of
fo
od c
onsu
mpti
on &
food
co
mpo
sition
4500
70
0
3800
6 1
5
Sub
tota
l sub
prog
ram
me
11.1
45
00
700
38
00
6 1
5
Su
b to
tal P
rogr
amm
e 11
45
00
700
38
00
6 1
5
12
: Foo
d sa
fety
and
qu
ality
im
prov
emen
t
12.1
: Im
prov
e su
rvei
llanc
e sy
stem
of f
ood
born
e ill
ness
es
Yes
Yes
tbd
Impr
ove
surv
eilla
nce
syst
em o
f fo
od b
orne
illn
esse
s 85
00
0
8500
12
0
12
Sub
tota
l sub
prog
ram
me
12.1
85
00
0
8500
12
0
12
12 Fo
od
safe
ty a
nd
qual
ity
impr
ovem
ent
12.2
: Dev
elop
and
enh
ance
cap
aciti
es o
f la
bora
torie
s an
d sy
stem
s for
food
qua
lity
assu
ranc
e an
d sa
fety
and
con
trol
of f
ood
Yes
Yes
DOFi
sh
Deve
lopm
ent o
f fish
erie
s an
d aq
uacu
lture
food
saf
ety
and
qual
ity m
anag
emen
t sys
tem
in
Bang
lade
sh
9760
49
68
4792
EU
14
7
7
Sub
tota
l sub
prog
ram
me
12.2
97
60
4968
47
92
14
7
7
12: F
ood
safe
ty a
nd
qual
ity
impr
ovem
ent
12.3
: Sup
port
the
deve
lopm
ent o
f a
mod
ern
food
con
trol
man
agem
ent s
yste
m
No
Yes
DLS
Faci
lities
dev
elop
men
t for
pr
oductio
n of
safe
mea
t 70
0
0
700
IDB
1
0
1
Sub
tota
l sub
prog
ram
me
12.3
70
0
0
700
1
0
1
Sub
tota
l Pro
gram
me
12
1896
0
4968
13
992
27
7
20

208 Anne
x 3.
6: D
evel
opm
ent p
artn
ers
cont
ributi
on
Anne
x 3.
6a: D
Ps C
ontr
ibuti
ons
thro
ugh
the
ADP
and
chan
ges
betw
een
July
201
0 an
d Ju
ne 2
012
(mill
ion
USD
) - T
able
4.2
. in
CIP
2011
CIP programme
Food
Ava
ilabi
lity
Food
Acc
ess
Food
Util
izati
on
Total CIP 2013
Change between CIP 2013 and CIP 2012
Change between CIP 2012 and CIP 2011
Change between CIP 2013 and CIP 2011
1. Sustainable and diversified agriculture through integrated
research and extension
2. Improved water resource management and infrastructure for
irrigation purposes
3. Improved quality of inputs and soil fertility
4. Fisheries and aquaculture development
5. Livestock development, with a focus on poultry and dairy production
Sub total Availability
6. Improved access to market, value addition in agriculture and non farm
incomes
7. Strengthened capacities for implementation and monitoring of
NFP and CIP actions
8. Enhanced public food management system
9. Institutional Development and Capacity Development for more
effective safety nets
Sub total Access
10. Community based nutrition programmes and services
11. Orient food and nutrition actions through data
12. Food safety and quality improvement
Sub total Utilization
Budget beyond the CIP period
ADB
22.5
55
.2
22.0
-
5.1
104.
9 15
6.4
0.8
- -
157.
2 -
- -
- 26
2.2
10.3
63
.8
74.0
69
.0
AusA
id
- -
- -
12.4
12
.4
- -
- 9.
3 9.
3 -
- -
- 21
.7
(7.6
) 3.
3 (4
.3)
1.8
DAN
IDA
7.8
- -
7.6
6.1
21.5
37
.1
- -
- 37
.1
- -
- -
58.5
26
.6
(33.
1)
(6.5
) -
DFID
12
0.0
- -
- 10
2.0
222.
0 42
.5
- -
167.
7 21
0.2
143.
0 -
- 14
3.0
575.
1 15
9.7
29.6
18
9.3
52.9
EK
N
- 59
.6
- -
- 59
.6
- -
- -
- -
- -
- 59
.6
(5.5
) (1
19.1
) (1
24.6
) 9.
2 EU
2.
2 -
13.7
(0
.1)
(0.3
) 15
.4
- 2.
6 -
48.6
51
.2
31.0
7.
6 8.
2 46
.8
113.
5 1.
8 6.
5 8.
3 -
FAO
0.
3 -
- 0.
1 -
0.4
0.5
6.6
- -
7.1
- 0.
2 -
0.2
7.6
6.9
(0.1
) 6.
8 -
GAF
SP
35.0
-
1.8
5.2
4.3
46.3
-
3.7
- -
3.7
- -
- -
50.0
50
.0
- 50
.0
- ID
B 2.
2 -
35.0
4.
5 -
41.7
3.
3 -
- -
3.3
- -
- -
45.0
(0
.1)
5.5
5.4
- IF
AD
15.7
26
.5
- 2.
9 -
45.1
23
.5
- -
- 23
.5
- -
- -
68.6
(1
7.1)
45
.0
27.9
17
.1
JICA
- 62
.8
- -
2.5
65.3
18
6.0
- 20
.1
- 20
6.1
- -
- -
271.
4 (2
1.1)
18
2.5
161.
4 6.
2 SD
C -
- -
- -
- 6.
2 -
- -
6.2
- -
- -
6.2
6.2
- 6.
2 2.
4 U
ND
P 9.
8 -
5.9
- -
15.7
-
- -
1.7
1.7
- -
- -
17.4
(9
.1)
(14.
3)
(23.
5)
- U
NIC
EF
- -
- -
- -
- -
- -
- 4.
0 -
- 4.
0 4.
0 4.
0 (1
5.0)
(1
1.0)
-
USA
ID
- -
- -
2.5
2.5
13.0
14
.4
- -
27.4
14
.7
- -
14.7
44
.6
23.5
16
.2
39.6
3.
7 W
FP
- 12
.6
- 4.
2 -
16.8
33
.6
- -
6.3
39.8
-
- -
- 56
.6
46.8
0.
0 46
.8
23.7
W
orld
Ban
k 62
.3
84.8
31
.9
- 16
.0
194.
9 -
- -
183.
1 18
3.1
- -
- -
378.
0 3.
5 19
1.7
195.
2 -
Chin
a -
- 56
0.0
- -
560.
0 -
- -
- -
- -
- -
560.
0 56
0.0
- 56
0.0
- G
IZ
2.3
- 1.
5 -
- 3.
8 -
- -
- -
- -
- -
3.8
(6.7
) 10
.5
3.8
- N
orw
ay
15.7
-
- -
- 15
.7
- -
- -
- -
- -
- 15
.7
- 15
.7
15.7
-
Spai
n -
- -
- -
- -
- -
- -
8.0
- -
8.0
8.0
- 8.
0 8.
0 -
Italy
-
- -
- -
- 2.
7 -
- -
2.7
- -
- -
2.7
2.7
- 2.
7 0.
3
Tota
l DP
295.
8 30
1.5
671.
7 24
.4
150.
6 1,
444.
0 50
4.6
28.2
20
.1
416.
6 96
9.5
200.
7 7.
8 8.
2 21
6.7
2,63
0.2
834.
5 39
6.7
1,23
1.3
186.
4
Shar
e on
tota
l 11
.2%
11
.5%
25
.5%
0.
9%
5.7%
54
.9%
19
.2%
1.
1%
0.8%
15
.8%
36
.9%
7.
6%
0.3%
0.
3%
8.2%
10
0.0%
-
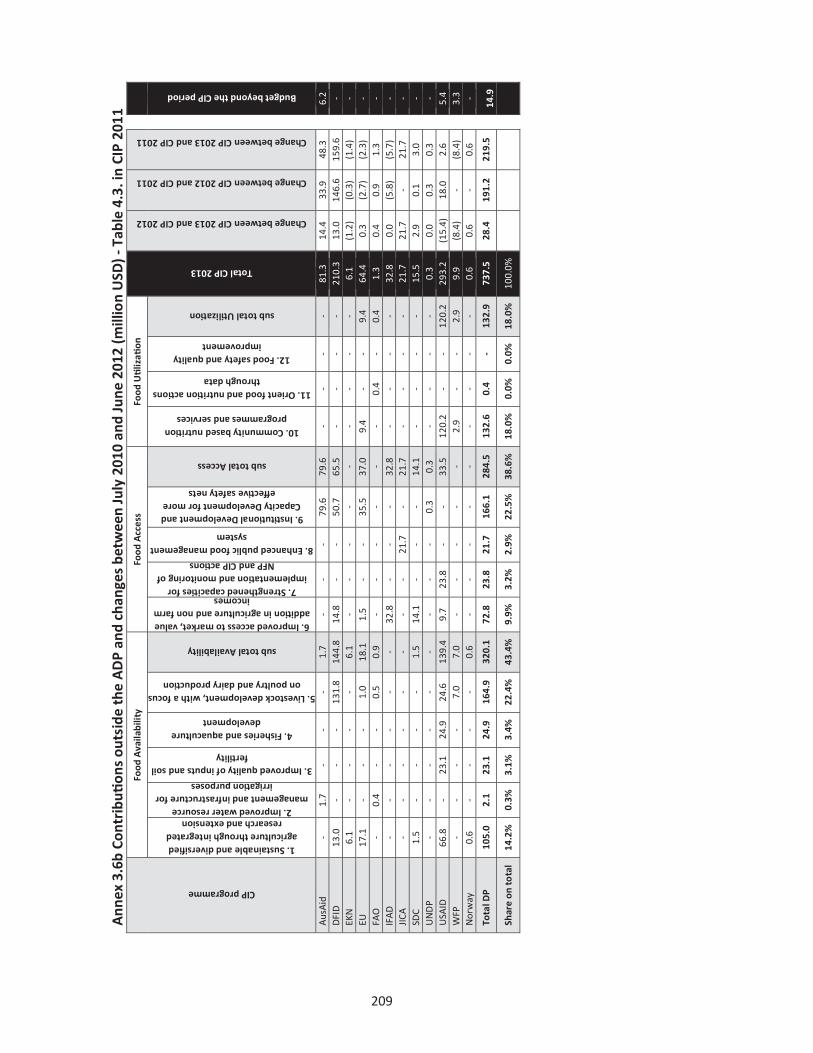
209
Ann
ex 3
.6b
Cont
ribu
tion
s ou
tsid
e th
e A
DP
and
chan
ges
betw
een
July
201
0 an
d Ju
ne 2
012
(mill
ion
USD
) - T
able
4.3
. in
CIP
2011
CIP programme
Food
Ava
ilabi
lity
Food
Acc
ess
Food
Uti
lizati
on
Total CIP 2013
Change between CIP 2013 and CIP 2012
Change between CIP 2012 and CIP 2011
Change between CIP 2013 and CIP 2011
1. Sustainable and diversified agriculture through integrated
research and extension 2. Improved water resource
management and infrastructure for irrigation purposes
3. Improved quality of inputs and soil fertility
4. Fisheries and aquaculture development
5. Livestock development, with a focus on poultry and dairy production
sub total Availability
6. Improved access to market, value addition in agriculture and non farm
incomes 7. Strengthened capacities for
implementation and monitoring of NFP and CIP actions
8. Enhanced public food management system
9. Institutional Development and Capacity Development for more
effective safety nets
sub total Access
10. Community based nutrition programmes and services
11. Orient food and nutrition actions through data
12. Food safety and quality improvement
sub total Utilization
Budget beyond the CIP period
Aus
Aid
-
1.7
- -
- 1.
7 -
- -
79.6
79
.6
- -
- -
81.3
14
.4
33.9
48
.3
6.2
DFI
D
13.0
-
- -
131.
8 14
4.8
14.8
-
- 50
.7
65.5
-
- -
- 21
0.3
13.0
14
6.6
159.
6 -
EKN
6.
1 -
- -
- 6.
1 -
- -
- -
- -
- -
6.1
(1.2
) (0
.3)
(1.4
) -
EU
17.1
-
- -
1.0
18.1
1.
5 -
- 35
.5
37.0
9.
4 -
- 9.
4 64
.4
0.3
(2.7
) (2
.3)
- FA
O
- 0.
4 -
- 0.
5 0.
9 -
- -
- -
- 0.
4 -
0.4
1.3
0.4
0.9
1.3
- IF
AD
-
- -
- -
- 32
.8
- -
- 32
.8
- -
- -
32.8
0.
0 (5
.8)
(5.7
) -
JICA
-
- -
- -
- -
- 21
.7
- 21
.7
- -
- -
21.7
21
.7
- 21
.7
- SD
C
1.5
- -
- -
1.5
14.1
-
- -
14.1
-
- -
- 15
.5
2.9
0.1
3.0
- U
ND
P -
- -
- -
- -
- -
0.3
0.3
- -
- -
0.3
0.0
0.3
0.3
- U
SAID
66
.8
- 23
.1
24.9
24
.6
139.
4 9.
7 23
.8
- -
33.5
12
0.2
- -
120.
2 29
3.2
(15.
4)
18.0
2.
6 5.
4 W
FP
- -
- -
7.0
7.0
- -
- -
- 2.
9 -
- 2.
9 9.
9 (8
.4)
- (8
.4)
3.3
Nor
way
0.
6 -
- -
- 0.
6 -
- -
- -
- -
- -
0.6
0.6
- 0.
6 -
Tota
l DP
10
5.0
2.1
23.1
24
.9
164.
9 32
0.1
72.8
23
.8
21.7
16
6.1
284.
5 13
2.6
0.4
- 13
2.9
737.
5 28
.4
191.
2 21
9.5
14.9
Shar
e on
tota
l 14
.2%
0.
3%
3.1%
3.
4%
22.4
%
43.4
%
9.9%
3.
2%
2.9%
22
.5%
38
.6%
18
.0%
0.
0%
0.0%
18
.0%
10
0.0%

210 Ann
ex 3
.6c
Poss
ible
futu
re c
ontr
ibuti
ons
thro
ugh
and
outs
ide
the
AD
P (m
illio
n U
SD) -
Tab
le 4
.4. i
n CI
P 20
11
CIP programme Fo
od A
vaila
bilit
y Fo
od A
cces
s Fo
od Uti
lizati
on
Change between CIP 2013 and CIP 2012
Change between CIP 2012 and CIP 2011
Change between CIP 2013 and CIP 2011
Budget beyond the CIP period
1. Sustainable and diversified agriculture through integrated research and
extension 2. Improved water resource
management and infrastructure for irrigation purposes
3. Improved quality of inputs and soil fertility
4. Fisheries and aquaculture development
5. Livestock development, with a focus on poultry and dairy production
sub total Availability
6. Improved access to market, value addition in agriculture and non farm
incomes 7. Strengthened capacities for
implementation and monitoring of NFP and CIP actions
8. Enhanced public food management system
9. Institutional Development and Capacity Development for more
effective safety nets
sub total Access
10. Community based nutrition programmes and services
11. Orient food and nutrition actions through data
12. Food safety and quality improvement
sub total Utilization
Total CIP 2013
AD
B
20.0
0.
8 7.
0 -
- 27
.8
461.
8 -
-
- 46
1.8
- -
- -
489.
6 46
9.1
(49.
5)
419.
6 18
.08
DA
NID
A
26.3
-
- -
- 26
.3
4.5
- -
- 4.
5 -
- -
- 30
.7
(29.
3)
(15.
0)
(44.
3)
30.8
8 D
FID
-
- -
- -
- -
- -
- -
108.
1 -
- 10
8.1
108.
1 54
.3
35.6
89
.9
27.0
8 EK
N
9.8
23.4
-
- -
33.1
-
- -
- -
- -
12.5
12
.5
45.6
3.
1 (8
3.7)
(8
0.6)
40
.33
EU
- -
- -
- -
- -
- 3.
5 3.
5 -
0.5
- 0.
5 4.
0 (1
06.0
) 11
0.0
4.0
5.60
FA
O
0.3
2.5
- -
0.1
2.9
0.1
- -
- 0.
1 -
- -
3.0
3.0
(4.4
) (1
.4)
- G
AFS
P 35
.0
- 1.
8 5.
2 4.
3 46
.3
- 3.
7 -
- 3.
7 -
- -
- 50
.0
0.0
50.0
50
.0
-
IFA
D
24.0
2.
6 -
- -
26.6
12
1.3
- -
- 12
1.3
- -
- -
147.
8 (5
6.2)
17
7.0
120.
8 57
.16
JICA
-
- -
- -
- -
- 21
.7
- 21
.7
- -
- -
21.7
21
.7
- 21
.7
- SD
C
- -
- -
- -
23.1
-
- -
23.1
-
- -
- 23
.1
14.6
(6
.5)
8.1
2.16
UN
DP
2.2
- -
- -
2.2
- -
- 1.
0 1.
0 -
- -
- 3.
2 3.
2 -
3.2
-
UN
ICEF
-
- -
- -
- -
- -
- -
5.6
0.5
- 6.
1 6.
1 6.
1 (8
0.0)
(7
3.9)
-
USA
ID
16.7
15
.0
11.3
-
- 43
.0
88.9
7.
5 -
- 96
.4
0.9
- 5.
0 5.
9 14
5.3
(113
.3)
189.
5 76
.2
10.3
3 W
FP
- 0.
8 -
0.3
0.5
1.6
2.3
- -
15.8
18
.1
14.9
-
- 14
.9
34.7
(2
1.0)
(7
3.1)
(9
4.2)
2.
22
Wor
ld B
ank
32.0
32
.0
15.0
-
8.0
87.0
-
- 27
5.0
50.0
32
5.0
- -
- -
412.
0 87
.0
54.5
14
1.5
-
GIZ
6.
1 -
- -
- 6.
1 -
- -
- -
- -
- -
6.1
(0.0
) 6.
1 6.
1 -
Spai
n 30
.0
30.0
-
- -
60.0
30
.0
- -
- 30
.0
- -
- -
90.0
90
.0
- 90
.0
-
Tota
l DP
20
2.2
107.
1 35
.1
5.6
12.9
36
2.8
732.
0 11
.1
296.
7 70
.3
1,11
0.2
129.
5 1.
0 17
.5
148.
1 1,
621.
1 (1
34.2
) 87
1.0
736.
8 19
3.8
Shar
e on
tota
l 12
.5%
6.
6%
2.2%
0.
3%
0.8%
22
.4%
45
.2%
0.
7%
18.3
%
4.3%
68
.5%
8.
0%
0.1%
1.
1%
9.1%
10
0.0%