national confidential inquiry into suicide and homicide … · National Confidential Inquiry into...
43
national confidential inquiry into suicide and homicide by people with mental illness AnnuAl RepoRt: e ngland and Wales July 2010
Transcript of national confidential inquiry into suicide and homicide … · National Confidential Inquiry into...

national confidential inquiry into suicide and homicide by people with mental illness
AnnuAl RepoRt: england and Wales
July 2010

National Confidential Inquiry into Suicide and Homicide by People with Mental Illness Annual Report July 2010CONTENTS
CONTENTS
LiST Of TabLES 5
LiST Of figurES 6
aCkNOwLEdgEmENTS 8
iNQuirY PErSONNEL 8
PrESENTaTiON Of fiNdiNgS 9
1. CurrENT iSSuES 111.1. Homicide by individuals psychotic at the time of the offence 111.2 Homicide by in-patients 151.3 Suicide by patients aged under 25 16
2. SuiCidE 172.1 Suicide in the general population 172.1.1 Variation in suicide by Strategic Health Authority (SHA) 172.1.2. Method of suicide 20
2

National Confidential Inquiry into Suicide and Homicide by People with Mental Illness Annual Report July 2010CONTENTS
2.2. Patient suicides 212.2.1 Patient suicide: numbers and rates 212.2.2 Method of suicide by patients 212.3. In-patient suicide 242.4. Diagnosis 25
3. HOmiCidE 263.1. Homicide in the general population 263.1.1. Variation in homicide by Strategic Health Authority (SHA) 283.2 Homicide by the mentally ill in the general population 303.2.1 Homicide with a lifetime primary diagnosis of schizophrenia 303.2.2 Perpetrators known to be mentally ill at the time of homicide 313.3 Patient homicides 323.3.1 Relationship of victim to perpetrator: patient homicide cases 343.3.2 Diagnosis 34
4. SuddEN uNEXPLaiNEd dEaTH iN PSYCHiaTriC iN-PaTiENTS 364.1 Sudden unexplained death by in-patients in England and Wales 364.2 Sudden unexplained death and patient ethnicity 37
3

National Confidential Inquiry into Suicide and Homicide by People with Mental Illness Annual Report July 2010CONTENTS
5. uPdaTE ON iNQuirY rESEarCH PrOJECTS 385.1 Projects funded by the National Patient Safety Agency 385.1.1 Serious violence by people in the care of services 385.1.2 People with mental ill health who are victims of homicide 385.1.3 The aetiology of in-patient suicide 385.2 Projects funded from external sources 395.2.1 Filicide: A Literature Review 395.2.2 Bipolar study 39
6. rECENT rEPOrTS aNd PaPErS frOm THE iNQuirY 40
7. rEfErENCES 41
fuNdiNg 43
4

National Confidential Inquiry into Suicide and Homicide by People with Mental Illness Annual Report July 2010LiST Of TabLES
LiST Of TabLES
Table 1: Number of suicides in the general population by year and sex 17
Table 2: Number of patient suicides by year and sex 21
Table 3: Number of sudden unexplained death by year and ethnicity 37
Table 4: Number of all deaths within 24 hours of restraint by year and ethnicity 37
5
National Confidential Inquiry into Suicide and Homicide by People with Mental Illness Annual Report July 2010LiST Of figurES
LiST Of figurES
Figure 1: Number of homicides by people with psychosis in urban and rural areas in England and Wales, by year of conviction 13
Figure 2: Number of homicides by people with psychosis and a history of drug and alcohol misuse, by year of conviction 14
Figure 3: Number of patient suicides in those aged under 25 16
Figure 4: Rates of general population suicide per 100,000 by year and sex 18
Figure 5: Rates of general population suicide per 100,000 by year and age-group 18
Figure 6: Rates of suicide by Strategic Health Authority of residence at the time of death (average rate 2005-2007) 19
Figure 7: Change in the rate of suicide from 1997-1999 to 2005-2007 by Strategic Health Authority 19
Figure 8: General population suicides: cause of death by year 20
Figure 9: Rates of patient suicide per 100,000 general population by year and sex 22
Figure 10: Rates of suicide per 100,000 mental health service users (England only, 2004-2007) 22
Figure 11: Number of patient suicides by year and age-group 23
Figure 12: Patient suicides: cause of death by year 23
Figure 13: Number of psychiatric in-patients who died by suicide; number of in-patients who died by hanging/strangulation on the ward 24
6
National Confidential Inquiry into Suicide and Homicide by People with Mental Illness Annual Report July 2010LiST Of figurES
Figure 14: Primary psychiatric diagnoses of patient suicide cases by year 25
Figure 15: General population homicides: sex of perpetrator by year of conviction 26
Figure 16: General population homicides: method of homicide by year of conviction 27
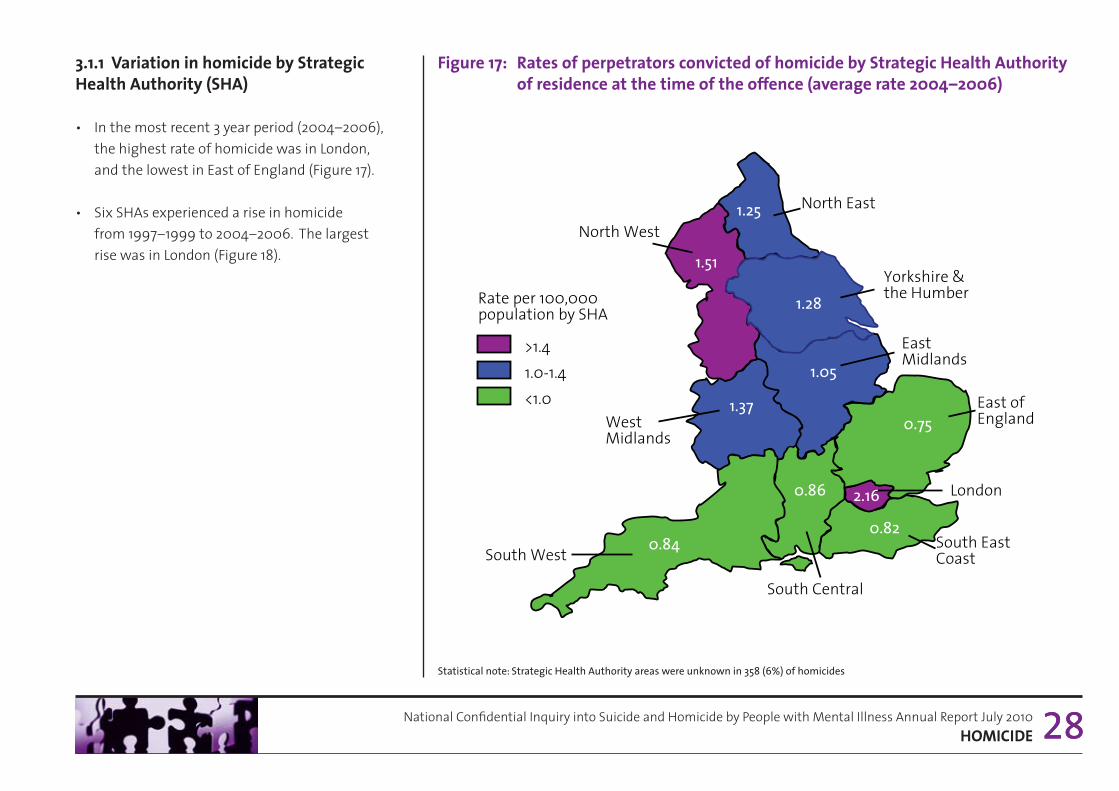
Figure 17: Rates of perpetrators convicted of homicide by Strategic Health Authority of residence at the time of the offence (average rate 2004-2006) 28
Figure 18: Change in the rate of perpetrators convicted of homicide from 1997-1999 to 2004-2006 by Strategic Health Authority 29
Figure 19: Perpetrators with a primary diagnosis of schizophrenia (lifetime history), by year of conviction 30
Figure 20: Perpetrators with mental illness at the time of the offence, by year of conviction (based upon all cases of homicide with a psychiatric report available) 31
Figure 21: Patient homicides: number of patient homicides by sex of perpetrator, by year of conviction 32
Figure 22: Number of patient homicides by age-group of perpetrator, by year of conviction 33
Figure 23: Patient homicides: relationship of victim to perpetrator, by year of conviction 34
Figure 24: Primary psychiatric diagnoses of patients from questionnaires and court reports, by year of conviction 35
Figure 25: Number of sudden unexplained death by year and sex 36
7

aCkNOwLEdgEmENTS
The Inquiry would like to acknowledge the assistance it has received from individuals throughout the NHS in England and Wales, the Home Office, the Ministry of Justice, Greater Manchester Police, the Office for National Statistics and personal communication from Dr. J. Kirkbride, University of Cambridge. Responsibility for the analysis and interpretation of the data provided from government offices rests with the National Confidential Inquiry into Suicide and Homicide by People with Mental Illness and not with the original data provider.
iNQuirY PErSONNEL
Director: Louis ApplebyAssistant Directors: Navneet Kapur and Jennifer ShawClinical Research Fellow: Nicola SwinsonProject Managers: Kirsten Windfuhr and Alyson WilliamsResearch & Statistics: Isabelle Hunt, Sandra Flynn, Harriet Bickley, Cathryn Rodway, Alison Roscoe, Pauline Turnbull, Damian Da Cruz, Pooja Saini, Anna Pearson, David WhileAdministration & IT Support: Rebecca Lowe, James Burns, Philip Stones, Kelly Hadfield, Paul Clarke, Danielle Matthews, Huma Daud
National Confidential Inquiry into Suicide and Homicide by People with Mental Illness Annual Report July 2010aCkNOwLEdgEmENTS 8

National Confidential Inquiry into Suicide and Homicide by People with Mental Illness Annual Report July 2010PrESENTaTiON Of fiNdiNgS
PrESENTaTiON Of fiNdiNgS
In this report, findings for England and Wales are presented for:
• Suicide
• Homicide
• Sudden unexplained deaths.
How data are collected for these core areas of the Inquiry’s research programme can be found on our website (http://www.manchester.ac.uk/nci/methodology) and in the Inquiry’s report Avoidable Deaths 2006 (1) also available online (http://www.manchester.ac.uk/nci/reports).
The report covers deaths by suicide for the period January 1997 to December 2007, people convicted of homicide (homicide convictions) between January 1997 and December 2006 and sudden unexplaineddeaths (SUD) in psychiatric in-patients for the period March 1999 to December 2007.
The Inquiry was notified of 54,808 deaths in the general population that received a coroner’s verdict of suicide or open verdict. The verdicts were received by the Inquiry from the Office for National Statistics (ONS) (2). The Inquiry also received a dataset from Home Office Statistics of 5,806 homicide convictions in the report period (3). Of these cases, 14,249 suicides (26%) and 589 convictions for homicide (10%)were identified as patient suicides and homicides, i.e. the individual had been in contact with mental health services in the 12 months prior to death or prior to the homicide. A psychiatric report was obtained on 2,844 (49%) homicide perpetrators.
General population homicide convictions in Section 3 are provided for the period of the report as context for our data on homicides by people with mental illness. A full analysis of homicide offences recorded by police in England and Wales was published by the Home Office in January 2010 (4). For SUD, data on all patient deaths within psychiatric and learning disabilities in-patient wards in England is provided by Hospital Episode Statistics (HES) (5), previously the NHS Wide Clearing Service, and for Wales by Health Solutions Wales (HSW) (6). During the report period the number of in-patient deaths notified to the Inquiry for England was 5,022 and in Wales 547.
9

National Confidential Inquiry into Suicide and Homicide by People with Mental Illness Annual Report July 2010PrESENTaTiON Of fiNdiNgS
Data completeness for patient suicide and homicide was high overall (98%) in the report period. However, in the final year reported, dataset completeness was 87% for suicide and 97% for homicide. This reflects the period of processing from time of notification of data to the Inquiry by ONS and the Home Office to receipt of clinical datafrom the trust. For SUD the number of cases is small and the completeness high. In the final year of the longitudinal analyses therefore, the projected number of cases for suicide, homicide and SUD based on completeness is presented.
Projected figures for suicide are based on the average annual return of Inquiry questionnaires. For homicide, projected figures are calculated on the average annual Inquiry questionnaire return and the number of court reports obtained in previous years. For SUD projected figures are lower than the number of cases currently notified at the time of publication because some patient deaths, currently satisfying the SUD eligibility criteria, are subsequently excluded from the study following case validation using hospital records.
Stata v10 (7) was used to examine trends over time. Poisson models were fitted with the number of suicides (or homicides) per year as the outcome and year as a linear predictor. For rates, general population per year was the exposure. Within the suicide sample, the exposure was the total number of suicides per year. For each model, the likelihood-ratio test p-value and the predictor (and 95% confidence intervals) for year were examined. General population and patient rates for suicide, and Strategic Health Authority (SHA) rates for suicide and homicide are calculated using population estimates (for those aged 10 or over) as a denominator obtained from the ONS. Discrepancies may arise between Inquiry national rates and those presented by the ONS and the National Mental Health Development Unit (NMHDU) (8) due to differences in measurement described in Avoidable Deaths (1). In addition, the Mental Health Minimum Dataset (MHMDS) (9) was used to ascertain rates of suicide in those in contact with NHS mental health services in England. Rates of suicide (for England only based on clinical denominators from the MHMDS) were calculated for the years that currently overlap with Inquiry data (2004-2007) (see Section 2.2, Figure 10).
During this period there was an average of 1,148,957 people in contact with NHS mental health services in England.
The Inquiry database is not static. Changes in annual figures will occur subject to further information received from either coroners or as a result of additional court hearings, e.g. following a successful appeal against a homicide conviction.
10
11National Confidential Inquiry into Suicide and Homicide by People with Mental Illness Annual Report July 2010 CurrENT iSSuES
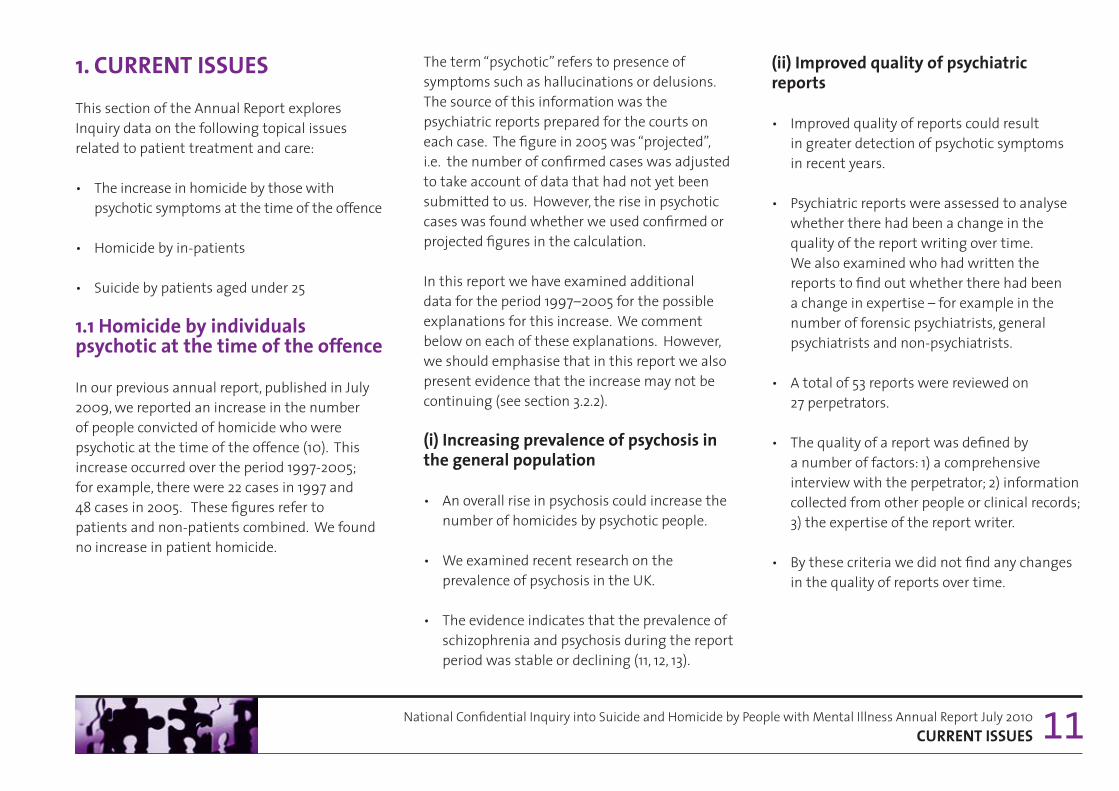
1. CurrENT iSSuESThis section of the Annual Report explores Inquiry data on the following topical issues related to patient treatment and care:
• The increase in homicide by those with psychotic symptoms at the time of the offence
• Homicide by in-patients
• Suicide by patients aged under 25
1.1 Homicide by individuals psychotic at the time of the offence
In our previous annual report, published in July 2009, we reported an increase in the number of people convicted of homicide who were psychotic at the time of the offence (10). This increase occurred over the period 1997-2005; for example, there were 22 cases in 1997 and 48 cases in 2005. These figures refer to patients and non-patients combined. We found no increase in patient homicide.
The term “psychotic” refers to presence of symptoms such as hallucinations or delusions. The source of this information was the psychiatric reports prepared for the courts on each case. The figure in 2005 was “projected”, i.e. the number of confirmed cases was adjusted to take account of data that had not yet been submitted to us. However, the rise in psychotic cases was found whether we used confirmed or projected figures in the calculation.
In this report we have examined additional data for the period 1997–2005 for the possible explanations for this increase. We comment below on each of these explanations. However, we should emphasise that in this report we also present evidence that the increase may not be continuing (see section 3.2.2).
(i) increasing prevalence of psychosis in the general population
• An overall rise in psychosis could increase the number of homicides by psychotic people.
• We examined recent research on the prevalence of psychosis in the UK.
• The evidence indicates that the prevalence of schizophrenia and psychosis during the report period was stable or declining (11, 12, 13).
(ii) improved quality of psychiatric reports
• Improved quality of reports could result in greater detection of psychotic symptoms in recent years.
• Psychiatric reports were assessed to analyse whether there had been a change in the quality of the report writing over time. We also examined who had written the reports to find out whether there had been a change in expertise – for example in the number of forensic psychiatrists, general psychiatrists and non-psychiatrists.
• A total of 53 reports were reviewed on 27 perpetrators.
• The quality of a report was defined by a number of factors: 1) a comprehensive interview with the perpetrator; 2) information collected from other people or clinical records; 3) the expertise of the report writer.
• By these criteria we did not find any changes in the quality of reports over time.

12National Confidential Inquiry into Suicide and Homicide by People with Mental Illness Annual Report July 2010 CurrENT iSSuES
(iii) increased rate of psychosis in immigrants
• Some migrant communities have a higher rate of psychosis (14) and may be less likely or able to seek help from services after arriving in England and Wales.
• Therefore we examined the number of perpetrators of homicide with psychosis at the time of the homicide, born outside England and Wales.
• If migration was the explanation, we would expect to see a more marked increase in the number of those who had recently moved to England and Wales.
• We therefore examined cases in which migration had occurred within 5 years of homicide. The numbers were small. Over the 9 years from 1997 to 2005, 72 (24%) of those who were psychotic at the time of the offence were born outside the UK. Overall, there was no trend in the number of homicides by people with psychosis who were immigrants. We found the figures increased in recent years from 7 in 1997 to 15 in 2004 and 11 in 2005.
An increase of this size does not explain the rise in homicide by people with psychosis.
• Eleven (4%) had recently migrated. There was no significant increase in this group.
(iv) increasing number of people with a short duration of illness
• An increase in cases of sudden onset of psychosis could lead to an increase in homicide before contact with services could be made.
• We examined cases in which onset of illness began within a year of the homicide.
• We found no change over time in people who were psychotic at the time of the offence who had a short duration of illness.
(v) increase in homicide in city populations
• Psychotic illness is more prevalent in urban areas (15). The increase in homicide by psychotic people could reflect a rise in urban homicides.
• We therefore examined the people with psychosis by urban and rural areas based on the police force where the person was charged (urban: Metropolitan, Greater Manchester, Merseyside, West Midlands and West Yorkshire police forces).
• Between 1997 and 2005 there was a significant increase in the number of homicides by people with psychosis whose offences occurred in urban areas. However, an increase was also noted in the number occurring in rural areas (Figure 1). There was no significant increase in urban psychotic homicides compared with those in rural areas.

13National Confidential Inquiry into Suicide and Homicide by People with Mental Illness Annual Report July 2010 CurrENT iSSuES 13
figure 1: Number of homicides by people with psychosis in urban and rural areas in England and wales, by year of conviction
(vi) increase in substance use
• Substance use can cause or exacerbate psychotic symptoms.
• A reported history of drug and alcohol misuse in those with psychosis was examined.
• There was a significant increase in the number of homicides by people with psychosis who also had a history of drug misuse (Figure 2).
• Of the 174 people with psychosis and a history of drug misuse, the most frequently used drugs in the year before the offence were cannabis (106 cases), cocaine/crack cocaine (41 cases) and amphetamines (35 cases).
• There was also a significant increase in the number of homicides by people with psychosis who also had a history of alcohol misuse (Figure 2).
• The rise in cases in which there was drug misuse, and less obviously in cases with alcohol misuse, is of the same order as the total rise in homicides by people with psychosis (around 20 cases annually).
Note: Urban police force areas include Metropolitan, Greater Manchester, West Midlands, West Yorkshire and Merseyside police forces only.
10
19
15
12
16
10
18
28
22
13 14
9 1 1
15
18
26 27
20
0
5
10
15
20
25
30
1997 1998 1999 2000 2001 2002 2003 2004 2005
Freq
uenc
y
Y ear
Urban
Rural

14National Confidential Inquiry into Suicide and Homicide by People with Mental Illness Annual Report July 2010 CurrENT iSSuES 14
figure 2: Number of homicides by people with psychosis and a history of drug and alcohol misuse, by year of conviction
Conclusion:On the basis of our data, the likeliest explanation for the rise in homicide by people with psychosis is the use of drugs and/or alcohol. However, we can not demonstrate cause and effect, and the association could be incidental.
1 1
19
13 10
13 13
32 30
33
7
12
8 6
10 10
22
26
16
0
5
10
15
20
25
30
35
1997 1998 1999 2000 2001 2002 2003 2004 2005
Freq
uenc
y
Y ear
Drug misuse Alcohol misuse
15National Confidential Inquiry into Suicide and Homicide by People with Mental Illness Annual Report July 2010 CurrENT iSSuES
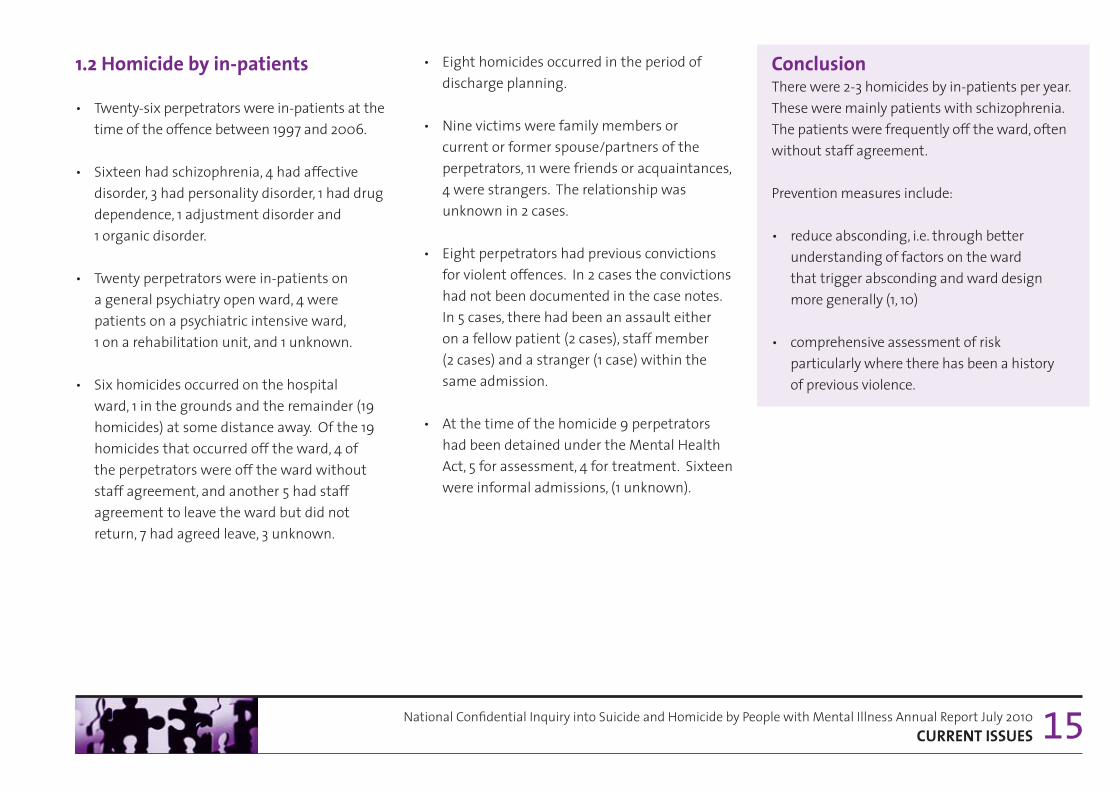
1.2 Homicide by in-patients
• Twenty-six perpetrators were in-patients at the time of the offence between 1997 and 2006.
• Sixteen had schizophrenia, 4 had affective disorder, 3 had personality disorder, 1 had drug dependence, 1 adjustment disorder and 1 organic disorder.
• Twenty perpetrators were in-patients on a general psychiatry open ward, 4 were patients on a psychiatric intensive ward, 1 on a rehabilitation unit, and 1 unknown.
• Six homicides occurred on the hospital ward, 1 in the grounds and the remainder (19 homicides) at some distance away. Of the 19 homicides that occurred off the ward, 4 of the perpetrators were off the ward without staff agreement, and another 5 had staff agreement to leave the ward but did not return, 7 had agreed leave, 3 unknown.
• Eight homicides occurred in the period of discharge planning.
• Nine victims were family members or current or former spouse/partners of the perpetrators, 11 were friends or acquaintances, 4 were strangers. The relationship was unknown in 2 cases.
• Eight perpetrators had previous convictions for violent offences. In 2 cases the convictions had not been documented in the case notes. In 5 cases, there had been an assault either on a fellow patient (2 cases), staff member (2 cases) and a stranger (1 case) within the same admission.
• At the time of the homicide 9 perpetrators had been detained under the Mental Health Act, 5 for assessment, 4 for treatment. Sixteen were informal admissions, (1 unknown).
ConclusionThere were 2-3 homicides by in-patients per year. These were mainly patients with schizophrenia. The patients were frequently off the ward, often without staff agreement.
Prevention measures include:
• reduce absconding, i.e. through better understanding of factors on the ward that trigger absconding and ward design more generally (1, 10)
• comprehensive assessment of risk particularly where there has been a history of previous violence.

16National Confidential Inquiry into Suicide and Homicide by People with Mental Illness Annual Report July 2010 CurrENT iSSuES 16
figure 3: Number of patient suicides in those aged under 251.3 Suicide by patients aged under 25
• In the years 1997-2007, there were 1,128 patient suicides among people under 25 years, 8% of the total sample. 289 (26%) were aged between 10 and 19, and 839 (74%) between 20 and 24.
• There has been a significant downward trend in the number of patient suicides aged under 25 since 1997 (Figure 3). The fall in patient suicides in this age-group (57%) has been greater than the fall in the equivalent age-group in the general population (39%).
• The magnitude of the fall was greater in the 20–24 year olds than that of the 10–19 year olds.
• The proportion of under 25 year olds who died by suicide and who had been in contact with services has remained stable over the study period at approximately 20%.
• The number of suicides in young patients with a short duration of illness (<1 year) has also fallen during the study period (13%), but not to the same degree as the total number of young patient suicides.
Conclusion The number of suicide deaths in younger patients has fallen substantially and this fall is greater than the equivalent fall in the general population.
138 127 121
104 1 1 1 93
107 100 94
80
60
27 41
26 23 29 26 22 29 19
29
20
1 1 1
86 95
81 82
67
85
71 75
51
39
0
20
40
60
80
100
120
140
160
1997 1998 1999 2000 2001 2002 2003 2004 2005 2006 2007
Freq
uenc
y
Year
Under 25 total 10-19 years 20-24 years
17National Confidential Inquiry into Suicide and Homicide by People with Mental Illness Annual Report July 2010SuiCidE 17
2. SuiCidE2.1 Suicide in the general population
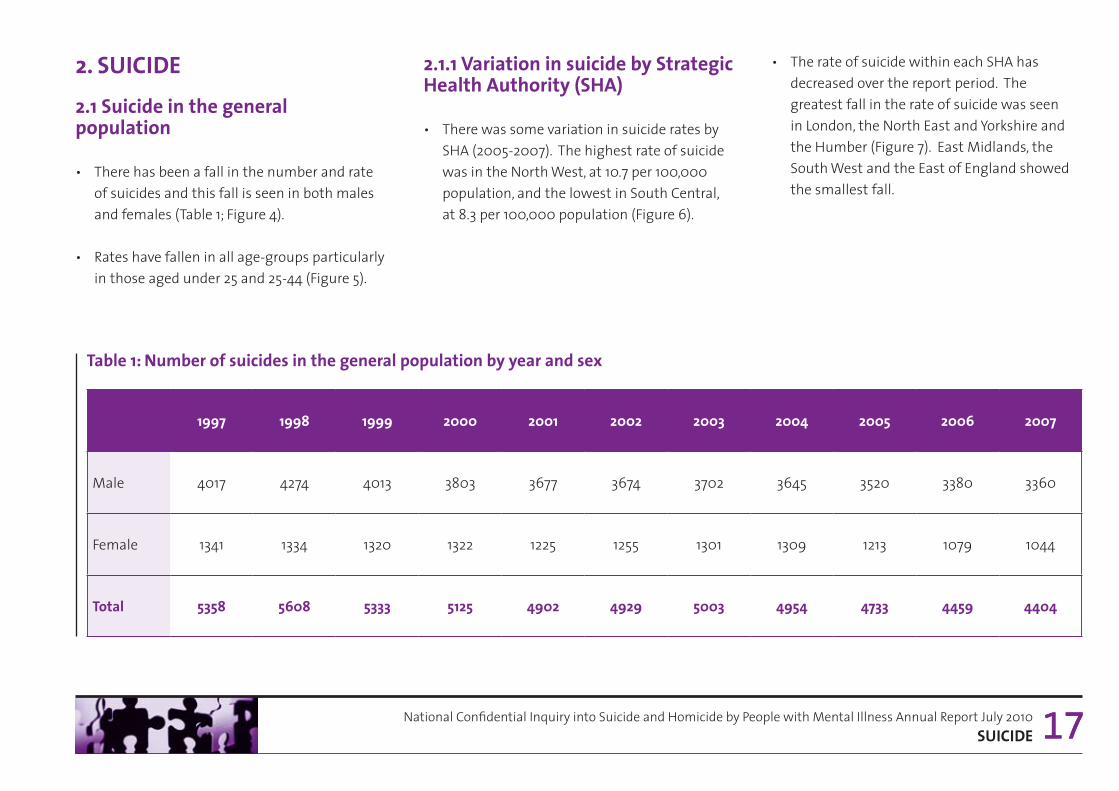
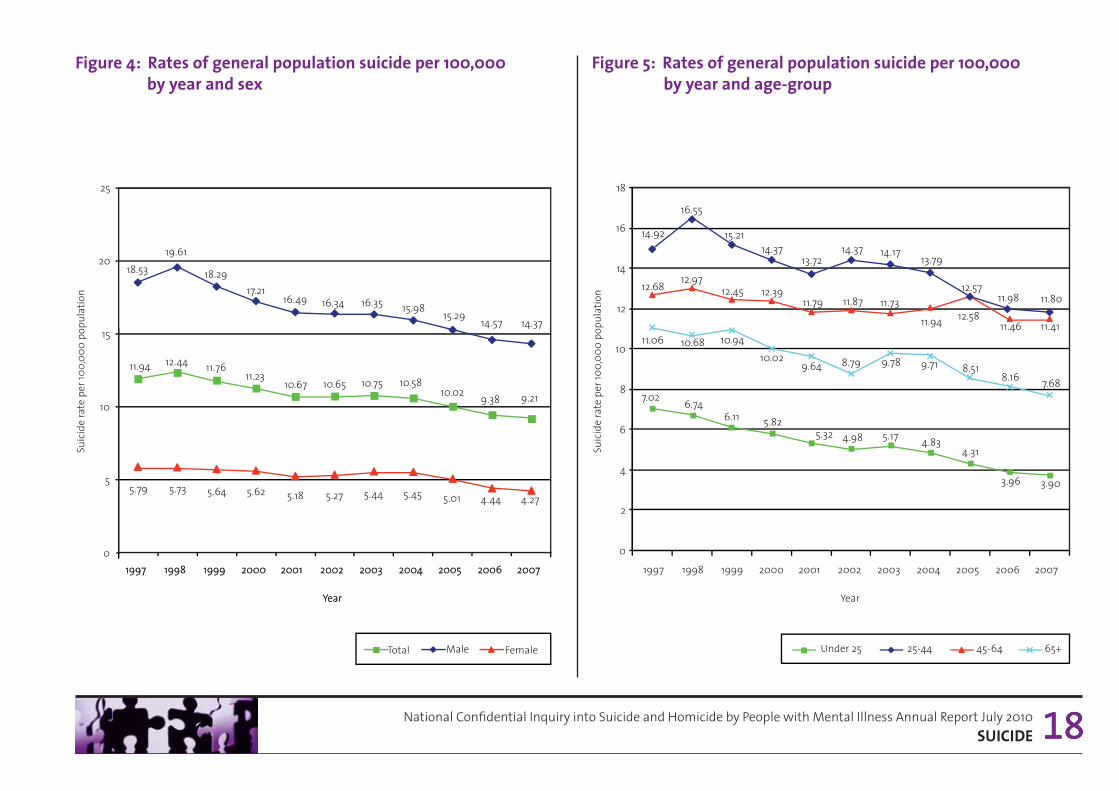
• There has been a fall in the number and rate of suicides and this fall is seen in both males and females (Table 1; Figure 4).
• Rates have fallen in all age-groups particularly in those aged under 25 and 25-44 (Figure 5).
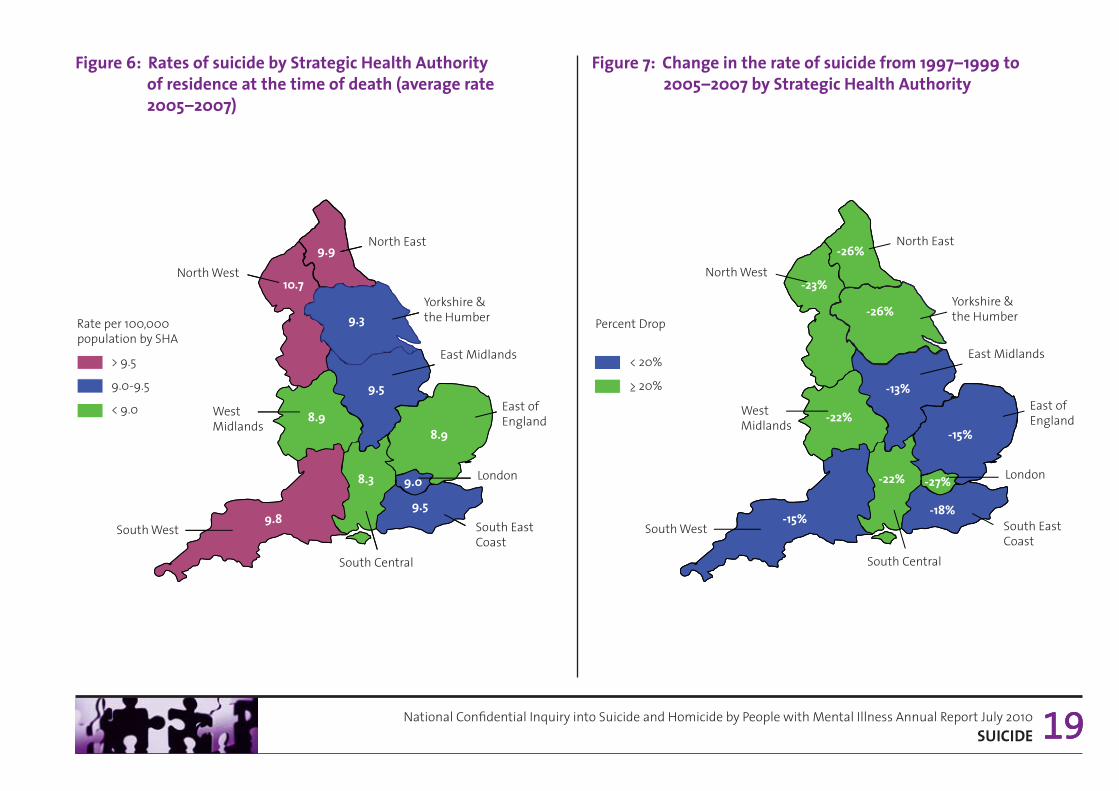
2.1.1 Variation in suicide by Strategic Health authority (SHa)
• There was some variation in suicide rates by SHA (2005-2007). The highest rate of suicide was in the North West, at 10.7 per 100,000 population, and the lowest in South Central, at 8.3 per 100,000 population (Figure 6).
• The rate of suicide within each SHA has decreased over the report period. The greatest fall in the rate of suicide was seen in London, the North East and Yorkshire and the Humber (Figure 7). East Midlands, the South West and the East of England showed the smallest fall.
Table 1: Number of suicides in the general population by year and sex
1997 1998 1999 2000 2001 2002 2003 2004 2005 2006 2007
Male 4017 4274 4013 3803 3677 3674 3702 3645 3520 3380 3360
Female 1341 1334 1320 1322 1225 1255 1301 1309 1213 1079 1044
Total 5358 5608 5333 5125 4902 4929 5003 4954 4733 4459 4404
18National Confidential Inquiry into Suicide and Homicide by People with Mental Illness Annual Report July 2010SuiCidE 1818
figure 4: rates of general population suicide per 100,000 by year and sex
figure 5: rates of general population suicide per 100,000 by year and age-group
19981997
Suici
de ra
te p
er 10
0,00
0 po
pula
tion
20
15
25
10
5
01999 2000 2001 2002
Year
2004 2005 2006 20072003
5.735.79 5.64 5.62 5.18 5.27 5.45 5.01 4.44 4.275.44
19.6118.53 18.29
17.2116.49 16.34 15.98
15.29 14.57 14.37
16.35
12.4411.94 11.7611.23
10.67 10.65 10.5810.02 9.38 9.21
10.75
Male FemaleTotal
Suici
de ra
te p
er 10
0,00
0 po
pula
tion
1998 1999 2000 2001 2003 20042002
Year
2005 2006 20071997
12.9712.45 12.39
11.79 11.73
11.94
11.8712.58
11.46 11.41
12.68
16.55
15.2114.37
13.7214.17
13.7914.37
12.5711.98 11.80
14.92
10.68 10.9410.02
9.64 9.78 9.718.79 8.518.16 7.68
11.06
7.02 6.746.11 5.82
5.32 5.17 4.834.984.31
3.96 3.90
0
2
6
4
8
10
12
14
16
18
Under 25 45-64 65+25-44
19981997
Suici
de ra
te p
er 10
0,00
0 po
pula
tion
20
15
25
10
5
01999 2000 2001 2002
Year
2004 2005 2006 20072003
5.735.79 5.64 5.62 5.18 5.27 5.45 5.01 4.44 4.275.44
19.6118.53 18.29
17.2116.49 16.34 15.98
15.29 14.57 14.37
16.35
12.4411.94 11.7611.23
10.67 10.65 10.5810.02 9.38 9.21
10.75
Male FemaleTotal
Suici
de ra
te p
er 10
0,00
0 po
pula
tion
1998 1999 2000 2001 2003 20042002
Year
2005 2006 20071997
12.9712.45 12.39
11.79 11.73
11.94
11.8712.58
11.46 11.41
12.68
16.55
15.2114.37
13.7214.17
13.7914.37
12.5711.98 11.80
14.92
10.68 10.9410.02
9.64 9.78 9.718.79 8.518.16 7.68
11.06
7.02 6.746.11 5.82
5.32 5.17 4.834.984.31
3.96 3.90
0
2
6
4
8
10
12
14
16
18
Under 25 45-64 65+25-44
19National Confidential Inquiry into Suicide and Homicide by People with Mental Illness Annual Report July 2010SuiCidE 1919
figure 6: rates of suicide by Strategic Health authority of residence at the time of death (average rate 2005–2007)
figure 7: Change in the rate of suicide from 1997–1999 to 2005–2007 by Strategic Health authority
Rate per 100,000 population by SHA
10.7
9.3
9.5
8.9
8.3 9.0
9.59.8
8.9
North West9.9
West Midlands
South West
North East
Yorkshire & the Humber
East Midlands
East of England
London
South East Coast
South Central
> 9.5
9.0-9.5
< 9.0
Percent Drop
North West-26%
-23%
-26%
-13%
-15%
-22%
-18%-15%
-22%West Midlands
South West
North East
Yorkshire & the Humber
East Midlands
East of London
London
South East Coast
South Central
< 20%
> 20%
North West
West Midlands
South West
North East
Yorkshire & the Humber
East Midlands
East of England
London
South East Coast
South Central
-27%

20National Confidential Inquiry into Suicide and Homicide by People with Mental Illness Annual Report July 2010SuiCidE 20
figure 8: general population suicides: cause of death by year2.1.2 method of suicide
• The most common methods of suicide were hanging/strangulation, self-poisoning (overdose) and jumping/multiple injuries.
• The frequency of methods differed between the sexes: in males the commonest methods were hanging/strangulation, self-poisoning and jumping/multiple injuries; in females, self-poisoning was the commonest method, followed by hanging/strangulation.
• Over the report period, there have been changes in method of suicide (Figure 8). Suicide deaths by hanging and cutting/stabbing have increased, whilst deaths by self-poisoning, carbon monoxide (CO) poisoning, drowning and firearms have decreased. Figures for jumping and burning have remained stable.
2000
1500
1000
500
1998 1999 2000 2002 2003 2005 20072006200420011997
1950 1927
18701972 1935
2043 20661919
2048
1780
1550
1468 1430 1374 1232 12771154
944996
125513201513
582 541
420320 308
485
189 151166228364
692
448 432
480 503 479 456507470485
461
109 138 127 11313514591 90 102 10277
0
2500
Freq
uenc
y
Year
CO poisoning
Self-poisoning Cutting/stabbing
JumpingHanging

21National Confidential Inquiry into Suicide and Homicide by People with Mental Illness Annual Report July 2010SuiCidE 21
2.2 Patient suicides 2.2.1 Patient suicide: numbers and rates
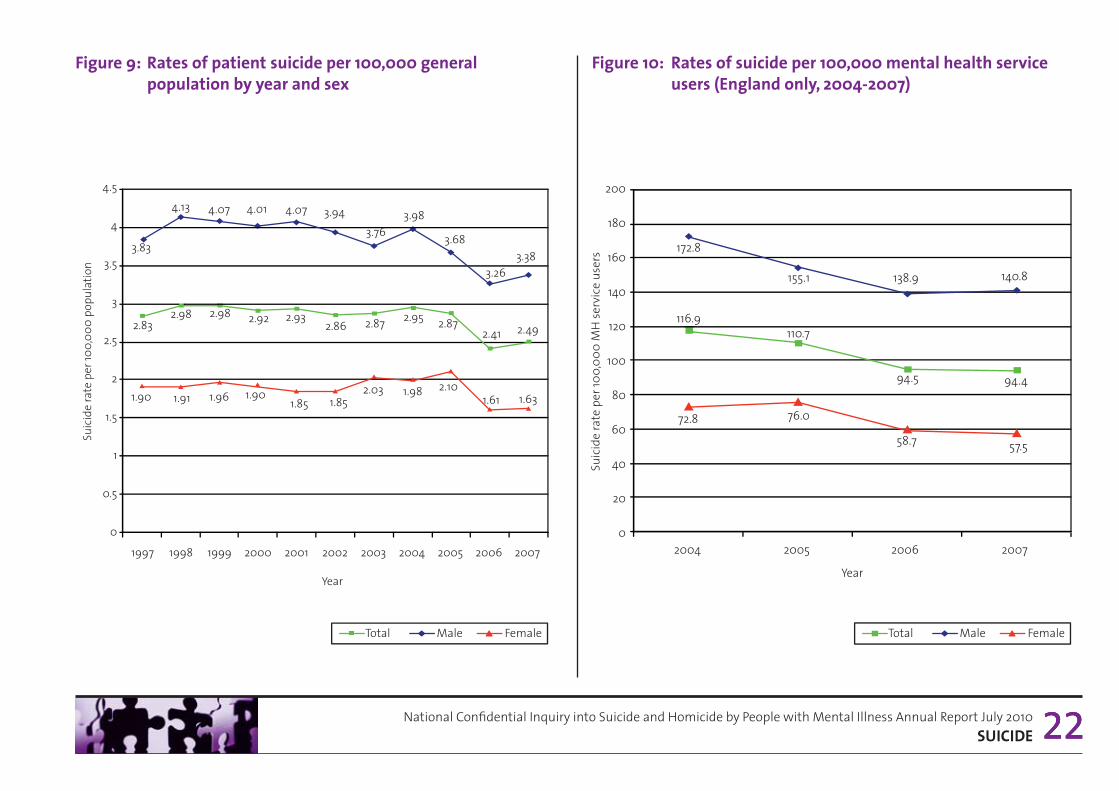
• During 1997-2007, 14,249 suicides (26% of general population suicides) were identified as patient suicides, i.e. the person had been in contact with mental health services in the 12 months prior to death.
• There has been a significant decrease in the rate of patient suicide using a general population denominator (Table 2; Figure 9).
• There has been a significant decrease in the rate of suicide between 2004-2007 when patient numbers rather than general population figures are used as the denominator (Figure 10).
• With respect to age, the number of patient suicides have decreased in those aged 44 and younger, but have increased in those aged 45-64 (Figure 11), the peak year being 2005.
2.2.2 method of suicide by patients
• The most common methods of suicide by patients were hanging/strangulation, self-poisoning and jumping/multiple injuries.
• The number of deaths by self-poisoning and carbon monoxide poisoning has decreased (Figure 12). An upward trend has occurred in hanging, jumping, and cutting/stabbing. Figures for drowning, firearms and burning have remained stable.
Table 2: Number of patient suicides by year and sex
1997 1998 1999 2000 2001 2002 2003 2004 2005 2006 2007
Male 830 900 893 887 908 885 852 907 848 755 791
Female 441 444 458 447 437 440 485 475 509 392 399
Total 1271 1344 1351 1334 1345 1325 1337 1382 1357 1147 1190
statistical note: patient suicides projected for 2007
22National Confidential Inquiry into Suicide and Homicide by People with Mental Illness Annual Report July 2010SuiCidE 2222
figure 9: rates of patient suicide per 100,000 general population by year and sex
figure 10: rates of suicide per 100,000 mental health service users (England only, 2004-2007)
1998 1999 2000 2002 2003 2005 20072006200420011997
1.91 1.96 1.90 1.852.03 2.10
1.631.611.98
1.851.90
2.98 2.98 2.92 2.86 2.87 2.87 2.492.412.952.93
2.83
4.13 4.07 4.01 3.943.76 3.68
3.383.26
3.984.07
3.83
2.5
3.5
4
3
1.5
2
1
0.5
0
4.5
Suici
de ra
te p
er 10
0,00
0 po
pula
tion
Year
Total Male Female
Total Male Female
200
172.8
138.9155.1 140.8
116.9
94.5
110.7
94.4
2004 20062005
Year
2007
72.8
58.7
76.0
57.5
Suic
ide
rate
per
100,
000
MH
serv
ice
user
s
180
160
140
120
100
80
60
20
0
40
Total Male Female
200
172.8
138.9155.1 140.8
116.9
94.5
110.7
94.4
2004 20062005
Year
2007
72.8
58.7
76.0
57.5
Suic
ide
rate
per
100,
000
MH
serv
ice
user
s
180
160
140
120
100
80
60
20
0
40
1998 1999 2000 2002 2003 2005 20072006200420011997
1.91 1.96 1.90 1.852.03 2.10
1.631.611.98
1.851.90
2.98 2.98 2.92 2.86 2.87 2.87 2.492.412.952.93
2.83
4.13 4.07 4.01 3.943.76 3.68
3.383.26
3.984.07
3.83
2.5
3.5
4
3
1.5
2
1
0.5
0
4.5
Suici
de ra
te p
er 10
0,00
0 po
pula
tion
Year
Total Male Female

23National Confidential Inquiry into Suicide and Homicide by People with Mental Illness Annual Report July 2010SuiCidE 2323
figure 11: Number of patient suicides by year and age-group figure 12: Patient suicides: cause of death by year
Under 2525-4445-6465+
Year
138
180153 160
186163
177162
176174153
127121 104 93 107 94
6080
100111138
654626 636 635
602
557
543
466
421
487484
616596610
425 424441 437 442
490
464
370
500
600
700
300
400
200
100
0
Freq
uenc
y
1998 1999 2000 2002 2003 2005 20072006200420011997
500
600
300
400
200
100
0
Freq
uenc
yHangingSelf-poisoningCO poisoningJumpingCutting/stabbing
Year
1998 1999 2000 2002 2003 2005 20072006200420011997
488 486 483 492 492518
497462
544
470
435
393 399
363 348 361 359
287282
395387369
158174
192 205 207
191 194201178
202
167
82 8370 67 57
393668
85
14 32 24 2538
43
292443
43
402125
66
Under 2525-4445-6465+
Year
138
180153 160
186163
177162
176174153
127121 104 93 107 94
6080
100111138
654626 636 635
602
557
543
466
421
487484
616596610
425 424441 437 442
490
464
370
500
600
700
300
400
200
100
0
Freq
uenc
y
1998 1999 2000 2002 2003 2005 20072006200420011997
Under 2525-4445-6465+
Year
138
180153 160
186163
177162
176174153
127121 104 93 107 94
6080
100111138
654626 636 635
602
557
543
466
421
487484
616596610
425 424441 437 442
490
464
370
500
600
700
300
400
200
100
0
Freq
uenc
y
1998 1999 2000 2002 2003 2005 20072006200420011997
Under 2525-4445-6465+
Year
138
180153 160
186163
177162
176174153
127121 104 93 107 94
6080
100111138
654626 636 635
602
557
543
466
421
487484
616596610
425 424441 437 442
490
464
370
500
600
700
300
400
200
100
0
Freq
uenc
y
1998 1999 2000 2002 2003 2005 20072006200420011997
500
600
300
400
200
100
0
Freq
uenc
yHangingSelf-poisoningCO poisoningJumpingCutting/stabbing
Year
1998 1999 2000 2002 2003 2005 20072006200420011997
488 486 483 492 492518
497462
544
470
435
393 399
363 348 361 359
287282
395387369
158174
192 205 207
191 194201178
202
167
82 8370 67 57
393668
85
14 32 24 2538
43
292443
43
402125
66
Under 2525-4445-6465+
Year
138
180153 160
186163
177162
176174153
127121 104 93 107 94
6080
100111138
654626 636 635
602
557
543
466
421
487484
616596610
425 424441 437 442
490
464
370
500
600
700
300
400
200
100
0
Freq
uenc
y
1998 1999 2000 2002 2003 2005 20072006200420011997

24National Confidential Inquiry into Suicide and Homicide by People with Mental Illness Annual Report July 2010SuiCidE 24
figure 13: Number of psychiatric in-patients who died by suicide; number of in-patients who died by hanging/strangulation on the ward
2.3 in-patient suicide
• Since 1997, there has been a 46% fall in the number of in-patients dying by suicide. A reduction in the rate of in-patient suicide has previously been found (16) (i.e. taking into account admission figures).
• The number of patients who died on the ward by hanging/strangulation has fallen by 69% (Figure 13).
• For 2007 there have been just 15 confirmed hanging deaths on psychiatric wards (we estimated that this figure will rise to 17 once data collection is complete – see Figure 13). The ligature points in 11 of these related to doors, windows or hooks/handles; in 6 cases a belt was used as the ligature.
219
199 202 209 196
179 193 170
164 141
1 18
54 43
57 45 46 38
48 35 31 29 17
0
50
100
150
200
250
1997 1998 1999 2000 2001 2002 2003 2004 2005 2006 2007
Freq
uenc
y
Y ear
In-patient suicide Hanging/strangulation on the ward

25National Confidential Inquiry into Suicide and Homicide by People with Mental Illness Annual Report July 2010SuiCidE 25
figure 14: Primary psychiatric diagnoses of patient suicide cases by year 2.4 diagnosis
• The primary psychiatric diagnoses for patients are shown in Figure 14.
• The numbers of patients with schizophrenia, alcohol dependence, drug dependence or personality disorder have decreased over the study period. The number with affective disorder has remained stable, whilst the number of patients with other diagnoses, particularly adjustment disorder, has increased.
ConclusionThe number of suicide deaths in mental health patients is falling and this fall is particularly evident in in-patients. These falls are greater than those in the general population. Suicide by hanging on the ward has fallen markedly. Suicide in patients aged 45-64 is increasing in frequency.
152
124 104 108
123 123 105 97 125
124
108 94
134
182 170 168 177 180 184
201 168
159
Affective disorder
Schizophrenia & other delusional
Personality disorder
Alcohol dependence
Drug dependence
Other
616
562 567 581 576
1 61627 616 627
529
577
263 261 239
273
237 230 244
268 263
208 191
55 79
50 48 53 50 35 42 29 24 39
1 1 1 131 123 129
113 99 88
1 13
83 79 89
0
100
200
300
400
500
600
700
Freq
uenc
y
1997 1998 1999 2000 2001 2002 2003 2004 2005 2006 2007
Year

National Confidential Inquiry into Suicide and Homicide by People with Mental Illness Annual Report July 2010HOmiCidE
3. HOmiCidE
3.1 Homicide in the general population
• The number of general population homicide convictions is shown in Figure 15. These figures are provided as context for our data on homicides by people with mental illness. More recent homicide statistics are published by the Home Office (4).
• The most common method of homicide is the use of a sharp instrument (Figure 16).
26
figure 15: general population homicides: sex of perpetrator by year of conviction
535
479 463
479
585
494
603 583
539 508
58 49 60 46 61 51 56 52 65 40
0
100
200
300
400
500
600
700
1997 1998 1999 2000 2001 2002 2003 2004 2005 2006
Freq
uenc
y
Year
Male Female
535
479 463
479
585
494
603 583
539 508
58 49 60 46 61 51 56 52 65 40
0
100
200
300
400
500
600
700
1997 1998 1999 2000 2001 2002 2003 2004 2005 2006
Freq
uenc
y
Year
Male Female

27National Confidential Inquiry into Suicide and Homicide by People with Mental Illness Annual Report July 20103. HOmiCidE 27
figure 16: general population homicides: method of homicide by year of conviction
212
77
80
39
28 17
123
186
69
84
36
128
192
74
60
48
28
106
182
53
81
31
24
113
210
63
98
53
31
127
208
41
104
30
45
104
248
72
111
27
49
100
209
64
94
33 49
69
0
50
100
150
250
200
300
Freq
uenc
y
1997 1998 1999 2000 2001 2002 2003 2004 2005 2006
Year
Sharp instrument Blunt instrument
Hitting & kicking Strangulation
Firearms Other method
238
74 106
33
50
411
234
61
98
46
52
125
28National Confidential Inquiry into Suicide and Homicide by People with Mental Illness Annual Report July 20103. HOmiCidE 28
figure 17: rates of perpetrators convicted of homicide by Strategic Health authority of residence at the time of the offence (average rate 2004–2006)
North East
North West
West Midlands
Yorkshire & the Humber
East of England
London
South East Coast
South Central
South West
East Midlands
Rate per 100,000 population by SHA
>1.4
<1.0 1.0-1.4
1.25
1.37
1.51
1.28
1.05
0.75
2.16
0.82
0.86
0.84
3.1.1 Variation in homicide by Strategic Health authority (SHa)
• In the most recent 3 year period (2004–2006), the highest rate of homicide was in London, and the lowest in East of England (Figure 17).
• Six SHAs experienced a rise in homicide from 1997–1999 to 2004–2006. The largest rise was in London (Figure 18).
statistical note: strategic health authority areas were unknown in 358 (6%) of homicides

29National Confidential Inquiry into Suicide and Homicide by People with Mental Illness Annual Report July 20103. HOmiCidE 29
figure 18: Change in the rate of perpetrators convicted of homicide from 1997–1999 to 2004–2006 by Strategic Health authority
North East
North West
West Midlands
Yorkshire & the Humber
East of England
London
South East Coast
South Central
South West
East Midlands
-10%
-1%
+14%
+21%
+19%
-6%
+8%
+11%
-7%
+44%
Percent change
>10%
<0% 0-10%

30National Confidential Inquiry into Suicide and Homicide by People with Mental Illness Annual Report July 20103. HOmiCidE 3030
26
35 29
28
38
30
37
48
41
36
0
10
20
30
40
50
60
Freq
uenc
y
1997 1998 1999 2000 2001 2002 2003 2004 2005 2006
Year
figure 19: Perpetrators with a primary diagnosis of schizophrenia (lifetime history), by year of conviction
3.2 Homicide by the mentally ill in the general population
3.2.1 Homicide with a lifetime primary diagnosis of schizophrenia
• There has been an overall rise in the number of homicides by people with schizophrenia over the report period (Figure 19).
• Data for the most recent years suggest this may not be continuing, as there has been a fall in the number of cases in the last 2 years.
• However, the figure for 2006 is an estimate in which the number of confirmed cases is adjusted to take account of late data. It is therefore too early to confirm a recent decrease.

National Confidential Inquiry into Suicide and Homicide by People with Mental Illness Annual Report July 2010HOmiCidE 31
figure 20: Perpetrators with mental illness at the time of the offence, by year of conviction (based upon all cases of homicide with a psychiatric report available)
56 55
46
56
23
33
24 23
57
31
60
28
74
44
78
55
70
42
47
23
0
10
20
30
40
50
60
70
80
90
Year
1997 1998 1999 2000 2001 2002 2003 2004 2005 2006
Freq
uenc
y
Abnormal mental state Psychotic at the time of the offence
56 55
46
56
23
33
24 23
57
31
60
28
74
44
78
55
70
42
47
23
0
10
20
30
40
50
60
70
80
90
Year
1997 1998 1999 2000 2001 2002 2003 2004 2005 2006
Freq
uenc
y
Abnormal mental state Psychotic at the time of the offence
3.2.2 Perpetrators known to be mentally ill at the time of homicide
• We previously reported a rise in homicides by people with symptoms of mental illness and symptoms of psychosis (see section 1.1).
• Our most recent data suggest that these increases may not be continuing (Figure 20).
• The figures for 2006 are estimates in which the number of confirmed cases are adjusted to take account of late data. It is therefore too early to confirm a recent decrease.

32National Confidential Inquiry into Suicide and Homicide by People with Mental Illness Annual Report July 20103. HOmiCidE 32
Freq
uenc
y
53
47
6
65
53
12
49
43
6
52
44
8
59
52
7
43
38
5
68
56
12
65
53
12
71
64
7
65
56
9
0
10
20
30
40
50
60
70
80
1997 1998 1999 2000 2001 2002 2003 2004 2005 2006
Year
Total Male Female
Freq
uenc
y
53
47
6
65
53
12
49
43
6
52
44
8
59
52
7
43
38
5
68
56
12
65
53
12
71
64
7
65
56
9
0
10
20
30
40
50
60
70
80
1997 1998 1999 2000 2001 2002 2003 2004 2005 2006
Year
Total Male Female
figure 21: Patient homicides: number of patient homicides by sex of perpetrator, by year of conviction
3.3 Patient homicides
• During 1997-2006, 589 people convicted of homicide (10% of all those convicted) were identified as patients, i.e. the person had been in contact with mental health services in the 12 months prior to the offence.
• Although numbers are higher in recent years (2003-2006) there is no significant overall increase in the number of patient homicides over the time period of the study (Figure 21).
• The number of cases in each age-group has fluctuated. There has been an upward trend in homicide by patients aged 25 to 44 (Figure 22).

33National Confidential Inquiry into Suicide and Homicide by People with Mental Illness Annual Report July 20103. HOmiCidE 33
1 1
1 1
31
17
39
9
15
28
9
17
33
9
23
39
9
15
41
9
13
27
9
29
7
7
18
37
13
13
45
7
0
5
10
15
20
25
30
35
40
45
50
Freq
uenc
y
1997 1998 1999 2000 2001 2002 2003 2004 2005 2006
Year
<25 25-44 45+
1 1
1 1
31
17
39
9
15
28
9
17
33
9
23
39
9
15
41
9
13
27
9
29
7
7
18
37
13
13
45
7
0
5
10
15
20
25
30
35
40
45
50
Freq
uenc
y
1997 1998 1999 2000 2001 2002 2003 2004 2005 2006
Year
<25 25-44 45+
figure 22: Number of patient homicides by age-group of perpetrator, by year of conviction

6
16
19
3
6
14
16
4
14
17
16
9
12 14
19
10
9
13
29
13
0
5
10
15
20
25
30
35
1997 1998 1999 2000 2001
Year
2002 2003 2004 2005 2006
Freq
uenc
y
Family member Spouse/partner Acquaintance Stranger
9 9
23
10 12
14
20
4
15
15
25
8
7
17
20
8 8
13
20
5
6
16
19
3
6
14
16
4
14
17
16
9
12 14
19
10
9
13
29
13
0
5
10
15
20
25
30
35
1997 1998 1999 2000 2001
Year
2002 2003 2004 2005 2006
Freq
uenc
y Family member Spouse/partner Acquaintance Stranger
9 9
23
10 12
14
20
4
15
15
25
8
7
17
20
8 8
13
20
5
34National Confidential Inquiry into Suicide and Homicide by People with Mental Illness Annual Report July 20103. HOmiCidE 34
figure 23: Patient homicides: relationship of victim to perpetrator, by year of conviction
3.3.1 relationship of victim to perpetrator: patient homicide cases
• The relationship of victim to perpetrator is shown in Figure 23.
• The commonest victims for male patients were acquaintances whereas females most commonly killed family members or spouse/partners.
• The figures fluctuated with no significant changes over the time period of the study.
3.3.2 diagnosis
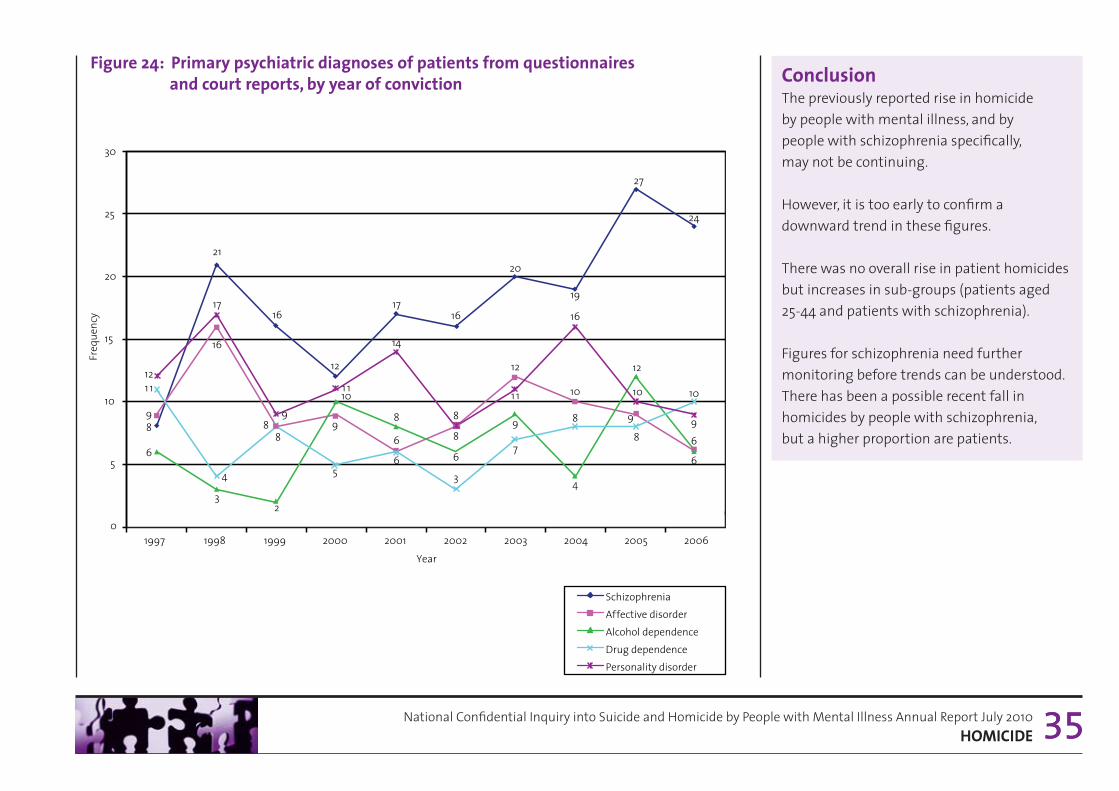
• Schizophrenia remains the commonest diagnosis (Figure 24).
• There was an increase in the number of homicides by patients with schizophrenia.
35National Confidential Inquiry into Suicide and Homicide by People with Mental Illness Annual Report July 20103. HOmiCidE 35
figure 24: Primary psychiatric diagnoses of patients from questionnaires and court reports, by year of conviction
17
6
8
6 8 9
6
1 1 12
21
16
3
4
17
14
16
8
6
3
8
20
12
9
7
1 1
27
9
12
8
10
24
6
6
10
9
0
5
10
15
20
25
30
1997 1998 1999 2000 2001 2002 2003 2004 2005 2006 Year
Schizophrenia Affective disorder Alcohol dependence Drug dependence Personality disorder
Freq
uenc
y
19
10
4
8
16
12
9
10
5
1 1
16
8
2
8
9
ConclusionThe previously reported rise in homicide by people with mental illness, and by people with schizophrenia specifically, may not be continuing.
However, it is too early to confirm a downward trend in these figures.
There was no overall rise in patient homicides but increases in sub-groups (patients aged 25-44 and patients with schizophrenia).
Figures for schizophrenia need further monitoring before trends can be understood. There has been a possible recent fall in homicides by people with schizophrenia, but a higher proportion are patients.
17
6
8
6 8 9
6
1 1 12
21
16
3
4
17
14
16
8
6
3
8
20
12
9
7
1 1
27
9
12
8
10
24
6
6
10
9
0
5
10
15
20
25
30
1997 1998 1999 2000 2001 2002 2003 2004 2005 2006 Year
Schizophrenia Affective disorder Alcohol dependence Drug dependence Personality disorder
Freq
uenc
y
19
10
4
8
16
12
9
10
5
1 1
16
8
2
8
9
36National Confidential Inquiry into Suicide and Homicide by People with Mental Illness Annual Report July 2010SuddEN uNEXPLaiNEd dEaTH iN PSYCHiaTriC iN-PaTiENTS
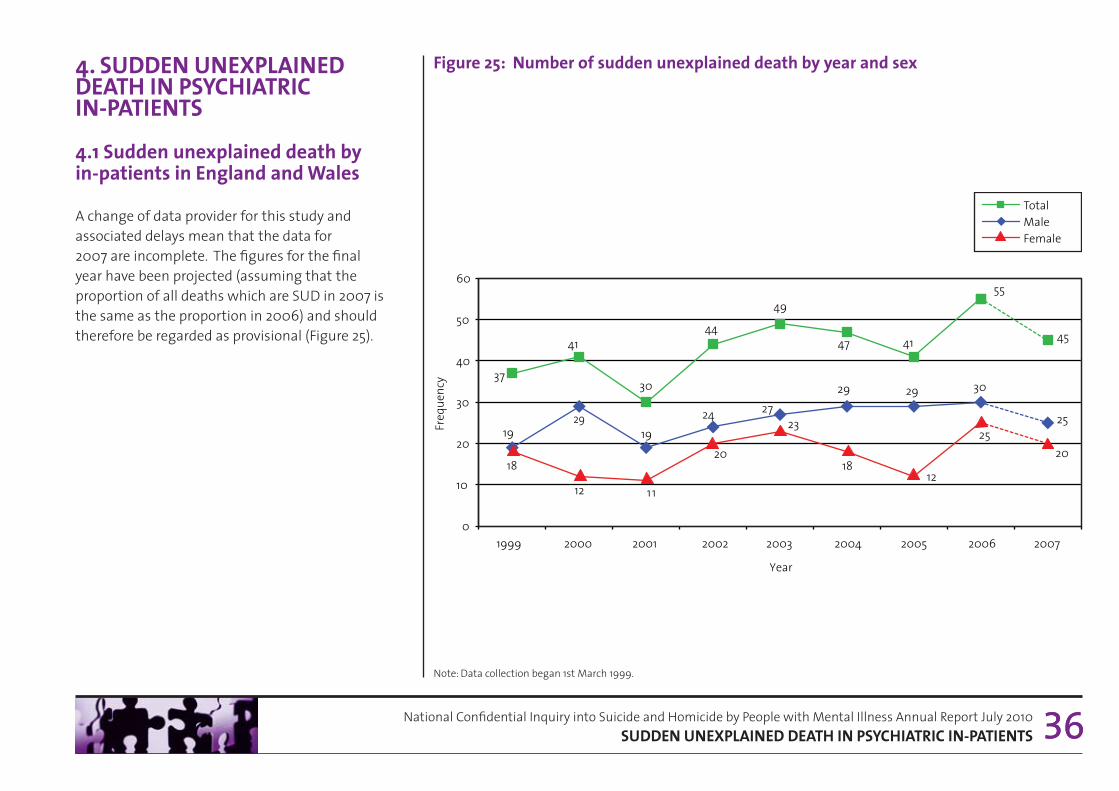
figure 25: Number of sudden unexplained death by year and sex4. SuddEN uNEXPLaiNEd dEaTH iN PSYCHiaTriC iN-PaTiENTS
4.1 Sudden unexplained death by in-patients in England and wales
A change of data provider for this study and associated delays mean that the data for 2007 are incomplete. The figures for the final year have been projected (assuming that the proportion of all deaths which are SUD in 2007 is the same as the proportion in 2006) and should therefore be regarded as provisional (Figure 25).
36Note: Data collection began 1st March 1999.
37
41
30
44
49
47 41
55
19 29
19 24 27
29 29
18
12 11
20
23
18 12
45
30
25 25
20
0
10
20
30
40
50
60
1999 2000 2001 2002 2003 2004 2005 2006 2007
Freq
uenc
y
Year
Total Male Female

37National Confidential Inquiry into Suicide and Homicide by People with Mental Illness Annual Report July 2010SuddEN uNEXPLaiNEd dEaTH iN PSYCHiaTriC iN-PaTiENTS
ConclusionThere continue to be approximately 40 sudden unexplained deaths per year on psychiatric in-patient wards. There are no clear trends with respect to ethnicity or restraint deaths.
Table 4: Number of all deaths within 24 hours of restraint by year and ethnicity
Table 3: Number of sudden unexplained death by year and ethnicity
1999 2000 2001 2002 2003 2004 2005 2006 2007
White 33 39 25 36 44 40 38 49 23
Black and Minority Ethnic 4 1 5 6 4 6 3 6 3
Unknown ethnicity 0 1 0 2 1 1 0 0 1
Note: Data collection began 1st March 1999.
2002 2003 2004 2005 2006 2007
White 1 1 1 3 4 2
Black and Minority Ethnic 1 0 1 0 0 0
Unknown ethnicity 0 0 1 0 0 1
4.2 Sudden unexplained death and patient ethnicity
• SUD in patients from Black and Minority Ethnic (BME) groups shows no clear pattern over time (Table 3). The number of cases has varied from 1-6 per year.
• The number of post-restraint deaths has varied from 1-4 per year (Table 4). Of the total 16 post-restraint deaths, 2 were patients from a BME group.
• We do not know whether restraint caused these deaths.
• These data represent actual (not projected) numbers.

National Confidential Inquiry into Suicide and Homicide by People with Mental Illness Annual Report July 2010uPdaTE ON iNQuirY rESEarCH PrOJECTS
5. uPdaTE ON iNQuirY rESEarCH PrOJECTS
5.1 Projects funded by the National Patient Safety agency
5.1.1 Serious violence by people in the care of services
Study focus: An extension to the homicide inquiry, this study is examining a national sample of people convicted for serious violent offences (including attempted murder, malicious wounding) who have had contact with mental health services. This study will provide information on the characteristics and service contact of patients committing serious violent offences. The aims are to:
• establish the prevalence of mental health service contact in those committing serious violent offences
• examine the social and clinical characteristics of those with a history of contact with psychiatric services.
Data collection for this study is completed and analysis is underway. Findings will be reported in future Inquiry publications.
5.1.2 People with mental ill health who are victims of homicide
Study focus: The relationship between mental illness and being a victim of homicide has not been researched comprehensively. The aims are to:
• estimate the number of people under mental health care who are victims of homicide
• identify the clinical and socio-demographic characteristics of the victims and their care from services.
Data collection for this study is completed and analysis is underway. Findings will be reported in future Inquiry publications.
5.1.3 The aetiology of in-patient suicide
Study focus: This project is studying the antecedents of suicide in three sub-groups of psychiatric in-patients: absconders, patients on agreed leave, and patients under non-routine observation. On completion this study will help to inform suicide prevention strategies specific to the psychiatric in-patient setting and help to reduce the incidence of suicide among this patient population. The aim is to:
• identify the socio-demographic features, clinical characteristics and care variables for patients in each of the sub-groups.
Data collection for this study is completed and analysis is underway. Findings will be reported in future Inquiry publications.
38

National Confidential Inquiry into Suicide and Homicide by People with Mental Illness Annual Report July 2010uPdaTE ON iNQuirY rESEarCH PrOJECTS
5.2 Projects funded from external sources
5.2.1 filicide: a Literature review(funded by the department of Health, Social Services and Public Safety Northern ireland)
We have completed a review of research on filicide in the United Kingdom and internationally to identify any issues relevant to mental health and social care, and to raise awareness of any potential links between parental mental health disorders and filicide. The report is available online via the Inquiry’s web site (17).
5.2.2 bipolar study(funded by NHS National institute for Health research)
Bipolar disorder is associated with a particularly high risk of self harm and suicide. This project aims to understand the risk of suicide in bipolar disorder by exploring demographic, clinical and management-related risk factors for suicidal behaviour and how these different risk factors link together in episodes of self harm or suicide. We will review existing data held by the National Confidential Inquiry and Manchester Self Harm project and undertake a series of in depth interviews with individuals with bipolar disorder who have made medically serious suicide attempts, and the relatives of individuals with bipolar disorder who died by suicide.
39

National Confidential Inquiry into Suicide and Homicide by People with Mental Illness Annual Report July 2010rECENT rEPOrTS aNd PaPErS frOm THE iNQuirY
6. rECENT rEPOrTS aNd PaPErS frOm THE iNQuirY
for a full list of inquiry reports and publications see the inquiry website (http://www.manchester.ac.uk/nci - inquiry publications).
Kapur, N., While, D., Blatchley, N., Bray, I. & Harrison, K. Suicide after leaving the UK armed forces – A cohort study. PLoS Med 6(3) (2009): e1000026 doi:10.1371/journal.pmed. 1000026.
Purandare, N., Oude Voshaar, R., Rodway, C., Bickley, H., Burns, A. & Kapur, N. Suicide in dementia: 9-year national clinical survey in England and Wales. British Journal of Psychiatry (2009) 194, 175-180.
Hunt, I.M., Kapur, N., Webb, R., Robinson, J., Burns, J., Shaw, J., & Appleby, L. Suicide in recently discharged psychiatric patients. Psychological Medicine (2009) 39, 443-449.
Pearson, A., Saini, P., Da Cruz, D., Miles, C., While, D., Swinson, N., Williams, A., Shaw, J. & Kapur, N. Primary care contact prior to suicide in individuals with mental illness. British Journal of General Practice (2009) 59, 825-832.
Hunt, I.M., While, D., Windfuhr, K., Swinson, N., Shaw, J., Appleby, L. & Kapur, N. Suicide pacts in the mentally ill: a national clinical survey. Psychiatry Research (2009) 167, 131-138.
Hunt, I.M., Windfuhr, K., Swinson, N., Shaw J., Appleby, L. & Kapur, N. Suicide amongst psychiatric in-patients who abscond from the ward: a national clinical survey. BMC Psychiatry (2010), 10:14http://www.biomedcentral.com/1471-244X/10/14.
Roscoe, A., Rodway, C., Mehta, H., While, D., Amos, T. ,Kapur, N., Appleby, L. & Shaw, J. Psychiatric recommendations to the court as regards homicide perpetrators. Journal of Forensic Psychiatry and Psychology (2009) 20(3), 366-377.
Rodway, C., Flynn, S., Swinson, N., Roscoe, A., Hunt, I.M., Windfuhr, K., Kapur, N., Appleby, L. & Shaw, J. Methods of homicide in England and Wales: a comparison by diagnostic group. Journal of Forensic Psychiatry and Psychology (2009) 20(2), 268-305.
Flynn, S., Swinson, N., While, D., Hunt, I.M., Windfuhr, K., Kapur, N., Appleby, L. & Shaw, J. Homicide followed by suicide: a cross sectional study. Journal of Forensic Psychiatry and Psychology (2009) 20(2), 306-321.
Hunt, I.M., Swinson, N., Palmer, B., Turnbull, P., Cooper, J., Kapur, N., & Appleby, L. Method of suicide in the mentally ill: a national clinical survey. Suicide and Life Threatening Behavior (2010), 40, 22-34.
Kapur, N. & Gask, L. Introduction to suicide and self-harm. Psychiatry, (2009) 8 (7), 233-236.
Kapur, N. Suicide in the mentally ill. Psychiatry, (2009) 8 (7), 257-260.
Windfuhr, K. Issues in designing, implementing, and evaluating suicide prevention strategies. Psychiatry, (2009) 8 (7), 272-275.
Shaw, J. & Turnbull, P. Suicide in custody. Psychiatry, (2009) 8 (7), 265-268.
40

National Confidential Inquiry into Suicide and Homicide by People with Mental Illness Annual Report July 2010rEfErENCES
7. rEfErENCES
1 Avoidable Deaths: Five year report of the National Confidential Inquiry into Suicide and Homicide by People with Mental Illness (2006). Online: http://www.medicine.manchester.ac.uk/psychiatry/research/suicide/prevention/nci/inquiry_reports
2 Office for National Statistics. http://www.statistics.gov.uk/
3 Home Office Research Development Statistics. http://www.homeoffice.gov.uk/rds/policevio1.html
4 Home Office (2010). http://rds.homeoffice.gov.uk/rds/pdfs10/hosb0110.pdf
5 Hospital Episode Statistics. http://www.hesonline.nhs.uk/
6 Health Solutions Wales. http://www.hsw.wales.nhs.uk/
7 Statacorp Statistical Software: Release 10.0. College Stations, TX: Stata Corporation, 2007
8 National Suicide Prevention Strategy for England. Annual Report 2007. National Mental Health Development Unit, published April 2008. Further information: http://nmhdu.org.uk/
9 Mental Health Minimum Dataset. Online: http://www.ic.nhs.uk/services/mental-health/mental-health-minimum-dataset-mhmds
10 National Confidential Inquiry into Suicide and Homicide by People with Mental Illness: Annual Report England and Wales (2009). Online: http://www.medicine.manchester.ac.uk/psychiatry/research/suicide/prevention/nci/inquiry_reports
41
National Confidential Inquiry into Suicide and Homicide by People with Mental Illness Annual Report July 2010rEfErENCES
11 Frisher, F., Crome, I., Martino, O., et al. (2009). Assessing the impact of cannabis use on trends in diagnosed schizophrenia in the United Kingdom from 1996 to 2005. Schizophrenia Research; 113; 123-128.
12 McManus, S., Meltzer, H., Brugha, T., et al. (2009). Adult Psychiatric Morbidity in England, 2007. Results of a household survey. NHS Publication, Jan 27, 2009. Available at: www.ic.nhs/pubs/psychiatricmorbidity07. Last accessed 7 Dec 2009.
13 Kirkbride, J.B., Croudace, T., Brewin, J., et al. (2009). Is the incidence of psychotic disorder in decline? Epidemiological evidence from two decades of research. International Journal of Epidemiology 38(5): 1255-1264.
14 Coid, J.W., Kirkbride, J.B., Barker, D., et al. (2008). Raised Incidence Rates of All Psychoses Among Migrant Groups. Findings From the East London First Episode Psychosis Study. Archives of General Psychiatry; 65: 1250-1258.
15 Mortensen, P., Pedersen, C.B., Westergaard, T., et al. (1999). Effects of family history and place and season of birth on the risk of schizophrenia. The New England Journal of Medicine; 340; 603-608.
16 Kapur, N., Hunt, I.M., Webb, R., et al. (2006). Suicide in psychiatric in-patients in England, 1997 to 2003. Psychological Medicine; 36: 1485-1492.
17 Filicide: A Literature Review. Online http://www.medicine.manchester.ac.uk/psychiatry/research/suicide/prevention/reports/filicide_a_literature_review.pdf
42

National Confidential Inquiry into Suicide and Homicide by People with Mental Illness Annual Report July 2010fuNdiNg bOdiES
fuNdiNg
The inquiry in England and wales is funded by:
additional funding is received from:
43