National Community Health Survey by Penn Schoen Berland
110
NEW YORK • WASHINGTON • DENVER • SEATTLE • LOS ANGELES • SAN FRANCISCO • LONDON • HONG KONG • BEIJING / NATIONAL COMMUNITY HEALTH SURVEY MARCH 2013 ©PENN, SCHOEN & BERLAND ASSOCIATES, LLC.
-
Upload
shefali-khanna -
Category
Documents
-
view
216 -
download
2
description
National Community Health Survey by Penn Schoen Berland concludes that family & health are top priorities of Americans. Americans do not think their communities provide sufficient access to key resources for good health & they rate themselves and their communities as healthy, despite research showing the opposite. They view health care providers as particularly important to community health & online resources as important health care tools.
Transcript of National Community Health Survey by Penn Schoen Berland
NEW YORK • WASHINGTON • DENVER • SEATTLE • LOS ANGELES • SAN FRANCISCO • LONDON • HONG KONG • BEIJING
/ NATIONAL COMMUNITY HEALTH SURVEY
MARCH 2013
©PENN, SCHOEN & BERLAND ASSOCIATES, LLC.
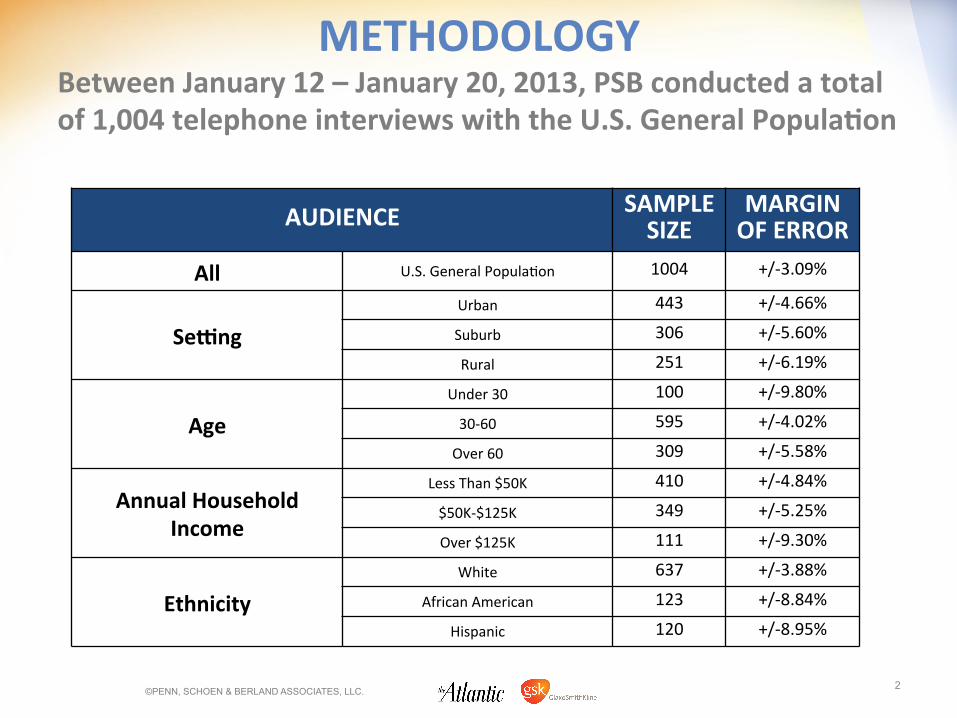
METHODOLOGY Between January 12 – January 20, 2013, PSB conducted a total of 1,004 telephone interviews with the U.S. General PopulaQon
2
AUDIENCE SAMPLE SIZE
MARGIN OF ERROR
All U.S. General Popula/on 1004 +/-‐3.09%
SeTng Urban 443 +/-‐4.66%
Suburb 306 +/-‐5.60%
Rural 251 +/-‐6.19%
Age Under 30 100 +/-‐9.80%
30-‐60 595 +/-‐4.02%
Over 60 309 +/-‐5.58%
Annual Household Income
Less Than $50K 410 +/-‐4.84%
$50K-‐$125K 349 +/-‐5.25%
Over $125K 111 +/-‐9.30%
Ethnicity White 637 +/-‐3.88%
African American 123 +/-‐8.84%
Hispanic 120 +/-‐8.95%
©PENN, SCHOEN & BERLAND ASSOCIATES, LLC.
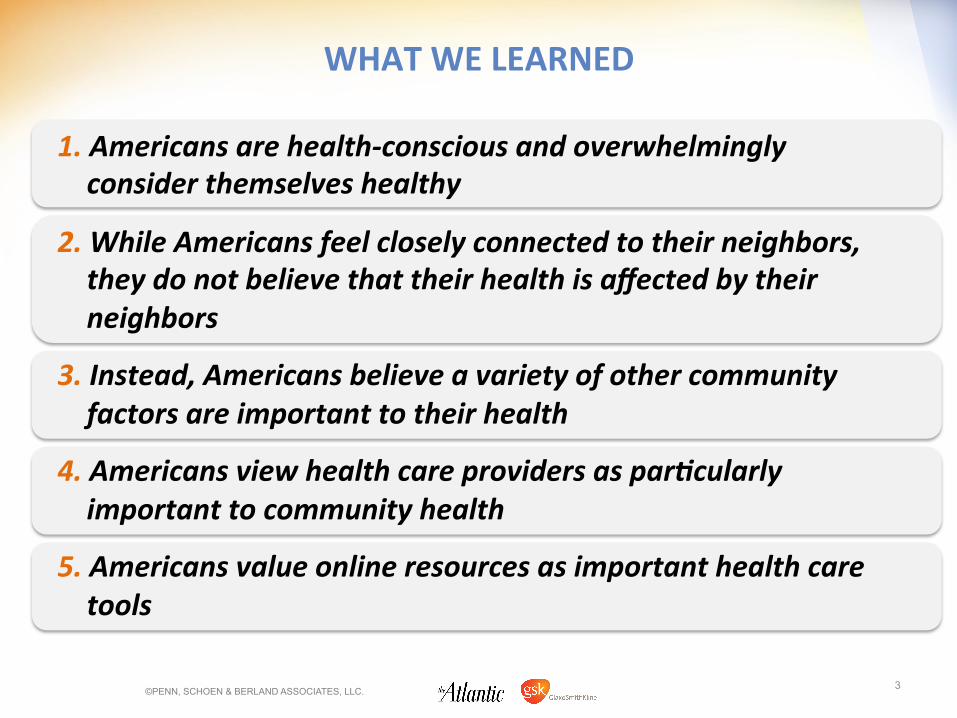
1. Americans are health-‐conscious and overwhelmingly consider themselves healthy
2. While Americans feel closely connected to their neighbors, they do not believe that their health is affected by their neighbors
3. Instead, Americans believe a variety of other community factors are important to their health
4. Americans view health care providers as parBcularly important to community health
5. Americans value online resources as important health care tools
WHAT WE LEARNED
©PENN, SCHOEN & BERLAND ASSOCIATES, LLC. 3

NEW YORK • WASHINGTON • DENVER • SEATTLE • LOS ANGELES • SAN FRANCISCO • LONDON • HONG KONG • BEIJING
AMERICANS ARE HEALTH-‐CONSCIOUS AND OVERWHELMINGLY CONSIDER THEMSELVES HEALTHY

FAMILY AND HEALTH ARE TOP PRIORITIES OF AMERICANS
©PENN, SCHOEN & BERLAND ASSOCIATES, LLC. 5
6
7
10
23
50
70
Your Social Life
Community Service
Your Hobbies And Leisure Time
Your Job
Your Health
Taking Care Of Your Family
PrioriQes Which of the following do you consider to be your 1-‐2 biggest prioriBes?
v 64% of Americans over the age of 60 say health is a top priority
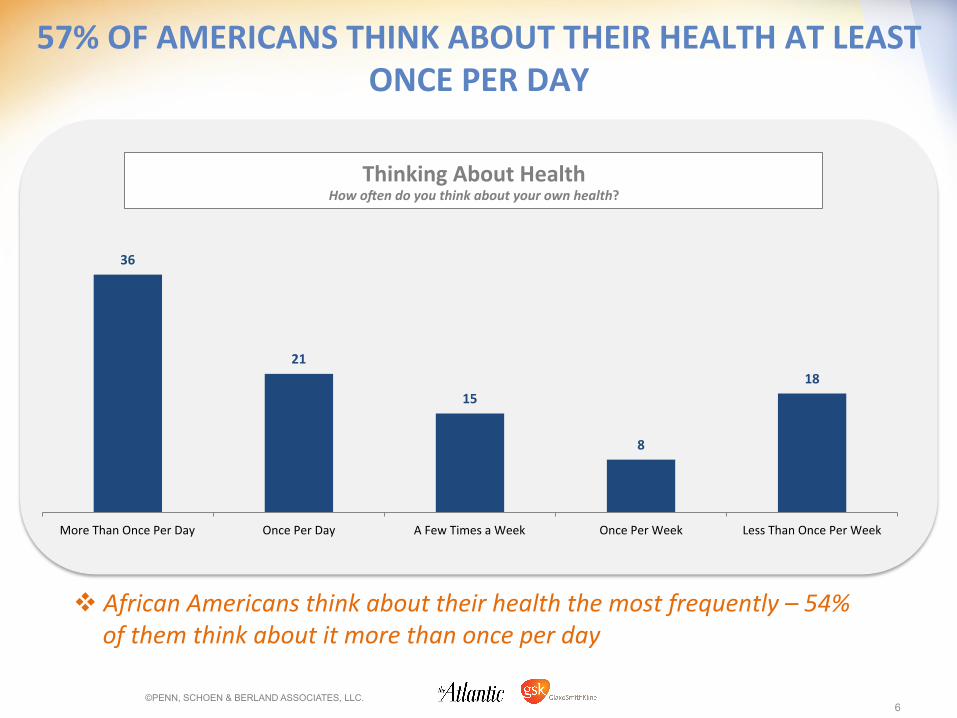
57% OF AMERICANS THINK ABOUT THEIR HEALTH AT LEAST ONCE PER DAY
©PENN, SCHOEN & BERLAND ASSOCIATES, LLC. 6
N=
36
21
15
8
18
More Than Once Per Day Once Per Day A Few Times a Week Once Per Week Less Than Once Per Week
Thinking About Health How oFen do you think about your own health?
v African Americans think about their health the most frequently – 54% of them think about it more than once per day
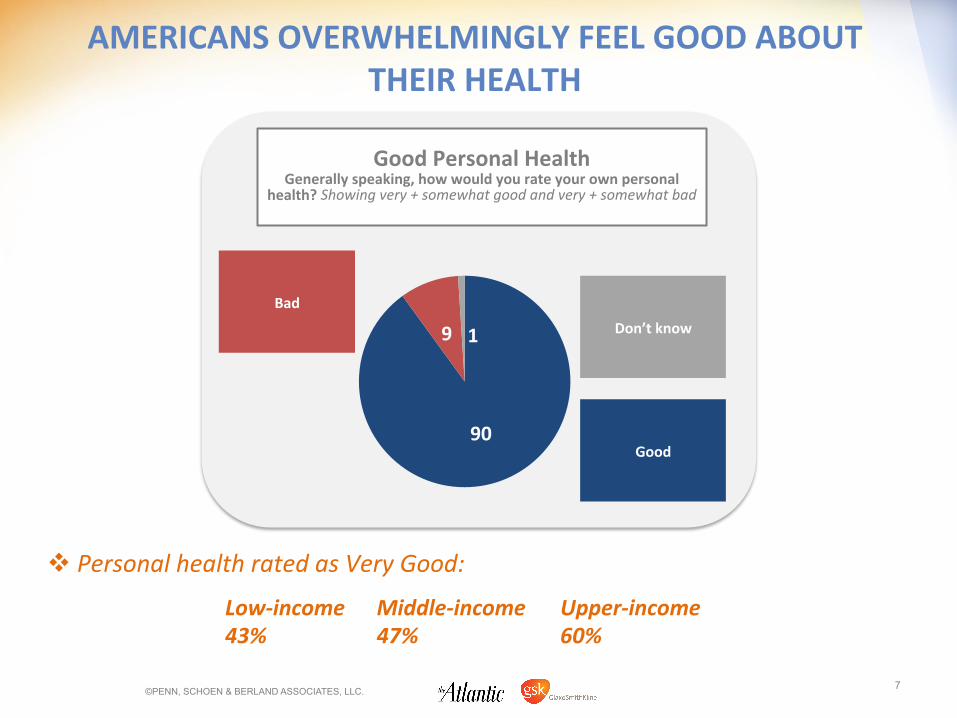
AMERICANS OVERWHELMINGLY FEEL GOOD ABOUT THEIR HEALTH
©PENN, SCHOEN & BERLAND ASSOCIATES, LLC. 7
Good Personal Health Generally speaking, how would you rate your own personal
health? Showing very + somewhat good and very + somewhat bad
90
9 1
Good
Bad
Don’t know
v Personal health rated as Very Good: Low-‐income 43%
Middle-‐income 47%
Upper-‐income 60%

A MAJORITY OF AMERICANS THINK THAT THEIR HEALTH HAS NOT CHANGED RECENTLY
©PENN, SCHOEN & BERLAND ASSOCIATES, LLC. 8
Change in Past 5-‐10 years Would you say that your health has generally improved, stayed
the same or goden worse since you have moved into your community? Asked of those who have moved in past 5 years
Would you say that your health has generally improved, stayed the same, or goden worse in the past 5-‐10 years? Asked of those
who have not moved in that Fmeframe.
19
26 53
Improved
Goden Worse
Stayed The Same
N=
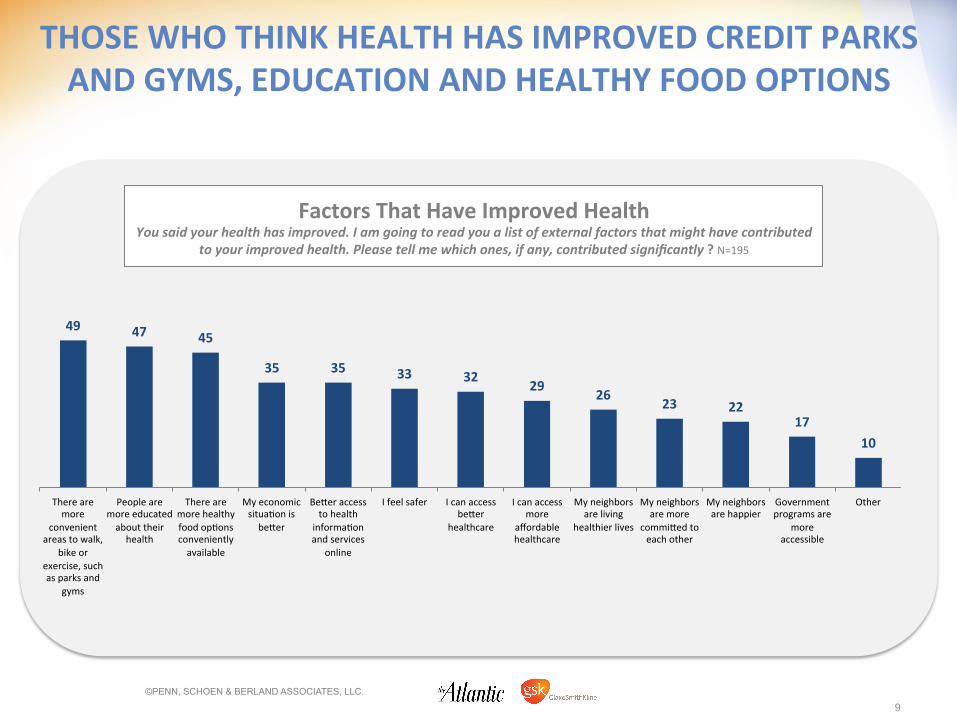
49 47 45
35 35 33 32 29 26 23 22 17
10
There are more
convenient areas to walk,
bike or exercise, such as parks and
gyms
People are more educated about their health
There are more healthy food op/ons conveniently available
My economic situa/on is be]er
Be]er access to health
informa/on and services
online
I feel safer I can access be]er
healthcare
I can access more
affordable healthcare
My neighbors are living
healthier lives
My neighbors are more
commi]ed to each other
My neighbors are happier
Government programs are
more accessible
Other
Factors That Have Improved Health You said your health has improved. I am going to read you a list of external factors that might have contributed
to your improved health. Please tell me which ones, if any, contributed significantly ? N=195
THOSE WHO THINK HEALTH HAS IMPROVED CREDIT PARKS AND GYMS, EDUCATION AND HEALTHY FOOD OPTIONS
©PENN, SCHOEN & BERLAND ASSOCIATES, LLC.
9
N=
28
20 15 15 15 15 14 14 14
11 6 6 6 5 4
My economic situa/on is worse
There are fewer healthy food op/ons conveniently available
I cannot access be]er healthcare
Government programs are
less accessible
People are less educated about their health
People are less
commi]ed to each other
I cannot access
affordable healthcare
I feel less safe There are fewer
convenient areas to walk,
bike, or exercise, such as parks and
gyms
I got older My neighbors are less happy
Developed health problem
Chose to live less healthy lifestyle
(Chose to eat worse,
exercise less, or take more job stress)
My neighbors are living less healthy lives
Worse access to health
informa/on and services
online
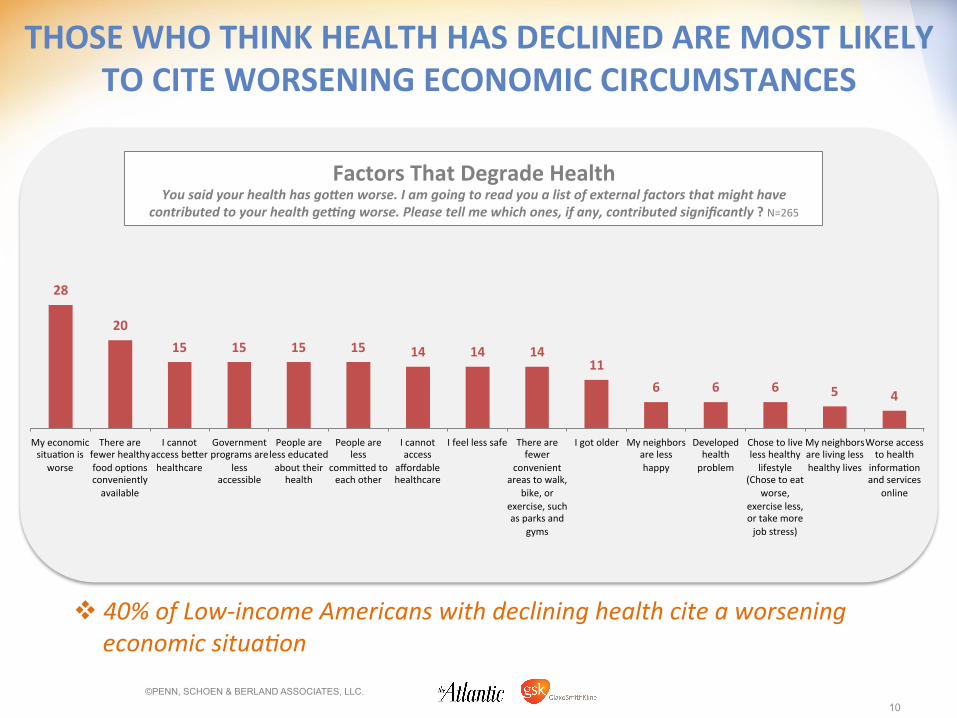
Factors That Degrade Health You said your health has goSen worse. I am going to read you a list of external factors that might have
contributed to your health geTng worse. Please tell me which ones, if any, contributed significantly ? N=265
THOSE WHO THINK HEALTH HAS DECLINED ARE MOST LIKELY TO CITE WORSENING ECONOMIC CIRCUMSTANCES
©PENN, SCHOEN & BERLAND ASSOCIATES, LLC.
10
v 40% of Low-‐income Americans with declining health cite a worsening economic situaFon
NEW YORK • WASHINGTON • DENVER • SEATTLE • LOS ANGELES • SAN FRANCISCO • LONDON • HONG KONG • BEIJING
WHILE AMERICANS FEEL CLOSELY CONNECTED TO THEIR NEIGHBORS, THEY DO NOT BELIEVE THAT THEIR HEALTH IS AFFECTED BY THEIR NEIGHBORS
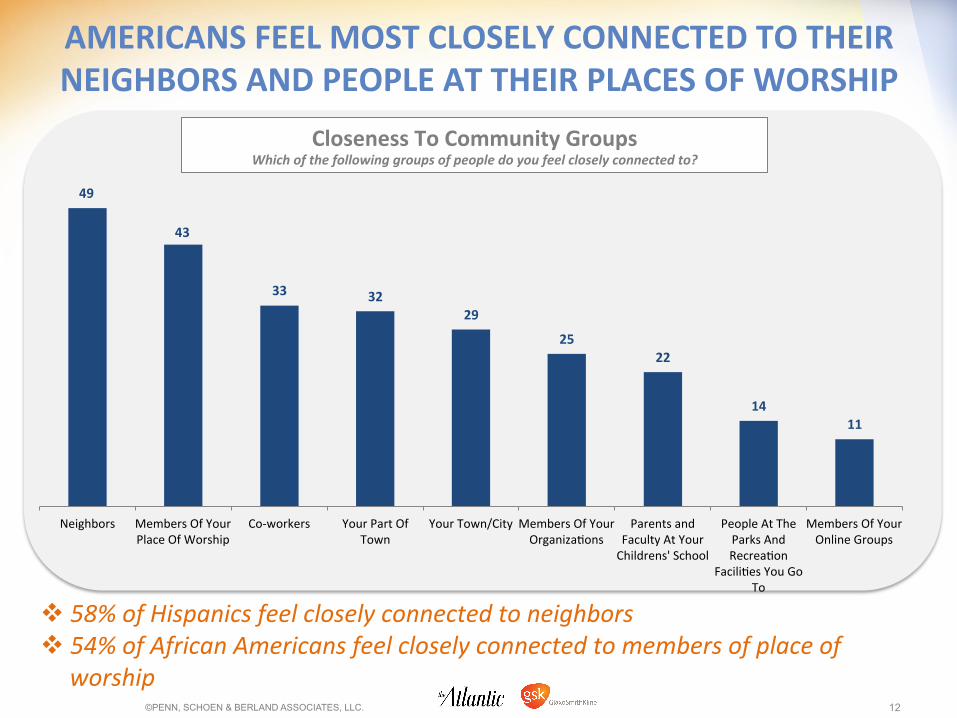
AMERICANS FEEL MOST CLOSELY CONNECTED TO THEIR NEIGHBORS AND PEOPLE AT THEIR PLACES OF WORSHIP
©PENN, SCHOEN & BERLAND ASSOCIATES, LLC. 12
49
43
33 32 29
25 22
14 11
Neighbors Members Of Your Place Of Worship
Co-‐workers Your Part Of Town
Your Town/City Members Of Your Organiza/ons
Parents and Faculty At Your Childrens' School
People At The Parks And Recrea/on
Facili/es You Go To
Members Of Your Online Groups
Closeness To Community Groups Which of the following groups of people do you feel closely connected to?
v 58% of Hispanics feel closely connected to neighbors v 54% of African Americans feel closely connected to members of place of
worship
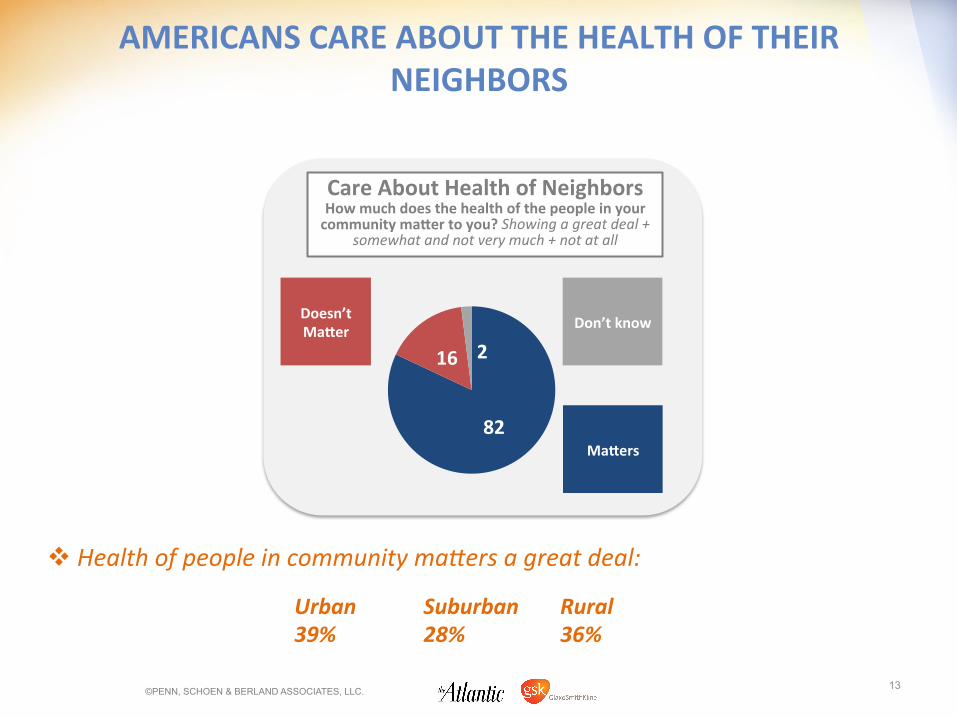
AMERICANS CARE ABOUT THE HEALTH OF THEIR NEIGHBORS
©PENN, SCHOEN & BERLAND ASSOCIATES, LLC. 13
Care About Health of Neighbors How much does the health of the people in your community mader to you? Showing a great deal +
somewhat and not very much + not at all
82
16 2
Maders
Doesn’t Mader Don’t know
v Health of people in community maLers a great deal:
Urban 39%
Suburban 28%
Rural 36%
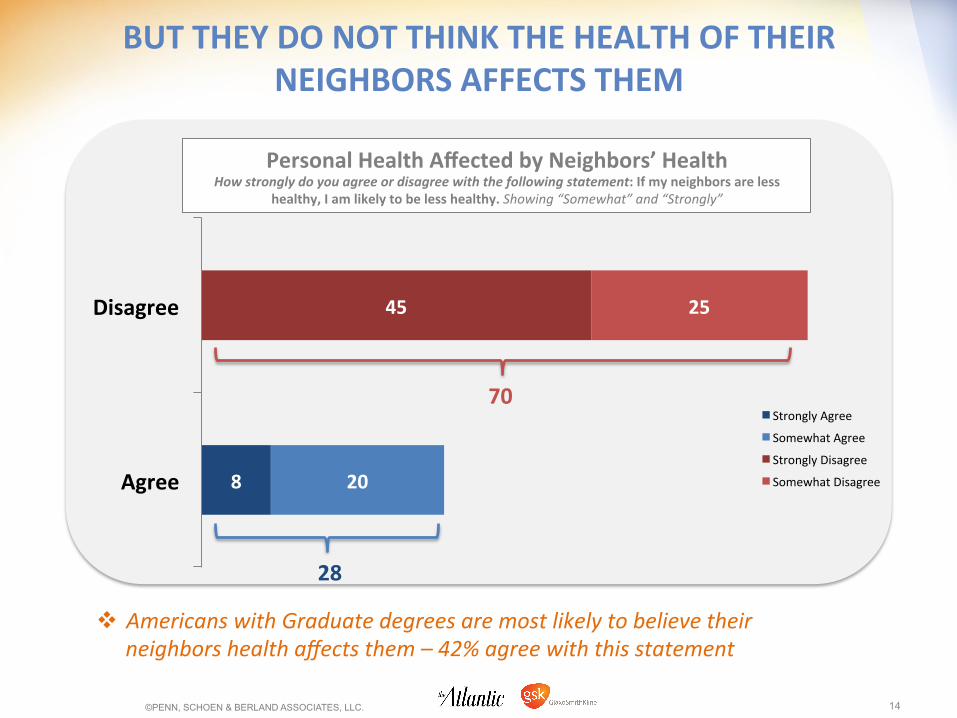
BUT THEY DO NOT THINK THE HEALTH OF THEIR NEIGHBORS AFFECTS THEM
©PENN, SCHOEN & BERLAND ASSOCIATES, LLC. 14
8
45
20
25
Agree
Disagree
Strongly Agree
Somewhat Agree
Strongly Disagree
Somewhat Disagree
Personal Health Affected by Neighbors’ Health How strongly do you agree or disagree with the following statement: If my neighbors are less
healthy, I am likely to be less healthy. Showing “Somewhat” and “Strongly”
70
28
v Americans with Graduate degrees are most likely to believe their neighbors health affects them – 42% agree with this statement
NEW YORK • WASHINGTON • DENVER • SEATTLE • LOS ANGELES • SAN FRANCISCO • LONDON • HONG KONG • BEIJING
AMERICANS BELIEVE A VARIETY OF OTHER COMMUNITY FACTORS ARE IMPORTANT TO THEIR HEALTH

AMERICANS BELIEVE THAT THEIR COMMUNITIES ARE HEALTHY PLACES TO LIVE
©PENN, SCHOEN & BERLAND ASSOCIATES, LLC. 16
Ability to Live Healthy in Your Community How easy or difficult do you think it is to live a healthy lifestyle specifically in your community? Showing very + somewhat easy
and very + somewhat difficult
81
19
Easy
Difficult
v This is consistent among urban, suburban, and rural Americans

THEY BELIEVE A VARIETY OF COMMUNITY RESOURCES ARE IMPORTANT TO THEIR HEALTH
©PENN, SCHOEN & BERLAND ASSOCIATES, LLC. 17
N=
87 82 81 74 69 64 59 41 39 32
12 15 17 22
19 28 29
33 38
20
Good Air and Water Quality
Doctors and Den/sts
Whom I Can See Regularly
Healthy Food Choices
Nearby Hospitals and Urgent Care Facili/es
Safe, Affordable Housing
Informa/on or Educa/on on Preven/on, Health and Wellness
Open Parks and Green Spaces
Nearby Gyms or Recrea/on Facili/es
Kind, Suppor/ve Neighbors
Ajer-‐School Programs or Ac/vi/es
Outside School Hours
Somewhat Important Very Important
Importance of Community Resources How important is the following to your health?
99
88 92 88
74 77
52
97 96 98
v Environment, doctors, healthy food and hospitals almost universally seen as most important

AMERICANS BELIEVE THAT THEIR COMMUNITIES PROVIDE AT LEAST SOME ACCESS TO HEALTH RESOURCES
©PENN, SCHOEN & BERLAND ASSOCIATES, LLC. 18
N=
73 68 72 62 64 57 53 47
37 32
20 24 19 28 26
30 27
31 41
25
Doctors and Den/sts
Whom I Can See Regularly
Healthy Food Choices
Nearby Hospitals and Urgent Care Facili/es
Good Air and Water Quality
Open Parks and Green Spaces
Informa/on or Educa/on on Preven/on, Health and Wellness
Nearby Gyms or Recrea/on Facili/es
Safe, Affordable Housing
Kind, Suppor/ve Neighbors
Ajer-‐School Programs or Ac/vi/es
Outside School Hours
Some
A Great Deal
Access To Community Resources How much access do you have to this resource in your community today?
93 90 87 80 78 78
57
92 90 91
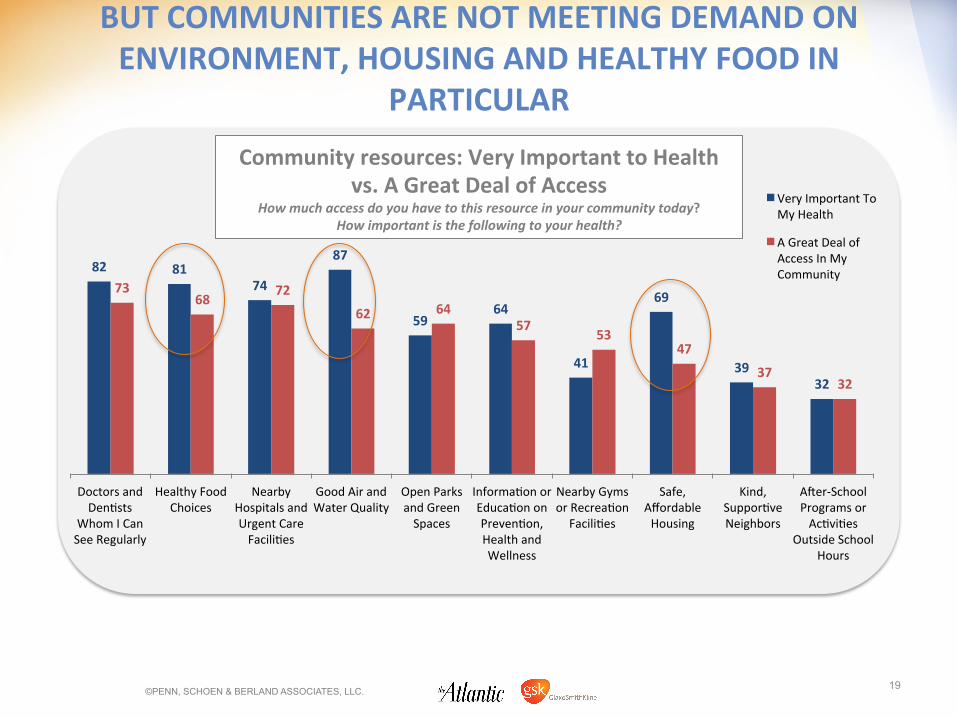
BUT COMMUNITIES ARE NOT MEETING DEMAND ON ENVIRONMENT, HOUSING AND HEALTHY FOOD IN
PARTICULAR
©PENN, SCHOEN & BERLAND ASSOCIATES, LLC. 19
N=
82 81 74
87
59 64
41
69
39 32
73 68
72
62 64 57
53 47
37 32
Doctors and Den/sts
Whom I Can See Regularly
Healthy Food Choices
Nearby Hospitals and Urgent Care Facili/es
Good Air and Water Quality
Open Parks and Green Spaces
Informa/on or Educa/on on Preven/on, Health and Wellness
Nearby Gyms or Recrea/on Facili/es
Safe, Affordable Housing
Kind, Suppor/ve Neighbors
Ajer-‐School Programs or Ac/vi/es
Outside School Hours
Very Important To My Health
A Great Deal of Access In My Community
Community resources: Very Important to Health vs. A Great Deal of Access
How much access do you have to this resource in your community today? How important is the following to your health?
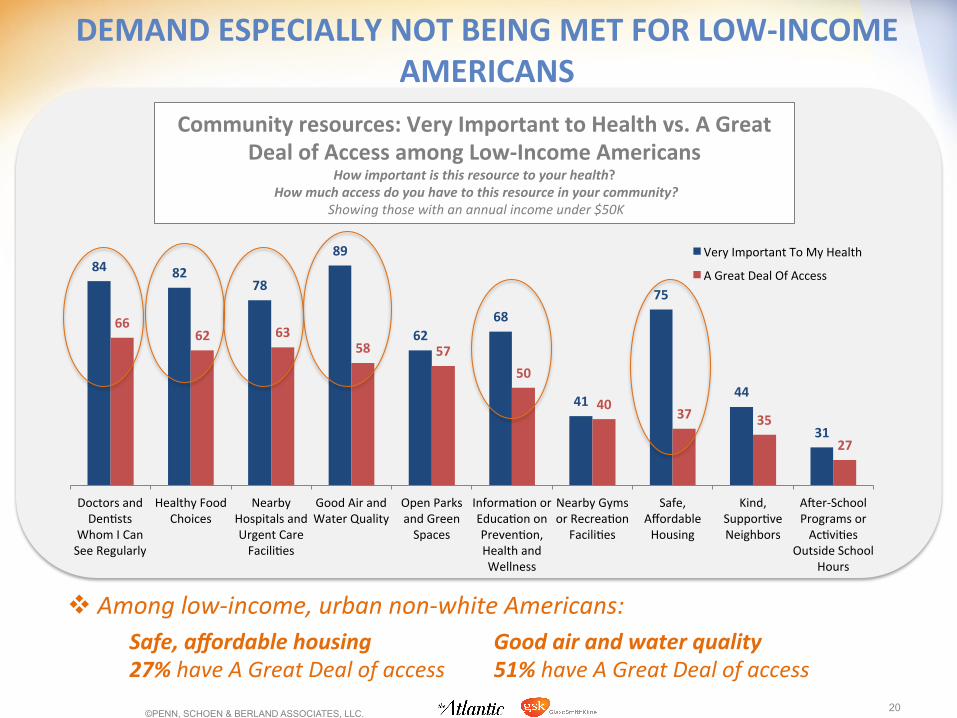
DEMAND ESPECIALLY NOT BEING MET FOR LOW-‐INCOME AMERICANS
©PENN, SCHOEN & BERLAND ASSOCIATES, LLC. 20
N=
84 82 78
89
62 68
41
75
44
31
66 62 63
58 57 50
40 37 35
27
Doctors and Den/sts
Whom I Can See Regularly
Healthy Food Choices
Nearby Hospitals and Urgent Care Facili/es
Good Air and Water Quality
Open Parks and Green Spaces
Informa/on or Educa/on on Preven/on, Health and Wellness
Nearby Gyms or Recrea/on Facili/es
Safe, Affordable Housing
Kind, Suppor/ve Neighbors
Ajer-‐School Programs or Ac/vi/es
Outside School Hours
Very Important To My Health
A Great Deal Of Access
Community resources: Very Important to Health vs. A Great Deal of Access among Low-‐Income Americans
How important is this resource to your health? How much access do you have to this resource in your community?
Showing those with an annual income under $50K
v Among low-‐income, urban non-‐white Americans: Safe, affordable housing 27% have A Great Deal of access
Good air and water quality 51% have A Great Deal of access
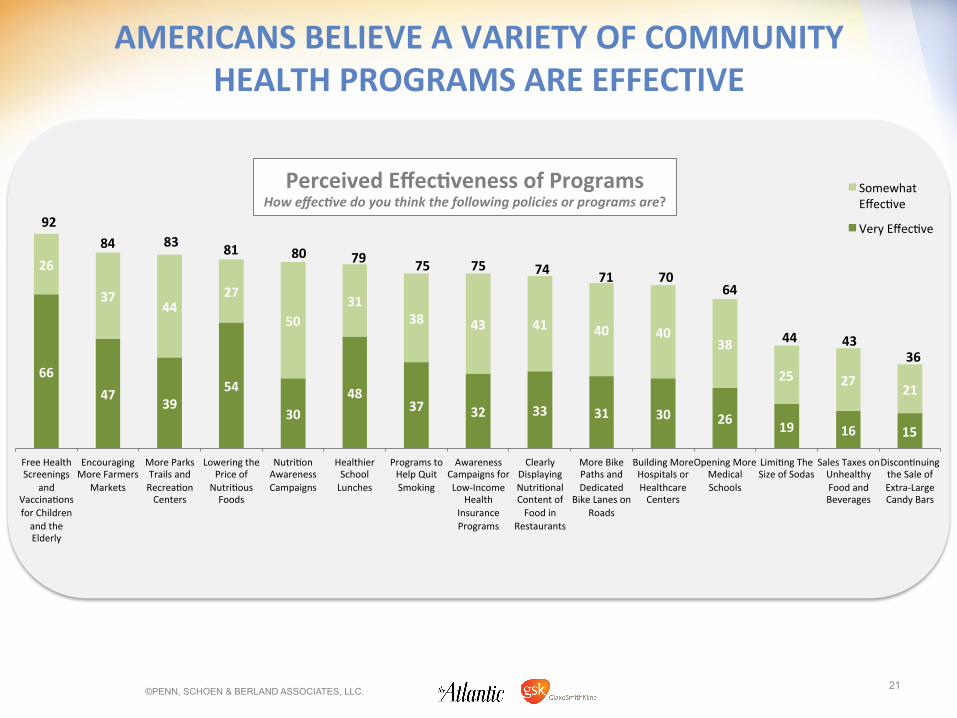
AMERICANS BELIEVE A VARIETY OF COMMUNITY HEALTH PROGRAMS ARE EFFECTIVE
©PENN, SCHOEN & BERLAND ASSOCIATES, LLC. 21
N=
66 47
39 54
30 48
37 32 33 31 30 26 19 16 15
26
37 44
27
50 31
38 43 41 40 40 38
25 27 21
Free Health Screenings
and Vaccina/ons for Children and the Elderly
Encouraging More Farmers
Markets
More Parks Trails and Recrea/on Centers
Lowering the Price of Nutri/ous Foods
Nutri/on Awareness Campaigns
Healthier School Lunches
Programs to Help Quit Smoking
Awareness Campaigns for Low-‐Income
Health Insurance Programs
Clearly Displaying Nutri/onal Content of Food in
Restaurants
More Bike Paths and Dedicated
Bike Lanes on Roads
Building More Hospitals or Healthcare Centers
Opening More Medical Schools
Limi/ng The Size of Sodas
Sales Taxes on Unhealthy Food and Beverages
Discon/nuing the Sale of Extra-‐Large Candy Bars
Somewhat Effec/ve
Very Effec/ve 84
Perceived EffecQveness of Programs How effecBve do you think the following policies or programs are?
92 83 81 80 79
71 74 75 75 70
64
44 43 36

NEW YORK • WASHINGTON • DENVER • SEATTLE • LOS ANGELES • SAN FRANCISCO • LONDON • HONG KONG • BEIJING
AMERICANS VIEW HEALTHCARE PROVIDERS AS PARTICULARLY IMPORTANT TO COMMUNITY HEALTH

DOCTORS AND HOSPITALS, ALONG WITH RESIDENTS, ARE SEEN AS MOST RESPONSIBLE FOR COMMUNITY HEALTH
©PENN, SCHOEN & BERLAND ASSOCIATES, LLC. 23
N=
47 46 40
36 32 30
27 25 21
Doctors and Hospitals
The Communi/es Residents
Local Health Department and Local Government
Health Care Insurance Companies
Employers And Businesses
The Federal Government
Community Non-‐Profit
Organiza/ons
Pharmaceu/cal Companies
Religions Ins/tu/ons
Responsibility For Community Health In your opinion, which of the following should be most responsible for ensuring good health in a community?

LOW-‐INCOME AMERICANS MOST LIKELY TO SAY DOCTORS AND HOSPITALS ARE RESPONSIBLE FOR COMMUNITY
HEALTH
©PENN, SCHOEN & BERLAND ASSOCIATES, LLC. 24
N=
42
50
36 32
27 32
24 21
14
55
47 46 43
39
32 33 31 27
48
36
51
37 43
35 30 28 28
48 50
36 35
25 31
25 24 20
46 44 49
43
35 30 31
25 22
Doctors and Hospitals
The Communi/es Residents
Local Health Department and Local Government
Healthcare Insurance Companies
The Federal Government
Employers And Businesses
Community Non-‐Profit
Organiza/ons
Pharmeceu/cal Companies
Religious Ins/tu/ons
High-‐Income
Low-‐income
African American
White
Hispanic
Responsibility for Community Health, By Subgroup In your opinion, which of the following should be most responsible for ensuring good health in a community?
v African Americans and Hispanics are most likely to say the local government is responsible for community health

49% OF AMERICANS VISIT THE DOCTOR FOR CHECK-‐UPS, EVEN WHEN WELL
©PENN, SCHOEN & BERLAND ASSOCIATES, LLC. 25
N=
49
26 20
3 2
I Visit The Doctor For Regular Check-‐Ups, Even When I Am
Well
I Only Visit The Doctor When I Am Sick Or Injured
I Visit The Doctor Regularly To Take Care Of A Chronic
Condi/on
I Only Visit The Doctor When I Am Given A Referral To See One
I Never Visit The Doctor
Frequency Of Doctors Visits Which of the following best describes your approach to visiBng the doctor?
v 45% of those under 30 only visit the doctor when sick or injured

AMERICANS WITH PRIMARY DOCTORS SAY DEVELOPING A RELATIONSHIP WITH THEIR DOCTOR IS EASY
©PENN, SCHOEN & BERLAND ASSOCIATES, LLC. 26
Developing RelaQonship With Primary Doctor How easy or hard is it to develop a relaQonship with your primary doctor so that your doctor knows your medical history well and you
are comfortable talking to your doctor? Showing Very Easy + Somewhat Easy and Very Hard + Somewhat Hard among those with primary
doctors
90
9 1
Easy
Hard Don’t Know

AND THAT THEIR DOCTORS ARE GOOD AT COORDINATING THEIR CARE
©PENN, SCHOEN & BERLAND ASSOCIATES, LLC. 27
CoordinaQng Care In your opinion, how good or bad is your doctor at coordinaQng your health care with other doctors and hospitals, including specialists that you might have to see? Showing Very Good
+Somewhat Good And Very Bad + Somewhat Bad among those with primary doctors
5
6
89
Don't Know
Bad
Good
v Doctor is Very Good at coordinaFng care: Low-‐income 71%
Middle-‐income 62%
Upper -‐income 54%

THEY THINK THE HEALTHCARE SYSTEM IS EASY TO NAVIGATE
©PENN, SCHOEN & BERLAND ASSOCIATES, LLC. 28
Ease Of The System In your opinion, is the health care system generally predy easy to
handle by yourself, or its it too complex?
74
23 3
Easy to Navigate
Too Complex
Don’t Know
v Easy to navigate, by age: Under 30 68%
30-‐60 73%
Over 60 78%

AND IF THEIR DOCTORS ARE HELPFUL IN NAVIGATING THE HEALTH CARE SYSTEM
©PENN, SCHOEN & BERLAND ASSOCIATES, LLC. 29
Doctor Helpfulness In your opinion, how good or bad is your doctor’s office at helping
you navigate the health care system? Showing Very Good + Somewhat Good and Very Bad + Somewhat Bad among those with
primary doctors
86
9 5 Don’t Know
Good
Bad
v Doctor’s office is Very Good at helping to navigate, by age:
Under 30 41%
30-‐60 50%
Over 60 64%

MAJORITY SAY INSURANCE AND PHARMACEUTICAL COMPANIES CARE ABOUT, UNDERSTAND THEIR COMMUNITY
©PENN, SCHOEN & BERLAND ASSOCIATES, LLC. 30
Household Income N=
56 42
2
Care
Don't Care
Don't Know
Caring How much do you think health care companies care about improving the health of people in your community? Showing “A great deal” + “Some” and
“Not very much” + “Not at all”
N= 57
40
3
Understand
Don't Understand
Don't Know
Understand
Don't Understand
Don't Know
Understanding How well do you think health care companies-‐like
insurance companies and pharmaceuBcal companies-‐understand what people in your community need to improve their health?
v Believe that health care companies care, by age: Under 30
51% 30-‐60 52%
Over 60 64%

NEW YORK • WASHINGTON • DENVER • SEATTLE • LOS ANGELES • SAN FRANCISCO • LONDON • HONG KONG • BEIJING
AMERICANS VALUE ONLINE RESOURCES AS IMPORTANT HEALTH CARE TOOLS
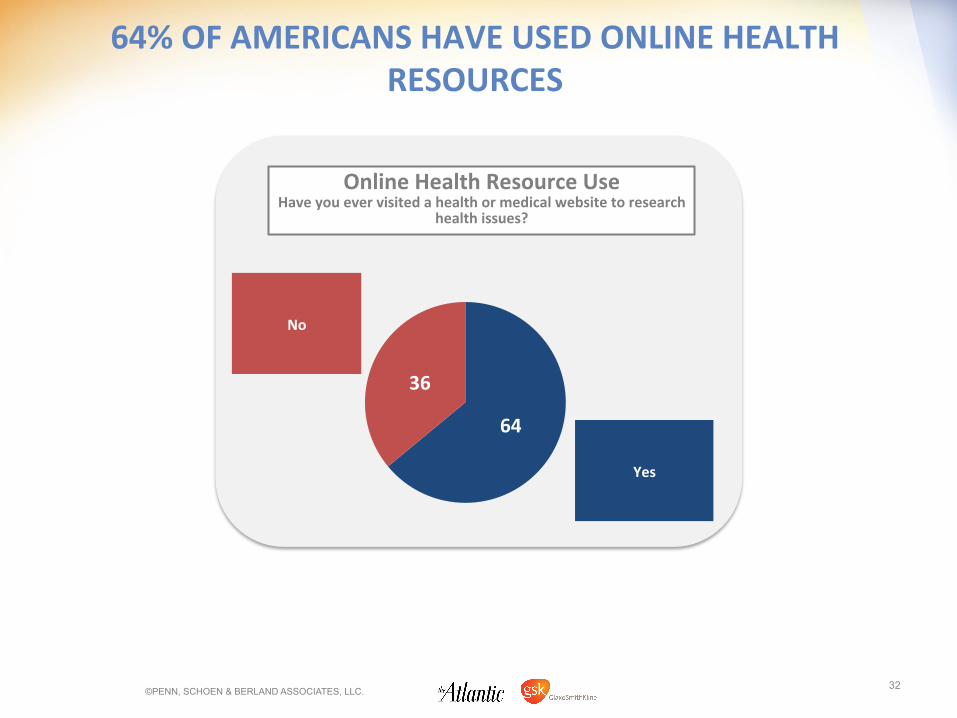
64% OF AMERICANS HAVE USED ONLINE HEALTH RESOURCES
©PENN, SCHOEN & BERLAND ASSOCIATES, LLC. 32
Online Health Resource Use Have you ever visited a health or medical website to research
health issues?
64
36
Yes
No
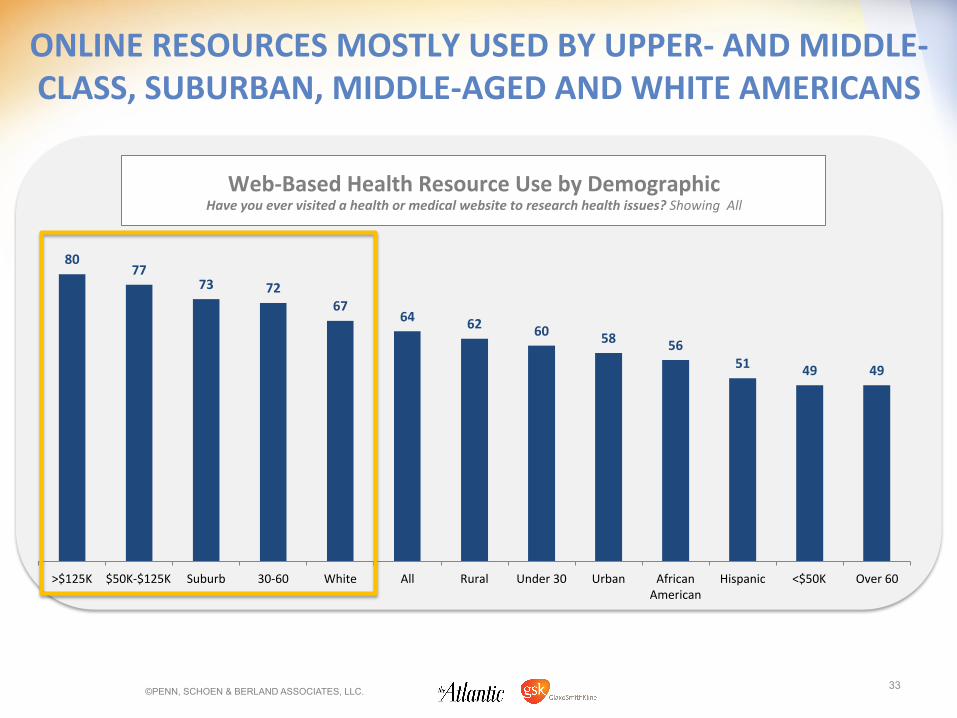
ONLINE RESOURCES MOSTLY USED BY UPPER-‐ AND MIDDLE-‐CLASS, SUBURBAN, MIDDLE-‐AGED AND WHITE AMERICANS
©PENN, SCHOEN & BERLAND ASSOCIATES, LLC. 33
N=
80 77
73 72 67
64 62 60 58 56 51 49 49
>$125K $50K-‐$125K Suburb 30-‐60 White All Rural Under 30 Urban African American
Hispanic <$50K Over 60
Web-‐Based Health Resource Use by Demographic Have you ever visited a health or medical website to research health issues? Showing All

94% OF THOSE WHO USE ONLINE HEALTH INFORMATION SEE IT AS IMPORTANT TO THEIR HEALTH
©PENN, SCHOEN & BERLAND ASSOCIATES, LLC. 34
Importance of Online Health InformaQon How important to your health do you consider the health or
medical informaQon you find online? Showing Very + Somewhat Important and Not Very + Not at All Important among those who
use medical websites
94
5 1 Don’t know
Important
Not Important
v Online informaFon Very Important to health: Low-‐income 46%
Middle-‐income 39%
Upper -‐income 33%

ONLINE RESOURCES PRIMARILY USED FOR INFORMATION, BUT MANY USE THEM FOR HEALTHCARE DECISIONS
©PENN, SCHOEN & BERLAND ASSOCIATES, LLC. 35
64
61
40
38
36
31
26
24
To Generally Educate Myself About Health Issues
To Learn About a Health Issue That Might be Affec/ng a Friend of Family Member
To Diagnose Myself
To Determine if I Need to See a Doctor
To Get Nutri/on Informa/on
To Get a Second Opinion
To Get Exercise Informa/on
To Find Reviews of Doctors
Main Uses of Online Health Resource What is most likely to make you consult these health or medical websites? Showing those who
have visited a medical/health website
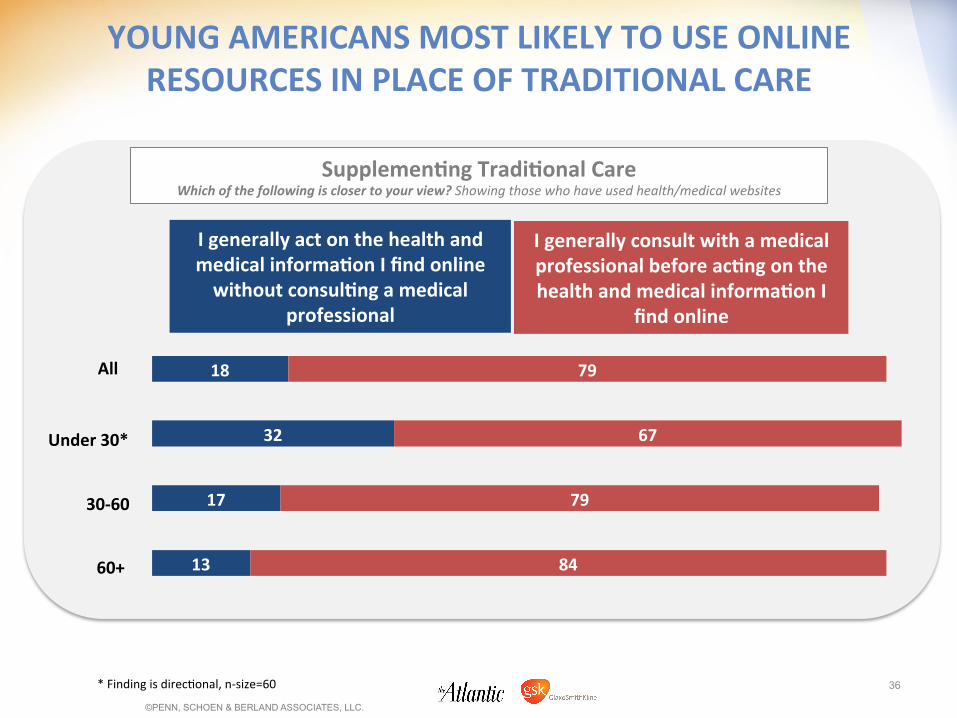
YOUNG AMERICANS MOST LIKELY TO USE ONLINE RESOURCES IN PLACE OF TRADITIONAL CARE
©PENN, SCHOEN & BERLAND ASSOCIATES, LLC.
36
SupplemenQng TradiQonal Care Which of the following is closer to your view? Showing those who have used health/medical websites
13
17
32
18
84
79
67
79
I generally act on the health and medical informaQon I find online without consulQng a medical
professional
I generally consult with a medical professional before acQng on the health and medical informaQon I
find online
Under 30*
30-‐60
60+
All
* Finding is direc/onal, n-‐size=60
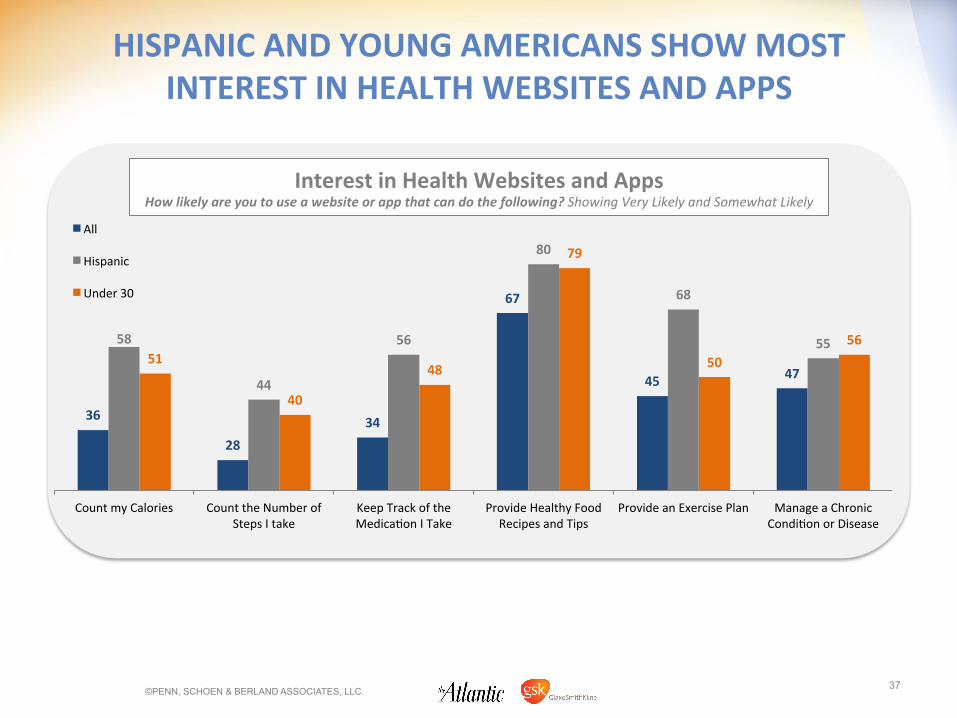
HISPANIC AND YOUNG AMERICANS SHOW MOST INTEREST IN HEALTH WEBSITES AND APPS
©PENN, SCHOEN & BERLAND ASSOCIATES, LLC. 37
N=
36
28 34
67
45 47
58
44
56
80
68
55 51
40
48
79
50 56
Count my Calories Count the Number of Steps I take
Keep Track of the Medica/on I Take
Provide Healthy Food Recipes and Tips
Provide an Exercise Plan Manage a Chronic Condi/on or Disease
All
Hispanic
Under 30
Interest in Health Websites and Apps How likely are you to use a website or app that can do the following? Showing Very Likely and Somewhat Likely

YOUNG AMERICANS ARE MOST WILLING TO HAVE PRIMARILY ONLINE INTERACTION WITH DOCTORS
©PENN, SCHOEN & BERLAND ASSOCIATES, LLC. 38
N=
34
27 26 23 22 21 20 20 19 18 18 17
12
Under 30 Hispanic >$125K 30-‐60 <$50K Urban All Suburb Rural $50K-‐$125K African American
White Over 60
Willingness to primarily communicate online with doctors Would you be comfortable if email or other electronic communicaBon was the primary way that you
communicate with your doctor? Showing Yes
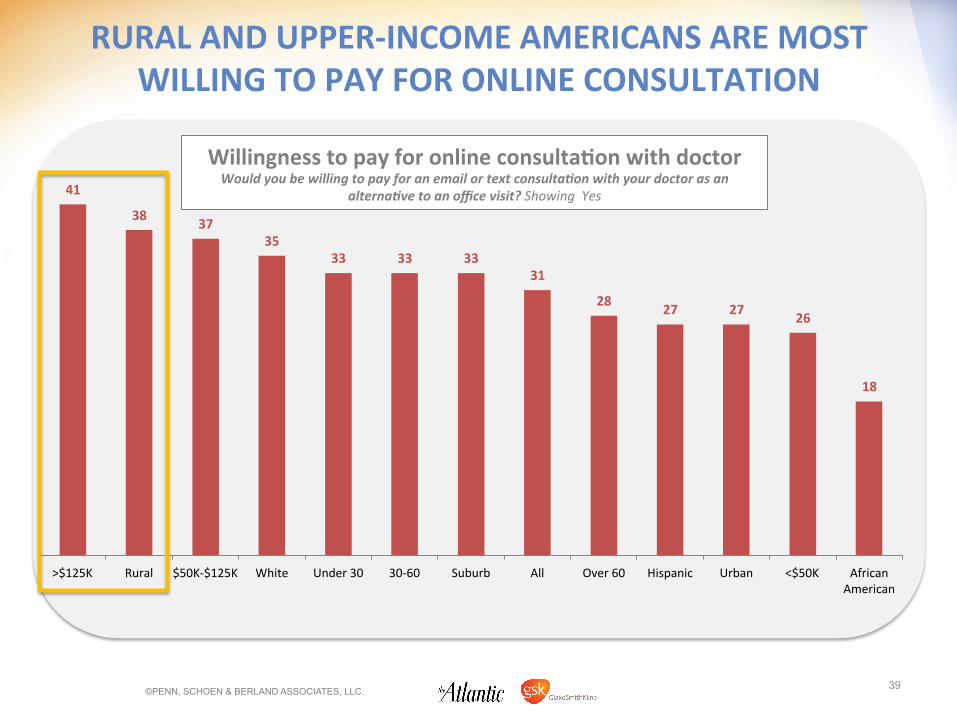
RURAL AND UPPER-‐INCOME AMERICANS ARE MOST WILLING TO PAY FOR ONLINE CONSULTATION
©PENN, SCHOEN & BERLAND ASSOCIATES, LLC. 39
N=
41
38 37 35
33 33 33 31
28 27 27 26
18
>$125K Rural $50K-‐$125K White Under 30 30-‐60 Suburb All Over 60 Hispanic Urban <$50K African American
Willingness to pay for online consultaQon with doctor Would you be willing to pay for an email or text consultaBon with your doctor as an
alternaBve to an office visit? Showing Yes
NEW YORK • WASHINGTON • DENVER • SEATTLE • LOS ANGELES • SAN FRANCISCO • LONDON • HONG KONG • BEIJING
RECAP
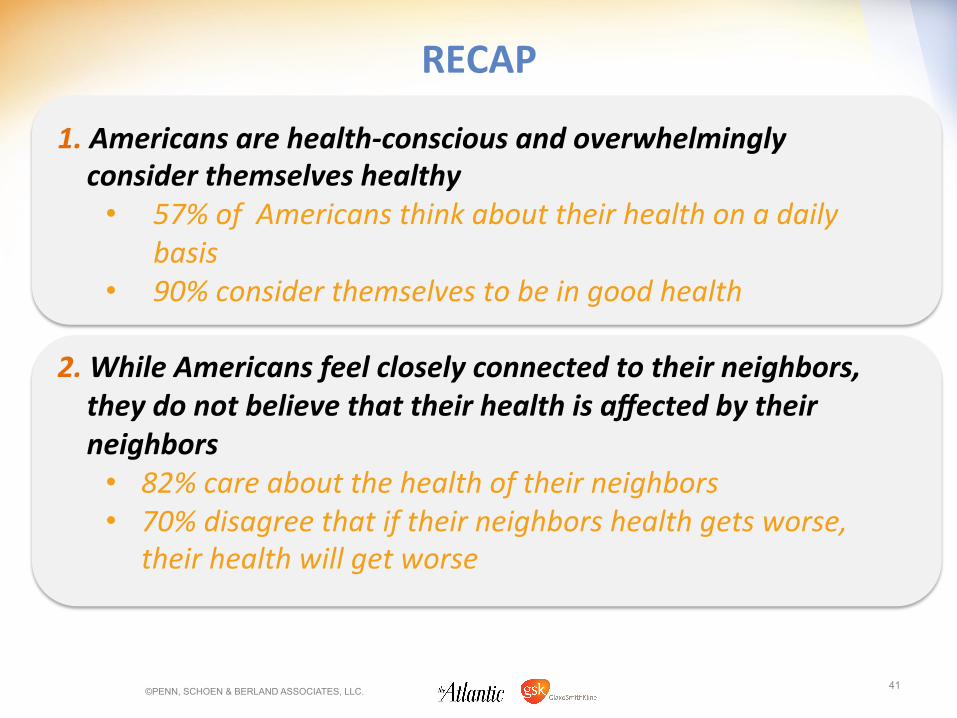
1. Americans are health-‐conscious and overwhelmingly consider themselves healthy
• 57% of Americans think about their health on a daily basis
• 90% consider themselves to be in good health
2. While Americans feel closely connected to their neighbors, they do not believe that their health is affected by their neighbors
• 82% care about the health of their neighbors • 70% disagree that if their neighbors health gets worse,
their health will get worse
RECAP
©PENN, SCHOEN & BERLAND ASSOCIATES, LLC. 41

3. Instead, Americans believe a variety of other community factors are important to their health
• 81% of Americans believe it is easy to live healthy in their communiFes
• Americans nearly universally think good air and water quality, doctors whom they can see regularly, healthy food choices and nearby hospitals are important to their health
• CommuniFes are not meeFng demand on environmental, healthy food and housing factors in parFcular – especially for low-‐income Americans
RECAP, CONTINUED
©PENN, SCHOEN & BERLAND ASSOCIATES, LLC. 42

4. Americans view healthcare providers as parBcularly important to community health
• Doctors and hospitals viewed as most responsible for communiFes health, along with individuals
• 90% of Americans with primary care doctors say developing a relaFonship with their doctor is easy
5. Americans value online resources as important healthcare tools
• 64% of Americans have used online health resources • 94% of Americans who have used online resources say
they are important to their health • Online resources mostly used for informaFon, though
40% use it to diagnose themselves
RECAP, CONTINUED
©PENN, SCHOEN & BERLAND ASSOCIATES, LLC. 43

NEW YORK • WASHINGTON • DENVER • SEATTLE • LOS ANGELES • SAN FRANCISCO • LONDON • HONG KONG • BEIJING
APPENDIX
NEW YORK • WASHINGTON • DENVER • SEATTLE • LOS ANGELES • SAN FRANCISCO • LONDON • HONG KONG • BEIJING
THE COMMUNITY

LIVING LOCATION
Do you live in a city, suburb just outside a city, or a less developed or rural area, not near a city?
All Male Female Under 30 30-‐60 Over
60 <$50k >$125k White Black Hispanic
City 44 42 46 44 43 47 51 32 38 62 61
Suburb 30 33 29 33 31 28 23 49 32 21 22
Rural 25 25 25 23 26 25 26 19 30 16 17
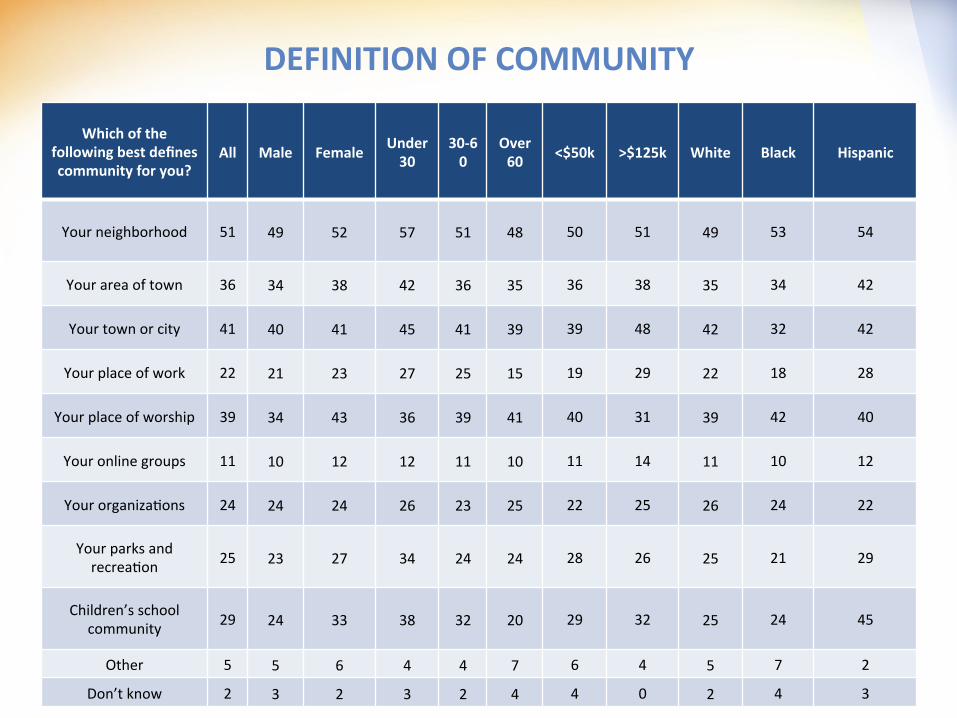
DEFINITION OF COMMUNITY
Which of the following best defines community for you?
All Male Female Under 30
30-‐60
Over 60 <$50k >$125k White Black Hispanic
Your neighborhood 51 49 52 57 51 48 50 51 49 53 54
Your area of town 36 34 38 42 36 35 36 38 35 34 42
Your town or city 41 40 41 45 41 39 39 48 42 32 42
Your place of work 22 21 23 27 25 15 19 29 22 18 28
Your place of worship 39 34 43 36 39 41 40 31 39 42 40
Your online groups 11 10 12 12 11 10 11 14 11 10 12
Your organiza/ons 24 24 24 26 23 25 22 25 26 24 22
Your parks and recrea/on 25 23 27 34 24 24 28 26 25 21 29
Children’s school community 29 24 33 38 32 20 29 32 25 24 45
Other 5 5 6 4 4 7 6 4 5 7 2
Don’t know 2 3 2 3 2 4 4 0 2 4 3
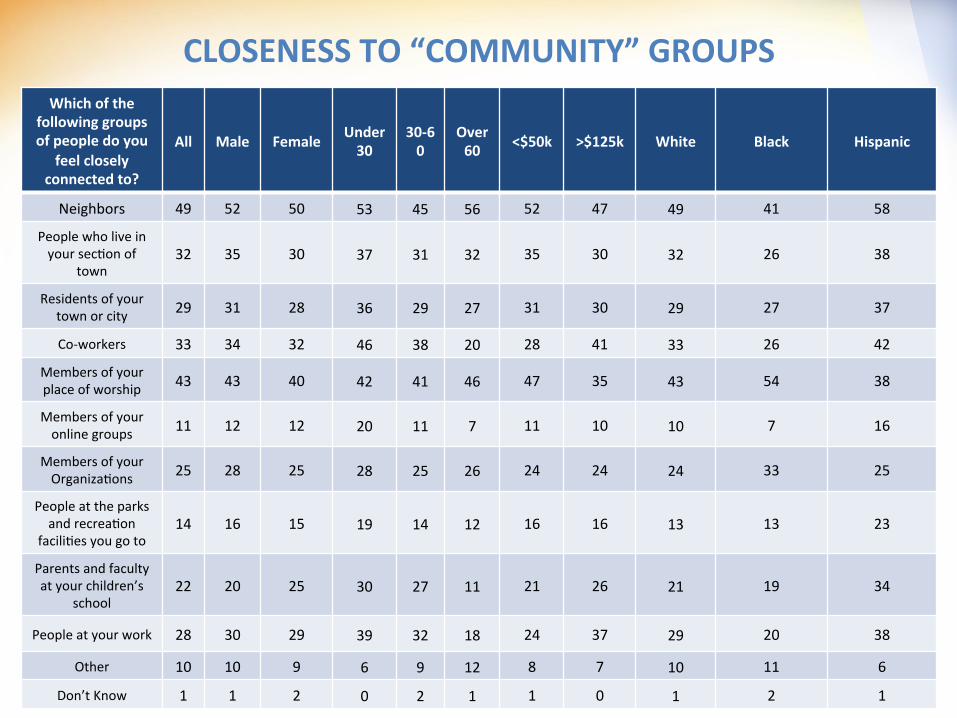
CLOSENESS TO “COMMUNITY” GROUPS Which of the
following groups of people do you
feel closely connected to?
All Male Female Under 30
30-‐60
Over 60 <$50k >$125k White Black Hispanic
Neighbors 49 52 50 53 45 56 52 47 49 41 58
People who live in your sec/on of
town 32 35 30 37 31 32 35 30 32 26 38
Residents of your town or city 29 31 28 36 29 27 31 30 29 27 37
Co-‐workers 33 34 32 46 38 20 28 41 33 26 42
Members of your place of worship 43 43 40 42 41 46 47 35 43 54 38
Members of your online groups 11 12 12 20 11 7 11 10 10 7 16
Members of your Organiza/ons 25 28 25 28 25 26 24 24 24 33 25
People at the parks and recrea/on
facili/es you go to 14 16 15 19 14 12 16 16 13 13 23
Parents and faculty at your children’s
school 22 20 25 30 27 11 21 26 21 19 34
People at your work 28 30 29 39 32 18 24 37 29 20 38
Other 10 10 9 6 9 12 8 7 10 11 6
Don’t Know 1 1 2 0 2 1 1 0 1 2 1
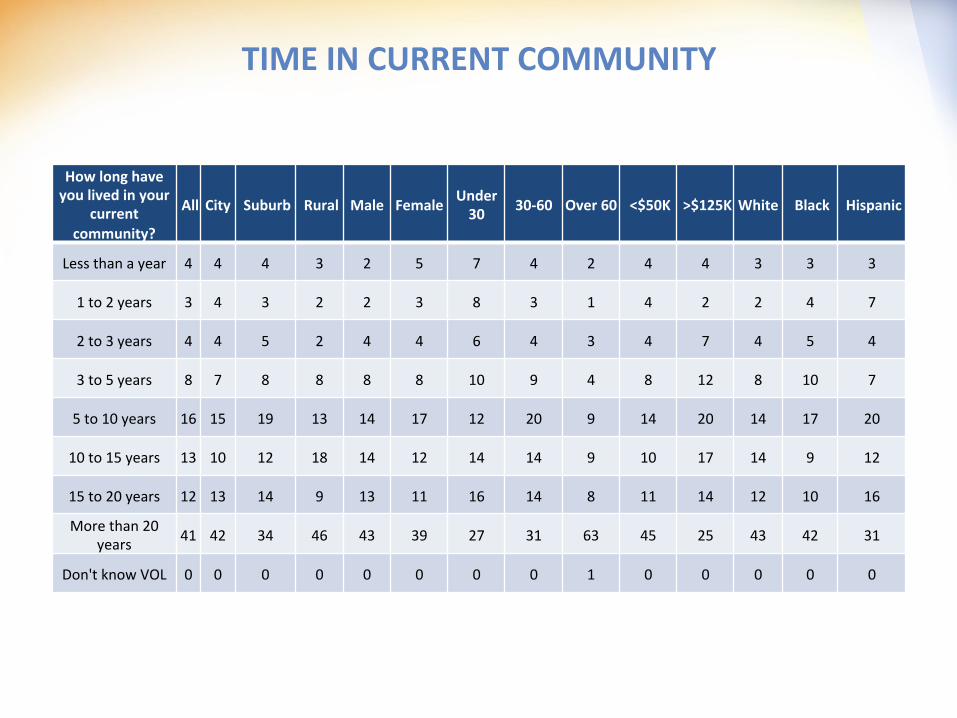
TIME IN CURRENT COMMUNITY
How long have you lived in your
current community?
All City Suburb Rural Male Female Under 30 30-‐60 Over 60 <$50K >$125K White Black Hispanic
Less than a year 4 4 4 3 2 5 7 4 2 4 4 3 3 3
1 to 2 years 3 4 3 2 2 3 8 3 1 4 2 2 4 7
2 to 3 years 4 4 5 2 4 4 6 4 3 4 7 4 5 4
3 to 5 years 8 7 8 8 8 8 10 9 4 8 12 8 10 7
5 to 10 years 16 15 19 13 14 17 12 20 9 14 20 14 17 20
10 to 15 years 13 10 12 18 14 12 14 14 9 10 17 14 9 12
15 to 20 years 12 13 14 9 13 11 16 14 8 11 14 12 10 16
More than 20 years 41 42 34 46 43 39 27 31 63 45 25 43 42 31
Don't know VOL 0 0 0 0 0 0 0 0 1 0 0 0 0 0

REASONS FOR LIVING IN A COMMUNITY
Why do you choose to live
there? All Male Female Under 30 30-‐60 Over 60 <$50K >$125K White Black Hispanic
Have always lived here 13 13 14 21 10 17 17 7 12 20 15
Cost of living 5 5 5 5 5 5 6 1 4 7 5
Access to public
transporta/on 1 1 1 0 1 1 1 1 0 1 1
Close to family and friends 13 12 13 19 13 10 15 8 12 11 17
Close to work 9 10 7 5 10 7 5 10 10 5 7
School system 6 7 6 4 9 2 4 15 7 2 8
Parks and recrea/on system
1 1 1 0 1 1 1 3 1 1 0
Affordable housing 6 5 6 6 5 6 8 4 5 11 6
Good climate for business 1 0 1 1 1 1 1 1 1 1 0
Lower taxes 1 1 0 0 1 1 0 2 1 0 1
Clean 2 2 2 1 3 1 2 1 2 2 3
Healthy community 6 7 5 4 7 5 5 8 6 5 5
Other 36 34 38 32 33 43 34 40 38 33 32
Don't know 1 1 1 2 2 0 1 0 1 1 2

CONNECTION WITH NEIGHBORS
How closely connected do you feel to your neighbors?
All City Suburb Rural Male Female Under 30 30-‐60 Over 60 <$50K >$125K White Black Hispanic
Very closely connected 27 25 21 37 26 28 21 24 33 30 18 26 26 27
Somewhat closely
connected 46 47 52 38 46 47 45 47 45 41 49 46 47 49
Not very connected 18 18 21 15 19 17 28 19 13 18 21 19 15 17
Not at all connected 9 10 7 9 9 9 5 10 8 10 12 9 11 7
Don't know 0 0 0 1 0 0 1 0 0 0 1 0 0 1
NEW YORK • WASHINGTON • DENVER • SEATTLE • LOS ANGELES • SAN FRANCISCO • LONDON • HONG KONG • BEIJING
PERSONAL HEALTH

PRIORITIES
Which of the following do you
consider to be your 1 or 2 biggest prioriQes?
All City Suburb Rural Male Female Under 30 30-‐60 Over 60 <$50K >$125K White Black Hispanic
Your job 23 21 26 24 29 19 34 30 7 19 35 24 18 24
Taking care of your family 70 67 72 74 68 72 79 77 54 63 77 70 65 84
Your health 50 54 48 46 46 54 37 45 64 53 43 49 57 48
Community service 7 9 5 7 6 8 5 6 11 9 5 8 7 3
Your social life 6 7 6 4 6 6 14 3 8 9 5 6 3 8
Your hobbies and leisure /me 10 9 10 13 12 9 8 9 14 13 8 13 6 5
Don't know 0 0 0 1 1 0 1 0 1 0 0 0 1 0

OPINION OF PERSONAL HEALTH
Generally speaking, how would you
rate your own personal health?
All City Suburb Rural Male Female Under 30 30-‐60 Over 60 <$50K >$125K White Black Hispanic
Very good 46 44 45 52 45 47 54 48 40 42 60 45 46 48
Somewhat good 44 46 48 37 47 42 43 42 50 44 38 44 43 48
Somewhat bad 7 7 6 10 6 8 3 8 8 10 2 9 7 4
Very bad 2 2 1 1 2 2 0 2 2 3 0 2 2 0
Don't know 0 0 0 0 0 1 0 0 0 0 0 0 2 0

FREQUENCY OF THOUGHTS ABOUT HEALTH
Generally speaking, how
oven do you think about your own
health?
All City Suburb Rural Male Female Under 30 30-‐60 Over 60 <$50K >$125K White Black Hispanic
Constantly/Almost always 20 21 20 17 18 22 21 22 17 21 17 15 39 25
Mul/ple /mes per day 16 15 21 12 19 13 17 17 14 17 18 18 15 11
Once per day 21 21 18 25 20 22 14 21 25 17 23 25 15 12
A few /mes a week/every few
days 15 15 17 12 17 13 16 15 13 15 17 14 11 20
Once per week 8 7 8 10 7 9 9 9 7 7 9 8 7 7
Less than once per week 18 19 14 22 17 18 23 15 22 19 15 18 11 22
Don't know 2 1 3 3 1 3 0 2 4 3 1 2 2 2
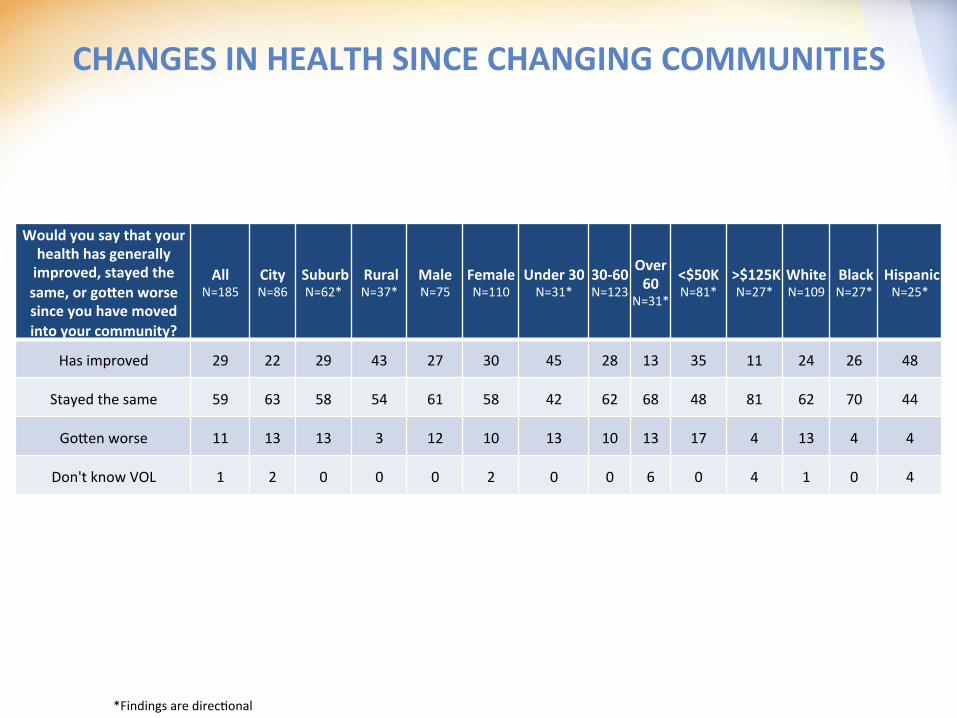
CHANGES IN HEALTH SINCE CHANGING COMMUNITIES
Would you say that your health has generally improved, stayed the same, or goden worse since you have moved into your community?
All N=185
City N=86
Suburb N=62*
Rural N=37*
Male N=75
Female N=110
Under 30 N=31*
30-‐60 N=123
Over 60
N=31*
<$50K N=81*
>$125K N=27*
White N=109
Black N=27*
Hispanic N=25*
Has improved 29 22 29 43 27 30 45 28 13 35 11 24 26 48
Stayed the same 59 63 58 54 61 58 42 62 68 48 81 62 70 44
Go]en worse 11 13 13 3 12 10 13 10 13 17 4 13 4 4
Don't know VOL 1 2 0 0 0 2 0 0 6 0 4 1 0 4
*Findings are direc/onal

CHANGES IN HEALTH OVER LAST 5-‐10 YEARS
Would you say that your health has
generally improved, stayed the same, or goden worse over the past 5 to 10 years?
All N=817
City N=355
Suburb N=244
Rural N=214
Male N=381
Female N=436
Under 30
N=69*
30-‐60 N=472
Over 60
N=276
<$50K N=327
>$125K N=84
White N=526
Black N=96
Hispanic N=95
Has improved 17 19 16 15 16 18 26 18 13 16 19 15 21 27
Stayed the same 52 48 51 58 55 49 52 54 47 50 56 53 51 47
Go]en worse 30 32 32 26 28 32 20 26 38 33 24 31 27 25
Don't know 1 1 1 0 1 1 1 1 1 1 1 1 1 0
*Findings are direc/onal
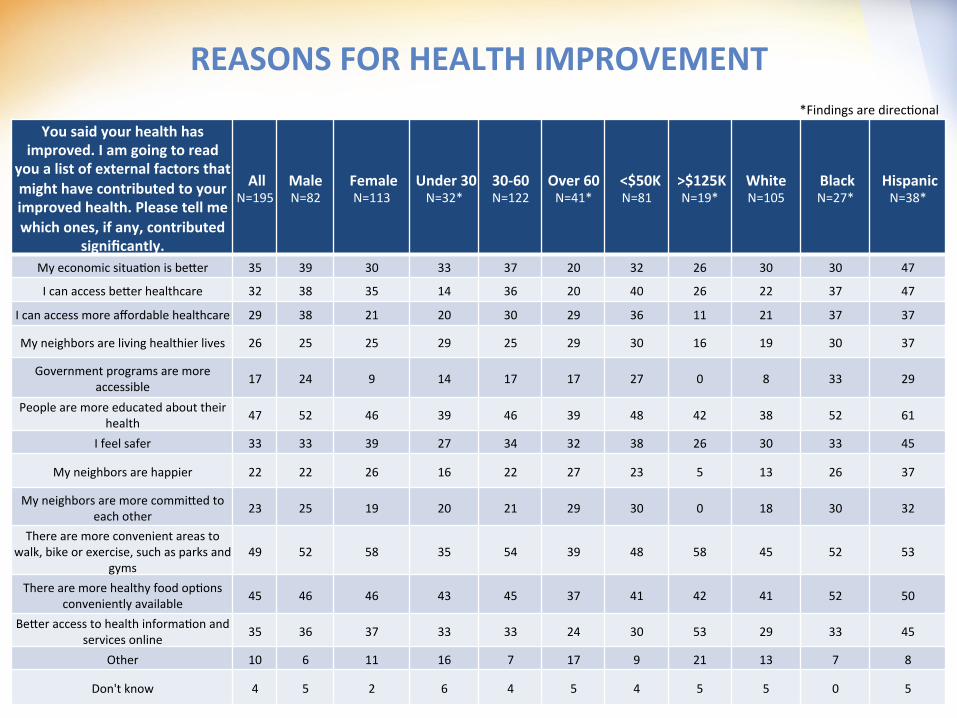
REASONS FOR HEALTH IMPROVEMENT
You said your health has improved. I am going to read
you a list of external factors that might have contributed to your improved health. Please tell me which ones, if any, contributed
significantly.
All N=195
Male N=82
Female N=113
Under 30 N=32*
30-‐60 N=122
Over 60 N=41*
<$50K N=81
>$125K N=19*
White N=105
Black N=27*
Hispanic N=38*
My economic situa/on is be]er 35 39 30 33 37 20 32 26 30 30 47
I can access be]er healthcare 32 38 35 14 36 20 40 26 22 37 47
I can access more affordable healthcare 29 38 21 20 30 29 36 11 21 37 37
My neighbors are living healthier lives 26 25 25 29 25 29 30 16 19 30 37
Government programs are more accessible 17 24 9 14 17 17 27 0 8 33 29
People are more educated about their health 47 52 46 39 46 39 48 42 38 52 61
I feel safer 33 33 39 27 34 32 38 26 30 33 45
My neighbors are happier 22 22 26 16 22 27 23 5 13 26 37
My neighbors are more commi]ed to each other 23 25 19 20 21 29 30 0 18 30 32
There are more convenient areas to walk, bike or exercise, such as parks and
gyms 49 52 58 35 54 39 48 58 45 52 53
There are more healthy food op/ons conveniently available 45 46 46 43 45 37 41 42 41 52 50
Be]er access to health informa/on and services online 35 36 37 33 33 24 30 53 29 33 45
Other 10 6 11 16 7 17 9 21 13 7 8
Don't know 4 5 2 6 4 5 4 5 5 0 5
*Findings are direc/onal

REASONS FOR DEGRADING HEALTH You said your health has goden worse. I am going to read you a list of external factors that might have contributed to your health geTng worse. Please tell me which ones, if
any, contributed significantly.
All N=265
Male N=115
Female N=150
Under 30
N=18*
30-‐60 N=137
Over 60 N=110
<$50K N=123
>$125K N=21*
White N=179
Black N=27*
Hispanic N=25*
My economic situa/on is worse 27 25 29 28 31 23 40 19 26 26 44
I cannot access be]er healthcare 15 12 17 17 18 11 21 14 16 15 16
I cannot access affordable healthcare 14 14 15 0 22 7 24 5 14 7 28
My neighbors are living less healthy lives 5 2 7 6 4 5 7 0 3 11 0
Government programs are less accessible 15 10 18 6 17 14 19 5 13 15 20
People are less educated about their health 15 14 16 39 17 9 16 5 13 26 28
I feel less safe 14 10 16 6 13 15 18 10 13 19 12
My neighbors are less happy 6 4 7 6 7 5 6 0 4 4 8
People are less commi]ed to each other 15 16 15 11 16 15 16 10 16 15 16
There are fewer convenient areas to walk, bike or exercise, such as parks and gyms 14 10 17 22 12 15 12 10 12 15 12
There are fewer healthy food op/ons conveniently available 20 20 19 33 22 15 20 38 18 22 20
Worse access to health informa/on and services online 4 5 3 6 3 5 4 5 3 11 0
Other 34 34 34 11 32 40 25 48 37 30 16
Don't know VOL 12 13 11 6 11 15 13 5 12 30 4
*Findings are direc/onal
NEW YORK • WASHINGTON • DENVER • SEATTLE • LOS ANGELES • SAN FRANCISCO • LONDON • HONG KONG • BEIJING
HEALTH IN THE COMMUNITY

DIFFICULTY OF HEALTHY LIFESTYLE
How easy or difficult do you think it is to live a
healthy lifestyle specifically in your
community?
All City Suburb Rural Male Female Under 30 30-‐60 Over 60 <$50K >$125K White Black Hispanic
Very easy 41 40 43 40 38 44 30 39 48 38 47 43 33 38
Somewhat easy 40 40 40 41 43 38 47 39 39 42 41 40 44 41
Somewhat difficult 14 15 12 14 14 13 20 15 9 15 8 12 17 16
Very difficult 5 5 4 4 5 5 3 6 2 5 5 4 5 4
Don't know VOL 1 0 1 2 0 1 0 1 2 1 0 1 1 1
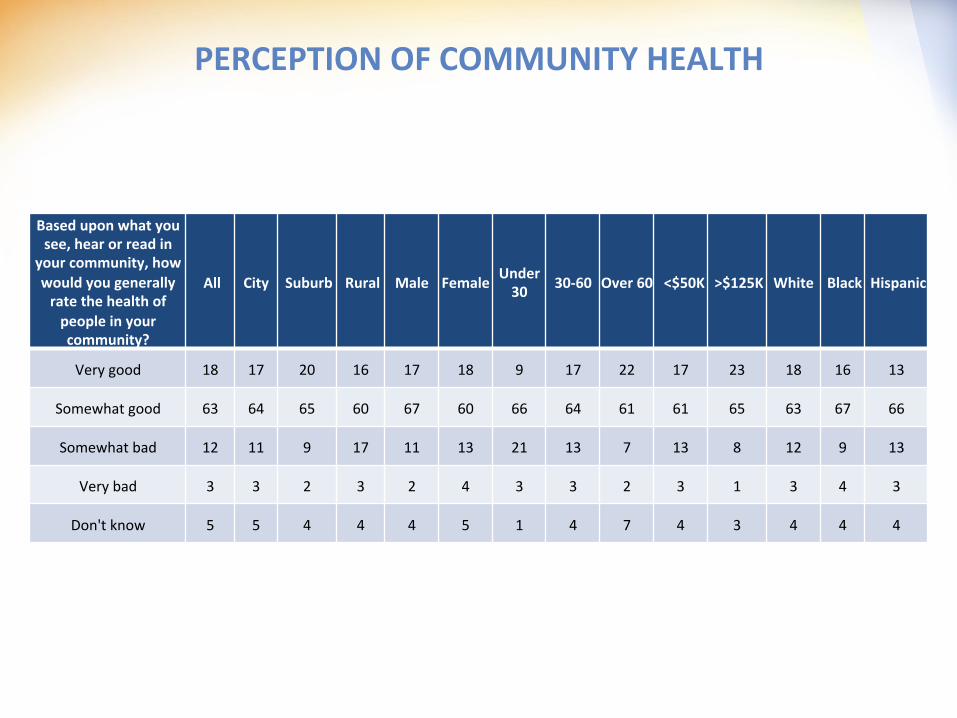
PERCEPTION OF COMMUNITY HEALTH
Based upon what you see, hear or read in
your community, how would you generally rate the health of people in your community?
All City Suburb Rural Male Female Under 30 30-‐60 Over 60 <$50K >$125K White Black Hispanic
Very good 18 17 20 16 17 18 9 17 22 17 23 18 16 13
Somewhat good 63 64 65 60 67 60 66 64 61 61 65 63 67 66
Somewhat bad 12 11 9 17 11 13 21 13 7 13 8 12 9 13
Very bad 3 3 2 3 2 4 3 3 2 3 1 3 4 3
Don't know 5 5 4 4 4 5 1 4 7 4 3 4 4 4
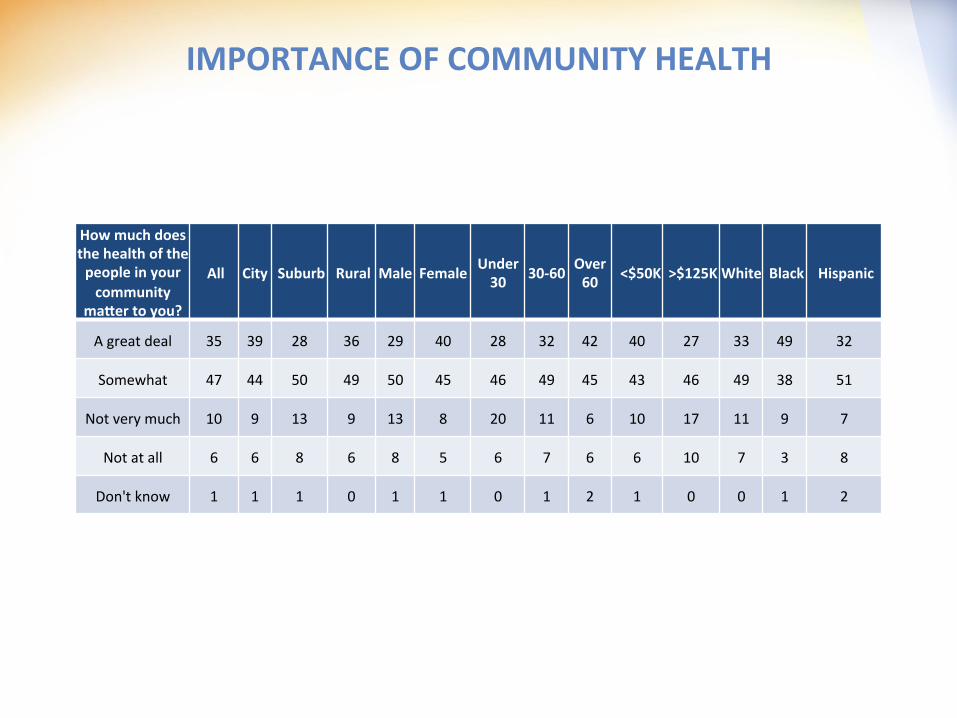
IMPORTANCE OF COMMUNITY HEALTH
How much does the health of the people in your community
mader to you?
All City Suburb Rural Male Female Under 30 30-‐60 Over 60 <$50K >$125K White Black Hispanic
A great deal 35 39 28 36 29 40 28 32 42 40 27 33 49 32
Somewhat 47 44 50 49 50 45 46 49 45 43 46 49 38 51
Not very much 10 9 13 9 13 8 20 11 6 10 17 11 9 7
Not at all 6 6 8 6 8 5 6 7 6 6 10 7 3 8
Don't know 1 1 1 0 1 1 0 1 2 1 0 0 1 2

CORRELATION BETWEEN PERSONAL HEALTH AND COMMUNITY HEALTH
How strongly do you agree or disagree with the following statement: If my neighbors are less healthy, I am likely to be
less healthy.
All City Suburb Rural Male Female Under 30 30-‐60 Over 60 <$50K >$125K White Black Hispanic
Strongly agree 8 10 5 7 8 7 7 8 7 10 6 5 13 13
Somewhat agree 20 21 18 21 21 20 19 20 20 17 23 21 9 23
Somewhat disagree 25 24 27 25 27 23 29 22 29 26 25 28 24 16
Strongly disagree 45 42 47 46 42 47 44 48 39 46 44 44 51 47
Don't know VOL 2 2 3 1 1 3 1 2 4 2 2 3 2 1
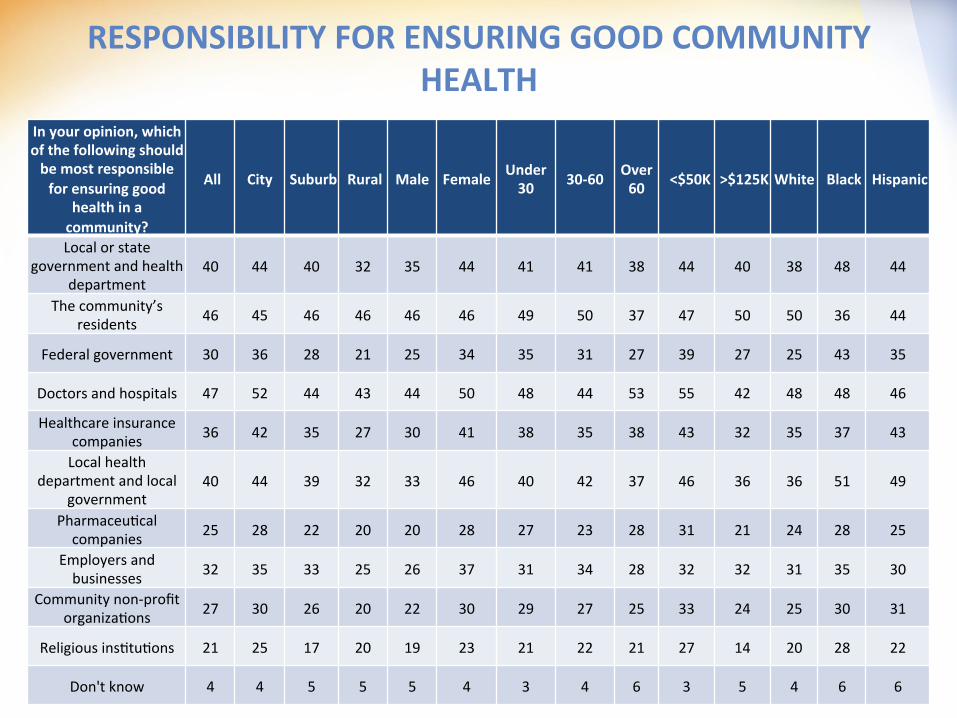
RESPONSIBILITY FOR ENSURING GOOD COMMUNITY HEALTH
In your opinion, which of the following should be most responsible for ensuring good
health in a community?
All City Suburb Rural Male Female Under 30 30-‐60 Over
60 <$50K >$125K White Black Hispanic
Local or state government and health
department 40 44 40 32 35 44 41 41 38 44 40 38 48 44
The community’s residents 46 45 46 46 46 46 49 50 37 47 50 50 36 44
Federal government 30 36 28 21 25 34 35 31 27 39 27 25 43 35
Doctors and hospitals 47 52 44 43 44 50 48 44 53 55 42 48 48 46
Healthcare insurance companies 36 42 35 27 30 41 38 35 38 43 32 35 37 43
Local health department and local
government 40 44 39 32 33 46 40 42 37 46 36 36 51 49
Pharmaceu/cal companies 25 28 22 20 20 28 27 23 28 31 21 24 28 25
Employers and businesses 32 35 33 25 26 37 31 34 28 32 32 31 35 30
Community non-‐profit organiza/ons 27 30 26 20 22 30 29 27 25 33 24 25 30 31
Religious ins/tu/ons 21 25 17 20 19 23 21 22 21 27 14 20 28 22
Don't know 4 4 5 5 5 4 3 4 6 3 5 4 6 6

NEW YORK • WASHINGTON • DENVER • SEATTLE • LOS ANGELES • SAN FRANCISCO • LONDON • HONG KONG • BEIJING
COMMUNITY HEALTH RESOURCES AND PROGRAMS: IMPORTANCE, ACCESS, AND EFFICACY

IMPORTANCE OF COMMUNITY HEALTH RESOURCES How important is the following to your health?
Showing “Very important” + “Important”/“Not very important” + “Not at all
important”
All City Suburb Rural Male Female Under 30 30-‐60 Over 60 <$50K >$125K White Black Hispanic
Healthy Food Choices 98/2 98/2 98/2 97/3 96/4 99/1 100/0 98/3 96/3 97/3 98/2 97/2 100/0 99/2
Open Parks and Green Spaces 88/11 89/11 89/11 87/12 87/12 89/10 88/11 92/8 81/18 88/11 91/9 86/13 94/6 94/5
Nearby Gyms and Recrea/ons Facili/es
74/26 77/23 79/20 63/35 74/25 73/26 90/10 77/22 62/36 74/25 80/20 69/30 79/18 88/13
Nearby hospitals and urgent care
facili/es 96/4 96/4 96/4 92/8 94/5 96/4 93/7 95/5 97/3 95/5 94/6 95/5 98/3 94/6
Doctors and den/sts whom I can see regularly
97/2 97/4 100/0 96/3 96/4 99/2 97/3 98/2 97/3 97/3 98/2 97/2 100/0 94/5
Good air and water quality 99/2 98/2 99/1 99/1 97/2 99/0 99/1 99/2 97/2 99/2 98/2 99/2 98/2 99/1
Safe, affordable housing 88/11 91/7 87/12 85/13 84/14 93/6 92/8 89/10 85/12 91/8 82/17 86/12 93/6 92/8
Ajer-‐school programs or
ac/vi/es outside school hours
52/40 54/35 48/43 51/43 51/41 52/38 76/21 59/35 29/56 50/42 47/48 46/45 61/31 74/22
Kind, suppor/ve neighbors 77/22 82/17 70/30 78/22 71/28 81/18 78/22 75/25 81/18 81/17 61/38 75/24 82/19 83/16
Informa/on or educa/on on
preven/on, health and wellness
92/8 94/6 91/9 89/11 89/11 94/7 90/10 92/9 93/7 92/7 87/12 90/10 99/1 97/3
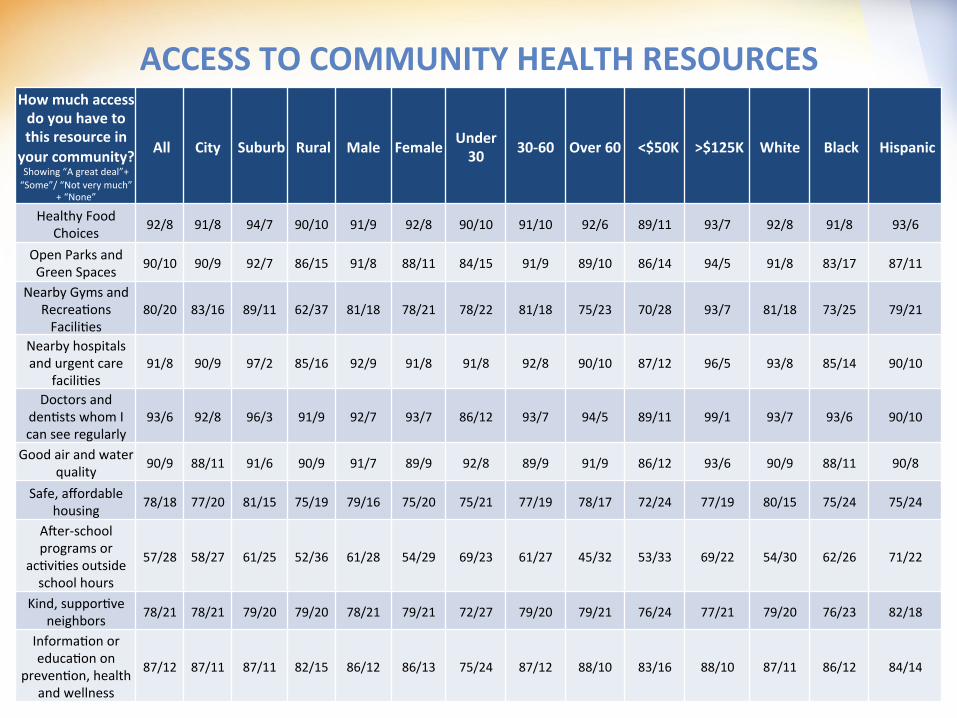
ACCESS TO COMMUNITY HEALTH RESOURCES How much access do you have to this resource in your community? Showing “A great deal”+ “Some”/ “Not very much”
+ “None”
All City Suburb Rural Male Female Under 30 30-‐60 Over 60 <$50K >$125K White Black Hispanic
Healthy Food Choices 92/8 91/8 94/7 90/10 91/9 92/8 90/10 91/10 92/6 89/11 93/7 92/8 91/8 93/6
Open Parks and Green Spaces 90/10 90/9 92/7 86/15 91/8 88/11 84/15 91/9 89/10 86/14 94/5 91/8 83/17 87/11
Nearby Gyms and Recrea/ons Facili/es
80/20 83/16 89/11 62/37 81/18 78/21 78/22 81/18 75/23 70/28 93/7 81/18 73/25 79/21
Nearby hospitals and urgent care
facili/es 91/8 90/9 97/2 85/16 92/9 91/8 91/8 92/8 90/10 87/12 96/5 93/8 85/14 90/10
Doctors and den/sts whom I can see regularly
93/6 92/8 96/3 91/9 92/7 93/7 86/12 93/7 94/5 89/11 99/1 93/7 93/6 90/10
Good air and water quality 90/9 88/11 91/6 90/9 91/7 89/9 92/8 89/9 91/9 86/12 93/6 90/9 88/11 90/8
Safe, affordable housing 78/18 77/20 81/15 75/19 79/16 75/20 75/21 77/19 78/17 72/24 77/19 80/15 75/24 75/24
Ajer-‐school programs or
ac/vi/es outside school hours
57/28 58/27 61/25 52/36 61/28 54/29 69/23 61/27 45/32 53/33 69/22 54/30 62/26 71/22
Kind, suppor/ve neighbors 78/21 78/21 79/20 79/20 78/21 79/21 72/27 79/20 79/21 76/24 77/21 79/20 76/23 82/18
Informa/on or educa/on on
preven/on, health and wellness
87/12 87/11 87/11 82/15 86/12 86/13 75/24 87/12 88/10 83/16 88/10 87/11 86/12 84/14

PERCEIVED EFFECTIVENESS OF HEALTH PROGRAMS How effecQve do you think the following policy or program is at improving health? Showing “Very effecFve” + “Somewhat effecFve”/
“Not very effecFve” + “Not at all effecFve”
All City Suburb Rural Male Female Under 30 30-‐60 Over 60 <$50K >$125K White Black Hispanic
Limi/ng the size of sodas 44/54 47/50 42/56 40/58 39/59 47/50 54/46 43/55 43/54 50/47 39/60 38/59 50/46 59/40 Discon/nuing the sake if extra-‐large candy bars 36/60 38/58 36/61 35/62 34/65 38/56 40/58 36/61 35/58 41/54 33/67 31/65 44/47 45/51
Sales taxes on unhealthy food and beverages 43/53 46/52 46/51 38/59 42/56 46/52 56/42 43/55 42/53 47/50 42/56 40/58 48/51 62/34 Clearly displaying
nutri/onal content of food in restaurants
74/25 82/17 75/23 57/41 71/28 76/22 75/25 74/24 72/25 73/24 72/26 72/26 76/22 78/20
Nutri/on awareness campaigns 80/18 84/15 80/19 70/26 77/22 81/16 79/19 80/19 78/19 80/18 79/21 78/20 87/12 86/12
Encouraging more Farmers’ markets 84/15 84/15 85/13 83/16 80/19 87/11 86/13 85/14 81/16 84/14 81/18 84/13 81/18 86/13
Lowering the price of nutri/ous foods 81/16 85/14 83/16 77/21 79/19 84/13 85/15 83/15 78/19 83/16 82/13 82/16 82/17 80/19
Healthier school lunches 79/15 82/12 82/14 72/24 80/16 79/15 84/15 81/16 76/14 81/12 79/19 78/17 83/6 87/11 Programs to help quit
smoking 75/20 79/17 76/18 68/28 74/23 77/18 78/21 76/20 74/21 74/21 77/18 75/20 73/22 78/19
Building more hospitals or healthcare centers 70/28 74/23 68/29 65/33 71/28 69/27 76/23 69/28 70/27 73/26 66/30 65/32 79/22 85/12
Opening more medical schools 64/29 70/24 62/32 59/36 67/30 63/29 73/26 62/32 67/26 71/23 62/32 60/33 73/22 83/16
Free health screenings or vaccina/ons for children
and the elderly 92/6 92/6 91/7 90/9 91/7 92/6 91/9 92/7 92/6 92/6 95/5 92/6 91/6 93/6
More parks, trails and recrea/on centers 83/16 85/13 85/15 77/21 81/19 85/12 90/10 86/13 75/21 83/16 85/14 83/15 84/15 89/10
More bike paths, and dedicated bike lanes on
roads 71/27 76/23 73/24 62/35 70/29 73/24 73/27 72/26 71/27 71/27 75/24 73/26 72/28 76/22
Awareness campaigns for low-‐income health insurance programs
74/21 77/17 75/18 68/27 71/25 78/16 80/19 74/21 73/19 78/18 69/26 72/22 84/13 77/22

NEW YORK • WASHINGTON • DENVER • SEATTLE • LOS ANGELES • SAN FRANCISCO • LONDON • HONG KONG • BEIJING
TECHNOLOGY AND HEALTH
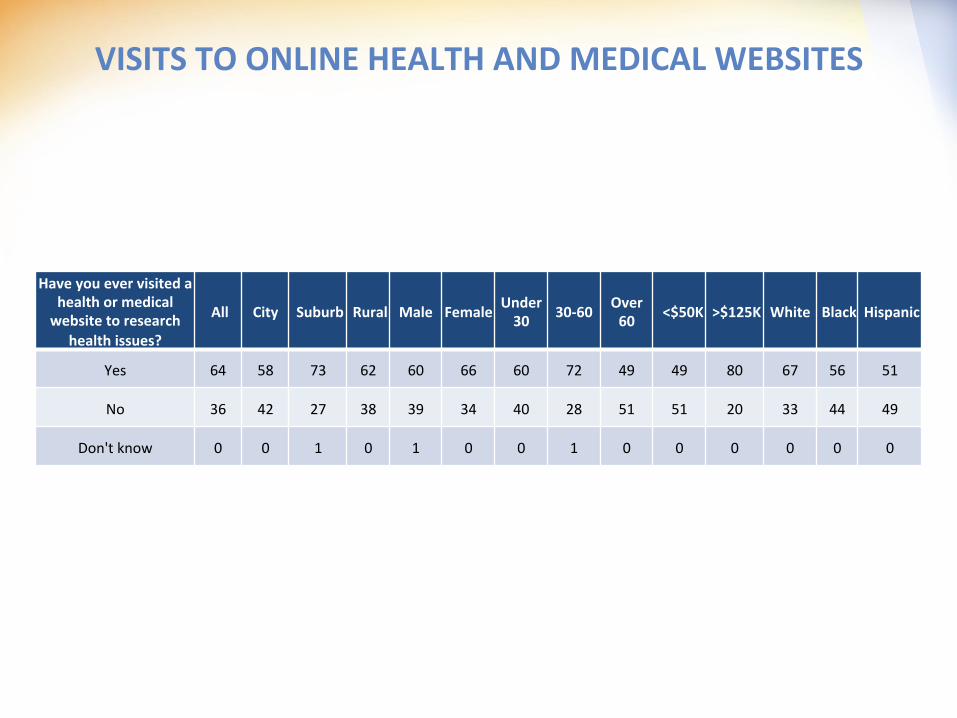
VISITS TO ONLINE HEALTH AND MEDICAL WEBSITES
Have you ever visited a health or medical website to research
health issues?
All City Suburb Rural Male Female Under 30 30-‐60 Over 60 <$50K >$125K White Black Hispanic
Yes 64 58 73 62 60 66 60 72 49 49 80 67 56 51
No 36 42 27 38 39 34 40 28 51 51 20 33 44 49
Don't know 0 0 1 0 1 0 0 1 0 0 0 0 0 0
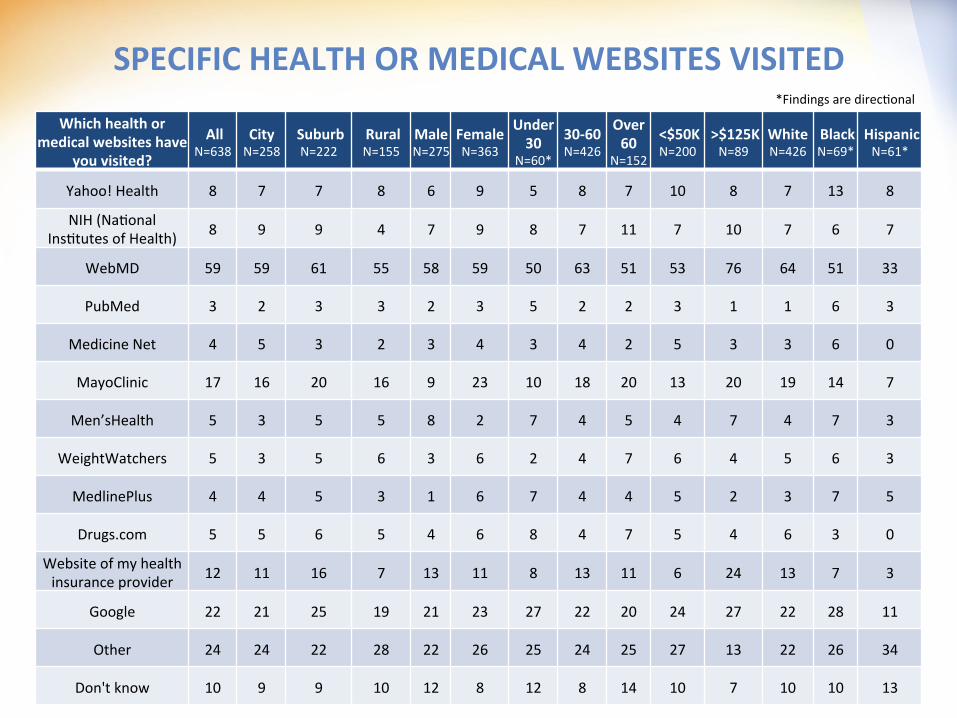
SPECIFIC HEALTH OR MEDICAL WEBSITES VISITED
Which health or medical websites have
you visited?
All N=638
City N=258
Suburb N=222
Rural N=155
Male N=275
Female N=363
Under 30
N=60*
30-‐60 N=426
Over 60
N=152
<$50K N=200
>$125K N=89
White N=426
Black N=69*
Hispanic N=61*
Yahoo! Health 8 7 7 8 6 9 5 8 7 10 8 7 13 8
NIH (Na/onal Ins/tutes of Health) 8 9 9 4 7 9 8 7 11 7 10 7 6 7
WebMD 59 59 61 55 58 59 50 63 51 53 76 64 51 33
PubMed 3 2 3 3 2 3 5 2 2 3 1 1 6 3
Medicine Net 4 5 3 2 3 4 3 4 2 5 3 3 6 0
MayoClinic 17 16 20 16 9 23 10 18 20 13 20 19 14 7
Men’sHealth 5 3 5 5 8 2 7 4 5 4 7 4 7 3
WeightWatchers 5 3 5 6 3 6 2 4 7 6 4 5 6 3
MedlinePlus 4 4 5 3 1 6 7 4 4 5 2 3 7 5
Drugs.com 5 5 6 5 4 6 8 4 7 5 4 6 3 0
Website of my health insurance provider 12 11 16 7 13 11 8 13 11 6 24 13 7 3
Google 22 21 25 19 21 23 27 22 20 24 27 22 28 11
Other 24 24 22 28 22 26 25 24 25 27 13 22 26 34
Don't know 10 9 9 10 12 8 12 8 14 10 7 10 10 13
*Findings are direc/onal
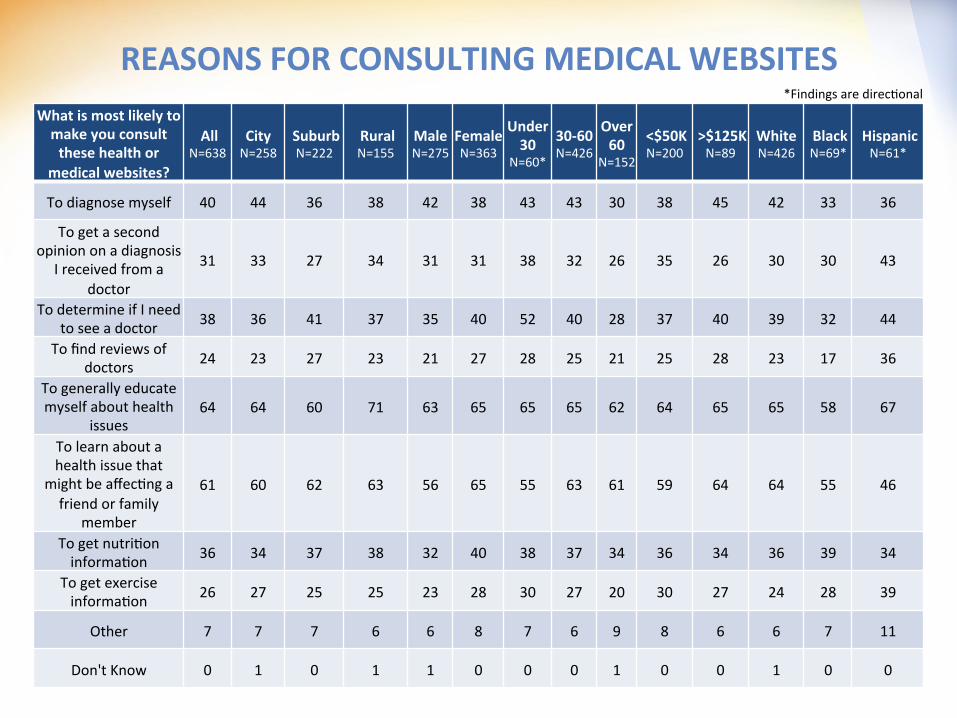
REASONS FOR CONSULTING MEDICAL WEBSITES What is most likely to make you consult these health or
medical websites?
All N=638
City N=258
Suburb N=222
Rural N=155
Male N=275
Female N=363
Under 30
N=60*
30-‐60 N=426
Over 60
N=152
<$50K N=200
>$125K N=89
White N=426
Black N=69*
Hispanic N=61*
To diagnose myself 40 44 36 38 42 38 43 43 30 38 45 42 33 36
To get a second opinion on a diagnosis
I received from a doctor
31 33 27 34 31 31 38 32 26 35 26 30 30 43
To determine if I need to see a doctor 38 36 41 37 35 40 52 40 28 37 40 39 32 44
To find reviews of doctors 24 23 27 23 21 27 28 25 21 25 28 23 17 36
To generally educate myself about health
issues 64 64 60 71 63 65 65 65 62 64 65 65 58 67
To learn about a health issue that
might be affec/ng a friend or family
member
61 60 62 63 56 65 55 63 61 59 64 64 55 46
To get nutri/on informa/on 36 34 37 38 32 40 38 37 34 36 34 36 39 34
To get exercise informa/on 26 27 25 25 23 28 30 27 20 30 27 24 28 39
Other 7 7 7 6 6 8 7 6 9 8 6 6 7 11
Don't Know 0 1 0 1 1 0 0 0 1 0 0 1 0 0
*Findings are direc/onal

IMPORTANCE OF ONLINE MEDICAL INFORMATION
How important to your health do you consider the health or medical informaQon you find
online?
All N=638
City N=258
Suburb N=222
Rural N=155
Male N=275
Female N=363
Under 30
N=60*
30-‐60 N=426
Over 60
N=152
<$50K N=200
>$125K N=89
White N=426
Black N=69*
Hispanic N=61*
Very important 39 38 40 40 39 39 52 40 33 46 33 33 46 57
Somewhat important 55 56 55 55 56 55 43 55 61 50 61 61 48 41
Not very important 4 6 3 4 4 5 5 4 5 2 3 5 4 2
Not at all important 1 0 2 1 2 1 0 1 1 2 3 2 1 0
Don't Know VOL 0 0 0 0 0 0 0 0 0 0 0 0 0 0
*Findings are direc/onal
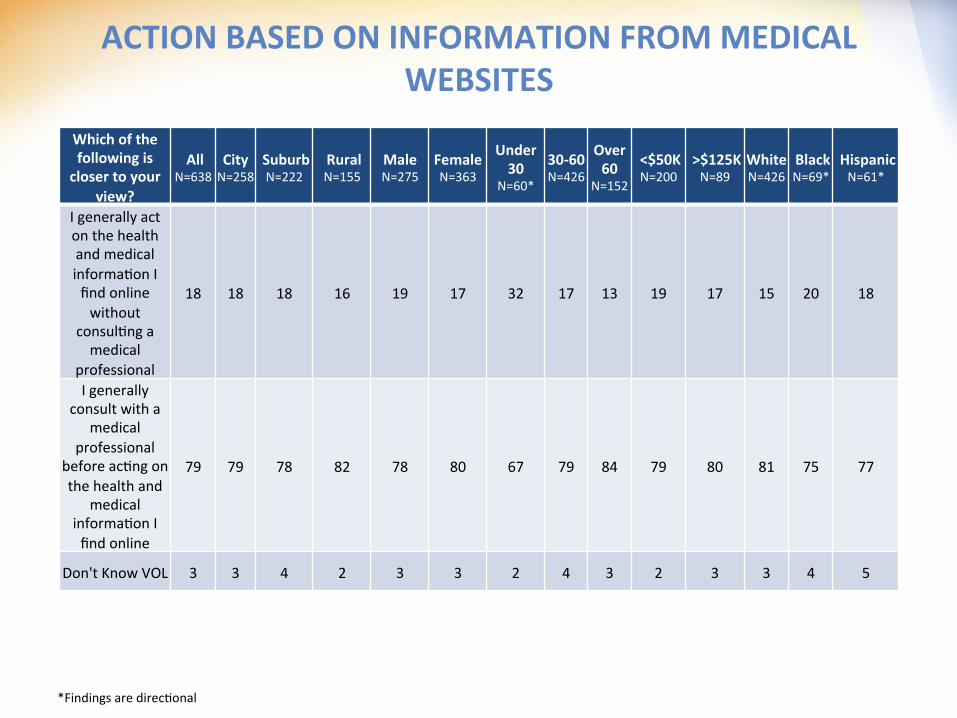
ACTION BASED ON INFORMATION FROM MEDICAL WEBSITES
Which of the following is closer to your
view?
All N=638
City N=258
Suburb N=222
Rural N=155
Male N=275
Female N=363
Under 30
N=60*
30-‐60 N=426
Over 60
N=152
<$50K N=200
>$125K N=89
White N=426
Black N=69*
Hispanic N=61*
I generally act on the health and medical informa/on I find online without
consul/ng a medical
professional
18 18 18 16 19 17 32 17 13 19 17 15 20 18
I generally consult with a
medical professional
before ac/ng on the health and
medical informa/on I find online
79 79 78 82 78 80 67 79 84 79 80 81 75 77
Don't Know VOL 3 3 4 2 3 3 2 4 3 2 3 3 4 5
*Findings are direc/onal

ELECTRONIC COMMUNICATION WITH DOCTORS
Have you ever emailed or sent text messages to your doctor with health quesQons?
All City Suburb Rural Male Female Under 30 30-‐60 Over 60 <$50K >$125K White Black Hispanic
Yes 12 12 14 9 12 12 5 16 7 7 23 12 9 10
No 88 88 85 90 88 88 95 84 93 92 77 88 91 90
Don't know 0 0 1 0 0 0 0 0 1 0 1 1 0 0
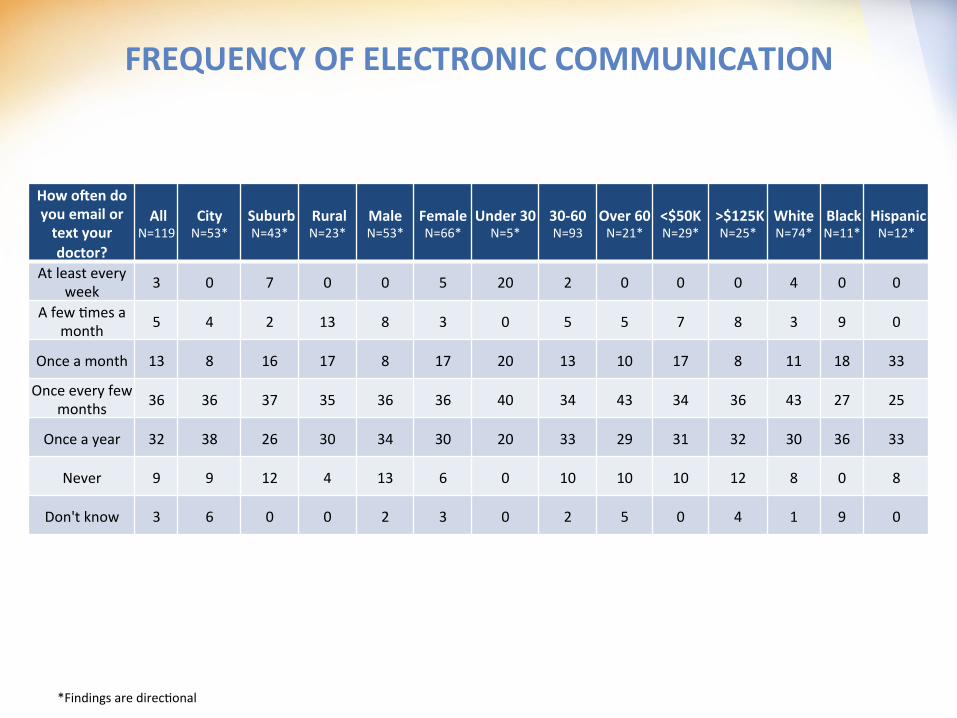
FREQUENCY OF ELECTRONIC COMMUNICATION
How oven do you email or text your doctor?
All N=119
City N=53*
Suburb N=43*
Rural N=23*
Male N=53*
Female N=66*
Under 30 N=5*
30-‐60 N=93
Over 60 N=21*
<$50K N=29*
>$125K N=25*
White N=74*
Black N=11*
Hispanic N=12*
At least every week 3 0 7 0 0 5 20 2 0 0 0 4 0 0
A few /mes a month 5 4 2 13 8 3 0 5 5 7 8 3 9 0
Once a month 13 8 16 17 8 17 20 13 10 17 8 11 18 33
Once every few months 36 36 37 35 36 36 40 34 43 34 36 43 27 25
Once a year 32 38 26 30 34 30 20 33 29 31 32 30 36 33
Never 9 9 12 4 13 6 0 10 10 10 12 8 0 8
Don't know 3 6 0 0 2 3 0 2 5 0 4 1 9 0
*Findings are direc/onal

ELECTRONIC REMINDERS CONCERNING HEALTH
From which of the following would you want to receive emails or text messages with
health reminders?
All City Suburb Rural Male Female Under 30 30-‐60 Over 60 <$50K >$125K White Black Hispanic
Your doctor’s office 64 63 70 59 66 62 67 69 53 58 75 61 71 70
Your health insurance company 27 26 28 25 29 25 27 28 24 29 34 25 30 35
A pharmaceu/cal company 15 16 15 12 14 16 11 16 15 18 14 13 19 18
Your local government or public health department
20 23 22 13 21 20 22 21 18 25 16 16 33 32
A Non-‐profit organiza/on related to a condi/on or disease that is relevant to you
25 28 26 18 26 25 28 27 21 24 30 24 28 24
Other 13 13 13 16 11 16 6 12 19 15 12 15 9 8
Don't know 12 14 10 12 12 12 13 10 17 13 7 13 11 8
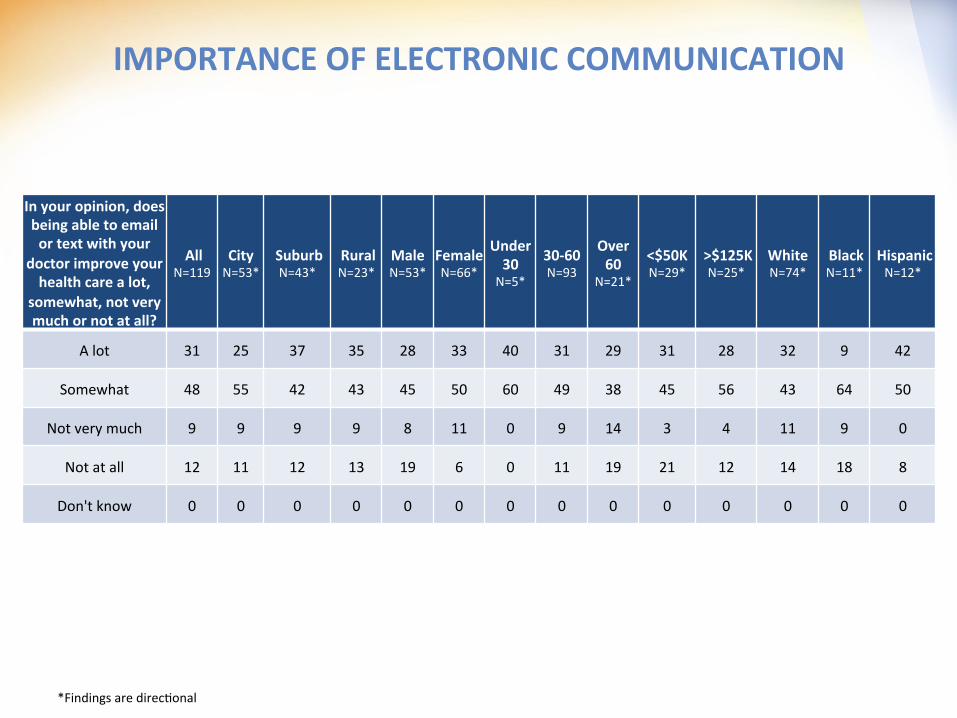
IMPORTANCE OF ELECTRONIC COMMUNICATION
In your opinion, does being able to email or text with your
doctor improve your health care a lot,
somewhat, not very much or not at all?
All N=119
City N=53*
Suburb N=43*
Rural N=23*
Male N=53*
Female N=66*
Under 30 N=5*
30-‐60 N=93
Over 60
N=21*
<$50K N=29*
>$125K N=25*
White N=74*
Black N=11*
Hispanic N=12*
A lot 31 25 37 35 28 33 40 31 29 31 28 32 9 42
Somewhat 48 55 42 43 45 50 60 49 38 45 56 43 64 50
Not very much 9 9 9 9 8 11 0 9 14 3 4 11 9 0
Not at all 12 11 12 13 19 6 0 11 19 21 12 14 18 8
Don't know 0 0 0 0 0 0 0 0 0 0 0 0 0 0
*Findings are direc/onal
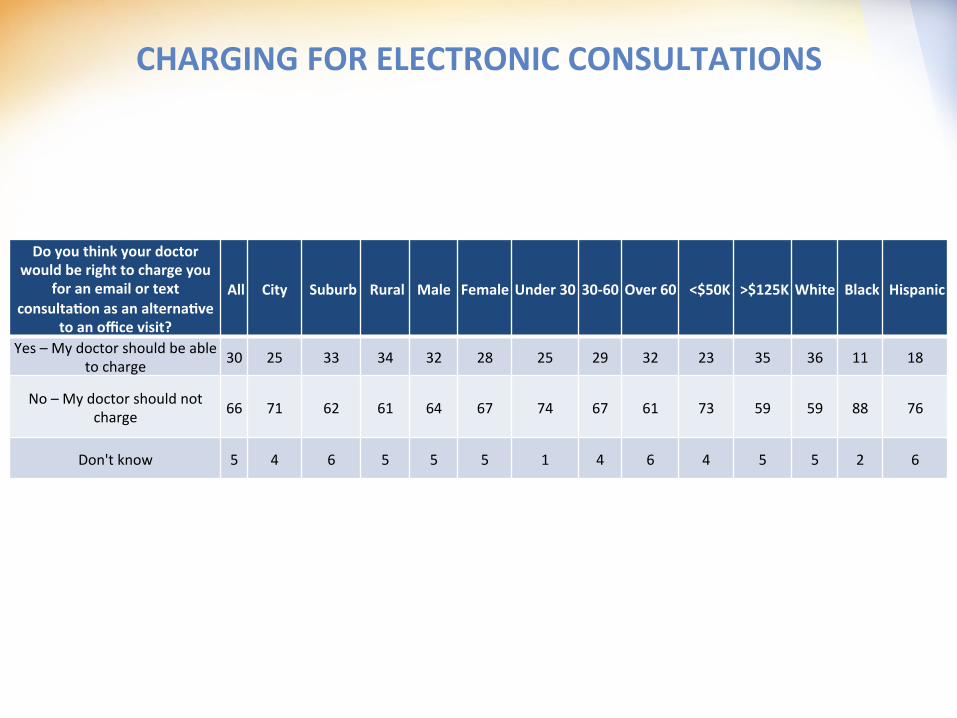
CHARGING FOR ELECTRONIC CONSULTATIONS
Do you think your doctor would be right to charge you
for an email or text consultaQon as an alternaQve
to an office visit?
All City Suburb Rural Male Female Under 30 30-‐60 Over 60 <$50K >$125K White Black Hispanic
Yes – My doctor should be able to charge 30 25 33 34 32 28 25 29 32 23 35 36 11 18
No – My doctor should not charge 66 71 62 61 64 67 74 67 61 73 59 59 88 76
Don't know 5 4 6 5 5 5 1 4 6 4 5 5 2 6

WILLINGNESS TO PAY FOR ELECTRONIC CONSULTATION
Would you be willing to pay for an
email or text consultaQon with your doctor as an alternaQve to an
office visit?
All City Suburb Rural Male Female Under 30 30-‐60 Over 60 <$50K >$125K White Black Hispanic
Yes 31 27 33 38 33 30 33 33 28 26 41 35 18 27
No 65 71 61 59 63 66 66 63 68 72 52 60 81 70
Don't know 4 2 6 3 3 4 1 4 5 2 6 5 1 3

ELECTRONIC COMMUNICATION AS PRIMARY FORM OF COMMUNICATION
Would you be comfortable if email or
other electronic communicaQon was the primary way that you communicate with your
doctor?
All City Suburb Rural Male Female Under 30 30-‐60 Over 60 <$50K >$125K White Black Hispanic
Yes 20 21 20 19 22 19 34 23 12 22 26 17 23 29
No 78 77 77 80 77 79 66 76 85 77 72 81 77 68
Don't know VOL 2 2 2 1 1 2 0 2 3 2 2 2 0 2

NEW YORK • WASHINGTON • DENVER • SEATTLE • LOS ANGELES • SAN FRANCISCO • LONDON • HONG KONG • BEIJING
THE HEALTHCARE SYSTEM

HEALTH CARE COMPANIES ROLE IN IMPROVING COMMUNITY HEALTH
How much do you think health care companies
care about improving the health of people in your
community?
All City Suburb Rural Male Female Under 30 30-‐60 Over 60 <$50K >$125K White Black Hispanic
A great deal 15 13 18 14 18 12 9 15 16 14 16 16 13 12
Some 41 42 41 39 43 39 42 37 48 40 41 39 41 50
Not very much 22 25 21 20 20 25 26 24 17 22 24 22 20 20
None at all 20 19 20 23 18 21 23 22 15 21 17 20 24 18
Don't Know VOL 2 2 1 3 1 3 0 2 4 2 1 2 2 0

PERCEPTION OF HEALTH CARE COMPANY UNDERSTANDING OF COMMUNITY NEEDS
How well do you think health care companies -‐-‐ like insurance and pharmaceuQcal companies -‐-‐
understand what people in your
community need to improve their health?
All City Suburb Rural Male Female Under 30 30-‐60 Over 60 <$50K >$125K White Black Hispanic
Very well 16 17 16 13 18 14 10 15 18 16 17 16 17 120
Somewhat well 41 41 40 41 43 39 50 39 41 38 46 40 38 16
Not very well 20 21 19 21 20 21 16 22 18 22 18 22 17 44
Not well at all 20 18 21 23 16 23 22 21 17 22 15 19 27 20
Don't know 4 3 5 2 3 4 2 3 5 3 4 4 1 17
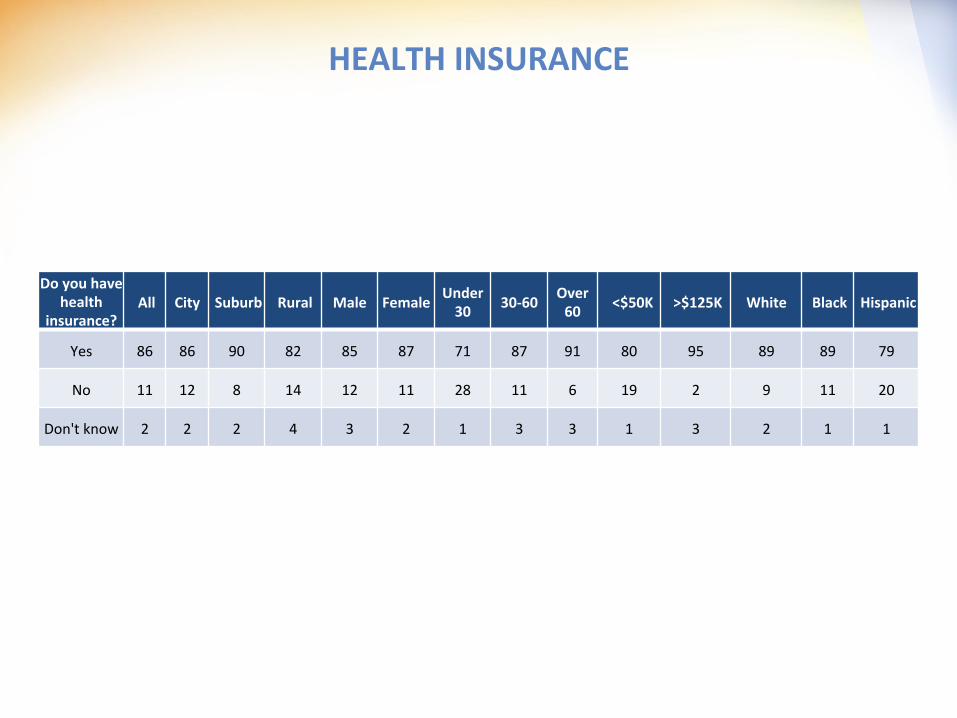
HEALTH INSURANCE
Do you have health
insurance? All City Suburb Rural Male Female Under 30 30-‐60 Over
60 <$50K >$125K White Black Hispanic
Yes 86 86 90 82 85 87 71 87 91 80 95 89 89 79
No 11 12 8 14 12 11 28 11 6 19 2 9 11 20
Don't know 2 2 2 4 3 2 1 3 3 1 3 2 1 1
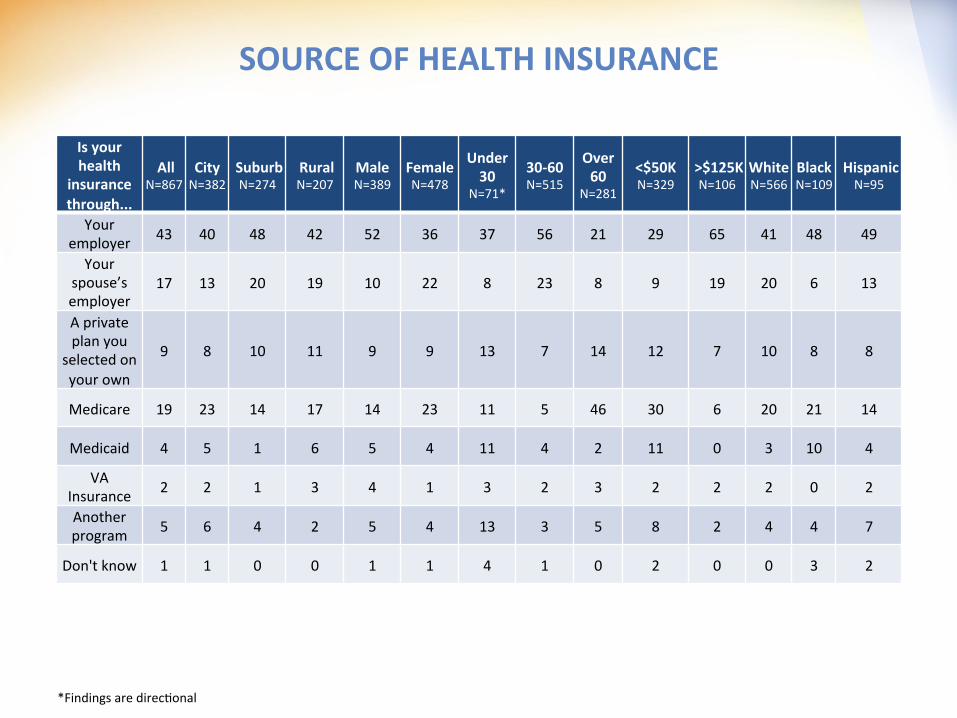
SOURCE OF HEALTH INSURANCE
Is your health
insurance through...
All N=867
City N=382
Suburb N=274
Rural N=207
Male N=389
Female N=478
Under 30
N=71*
30-‐60 N=515
Over 60
N=281
<$50K N=329
>$125K N=106
White N=566
Black N=109
Hispanic N=95
Your employer 43 40 48 42 52 36 37 56 21 29 65 41 48 49
Your spouse’s employer
17 13 20 19 10 22 8 23 8 9 19 20 6 13
A private plan you
selected on your own
9 8 10 11 9 9 13 7 14 12 7 10 8 8
Medicare 19 23 14 17 14 23 11 5 46 30 6 20 21 14
Medicaid 4 5 1 6 5 4 11 4 2 11 0 3 10 4
VA Insurance 2 2 1 3 4 1 3 2 3 2 2 2 0 2
Another program 5 6 4 2 5 4 13 3 5 8 2 4 4 7
Don't know 1 1 0 0 1 1 4 1 0 2 0 0 3 2
*Findings are direc/onal

DOCTOR VISITS PER YEAR
On average, how many Qmes per year do you visit
a doctor?
All City Suburb Rural Male Female Under 30 30-‐60 Over 60 <$50K >$125K White Black Hispanic
0 5 5 5 8 7 4 4 7 3 6 7 6 2 6
1 20 19 22 20 21 19 19 24 13 16 31 22 12 18
2 23 24 24 19 23 22 33 23 18 20 23 20 25 28
3 15 15 14 14 13 16 15 13 17 16 16 14 14 16
4 15 16 11 17 14 15 9 13 20 16 11 14 19 12
5+ 20 20 23 19 17 23 20 18 28 22 14 21 29 21
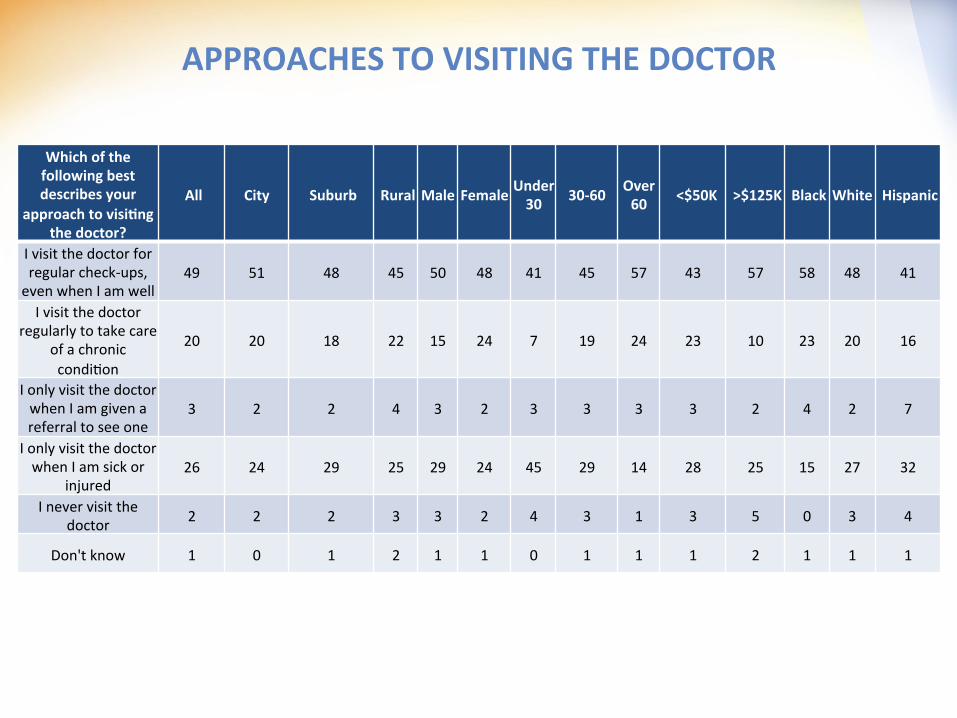
APPROACHES TO VISITING THE DOCTOR
Which of the following best describes your
approach to visiQng the doctor?
All City Suburb Rural Male Female Under 30 30-‐60 Over 60 <$50K >$125K Black White Hispanic
I visit the doctor for regular check-‐ups, even when I am well
49 51 48 45 50 48 41 45 57 43 57 58 48 41
I visit the doctor regularly to take care
of a chronic condi/on
20 20 18 22 15 24 7 19 24 23 10 23 20 16
I only visit the doctor when I am given a referral to see one
3 2 2 4 3 2 3 3 3 3 2 4 2 7
I only visit the doctor when I am sick or
injured 26 24 29 25 29 24 45 29 14 28 25 15 27 32
I never visit the doctor 2 2 2 3 3 2 4 3 1 3 5 0 3 4
Don't know 1 0 1 2 1 1 0 1 1 1 2 1 1 1

PRIMARY DOCTOR
Do you have a primary doctor – such as a general pracQce, family
pracQce or internal medicine physician?
All City Suburb Rural Male Female Under 30 30-‐60 Over 60 <$50K >$125K White Black Hispanic
Yes 88 87 90 90 86 90 70 88 95 86 92 91 89 75
No 11 13 10 10 13 9 29 11 5 14 7 9 11 24
Don't know 0 0 0 0 0 1 1 0 0 0 1 0 0 1

SEEING THE SAME DOCTOR
Do you typically see the same doctor every Qme you go to the doctor, or do you typically see a different doctor each
Qme?
All City Suburb Rural Male Female Under 30 30-‐60 Over 60 <$50K >$125K White Black Hispanic
The same each /me 83 80 85 86 81 85 66 84 89 81 84 86 83 70
Different each /me 15 18 12 12 17 13 32 14 9 16 13 11 15 28
Don't know VOL 2 2 3 2 2 2 2 2 2 3 4 2 2 2
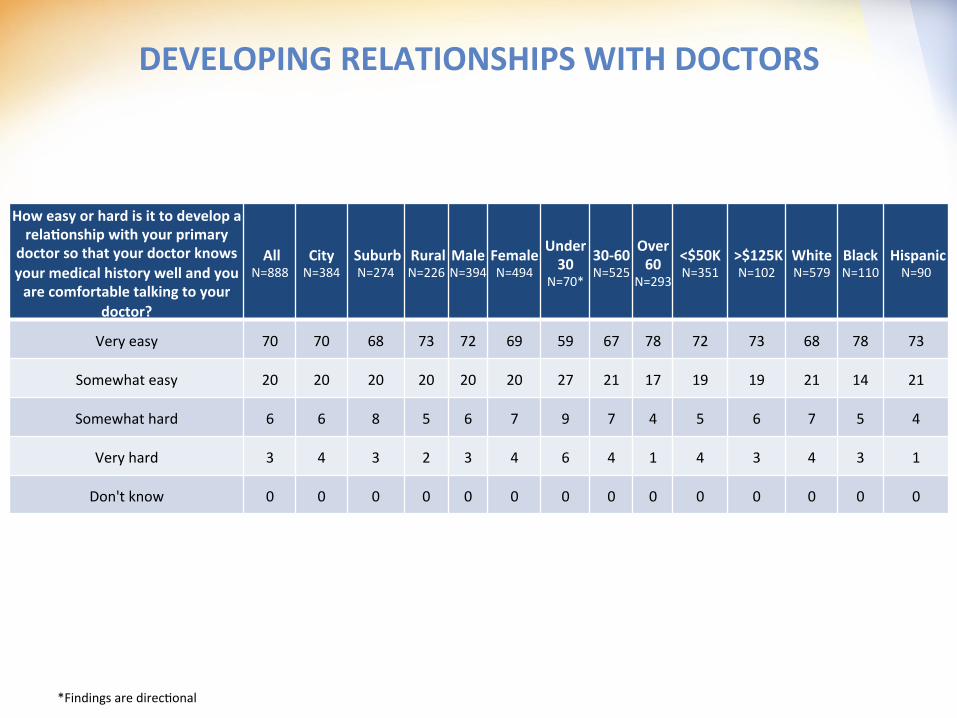
DEVELOPING RELATIONSHIPS WITH DOCTORS
How easy or hard is it to develop a relaQonship with your primary
doctor so that your doctor knows your medical history well and you are comfortable talking to your
doctor?
All N=888
City N=384
Suburb N=274
Rural N=226
Male N=394
Female N=494
Under 30
N=70*
30-‐60 N=525
Over 60
N=293
<$50K N=351
>$125K N=102
White N=579
Black N=110
Hispanic N=90
Very easy 70 70 68 73 72 69 59 67 78 72 73 68 78 73
Somewhat easy 20 20 20 20 20 20 27 21 17 19 19 21 14 21
Somewhat hard 6 6 8 5 6 7 9 7 4 5 6 7 5 4
Very hard 3 4 3 2 3 4 6 4 1 4 3 4 3 1
Don't know 0 0 0 0 0 0 0 0 0 0 0 0 0 0
*Findings are direc/onal
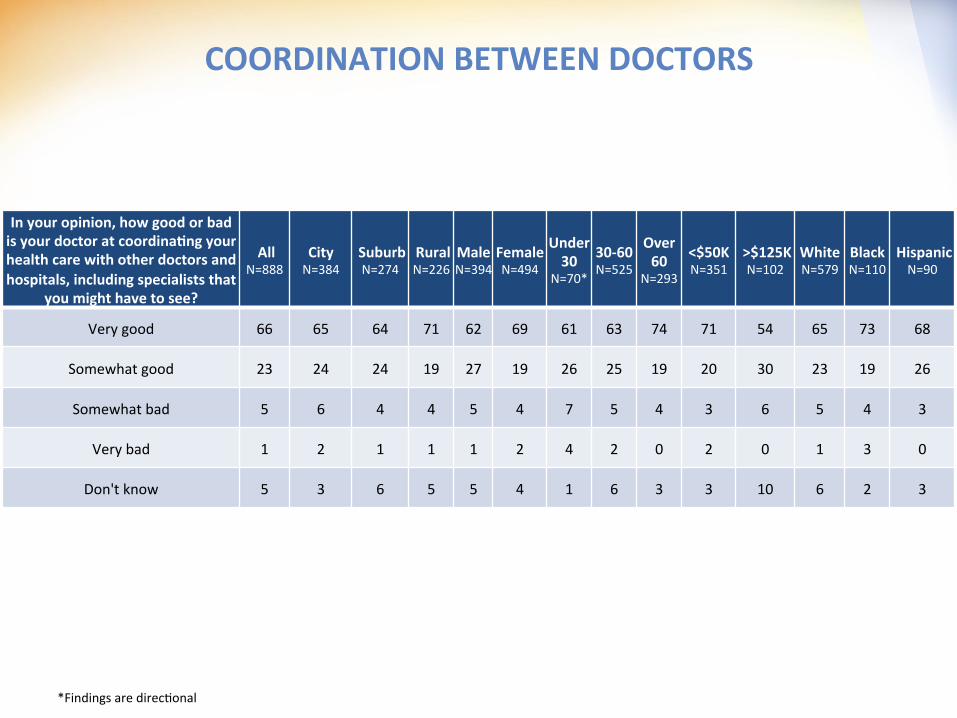
COORDINATION BETWEEN DOCTORS
In your opinion, how good or bad is your doctor at coordinaQng your health care with other doctors and hospitals, including specialists that
you might have to see?
All N=888
City N=384
Suburb N=274
Rural N=226
Male N=394
Female N=494
Under 30
N=70*
30-‐60 N=525
Over 60
N=293
<$50K N=351
>$125K N=102
White N=579
Black N=110
Hispanic N=90
Very good 66 65 64 71 62 69 61 63 74 71 54 65 73 68
Somewhat good 23 24 24 19 27 19 26 25 19 20 30 23 19 26
Somewhat bad 5 6 4 4 5 4 7 5 4 3 6 5 4 3
Very bad 1 2 1 1 1 2 4 2 0 2 0 1 3 0
Don't know 5 3 6 5 5 4 1 6 3 3 10 6 2 3
*Findings are direc/onal

COMPLEXITY OF THE HEALTH CARE SYSTEM
In your opinion, is the health care system generally predy easy to handle by yourself, or is too complex to handle by
yourself?
All City Suburb Rural Male Female Under 30 30-‐60 Over 60 <$50K >$125K White Black Hispanic
Easy to navigate 74 75 72 74 72 75 68 73 78 71 78 74 72 77
Too complex 23 22 25 23 25 22 30 25 18 25 21 22 26 22
Don't know 3 3 3 3 3 3 2 3 3 4 1 3 2 1
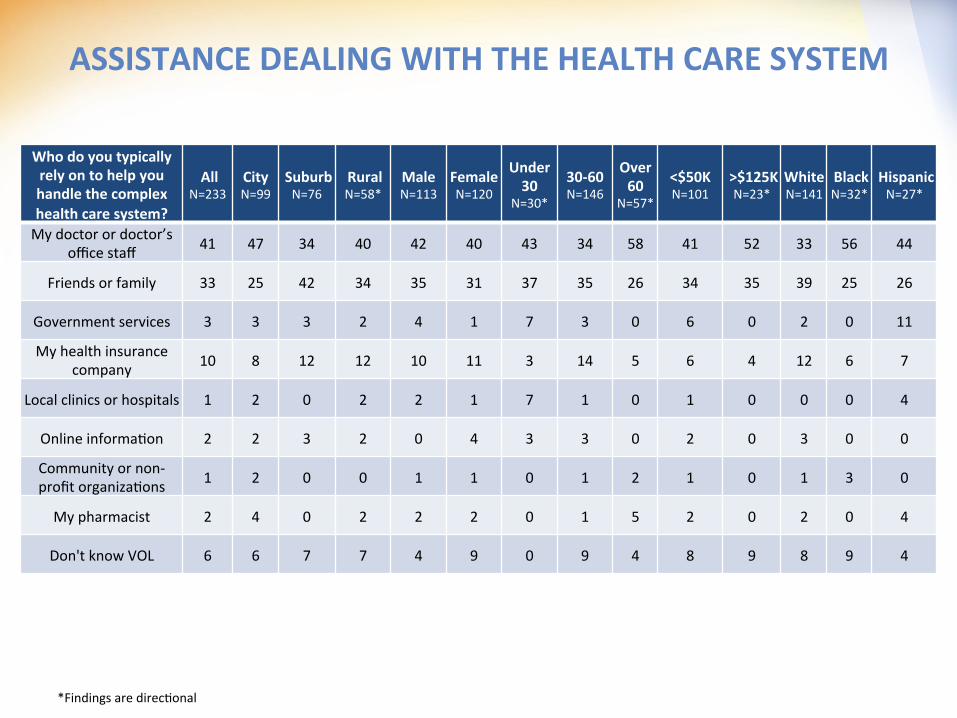
ASSISTANCE DEALING WITH THE HEALTH CARE SYSTEM
Who do you typically rely on to help you handle the complex health care system?
All N=233
City N=99
Suburb N=76
Rural N=58*
Male N=113
Female N=120
Under 30
N=30*
30-‐60 N=146
Over 60
N=57*
<$50K N=101
>$125K N=23*
White N=141
Black N=32*
Hispanic N=27*
My doctor or doctor’s office staff 41 47 34 40 42 40 43 34 58 41 52 33 56 44
Friends or family 33 25 42 34 35 31 37 35 26 34 35 39 25 26
Government services 3 3 3 2 4 1 7 3 0 6 0 2 0 11
My health insurance company 10 8 12 12 10 11 3 14 5 6 4 12 6 7
Local clinics or hospitals 1 2 0 2 2 1 7 1 0 1 0 0 0 4
Online informa/on 2 2 3 2 0 4 3 3 0 2 0 3 0 0
Community or non-‐profit organiza/ons 1 2 0 0 1 1 0 1 2 1 0 1 3 0
My pharmacist 2 4 0 2 2 2 0 1 5 2 0 2 0 4
Don't know VOL 6 6 7 7 4 9 0 9 4 8 9 8 9 4
*Findings are direc/onal
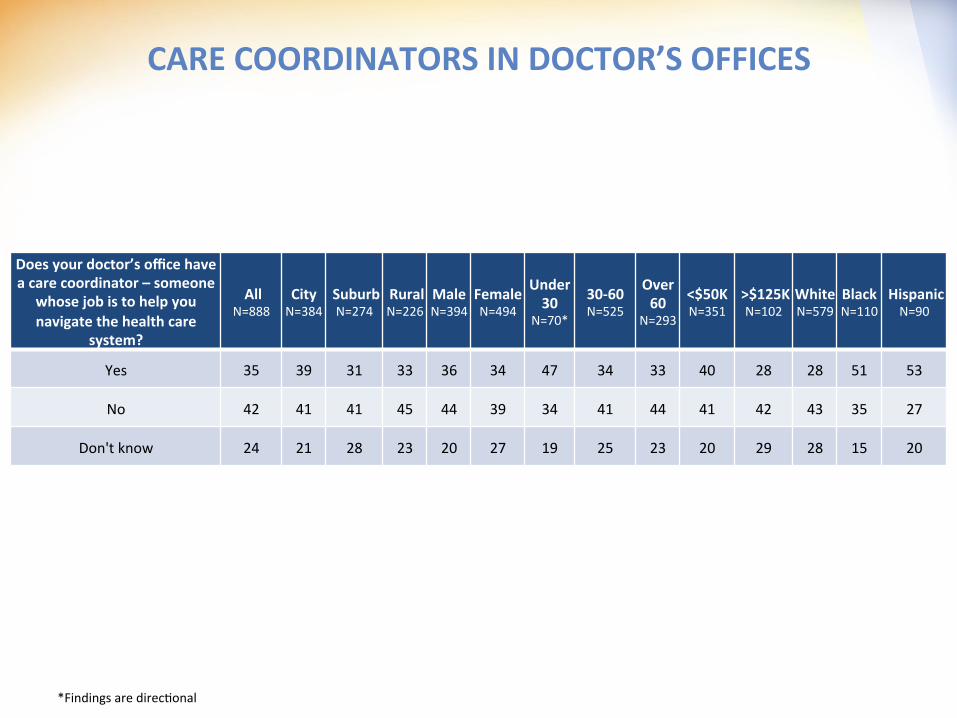
CARE COORDINATORS IN DOCTOR’S OFFICES
Does your doctor’s office have a care coordinator – someone
whose job is to help you navigate the health care
system?
All N=888
City N=384
Suburb N=274
Rural N=226
Male N=394
Female N=494
Under 30
N=70*
30-‐60 N=525
Over 60
N=293
<$50K N=351
>$125K N=102
White N=579
Black N=110
Hispanic N=90
Yes 35 39 31 33 36 34 47 34 33 40 28 28 51 53
No 42 41 41 45 44 39 34 41 44 41 42 43 35 27
Don't know 24 21 28 23 20 27 19 25 23 20 29 28 15 20
*Findings are direc/onal
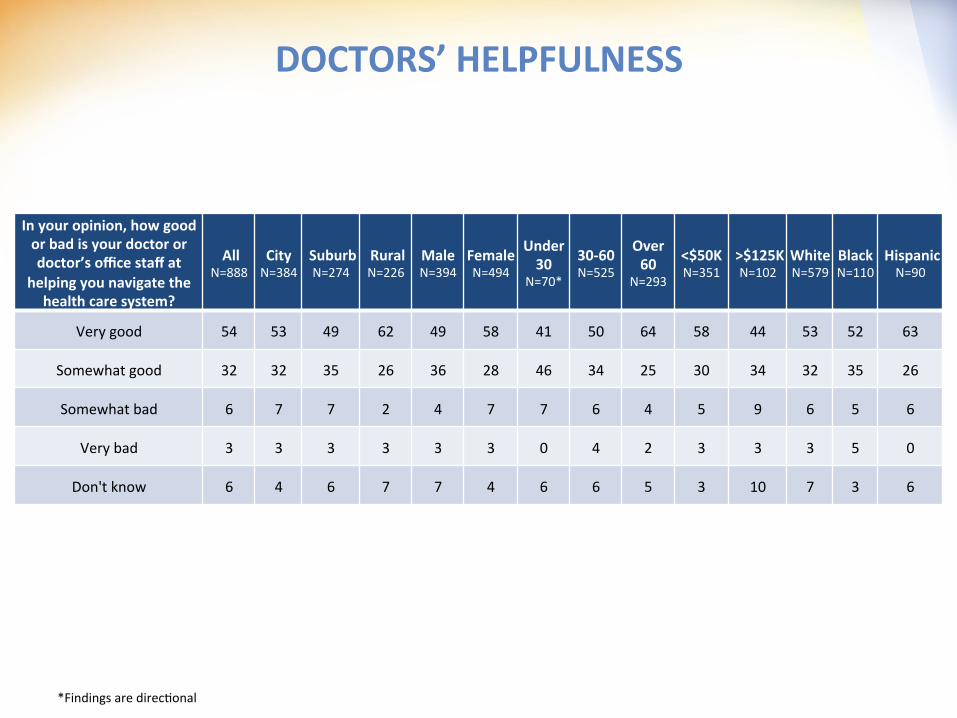
DOCTORS’ HELPFULNESS
In your opinion, how good or bad is your doctor or doctor’s office staff at
helping you navigate the health care system?
All N=888
City N=384
Suburb N=274
Rural N=226
Male N=394
Female N=494
Under 30
N=70*
30-‐60 N=525
Over 60
N=293
<$50K N=351
>$125K N=102
White N=579
Black N=110
Hispanic N=90
Very good 54 53 49 62 49 58 41 50 64 58 44 53 52 63
Somewhat good 32 32 35 26 36 28 46 34 25 30 34 32 35 26
Somewhat bad 6 7 7 2 4 7 7 6 4 5 9 6 5 6
Very bad 3 3 3 3 3 3 0 4 2 3 3 3 5 0
Don't know 6 4 6 7 7 4 6 6 5 3 10 7 3 6
*Findings are direc/onal

DOCTOR RELATIONSHIPS PAST VS. PRESENT
Thinking about your parents’ generaQon, do you think they had more personal or less
personal relaQonships with their doctors than you do now?
All City Suburb Rural Male Female Under 30 30-‐60 Over 60 <$50K >$125K White Black Hispanic
Much more personal 40 38 44 38 41 38 29 45 32 33 47 42 37 34
Somewhat more personal 22 22 21 22 24 19 31 21 19 20 25 24 13 12
Somewhat less personal 17 18 16 18 16 19 19 16 19 20 13 14 26 27
Much less personal 14 15 12 15 13 15 16 11 19 18 6 12 17 21
Don't know 8 7 7 8 6 9 5 6 11 8 9 7 7 7

REGULAR CHECKUPS
Do you regularly go to see a doctor when you’re not sick (such as for an
annual checkup)?
All City Suburb Rural Male Female Under 30 30-‐60 Over 60 <$50K >$125K White Black Hispanic
Yes 66 69 65 63 61 70 59 63 75 64 67 66 73 68
No 32 29 33 34 36 28 40 34 24 35 31 32 26 32
Don't know 2 2 1 3 3 2 1 3 1 1 3 2 1 0

NEW YORK • WASHINGTON • DENVER • SEATTLE • LOS ANGELES • SAN FRANCISCO • LONDON • HONG KONG • BEIJING
DOCTORS’ APPEARANCE
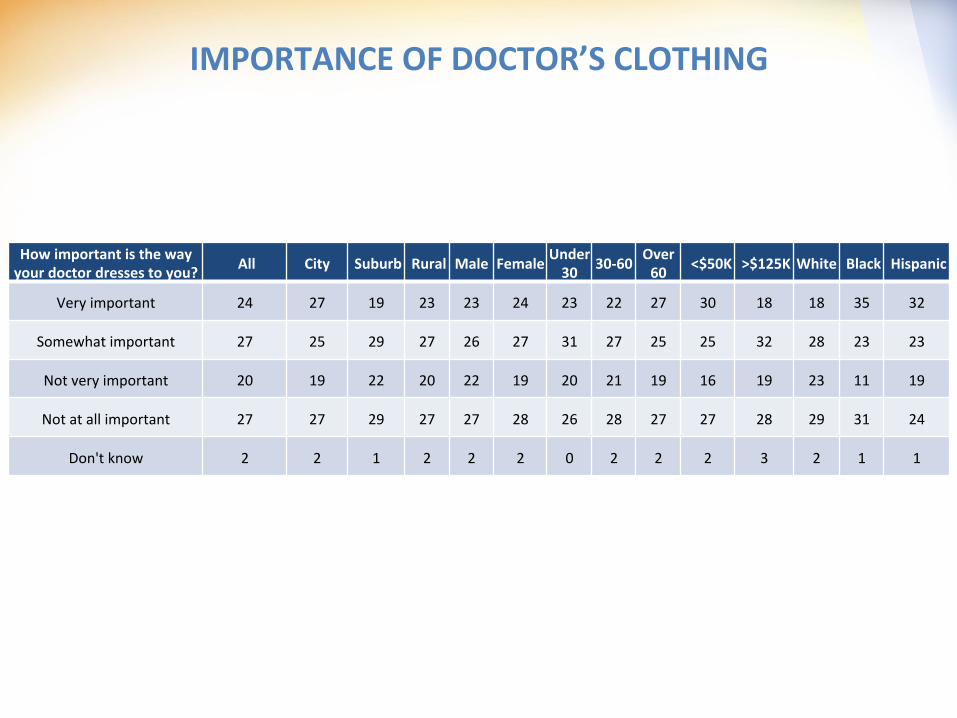
IMPORTANCE OF DOCTOR’S CLOTHING
How important is the way your doctor dresses to you? All City Suburb Rural Male Female Under 30 30-‐60 Over 60 <$50K >$125K White Black Hispanic
Very important 24 27 19 23 23 24 23 22 27 30 18 18 35 32
Somewhat important 27 25 29 27 26 27 31 27 25 25 32 28 23 23
Not very important 20 19 22 20 22 19 20 21 19 16 19 23 11 19
Not at all important 27 27 29 27 27 28 26 28 27 27 28 29 31 24
Don't know 2 2 1 2 2 2 0 2 2 2 3 2 1 1
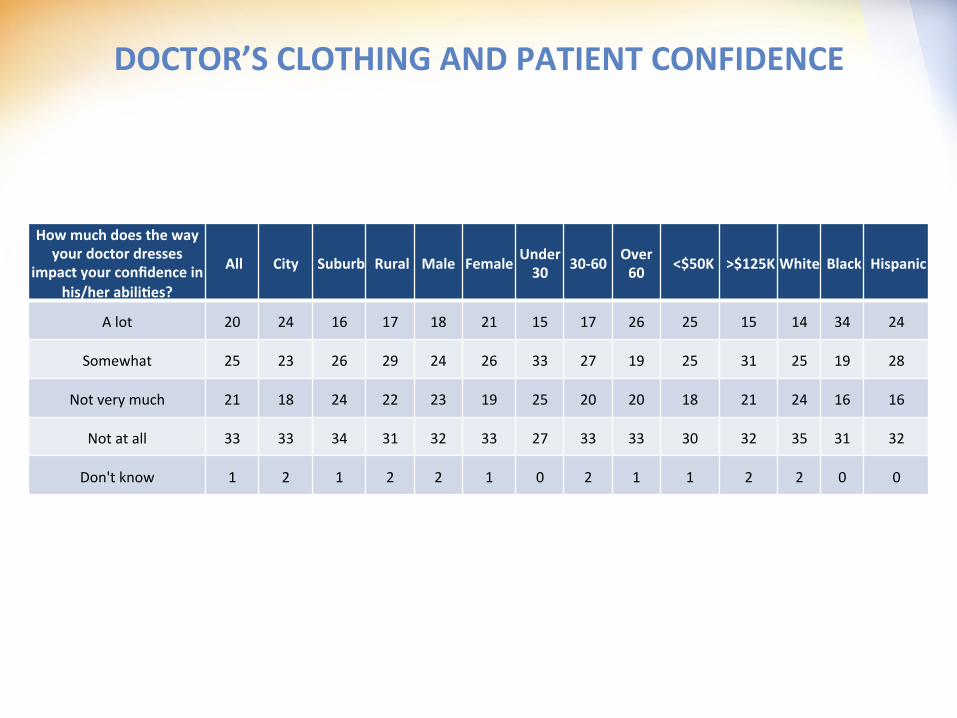
DOCTOR’S CLOTHING AND PATIENT CONFIDENCE
How much does the way your doctor dresses
impact your confidence in his/her abiliQes?
All City Suburb Rural Male Female Under 30 30-‐60 Over 60 <$50K >$125K White Black Hispanic
A lot 20 24 16 17 18 21 15 17 26 25 15 14 34 24
Somewhat 25 23 26 29 24 26 33 27 19 25 31 25 19 28
Not very much 21 18 24 22 23 19 25 20 20 18 21 24 16 16
Not at all 33 33 34 31 32 33 27 33 33 30 32 35 31 32
Don't know 1 2 1 2 2 1 0 2 1 1 2 2 0 0

DOCTOR’S CLOTHING
How do you prefer your
doctor to dress? All City Suburb Rural Male Female Under 30 30-‐60 Over
60 <$50K >$125K White Black Hispanic
White coat 39 41 39 35 42 36 52 36 39 42 32 35 44 51
Scrubs 6 6 6 7 5 7 11 7 4 8 8 6 7 8
Business awre 16 15 16 18 17 15 12 19 12 13 23 16 13 15
Other 26 24 27 26 23 28 18 25 29 27 19 28 24 21
Don't know 13 14 12 14 13 14 7 13 16 9 18 13 11 6
NEW YORK • WASHINGTON • DENVER • SEATTLE • LOS ANGELES • SAN FRANCISCO • LONDON • HONG KONG • BEIJING
HEALTHY LIVING FACTORS
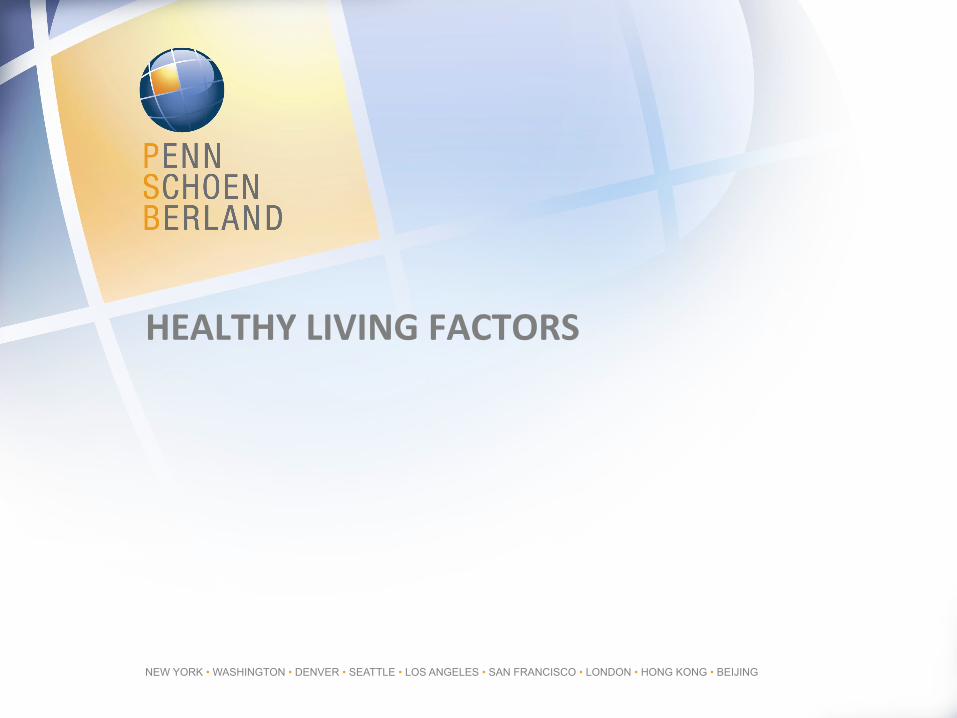
EXERCISE
How many hours per week do you exercise? All City Suburb Rural Male Female Under 30 30-‐60 Over
60 <$50K >$125K White Black Hispanic
0-‐1 hours per week 25 28 22 24 23 27 17 24 29 29 22 25 38 18
2-‐5 hours per week 37 38 36 38 34 40 37 38 35 33 41 37 35 42
5-‐8 hours per week 17 17 19 14 20 14 18 16 18 16 22 18 11 17
8-‐10 hours per week 8 7 10 7 9 8 14 8 7 10 5 8 8 12
More than 10 hours per week 9 8 10 12 12 7 13 10 7 10 8 9 5 10
Don't know 3 2 3 5 3 3 1 3 4 2 3 3 3 2
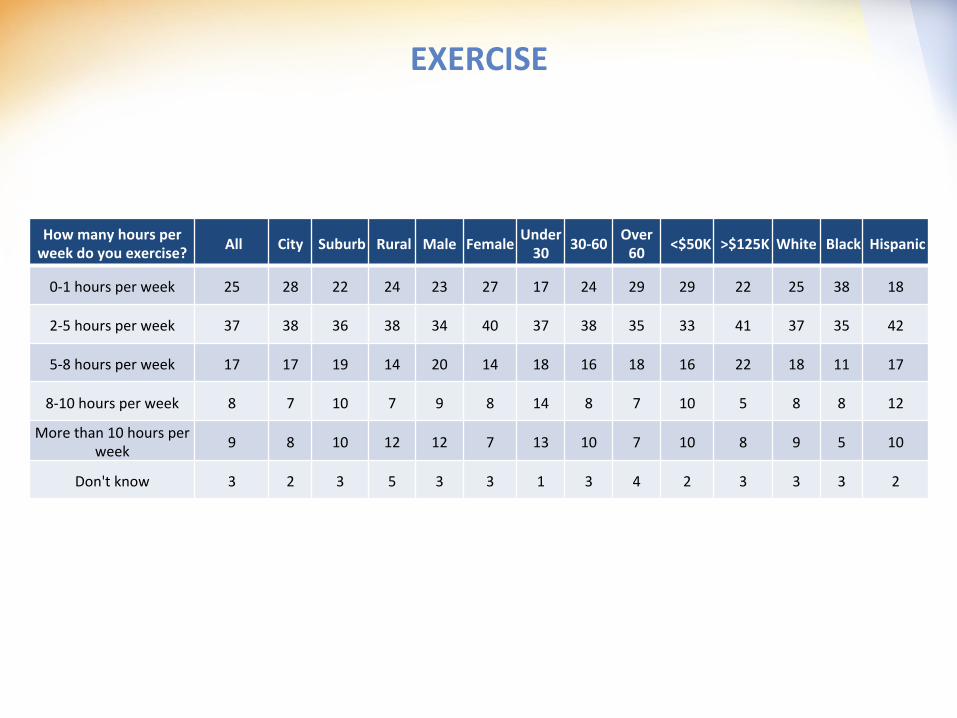
SMOKING
Do you smoke
regularly? All City Suburb Rural Male Female Under
30 30-‐60 Over 60 <$50K >$125K White Black Hispanic
Yes 14 16 11 15 16 12 18 16 8 18 8 14 15 16
No 84 82 87 82 81 86 81 81 90 81 89 84 85 84
Don't know 2 2 2 3 3 2 1 3 2 1 3 2 0 0

HEALTHY FOOD CHOICES
Do you generally choose
organic or healthy food opQons?
All City Suburb Rural Male Female Under 30 30-‐60 Over 60 <$50K >$125K White Black Hispanic
Yes 62 63 61 62 55 68 65 63 59 63 64 63 65 58
No 34 34 35 33 40 29 34 33 37 35 32 34 33 40
Don't Know 4 3 4 4 4 3 1 4 4 2 4 3 2 2

HAND WASHING
How many Qmes do you wash your hands per day?
All City Suburb Rural Male Female Under 30 30-‐60 Over 60 <$50K >$125K White Black Hispanic
0 0 0 0 0 0 0 0 0 0 0 1 0 0 0
1 1 1 1 1 1 1 0 1 1 1 2 1 0 1
2 3 3 2 3 4 2 3 2 3 2 3 3 1 2
3 4 4 5 4 7 2 4 5 4 5 8 4 8 2
More than 3 /mes per day 89 90 89 88 85 93 91 89 89 90 84 89 89 93
Don't know 3 3 3 4 3 3 2 3 4 1 3 2 2 2
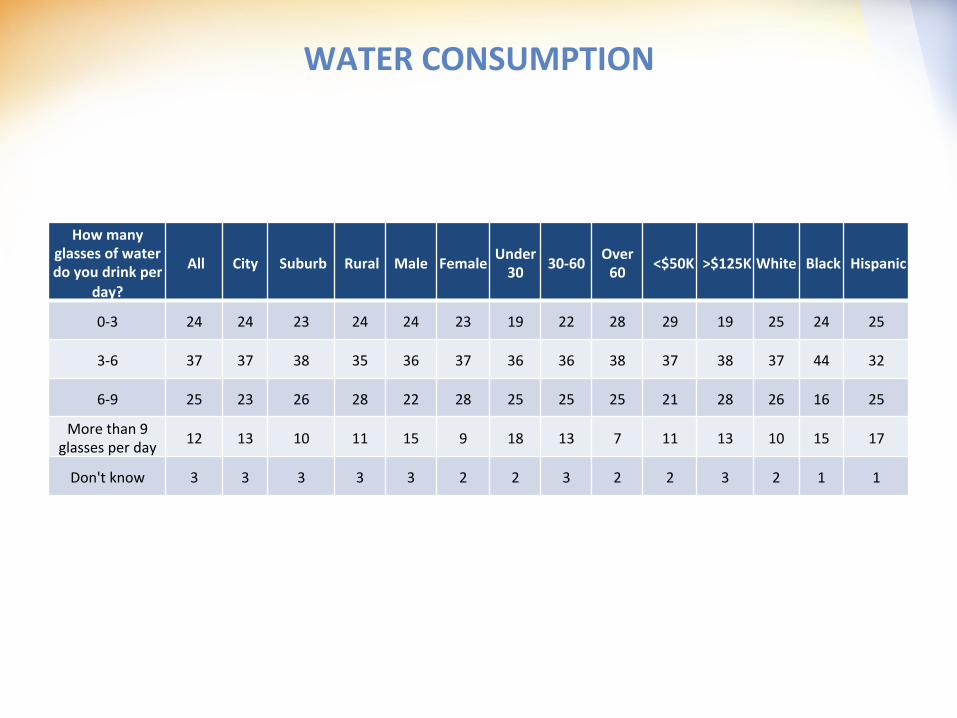
WATER CONSUMPTION
How many glasses of water do you drink per
day?
All City Suburb Rural Male Female Under 30 30-‐60 Over 60 <$50K >$125K White Black Hispanic
0-‐3 24 24 23 24 24 23 19 22 28 29 19 25 24 25
3-‐6 37 37 38 35 36 37 36 36 38 37 38 37 44 32
6-‐9 25 23 26 28 22 28 25 25 25 21 28 26 16 25
More than 9 glasses per day 12 13 10 11 15 9 18 13 7 11 13 10 15 17
Don't know 3 3 3 3 3 2 2 3 2 2 3 2 1 1

VISITING THE DENTIST
Do you go to see a denQst when there isn’t something wrong (such as for an annual
teeth cleaning)?
All City Suburb Rural Male Female Under 30 30-‐60 Over 60 <$50K >$125K White Black Hispanic
Yes 68 62 80 66 66 70 63 71 64 53 82 72 59 58
No 29 36 18 31 31 28 36 26 33 46 15 26 41 40
Don't know 2 2 2 3 3 2 1 3 3 1 3 2 0 2