National Commercial Bank Investor Presentation 2Q … 2Q... · NCB Investor Relations ... National...
52
NCB Investor Relations 2Q 2017 Investor Presentation 1 National Commercial Bank Investor Presentation 2Q 2017 Results
Transcript of National Commercial Bank Investor Presentation 2Q … 2Q... · NCB Investor Relations ... National...
NCB Investor Relations2Q 2017 Investor Presentation 1
National Commercial Bank
Investor Presentation
2Q 2017 Results
NCB Investor Relations2Q 2017 Investor Presentation 2
Disclaimer
The National Commercial Bank (NCB) prepared this presentation on a proprietary basis as general background information about the activities of NCB. The information contained herein is given in summary form and for discussion purposes only. Some of the information that is relied upon by NCB is obtained from sources believed to be reliable, but NCB (nor any of its directors, officers, employees, agents, affiliates or subsidiaries) does not guarantee the accuracy or completeness of such information, and disclaims all liability or responsibility for any loss or damage caused by any act taken as a result of the information. This presentation including the information covered therein is not intended either to be relied upon or construed as an advertisement for, or an offer, solicitation or invitation to sell or issue, or to subscribe, underwrite or otherwise acquire any securities in any jurisdiction. It should and must not be treated as giving tax, legal, investment or other specialist advice or a recommendation to investors or potential investors and does not take into account the investment objectives, financial situation or needs of any particular investor. Neither shall any part of this information nor the fact of its distribution form part of or be relied on in connection with any contract or investment decision or commitment relating thereto, nor does it constitute a recommendation regarding the subject of this presentation.
All statements included in this presentation other than statements of historical facts, including, without limitation, those regarding financial position, business strategy, plans and objectives of management for future operations (including development plans and objectives) are forward-looking statements and may thus include words like "anticipate", "believe", "intend", "estimate", "expect", "will", "may", "project", "plan" and such other words of similar meaning. Such forward-looking statements are based on numerous assumptions regarding present and future business strategies and the relevant future business environment. Any forward-looking statements speak only as of the date of this presentation and NCB expressly disclaims to the fullest extent permitted by law any obligation or undertaking to disseminate any updates or revisions to any forward-looking statements contained herein to reflect any change in expectations with regard thereto or any change in events, conditions or circumstances on which any such statement is based. Nothing in the foregoing is intended to or shall exclude any liability for, or remedy in respect of, fraudulent misrepresentation. Due to rounding, numbers and percentages presented throughout this presentation may not add up precisely to the totals provided.
NCB is not under any obligation to update, complete, amend, revise or keep current the information contained herein, and any opinions expressed herein are subject to change materially without notice. Accordingly, no representation or warranty, express or implied, is or will be made by NCB, their respective advisors or any such persons’ directors, officers or employees, or any other person as to the accuracy, completeness or fairness of the information or opinions contained in this presentation, and any reliance you place on them will be at your sole risk. Investors must rely solely on their own examinations of the Offering and relevant documentation in making a determination as to whether to invest in the securities described. An investor should seek independent professional advice when deciding if an investment is appropriate. Securities that may be discussed herein may not be suitable for all investors. Investors are required to make their own independent investigation and appraisal of the business and financial condition of NCB and its subsidiaries, the nature of the securities and the merits or suitability of the securities or any transaction to any investor’s particular situation and objectives, including the possible risks and benefits of purchasing any securities. Any such determination should involve an assessment of the legal, tax, accounting, regulatory, financial, credit or other related aspects of the offering or the securities. Without prejudice to the foregoing, NCB, their advisors and any such persons’ directors, officers or employees expressly disclaim any liability whatsoever, in negligence or otherwise, for any loss howsoever arising, directly or indirectly, from use of, or reliance on, this presentation or its contents or otherwise arising in connection therewith.
NCB Investor Relations2Q 2017 Investor Presentation 3
Investor Presentation
Contents
04
12
18
28
43
51
NCB – The leading KSA bank
Grow with KSA. Grow with NCB.
Strategy Overview
Financial Results
Segmental Overview
Additional Information
NCB Investor Relations2Q 2017 Investor Presentation 4
National Commercial Bank
The Leading KSA Bank
2Q 2017 Results
NCB Investor Relations2Q 2017 Investor Presentation 5
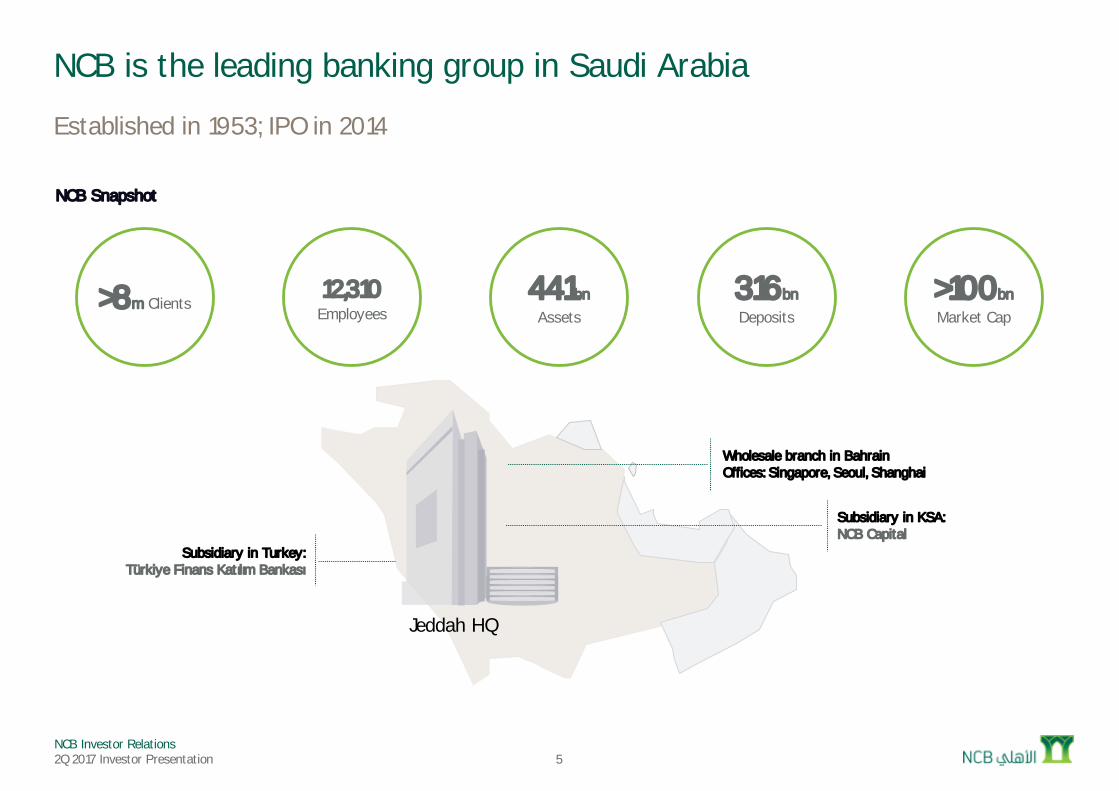
NCB is the leading banking group in Saudi Arabia
Established in 1953; IPO in 2014
NCB Snapshot
Jeddah HQ
>8m Clients12,310Employees
441bn Assets
316bn Deposits
>100bn Market Cap
Wholesale branch in BahrainOffices: Singapore, Seoul, Shanghai
Subsidiary in Turkey:Türkiye Finans Katılım Bankası
Subsidiary in KSA:NCB Capital
NCB Investor Relations2Q 2017 Investor Presentation 6
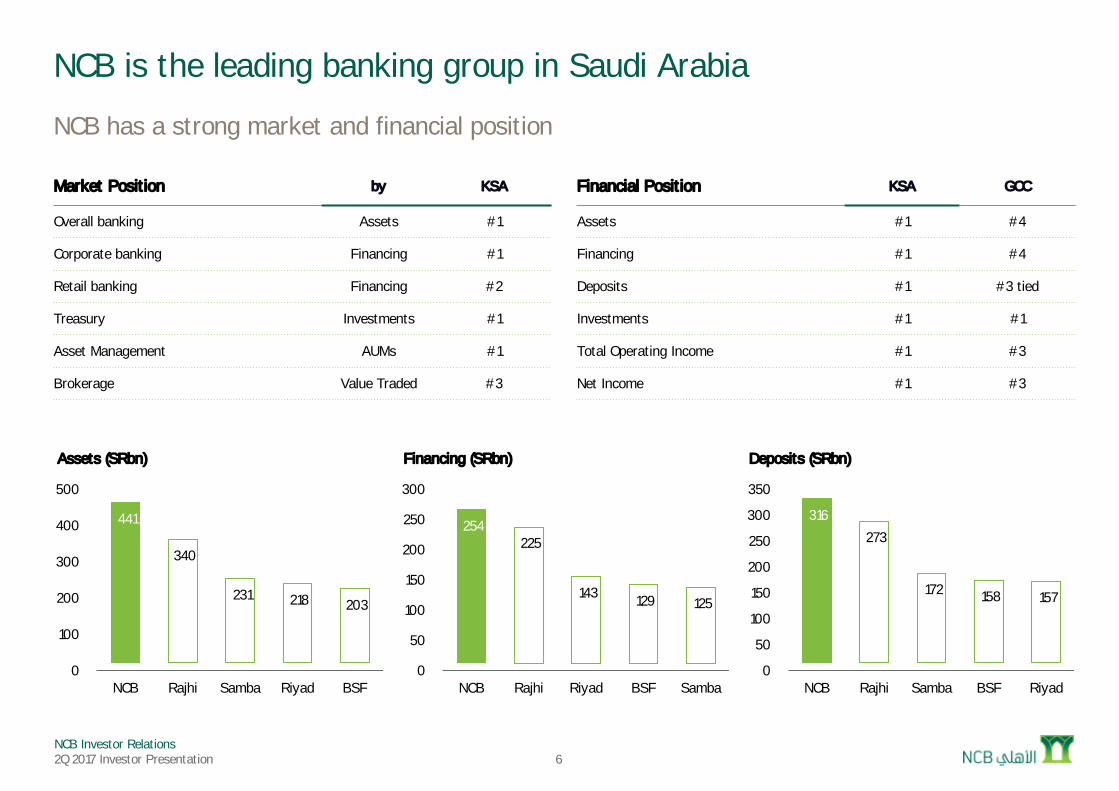
NCB is the leading banking group in Saudi Arabia
NCB has a strong market and financial position
Financial Position KSA GCC
Assets #1 #4
Financing #1 #4
Deposits #1 #3 tied
Investments #1 #1
Total Operating Income #1 #3
Net Income #1 #3
Market Position by KSA
Overall banking Assets #1
Corporate banking Financing #1
Retail banking Financing #2
Treasury Investments #1
Asset Management AUMs #1
Brokerage Value Traded #3
441
340
231 218 203
0
100
200
300
400
500
NCB Rajhi Samba Riyad BSF
Assets (SRbn)
254 225
143 129 125
0
50
100
150
200
250
300
NCB Rajhi Riyad BSF Samba
Financing (SRbn)
316
273
172 158 157
0
50
100
150
200
250
300
350
NCB Rajhi Samba BSF Riyad
Deposits (SRbn)
NCB Investor Relations2Q 2017 Investor Presentation 7
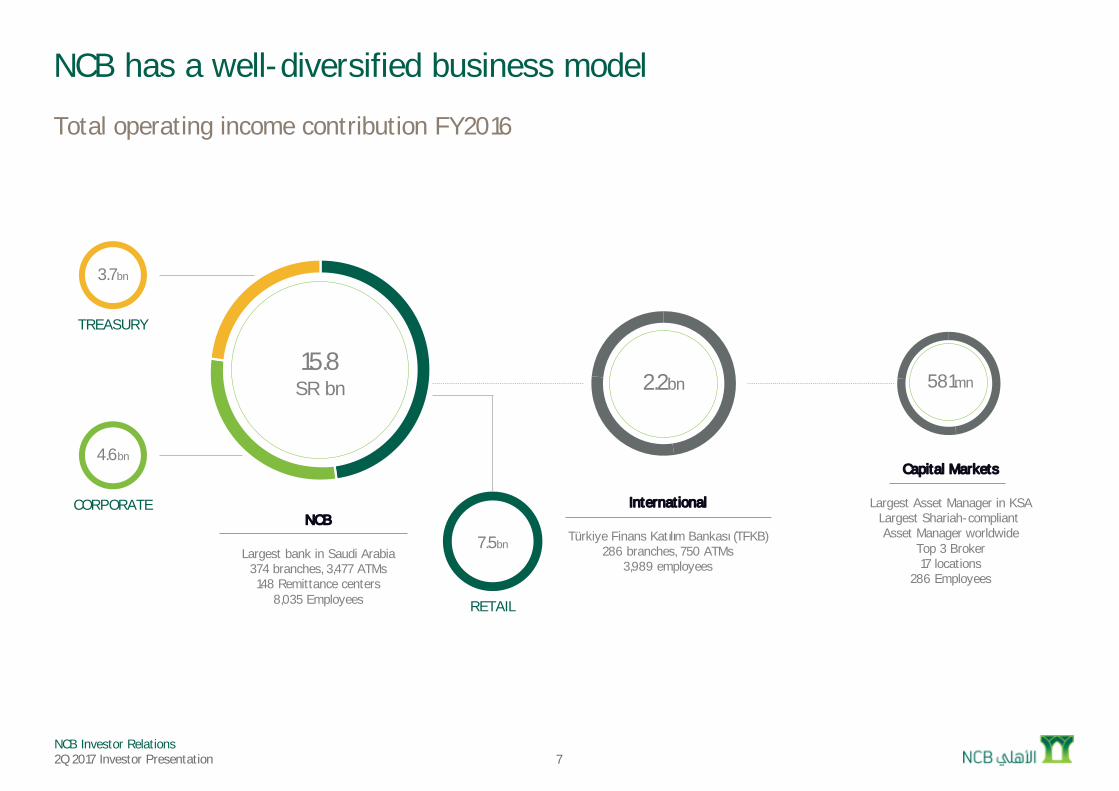
NCB has a well-diversified business model
Total operating income contribution FY2016
Capital Markets
Largest Asset Manager in KSALargest Shariah-compliant Asset Manager worldwide
Top 3 Broker17 locations
286 Employees
15.8SR bn
NCB
Largest bank in Saudi Arabia374 branches, 3,477 ATMs148 Remittance centers
8,035 Employees
7.5bn
4.6bn
3.7bn
RETAIL
CORPORATE
TREASURY
2.2bn 581mn
International
Türkiye Finans Katılım Bankası (TFKB)286 branches, 750 ATMs
3,989 employees
NCB Investor Relations2Q 2017 Investor Presentation 8
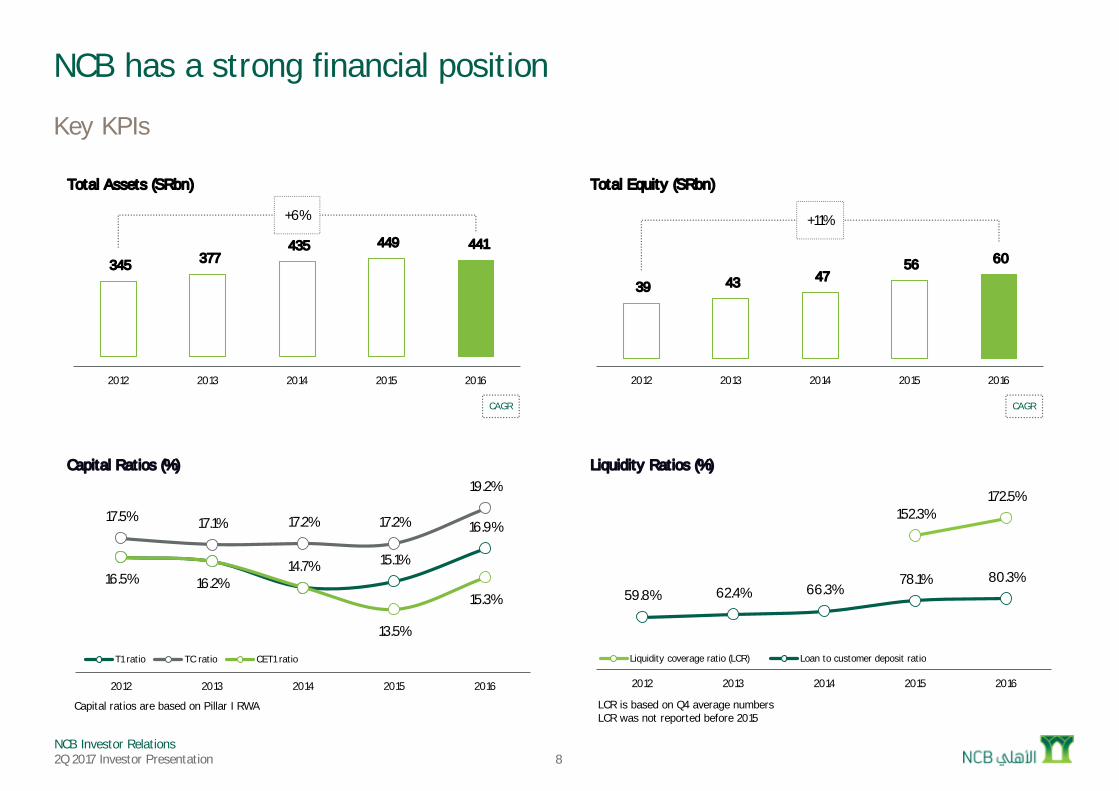
NCB has a strong financial position
Key KPIs
14.7% 15.1%
16.9%17.5% 17.1% 17.2% 17.2%
19.2%
16.5% 16.2%
13.5%
15.3%
10.0%
11.0%
12.0%
13.0%
14.0%
15.0%
16.0%
17.0%
18.0%
19.0%
20.0%
2012 2013 2014 2015 2016
Capital Ratios (%)
T1 ratio TC ratio CET1 ratio
39 43 47 56 60
+11%
0
20
40
60
80
100
2012 2013 2014 2015 2016
Total Equity (SRbn)
345 377 435 449 441
+6%
0
100
200
300
400
500
600
700
2012 2013 2014 2015 2016
Total Assets (SRbn)
CAGR CAGR
LCR is based on Q4 average numbersLCR was not reported before 2015
Capital ratios are based on Pillar I RWA
152.3%172.5%
59.8% 62.4% 66.3%78.1% 80.3%
0
0
0
1
1
1
1
1
2
2
2
2012 2013 2014 2015 2016
Liquidity Ratios (%)
Liquidity coverage ratio (LCR) Loan to customer deposit ratio
NCB Investor Relations2Q 2017 Investor Presentation 9
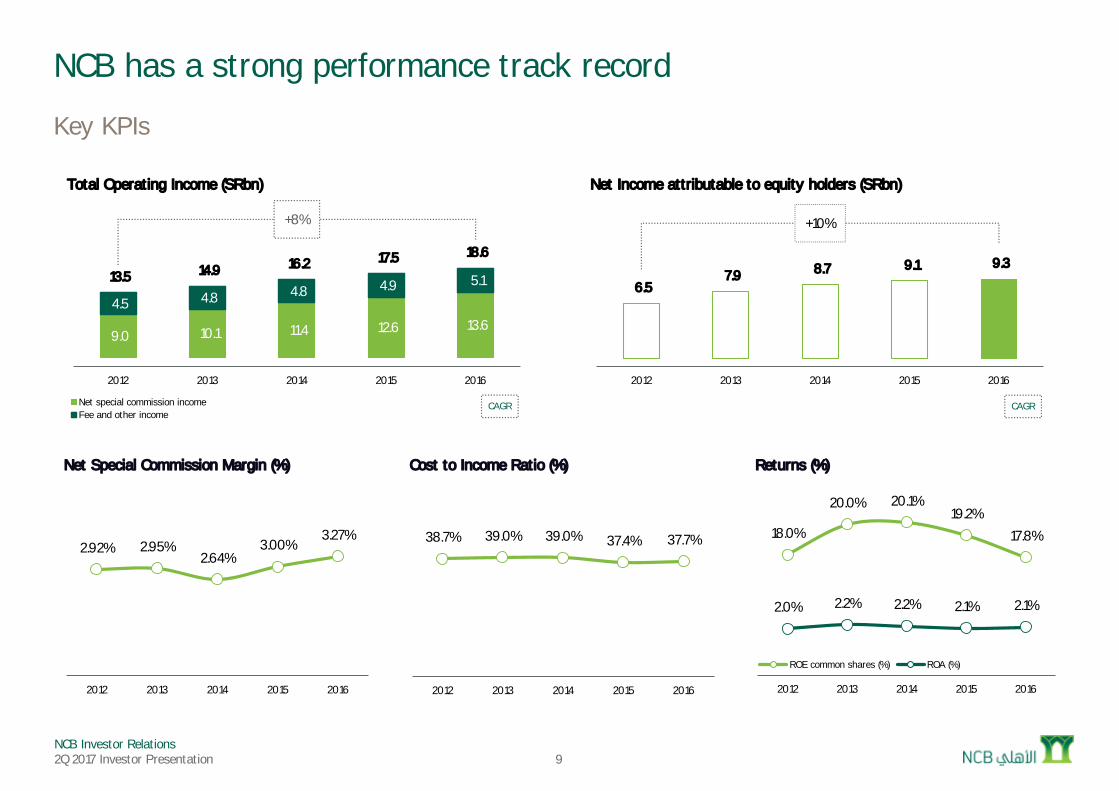
NCB has a strong performance track record
Key KPIs
9.0 10.1 11.4 12.6 13.6 4.5 4.8 4.8 4.9 5.1 13.5 14.9 16.2 17.5 18.6
+8%
0
5
10
15
20
25
30
2012 2013 2014 2015 2016
Total Operating Income (SRbn)
Net special commission incomeFee and other income
2.92% 2.95%2.64%
3.00%3.27%
0
0
0
0
0
0
2012 2013 2014 2015 2016
Net Special Commission Margin (%)
38.7% 39.0% 39.0% 37.4% 37.7%
0
0
0
0
0
1
1
2012 2013 2014 2015 2016
Cost to Income Ratio (%)
CAGR CAGR
6.5 7.9 8.7 9.1 9.3
+10%
0
2
4
6
8
10
12
14
16
18
2012 2013 2014 2015 2016
Net Income attributable to equity holders (SRbn)
18.0%
20.0% 20.1%19.2%
17.8%
2.0% 2.2% 2.2% 2.1% 2.1%
0.0%
1.0%
2.0%
3.0%
4.0%
5.0%
6.0%
7.0%
8.0%
0
0
0
0
0
0
0
2012 2013 2014 2015 2016
Returns (%)
ROE common shares (%) ROA (%)
NCB Investor Relations2Q 2017 Investor Presentation 10
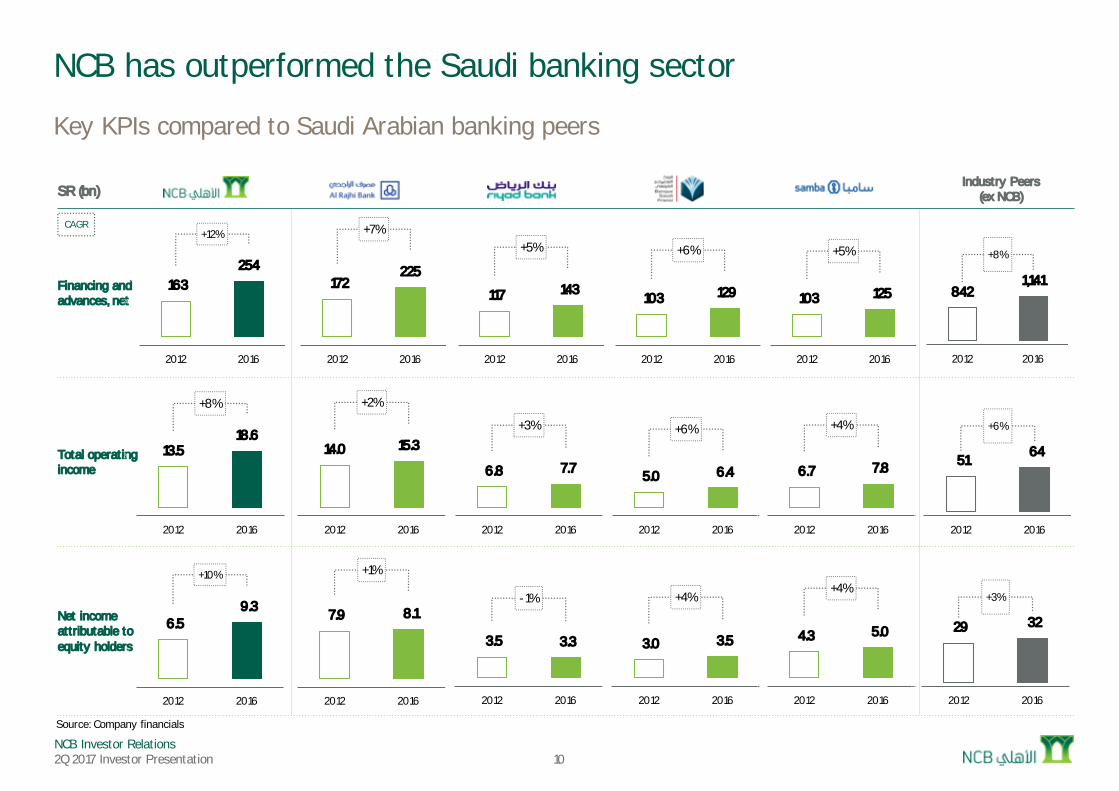
NCB has outperformed the Saudi banking sector
Key KPIs compared to Saudi Arabian banking peers
SR (bn)
Financing and advances, net
Total operating income
Net income attributable to equity holders
Source: Company financials
CAGR
163 254
+12%
0
100
200
300
400
500
2012 2016
172 225
+7%
0
100
200
300
400
500
2012 2016
117 143
+5%
0
100
200
300
400
500
2012 2016
103 129
+6%
0
100
200
300
400
500
2012 2016
103 125
+5%
0
100
200
300
400
500
2012 2016
13.5 18.6
+8%
0
5
10
15
20
25
30
35
40
2012 2016
14.0 15.3
+2%
0
5
10
15
20
25
30
35
40
2012 2016
6.8 7.7
+3%
0
5
10
15
20
25
30
35
40
2012 2016
5.0 6.4
+6%
0
5
10
15
20
25
30
35
40
2012 2016
6.7 7.8
+4%
0
5
10
15
20
25
30
35
40
2012 2016
7.9 8.1
+1%
0
2
4
6
8
10
12
14
16
18
20
2012 2016
3.5 3.3
-1%
0
2
4
6
8
10
12
14
16
18
20
2012 2016
3.0 3.5
+4%
0
2
4
6
8
10
12
14
16
18
20
2012 2016
4.3 5.0
+4%
0
2
4
6
8
10
12
14
16
18
20
2012 2016
6.5 9.3
+10%
0
2
4
6
8
10
12
14
16
18
20
2012 2016
842 1,141
+8%
0
500
1,000
1,500
2,000
2,500
2012 2016
51 64
+6%
0
20
40
60
80
100
120
140
2012 2016
29 32
+3%
0
10
20
30
40
50
60
70
2012 2016
Industry Peers(ex NCB)
NCB Investor Relations2Q 2017 Investor Presentation 11
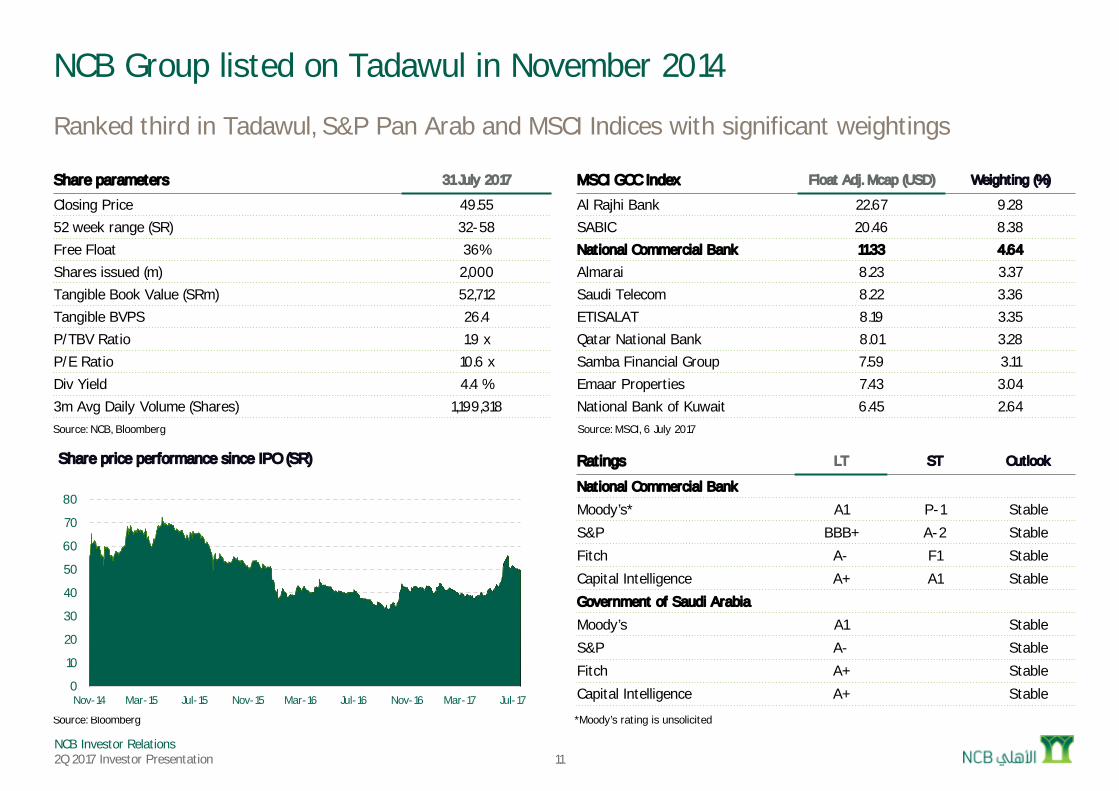
NCB Group listed on Tadawul in November 2014
Ranked third in Tadawul, S&P Pan Arab and MSCI Indices with significant weightings
Share parameters 31 July 2017
Closing Price 49.5552 week range (SR) 32-58Free Float 36%Shares issued (m) 2,000Tangible Book Value (SRm) 52,712Tangible BVPS 26.4P/TBV Ratio 1.9 xP/E Ratio 10.6 xDiv Yield 4.4 %3m Avg Daily Volume (Shares) 1,199,318
MSCI GCC Index Float Adj. Mcap (USD) Weighting (%)
Al Rajhi Bank 22.67 9.28SABIC 20.46 8.38National Commercial Bank 11.33 4.64
Almarai 8.23 3.37Saudi Telecom 8.22 3.36ETISALAT 8.19 3.35Qatar National Bank 8.01 3.28Samba Financial Group 7.59 3.11Emaar Properties 7.43 3.04National Bank of Kuwait 6.45 2.64
Ratings LT ST Outlook
National Commercial Bank
Moody’s* A1 P-1 Stable
S&P BBB+ A-2 Stable
Fitch A- F1 Stable
Capital Intelligence A+ A1 StableGovernment of Saudi Arabia
Moody’s A1 Stable
S&P A- Stable
Fitch A+ Stable
Capital Intelligence A+ Stable
*Moody’s rating is unsolicited
Source: MSCI, 6 July 2017
Source: Bloomberg
Source: NCB, Bloomberg
0
10
20
30
40
50
60
70
80
Nov-14 Mar-15 Jul-15 Nov-15 Mar-16 Jul-16 Nov-16 Mar-17 Jul-17
Share price performance since IPO (SR)
NCB Investor Relations2Q 2017 Investor Presentation
National Commercial Bank
Grow with KSA. Grow with NCB.
2Q 2017 Results
NCB Investor Relations2Q 2017 Investor Presentation 13
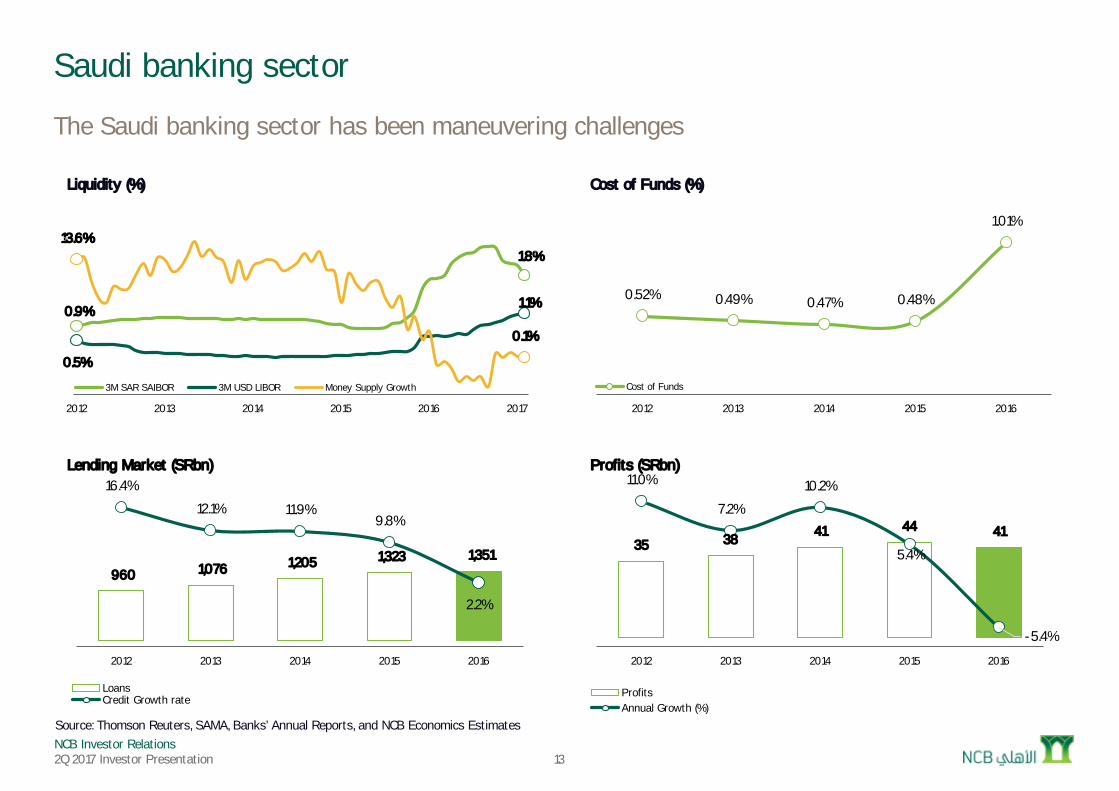
Saudi banking sector
The Saudi banking sector has been maneuvering challenges
0.9%
1.8%
0.5%
1.1%
13.6%
0.1%
-5.0%
0.0%
5.0%
10.0%
15.0%
20.0%
(0)
0
0
0
0
0
0
0
2012 2013 2014 2015 2016 2017
Liquidity (%)
3M SAR SAIBOR 3M USD LIBOR Money Supply Growth
35 38 41 44 41
11.0%
7.2%
10.2%
5.4%
-5.4%-8.0%
-6.0%
-4.0%
-2.0%
0.0%
2.0%
4.0%
6.0%
8.0%
10.0%
12.0%
0
10
20
30
40
50
60
70
2012 2013 2014 2015 2016
Profits (SRbn)
ProfitsAnnual Growth (%)
Source: Thomson Reuters, SAMA, Banks’ Annual Reports, and NCB Economics Estimates
0.52% 0.49% 0.47% 0.48%
1.01%
0
0
0
0
0
0
0
2012 2013 2014 2015 2016
Cost of Funds (%)
Cost of Funds
960 1,076 1,205 1,323 1,351
16.4%
12.1% 11.9%9.8%
2.2%
-10.0%
-5.0%
0.0%
5.0%
10.0%
15.0%
0
500
1,000
1,500
2,000
2,500
3,000
2012 2013 2014 2015 2016
Lending Market (SRbn)
LoansCredit Growth rate
NCB Investor Relations2Q 2017 Investor Presentation 14
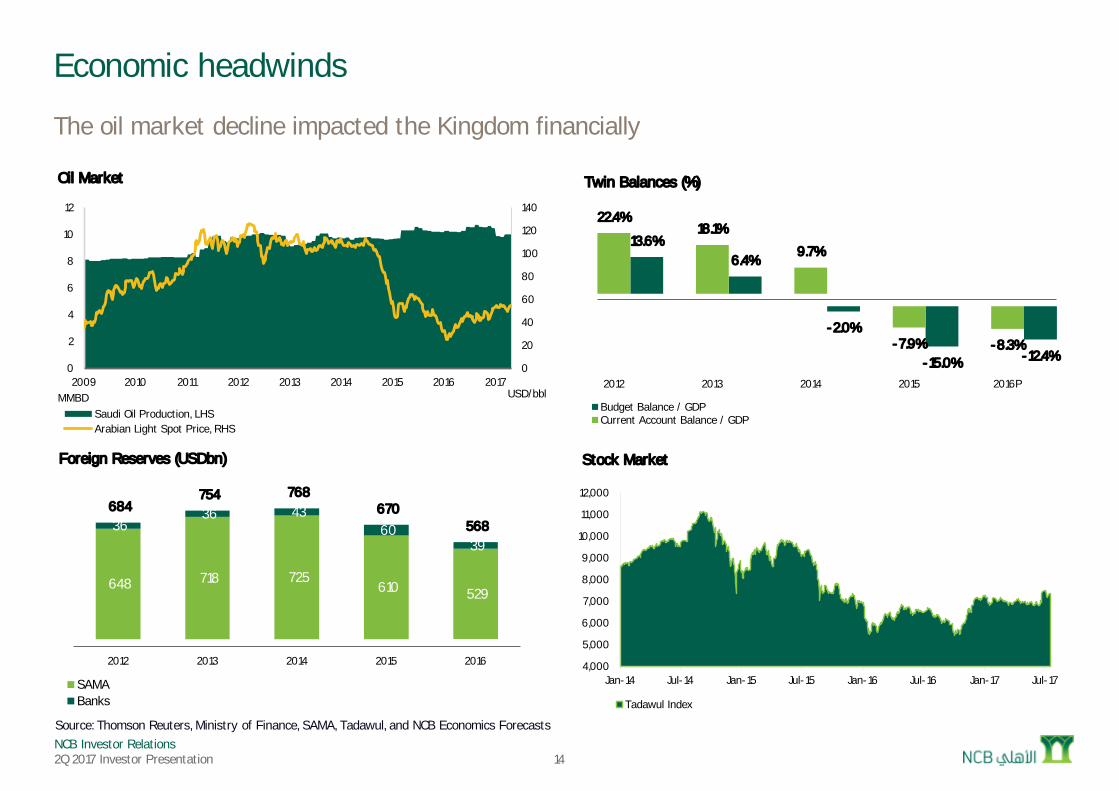
Economic headwinds
The oil market decline impacted the Kingdom financially
0
20
40
60
80
100
120
140
0
2
4
6
8
10
12
2009 2010 2011 2012 2013 2014 2015 2016 2017USD/bblMMBD
Oil Market
Saudi Oil Production, LHSArabian Light Spot Price, RHS
648 718 725 610 529
36 36 43
60 39
684 754 768
670 568
0
100
200
300
400
500
600
700
800
900
2012 2013 2014 2015 2016
Foreign Reserves (USDbn)
SAMABanks
4,000
5,000
6,000
7,000
8,000
9,000
10,000
11,000
12,000
Jan-14 Jul-14 Jan-15 Jul-15 Jan-16 Jul-16 Jan-17 Jul-17
Stock Market
Tadawul Index
Source: Thomson Reuters, Ministry of Finance, SAMA, Tadawul, and NCB Economics Forecasts
13.6%6.4%
-2.0%
-15.0% -12.4%
22.4%18.1%
9.7%
-7.9% -8.3%-25.0%
-15.0%
-5.0%
5.0%
15.0%
25.0%
2012 2013 2014 2015 2016P
Twin Balances (%)
Budget Balance / GDPCurrent Account Balance / GDP
NCB Investor Relations2Q 2017 Investor Presentation 15
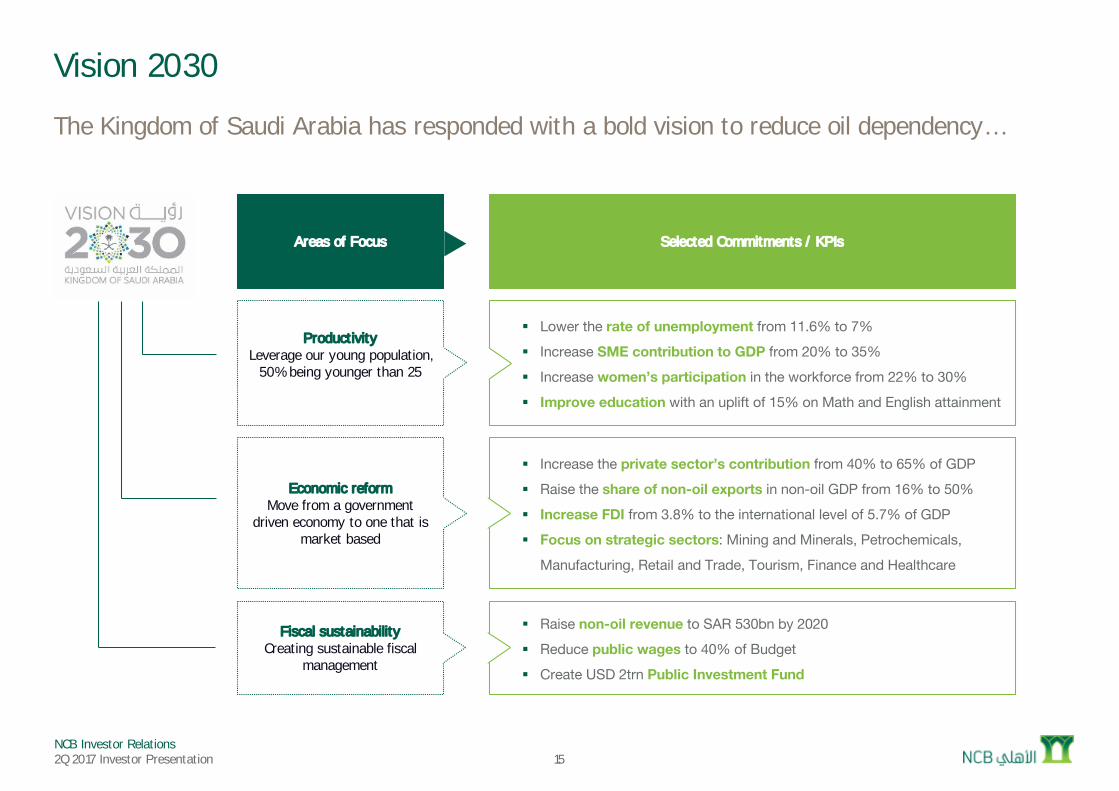
Vision 2030
The Kingdom of Saudi Arabia has responded with a bold vision to reduce oil dependency…
Economic reformMove from a government
driven economy to one that is market based
§ Increase the private sector’s contribution from 40% to 65% of GDP§ Raise the share of non-oil exports in non-oil GDP from 16% to 50%§ Increase FDI from 3.8% to the international level of 5.7% of GDP§ Focus on strategic sectors: Mining and Minerals, Petrochemicals,
Manufacturing, Retail and Trade, Tourism, Finance and Healthcare
Fiscal sustainabilityCreating sustainable fiscal
management
§ Raise non-oil revenue to SAR 530bn by 2020§ Reduce public wages to 40% of Budget§ Create USD 2trn Public Investment Fund
ProductivityLeverage our young population,
50% being younger than 25
§ Lower the rate of unemployment from 11.6% to 7%§ Increase SME contribution to GDP from 20% to 35%§ Increase women’s participation in the workforce from 22% to 30%§ Improve education with an uplift of 15% on Math and English attainment
Areas of Focus Selected Commitments / KPIs
NCB Investor Relations2Q 2017 Investor Presentation 16
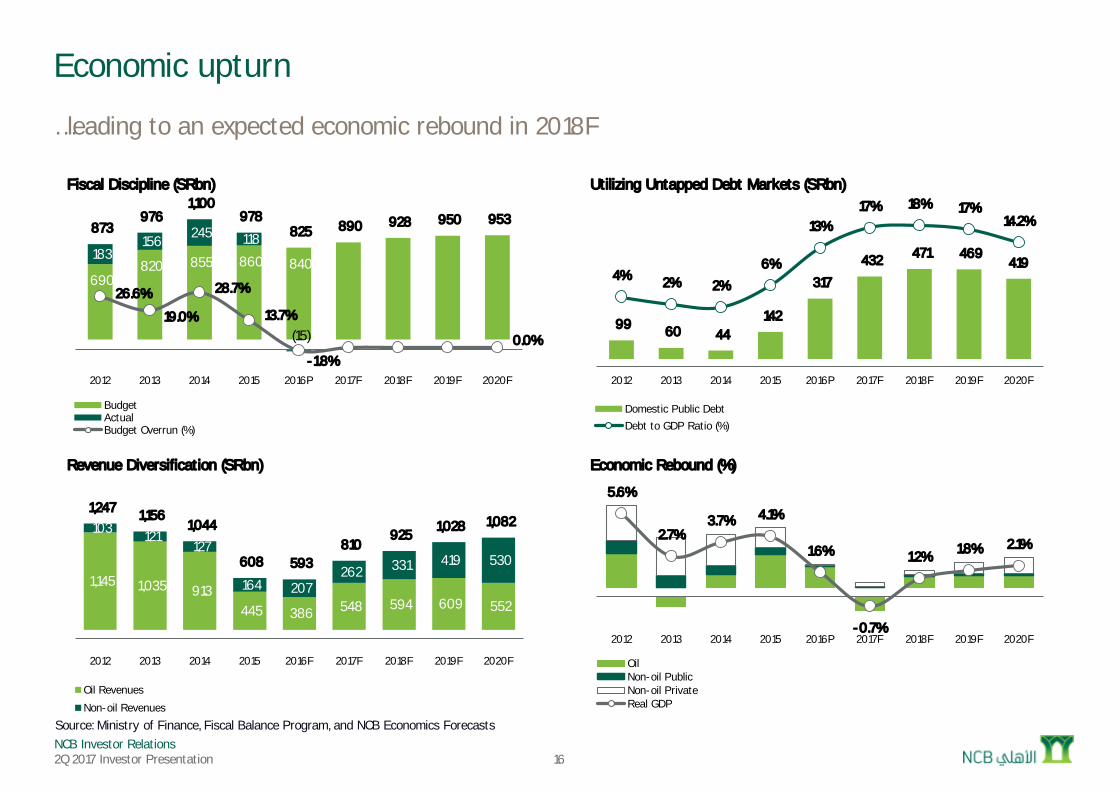
Economic upturn
…leading to an expected economic rebound in 2018F
Source: Ministry of Finance, Fiscal Balance Program, and NCB Economics Forecasts
99 60 44 142
317
432 471 469 419
4% 2% 2%
6%
13%17% 18% 17%
14.2%
-10%
-5%
0%
5%
10%
15%
20%
0
100
200
300
400
500
600
700
800
2012 2013 2014 2015 2016P 2017F 2018F 2019F 2020F
Utilizing Untapped Debt Markets (SRbn)
Domestic Public DebtDebt to GDP Ratio (%)
(
1,145 1,035 913 445 386 548 594 609 552
103 121 127
164 207 262 331 419 530
1,247 1,156 1,044
608 593 810
925 1,028 1,082
(100)
100
300
500
700
900
1,100
1,300
1,500
1,700
2012 2013 2014 2015 2016F 2017F 2018F 2019F 2020F
Revenue Diversification (SRbn)
Oil Revenues
Non-oil Revenues
690 820 855 860 840
183 156 245 118
(15)
873 976
1,100 978
825 890 928 950 953
26.6%
19.0%
28.7%
13.7%
-1.8%0.0%
-10.0%
0.0%
10.0%
20.0%
30.0%
40.0%
50.0%
60.0%
70.0%
(150)
50
250
450
650
850
1,050
1,250
2012 2013 2014 2015 2016P 2017F 2018F 2019F 2020F
Fiscal Discipline (SRbn)
BudgetActualBudget Overrun (%)
5.6%
2.7%3.7% 4.1%
1.6%
-0.7%
1.2% 1.8% 2.1%
(0)
(0)
0
0
0
0
0
0
0
0
2012 2013 2014 2015 2016P 2017F 2018F 2019F 2020F
Economic Rebound (%)
OilNon-oil PublicNon-oil PrivateReal GDP
NCB Investor Relations2Q 2017 Investor Presentation 17
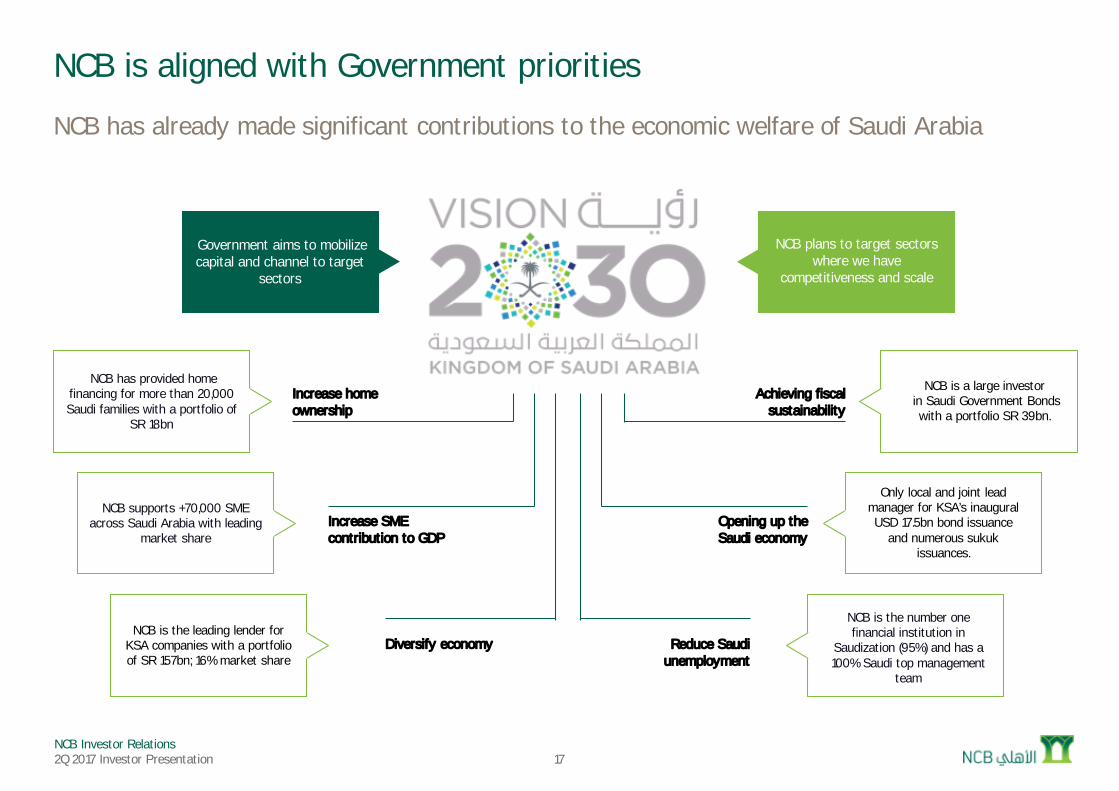
NCB is aligned with Government priorities
NCB has already made significant contributions to the economic welfare of Saudi Arabia
Government aims to mobilize capital and channel to target
sectors
NCB plans to target sectors where we have
competitiveness and scale
NCB supports +70,000 SME across Saudi Arabia with leading
market share
Only local and joint lead manager for KSA’s inaugural USD 17.5bn bond issuance
and numerous sukukissuances.
NCB is a large investorin Saudi Government Bonds with a portfolio SR 39bn.
NCB has provided home financing for more than 20,000 Saudi families with a portfolio of
SR 18bn
Achieving fiscalsustainability
Opening up the Saudi economy
Increase SME contribution to GDP
Increase homeownership
Reduce Saudi unemployment
Diversify economyNCB is the leading lender for
KSA companies with a portfolio of SR 157bn; 16% market share
NCB is the number one financial institution in
Saudization (95%) and has a 100% Saudi top management
team
NCB Investor Relations2Q 2017 Investor Presentation
National Commercial Bank
Strategic overview
2Q 2017 Results
NCB Investor Relations2Q 2017 Investor Presentation 19
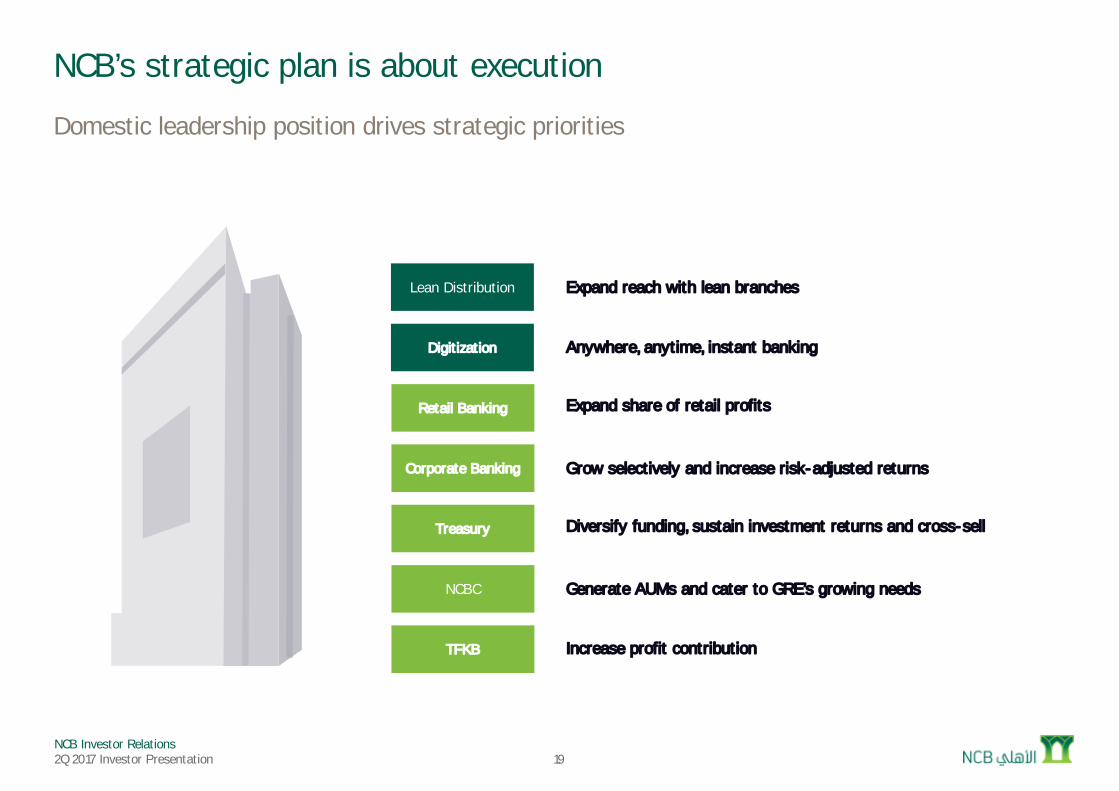
NCB’s strategic plan is about execution
Domestic leadership position drives strategic priorities
Retail Banking Expand share of retail profits
Corporate Banking Grow selectively and increase risk-adjusted returns
TFKB Increase profit contribution
Treasury Diversify funding, sustain investment returns and cross-sell
NCBC Generate AUMs and cater to GRE’s growing needs
Lean Distribution
Digitization
Expand reach with lean branches
Anywhere, anytime, instant banking
NCB Investor Relations2Q 2017 Investor Presentation 20
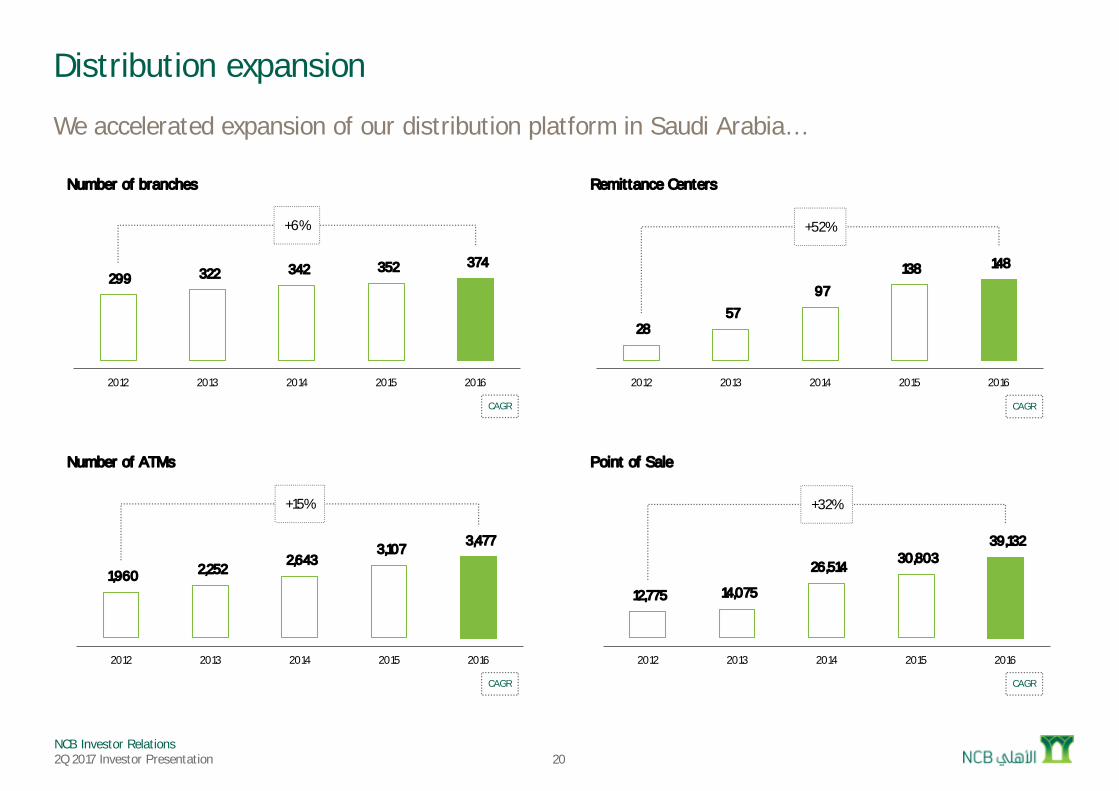
Distribution expansion
We accelerated expansion of our distribution platform in Saudi Arabia…
299 322 342 352 374
+6%
0
100
200
300
400
500
600
700
2012 2013 2014 2015 2016
Number of branches
28 57
97
138 148
+52%
0
50
100
150
200
250
2012 2013 2014 2015 2016
Remittance Centers
1,960 2,252 2,643
3,107 3,477
+15%
0
1,000
2,000
3,000
4,000
5,000
6,000
2012 2013 2014 2015 2016
Number of ATMs
12,775 14,075
26,514 30,803
39,132
+32%
0
10,000
20,000
30,000
40,000
50,000
60,000
70,000
2012 2013 2014 2015 2016
Point of Sale
CAGR CAGR
CAGR CAGR
NCB Investor Relations2Q 2017 Investor Presentation
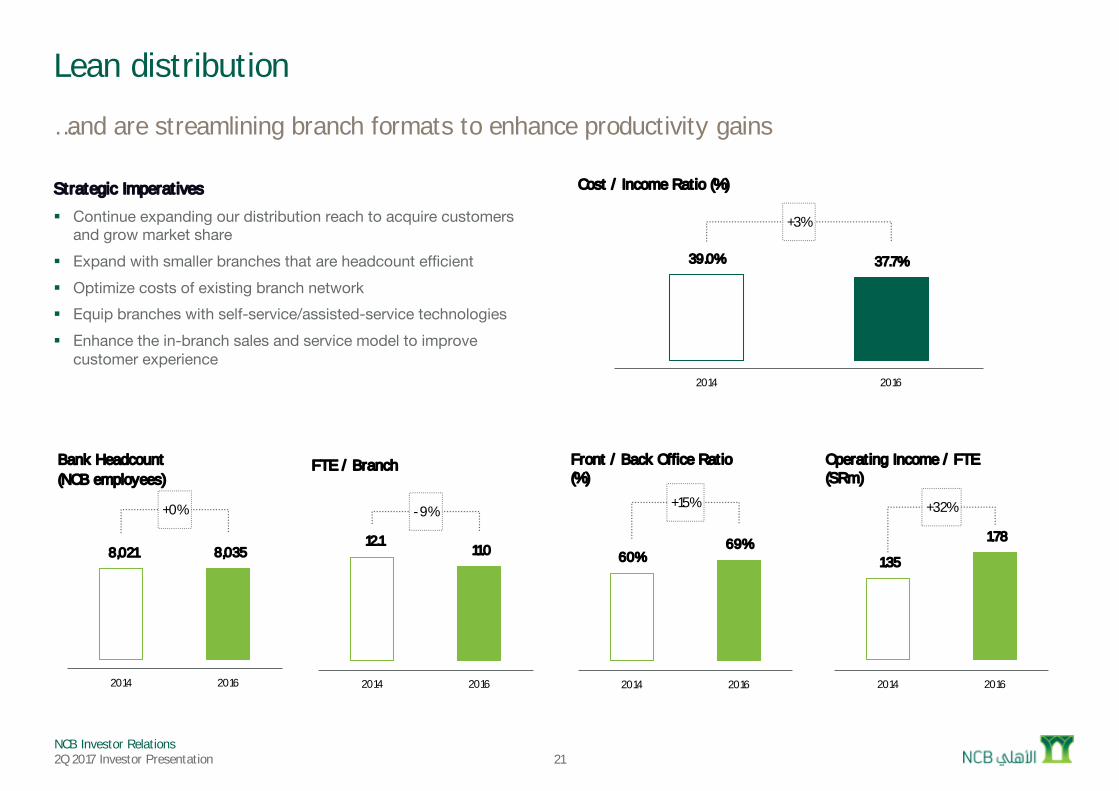
60%69%
+15%
0
0
0
1
1
1
1
2014 2016
Front / Back Office Ratio (%)
21
Lean distribution
…and are streamlining branch formats to enhance productivity gains
Strategic Imperatives
§ Continue expanding our distribution reach to acquire customers and grow market share
§ Expand with smaller branches that are headcount efficient§ Optimize costs of existing branch network§ Equip branches with self-service/assisted-service technologies§ Enhance the in-branch sales and service model to improve
customer experience
39.0% 37.7%
+3%
0
0
0
0
0
1
1
1
2014 2016
Cost / Income Ratio (%)
1.35
1.78
+32%
0
1
1
2
2
3
2014 2016
Operating Income / FTE (SRm)
12.1 11.0
-9%
0
2
4
6
8
10
12
14
16
18
20
2014 2016
FTE / Branch
8,021 8,035
+0%
(1,000)
1,000
3,000
5,000
7,000
9,000
11,000
13,000
15,000
2014 2016
Bank Headcount (NCB employees)
NCB Investor Relations2Q 2017 Investor Presentation 22
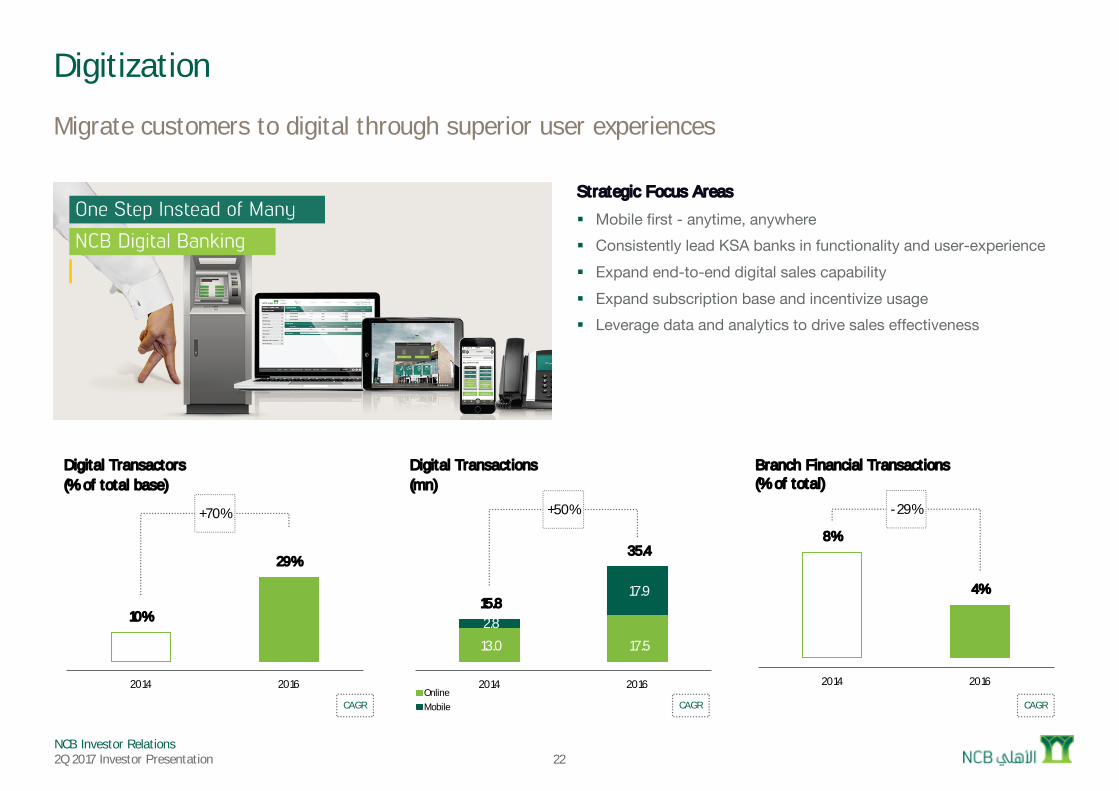
Digitization
Migrate customers to digital through superior user experiences
Strategic Focus Areas
§ Mobile first - anytime, anywhere§ Consistently lead KSA banks in functionality and user-experience § Expand end-to-end digital sales capability§ Expand subscription base and incentivize usage§ Leverage data and analytics to drive sales effectiveness
10%
29%
+70%
0
0
0
0
0
1
1
2014 2016
Digital Transactors(% of total base)
CAGR CAGR CAGR
13.0 17.5
2.8
17.9 15.8
35.4
+50%
0
10
20
30
40
50
60
2014 2016
Digital Transactions (mn)
OnlineMobile
8%
4%
-29%
0
0
0
0
0
0
0
2014 2016
Branch Financial Transactions (% of total)
NCB Investor Relations2Q 2017 Investor Presentation
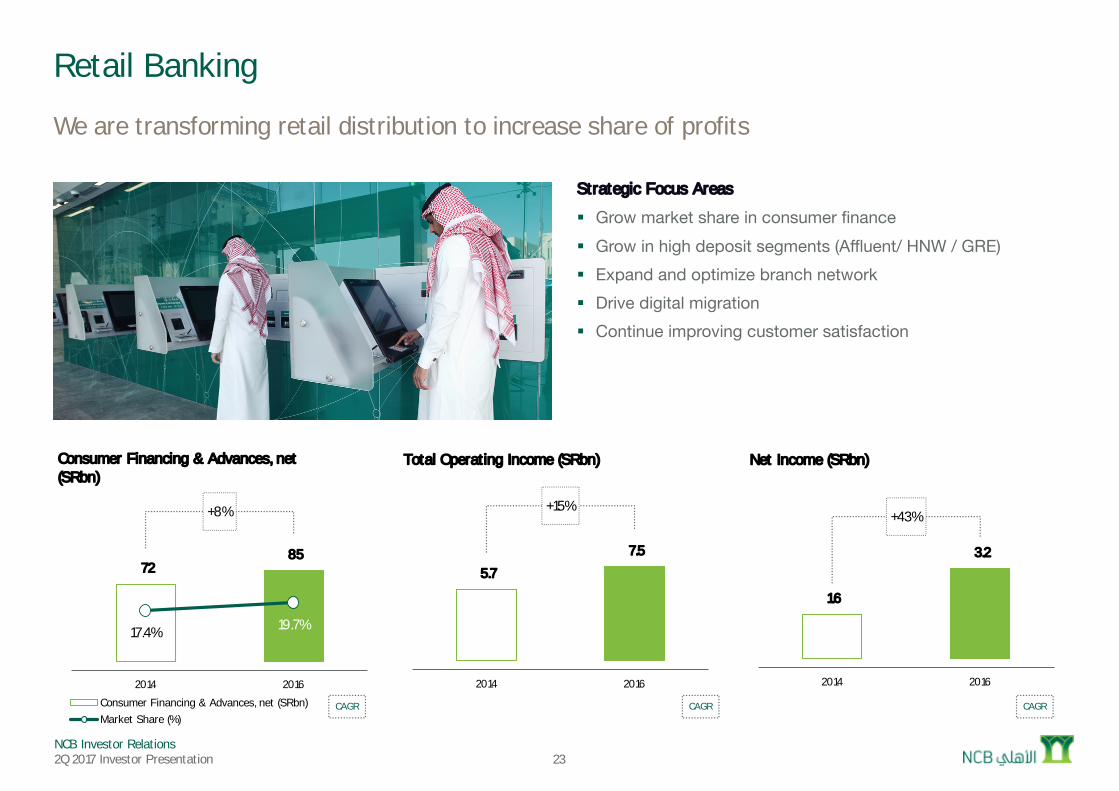
Retail Banking
We are transforming retail distribution to increase share of profits
Strategic Focus Areas
§ Grow market share in consumer finance§ Grow in high deposit segments (Affluent/ HNW / GRE) § Expand and optimize branch network§ Drive digital migration§ Continue improving customer satisfaction
CAGR CAGR CAGR
5.7
7.5
+15%
0
2
4
6
8
10
12
14
2014 2016
Total Operating Income (SRbn)
1.6
3.2
+43%
0
1
2
3
4
5
6
2014 2016
Net Income (SRbn)
23
72 85
17.4% 19.7%
+8%
0.0%
5.0%
10.0%
15.0%
20.0%
25.0%
30.0%
35.0%
40.0%
45.0%
50.0%
0
20
40
60
80
100
120
140
160
2014 2016
Consumer Financing & Advances, net (SRbn)
Consumer Financing & Advances, net (SRbn)Market Share (%)
NCB Investor Relations2Q 2017 Investor Presentation 24
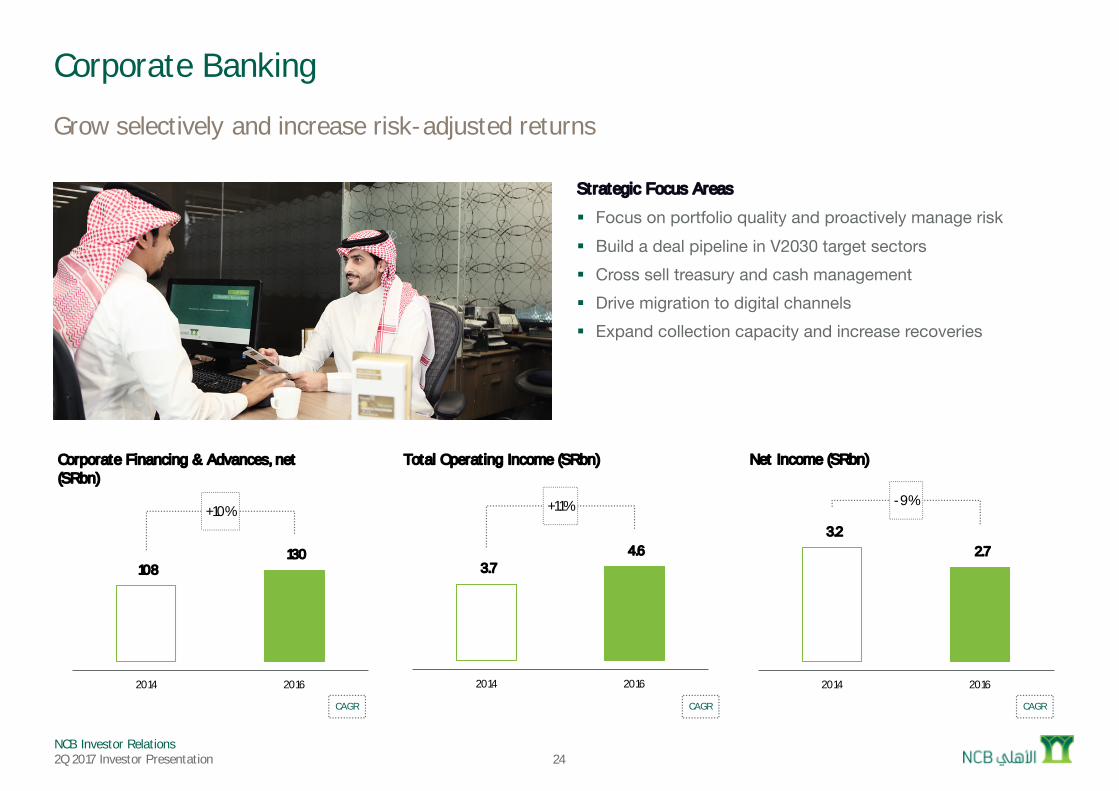
Corporate Banking
Grow selectively and increase risk-adjusted returns
Strategic Focus Areas
§ Focus on portfolio quality and proactively manage risk§ Build a deal pipeline in V2030 target sectors § Cross sell treasury and cash management§ Drive migration to digital channels§ Expand collection capacity and increase recoveries
CAGR CAGR CAGR
108 130
+10%
0
50
100
150
200
250
2014 2016
Corporate Financing & Advances, net (SRbn)
3.7 4.6
+11%
0
1
2
3
4
5
6
7
8
2014 2016
Total Operating Income (SRbn)
3.2 2.7
-9%
0
1
1
2
2
3
3
4
4
5
5
2014 2016
Net Income (SRbn)
NCB Investor Relations2Q 2017 Investor Presentation
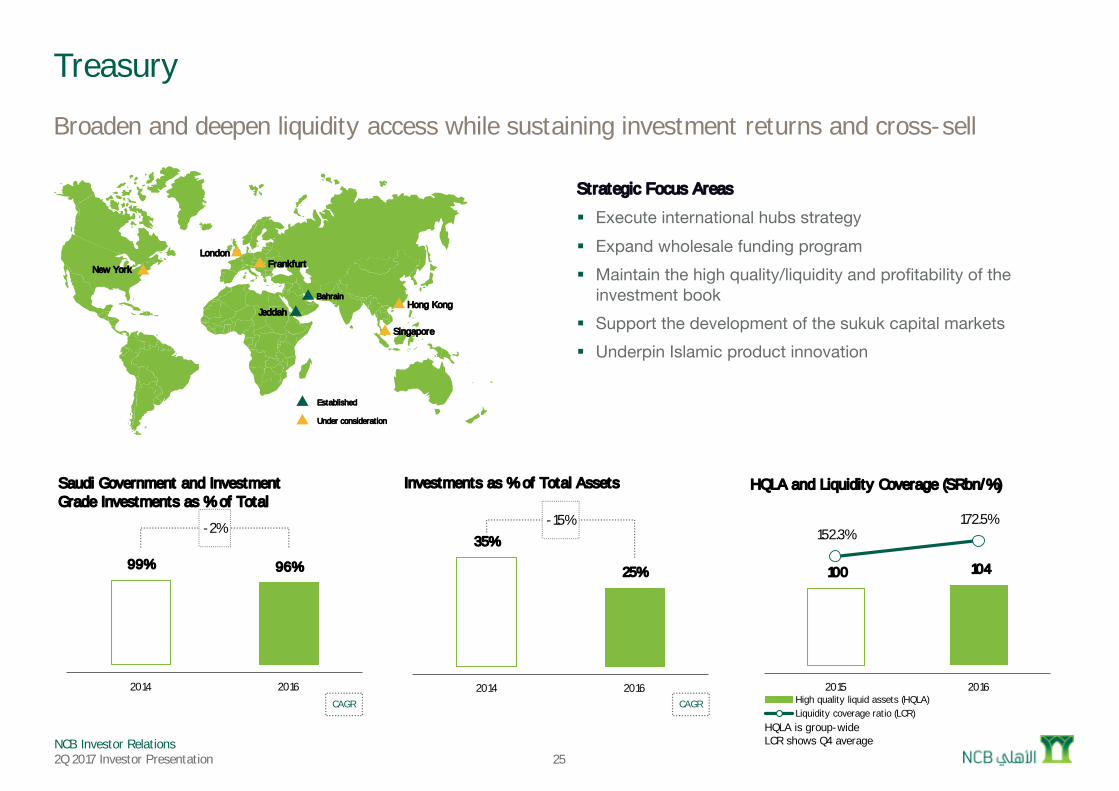
35%
25%
-15%
0
0
0
0
0
0
0
0
0
0
1
2014 2016
Investments as % of Total Assets
25
Treasury
Broaden and deepen liquidity access while sustaining investment returns and cross-sell
Strategic Focus Areas
§ Execute international hubs strategy § Expand wholesale funding program§ Maintain the high quality/liquidity and profitability of the
investment book§ Support the development of the sukuk capital markets § Underpin Islamic product innovation
100 104
152.3%172.5%
0.0%
20.0%
40.0%
60.0%
80.0%
100.0%
120.0%
140.0%
160.0%
180.0%
200.0%
0
20
40
60
80
100
120
140
160
180
200
2015 2016
HQLA and Liquidity Coverage (SRbn/%)
High quality liquid assets (HQLA)Liquidity coverage ratio (LCR)
London
Bahrain
Singapore
Jeddah
Established
Under consideration
CAGR CAGR
HQLA is group-wideLCR shows Q4 average
FrankfurtNew York
Hong Kong
99% 96%
-2%
0
0
0
1
1
1
1
1
2
2
2014 2016
Saudi Government and Investment Grade Investments as % of Total
NCB Investor Relations2Q 2017 Investor Presentation 26
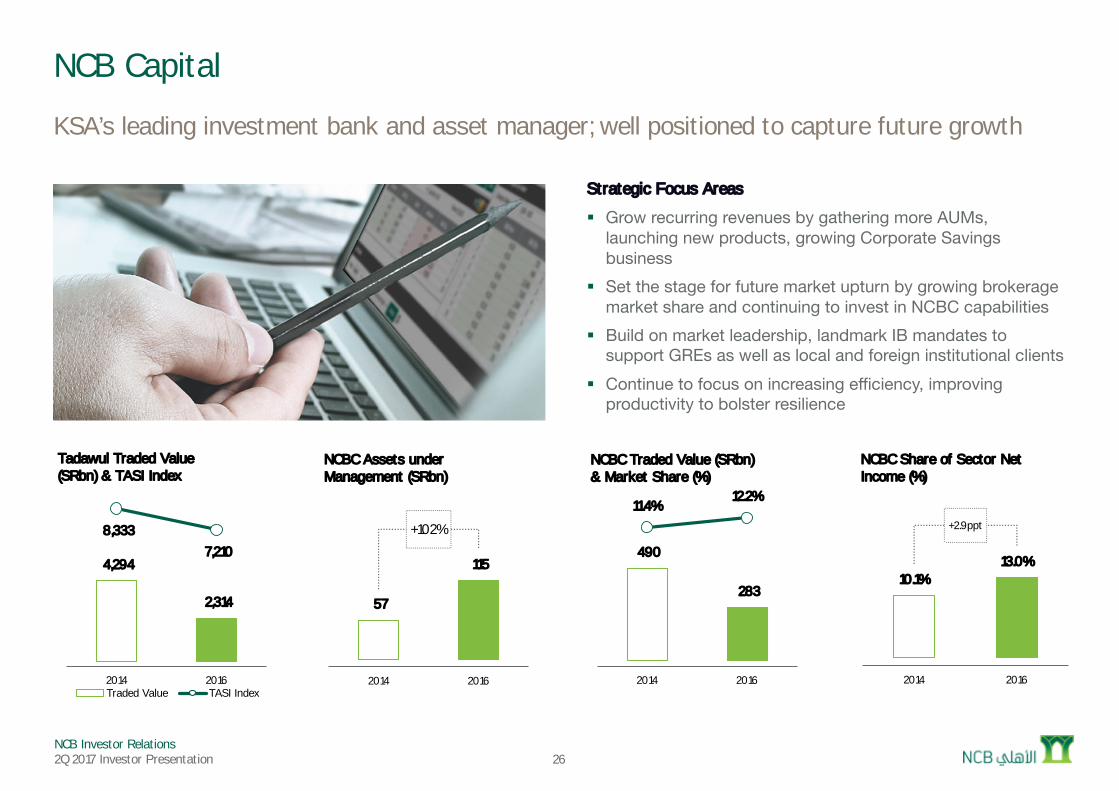
NCB Capital
KSA’s leading investment bank and asset manager; well positioned to capture future growth
Strategic Focus Areas
§ Grow recurring revenues by gathering more AUMs, launching new products, growing Corporate Savings business
§ Set the stage for future market upturn by growing brokerage market share and continuing to invest in NCBC capabilities
§ Build on market leadership, landmark IB mandates to support GREs as well as local and foreign institutional clients
§ Continue to focus on increasing efficiency, improving productivity to bolster resilience
57
115
+102%
0
50
100
150
200
250
2014 2016
NCBC Assets under Management (SRbn)
4,294
2,314
8,333 7,210
0
1,000
2,000
3,000
4,000
5,000
6,000
7,000
8,000
9,000
2014 2016
Tadawul Traded Value (SRbn) & TASI Index
Traded Value TASI Index
490
283
11.4%12.2%
0.0%
2.0%
4.0%
6.0%
8.0%
10.0%
12.0%
14.0%
0
100
200
300
400
500
600
700
800
900
2014 2016
NCBC Traded Value (SRbn) & Market Share (%)
10.1%13.0%
+2.9ppt
0
0
0
0
0
0
2014 2016
NCBC Share of Sector Net Income (%)
NCB Investor Relations2Q 2017 Investor Presentation
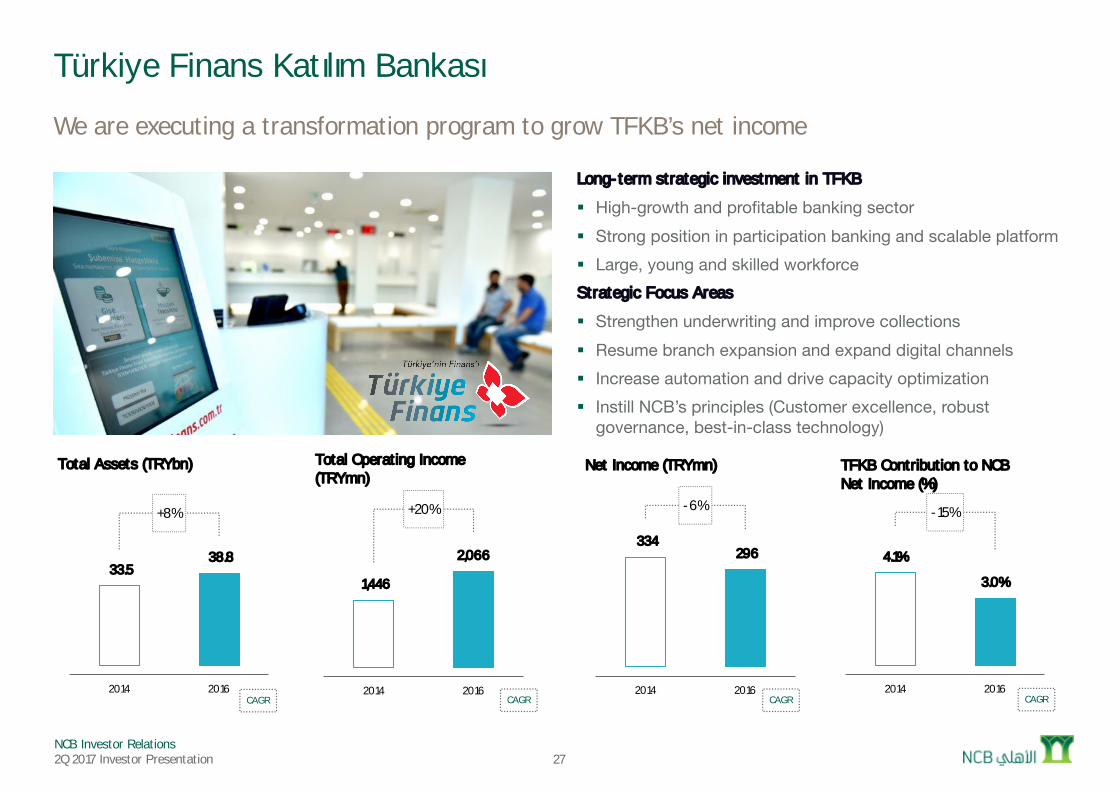
334 296
-6%
0
100
200
300
400
500
2014 2016
Net Income (TRYmn)
33.5 38.8
+8%
0
10
20
30
40
50
60
70
2014 2016
Total Assets (TRYbn)
27
Türkiye Finans Katılım Bankası
We are executing a transformation program to grow TFKB’s net income
Long-term strategic investment in TFKB
§ High-growth and profitable banking sector§ Strong position in participation banking and scalable platform§ Large, young and skilled workforceStrategic Focus Areas
§ Strengthen underwriting and improve collections§ Resume branch expansion and expand digital channels § Increase automation and drive capacity optimization § Instill NCB’s principles (Customer excellence, robust
governance, best-in-class technology)
CAGRCAGRCAGRCAGR
4.1%
3.0%
-15%
0
0
0
0
0
0
0
0
0
2014 2016
TFKB Contribution to NCB Net Income (%)
1,446
2,066
+20%
0
500
1,000
1,500
2,000
2,500
3,000
3,500
2014 2016
Total Operating Income (TRYmn)
NCB Investor Relations2Q 2017 Investor Presentation
National Commercial Bank
Financial Results Highlights
2Q 2017 Results
NCB Investor Relations2Q 2017 Investor Presentation 29
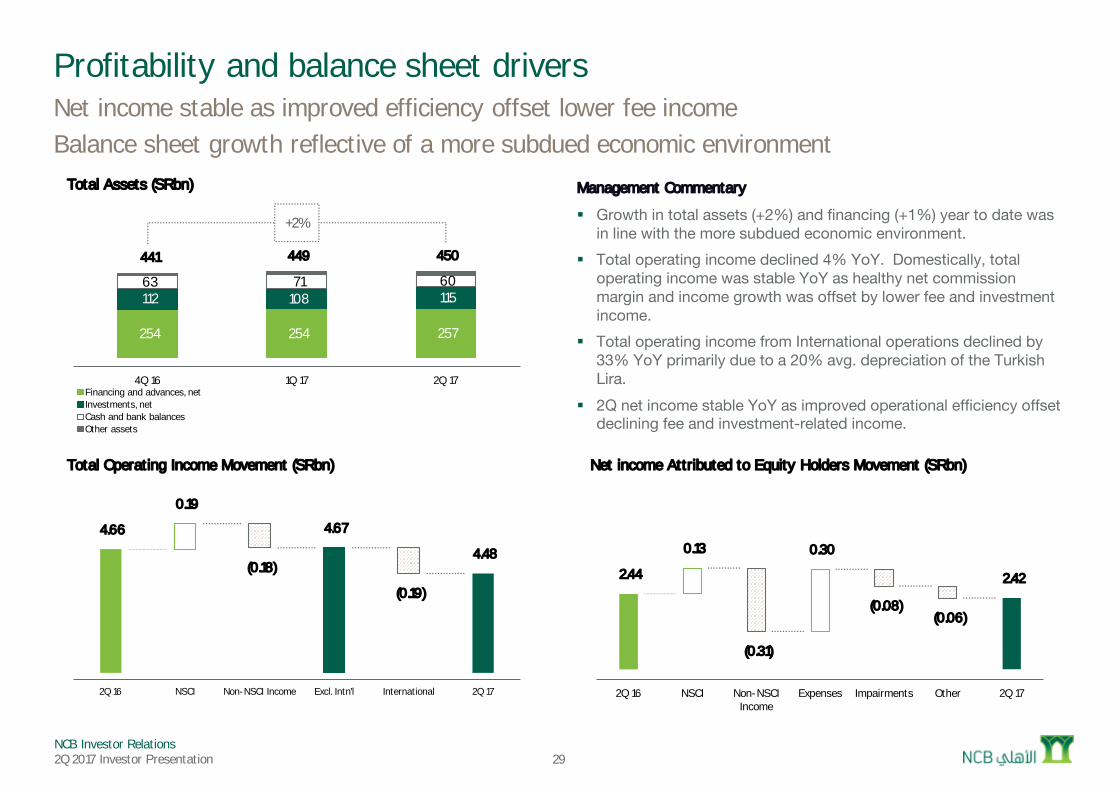
Profitability and balance sheet driversNet income stable as improved efficiency offset lower fee incomeBalance sheet growth reflective of a more subdued economic environment
Management Commentary
§ Growth in total assets (+2%) and financing (+1%) year to date was in line with the more subdued economic environment.
§ Total operating income declined 4% YoY. Domestically, total operating income was stable YoY as healthy net commission margin and income growth was offset by lower fee and investment income.
§ Total operating income from International operations declined by 33% YoY primarily due to a 20% avg. depreciation of the Turkish Lira.
§ 2Q net income stable YoY as improved operational efficiency offset declining fee and investment-related income.
254 254 257
112 108 115 63 71 60
441 449 450
+2%
0
100
200
300
400
500
600
700
800
4Q 16 1Q 17 2Q 17
Total Assets (SRbn)
Financing and advances, netInvestments, netCash and bank balancesOther assets
2.44
0.13
(0.31)
0.30
(0.08)(0.06)
2.42
0
0
0
0
0
1
1
1
1
1
2Q 16 NSCI Non-NSCI Income
Expenses Impairments Other 2Q 17
Net income Attributed to Equity Holders Movement (SRbn)
4.66
0.19
(0.18)
4.67
(0.19)
4.48
0
0
0
1
1
1
1
1
2Q 16 NSCI Non-NSCI Income Excl. Intn'l International 2Q 17
Total Operating Income Movement (SRbn)
NCB Investor Relations2Q 2017 Investor Presentation
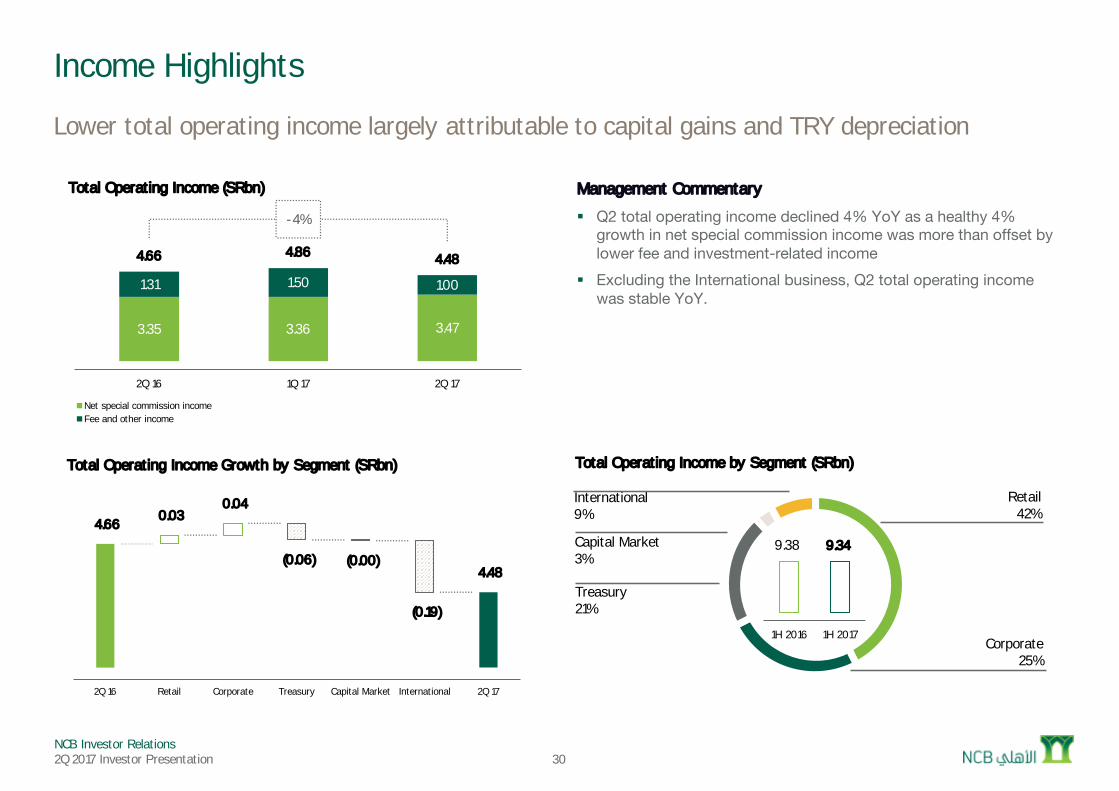
Retail42%
Corporate25%
Treasury21%
Capital Market3%
International9%
Total Operating Income by Segment (SRbn)
30
Income Highlights
Management Commentary
§ Q2 total operating income declined 4% YoY as a healthy 4% growth in net special commission income was more than offset by lower fee and investment-related income
§ Excluding the International business, Q2 total operating income was stable YoY.
Lower total operating income largely attributable to capital gains and TRY depreciation
3.35 3.36 3.47
1.31 1.50 1.00
4.66 4.86 4.48
-4%
0
1
2
3
4
5
6
7
8
2Q 16 1Q 17 2Q 17
Total Operating Income (SRbn)
Net special commission incomeFee and other income
9.38 9.34
0
2
4
6
8
10
12
14
1H 2016 1H 2017
4.66 0.03
(0.06)
0.04
(0.00)
(0.19)
4.48
0
0
0
0
0
1
1
1
2Q 16 Retail Corporate Treasury Capital Market International 2Q 17
Total Operating Income Growth by Segment (SRbn)
NCB Investor Relations2Q 2017 Investor Presentation 31
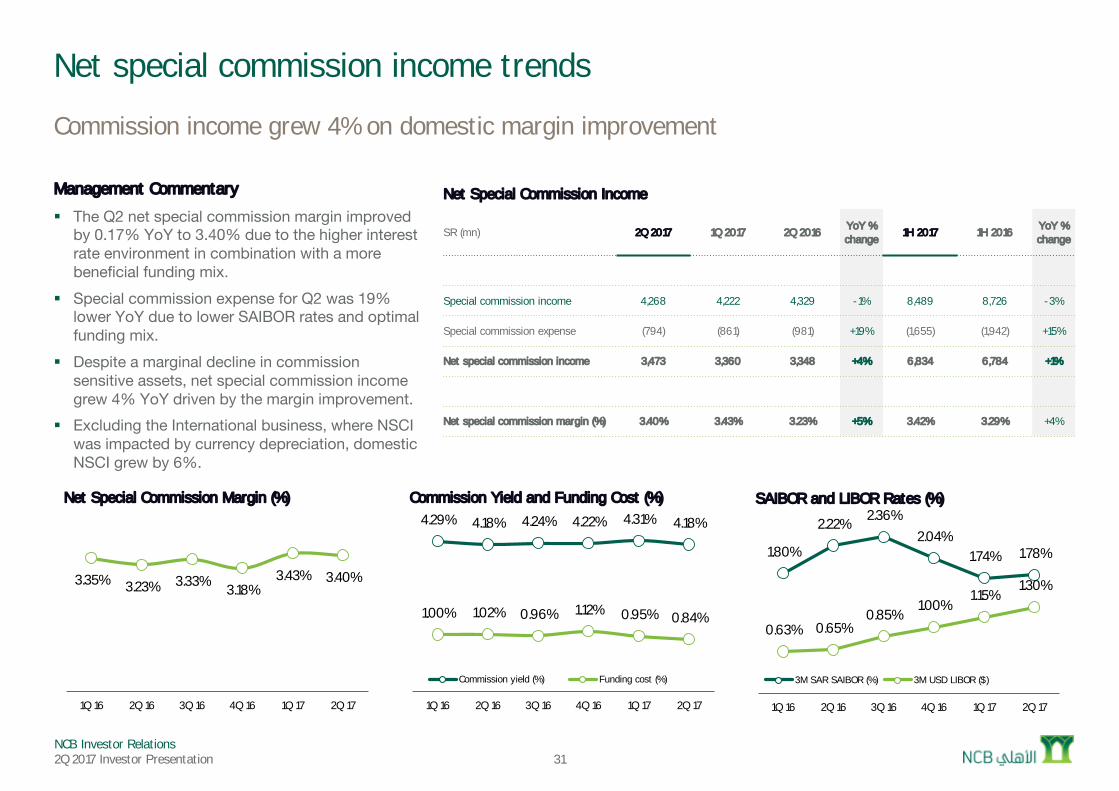
Net special commission income trends
Commission income grew 4% on domestic margin improvement
Management Commentary
§ The Q2 net special commission margin improved by 0.17% YoY to 3.40% due to the higher interest rate environment in combination with a more beneficial funding mix.
§ Special commission expense for Q2 was 19% lower YoY due to lower SAIBOR rates and optimal funding mix.
§ Despite a marginal decline in commission sensitive assets, net special commission income grew 4% YoY driven by the margin improvement.
§ Excluding the International business, where NSCI was impacted by currency depreciation, domestic NSCI grew by 6%.
Net Special Commission Income
SR (mn) 2Q 2017 1Q 2017 2Q 2016 YoY % change
1H 2017 1H 2016 YoY % change
Special commission income 4,268 4,222 4,329 -1% 8,489 8,726 -3%
Special commission expense (794) (861) (981) +19% (1,655) (1,942) +15%
Net special commission income 3,473 3,360 3,348 +4% 6,834 6,784 +1%
Net special commission margin (%) 3.40% 3.43% 3.23% +5% 3.42% 3.29% +4%
4.29% 4.18% 4.24% 4.22% 4.31% 4.18%
1.00% 1.02% 0.96% 1.12% 0.95% 0.84%
(0)
0
0
0
0
0
0
1Q 16 2Q 16 3Q 16 4Q 16 1Q 17 2Q 17
Commission Yield and Funding Cost (%)
Commission yield (%) Funding cost (%)
3.35% 3.23% 3.33% 3.18%3.43% 3.40%
0
0
0
0
0
0
0
1Q 16 2Q 16 3Q 16 4Q 16 1Q 17 2Q 17
Net Special Commission Margin (%)
1.80%
2.22% 2.36%2.04%
1.74% 1.78%
0.63% 0.65%0.85%
1.00%1.15%
1.30%
0
0
0
0
0
0
1Q 16 2Q 16 3Q 16 4Q 16 1Q 17 2Q 17
SAIBOR and LIBOR Rates (%)
3M SAR SAIBOR (%) 3M USD LIBOR ($)
NCB Investor Relations2Q 2017 Investor Presentation 32
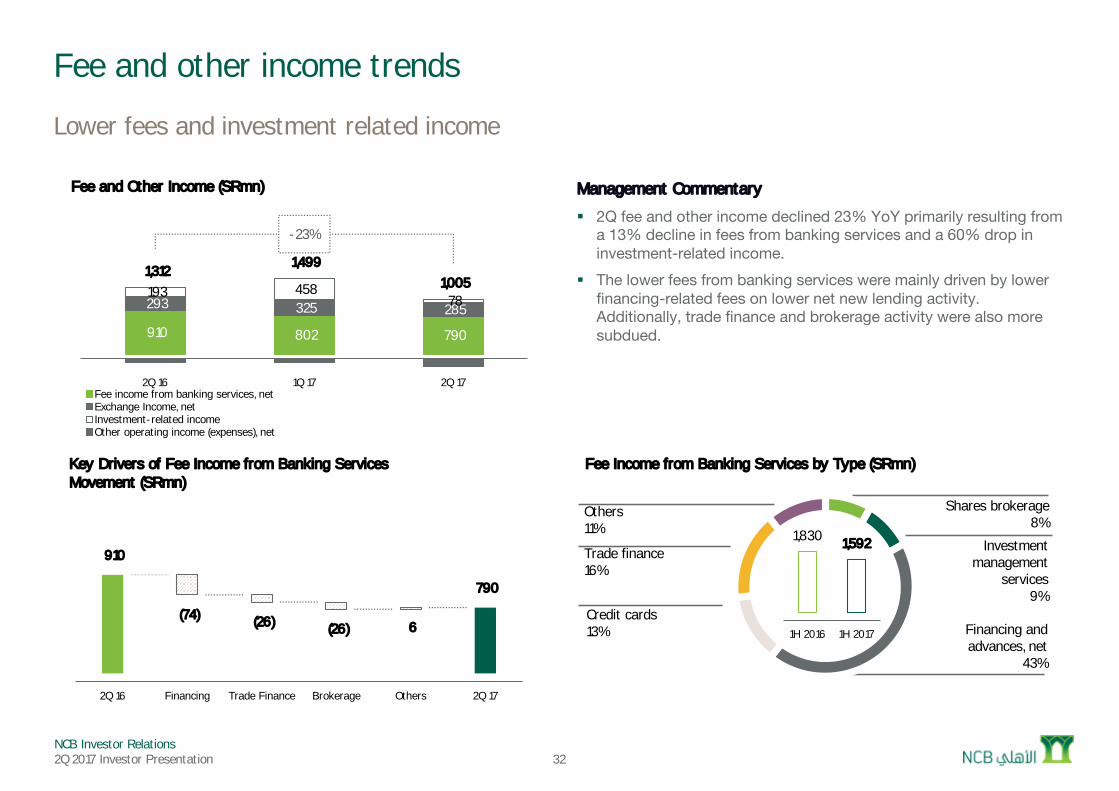
Fee and other income trends
Management Commentary
§ 2Q fee and other income declined 23% YoY primarily resulting from a 13% decline in fees from banking services and a 60% drop in investment-related income.
§ The lower fees from banking services were mainly driven by lower financing-related fees on lower net new lending activity. Additionally, trade finance and brokerage activity were also more subdued.
Lower fees and investment related income
910 802 790
293 325 285 193 458
78
1,312 1,499
1,005
-23%
(200)
300
800
1,300
1,800
2,300
2,800
2Q 16 1Q 17 2Q 17
Fee and Other Income (SRmn)
Fee income from banking services, netExchange Income, netInvestment-related incomeOther operating income (expenses), net
910
(74) (26) (26) 6
790
0
100
200
300
400
500
600
700
2Q 16 Financing Trade Finance Brokerage Others 2Q 17
Key Drivers of Fee Income from Banking Services Movement (SRmn)
Shares brokerage8%
Investment management
services9%
Financing and advances, net
43%
Credit cards13%
Trade finance16%
Others11%
Fee Income from Banking Services by Type (SRmn)
1,830 1,592
0
500
1,000
1,500
2,000
2,500
1H 2016 1H 2017
NCB Investor Relations2Q 2017 Investor Presentation 33
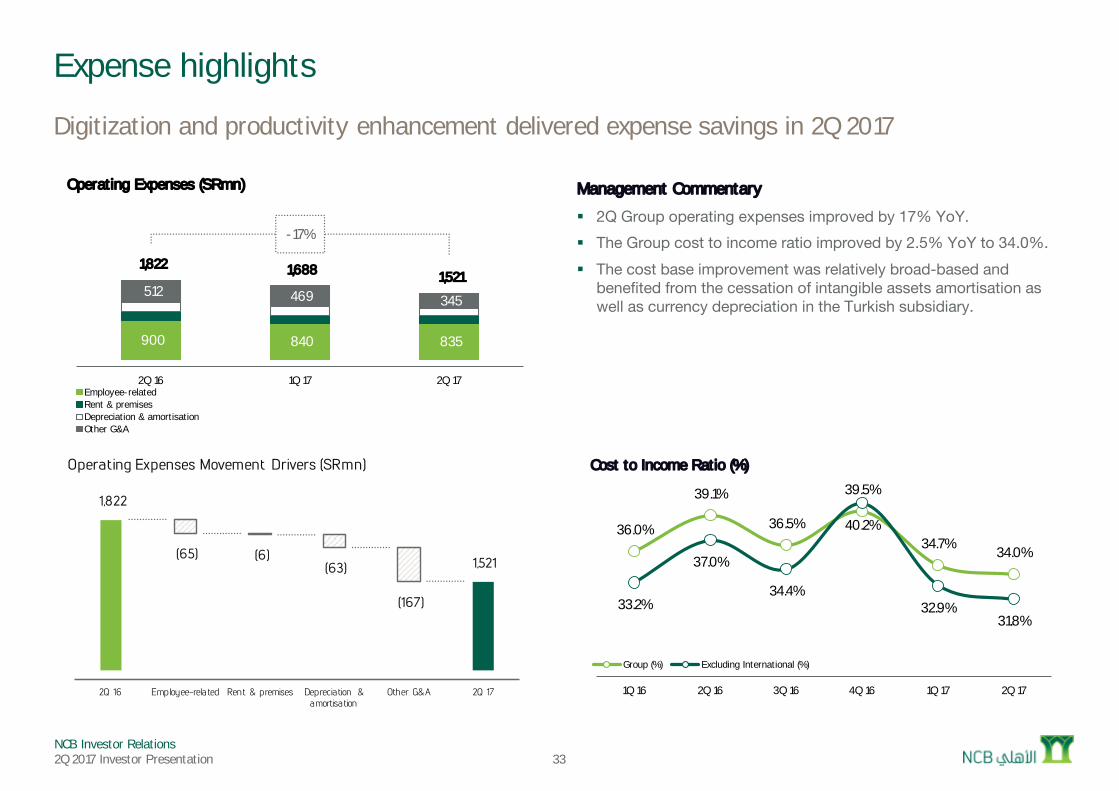
Expense highlights
Digitization and productivity enhancement delivered expense savings in 2Q 2017
Management Commentary
§ 2Q Group operating expenses improved by 17% YoY.§ The Group cost to income ratio improved by 2.5% YoY to 34.0%. § The cost base improvement was relatively broad-based and
benefited from the cessation of intangible assets amortisation as well as currency depreciation in the Turkish subsidiary.
36.0%
39.1%
36.5%
39.5%
34.7% 34.0%
33.2%
37.0%
34.4%
40.2%
32.9%31.8%
0
0
0
0
0
0
0
0
0
1Q 16 2Q 16 3Q 16 4Q 16 1Q 17 2Q 17
Cost to Income Ratio (%)
Group (%) Excluding International (%)
900 840 835
512 469 345
1,822 1,688 1,521
-17%
0
500
1,000
1,500
2,000
2,500
3,000
3,500
2Q 16 1Q 17 2Q 17
Operating Expenses (SRmn)
Employee-relatedRent & premisesDepreciation & amortisationOther G&A
1,822
(65)(63)
(6)
(167)
1,521
0
100
200
300
400
500
600
700
800
900
2Q 16 Employee-related Rent & premises Depreciation & amortisation
Other G&A 2Q 17
Operating Expenses Movement Drivers (SRmn)
NCB Investor Relations2Q 2017 Investor Presentation
Retail24%
Corporate32%
Treasury35%
Capital Market0%
International9%
Total Assets by Segment (SRbn)
34
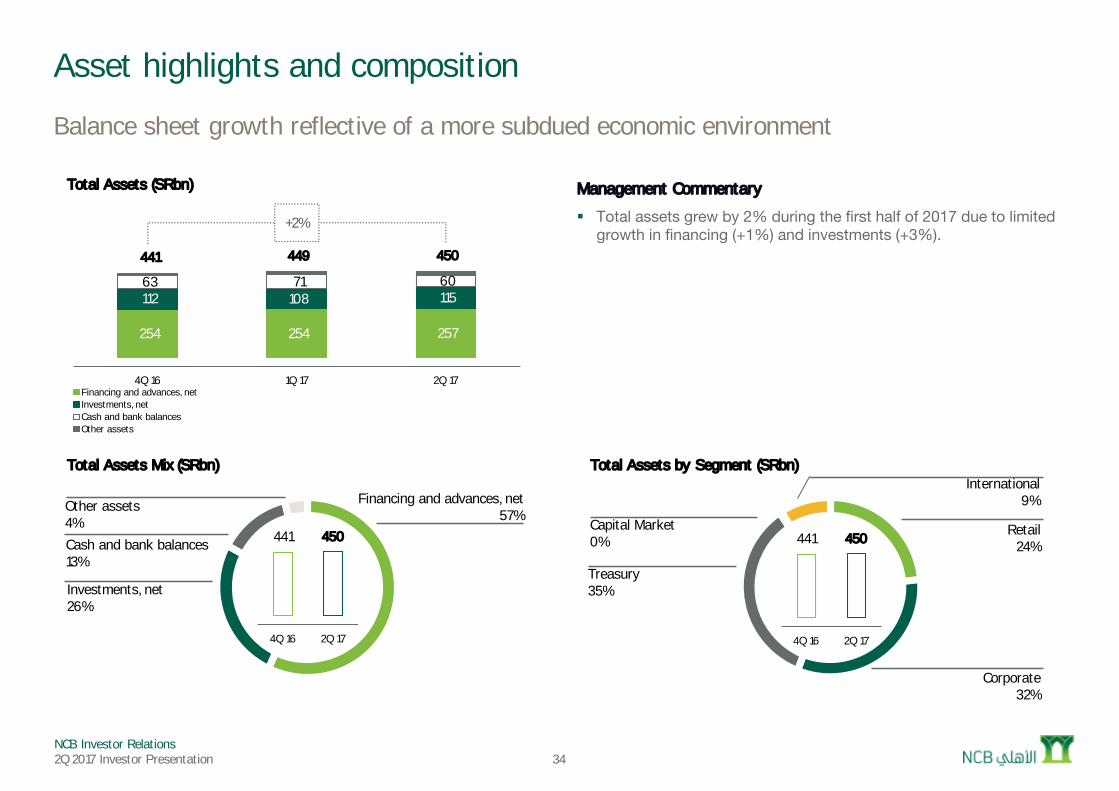
Asset highlights and composition
Balance sheet growth reflective of a more subdued economic environment
254 254 257
112 108 115 63 71 60
441 449 450
+2%
0
100
200
300
400
500
600
700
800
4Q 16 1Q 17 2Q 17
Total Assets (SRbn)
Financing and advances, netInvestments, netCash and bank balancesOther assets
Financing and advances, net57%
Investments, net26%
Cash and bank balances13%
Other assets4%
Total Assets Mix (SRbn)
Management Commentary
§ Total assets grew by 2% during the first half of 2017 due to limited growth in financing (+1%) and investments (+3%).
441 450
0
100
200
300
400
500
600
4Q 16 2Q 17
441 450
0
100
200
300
400
500
600
4Q 16 2Q 17
NCB Investor Relations2Q 2017 Investor Presentation
Consumer loans and credit cards35%
Commerce18%
Manufacturing12%
Services8%
Building and construction7%
Others across 7 sectors20%
Financing and Advances, gross by Economic Sector (Top 5) (SRbn)
35
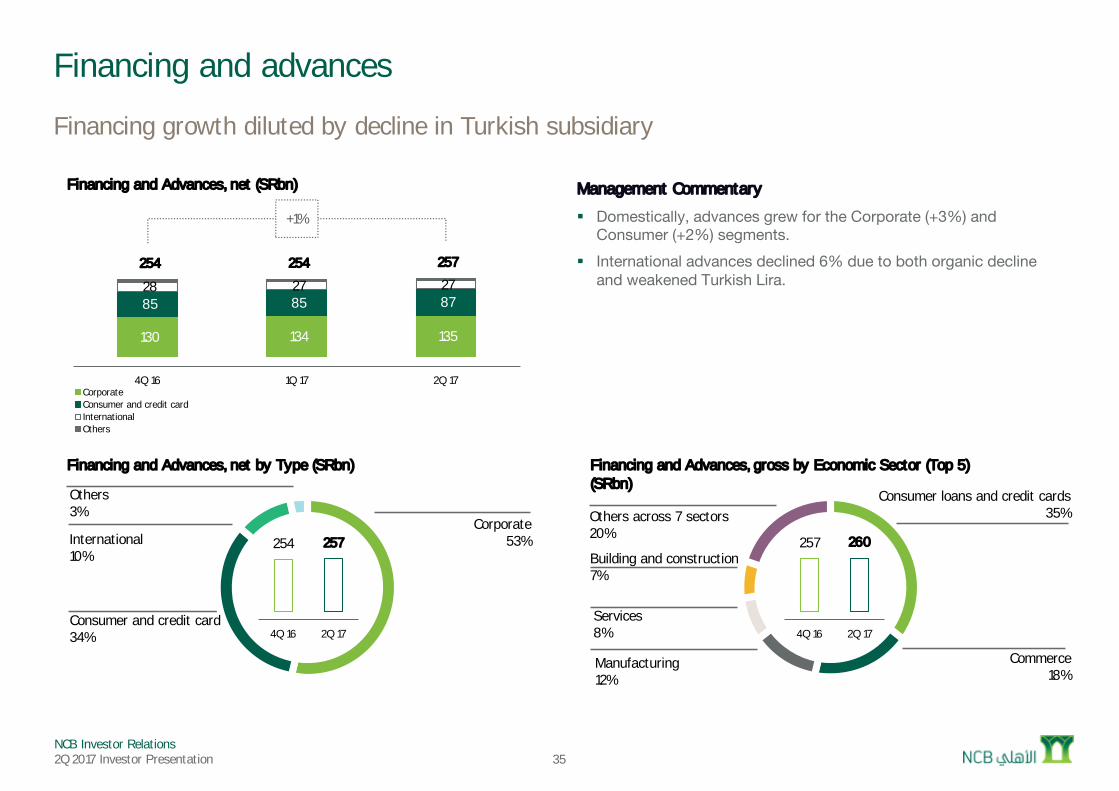
Financing and advances
Financing growth diluted by decline in Turkish subsidiary
Management Commentary
§ Domestically, advances grew for the Corporate (+3%) and Consumer (+2%) segments.
§ International advances declined 6% due to both organic decline and weakened Turkish Lira.
254 257
0
50
100
150
200
250
300
350
400
4Q 16 2Q 17
130 134 135
85 85 87 28 27 27 254 254 257
+1%
0
50
100
150
200
250
300
350
400
450
500
4Q 16 1Q 17 2Q 17
Financing and Advances, net (SRbn)
CorporateConsumer and credit cardInternationalOthers
Corporate53%
Consumer and credit card34%
International10%
Others3%
Financing and Advances, net by Type (SRbn)
257 260
0
50
100
150
200
250
300
350
400
4Q 16 2Q 17
NCB Investor Relations2Q 2017 Investor Presentation 36
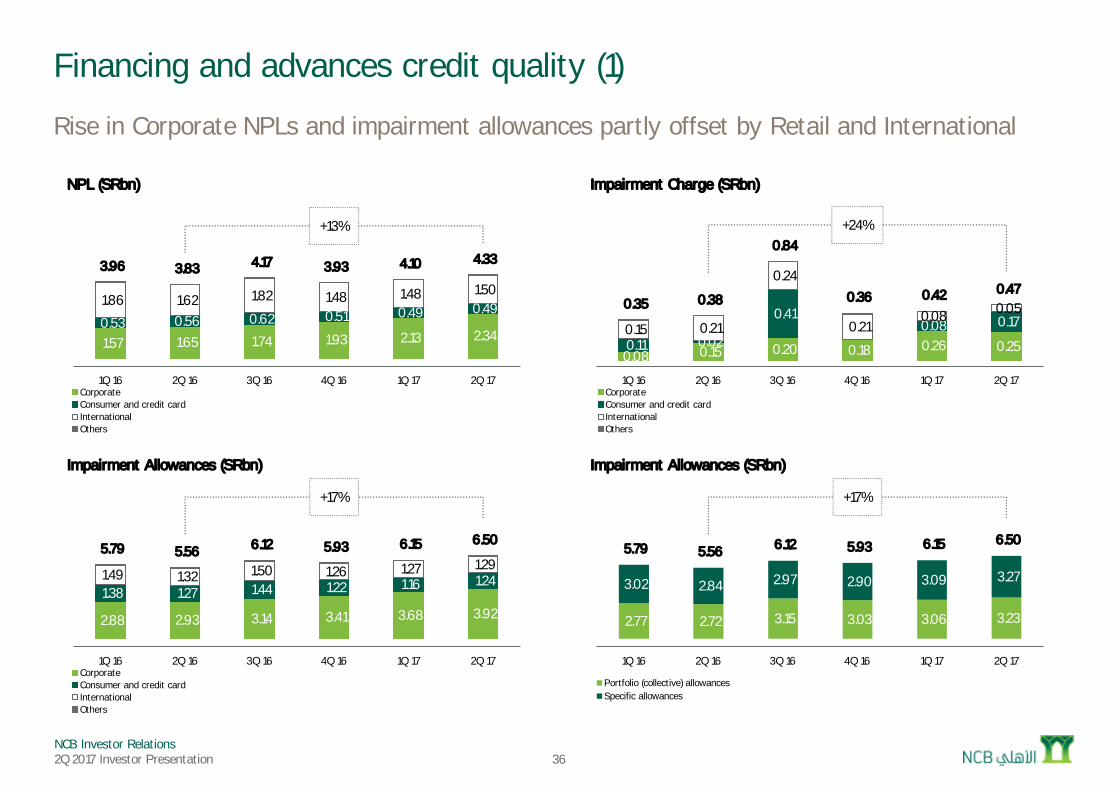
Financing and advances credit quality (1)
Rise in Corporate NPLs and impairment allowances partly offset by Retail and International
0.08 0.15 0.20 0.18 0.26 0.25 0.11 0.02
0.41 0.08 0.17 0.15 0.21
0.24
0.21 0.08 0.05 0.35 0.38
0.84
0.36 0.42 0.47
+24%
0
0
0
1
1
1
1
1Q 16 2Q 16 3Q 16 4Q 16 1Q 17 2Q 17
Impairment Charge (SRbn)
CorporateConsumer and credit cardInternationalOthers
2.77 2.72 3.15 3.03 3.06 3.23
3.02 2.84 2.97 2.90 3.09 3.27
5.79 5.56 6.12 5.93 6.15 6.50
+17%
0
2
4
6
8
10
12
1Q 16 2Q 16 3Q 16 4Q 16 1Q 17 2Q 17
Impairment Allowances (SRbn)
Portfolio (collective) allowancesSpecific allowances
2.88 2.93 3.14 3.41 3.68 3.92 1.38 1.27 1.44 1.22 1.16 1.24 1.49 1.32 1.50 1.26 1.27 1.29 5.79 5.56 6.12 5.93 6.15 6.50
+17%
0
2
4
6
8
10
12
1Q 16 2Q 16 3Q 16 4Q 16 1Q 17 2Q 17
Impairment Allowances (SRbn)
CorporateConsumer and credit cardInternationalOthers
1.57 1.65 1.74 1.93 2.13 2.34 0.53 0.56 0.62 0.51 0.49 0.49 1.86 1.62 1.82 1.48 1.48 1.50
3.96 3.83 4.17 3.93 4.10 4.33
+13%
0
1
2
3
4
5
6
7
8
1Q 16 2Q 16 3Q 16 4Q 16 1Q 17 2Q 17
NPL (SRbn)
CorporateConsumer and credit cardInternationalOthers
NCB Investor Relations2Q 2017 Investor Presentation 37
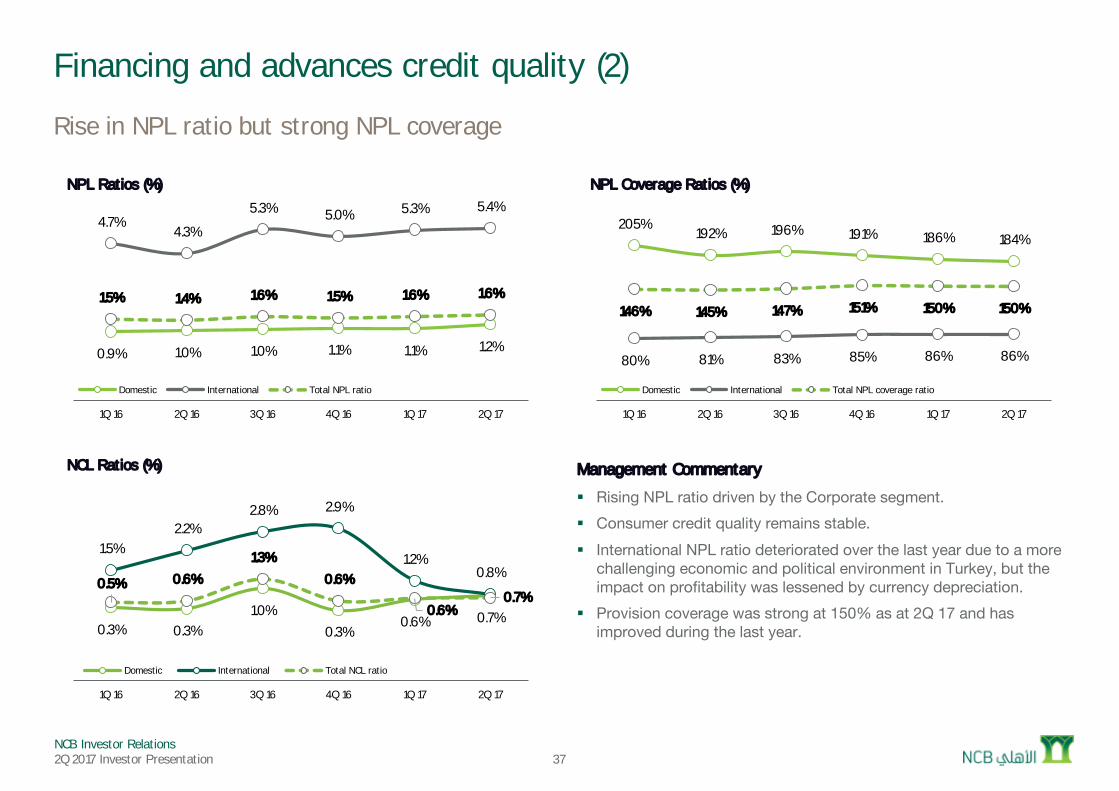
Financing and advances credit quality (2)
Rise in NPL ratio but strong NPL coverage
Management Commentary
§ Rising NPL ratio driven by the Corporate segment.§ Consumer credit quality remains stable.§ International NPL ratio deteriorated over the last year due to a more
challenging economic and political environment in Turkey, but the impact on profitability was lessened by currency depreciation.
§ Provision coverage was strong at 150% as at 2Q 17 and has improved during the last year.
205%192% 196% 191% 186% 184%
80% 81% 83% 85% 86% 86%
146% 145% 147% 151% 150% 150%
(0)
0
1
1
2
2
1Q 16 2Q 16 3Q 16 4Q 16 1Q 17 2Q 17
NPL Coverage Ratios (%)
Domestic International Total NPL coverage ratio
0.9% 1.0% 1.0% 1.1% 1.1% 1.2%
4.7%4.3%
5.3% 5.0% 5.3% 5.4%
1.5% 1.4% 1.6% 1.5% 1.6% 1.6%
(0)
(0)
0
0
0
0
0
0
0
1Q 16 2Q 16 3Q 16 4Q 16 1Q 17 2Q 17
NPL Ratios (%)
Domestic International Total NPL ratio
0.3% 0.3%1.0%
0.3%0.6% 0.7%
1.5%2.2%
2.8% 2.9%
1.2%0.8%
0.5% 0.6%
1.3%
0.6%
0.6%0.7%
(0)
(0)
0
0
0
0
0
1Q 16 2Q 16 3Q 16 4Q 16 1Q 17 2Q 17
NCL Ratios (%)
Domestic International Total NCL ratio
NCB Investor Relations2Q 2017 Investor Presentation 38
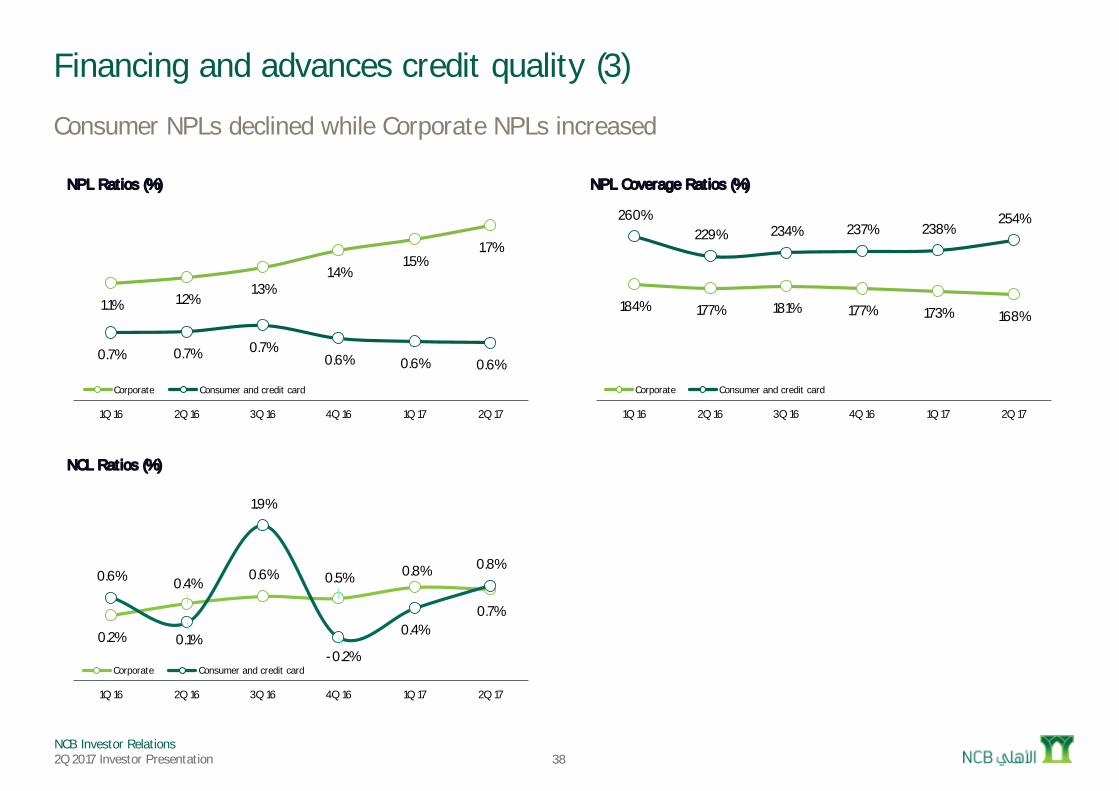
Financing and advances credit quality (3)
Consumer NPLs declined while Corporate NPLs increased
1.1% 1.2%1.3%
1.4%1.5%
1.7%
0.7% 0.7% 0.7%0.6% 0.6% 0.6%
0
0
0
0
0
0
0
0
0
0
1Q 16 2Q 16 3Q 16 4Q 16 1Q 17 2Q 17
NPL Ratios (%)
Corporate Consumer and credit card
184% 177% 181% 177% 173% 168%
260%229% 234% 237% 238%
254%
(0)
0
1
1
2
2
3
1Q 16 2Q 16 3Q 16 4Q 16 1Q 17 2Q 17
NPL Coverage Ratios (%)
Corporate Consumer and credit card
0.2%
0.4%0.6% 0.5% 0.8%
0.7%
0.6%
0.1%
1.9%
-0.2%
0.4%
0.8%
(0)
(0)
0
0
0
0
0
0
1Q 16 2Q 16 3Q 16 4Q 16 1Q 17 2Q 17
NCL Ratios (%)
Corporate Consumer and credit card
NCB Investor Relations2Q 2017 Investor Presentation
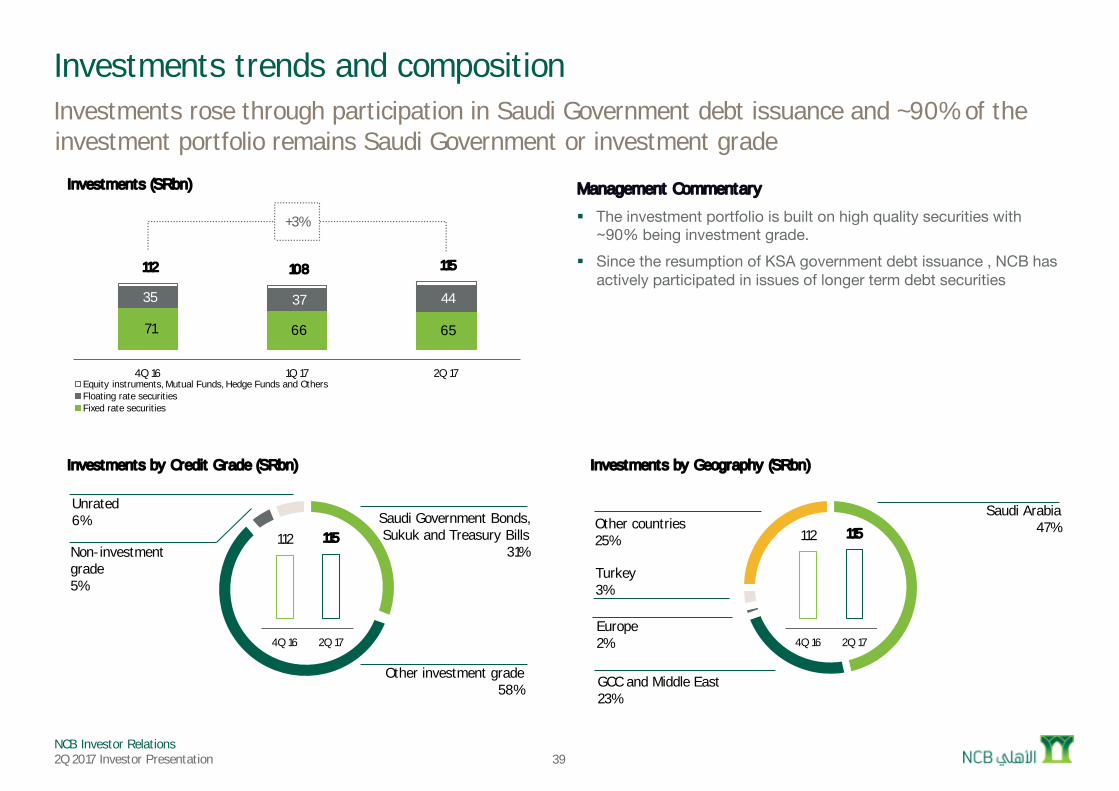
Saudi Arabia47%
GCC and Middle East23%
Europe2%
Turkey3%
Other countries25%
Investments by Geography (SRbn)
Investments trends and compositionInvestments rose through participation in Saudi Government debt issuance and ~90% of the investment portfolio remains Saudi Government or investment grade
112 115
0
20
40
60
80
100
120
140
160
4Q 16 2Q 17
Management Commentary
§ The investment portfolio is built on high quality securities with ~90% being investment grade.
§ Since the resumption of KSA government debt issuance , NCB has actively participated in issues of longer term debt securities
Saudi Government Bonds, Sukuk and Treasury Bills
31%
Other investment grade58%
Non-investment grade5%
Unrated6%
Investments by Credit Grade (SRbn)
112 115
0
20
40
60
80
100
120
140
160
180
4Q 16 2Q 17
39
71 66 65
35 37 44
112 108 115
+3%
0
50
100
150
200
250
4Q 16 1Q 17 2Q 17
Investments (SRbn)
Equity instruments, Mutual Funds, Hedge Funds and OthersFloating rate securitiesFixed rate securities
NCB Investor Relations2Q 2017 Investor Presentation 40
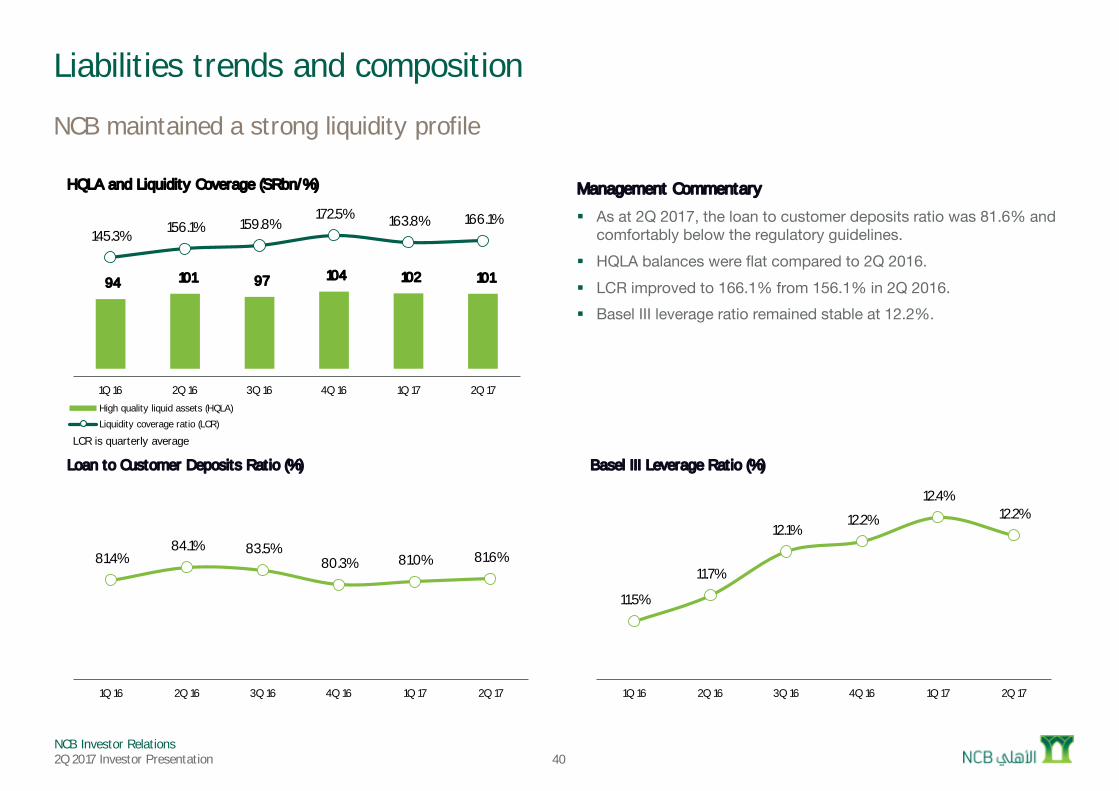
Liabilities trends and composition
NCB maintained a strong liquidity profile
Management Commentary
§ As at 2Q 2017, the loan to customer deposits ratio was 81.6% and comfortably below the regulatory guidelines.
§ HQLA balances were flat compared to 2Q 2016.§ LCR improved to 166.1% from 156.1% in 2Q 2016.§ Basel III leverage ratio remained stable at 12.2%.
81.4%84.1% 83.5%
80.3% 81.0% 81.6%
1
1
1
1
1
1
1
1
1
1Q 16 2Q 16 3Q 16 4Q 16 1Q 17 2Q 17
Loan to Customer Deposits Ratio (%)
11.5%
11.7%
12.1%12.2%
12.4%12.2%
0
0
0
0
0
0
0
0
0
1Q 16 2Q 16 3Q 16 4Q 16 1Q 17 2Q 17
Basel III Leverage Ratio (%)
LCR is quarterly average
94 101 97 104 102 101
145.3% 156.1% 159.8%172.5% 163.8% 166.1%
0.0%
20.0%
40.0%
60.0%
80.0%
100.0%
120.0%
140.0%
160.0%
180.0%
200.0%
0
50
100
150
200
1Q 16 2Q 16 3Q 16 4Q 16 1Q 17 2Q 17
HQLA and Liquidity Coverage (SRbn/%)
High quality liquid assets (HQLA)
Liquidity coverage ratio (LCR)
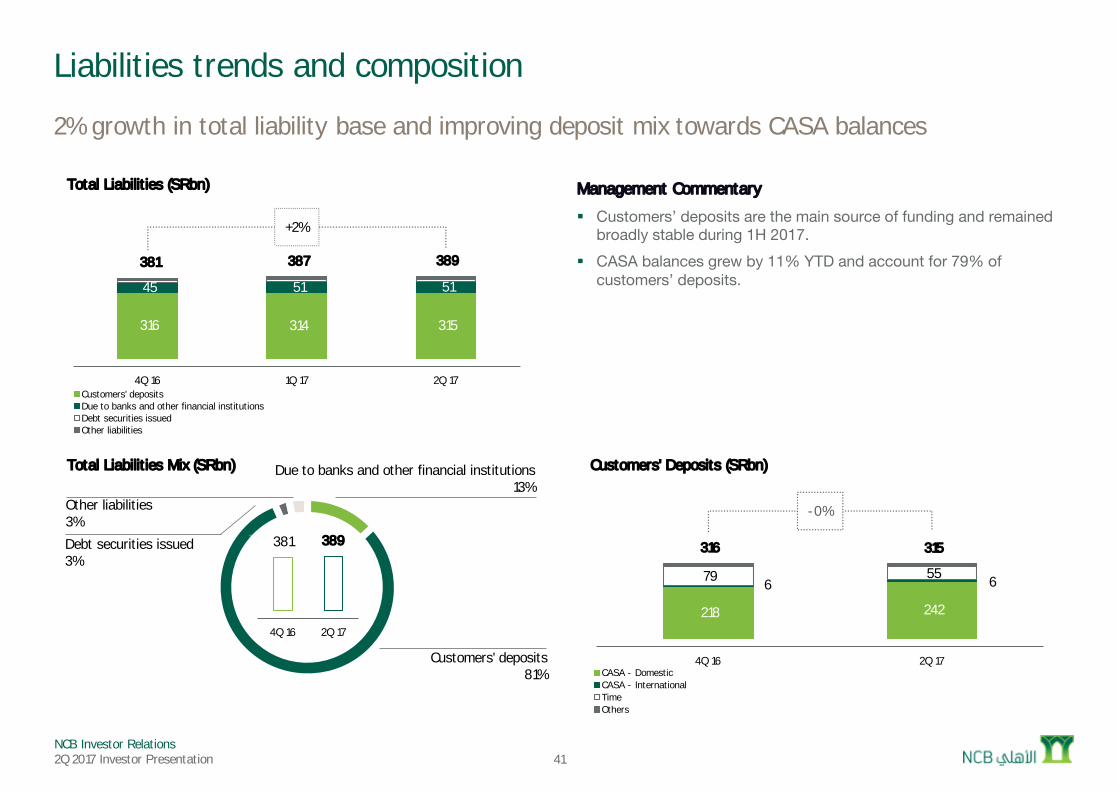
NCB Investor Relations2Q 2017 Investor Presentation
Due to banks and other financial institutions13%
Customers' deposits81%
Debt securities issued3%
Other liabilities3%
Total Liabilities Mix (SRbn)
41
Liabilities trends and composition
2% growth in total liability base and improving deposit mix towards CASA balances
Management Commentary
§ Customers’ deposits are the main source of funding and remained broadly stable during 1H 2017.
§ CASA balances grew by 11% YTD and account for 79% of customers’ deposits.
316 314 315
45 51 51
381 387 389
+2%
0
100
200
300
400
500
600
700
4Q 16 1Q 17 2Q 17
Total Liabilities (SRbn)
Customers' depositsDue to banks and other financial institutionsDebt securities issuedOther liabilities
381 389
0
100
200
300
400
500
600
4Q 16 2Q 17
218 242
6 6 79 55
316 315
-0%
0
100
200
300
400
500
600
4Q 16 2Q 17
Customers' Deposits (SRbn)
CASA - DomesticCASA - InternationalTimeOthers
NCB Investor Relations2Q 2017 Investor Presentation
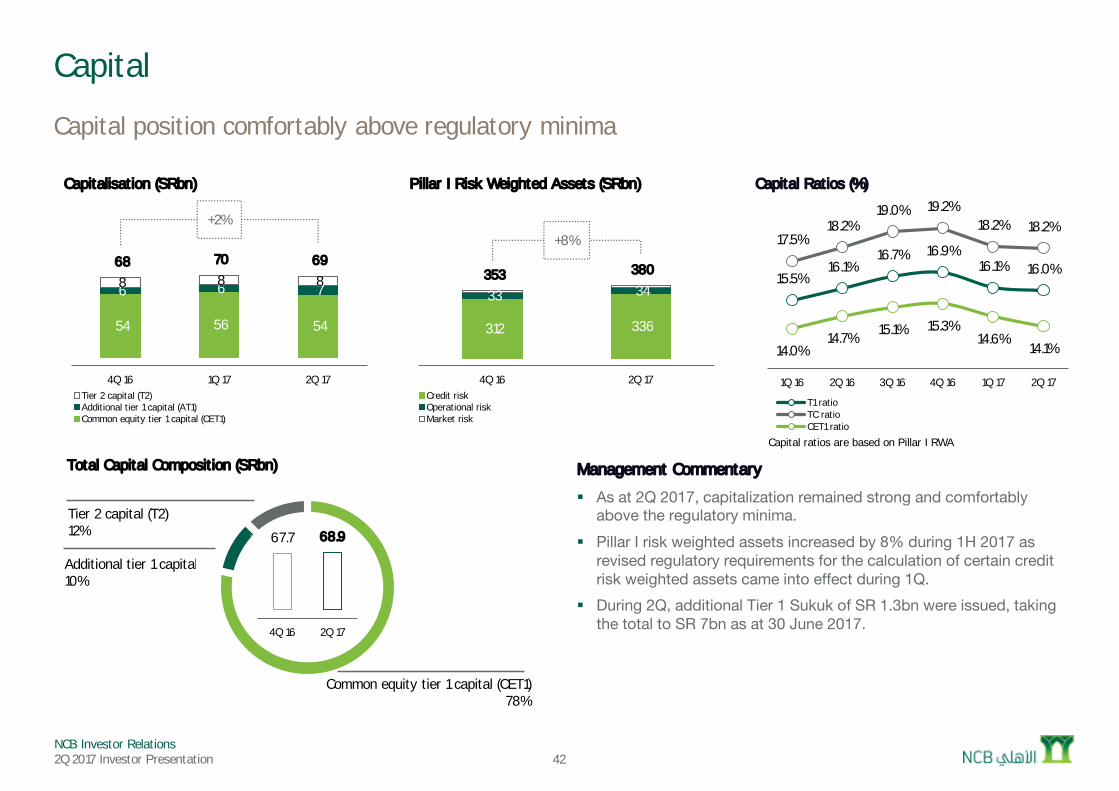
Management Commentary
§ As at 2Q 2017, capitalization remained strong and comfortably above the regulatory minima.
§ Pillar I risk weighted assets increased by 8% during 1H 2017 as revised regulatory requirements for the calculation of certain credit risk weighted assets came into effect during 1Q.
§ During 2Q, additional Tier 1 Sukuk of SR 1.3bn were issued, taking the total to SR 7bn as at 30 June 2017.
Common equity tier 1 capital (CET1)78%
Additional tier 1 capital (AT1)10%
Tier 2 capital (T2)12%
Total Capital Composition (SRbn)
42
Capital
Capital position comfortably above regulatory minima
67.7 68.9
0
10
20
30
40
50
60
70
80
90
100
4Q 16 2Q 17
Capital ratios are based on Pillar I RWA
15.5%16.1%
16.7% 16.9%16.1% 16.0%
17.5%18.2%
19.0% 19.2%18.2% 18.2%
14.0%14.7% 15.1% 15.3%
14.6%14.1%
12.0%
13.0%
14.0%
15.0%
16.0%
17.0%
18.0%
19.0%
20.0%
1Q 16 2Q 16 3Q 16 4Q 16 1Q 17 2Q 17
Capital Ratios (%)
T1 ratioTC ratioCET1 ratio
312 336
33 34 353 380
+8%
0
100
200
300
400
500
600
700
800
4Q 16 2Q 17
Pillar I Risk Weighted Assets (SRbn)
Credit riskOperational riskMarket risk
54 56 54
6 6 7 8 8 8 68 70 69
+2%
0
20
40
60
80
100
120
4Q 16 1Q 17 2Q 17
Capitalisation (SRbn)
Tier 2 capital (T2)Additional tier 1 capital (AT1)Common equity tier 1 capital (CET1)
NCB Investor Relations2Q 2017 Investor Presentation
National Commercial Bank
Segmental Review
2Q 2017 Results
NCB Investor Relations2Q 2017 Investor Presentation
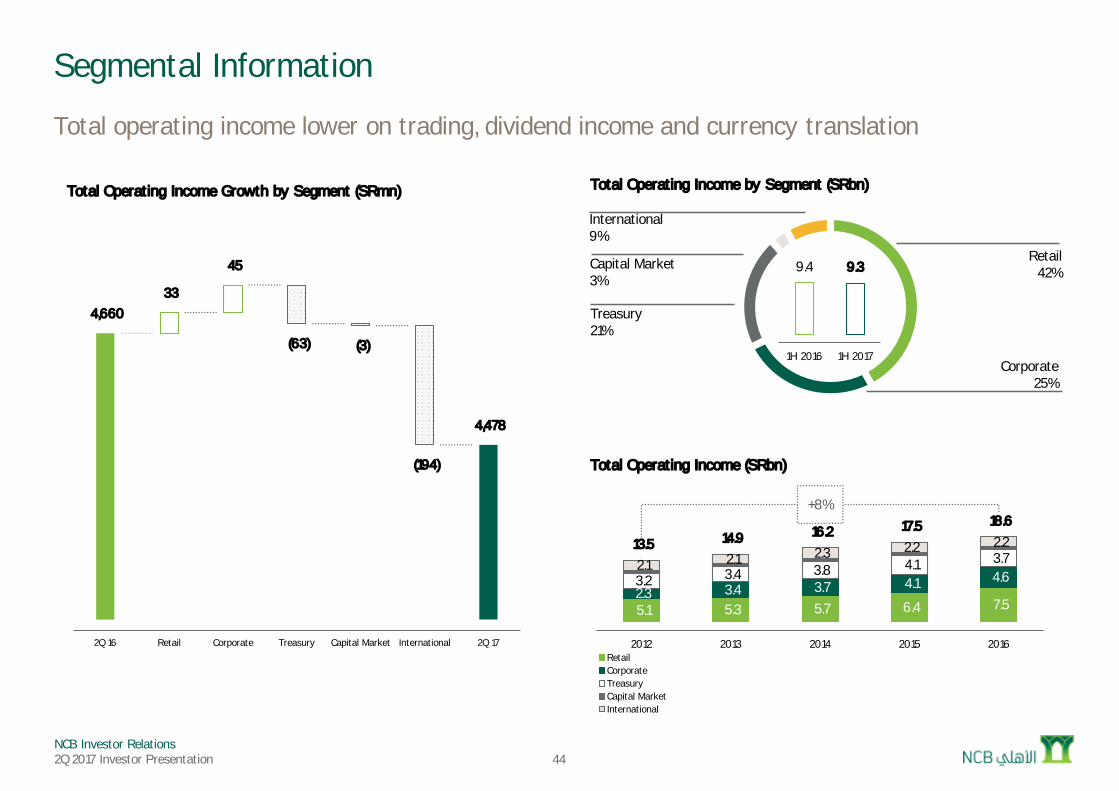
Retail42%
Corporate25%
Treasury21%
Capital Market3%
International9%
Total Operating Income by Segment (SRbn)
44
Segmental Information
Total operating income lower on trading, dividend income and currency translation
9.4 9.3
0
2
4
6
8
10
12
14
1H 2016 1H 2017
5.1 5.3 5.7 6.4 7.5 2.3 3.4 3.7 4.1 4.6 3.2 3.4 3.8 4.1 3.7 2.1 2.1 2.3 2.2 2.2 13.5 14.9 16.2 17.5 18.6
+8%
0
5
10
15
20
25
30
2012 2013 2014 2015 2016
Total Operating Income (SRbn)
RetailCorporateTreasuryCapital MarketInternational
4,660 33
(63)
45
(3)
(194)
4,478
0
100
200
300
400
500
600
2Q 16 Retail Corporate Treasury Capital Market International 2Q 17
Total Operating Income Growth by Segment (SRmn)
NCB Investor Relations2Q 2017 Investor Presentation
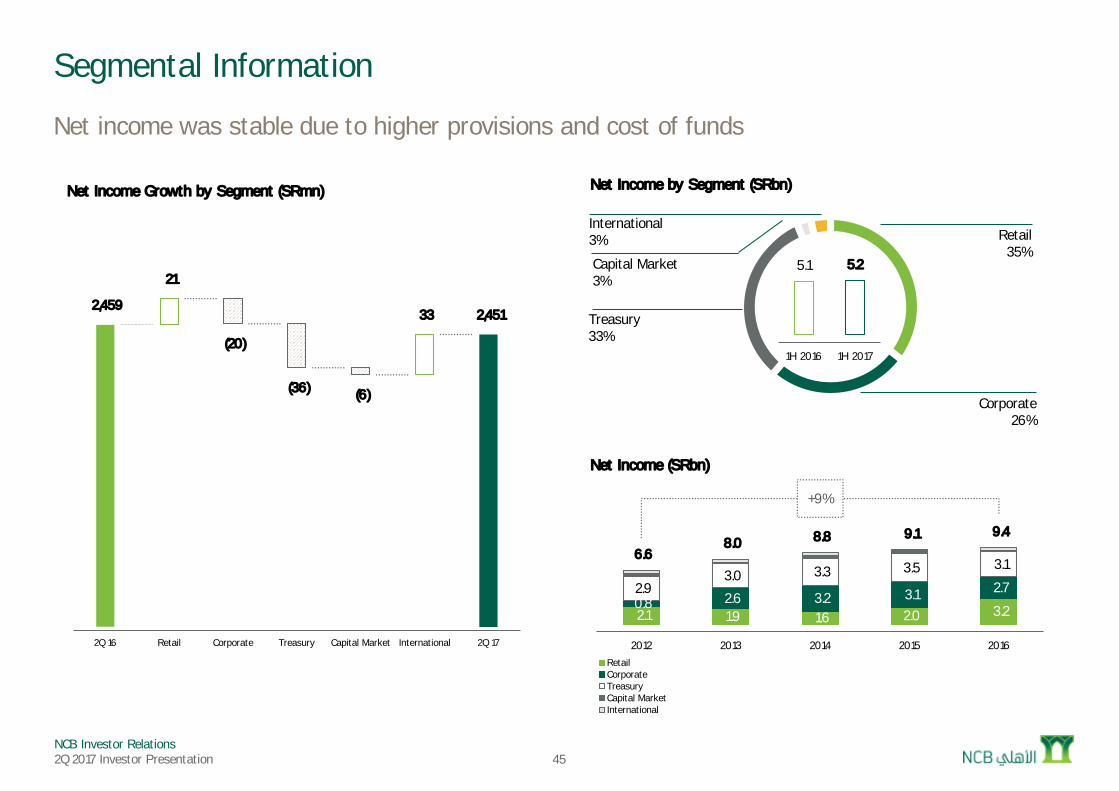
Retail35%
Corporate26%
Treasury33%
Capital Market3%
International3%
Net Income by Segment (SRbn)
45
Segmental Information
Net income was stable due to higher provisions and cost of funds
2.1 1.9 1.6 2.0 3.2 0.8 2.6 3.2 3.1 2.7 2.9 3.0 3.3 3.5 3.1
6.6 8.0 8.8 9.1 9.4
+9%
0
2
4
6
8
10
12
14
16
2012 2013 2014 2015 2016
Net Income (SRbn)
RetailCorporateTreasuryCapital MarketInternational
5.1 5.2
0
1
2
3
4
5
6
7
8
1H 2016 1H 2017
2,459
21
(36)
(20)
(6)
33 2,451
0
50
100
150
200
250
300
2Q 16 Retail Corporate Treasury Capital Market International 2Q 17
Net Income Growth by Segment (SRmn)
NCB Investor Relations2Q 2017 Investor Presentation 46
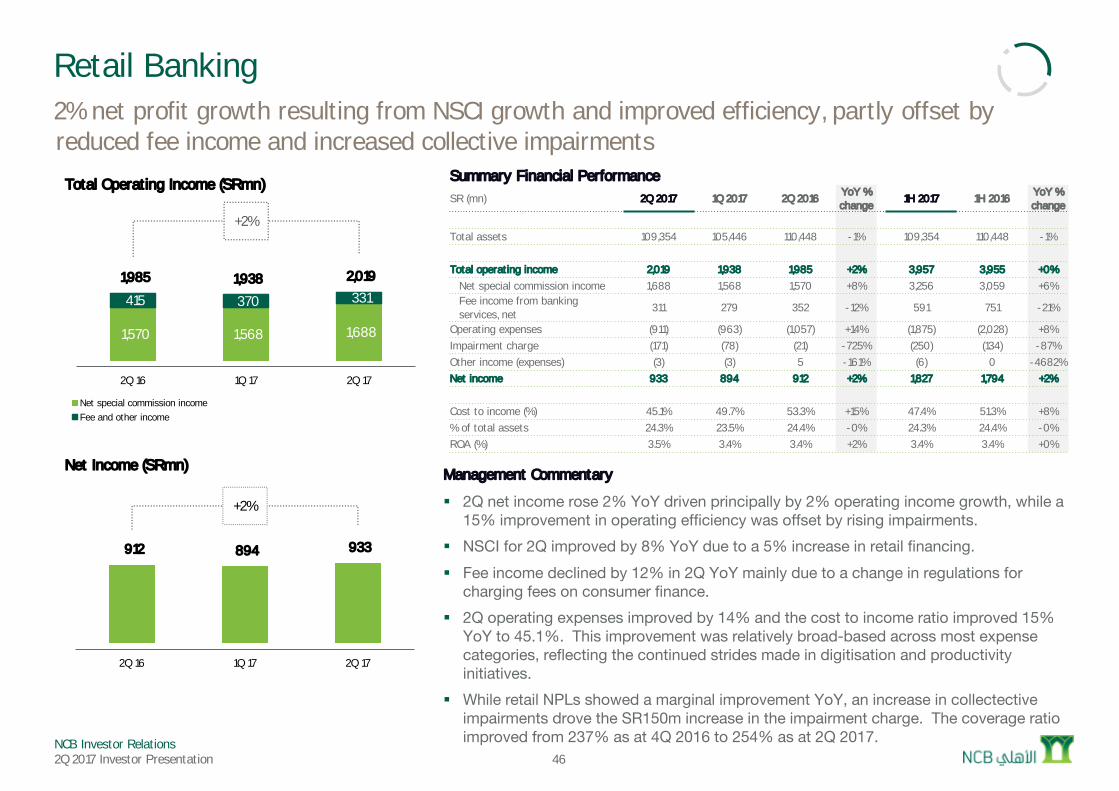
Retail Banking2% net profit growth resulting from NSCI growth and improved efficiency, partly offset by reduced fee income and increased collective impairments
Management Commentary
§ 2Q net income rose 2% YoY driven principally by 2% operating income growth, while a 15% improvement in operating efficiency was offset by rising impairments.
§ NSCI for 2Q improved by 8% YoY due to a 5% increase in retail financing.§ Fee income declined by 12% in 2Q YoY mainly due to a change in regulations for
charging fees on consumer finance.§ 2Q operating expenses improved by 14% and the cost to income ratio improved 15%
YoY to 45.1%. This improvement was relatively broad-based across most expense categories, reflecting the continued strides made in digitisation and productivity initiatives.
§ While retail NPLs showed a marginal improvement YoY, an increase in collectective impairments drove the SR150m increase in the impairment charge. The coverage ratio improved from 237% as at 4Q 2016 to 254% as at 2Q 2017.
1,570 1,568 1,688
415 370 331 1,985 1,938 2,019
+2%
0
500
1,000
1,500
2,000
2,500
3,000
3,500
4,000
4,500
2Q 16 1Q 17 2Q 17
Total Operating Income (SRmn)
Net special commission incomeFee and other income
912 894 933
+2%
0
200
400
600
800
1,000
1,200
1,400
1,600
1,800
2Q 16 1Q 17 2Q 17
Net Income (SRmn)
Summary Financial PerformanceSR (mn) 2Q 2017 1Q 2017 2Q 2016 YoY %
change1H 2017 1H 2016 YoY %
change
Total assets 109,354 105,446 110,448 -1% 109,354 110,448 -1%
Total operating income 2,019 1,938 1,985 +2% 3,957 3,955 +0%Net special commission income 1,688 1,568 1,570 +8% 3,256 3,059 +6%Fee income from banking services, net
311 279 352 -12% 591 751 -21%
Operating expenses (911) (963) (1,057) +14% (1,875) (2,028) +8%Impairment charge (171) (78) (21) -725% (250) (134) -87%Other income (expenses) (3) (3) 5 -161% (6) 0 -4682%Net income 933 894 912 +2% 1,827 1,794 +2%
Cost to income (%) 45.1% 49.7% 53.3% +15% 47.4% 51.3% +8%% of total assets 24.3% 23.5% 24.4% -0% 24.3% 24.4% -0%ROA (%) 3.5% 3.4% 3.4% +2% 3.4% 3.4% +0%
NCB Investor Relations2Q 2017 Investor Presentation 47
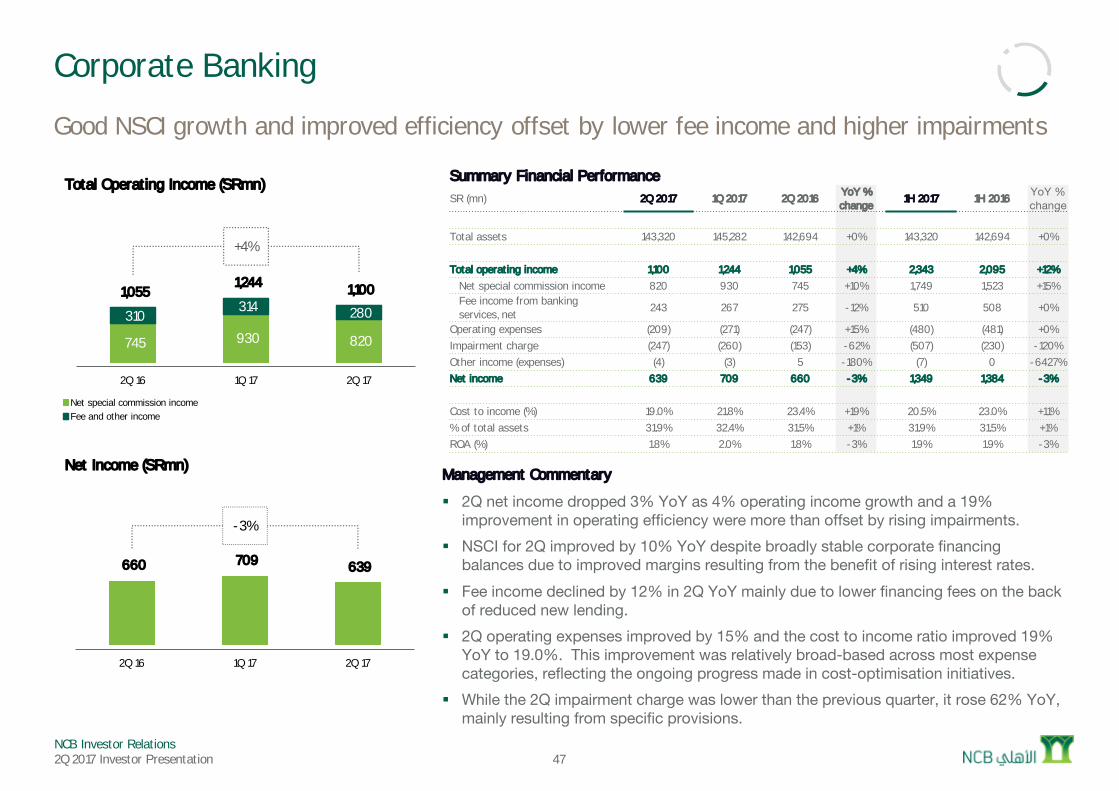
Corporate Banking
Good NSCI growth and improved efficiency offset by lower fee income and higher impairments
Management Commentary
§ 2Q net income dropped 3% YoY as 4% operating income growth and a 19% improvement in operating efficiency were more than offset by rising impairments.
§ NSCI for 2Q improved by 10% YoY despite broadly stable corporate financing balances due to improved margins resulting from the benefit of rising interest rates.
§ Fee income declined by 12% in 2Q YoY mainly due to lower financing fees on the back of reduced new lending.
§ 2Q operating expenses improved by 15% and the cost to income ratio improved 19% YoY to 19.0%. This improvement was relatively broad-based across most expense categories, reflecting the ongoing progress made in cost-optimisation initiatives.
§ While the 2Q impairment charge was lower than the previous quarter, it rose 62% YoY, mainly resulting from specific provisions.
745 930 820
310 314 280
1,055 1,244 1,100
+4%
0
500
1,000
1,500
2,000
2,500
3,000
2Q 16 1Q 17 2Q 17
Total Operating Income (SRmn)
Net special commission incomeFee and other income
660 709 639
-3%
0
200
400
600
800
1,000
1,200
1,400
1,600
2Q 16 1Q 17 2Q 17
Net Income (SRmn)
Summary Financial PerformanceSR (mn) 2Q 2017 1Q 2017 2Q 2016 YoY %
change1H 2017 1H 2016 YoY %
change
Total assets 143,320 145,282 142,694 +0% 143,320 142,694 +0%
Total operating income 1,100 1,244 1,055 +4% 2,343 2,095 +12%Net special commission income 820 930 745 +10% 1,749 1,523 +15%Fee income from banking services, net
243 267 275 -12% 510 508 +0%
Operating expenses (209) (271) (247) +15% (480) (481) +0%Impairment charge (247) (260) (153) -62% (507) (230) -120%Other income (expenses) (4) (3) 5 -180% (7) 0 -6427%Net income 639 709 660 -3% 1,349 1,384 -3%
Cost to income (%) 19.0% 21.8% 23.4% +19% 20.5% 23.0% +11%% of total assets 31.9% 32.4% 31.5% +1% 31.9% 31.5% +1%ROA (%) 1.8% 2.0% 1.8% -3% 1.9% 1.9% -3%
NCB Investor Relations2Q 2017 Investor Presentation 48
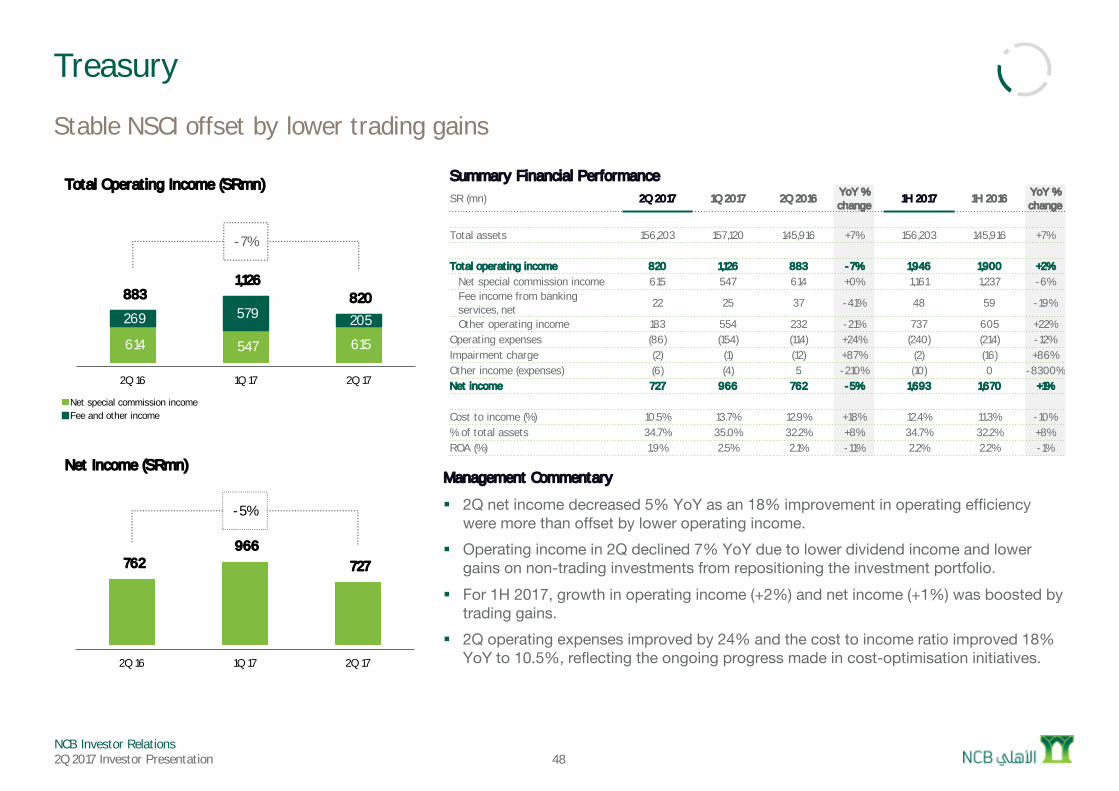
Treasury
Stable NSCI offset by lower trading gains
Management Commentary
§ 2Q net income decreased 5% YoY as an 18% improvement in operating efficiency were more than offset by lower operating income.
§ Operating income in 2Q declined 7% YoY due to lower dividend income and lower gains on non-trading investments from repositioning the investment portfolio.
§ For 1H 2017, growth in operating income (+2%) and net income (+1%) was boosted by trading gains.
§ 2Q operating expenses improved by 24% and the cost to income ratio improved 18% YoY to 10.5%, reflecting the ongoing progress made in cost-optimisation initiatives.
614 547 615
269 579 205
883 1,126
820
-7%
0
500
1,000
1,500
2,000
2,500
2Q 16 1Q 17 2Q 17
Total Operating Income (SRmn)
Net special commission incomeFee and other income
762 966
727
-5%
0
200
400
600
800
1,000
1,200
1,400
1,600
1,800
2Q 16 1Q 17 2Q 17
Net Income (SRmn)
Summary Financial PerformanceSR (mn) 2Q 2017 1Q 2017 2Q 2016 YoY %
change1H 2017 1H 2016 YoY %
change
Total assets 156,203 157,120 145,916 +7% 156,203 145,916 +7%
Total operating income 820 1,126 883 -7% 1,946 1,900 +2%Net special commission income 615 547 614 +0% 1,161 1,237 -6%Fee income from banking services, net
22 25 37 -41% 48 59 -19%
Other operating income 183 554 232 -21% 737 605 +22%Operating expenses (86) (154) (114) +24% (240) (214) -12%Impairment charge (2) (1) (12) +87% (2) (16) +86%Other income (expenses) (6) (4) 5 -210% (10) 0 -8300%Net income 727 966 762 -5% 1,693 1,670 +1%
Cost to income (%) 10.5% 13.7% 12.9% +18% 12.4% 11.3% -10%% of total assets 34.7% 35.0% 32.2% +8% 34.7% 32.2% +8%ROA (%) 1.9% 2.5% 2.1% -11% 2.2% 2.2% -1%
NCB Investor Relations2Q 2017 Investor Presentation 49
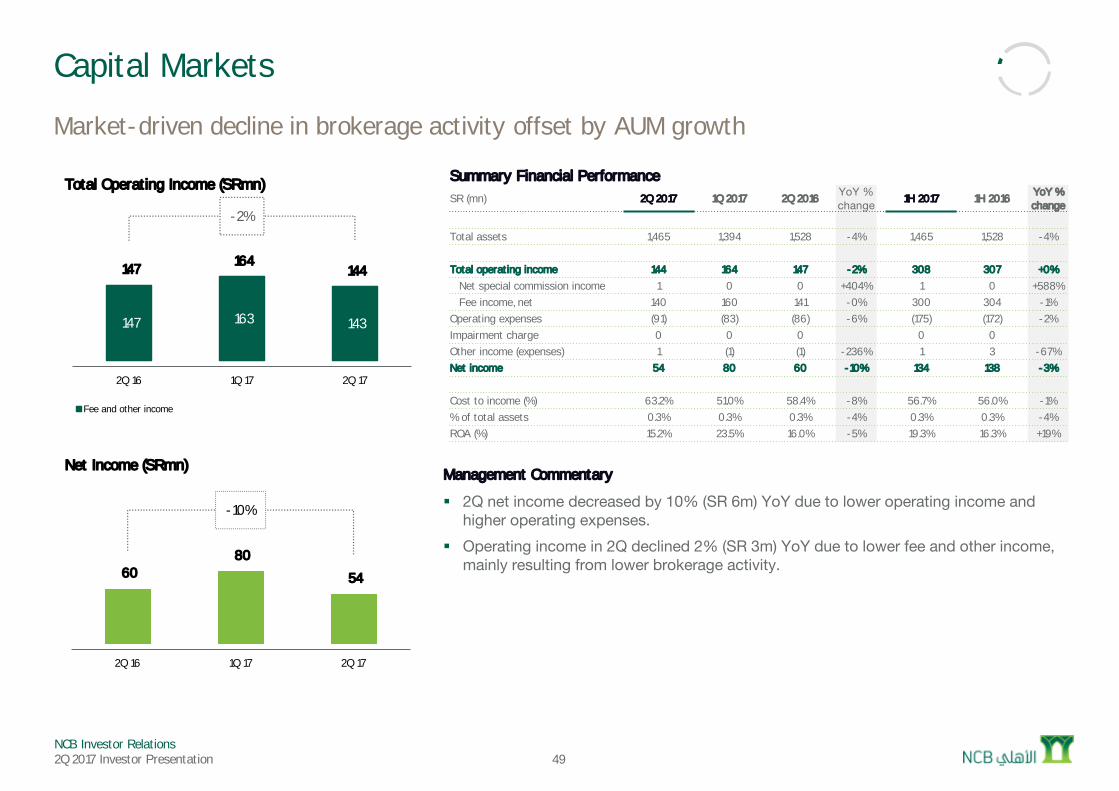
Capital Markets
Market-driven decline in brokerage activity offset by AUM growth
Management Commentary
§ 2Q net income decreased by 10% (SR 6m) YoY due to lower operating income and higher operating expenses.
§ Operating income in 2Q declined 2% (SR 3m) YoY due to lower fee and other income, mainly resulting from lower brokerage activity.
147 163 143
147 164 144
-2%
0
50
100
150
200
250
300
2Q 16 1Q 17 2Q 17
Total Operating Income (SRmn)
Fee and other income
60 80
54
-10%
0
20
40
60
80
100
120
140
160
2Q 16 1Q 17 2Q 17
Net Income (SRmn)
Summary Financial PerformanceSR (mn) 2Q 2017 1Q 2017 2Q 2016 YoY %
change 1H 2017 1H 2016 YoY % change
Total assets 1,465 1,394 1,528 -4% 1,465 1,528 -4%
Total operating income 144 164 147 -2% 308 307 +0%Net special commission income 1 0 0 +404% 1 0 +588%Fee income, net 140 160 141 -0% 300 304 -1%
Operating expenses (91) (83) (86) -6% (175) (172) -2%Impairment charge 0 0 0 0 0 Other income (expenses) 1 (1) (1) -236% 1 3 -67%Net income 54 80 60 -10% 134 138 -3%
Cost to income (%) 63.2% 51.0% 58.4% -8% 56.7% 56.0% -1%% of total assets 0.3% 0.3% 0.3% -4% 0.3% 0.3% -4%ROA (%) 15.2% 23.5% 16.0% -5% 19.3% 16.3% +19%
NCB Investor Relations2Q 2017 Investor Presentation 50
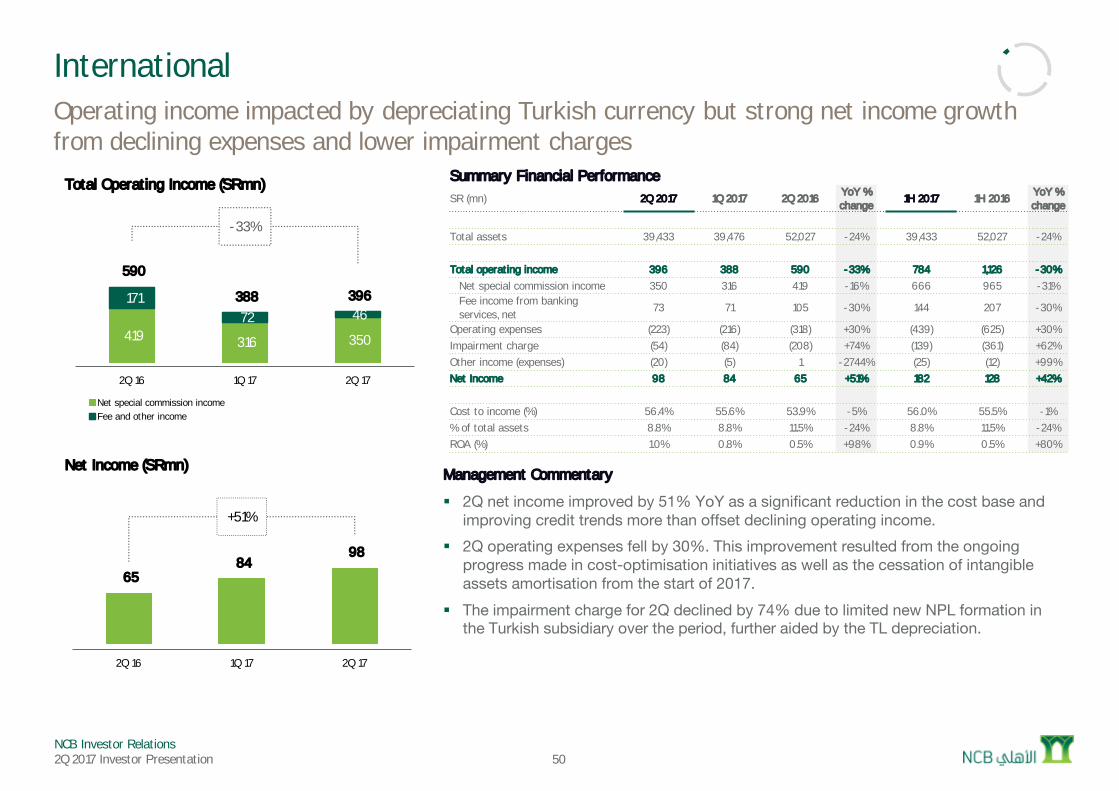
InternationalOperating income impacted by depreciating Turkish currency but strong net income growth from declining expenses and lower impairment charges
Management Commentary
§ 2Q net income improved by 51% YoY as a significant reduction in the cost base and improving credit trends more than offset declining operating income.
§ 2Q operating expenses fell by 30%. This improvement resulted from the ongoing progress made in cost-optimisation initiatives as well as the cessation of intangible assets amortisation from the start of 2017.
§ The impairment charge for 2Q declined by 74% due to limited new NPL formation in the Turkish subsidiary over the period, further aided by the TL depreciation.
419 316 350
171 72 46
590
388 396
-33%
0
200
400
600
800
1,000
1,200
2Q 16 1Q 17 2Q 17
Total Operating Income (SRmn)
Net special commission incomeFee and other income
65 84
98
+51%
0
20
40
60
80
100
120
140
160
180
200
2Q 16 1Q 17 2Q 17
Net Income (SRmn)
Summary Financial PerformanceSR (mn) 2Q 2017 1Q 2017 2Q 2016 YoY %
change1H 2017 1H 2016 YoY %
change
Total assets 39,433 39,476 52,027 -24% 39,433 52,027 -24%
Total operating income 396 388 590 -33% 784 1,126 -30%Net special commission income 350 316 419 -16% 666 965 -31%Fee income from banking services, net
73 71 105 -30% 144 207 -30%
Operating expenses (223) (216) (318) +30% (439) (625) +30%Impairment charge (54) (84) (208) +74% (139) (361) +62%Other income (expenses) (20) (5) 1 -2744% (25) (12) +99%Net Income 98 84 65 +51% 182 128 +42%
Cost to income (%) 56.4% 55.6% 53.9% -5% 56.0% 55.5% -1%% of total assets 8.8% 8.8% 11.5% -24% 8.8% 11.5% -24%ROA (%) 1.0% 0.8% 0.5% +98% 0.9% 0.5% +80%
NCB Investor Relations2Q 2017 Investor Presentation
National Commercial Bank
Additional Information
2Q 2017 Results
NCB Investor Relations2Q 2017 Investor Presentation 52
Additional Information
Please don’t hesitate to contact NCB Group Investor Relations
More information
Download copies of National Commercial Bank’s:
§ Financial statements
§ Earnings release
§ Investor presentation
§ Financial data pack (Excel)
Visit: http://www.alahli.com/en-us/Investor_Relation
Mr. Abdulbadie Alyafi
Head, Investor Relations
P: +966 12 646 3988
National Commercial Bank
P.O. Box 3555
21481 Jeddah, Kingdom of Saudi Arabia