NATIONAL CENTER FOR EDUCATION STATISTICSnces.ed.gov/pubs2003/200306.pdfNATIONAL CENTER FOR EDUCATION...
61
NATIONAL CENTER FOR EDUCATION STATISTICS Working Paper Series The Working Paper Series was initiated to promote the sharing of the valuable work experience and knowledge reflected in these preliminary reports. These reports are viewed as works in progress, and have not undergone a rigorous review for consistency with NCES Statistical Standards prior to inclusion in the Working Paper Series. U. S. Department of Education Institute of Education Sciences
Transcript of NATIONAL CENTER FOR EDUCATION STATISTICSnces.ed.gov/pubs2003/200306.pdfNATIONAL CENTER FOR EDUCATION...
NATIONAL CENTER FOR EDUCATION STATISTICS
Working Paper Series
The Working Paper Series was initiated to promote the sharing of the valuable work experience and knowledge reflected in these preliminary reports. These reports are viewed as works in progress, and have not undergone a rigorous review for consistency with NCES Statistical Standards prior to inclusion in the Working Paper Series.
U. S. Department of Education Institute of Education Sciences

This page intentionally left blank.

NATIONAL CENTER FOR EDUCATION STATISTICS
Working Paper Series
NAEP VALIDITY STUDIES: THE VALIDITY OF ORAL
ACCOMMODATION IN TESTING
Working Paper No. 2003-06 April 2003
Contact: Patricia Dabbs
Field Operations and Publication Management [email protected]
U. S. Department of Education Institute of Education Sciences

U.S. Department of Education Rod Paige Secretary
Institute of Education Sciences Grover J. Whitehurst Director
National Center for Education Statistics Val Plisko Associate Commissioner
The National Center for Education Statistics (NCES) is the primary federal entity for collecting, analyzing, and reporting data related to education in the United States and other nations. It fulfills a congressional mandate to collect, collate, analyze, and report full and complete statistics on the condition of education in the United States; conduct and publish reports and specialized analyses of the meaning and significance of such statistics; assist state and local education agencies in improving their statistical systems; and review and report on education activities in foreign countries.
NCES activities are designed to address high priority education data needs; provide consistent, reliable, complete, and accurate indicators of education status and trends; and report timely, useful, and high quality data to the U.S. Department of Education, the Congress, the states, other education policymakers, practitioners, data users, and the general public.
We strive to make our products available in a variety of formats and in language that is appropriate to a variety of audiences. You, as our customer, are the best judge of our success in communicating information effectively. If you have any comments or suggestions about this or any other NCES product or report, we would like to hear from you. Please direct your comments to:
National Center for Education Statistics Institute of Education Sciences U.S. Department of Education 1990 K Street NW Washington, DC 20006–5651
March 2003
The NCES World Wide Web Home Page address is http://nces.ed.gov The NCES World Wide Web Electronic Catalog is: http://nces.ed.gov/pubsearch
Suggested Citation
U.S. Department of Education, National Center for Education Statistics. NAEP Validity Studies: The Validity of Oral Accommodation in Testing , NCES 2003–06, by Timothy J. Weston. Project Officer: Patricia Dabbs. Washington, DC: 2003
For ordering information on this report, write:
U.S. Department of Education ED Pubs P.O. Box 1398 Jessup, MD 20794–1398
Or call toll free 1–877–4ED–Pubs
Content Contact: Patricia Dabbs (202) 502–7332 [email protected]

Foreword In addition to official NCES publications, NCES staff and individuals commissioned by NCES produce preliminary research reports that include analyses of survey results, and presentations of technical, methodological, and statistical evaluation issues. The Working Paper Series was initiated to promote the sharing of the valuable work experience and knowledge reflected in these preliminary reports. These reports are viewed as works in progress, and have not undergone a rigorous review for consistency with NCES Statistical Standards prior to inclusion in the Working Paper Series. Copies of Working Papers can be downloaded as pdf files from the NCES Electronic Catalog (http://nces.ed.gov/pubsearch/), or contact Sheilah Jupiter at (202) 502–7363, e-mail: [email protected], or mail: U.S. Department of Education, Institute of Education Sciences, National Center for Education Statistics, 1990 K Street NW, Room 9048, Washington, DC 20006. Marilyn M. Seastrom Ralph Lee Chief Mathematical Statistician Mathematical Statistician Statistical Standards Program Statistical Standards Program

This page intentionally left blank.

The Validity of Oral Accommodation in Testing
Timothy J. Weston
Commissioned by the NAEP Validity Studies (NVS) Panel July 2002
George W. Bohrnstedt, Panel Chair Frances B. Stancavage, Project Director The NAEP Validity Studies Panel was formed by the American Institutes for Research under contract with the National Center for Education Statistics. Points of view or opinions expressed in this paper do not necessarily represent the official positions of the U.S. Department of Education or the American Institutes for Research.
The NAEP Validity Studies (NVS) Panel was formed in 1995 to provide a technical review of NAEP plans and products and to identify technical concerns and promising techniques worthy of further study and research. The members of the panel have been charged with writing focused studies and issue papers on the most salient of the identified issues. Panel Members: Albert E. Beaton Boston College
Larry Hedges University of Chicago
Peter Behuniak Connecticut State Department of Education
Gerunda Hughes Howard University
George W. Bohrnstedt American Institutes for Research
Robert Linn University of Colorado
James R. Chromy Research Triangle Institute
Donald M. McLaughlin American Institutes for Research
Phil Daro East Bay Community Foundation
Ina V.S. Mullis Boston College
Lizanne DeStefano University of Illinois
P. David Pearson Michigan State University
Gerald DeMauro New York State Education Department
Lorrie Shepard University of Colorado
Richard P. Durán University of California
David Thiessen University of North Carolina-Chapel Hill
David Grissmer RAND
Project Director: Frances B. Stancavage American Institutes for Research Project Officer: Patricia Dabbs National Center for Education Statistics For Information: NAEP Validity Studies (NVS) American Institutes for Research 1791 Arastradero Road Palo Alto, CA 94304-1337 Phone: 650/ 493-3550 Fax: 650/ 858-0958

Table of Contents
Literature .........................................................................................................................................2
Hypotheses ......................................................................................................................................3
Methodology ...................................................................................................................................4
Results..............................................................................................................................................5
Hypothesis 1: Accommodation will increase scores for learning disabled students only. ............................................................................................................................5 Hypothesis 2: The accommodation will reduce construct irrelevant variance due to reading. ..........................................................................................................................6 Hypothesis 3: Accommodated Test Scores Will be More Consonant with Teachers’ Ratings of Student Ability .............................................................................12
Interviews with Teachers ..............................................................................................................14
Interviews with Students ..............................................................................................................15
Discussion......................................................................................................................................16
The Main Effects........................................................................................................................18 Reading and the Effects of the Accommodation .....................................................................18 Possible Construct-irrelevant Difficulty Caused by the Accommodation .............................20 Construct-irrelevant Easiness ...................................................................................................20 Other Possible Sources of Construct-irrelevant Variance.......................................................21
Implications for NAEP .................................................................................................................22
References......................................................................................................................................23
Appendix A: Instruments Used in the Study and Protocol for Acccommodation .....................................................................................................................A-1
Appendix B: Additional Data Tables and Figures ....................................................................B-1


The Validity of Oral Accommodation in Testing 1
The Validity of Oral Accommodation in Testing
In recent years, educators and others responsible for large-scale assessments have sought to include more disabled students in testing programs. Fuller inclusion of students with disabilities in large-scale assessments is viewed as a necessary and positive move, not only for the sake of equity and accessibility, but also as a means of improving the comparability of assessments among units, and over time. Accommodations—and alternative assessments for severely disabled students—are practices that encourage participation of students with disabilities in assessment and accountability systems. Test accommodations are already provided for some students taking the National Assessment of Educational Progress (NAEP) and other large-scale state assessments.
Accommodation in educational and employment testing is covered by the Section 504 of the Rehabilitation Act, the Americans with Disabilities Act (ADA), and the Individuals with Disabilities Education Act (IDEA). The recent drive by educators to provide accommodation in testing has been spurred byand follows the logic ofbroader accommodation guidelines for educational, employment and licensure testing found in these regulations and laws. A reasonable accommodation in testing provides disabled stduents access to tests through alteration in administration procedures that do not change the nature of the constructs being measured. Commonly used accommodations include extended time, oral presentation and response, Braille, sign language interpreters, format changes (e.g., large print), relocation to a quiet room, and computerized aids. Laws about accommodation in testing do not require schools or testing programs to implement special preferences or an easier test for disabled examinees.
The provision of testing accommodations for disabled students is a controversial issue, however, because little empirical research exists about the effects of specific accommodations. While accommodations are usually administered in good faith, altering test administration conditions may inadvertently change the meaning of a test score, causing inferences, and hence the decisions and actions based upon the test score to be flawed. Only empirical research can provide evidence for evaluating the validity and fairness of accommodations use. The present study takes one step toward developing this necessary empirical base.
The conceptual model for this study focuses upon the behavioral and cognitive tasks required to take a test. Sometimes these tasks are the substance of what is being measured (or directly relevant to what is measured), while in other cases tasks are “ancillary” or irrelevant to the meaning of the test score. Haertel and Linn (1996, p. 63) describe “ancillary” parts of a test such as “format, layout, timing and instructions” that are “conditioned by age, language and culture of the intended examinees.” The authors also include literacy and language skills as ancillary tasks underlying some tests. Tests come in a variety of forms and have different degrees and types of ancillary task requirements. Written items depend upon the ability of the examinees to read, and often write, in English. Performance tasks may require a variety of ancillary motor or organizational skills as well as linguistic and literacy skills, while computerized tests presuppose a basic familiarity with typing and computers. The (usually tacit) assumption made by test developers and test users is that students reach a threshold level of proficiency in these

NAEP Validity Studies
2 The Validity of Oral Accommodation in Testing
basic skills so that that these skills become irrelevant to the total score. However, this assumption does not hold for some disabled students whose disability is directly connected to the ancillary skills needed to take a test. These are the students who need testing accommodations.
Stated another way, the provision of accommodations promises to reduce construct irrelevant variance in the test scores of disabled students. Construct irrelevant test score variance is “excess reliable variance that is irrelevant to the interpreted construct” (Messick, 1989). Messick identifies “the intrusion of undue reading comprehension requirements in a test of subject matter knowledge” as one type of construct irrelevant difficulty. A multiple-choice test where the correct answer is always “A” is an example of construct irrelevant easiness.
The main task of the validity investigation reported here is to distinguish between construct relevant and construct irrelevant test score variance, and to determine whether accommodations ameliorate construct irrelevant variance in test scores. More specifically, the study seeks to learn if construct irrelevant variance is reduced in the mathematics test scores of learning disabled students through the use of the testing accommodation of oral presentation. Investigation of the validity of the accommodation occurs through a process of hypothesis testing and modeling of plausible relationships between the effects of the accommodation and other variables such as reading level, reading load of items, and disability characteristics.
Literature
Most of the literature about accommodations and testing for disabled students has been published in the last ten years. A great deal of the literature about accommodations offers conceptual overviews of legal and psychometric issues surrounding the inclusion of disabled students into testing programs and makes suggestions for future empirical research (see, for example, Phillips, 1994; Geisinger, 1994; Hanley, 1994). Surveys of current practice published by the National Center for Educational Outcomes (NCEO) publications (1992–1997) detail state policies for inclusion and exclusion of disabled students from large-scale assessments, examine the types of accommodations used by students in different states, and describe efforts to develop alternate assessments for students who cannot participate in regular assessments. The recent National Research Council report also provides an overview of these issues (McDonnell, McLaughlin, and Morrison, 1997).
A small number of studies published in special education journals have directly tested the effects of specific accommodations (e.g., Alster, 1997; Runyan, 1991, Centra, 1986). In general, these studies support the validity of the use of the accommodation as means of compensating for disabilities.
A report prepared for the Center for Research and Evaluation Standards and Student Testing (CRESST) by Koretz (1997), however, gives a somewhat different picture. Using existing data from the 1995 Kentucky State Assessment for 4th, 8th and 11th grade students, Koretz conducted a number of analyses that compared performance between disabled and non-disabled groups, accommodated and non-accommodated disabled students, and students receiving each accommodation condition. Results of his analyses

NAEP Validity Studies
The Validity of Oral Accommodation in Testing 3
suggest that certain accommodations tend to inflate the scores of disabled students. For instance, comparisons of mean performance showed that mentally retarded students who received the accommodation of dictation scored .1 standard deviation unit above the mean of the non-disabled group, while learning disabled students who received the combined accommodations of oral presentation, dictation and paraphrasing scored from .2 to .5 standard deviation units above the mean for non-disabled students in science. These results are unexpected since mentally retarded and learning disabled students generally perform at or below grade level.
Koretz also found that certain items showed differential easiness or difficulty for disabled students taking the test under accommodated conditions. Items that were harder for students using accommodations included those that involved graphs and tables, while items that had “a complex written array of information” or required “an unusual degree of reading” were made easier by accommodations.
Several studies have directly investigated the effects of oral presentation on students’ test scores. Tindal, et al. (1997) gave a mathematics test to 70 elementary school students using both read-aloud and standardized conditions. The students, who were drawn from both special education and regular education, were also ranked for “general academic” ability in their classes by their teachers. The study found that, for the whole group comparison, all students, regardless of group membership, did significantly better in the read-aloud condition. When only the 10 lowest ranked general education students from each class were included in the analysis, an interaction became apparent with the regular education students failing to gain from the accommodation. When only the five lowest ranked general education students were included in the analysis, their scores actually decreased in the read aloud condition.
The results of the Tindal study argue against the validity of the accommodation on several counts. First, while there is evidence that the accommodation has a compensating effect for special education students, higher achieving regular education students also gain from this accommodation condition. Secondly, the fact that lower achieving regular education students do not profit from the accommodation (and may actually do worse in this condition) argues against the idea that reading level by itself is responsible for differences in variations in response to the accommodation.
The present study is meant to replicate the Tindal study with NAEP mathematics items while directly evaluating questions brought up by both Tindal and Koretz. The Koretz study suggests that certain accommodations are unduly boosting the scores of students. However, the analysis does not provide an answer for why this might occur. Because the accommodations that seem to cause the most inflation are paraphrasing, cueing, and oral presentation and response, the possibility of differential easiness caused by an intermediary exists. Also, because non-disabled students are not allowed the accommodation, part of the inflation may be caused by irrelevant difficulty depressing the scores of some non-disabled students.
Hypotheses
Three main hypotheses are proposed to test the validity of the accommodation of oral presentation:

NAEP Validity Studies
4 The Validity of Oral Accommodation in Testing
1. Having a mathematics test read aloud to students will increase mean scores of learning-disabled students but make little or no difference to the mean scores of students from the regular classroom. The evidence for this would be a statistically significant interaction between the effect of the accommodation and disability group status where learning-disabled students profit from the accommodation, and regular classroom students do not profit.
2. The accommodation of oral presentation will reduce construct irrelevant variance due to reading. Three types of evidence for this hypothesis will be examined:
a) Students in the lower range of the reading distribution should gain more from the accommodation than students who score higher on the reading test, regardless of disability status.
b) Mean score accommodation gains on word problems should be greater than gains on calculation problems that contain few or no words.
c) Students should gain more from the accommodation on test items that contain more complex vocabulary and/or grammatical structures than items with more common words or easier grammar.
3. Accommodated test scores will be more consonant with teachers’ ratings of student ability than non-accommodated tests. Evidence comes from comparison of teacher ratings with student performance on accommodated and non-accommodated tests.
Methodology
Sixty-five learning disabled and 54 non-disabled fourth-grade students (total N = 119) took two matched forms of a mathematics assessment based on NAEP items: one form accommodated, and one form non-accommodated. Order of presentation for the accommodation and form by accommodation condition were counter-balanced. Each test form contained a mixture of word problems and calculation-only items.
The tests were administered in small groups by classroom teachers. In the accommodated condition, the teachers read the test questions and answer choices out loud. Students could request that teachers repeat specific questions.
Students also took the first part of the third grade Terra Nova Reading test, and teachers completed several written instruments. The latter involved rating their students on a list of 33 mathematical operations, ranking their students on overall mathematics and reading ability, and answering detailed questions about each student’s disability status and academic program.
Finally, interviews were conducted with all of the teachers and a sample of the students. Teachers were asked to discuss their rationale for recommending accommodations for individual students and their perceptions and beliefs about the efficacy, effects and fairness of accommodations. Students were asked to discuss their perceptions of the effects and efficacy of the accommodation.
More detail about the instruments used in the study, and the protocol for administering the accommodation can be found in Appendix A.

NAEP Validity Studies
The Validity of Oral Accommodation in Testing 5
Results
Hypothesis 1: Accommodation will increase scores for learning disabled students only.
At the heart of this study are the effects (or lack of effects) of the accommodation of oral presentation. The first hypothesis for the validity of the accommodation states that learning disabled students will perform better on an accommodated test while students from the regular classroom will perform in a roughly similar manner over both test formats. In fact, as shown in Table 1, both groups exhibited a mean increase in scores under the accommodated condition, although students in the learning disabled group gained more.
Table 1. Total Mathematics Scores Under Accommodated (A) and Non-accommodated Conditions (NA) for Learning Disabled and Regular Classroom Groups
Groups Test Condition Effect Size (difference) Read Aloud
(A) Paper and Pencil
(NA)
Learning Disabled x = 11.0 s = 3.37
x = 8.7 s = 3.80
∆ = .64
Regular Classroom x = 14.3 s = 3.20
x = 13.3 s = 3.20
∆ = .31
Total (both groups) x = 12.5 s = 3.68
x = 10.8 s = 4.25
∆ = .42
These results were confirmed with an ANOVA that estimated main effects for the accommodation condition (A) and disability group status (G), and an interactive effect for accommodation condition by group status (A × G).
NAEP Validity Studies
6 The Validity of Oral Accommodation in Testing
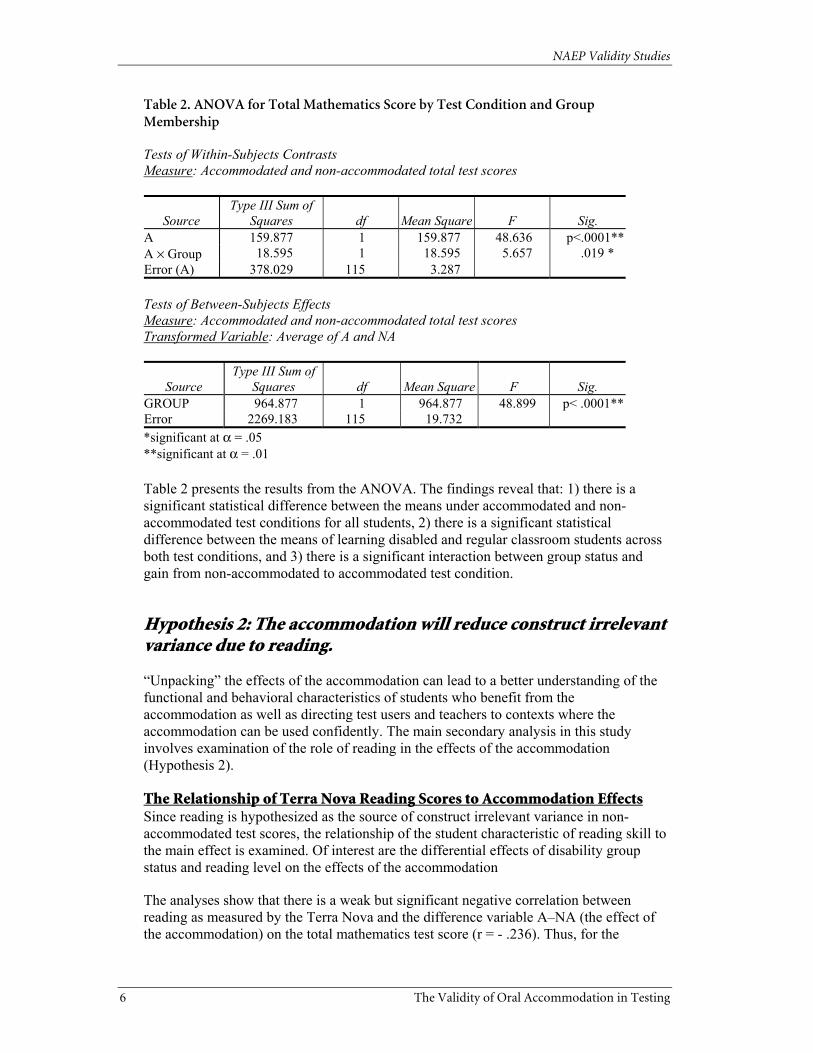
Table 2. ANOVA for Total Mathematics Score by Test Condition and Group Membership
Tests of Within-Subjects Contrasts Measure: Accommodated and non-accommodated total test scores
Source Type III Sum of
Squares df Mean Square F Sig. A 159.877 1 159.877 48.636 p<.0001** A × Group 18.595 1 18.595 5.657 .019 * Error (A) 378.029 115 3.287
Tests of Between-Subjects Effects Measure: Accommodated and non-accommodated total test scores Transformed Variable: Average of A and NA
Source Type III Sum of
Squares df Mean Square F Sig. GROUP 964.877 1 964.877 48.899 p< .0001** Error 2269.183 115 19.732 *significant at α = .05 **significant at α = .01
Table 2 presents the results from the ANOVA. The findings reveal that: 1) there is a significant statistical difference between the means under accommodated and non-accommodated test conditions for all students, 2) there is a significant statistical difference between the means of learning disabled and regular classroom students across both test conditions, and 3) there is a significant interaction between group status and gain from non-accommodated to accommodated test condition.
Hypothesis 2: The accommodation will reduce construct irrelevant variance due to reading.
“Unpacking” the effects of the accommodation can lead to a better understanding of the functional and behavioral characteristics of students who benefit from the accommodation as well as directing test users and teachers to contexts where the accommodation can be used confidently. The main secondary analysis in this study involves examination of the role of reading in the effects of the accommodation (Hypothesis 2).
The Relationship of Terra Nova Reading Scores to Accommodation Effects Since reading is hypothesized as the source of construct irrelevant variance in non-accommodated test scores, the relationship of the student characteristic of reading skill to the main effect is examined. Of interest are the differential effects of disability group status and reading level on the effects of the accommodation
The analyses show that there is a weak but significant negative correlation between reading as measured by the Terra Nova and the difference variable A–NA (the effect of the accommodation) on the total mathematics test score (r = - .236). Thus, for the

NAEP Validity Studies
The Validity of Oral Accommodation in Testing 7
combined group of learning disabled and regular classroom students, students with higher reading performance gain less on the accommodated test.
However, when the same analysis is conducted by disability group, there is a difference between the signs of the regression lines for each group. As reading level increases, regular classroom students gain slightly more from the accommodation, although this correlation is not significant (r = .127). Their learning disabled peers do the opposite: as reading level increases, the gain from the accommodation decreases with a significant correlation of r = -.301. Much of the effect for learning disabled students occurs at lower reading levels where regular students are not well represented in this study.
Figure 1. Regression Lines for Score Gains Under Accommodated Condition as a Function of Reading Scores
Reading Scores
Figure 1 presents separate regression lines for regular classroom and learning disabled groups for the scatter of A - NA and reading scores.
An ANOVA was calculated which adds a dichotomized reading score variable to the analysis by test condition and group membership. (The reading score was dichotomized at .63, which corresponds to the median for all students in the study and approximates the published norm for third grade reading. The resulting groups are balanced for reading but are not balanced by disability status within reading cells.) The results are shown in Table 3.
Scor
e G
ains
(A-A
N)
Group
RC
LD
NAEP Validity Studies
8 The Validity of Oral Accommodation in Testing
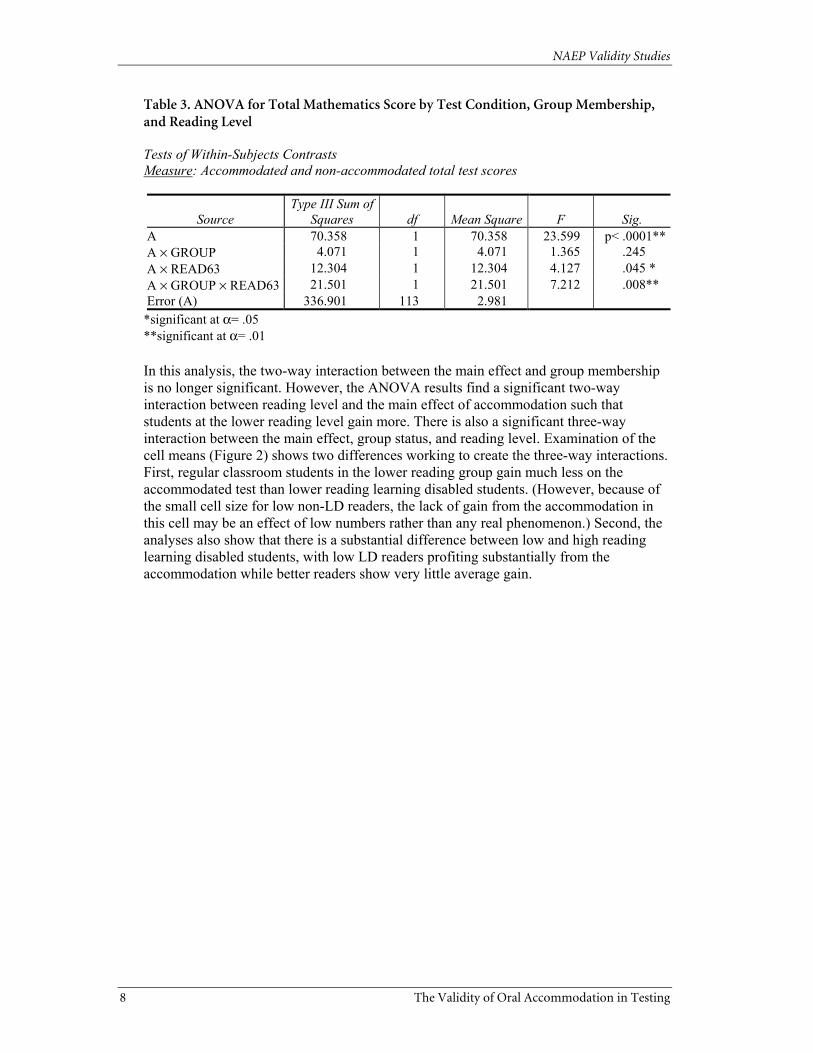
Table 3. ANOVA for Total Mathematics Score by Test Condition, Group Membership, and Reading Level
Tests of Within-Subjects Contrasts Measure: Accommodated and non-accommodated total test scores
Source Type III Sum of
Squares df Mean Square F Sig. A 70.358 1 70.358 23.599 p< .0001** A × GROUP 4.071 1 4.071 1.365 .245 A × READ63 12.304 1 12.304 4.127 .045 * A × GROUP × READ63 21.501 1 21.501 7.212 .008** Error (A) 336.901 113 2.981
*significant at α= .05 **significant at α= .01
In this analysis, the two-way interaction between the main effect and group membership is no longer significant. However, the ANOVA results find a significant two-way interaction between reading level and the main effect of accommodation such that students at the lower reading level gain more. There is also a significant three-way interaction between the main effect, group status, and reading level. Examination of the cell means (Figure 2) shows two differences working to create the three-way interactions. First, regular classroom students in the lower reading group gain much less on the accommodated test than lower reading learning disabled students. (However, because of the small cell size for low non-LD readers, the lack of gain from the accommodation in this cell may be an effect of low numbers rather than any real phenomenon.) Second, the analyses also show that there is a substantial difference between low and high reading learning disabled students, with low LD readers profiting substantially from the accommodation while better readers show very little average gain.

NAEP Validity Studies
The Validity of Oral Accommodation in Testing 9
Figure 2. Differences in Score Gains (A-NA) for Reading Level by Group Membership
0
0.5
1
1.5
2
2.5
3
3.5
Low readers High readers
Scor
e G
ains
(A-A
N)
LD
RC
Comparison of Score Gains on Calculation and Word Problem Subscores Further analysis of the relationship of reading to the effects of the accommodation shifts from student ability to the interaction of student characteristics and test item characteristics. Each mathematics test form included 8 calculation items and 14 word problems. It was hypothesized that the calculation items would pose little reading difficulty and therefore would exhibit only small differences between accommodation conditions. Conversely, the reading difficulty present in the word problems was expected to cause larger differences from the non-accommodated to the accommodated administrations. Table 4 shows the mean score gains for each group of students separately for calculation items and word problems.
Group

NAEP Validity Studies
10 The Validity of Oral Accommodation in Testing
Table 4. Calculation and Word Problem Subscores Under Accommodated (A) and Non-accommodated (NA) Conditions
Calculation Subscore Word Problem Subscore Test Condition Test Condition
Group A NA Effect Size (difference) A NA
Effect Size (difference)
Learning Disabled
x = 3.44 s = 1.52
x = 3.12 s = 1.54
∆ = .20 x = 7.55 s = 2.69
x = 5.64 s = 3.17
∆ = .65
Regular Classroom
x = 4.86 s = 1. 31
x = 4.35 s = 1.51
∆ = .35
x = 9.65 s = 2.23
x= 9.00 s = 2.37
∆ = .28
Total x = 4.07 s = 1.58
x = 3.68 s = 1.64
∆ = .24
x = 8.48 s = 2.70
x = 7.16 s = 3.30
∆ = .44
As can be seen, the learning disabled students did exhibit greater gains on the word problems than on the calculation items, but the pattern did not hold for regular classroom students. (The high delta for regular classroom students on calculation items is reduced somewhatfrom .35 to .29when two outliers are removed from the analysis, but even with this adjustment, the regular classroom students fail to exhibit differentially greater gains on the word problems.)
The ANOVA analyses of the calculation and word problem subscores shown in Appendix B (Tables B-1 and B-2) confirm that there is a significant main effect for the accommodation on both types of items and a significant interaction between group membership and accommodation condition on word problems, but not on calculation items. That is, learning disabled students benefited more than regular classroom students from the accommodation on word problems, but the groups benefited equally from the accommodation on calculation items.
Item P-value Analysis The response patterns of students across items can help answer questions about the interaction of test content and student ability. Pattern of gain can be unidirectional across items (e.g., all items show gain under the accommodated condition) or bi-directional (gains are shown under either accommodated or non-accommodated conditions depending on item). Analysis of bi-directional patterns of item gain can expose possible construct irrelevant difficulty due to the accommodation which would otherwise be masked by total score gains favoring the accommodated format.
Figure 3 presents the p-values for each item on each format of the mathematics test for the total group. As can be seen, most items exhibit some gain under the accommodated condition, but three items (calculation 2, calculation 4, and word problem 6) are slightly more difficult when administered with the accommodation.

NAEP Validity Studies
The Validity of Oral Accommodation in Testing 11
Figure 3. Item P-values Under Accommodated and Non-accommodated Test Conditions: Total Sample
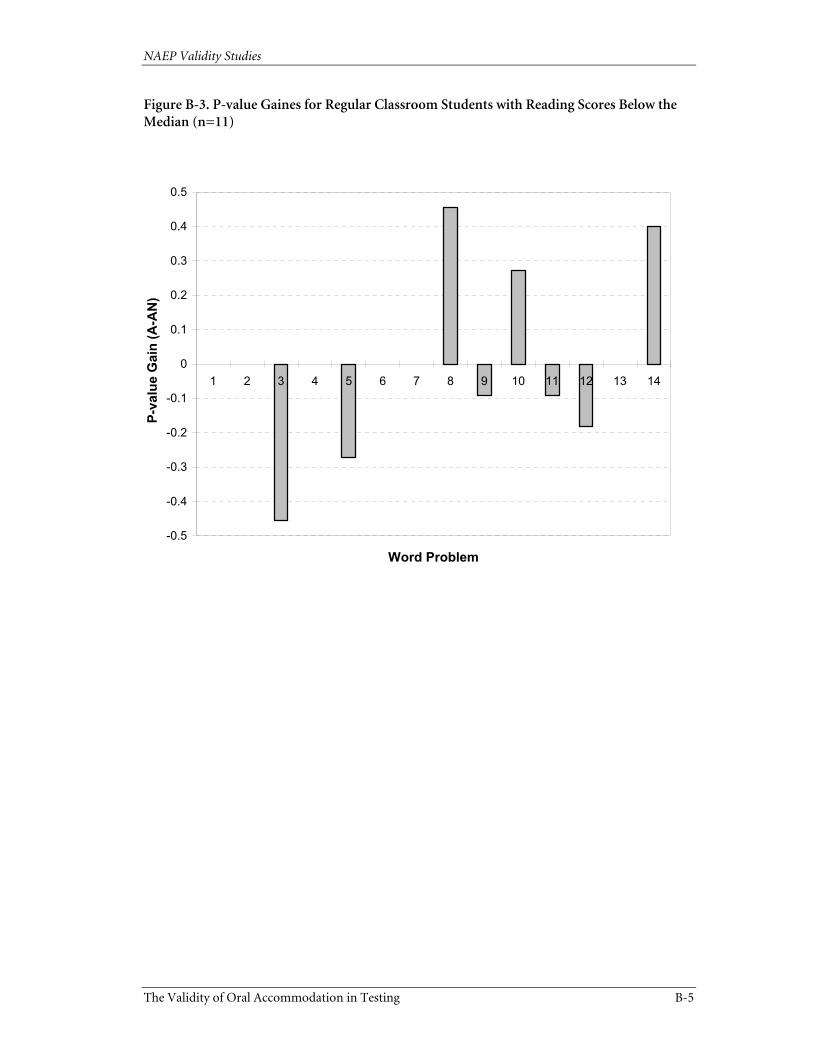
Gain patterns for word problems were examined separately for the four subgroups of students defined by crossing reading level with disability status. This analysis reveals substantial differences between the gain patterns for low-reading learning disabled students and the rest of the students in the sample. Low-reading learning disabled students show a unidirectional gain in favor of the accommodated format. Conversely, disabled students reading above the median, and regular students in both reading-level groups show gains that are bi-directional and often near zero. The results are displayed in Appendix B, Figures B-1 through B-4.
The 14 word problems were analyzed using a variety of linguistic indices in an effort to understand why gain patterns differed across items. However, the analyses did not reveal clear cut explanations. P-value differences were not significantly correlated with mean sentence length, prepositional density, or verb frequency. The unsatisfactory outcomes of these analyses may reflect the fact that the same variables that predict reading difficulty may also predict difficulty in listening to a test and so may be useless in predicting differences between the two test formats.
A greater association was observed between p-value gains and the average SFI index of an item, where the SFI index is a measure that quantifies the frequency with which a
0
0.1
0.2
0.3
0.4
0.5
0.6
0.7
0.8
0.9
1ca
lc1
calc
2
calc
3
calc
4
calc
5
calc
6
calc
7
calc
8 it1 it2 it3 it4 it5 it6 it7 it8 it9 it10
it11
it12
it13
it14
Item
P-va
lue
Accommodated test condition Non-accommodated test condition

NAEP Validity Studies
12 The Validity of Oral Accommodation in Testing
word appears in English language text. In this case, a negative correlation was seen, indicating that accommodation gains were relatively greater for items containing more unusual words. However, the correlation for regular classroom students (r = -.44 versus r = -.28 for LD students) subsumed the fact that several items with low SFI indices (i.e., items with more familiar vocabulary) actually dropped in p-value for these students when administered with the accommodation.
Impact of Discrepancy Between Mathematics and Reading Ability When the accommodation works in its intended manner, students with low reading ability but higher mathematics skills should gain more from the accommodation than students with roughly equal ability in both subjects. Based on rankings provided by teachers, students were classified into one of three groups: students with high mathematics and low reading skills, students with relatively equal skills in both areas, and students with high reading skills and low mathematics skills. The average score gains under accommodated conditions for students in each of these three groups are shown in Table 5. Differences in score gains were not statistically significant, but the general trend supports the validity argument.
Table 5. Mean Score Gains Under Accommodated Condition for Students with Different Patterns of Mathematics and Reading Skills (based on teacher rankings)
N Mean
Score Gain Std. DeviationMathematics skills lower than reading skills 11 .727 2.83 Mathematics skills equal to reading skills 90 1.756 2.61 Mathematics skills higher than reading skills
16 2.250 2.49
Hypothesis 3: Accommodated Test Scores Will be More Consonant with Teachers’ Ratings of Student Ability
The third hypothesis proposes that accommodated test results should be more consonant with teacher ratings of student ability than non-accommodated test results. To examine this hypothesis, teacher ratings of students’ specific mathematics abilities were matched with item level results on the accommodated and non-accommodated mathematics tests.
A sample item from the 30-item rating survey administered to teachers reads:
This student can: Add two and three digit whole numbers with carrying…
1 2 3 4 Almost never Sometimes Always No evidence for
evaluation

NAEP Validity Studies
The Validity of Oral Accommodation in Testing 13
A matched item on the mathematics test is a two or more digit addition problem. Some mathematics problems from the tests have more than one match on the survey. For example, a word problem may involve identifying the operation that is required and then carrying out the operation. Likewise, one item on the survey may have more than one item match on the test. The resulting comparisons take the form of a “hit and miss” contingency table, as shown below.
Teacher Rating Student Response 0 1 2 3 incorrect deleted from
analysis hit neither hit nor
miss miss
correct deleted from analysis
miss neither hit nor miss
hit
For this analysis, each student was given a hit, miss or “sometimes” score on each item match. If the teacher predicted the student’s performance correctly (a hit), the student was given a 2; if the teacher was incorrect in his or her prediction (a miss), the student was given a zero, and if the teacher made an ambiguous prediction (i.e., that the student would be able to perform the referenced operation “sometimes”), the student was given a 1 regardless of his or her performance on the test item. Scores were then summed across item matches and averaged across students. When more than one survey item matched a test item, the scores were averaged across matches within an item. A repeated measures ANOVA was then performed on the resulting scores using the same accommodation by disability group design (A × G) used in the regular analysis.
The results of the ANOVA are presented in Table 6.
Table 6. ANOVA for Teacher Prediction by Test Condition and Group Membership: Total Sample
Tests of Within-Subjects Contrasts Measure: Prediction of item level performance
Source Type III Sum of
Squares df Mean Square F Sig. A .112 1 .112 6.574 .012*
A × GROUP 3.868E-02 1 3.868E-02 2.272 .135 Error (A) 1.787 105 1.702E-02
Tests of Between-Subjects Effects Measure: Prediction of item level performance Transformed Variable: Average of A and NA
Source Type III Sum of
Squares df Mean Square F Sig. GROUP .582 1 .582 6.341 .013*
Error 9.636 105 9.178E-02 * Significant at α = .05

NAEP Validity Studies
14 The Validity of Oral Accommodation in Testing
These results suggest that teachers’ estimations of student mathematics ability are slightly more consonant with the accommodated test than with the non-accommodated test. Somewhat surprisingly, there is also greater predictive accuracy for the regular classroom group than for the learning disabled group, although the interaction term for accommodation by group membership is not significant. When the same comparison is examined for only students gaining three or more points on the accommodation (A–NA >= 3) the differences in mean prediction rates increases, again favoring the accommodated test. Table B-3 in Appendix B shows the ANOVA for this comparison.
Interviews with Teachers
Teachers were interviewed to learn their views on the effects and general fairness of using the accommodation. Teachers were also asked about their views on excluding students from standardized testing, and about the feasibility of alternate means for administering the same accommodation.
Teachers offered explanations for why the accommodation works for some students and not for others. All teachers felt that reading content in test items posed a barrier for their students, and expected very poor readers to do much better on the accommodated test than on the non-accommodated test. In many cases they believed that not using the accommodation would frustrate students or lower their self-esteem.
Reading skill was the most important feature teachers identified as making a difference for the effect of the accommodation for individual students. However, when asked to predict the effects of the accommodation for individuals, teachers seemed to do no better than chance at predicting which students would gain the most from the accommodation.
While reading was cited as important to the effect of the accommodation, the likely effect of the teacher’s directing and pacing students through the test was also emphasized. Learning disabled students generally have less experience with testing, and some have difficulties concentrating on the test without the assistance of teachers. Others may hurry through paper and pencil tests without concentrating. One teacher explained the effects of the accommodation for one student in terms of engagement.
I would predict that the LD students probably didn't do as well just because they weren't as engaged… I watched this one little boy who I know has really good math ability and when I was reading it to him he was smiling and he was working… he had set up a problem, the whole thing. That was on the word problems particularly. And I watched him do the other test, when I didn't readhe would glance at it and he'd, he'd wait for a minute. I don't know if he was trying to figure it out or what… he would go right to the next one or flip the page and go on. It was like ‘I can't do that.’ He didn't even attempt it.
Other teachers concurred with this description of the effects of the accommodation. The effects of the accommodation are described variously as “made students focus,” “engaged students,” and “made them pay attention.”

NAEP Validity Studies
The Validity of Oral Accommodation in Testing 15
Eight of the nineteen teachers believed that the accommodation distracted or frustrated some of the students from the regular classroom. One teacher described the effect of the accommodation for regular classroom students in this manner:
Some of them kind of get on a roll, and reading the test aloud slowed some of them down. [They said] “I know this stuff.” I'm going, you know, to do well on it. They're more independent workers, and when you make them stay with you [by reading aloud] it frustrates them.
Other teachers described the effect of the accommodation for regular education students as “frustrating,” and “it holds them up.” Four teachers reported that some students began talking while waiting for the next problem.
All except one teacher agreed with the general policy rationale for including students with disabilities in testing. The benefits for the policy of inclusion stated by teachers include more attention for students with disabilities from administrators and greater accountability for regular classroom teachers who have special education students in their classes. A special education teacher explained:
Well, I'll give you my rationale on this. I don't think [students should be excluded] because I think there's a real danger of if we exclude children who have special needs from testing, then teachers won't take the same amount of responsibility for those kids because they know it's sort of…well, we'll just push this one over in the corner. And if they don't have to show progress on something like a test, then they're not as likely to invest as much effort as they do for children who are expected to be tested.
A similar argument emphasizing accountability was offered by three other teachers. These teachers believed that including disabled students brings attention to these students in the mainstream classroom, and focuses administrators’ attention on special education programs.
By contrast, one teacher did not believe that her students should be included in testing. Her reason for this was related to her distrust of standardized tests in general, and her belief that the special education students’ confidence is hurt by testing. She was planning on excluding her students from the upcoming state assessment even though her students would be assigned zero scores for not participating.
All teachers in the sample felt that students with more severe disabilities should be excluded from standardized testing programs. Characteristics of these students included students with Autism, severe cognitive deficits, severe emotional problems, and students with specific mental health problems (e.g., schizophrenia). Teachers feel that testing for many of these students is essentially meaningless and in some cases cruel.
Interviews with Students
Students were interviewed (in groups of six) to learn their views of the accommodation. Students were asked which test they preferred, which test was harder, which test they
NAEP Validity Studies
16 The Validity of Oral Accommodation in Testing
believe they performed better on, and if they had experienced difficulty reading the test questions.
When students were asked which test they preferred, they (overwhelmingly) said that they preferred the paper and pencil test to the test read aloud. Several students felt that taking the test with the accommodation “took too much time.” One regular classroom student said he disliked the accommodated test because “they won't let you go ahead.” This result was a bit surprising, but understandable given teachers’ views on the secondary effects of the accommodation: students may dislike having to pay attention to the teacher.
When students were asked if they understood the test better with the accommodation or with paper and pencil, all students except two said they understood the test better when read aloud. When asked why, most either didn’t know, or said they had difficulty reading the test items. The two students who disagreed were both from the regular classroom. They said that they preferred working on the test by themselves.
When students were asked if they believed they did better when the test was read to them all but three students said that they had done better on the accommodated test.
Students were asked about any difficulties they had experienced with specific vocabulary in test items. Words identified as problematic included “census” (which one student believed meant “senses”) and words for money such as quarter, dime and nickel. Several learning disabled students told the researcher they couldn’t read the test questions.
Discussion
The current study seeks to learn 1) if the accommodation removes (or adds) construct irrelevant variance to test scores, 2) what are the possible sources of construct irrelevant variance, and 3) if the construct irrelevant variance is limited to students who would be entitled to receive the accommodation under current test practices (i.e., students labeled as learning disabled) or if other students are also affected by the accommodation. Table 7 summarizes the validity evidence found by this study.

NAEP Validity Studies
The Validity of Oral Accommodation in Testing 17
Table 7. Summary of Validity Evidence for Learning Disabled and Regular Classroom Groups
Main Effect for Accommodation
Correlation of Main Effect with Reading
Ability Effect for Word
Problem Subscore Effect for Calculation
Item Subscore
Correlation of Word Problem ∆ w/
Reading Ability Learning Disabled ∆ = .64 −.3∗ ∆ = .65 ∆ = .28 −.244 Regular Classroom ∆ = .31 .1 ∆ = .28 ∆ = .35 .238
Correlation of Calculation Item
∆ w/ Reading Ability Item Gain Direction
Correlation of Item P-value w/Average Word Familiarity
(SFI Index) Teacher Prediction of Student Performance
Learning Disabled −.119 All favor A −.28 A > NA Regular Classroom −.068 Split A/NA −.44 A >NA (RC > LD)
*significant at α = .05

NAEP Validity Studies
The Validity of Oral Accommodation in Testing 18
The Main Effects
The main effect for the accommodation on the total test score is larger for the learning disabled students than for the regular classroom students. The presence of an effect for the regular classroom students suggests the possibility that irrelevant variance in the non-accommodated scores is overcome by the use of the accommodation for both disabled and regular classroom students. This result mirrors recent studies by Fuchs, L., Fuchs, D., Eaton,, Hamlett, and Karns (1998) and Tindal (1997) where both learning disabled and regular classroom students performed significantly better on an accommodated test using the accommodation of oral presentation but with much larger gains by disabled students. It is slightly different from the Tindal, Heath, Hollenbeck, Almond, and Harniss (1998) study, which found a large effect for disabled students but no significant effect for regular classroom students administered the oral accommodation by video.
In the present study, learning disabled students with low reading skills gained uniformly across all word problems under the accommodated condition. This result suggests that the general word problem format more than the specific linguistic content of particular items forms a barrier to participation in testing for these students. In contrast, learning disabled students with higher reading skills and all regular education students showed a mixed pattern of gainswith some items appearing easier under the accommodated condition, but other items appearing easier under the non-accommodated condition. Still other items showed little change in p-value as a function of test condition. This means that for regular classroom students and higher reading learning disabled students, the effect of the accommodation is item specific. A similar result was found in Helwig, Rozek-Tedesco, Heath, Tindal, and Almond (1998), where selected items read aloud exhibited significant gains for a mixed group of disabled and regular classroom students, but no main effect was found for the accommodation on the total test score. Significant total score gains on other tests and in other studies may depend more upon the content of individual items than upon a general pervasive effect due to the accommodation.
Reading and the Effects of the Accommodation
Low reading ability is one possible explanation of construct irrelevant variance in non-accommodated test scores. Reading a test aloud should remove the barrier posed by poor decoding skills, with very poor readers gaining more from the accommodation than better readers given equal variability in conditional distributions of mathematics ability for each reading level.
Most of the learning disabled students in the present sample read very poorly. While Terra Nova reading test scores overlapped for the disabled and regular classroom students, most of the learning disabled students read at a second-grade level, and some had difficulty reading at all. Inability to read at grade level is compounded and complicated by a constellation of other problems such as attention deficit, emotional and behavioral problems, lack of motivation, and slow cognitive processing. Many learning disabled students experience general academic difficulties in writing, spelling, mathematics, and other academic subjects.

NAEP Validity Studies
The Validity of Oral Accommodation in Testing 19
Reading significantly correlated with the effect of the accommodation for disabled students in the present sample. Learning disabled students who were very low readers exhibited (almost uniformly) positive gains from the accommodation. On the other hand, some learning disabled students at or above the third grade reading level did worse on the accommodated test than on the paper and pencil format, and the overall effect of the accommodation approached zero as reading skill increased. This evidence suggests that learning disabled students with better reading skills are not as challenged by the word problem format as poor learning disabled readers.
Learning disabled students also experienced larger gains under the accommodated condition for test content that included text (word problems) as opposed to items containing calculations only. For disabled students, gains on word problem items correlate with reading ability measured by the Terra Nova. No significant correlation exists between reading and the gains or losses for calculation items.
While reading correlates with the effect of the accommodation for the disabled sample, the same model cannot be applied to the regular classroom students. First, no significant correlation exists between reading scores and the effect of the accommodation for regular classroom students. Further, the non-significant correlation is in the positive direction, with better readers gaining more. One difficulty with this comparison is that few regular classroom students exhibit the very low reading skills typical of the (learning disabled) students who experienced the large gains from the accommodation. Be that as it may, those regular classroom students in the study with reading scores below the median exhibited no gains on the word problem subscore under the accommodated condition, either because of lack of power caused by small numbers, or because these students respond to the accommodation in a different manner than the learning disabled students. One obvious difference between the groups is their history of accommodation use. Learning disabled students are used to having tests and assignments real aloud; the regular classroom students do not receive accommodations in their classes.
The accommodation had some positive effect on performance in the calculation-only items for both learning disabled and regular classroom students, even though these items do not require what is typically considered to be reading skills. The positive effect was not correlated with reading ability, and was slightly larger in the regular classroom group. Moreover, although this unexplained effect was smaller than the main effect on the word problem subscore for the disabled group, for the regular classroom sample, the effect sizes for the calculation subscore, the word problem subscore, and the total score were roughly similar. Several hypotheses can be ventured about the effect for calculation subscores. One hypothesis is that unfamiliarity with item formats (such as addition in columns versus rows) may be overcome by reading the test aloud. Another hypothesis is that the gain on calculation items occurs because students are kept on task when the test is read aloud.
A measure of the average familiarity of words appearing in the item text (the SFI index) was negatively correlated with p-value gains under the accommodated condition. That is, items with less familiar words (words that appear less frequently in typical English text) tend to become differentially easier with the accommodation. Presumably this finding reflects a discrepancy between text familiarity and spoken vocabulary that is overcome by reading a test aloud. However, the negative correlation between SFI and item gain is stronger for regular classroom students than for others in the sample. While this result may seem contradictory with the general finding that student reading ability is not

NAEP Validity Studies
20 The Validity of Oral Accommodation in Testing
correlated with the effect of the accommodation for these students, examination of the gains and losses on items for each group shows that students in the regular classroom group (especially in the lower reading levels) do worse on a number of items with high SFI indices when they are administered in the accommodated format. The implications of this pattern are discussed below in the section related to construct irrelevant difficulty due to the accommodation.
Possible Construct-irrelevant Difficulty Caused by the Accommodation
Why do poor-reading regular classroom students fail to gain from the accommodation in the composite measure? Construct irrelevant variance caused by the accommodation may make the test, or some items on the test, harder for a specific population. Evidence of difficulty due to the accommodation is found in p-value differences on items that favor the non-accommodated test format.
There are two types of gains exhibited by students in the sample, and these gains relate to the question of construct irrelevant difficulty introduced by the accommodation. The first type of gain is positive across all items in favor of the accommodation; the second pattern item gains vary in direction between accommodated and non-accommodated formats. When item level performance is examined by disability group and reading ability, the pattern of gains for each test condition becomes more evident. Learning disabled students who are poor readers (as a group) show the first type of gain: these students perform better on all items under the accommodated condition. Learning disabled students with reading scores above the median show item gains in both directions, as do all regular classroom students. For the regular classroom students with reading scores below the median (who do not profit from the accommodation), this pattern becomes pronounced as the main composite effect for the word problems disappears.
Evidence of construct irrelevant variance caused by the accommodation is bolstered by the relationship of p-value gains to the SFI index. This correlative pattern is most evident in the relationship of p-value gains for lower-reading regular classroom students. Why should items with a lack of difficult words in text correlate with students doing worse under the accommodated conditon? One hypothesis is, for some items the accommodation helps overcome reading difficulty due to specific linguistic features in an item, but when this barrier does not exist, the accommodation becomes a distraction. Interviews with participating teachers support this hypothesis. Teachers said that regular classroom students sometimes became impatient with the time needed to finish reading items aloud. Regular classroom students also reported that they disliked taking the accommodated test because of its pace. Construct irrelevant variance due to the accommodation could also be present for students in Tindal’s study (1997) in which very low achieving regular classroom students lost ground on accommodated tests.
Construct-irrelevant Easiness
Construct irrelevant easiness may be introduced into the accommodated score by an intermediary (the teacher) who provides the student with either conscious or unconscious help. Where this type of assistance becomes most critical is in high stakes situations

NAEP Validity Studies
The Validity of Oral Accommodation in Testing 21
where a test score has consequences (rewards or punishments) for a student, teacher, or school. In these situations, teachers might act in bad faith to assist students, although this type of cheating could also occur with a paper and pencil test. For this study, no consequences were attached to the result and so there was little obvious motivation to help students consciously with the accommodation. In real life situations, secondary data analysis might be used to discover bad faith efforts, or unconscious assistance (see Koretz, 1997). In-service training and the use of standardized protocols to administer the accommodation could help prevent differential easiness.
The possibility of unconscious assistance remains in this study. Teachers could give away an answer by subtly emphasizing the correct answer choice through voice inflection or body language, or, in attempt to be helpful, paraphrase questions so that the answer becomes obvious to the students.
In the item-by-item comparison, the accommodated test is slightly more congruent with teacher ratings of student ability than the non-accommodated test. Some students in the study did substantially better on the accommodated test, registering three to seven point gains over the paper and pencil administration. If these students took a “real” test, the validity of inferences about these students’ ability level would be substantially affected by the test administration procedures that were used. Consider a hypothetical learning disabled student who gained six points on a twenty-two point scale. The inference drawn from the non-accommodated test would indicate that the student only had rudimentary mathematics skills in addition, subtraction, and simple probability. The accommodated test would send a different message: that the student understands inequalities, graphing, and operations with money. If only students who gain three or more points on the accommodated test are included in the comparative analysis, the difference in predictive power between the accommodated and non-accommodated tests becomes greater in favor of the accommodated test.
This evidence indicates that differential easiness due to unexplained factors may affect a minority of students’ scores, but as a group the accommodated test is a better representation of student ability than the non-accommodated test.
Other Possible Sources of Construct-irrelevant Variance
When teachers were asked for their perspective on the reasons why the accommodation improves performance, most mentioned the potential of the accommodation to offset reading difficulties, but also mentioned that the accommodation would help students remain on task. Some students will hurry through a written test, become distracted, or give up on the test without finishing. When students are read a test aloud, they are paced through the test and the teacher communicates an expectation that the student will work in a concentrated manner on the problems. This variance is probably best categorized as construct irrelevant: the ability to concentrate on taking a test is a learned behavior that has little to do with the content area being assessed. It is quite possible that this assistance accounts for the gain in the regular classroom sample as well as a portion of the gains made by learning disabled students. Unfortunately, no direct quantitative measure of attention exists for these students. Further research could control for this aspect of the accommodation by presenting a paced paper and pencil test to students.

NAEP Validity Studies
22 The Validity of Oral Accommodation in Testing
Implications for NAEP
NAEP began using accommodations for testing only recently. Even if scores from accommodated tests were found to be highly inflated or (deflated) representations of student ability, the effect upon aggregate trend lines would be weak. Two factors mitigate any broad influence of accommodated scores on the integrity of NAEP trends. First, only a relatively small proportion of students in the national sample are disabled, and only a portion of these students use accommodations. Second, most NAEP items are too difficult for the majority of the learning disabled students. On a real NAEP item block, the disabled students in this study would do very poorly, and the accommodation (for the majority of students) would only change their scores marginally. From interviews with the special education teachers in the study, it became evident that most of the item content covered in NAEP (i.e., fractions, decimals, measurement) was not included in the mathematics curricula for these students.
While the contribution of accommodated scores to NAEP trend lines is most likely small, it is still in NAEP’s best interest to provide the fairest and most valid test possible to all of its students. For learning disabled students, this study presents evidence that: 1) learning disabled students taking easy NAEP items tend to do better when these items are read aloud than in standard format: 2) lower-reading learning disabled students are more affected by the accommodation than their peers with better reading scores: 3) the accommodation has a greater impact for items with reading content than for items with only numbers: 4) items with less commonly used words tend to show greater gains on the accommodated format than items with more common words: and 5) accommodated scores (with some exceptions) are more consonant with teachers’ ratings of student ability than non-accommodated scores. Also, learning disabled students tended to profit in a fairly uniform manner from the accommodation across different types of items. If the model for the behavior of the accommodation presented in this paper is accepted (i.e., the criteria for a valid accommodation are plausible), it behooves NAEP to provide the accommodation of oral presentation for those learning disabled students who are deemed eligible to use the accommodation.
For non-disabled students the evidence is mixed and may be flawed by methodological problems. First, very low readers in the regular classroom did not seem to profit from the accommodation, although this result may be due to their poor representation in the sample. Second, item content (word problems versus computation only) did not seem to make much of a difference on the effects of the accommodation for regular classroom students. Third, these students performed better on a number of items in the paper and pencil format. For any policy decision that contemplates providing these students with accommodations, more research should be done to learn if the patterns shown in this study can be reproduced.

NAEP Validity Studies
The Validity of Oral Accommodation in Testing 23
References
Alster, E.H. (1997). The effects of extended time on algebra test scores for college students with and without learning disabilities. Journal of Learning Disabilities, V. 30 (2), p. 222-227.
Centra, J.A (1986). Handicapped student performance on the scholastic aptitude test. Journal of Learning Disabilities, 19, n.6, p. 324-327.
Fuchs, L.S., Fuchs, D., Eaton, S.B., Hamlett, C., and Karns, K. Mathematics test accommodations for students with learning disabilities: Supplementing teacher judgments with the Dynamic Assessment of Test Accommodations (DATA). Manuscript submitted for publication.
Geisinger, K.F. (1994). Psychometric issues in testing students with disabilities. Applied measurement in education, 7(2), 121-140.
Hanley, T.V. (1994). The need for technological advances in assessment related to national educational reform. Exceptional Children, v61, n3, p. 222-229.
Haertel, E. H., Linn, R. L. (1996). Comparability. In G.W. Phillips (Ed.). Technical Issues in Large Scale Performance Assessment. Washington, DC: National Center for Educational Statistics: pp. 59-78.
Helwig, R., Rozek-Tedesco, M.A., Heath, B., Tindal, G., and Almond, P. (1998, April). The relationship between reading ability and performance on a video accommodated math problem-solving task. Paper presented at the meeting of the American Education Research Association, San Diego, CA.
Koretz, D. (1997). CRESST Technical Report on Accommodations in Kentucky Assessment.
Messick, S. (1989). Validity. In R.L. Linn (Ed.). Educational measurement (3rd ed, pp. 13-101). Washington DC: American Council on Education & National Council on Measurement in Education.
McDonnell, L.M., Mclaughlin, M.J. and Morison, P. (Eds.). (1997). Educating one and all: Students with disabilities and standards based reform. National Academy Press: Washington D.C.
Philips, S.E. (1994) High stakes testing accommodations: Validity v. disabled rights. Applied Measurement in Education. 7 (2), 93-120.
Runyan, M.K., (1991). The effect of extra time on reading comprehension scores for university students with and without learning disabilities. Journal of Learning Disabilities, V.24 (2), p.104-107
Tindal, G. et. al (1997). Accommodating students with disabilities on large-scale tests: and empirical study of student response and test administration demands. AERA paper.

NAEP Validity Studies
24 The Validity of Oral Accommodation in Testing
Tindal, G., Heath, B., Hollenbeck, K., Almond, P., & Harniss, M. (1998). Accommodating students with disabilities on large-scale tests: An empirical study of student response and test administration demands. Exceptional Children, 64(4), 439–450.

The Validity of Oral Accommodation in Testing A-1
Appendix A: Instruments Used in the Study and Protocol for Accommodation
Instruments
The instruments used in this study include:
1. Two matching forms of a mathematics test.
Each form (Form A and Form B) has 22 items. Eight items involve calculation only, and 14 are word problems. Items were chosen from the 1990, 1992, and 1996 NAEP publicly released items. Items with p-values of less than .4 were excluded from the pool of items considered for the test. Items were also shown to teachers before the study to judge appropriate difficulty and to determine whether the content in the items was covered in the curriculum.
The widest possible range of operations was sought for the finalized test forms. The resulting test included: four basic operations, greater than/less than, number translation, operations with money, graphs, simple probability, and identification of operations from word problems.
NAEP items were distributed equally between Form A and Form B. Nearly identical items were written that changed numbers, names or other nouns, and tried to keep word length constant. These altered items filled out each form. Sentence structure and the length of words were kept constant.
2. Rating survey
Teachers rated their students’ capabilities on a list of 33 mathematical operations. These operations included all material presented on the test along with other operations that were not on the test. For each item, teachers were asked to specify whether the student could perform/understand the operation “never,” “sometimes,” or “nearly all of the time,” or to indicate that they had “no evidence for evaluation.”
3. Ranking survey
Teachers ranked the students participating in the study in overall mathematics and reading ability. Teachers were asked to first give a straight ranking, and then to place students as they would rank in their mainstream classroom. Teachers were also asked to identify those students who they believed had the largest discrepancy between reading and mathematics ability.

NAEP Validity Studies
A-2 The Validity of Oral Accommodation in Testing
4. Disability survey
Teachers were asked to answer 14 questions about the characteristics of the disabled students in the study. Questions included ratings of time spent in the mainstream classroom, the severity of the students’ disabilities, and students’ ability to work independently. Teachers were asked open-ended questions about how the disability manifested itself in the classroom, what extra services students received, the student’s history of accommodation use, and descriptions of any auditory processing or memory problems.
5. Terra Nova Reading test
Students took part one of the third-grade Terra Nova reading comprehension test. This test has 29 items. The Terra Nova is a widely used standardized test produced by CTB McGraw Hill.
6. Teacher Interviews
All teachers in the study were interviewed after they participated in the study. Teachers were asked questions about their general impressions of administering an accommodated test. Teachers were also asked about their views on excluding students from standardized tests, and asked general questions about the fairness of the accommodation.
7. Student interviews
Eighteen students (in three groups of six) were interviewed about their impressions of the tests. Students were asked if they liked one testing condition more than another, if they thought one condition was more difficult than another, and in which condition they thought they had scored better. Students were also asked if they had experienced any difficulties reading the tests.
Administration of Tests
Teachers administered the tests to small groups of students. Form and accommodation order were counterbalanced by the researcher beforehand to control for practice effects, differences in form difficulty, and regression toward the mean. Tests were administered one week, but not more than 10 days apart. A time limit of 55 minutes was placed on the paper and pencil test, although none of the students exceeded this limit. Teachers were asked not to cover the material on the test between test administrations.
The accommodation of oral presentation was defined in this study as teachers reading the test items and possible test answers aloud. If students wanted the questions and/or answers read again, they raised their hands and asked for the teacher to repeat the question. Up to three repetitions were allowed. Teachers were told not to emphasize the right answer through voice changes or body language. Five teachers were observed administering the accommodated test.
The small groups in this study ranged from three students to ten students. Most groups had six students, three learning disabled and three regular education.

NAEP Validity Studies
The Validity of Oral Accommodation in Testing A-3
The Terra Nova reading test was administered in a standard paper and pencil format after the teacher read the instructions.
Learning disabled students were eligible to participate in the study if they 1) had an IEP stating that they had a perceptual-communicative disorder, 2) had used the accommodation of oral presentation in the classroom or in testing during the past year, 3) did not use another accommodation that would interfere with the results of the study, 4) could meaningfully participate in the paper and pencil test (e.g., they weren’t also blind), and 5) were fluent in spoken English. Regular classroom students could participate in the study if they 1) had never been recommended or placed in special education, 2) had average or below average mathematics ability as judged by a classroom teacher, and 3) spoke fluent English.

NAEP Validity Studies
A-4 The Validity of Oral Accommodation in Testing
.

The Validity of Oral Accommodation in Testing B-1
Appendix B. Additional Data Tables and Figures
Table B-1. ANOVA for Calculation Subscore by Test Condition and Group Membership
Tests of Within-Subjects Contrasts Measure: Accommodated and non-accommodated calculation subscores
Source Type III Sum of
Squares df Mean Square F Sig. A 10.248 1 10.248 12.866 p<.0001** A × GROUP .556 1 .556 .698 .405 Error (A) 91.598 115 .797
Table B-2. ANOVA for Word Problem Subscore by Test Condition and Group Membership
Tests of Within-Subjects Contrasts Measure: Accommodated and non-accommodated Word Problem subscores
Source Type III Sum of
Squares df Mean Square F Sig. A 89.170 1 89.170 31.939 p<.0001**
A × Group 25.580 1 25.580 9.162 .003** Error (A) 321.069 115 2.792
*significant at α = .05 **significant at α = .01

NAEP Validity Studies
B-2 The Validity of Oral Accommodation in Testing
Table B-3. ANOVA for Teacher Prediction Variable by Test Conditions and Group Membership: Students with A–NA Greater or Equal to Three
Tests of Within-Subjects Contrasts Measure: Prediction of item-level performance
Source Type III Sum of
Squares df Mean Square F Sig. A .336 1 .336 17.306 p <.0001** A × GROUP 7.249E-02 1 7.249E-02 3.728 .060 Error (A) .817 42 1.944E-02 Tests of Between-Subjects Effects Measure: Prediction of item-level performance Transformed Variable: Average of A and NA
Source Type III Sum of
Squares df Mean Square F Sig. GROUP 4.267E-02 1 4.267E-02 .416 .523 Error 4.310 42 .103 * significant at α = .05 **significant at α = .01

NAEP Validity Studies
The Validity of Oral Accommodation in Testing B-3
Figure B-1. P-value Gains for Learning Disabled Students with Reading Scores Below the Median (n=48)
0
0.05
0.1
0.15
0.2
0.25
0.3
0.35
1 2 3 4 5 6 7 8 9 10 11 12 13 14
Word Problem
P-Va
lue
Gai
n (A
-AN
)

NAEP Validity Studies
B-4 The Validity of Oral Accommodation in Testing
Figure B-2. P-value Gains for Learning Disabled Students with Reading Scores Above the Median (n=17)
-0.4
-0.3
-0.2
-0.1
0
0.1
0.2
0.3
1 2 3 4 5 6 7 8 9 10 11 12 13 14
Word Problem
P-va
lue
Gai
n (A
-NA
)
NAEP Validity Studies
The Validity of Oral Accommodation in Testing B-5
Figure B-3. P-value Gaines for Regular Classroom Students with Reading Scores Below the Median (n=11)
-0.5
-0.4
-0.3
-0.2
-0.1
0
0.1
0.2
0.3
0.4
0.5
1 2 3 4 5 6 7 8 9 10 11 12 13 14
Word Problem
P-va
lue
Gai
n (A
-AN
)

NAEP Validity Studies
B-6 The Validity of Oral Accommodation in Testing
Figure B-4. P-value Gains for Regular Classroom Students with Reading Scores Above the Median (n=43)
-0.15
-0.1
-0.05
0
0.05
0.1
0.15
0.2
0.25
0.3
1 2 3 4 5 6 7 8 9 10 11 12 13 14
Word Problem
P-va
lue
Gai
ns (A
-AN
)

Listing of NCES Working Papers to Date Working papers can be downloaded as .pdf files from the NCES Electronic Catalog (http://nces.ed.gov/pubsearch/). You can also contact Sheilah Jupiter at (202) 502–7363 ([email protected]) if you are interested in any of the following papers.
Listing of NCES Working Papers by Program Area No. Title NCES contact
Baccalaureate and Beyond (B&B)
98–15 Development of a Prototype System for Accessing Linked NCES Data Steven Kaufman 2001–15 Baccalaureate and Beyond Longitudinal Study: 2000/01 Follow-Up Field Test
Methodology Report Andrew G. Malizio
2002–04 Improving Consistency of Response Categories Across NCES Surveys Marilyn Seastrom Beginning Postsecondary Students (BPS) Longitudinal Study
98–11 Beginning Postsecondary Students Longitudinal Study First Follow-up (BPS:96–98) Field Test Report
Aurora D’Amico
98–15 Development of a Prototype System for Accessing Linked NCES Data Steven Kaufman 1999–15 Projected Postsecondary Outcomes of 1992 High School Graduates Aurora D’Amico 2001–04 Beginning Postsecondary Students Longitudinal Study: 1996–2001 (BPS:1996/2001)
Field Test Methodology Report Paula Knepper
2002–04 Improving Consistency of Response Categories Across NCES Surveys Marilyn Seastrom Common Core of Data (CCD)
95–12 Rural Education Data User’s Guide Samuel Peng 96–19 Assessment and Analysis of School-Level Expenditures William J. Fowler, Jr. 97–15 Customer Service Survey: Common Core of Data Coordinators Lee Hoffman 97–43 Measuring Inflation in Public School Costs William J. Fowler, Jr. 98–15 Development of a Prototype System for Accessing Linked NCES Data Steven Kaufman
1999–03 Evaluation of the 1996–97 Nonfiscal Common Core of Data Surveys Data Collection, Processing, and Editing Cycle
Beth Young
2000–12 Coverage Evaluation of the 1994–95 Common Core of Data: Public Elementary/Secondary School Universe Survey
Beth Young
2000–13 Non-professional Staff in the Schools and Staffing Survey (SASS) and Common Core of Data (CCD)
Kerry Gruber
2002–02 School Locale Codes 1987 - 2000 Frank Johnson Data Development
2000–16a Lifelong Learning NCES Task Force: Final Report Volume I Lisa Hudson 2000–16b Lifelong Learning NCES Task Force: Final Report Volume II Lisa Hudson Decennial Census School District Project
95–12 Rural Education Data User’s Guide Samuel Peng 96–04 Census Mapping Project/School District Data Book Tai Phan 98–07 Decennial Census School District Project Planning Report Tai Phan
Early Childhood Longitudinal Study (ECLS)
96–08 How Accurate are Teacher Judgments of Students’ Academic Performance? Jerry West 96–18 Assessment of Social Competence, Adaptive Behaviors, and Approaches to Learning with
Young Children Jerry West
97–24 Formulating a Design for the ECLS: A Review of Longitudinal Studies Jerry West 97–36 Measuring the Quality of Program Environments in Head Start and Other Early Childhood
Programs: A Review and Recommendations for Future Research Jerry West
1999–01 A Birth Cohort Study: Conceptual and Design Considerations and Rationale Jerry West 2000–04 Selected Papers on Education Surveys: Papers Presented at the 1998 and 1999 ASA and
1999 AAPOR Meetings Dan Kasprzyk
2001–02 Measuring Father Involvement in Young Children's Lives: Recommendations for a Fatherhood Module for the ECLS-B
Jerry West
2001–03 Measures of Socio-Emotional Development in Middle Childhood Elvira Hausken

No. Title NCES contact 2001–06 Papers from the Early Childhood Longitudinal Studies Program: Presented at the 2001
AERA and SRCD Meetings Jerry West
2002-05 Early Childhood Longitudinal Study-Kindergarten Class of 1998–99 (ECLS–K), Psychometric Report for Kindergarten Through First Grade
Elvira Hausken
Education Finance Statistics Center (EDFIN)
94–05 Cost-of-Education Differentials Across the States William J. Fowler, Jr. 96–19 Assessment and Analysis of School-Level Expenditures William J. Fowler, Jr. 97–43 Measuring Inflation in Public School Costs William J. Fowler, Jr. 98–04 Geographic Variations in Public Schools’ Costs William J. Fowler, Jr.
1999–16 Measuring Resources in Education: From Accounting to the Resource Cost Model Approach
William J. Fowler, Jr.
Education Longitudinal Study: 2002 (ELS:2002)
2003-03 Education Longitudinal Study: 2002 (ELS: 2002) Field Test Report Jeffrey Owings High School and Beyond (HS&B)
95–12 Rural Education Data User’s Guide Samuel Peng 1999–05 Procedures Guide for Transcript Studies Dawn Nelson 1999–06 1998 Revision of the Secondary School Taxonomy Dawn Nelson 2002–04 Improving Consistency of Response Categories Across NCES Surveys Marilyn Seastrom
HS Transcript Studies
1999–05 Procedures Guide for Transcript Studies Dawn Nelson 1999–06 1998 Revision of the Secondary School Taxonomy Dawn Nelson 2003–01 Mathematics, Foreign Language, and Science Coursetaking and the NELS:88 Transcript
Data Jeffrey Owings
2003–02 English Coursetaking and the NELS:88 Transcript Data Jeffrey Owings International Adult Literacy Survey (IALS)
97–33 Adult Literacy: An International Perspective Marilyn Binkley Integrated Postsecondary Education Data System (IPEDS)
97–27 Pilot Test of IPEDS Finance Survey Peter Stowe 98–15 Development of a Prototype System for Accessing Linked NCES Data Steven Kaufman
2000–14 IPEDS Finance Data Comparisons Under the 1997 Financial Accounting Standards for Private, Not-for-Profit Institutes: A Concept Paper
Peter Stowe
National Assessment of Adult Literacy (NAAL)
98–17 Developing the National Assessment of Adult Literacy: Recommendations from Stakeholders
Sheida White
1999–09a 1992 National Adult Literacy Survey: An Overview Alex Sedlacek 1999–09b 1992 National Adult Literacy Survey: Sample Design Alex Sedlacek 1999–09c 1992 National Adult Literacy Survey: Weighting and Population Estimates Alex Sedlacek 1999–09d 1992 National Adult Literacy Survey: Development of the Survey Instruments Alex Sedlacek 1999–09e 1992 National Adult Literacy Survey: Scaling and Proficiency Estimates Alex Sedlacek 1999–09f 1992 National Adult Literacy Survey: Interpreting the Adult Literacy Scales and Literacy
Levels Alex Sedlacek
1999–09g 1992 National Adult Literacy Survey: Literacy Levels and the Response Probability Convention
Alex Sedlacek
2000–05 Secondary Statistical Modeling With the National Assessment of Adult Literacy: Implications for the Design of the Background Questionnaire
Sheida White
2000–06 Using Telephone and Mail Surveys as a Supplement or Alternative to Door-to-Door Surveys in the Assessment of Adult Literacy
Sheida White
2000–07 “How Much Literacy is Enough?” Issues in Defining and Reporting Performance Standards for the National Assessment of Adult Literacy
Sheida White
2000–08 Evaluation of the 1992 NALS Background Survey Questionnaire: An Analysis of Uses with Recommendations for Revisions
Sheida White
2000–09 Demographic Changes and Literacy Development in a Decade Sheida White 2001–08 Assessing the Lexile Framework: Results of a Panel Meeting Sheida White

No. Title NCES contact 2002–04 Improving Consistency of Response Categories Across NCES Surveys Marilyn Seastrom
National Assessment of Educational Progress (NAEP)
95–12 Rural Education Data User’s Guide Samuel Peng 97–29
Can State Assessment Data be Used to Reduce State NAEP Sample Sizes? Steven Gorman
97–30 ACT’s NAEP Redesign Project: Assessment Design is the Key to Useful and Stable
Assessment Results Steven Gorman
97–31 NAEP Reconfigured: An Integrated Redesign of the National Assessment of Educational Progress
Steven Gorman
97–32 Innovative Solutions to Intractable Large Scale Assessment (Problem 2: Background Questionnaires)
Steven Gorman
97–37 Optimal Rating Procedures and Methodology for NAEP Open-ended Items Steven Gorman 97–44 Development of a SASS 1993–94 School-Level Student Achievement Subfile: Using
State Assessments and State NAEP, Feasibility Study Michael Ross
98–15 Development of a Prototype System for Accessing Linked NCES Data Steven Kaufman 1999–05 Procedures Guide for Transcript Studies Dawn Nelson 1999–06 1998 Revision of the Secondary School Taxonomy Dawn Nelson 2001–07 A Comparison of the National Assessment of Educational Progress (NAEP), the Third
International Mathematics and Science Study Repeat (TIMSS-R), and the Programme for International Student Assessment (PISA)
Arnold Goldstein
2001–08 Assessing the Lexile Framework: Results of a Panel Meeting Sheida White 2001–11 Impact of Selected Background Variables on Students’ NAEP Math Performance Arnold Goldstein 2001–13 The Effects of Accommodations on the Assessment of LEP Students in NAEP Arnold Goldstein 2001–19 The Measurement of Home Background Indicators: Cognitive Laboratory Investigations
of the Responses of Fourth and Eighth Graders to Questionnaire Items and Parental Assessment of the Invasiveness of These Items
Arnold Goldstein
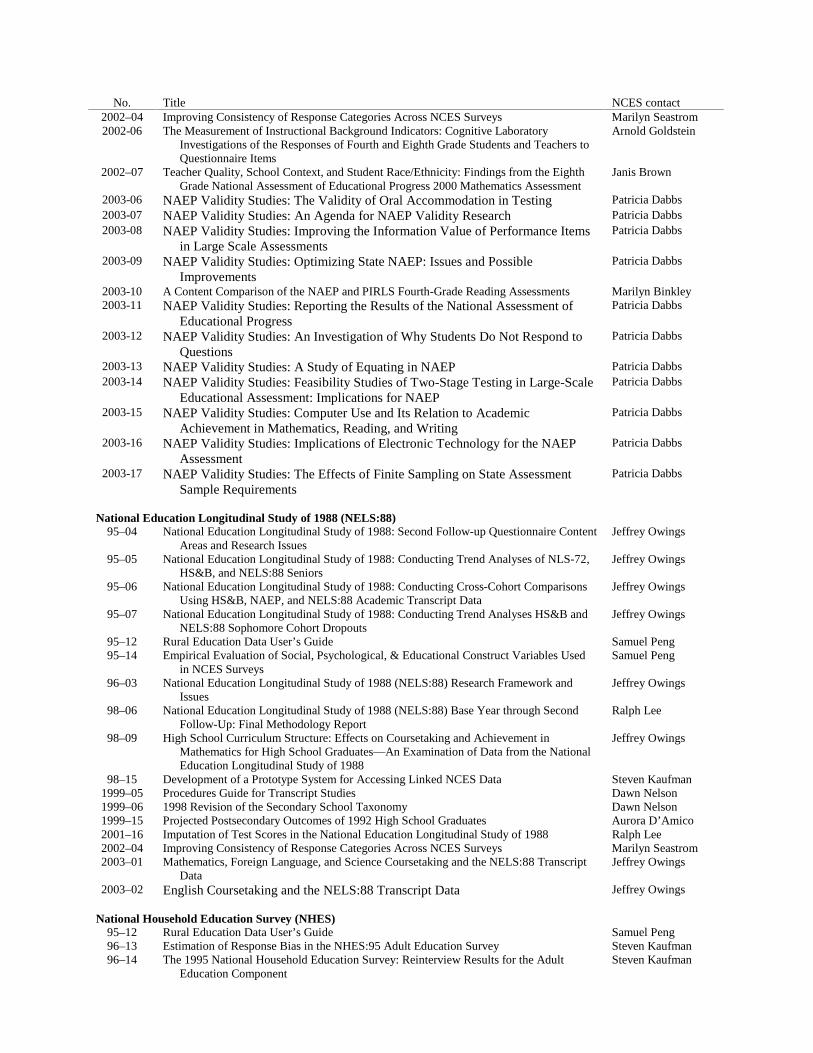
No. Title NCES contact 2002–04 Improving Consistency of Response Categories Across NCES Surveys Marilyn Seastrom 2002-06
2002–07
The Measurement of Instructional Background Indicators: Cognitive Laboratory Investigations of the Responses of Fourth and Eighth Grade Students and Teachers to Questionnaire Items
Teacher Quality, School Context, and Student Race/Ethnicity: Findings from the Eighth Grade National Assessment of Educational Progress 2000 Mathematics Assessment
Arnold Goldstein Janis Brown
2003-06 NAEP Validity Studies: The Validity of Oral Accommodation in Testing Patricia Dabbs 2003-07 NAEP Validity Studies: An Agenda for NAEP Validity Research Patricia Dabbs 2003-08 NAEP Validity Studies: Improving the Information Value of Performance Items
in Large Scale Assessments Patricia Dabbs
2003-09 NAEP Validity Studies: Optimizing State NAEP: Issues and Possible Improvements
Patricia Dabbs
2003-10 A Content Comparison of the NAEP and PIRLS Fourth-Grade Reading Assessments Marilyn Binkley 2003-11 NAEP Validity Studies: Reporting the Results of the National Assessment of
Educational Progress Patricia Dabbs
2003-12 NAEP Validity Studies: An Investigation of Why Students Do Not Respond to Questions
Patricia Dabbs
2003-13 NAEP Validity Studies: A Study of Equating in NAEP Patricia Dabbs 2003-14 NAEP Validity Studies: Feasibility Studies of Two-Stage Testing in Large-Scale
Educational Assessment: Implications for NAEP Patricia Dabbs
2003-15 NAEP Validity Studies: Computer Use and Its Relation to Academic Achievement in Mathematics, Reading, and Writing
Patricia Dabbs
2003-16 NAEP Validity Studies: Implications of Electronic Technology for the NAEP Assessment
Patricia Dabbs
2003-17 NAEP Validity Studies: The Effects of Finite Sampling on State Assessment Sample Requirements
Patricia Dabbs
National Education Longitudinal Study of 1988 (NELS:88)
95–04 National Education Longitudinal Study of 1988: Second Follow-up Questionnaire Content Areas and Research Issues
Jeffrey Owings
95–05 National Education Longitudinal Study of 1988: Conducting Trend Analyses of NLS-72, HS&B, and NELS:88 Seniors
Jeffrey Owings
95–06 National Education Longitudinal Study of 1988: Conducting Cross-Cohort Comparisons Using HS&B, NAEP, and NELS:88 Academic Transcript Data
Jeffrey Owings
95–07 National Education Longitudinal Study of 1988: Conducting Trend Analyses HS&B and NELS:88 Sophomore Cohort Dropouts
Jeffrey Owings
95–12 Rural Education Data User’s Guide Samuel Peng 95–14 Empirical Evaluation of Social, Psychological, & Educational Construct Variables Used
in NCES Surveys Samuel Peng
96–03 National Education Longitudinal Study of 1988 (NELS:88) Research Framework and Issues
Jeffrey Owings
98–06 National Education Longitudinal Study of 1988 (NELS:88) Base Year through Second Follow-Up: Final Methodology Report
Ralph Lee
98–09 High School Curriculum Structure: Effects on Coursetaking and Achievement in Mathematics for High School Graduates—An Examination of Data from the National Education Longitudinal Study of 1988
Jeffrey Owings
98–15 Development of a Prototype System for Accessing Linked NCES Data Steven Kaufman 1999–05 Procedures Guide for Transcript Studies Dawn Nelson 1999–06 1998 Revision of the Secondary School Taxonomy Dawn Nelson 1999–15 Projected Postsecondary Outcomes of 1992 High School Graduates Aurora D’Amico 2001–16 Imputation of Test Scores in the National Education Longitudinal Study of 1988 Ralph Lee 2002–04 Improving Consistency of Response Categories Across NCES Surveys Marilyn Seastrom 2003–01 Mathematics, Foreign Language, and Science Coursetaking and the NELS:88 Transcript
Data Jeffrey Owings
2003–02 English Coursetaking and the NELS:88 Transcript Data Jeffrey Owings National Household Education Survey (NHES)
95–12 Rural Education Data User’s Guide Samuel Peng 96–13 Estimation of Response Bias in the NHES:95 Adult Education Survey Steven Kaufman 96–14 The 1995 National Household Education Survey: Reinterview Results for the Adult
Education Component Steven Kaufman

No. Title NCES contact 96–20 1991 National Household Education Survey (NHES:91) Questionnaires: Screener, Early
Childhood Education, and Adult Education Kathryn Chandler
96–21 1993 National Household Education Survey (NHES:93) Questionnaires: Screener, School Readiness, and School Safety and Discipline
Kathryn Chandler
96–22 1995 National Household Education Survey (NHES:95) Questionnaires: Screener, Early Childhood Program Participation, and Adult Education
Kathryn Chandler
96–29 Undercoverage Bias in Estimates of Characteristics of Adults and 0- to 2-Year-Olds in the 1995 National Household Education Survey (NHES:95)
Kathryn Chandler
96–30 Comparison of Estimates from the 1995 National Household Education Survey (NHES:95)
Kathryn Chandler
97–02 Telephone Coverage Bias and Recorded Interviews in the 1993 National Household Education Survey (NHES:93)
Kathryn Chandler
97–03 1991 and 1995 National Household Education Survey Questionnaires: NHES:91 Screener, NHES:91 Adult Education, NHES:95 Basic Screener, and NHES:95 Adult Education
Kathryn Chandler
97–04 Design, Data Collection, Monitoring, Interview Administration Time, and Data Editing in the 1993 National Household Education Survey (NHES:93)
Kathryn Chandler
97–05 Unit and Item Response, Weighting, and Imputation Procedures in the 1993 National Household Education Survey (NHES:93)
Kathryn Chandler
97–06 Unit and Item Response, Weighting, and Imputation Procedures in the 1995 National Household Education Survey (NHES:95)
Kathryn Chandler
97–08 Design, Data Collection, Interview Timing, and Data Editing in the 1995 National Household Education Survey
Kathryn Chandler
97–19 National Household Education Survey of 1995: Adult Education Course Coding Manual Peter Stowe 97–20 National Household Education Survey of 1995: Adult Education Course Code Merge
Files User’s Guide Peter Stowe
97–25 1996 National Household Education Survey (NHES:96) Questionnaires: Screener/Household and Library, Parent and Family Involvement in Education and Civic Involvement, Youth Civic Involvement, and Adult Civic Involvement
Kathryn Chandler
97–28 Comparison of Estimates in the 1996 National Household Education Survey Kathryn Chandler 97–34 Comparison of Estimates from the 1993 National Household Education Survey Kathryn Chandler 97–35 Design, Data Collection, Interview Administration Time, and Data Editing in the 1996
National Household Education Survey Kathryn Chandler
97–38 Reinterview Results for the Parent and Youth Components of the 1996 National Household Education Survey
Kathryn Chandler
97–39 Undercoverage Bias in Estimates of Characteristics of Households and Adults in the 1996 National Household Education Survey
Kathryn Chandler
97–40 Unit and Item Response Rates, Weighting, and Imputation Procedures in the 1996 National Household Education Survey
Kathryn Chandler
98–03 Adult Education in the 1990s: A Report on the 1991 National Household Education Survey
Peter Stowe
98–10 Adult Education Participation Decisions and Barriers: Review of Conceptual Frameworks and Empirical Studies
Peter Stowe
2002–04 Improving Consistency of Response Categories Across NCES Surveys Marilyn Seastrom National Longitudinal Study of the High School Class of 1972 (NLS-72)
95–12 Rural Education Data User’s Guide Samuel Peng 2002–04 Improving Consistency of Response Categories Across NCES Surveys Marilyn Seastrom
National Postsecondary Student Aid Study (NPSAS)
96–17 National Postsecondary Student Aid Study: 1996 Field Test Methodology Report Andrew G. Malizio 2000–17 National Postsecondary Student Aid Study:2000 Field Test Methodology Report Andrew G. Malizio 2002–03 National Postsecondary Student Aid Study, 1999–2000 (NPSAS:2000), CATI
Nonresponse Bias Analysis Report. Andrew Malizio
2002–04 Improving Consistency of Response Categories Across NCES Surveys Marilyn Seastrom
National Study of Postsecondary Faculty (NSOPF) 97–26 Strategies for Improving Accuracy of Postsecondary Faculty Lists Linda Zimbler 98–15 Development of a Prototype System for Accessing Linked NCES Data Steven Kaufman
2000–01 1999 National Study of Postsecondary Faculty (NSOPF:99) Field Test Report Linda Zimbler

No. Title NCES contact 2002–04 Improving Consistency of Response Categories Across NCES Surveys Marilyn Seastrom 2002–08 A Profile of Part-time Faculty: Fall 1998 Linda Zimbler
Postsecondary Education Descriptive Analysis Reports (PEDAR)
2000–11 Financial Aid Profile of Graduate Students in Science and Engineering Aurora D’Amico Private School Universe Survey (PSS)
95–16 Intersurvey Consistency in NCES Private School Surveys Steven Kaufman 95–17 Estimates of Expenditures for Private K–12 Schools Stephen Broughman 96–16 Strategies for Collecting Finance Data from Private Schools Stephen Broughman 96–26 Improving the Coverage of Private Elementary-Secondary Schools Steven Kaufman 96–27 Intersurvey Consistency in NCES Private School Surveys for 1993–94 Steven Kaufman 97–07 The Determinants of Per-Pupil Expenditures in Private Elementary and Secondary
Schools: An Exploratory Analysis Stephen Broughman
97–22 Collection of Private School Finance Data: Development of a Questionnaire Stephen Broughman 98–15 Development of a Prototype System for Accessing Linked NCES Data Steven Kaufman
2000–04 Selected Papers on Education Surveys: Papers Presented at the 1998 and 1999 ASA and 1999 AAPOR Meetings
Dan Kasprzyk
2000–15 Feasibility Report: School-Level Finance Pretest, Private School Questionnaire Stephen Broughman Progress in International Reading Literacy Study (PIRLS)
2003–05 PIRLS-IEA Reading Literacy Framework: Comparative Analysis of the 1991 IEA Reading Study and the Progress in International Reading Literacy Study
Laurence Ogle
2003-10 A Content Comparison of the NAEP and PIRLS Fourth-Grade Reading Assessments Marilyn Binkley Recent College Graduates (RCG)
98–15 Development of a Prototype System for Accessing Linked NCES Data Steven Kaufman 2002–04 Improving Consistency of Response Categories Across NCES Surveys Marilyn Seastrom
Schools and Staffing Survey (SASS)
94–01 Schools and Staffing Survey (SASS) Papers Presented at Meetings of the American Statistical Association
Dan Kasprzyk
94–02 Generalized Variance Estimate for Schools and Staffing Survey (SASS) Dan Kasprzyk 94–03 1991 Schools and Staffing Survey (SASS) Reinterview Response Variance Report Dan Kasprzyk 94–04 The Accuracy of Teachers’ Self-reports on their Postsecondary Education: Teacher
Transcript Study, Schools and Staffing Survey Dan Kasprzyk
94–06 Six Papers on Teachers from the 1990–91 Schools and Staffing Survey and Other Related Surveys
Dan Kasprzyk
95–01 Schools and Staffing Survey: 1994 Papers Presented at the 1994 Meeting of the American Statistical Association
Dan Kasprzyk
95–02 QED Estimates of the 1990–91 Schools and Staffing Survey: Deriving and Comparing QED School Estimates with CCD Estimates
Dan Kasprzyk
95–03 Schools and Staffing Survey: 1990–91 SASS Cross-Questionnaire Analysis Dan Kasprzyk 95–08 CCD Adjustment to the 1990–91 SASS: A Comparison of Estimates Dan Kasprzyk 95–09 The Results of the 1993 Teacher List Validation Study (TLVS) Dan Kasprzyk 95–10 The Results of the 1991–92 Teacher Follow-up Survey (TFS) Reinterview and Extensive
Reconciliation Dan Kasprzyk
95–11 Measuring Instruction, Curriculum Content, and Instructional Resources: The Status of Recent Work
Sharon Bobbitt & John Ralph
95–12 Rural Education Data User’s Guide Samuel Peng 95–14 Empirical Evaluation of Social, Psychological, & Educational Construct Variables Used
in NCES Surveys Samuel Peng
95–15 Classroom Instructional Processes: A Review of Existing Measurement Approaches and Their Applicability for the Teacher Follow-up Survey
Sharon Bobbitt
95–16 Intersurvey Consistency in NCES Private School Surveys Steven Kaufman 95–18 An Agenda for Research on Teachers and Schools: Revisiting NCES’ Schools and
Staffing Survey Dan Kasprzyk
96–01 Methodological Issues in the Study of Teachers’ Careers: Critical Features of a Truly Longitudinal Study
Dan Kasprzyk
96–02 Schools and Staffing Survey (SASS): 1995 Selected papers presented at the 1995 Meeting of the American Statistical Association
Dan Kasprzyk
96–05 Cognitive Research on the Teacher Listing Form for the Schools and Staffing Survey Dan Kasprzyk

No. Title NCES contact 96–06 The Schools and Staffing Survey (SASS) for 1998–99: Design Recommendations to
Inform Broad Education Policy Dan Kasprzyk
96–07 Should SASS Measure Instructional Processes and Teacher Effectiveness? Dan Kasprzyk 96–09 Making Data Relevant for Policy Discussions: Redesigning the School Administrator
Questionnaire for the 1998–99 SASS Dan Kasprzyk
96–10 1998–99 Schools and Staffing Survey: Issues Related to Survey Depth Dan Kasprzyk 96–11 Towards an Organizational Database on America’s Schools: A Proposal for the Future of
SASS, with comments on School Reform, Governance, and Finance Dan Kasprzyk
96–12 Predictors of Retention, Transfer, and Attrition of Special and General Education Teachers: Data from the 1989 Teacher Followup Survey
Dan Kasprzyk
96–15 Nested Structures: District-Level Data in the Schools and Staffing Survey Dan Kasprzyk 96–23 Linking Student Data to SASS: Why, When, How Dan Kasprzyk 96–24 National Assessments of Teacher Quality Dan Kasprzyk 96–25 Measures of Inservice Professional Development: Suggested Items for the 1998–1999
Schools and Staffing Survey Dan Kasprzyk
96–28 Student Learning, Teaching Quality, and Professional Development: Theoretical Linkages, Current Measurement, and Recommendations for Future Data Collection
Mary Rollefson
97–01 Selected Papers on Education Surveys: Papers Presented at the 1996 Meeting of the American Statistical Association
Dan Kasprzyk
97–07 The Determinants of Per-Pupil Expenditures in Private Elementary and Secondary Schools: An Exploratory Analysis
Stephen Broughman
97–09 Status of Data on Crime and Violence in Schools: Final Report Lee Hoffman 97–10 Report of Cognitive Research on the Public and Private School Teacher Questionnaires
for the Schools and Staffing Survey 1993–94 School Year Dan Kasprzyk
97–11 International Comparisons of Inservice Professional Development Dan Kasprzyk 97–12 Measuring School Reform: Recommendations for Future SASS Data Collection Mary Rollefson 97–14 Optimal Choice of Periodicities for the Schools and Staffing Survey: Modeling and
Analysis Steven Kaufman
97–18 Improving the Mail Return Rates of SASS Surveys: A Review of the Literature Steven Kaufman 97–22 Collection of Private School Finance Data: Development of a Questionnaire Stephen Broughman 97–23 Further Cognitive Research on the Schools and Staffing Survey (SASS) Teacher Listing
Form Dan Kasprzyk
97–41 Selected Papers on the Schools and Staffing Survey: Papers Presented at the 1997 Meeting of the American Statistical Association
Steve Kaufman
97–42 Improving the Measurement of Staffing Resources at the School Level: The Development of Recommendations for NCES for the Schools and Staffing Survey (SASS)
Mary Rollefson
97–44 Development of a SASS 1993–94 School-Level Student Achievement Subfile: Using State Assessments and State NAEP, Feasibility Study
Michael Ross
98–01 Collection of Public School Expenditure Data: Development of a Questionnaire Stephen Broughman 98–02 Response Variance in the 1993–94 Schools and Staffing Survey: A Reinterview Report Steven Kaufman 98–04 Geographic Variations in Public Schools’ Costs William J. Fowler, Jr. 98–05 SASS Documentation: 1993–94 SASS Student Sampling Problems; Solutions for
Determining the Numerators for the SASS Private School (3B) Second-Stage Factors Steven Kaufman
98–08 The Redesign of the Schools and Staffing Survey for 1999–2000: A Position Paper Dan Kasprzyk 98–12 A Bootstrap Variance Estimator for Systematic PPS Sampling Steven Kaufman 98–13 Response Variance in the 1994–95 Teacher Follow-up Survey Steven Kaufman 98–14 Variance Estimation of Imputed Survey Data Steven Kaufman 98–15 Development of a Prototype System for Accessing Linked NCES Data Steven Kaufman 98–16 A Feasibility Study of Longitudinal Design for Schools and Staffing Survey Stephen Broughman
1999–02 Tracking Secondary Use of the Schools and Staffing Survey Data: Preliminary Results Dan Kasprzyk 1999–04 Measuring Teacher Qualifications Dan Kasprzyk 1999–07 Collection of Resource and Expenditure Data on the Schools and Staffing Survey Stephen Broughman 1999–08 Measuring Classroom Instructional Processes: Using Survey and Case Study Fieldtest
Results to Improve Item Construction Dan Kasprzyk
1999–10 What Users Say About Schools and Staffing Survey Publications Dan Kasprzyk 1999–12 1993–94 Schools and Staffing Survey: Data File User’s Manual, Volume III: Public-Use
Codebook Kerry Gruber
1999–13 1993–94 Schools and Staffing Survey: Data File User’s Manual, Volume IV: Bureau of Indian Affairs (BIA) Restricted-Use Codebook
Kerry Gruber
1999–14 1994–95 Teacher Followup Survey: Data File User’s Manual, Restricted-Use Codebook Kerry Gruber 1999–17 Secondary Use of the Schools and Staffing Survey Data Susan Wiley 2000–04 Selected Papers on Education Surveys: Papers Presented at the 1998 and 1999 ASA and
1999 AAPOR Meetings Dan Kasprzyk

No. Title NCES contact 2000–10 A Research Agenda for the 1999–2000 Schools and Staffing Survey Dan Kasprzyk 2000–13 Non-professional Staff in the Schools and Staffing Survey (SASS) and Common Core of
Data (CCD) Kerry Gruber
2000–18 Feasibility Report: School-Level Finance Pretest, Public School District Questionnaire Stephen Broughman 2002–04 Improving Consistency of Response Categories Across NCES Surveys Marilyn Seastrom
Third International Mathematics and Science Study (TIMSS)
2001–01 Cross-National Variation in Educational Preparation for Adulthood: From Early Adolescence to Young Adulthood
Elvira Hausken
2001–05 Using TIMSS to Analyze Correlates of Performance Variation in Mathematics Patrick Gonzales 2001–07 A Comparison of the National Assessment of Educational Progress (NAEP), the Third
International Mathematics and Science Study Repeat (TIMSS-R), and the Programme for International Student Assessment (PISA)
Arnold Goldstein
2002–01 Legal and Ethical Issues in the Use of Video in Education Research Patrick Gonzales

Listing of NCES Working Papers by Subject
No. Title NCES contact Achievement (student) - mathematics
2001–05 Using TIMSS to Analyze Correlates of Performance Variation in Mathematics Patrick Gonzales Adult education
96–14 The 1995 National Household Education Survey: Reinterview Results for the Adult Education Component
Steven Kaufman
96–20 1991 National Household Education Survey (NHES:91) Questionnaires: Screener, Early Childhood Education, and Adult Education
Kathryn Chandler
96–22 1995 National Household Education Survey (NHES:95) Questionnaires: Screener, Early Childhood Program Participation, and Adult Education
Kathryn Chandler
98–03 Adult Education in the 1990s: A Report on the 1991 National Household Education Survey
Peter Stowe
98–10 Adult Education Participation Decisions and Barriers: Review of Conceptual Frameworks and Empirical Studies
Peter Stowe
1999–11 Data Sources on Lifelong Learning Available from the National Center for Education Statistics
Lisa Hudson
2000–16a Lifelong Learning NCES Task Force: Final Report Volume I Lisa Hudson 2000–16b Lifelong Learning NCES Task Force: Final Report Volume II Lisa Hudson Adult literacy—see Literacy of adults
American Indian – education
1999–13 1993–94 Schools and Staffing Survey: Data File User’s Manual, Volume IV: Bureau of Indian Affairs (BIA) Restricted-Use Codebook
Kerry Gruber
Assessment/achievement
95–12 Rural Education Data User’s Guide Samuel Peng 95–13 Assessing Students with Disabilities and Limited English Proficiency James Houser 97–29 Can State Assessment Data be Used to Reduce State NAEP Sample Sizes? Larry Ogle 97–30 ACT’s NAEP Redesign Project: Assessment Design is the Key to Useful and Stable
Assessment Results Larry Ogle
97–31 NAEP Reconfigured: An Integrated Redesign of the National Assessment of Educational Progress
Larry Ogle
97–32 Innovative Solutions to Intractable Large Scale Assessment (Problem 2: Background Questions)
Larry Ogle
97–37 Optimal Rating Procedures and Methodology for NAEP Open-ended Items Larry Ogle 97–44 Development of a SASS 1993–94 School-Level Student Achievement Subfile: Using
State Assessments and State NAEP, Feasibility Study Michael Ross
98–09 High School Curriculum Structure: Effects on Coursetaking and Achievement in Mathematics for High School Graduates—An Examination of Data from the National Education Longitudinal Study of 1988
Jeffrey Owings
2001–07 A Comparison of the National Assessment of Educational Progress (NAEP), the Third International Mathematics and Science Study Repeat (TIMSS-R), and the Programme for International Student Assessment (PISA)
Arnold Goldstein
2001–11 Impact of Selected Background Variables on Students’ NAEP Math Performance Arnold Goldstein 2001–13 The Effects of Accommodations on the Assessment of LEP Students in NAEP Arnold Goldstein 2001–19 The Measurement of Home Background Indicators: Cognitive Laboratory Investigations
of the Responses of Fourth and Eighth Graders to Questionnaire Items and Parental Assessment of the Invasiveness of These Items
Arnold Goldstein
2002-05 Early Childhood Longitudinal Study-Kindergarten Class of 1998–99 (ECLS–K), Psychometric Report for Kindergarten Through First Grade
Elvira Hausken

No. Title NCES contact 2002-06
2002-07
The Measurement of Instructional Background Indicators: Cognitive Laboratory Investigations of the Responses of Fourth and Eighth Grade Students and Teachers to Questionnaire Items
Teacher Quality, School Context, and Student Race/Ethnicity: Findings from the Eighth Grade National Assessment of Educational Progress 2000 Mathematics Assessment
Arnold Goldstein Janis Brown
Beginning students in postsecondary education
98–11 Beginning Postsecondary Students Longitudinal Study First Follow-up (BPS:96–98) Field Test Report
Aurora D’Amico
2001–04 Beginning Postsecondary Students Longitudinal Study: 1996–2001 (BPS:1996/2001) Field Test Methodology Report
Paula Knepper
Civic participation
97–25 1996 National Household Education Survey (NHES:96) Questionnaires: Screener/Household and Library, Parent and Family Involvement in Education and Civic Involvement, Youth Civic Involvement, and Adult Civic Involvement
Kathryn Chandler
Climate of schools
95–14 Empirical Evaluation of Social, Psychological, & Educational Construct Variables Used in NCES Surveys
Samuel Peng
Cost of education indices
94–05 Cost-of-Education Differentials Across the States William J. Fowler, Jr. Course-taking
95–12 Rural Education Data User’s Guide Samuel Peng 98–09 High School Curriculum Structure: Effects on Coursetaking and Achievement in
Mathematics for High School Graduates—An Examination of Data from the National Education Longitudinal Study of 1988
Jeffrey Owings
1999–05 Procedures Guide for Transcript Studies Dawn Nelson 1999–06 1998 Revision of the Secondary School Taxonomy Dawn Nelson 2003–01 Mathematics, Foreign Language, and Science Coursetaking and the NELS:88 Transcript
Data Jeffrey Owings
2003–02 English Coursetaking and the NELS:88 Transcript Data Jeffrey Owings Crime
97–09 Status of Data on Crime and Violence in Schools: Final Report Lee Hoffman Curriculum
95–11 Measuring Instruction, Curriculum Content, and Instructional Resources: The Status of Recent Work
Sharon Bobbitt & John Ralph
98–09 High School Curriculum Structure: Effects on Coursetaking and Achievement in Mathematics for High School Graduates—An Examination of Data from the National Education Longitudinal Study of 1988
Jeffrey Owings
Customer service
1999–10 What Users Say About Schools and Staffing Survey Publications Dan Kasprzyk 2000–02 Coordinating NCES Surveys: Options, Issues, Challenges, and Next Steps Valena Plisko 2000–04 Selected Papers on Education Surveys: Papers Presented at the 1998 and 1999 ASA and
1999 AAPOR Meetings Dan Kasprzyk
Data quality
97–13 Improving Data Quality in NCES: Database-to-Report Process Susan Ahmed 2001–11 Impact of Selected Background Variables on Students’ NAEP Math Performance Arnold Goldstein 2001–13 The Effects of Accommodations on the Assessment of LEP Students in NAEP Arnold Goldstein 2001–19 The Measurement of Home Background Indicators: Cognitive Laboratory Investigations
of the Responses of Fourth and Eighth Graders to Questionnaire Items and Parental Assessment of the Invasiveness of These Items
Arnold Goldstein
2002-06 The Measurement of Instructional Background Indicators: Cognitive Laboratory Investigations of the Responses of Fourth and Eighth Grade Students and Teachers to Questionnaire Items
Arnold Goldstein
Data warehouse

No. Title NCES contact 2000–04 Selected Papers on Education Surveys: Papers Presented at the 1998 and 1999 ASA and
1999 AAPOR Meetings Dan Kasprzyk
Design effects
2000–03 Strengths and Limitations of Using SUDAAN, Stata, and WesVarPC for Computing Variances from NCES Data Sets
Ralph Lee
Dropout rates, high school
95–07 National Education Longitudinal Study of 1988: Conducting Trend Analyses HS&B and NELS:88 Sophomore Cohort Dropouts
Jeffrey Owings
Early childhood education
96–20 1991 National Household Education Survey (NHES:91) Questionnaires: Screener, Early Childhood Education, and Adult Education
Kathryn Chandler
96–22 1995 National Household Education Survey (NHES:95) Questionnaires: Screener, Early Childhood Program Participation, and Adult Education
Kathryn Chandler
97–24 Formulating a Design for the ECLS: A Review of Longitudinal Studies Jerry West 97–36 Measuring the Quality of Program Environments in Head Start and Other Early Childhood
Programs: A Review and Recommendations for Future Research Jerry West
1999–01 A Birth Cohort Study: Conceptual and Design Considerations and Rationale Jerry West 2001–02 Measuring Father Involvement in Young Children's Lives: Recommendations for a
Fatherhood Module for the ECLS-B Jerry West
2001–03 Measures of Socio-Emotional Development in Middle School Elvira Hausken 2001–06 Papers from the Early Childhood Longitudinal Studies Program: Presented at the 2001
AERA and SRCD Meetings Jerry West
2002-05 Early Childhood Longitudinal Study-Kindergarten Class of 1998–99 (ECLS–K), Psychometric Report for Kindergarten Through First Grade
Elvira Hausken
Educational attainment
98–11 Beginning Postsecondary Students Longitudinal Study First Follow-up (BPS:96–98) Field Test Report
Aurora D’Amico
2001–15 Baccalaureate and Beyond Longitudinal Study: 2000/01 Follow-Up Field Test Methodology Report
Andrew G. Malizio
Educational research
2000–02 Coordinating NCES Surveys: Options, Issues, Challenges, and Next Steps Valena Plisko 2002–01 Legal and Ethical Issues in the Use of Video in Education Research Patrick Gonzales
Eighth-graders
2001–05 2002-07
Using TIMSS to Analyze Correlates of Performance Variation in Mathematics Teacher Quality, School Context, and Student Race/Ethnicity: Findings from the Eighth
Grade National Assessment of Educational Progress 2000 Mathematics Assessment
Patrick Gonzales Janis Brown
Employment
96–03 National Education Longitudinal Study of 1988 (NELS:88) Research Framework and Issues
Jeffrey Owings
98–11 Beginning Postsecondary Students Longitudinal Study First Follow-up (BPS:96–98) Field Test Report
Aurora D’Amico
2000–16a Lifelong Learning NCES Task Force: Final Report Volume I Lisa Hudson 2000–16b Lifelong Learning NCES Task Force: Final Report Volume II Lisa Hudson 2001–01 Cross-National Variation in Educational Preparation for Adulthood: From Early
Adolescence to Young Adulthood Elvira Hausken
Employment – after college
2001–15 Baccalaureate and Beyond Longitudinal Study: 2000/01 Follow-Up Field Test Methodology Report
Andrew G. Malizio
Engineering
2000–11 Financial Aid Profile of Graduate Students in Science and Engineering Aurora D’Amico Enrollment – after college
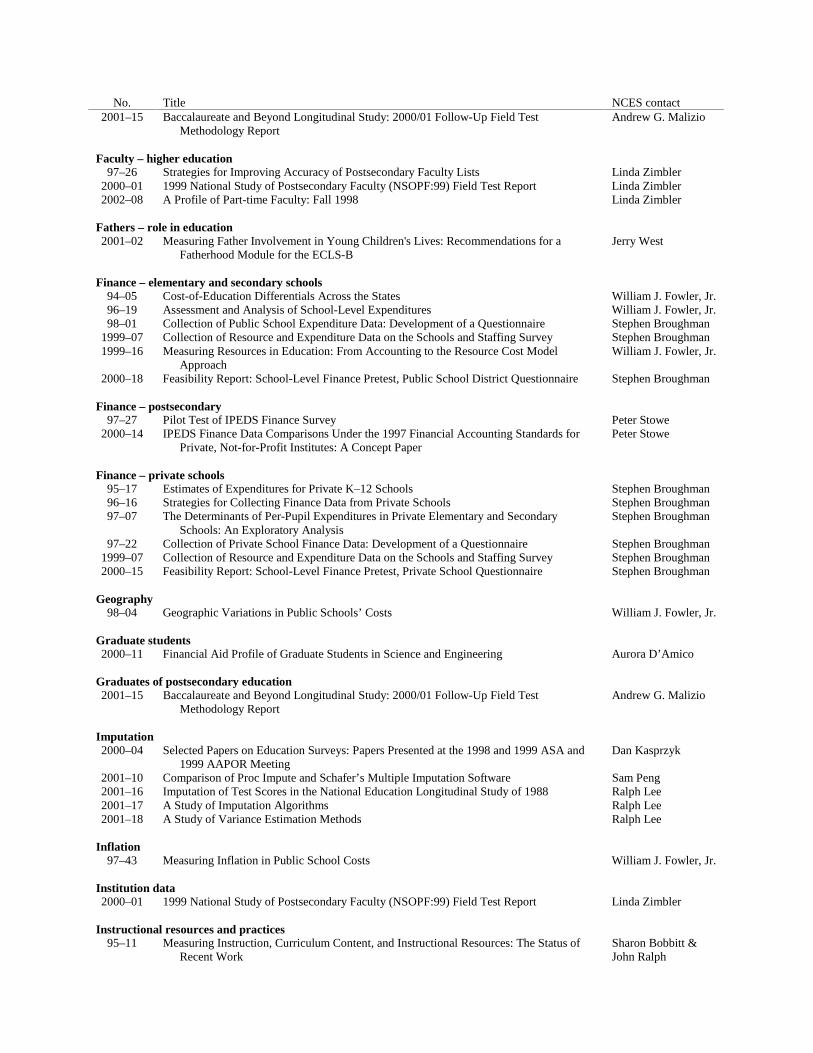
No. Title NCES contact 2001–15 Baccalaureate and Beyond Longitudinal Study: 2000/01 Follow-Up Field Test
Methodology Report Andrew G. Malizio
Faculty – higher education
97–26 Strategies for Improving Accuracy of Postsecondary Faculty Lists Linda Zimbler 2000–01 1999 National Study of Postsecondary Faculty (NSOPF:99) Field Test Report Linda Zimbler 2002–08 A Profile of Part-time Faculty: Fall 1998 Linda Zimbler
Fathers – role in education
2001–02 Measuring Father Involvement in Young Children's Lives: Recommendations for a Fatherhood Module for the ECLS-B
Jerry West
Finance – elementary and secondary schools
94–05 Cost-of-Education Differentials Across the States William J. Fowler, Jr. 96–19 Assessment and Analysis of School-Level Expenditures William J. Fowler, Jr. 98–01 Collection of Public School Expenditure Data: Development of a Questionnaire Stephen Broughman
1999–07 Collection of Resource and Expenditure Data on the Schools and Staffing Survey Stephen Broughman 1999–16 Measuring Resources in Education: From Accounting to the Resource Cost Model
Approach William J. Fowler, Jr.
2000–18 Feasibility Report: School-Level Finance Pretest, Public School District Questionnaire Stephen Broughman Finance – postsecondary
97–27 Pilot Test of IPEDS Finance Survey Peter Stowe 2000–14 IPEDS Finance Data Comparisons Under the 1997 Financial Accounting Standards for
Private, Not-for-Profit Institutes: A Concept Paper Peter Stowe
Finance – private schools
95–17 Estimates of Expenditures for Private K–12 Schools Stephen Broughman 96–16 Strategies for Collecting Finance Data from Private Schools Stephen Broughman 97–07 The Determinants of Per-Pupil Expenditures in Private Elementary and Secondary
Schools: An Exploratory Analysis Stephen Broughman
97–22 Collection of Private School Finance Data: Development of a Questionnaire Stephen Broughman 1999–07 Collection of Resource and Expenditure Data on the Schools and Staffing Survey Stephen Broughman 2000–15 Feasibility Report: School-Level Finance Pretest, Private School Questionnaire Stephen Broughman
Geography
98–04 Geographic Variations in Public Schools’ Costs William J. Fowler, Jr. Graduate students
2000–11 Financial Aid Profile of Graduate Students in Science and Engineering Aurora D’Amico Graduates of postsecondary education
2001–15 Baccalaureate and Beyond Longitudinal Study: 2000/01 Follow-Up Field Test Methodology Report
Andrew G. Malizio
Imputation
2000–04 Selected Papers on Education Surveys: Papers Presented at the 1998 and 1999 ASA and 1999 AAPOR Meeting
Dan Kasprzyk
2001–10 Comparison of Proc Impute and Schafer’s Multiple Imputation Software Sam Peng 2001–16 Imputation of Test Scores in the National Education Longitudinal Study of 1988 Ralph Lee 2001–17 A Study of Imputation Algorithms Ralph Lee 2001–18 A Study of Variance Estimation Methods Ralph Lee
Inflation
97–43 Measuring Inflation in Public School Costs William J. Fowler, Jr.
Institution data
2000–01 1999 National Study of Postsecondary Faculty (NSOPF:99) Field Test Report Linda Zimbler Instructional resources and practices
95–11 Measuring Instruction, Curriculum Content, and Instructional Resources: The Status of Recent Work
Sharon Bobbitt & John Ralph

No. Title NCES contact 1999–08 Measuring Classroom Instructional Processes: Using Survey and Case Study Field Test
Results to Improve Item Construction Dan Kasprzyk
International comparisons
97–11 International Comparisons of Inservice Professional Development Dan Kasprzyk 97–16 International Education Expenditure Comparability Study: Final Report, Volume I Shelley Burns 97–17 International Education Expenditure Comparability Study: Final Report, Volume II,
Quantitative Analysis of Expenditure Comparability Shelley Burns
2001–01 Cross-National Variation in Educational Preparation for Adulthood: From Early Adolescence to Young Adulthood
Elvira Hausken
2001–07 A Comparison of the National Assessment of Educational Progress (NAEP), the Third International Mathematics and Science Study Repeat (TIMSS-R), and the Programme for International Student Assessment (PISA)
Arnold Goldstein
International comparisons – math and science achievement
2001–05 Using TIMSS to Analyze Correlates of Performance Variation in Mathematics Patrick Gonzales Libraries
94–07 Data Comparability and Public Policy: New Interest in Public Library Data Papers Presented at Meetings of the American Statistical Association
Carrol Kindel
97–25 1996 National Household Education Survey (NHES:96) Questionnaires: Screener/Household and Library, Parent and Family Involvement in Education and Civic Involvement, Youth Civic Involvement, and Adult Civic Involvement
Kathryn Chandler
Limited English Proficiency
95–13 Assessing Students with Disabilities and Limited English Proficiency James Houser 2001–11 Impact of Selected Background Variables on Students’ NAEP Math Performance Arnold Goldstein 2001–13 The Effects of Accommodations on the Assessment of LEP Students in NAEP Arnold Goldstein
Literacy of adults
98–17 Developing the National Assessment of Adult Literacy: Recommendations from Stakeholders
Sheida White
1999–09a 1992 National Adult Literacy Survey: An Overview Alex Sedlacek 1999–09b 1992 National Adult Literacy Survey: Sample Design Alex Sedlacek 1999–09c 1992 National Adult Literacy Survey: Weighting and Population Estimates Alex Sedlacek 1999–09d 1992 National Adult Literacy Survey: Development of the Survey Instruments Alex Sedlacek 1999–09e 1992 National Adult Literacy Survey: Scaling and Proficiency Estimates Alex Sedlacek 1999–09f 1992 National Adult Literacy Survey: Interpreting the Adult Literacy Scales and Literacy
Levels Alex Sedlacek
1999–09g 1992 National Adult Literacy Survey: Literacy Levels and the Response Probability Convention
Alex Sedlacek
1999–11 Data Sources on Lifelong Learning Available from the National Center for Education Statistics
Lisa Hudson
2000–05 Secondary Statistical Modeling With the National Assessment of Adult Literacy: Implications for the Design of the Background Questionnaire
Sheida White
2000–06 Using Telephone and Mail Surveys as a Supplement or Alternative to Door-to-Door Surveys in the Assessment of Adult Literacy
Sheida White
2000–07 “How Much Literacy is Enough?” Issues in Defining and Reporting Performance Standards for the National Assessment of Adult Literacy
Sheida White
2000–08 Evaluation of the 1992 NALS Background Survey Questionnaire: An Analysis of Uses with Recommendations for Revisions
Sheida White
2000–09 Demographic Changes and Literacy Development in a Decade Sheida White 2001–08 Assessing the Lexile Framework: Results of a Panel Meeting Sheida White
Literacy of adults – international
97–33 Adult Literacy: An International Perspective Marilyn Binkley Mathematics
98–09 High School Curriculum Structure: Effects on Coursetaking and Achievement in Mathematics for High School Graduates—An Examination of Data from the National Education Longitudinal Study of 1988
Jeffrey Owings
1999–08 Measuring Classroom Instructional Processes: Using Survey and Case Study Field Test Results to Improve Item Construction
Dan Kasprzyk

No. Title NCES contact 2001–05 Using TIMSS to Analyze Correlates of Performance Variation in Mathematics Patrick Gonzales 2001–07 A Comparison of the National Assessment of Educational Progress (NAEP), the Third
International Mathematics and Science Study Repeat (TIMSS-R), and the Programme for International Student Assessment (PISA)
Arnold Goldstein
2001–11 Impact of Selected Background Variables on Students’ NAEP Math Performance Arnold Goldstein 2002-06
2002-07
The Measurement of Instructional Background Indicators: Cognitive Laboratory Investigations of the Responses of Fourth and Eighth Grade Students and Teachers to Questionnaire Items
Teacher Quality, School Context, and Student Race/Ethnicity: Findings from the Eighth Grade National Assessment of Educational Progress 2000 Mathematics Assessment
Arnold Goldstein Janis Brown
Parental involvement in education
96–03 National Education Longitudinal Study of 1988 (NELS:88) Research Framework and Issues
Jeffrey Owings
97–25 1996 National Household Education Survey (NHES:96) Questionnaires: Screener/Household and Library, Parent and Family Involvement in Education and Civic Involvement, Youth Civic Involvement, and Adult Civic Involvement
Kathryn Chandler
1999–01 A Birth Cohort Study: Conceptual and Design Considerations and Rationale Jerry West 2001–06 Papers from the Early Childhood Longitudinal Studies Program: Presented at the 2001
AERA and SRCD Meetings Jerry West
2001–19 The Measurement of Home Background Indicators: Cognitive Laboratory Investigations of the Responses of Fourth and Eighth Graders to Questionnaire Items and Parental Assessment of the Invasiveness of These Items
Arnold Goldstein
Participation rates
98–10 Adult Education Participation Decisions and Barriers: Review of Conceptual Frameworks and Empirical Studies
Peter Stowe
Postsecondary education
1999–11 Data Sources on Lifelong Learning Available from the National Center for Education Statistics
Lisa Hudson
2000–16a Lifelong Learning NCES Task Force: Final Report Volume I Lisa Hudson 2000–16b Lifelong Learning NCES Task Force: Final Report Volume II Lisa Hudson Postsecondary education – persistence and attainment
98–11 Beginning Postsecondary Students Longitudinal Study First Follow-up (BPS:96–98) Field Test Report
Aurora D’Amico
1999–15 Projected Postsecondary Outcomes of 1992 High School Graduates Aurora D’Amico Postsecondary education – staff
97–26 Strategies for Improving Accuracy of Postsecondary Faculty Lists Linda Zimbler 2000–01 1999 National Study of Postsecondary Faculty (NSOPF:99) Field Test Report Linda Zimbler 2002–08 A Profile of Part-time Faculty: Fall 1998 Linda Zimbler
Principals
2000–10 A Research Agenda for the 1999–2000 Schools and Staffing Survey Dan Kasprzyk Private schools
96–16 Strategies for Collecting Finance Data from Private Schools Stephen Broughman 97–07 The Determinants of Per-Pupil Expenditures in Private Elementary and Secondary
Schools: An Exploratory Analysis Stephen Broughman
97–22 Collection of Private School Finance Data: Development of a Questionnaire Stephen Broughman 2000–13 Non-professional Staff in the Schools and Staffing Survey (SASS) and Common Core of
Data (CCD) Kerry Gruber
2000–15 Feasibility Report: School-Level Finance Pretest, Private School Questionnaire Stephen Broughman Projections of education statistics
1999–15 Projected Postsecondary Outcomes of 1992 High School Graduates Aurora D’Amico Public school finance
1999–16 Measuring Resources in Education: From Accounting to the Resource Cost Model Approach
William J. Fowler, Jr.
2000–18 Feasibility Report: School-Level Finance Pretest, Public School District Questionnaire Stephen Broughman

No. Title NCES contact Public schools
97–43 Measuring Inflation in Public School Costs William J. Fowler, Jr. 98–01 Collection of Public School Expenditure Data: Development of a Questionnaire Stephen Broughman 98–04 Geographic Variations in Public Schools’ Costs William J. Fowler, Jr.
1999–02 Tracking Secondary Use of the Schools and Staffing Survey Data: Preliminary Results Dan Kasprzyk 2000–12 Coverage Evaluation of the 1994–95 Public Elementary/Secondary School Universe
Survey Beth Young
2000–13 Non-professional Staff in the Schools and Staffing Survey (SASS) and Common Core of Data (CCD)
Kerry Gruber
2002–02 Locale Codes 1987 - 2000 Frank Johnson Public schools – secondary
98–09 High School Curriculum Structure: Effects on Coursetaking and Achievement in Mathematics for High School Graduates—An Examination of Data from the National Education Longitudinal Study of 1988
Jeffrey Owings
Reform, educational
96–03 National Education Longitudinal Study of 1988 (NELS:88) Research Framework and Issues
Jeffrey Owings
Response rates
98–02 Response Variance in the 1993–94 Schools and Staffing Survey: A Reinterview Report Steven Kaufman School districts
2000–10 A Research Agenda for the 1999–2000 Schools and Staffing Survey Dan Kasprzyk School districts, public
98–07 Decennial Census School District Project Planning Report Tai Phan 1999–03 Evaluation of the 1996–97 Nonfiscal Common Core of Data Surveys Data Collection,
Processing, and Editing Cycle Beth Young
School districts, public – demographics of
96–04 Census Mapping Project/School District Data Book Tai Phan Schools
97–42 Improving the Measurement of Staffing Resources at the School Level: The Development of Recommendations for NCES for the Schools and Staffing Survey (SASS)
Mary Rollefson
98–08 The Redesign of the Schools and Staffing Survey for 1999–2000: A Position Paper Dan Kasprzyk 1999–03 Evaluation of the 1996–97 Nonfiscal Common Core of Data Surveys Data Collection,
Processing, and Editing Cycle Beth Young
2000–10 A Research Agenda for the 1999–2000 Schools and Staffing Survey Dan Kasprzyk 2002–02 2002-07
Locale Codes 1987 – 2000 Teacher Quality, School Context, and Student Race/Ethnicity: Findings from the Eighth
Grade National Assessment of Educational Progress 2000 Mathematics Assessment
Frank Johnson Janis Brown
Schools – safety and discipline
97–09 Status of Data on Crime and Violence in Schools: Final Report Lee Hoffman Science
2000–11 Financial Aid Profile of Graduate Students in Science and Engineering Aurora D’Amico 2001–07 A Comparison of the National Assessment of Educational Progress (NAEP), the Third
International Mathematics and Science Study Repeat (TIMSS-R), and the Programme for International Student Assessment (PISA)
Arnold Goldstein
Software evaluation
2000–03 Strengths and Limitations of Using SUDAAN, Stata, and WesVarPC for Computing Variances from NCES Data Sets
Ralph Lee
Staff 97–42 Improving the Measurement of Staffing Resources at the School Level: The Development
of Recommendations for NCES for the Schools and Staffing Survey (SASS) Mary Rollefson
98–08 The Redesign of the Schools and Staffing Survey for 1999–2000: A Position Paper Dan Kasprzyk

No. Title NCES contact Staff – higher education institutions
97–26 Strategies for Improving Accuracy of Postsecondary Faculty Lists Linda Zimbler 2002–08 A Profile of Part-time Faculty: Fall 1998 Linda Zimbler
Staff – nonprofessional
2000–13 Non-professional Staff in the Schools and Staffing Survey (SASS) and Common Core of Data (CCD)
Kerry Gruber
State
1999–03 Evaluation of the 1996–97 Nonfiscal Common Core of Data Surveys Data Collection, Processing, and Editing Cycle
Beth Young
Statistical methodology
97–21 Statistics for Policymakers or Everything You Wanted to Know About Statistics But Thought You Could Never Understand
Susan Ahmed
Statistical standards and methodology
2001–05 Using TIMSS to Analyze Correlates of Performance Variation in Mathematics Patrick Gonzales 2002–04 Improving Consistency of Response Categories Across NCES Surveys Marilyn Seastrom
Students with disabilities
95–13 Assessing Students with Disabilities and Limited English Proficiency James Houser 2001–13 The Effects of Accommodations on the Assessment of LEP Students in NAEP Arnold Goldstein
Survey methodology
96–17 National Postsecondary Student Aid Study: 1996 Field Test Methodology Report Andrew G. Malizio 97–15 Customer Service Survey: Common Core of Data Coordinators Lee Hoffman 97–35 Design, Data Collection, Interview Administration Time, and Data Editing in the 1996
National Household Education Survey Kathryn Chandler
98–06 National Education Longitudinal Study of 1988 (NELS:88) Base Year through Second Follow-Up: Final Methodology Report
Ralph Lee
98–11 Beginning Postsecondary Students Longitudinal Study First Follow-up (BPS:96–98) Field Test Report
Aurora D’Amico
98–16 A Feasibility Study of Longitudinal Design for Schools and Staffing Survey Stephen Broughman 1999–07 Collection of Resource and Expenditure Data on the Schools and Staffing Survey Stephen Broughman 1999–17 Secondary Use of the Schools and Staffing Survey Data Susan Wiley 2000–01 1999 National Study of Postsecondary Faculty (NSOPF:99) Field Test Report Linda Zimbler 2000–02 Coordinating NCES Surveys: Options, Issues, Challenges, and Next Steps Valena Plisko 2000–04 Selected Papers on Education Surveys: Papers Presented at the 1998 and 1999 ASA and
1999 AAPOR Meetings Dan Kasprzyk
2000–12 Coverage Evaluation of the 1994–95 Public Elementary/Secondary School Universe Survey
Beth Young
2000–17 National Postsecondary Student Aid Study:2000 Field Test Methodology Report Andrew G. Malizio 2001–04 Beginning Postsecondary Students Longitudinal Study: 1996–2001 (BPS:1996/2001)
Field Test Methodology Report Paula Knepper
2001–07 A Comparison of the National Assessment of Educational Progress (NAEP), the Third International Mathematics and Science Study Repeat (TIMSS-R), and the Programme for International Student Assessment (PISA)
Arnold Goldstein
2001–11 Impact of Selected Background Variables on Students’ NAEP Math Performance Arnold Goldstein 2001–13 The Effects of Accommodations on the Assessment of LEP Students in NAEP Arnold Goldstein 2001–19 The Measurement of Home Background Indicators: Cognitive Laboratory Investigations
of the Responses of Fourth and Eighth Graders to Questionnaire Items and Parental Assessment of the Invasiveness of These Items
Arnold Goldstein
2002–01 Legal and Ethical Issues in the Use of Video in Education Research Patrick Gonzales 2002–02 Locale Codes 1987 - 2000 Frank Johnson 2002–03 National Postsecondary Student Aid Study, 1999–2000 (NPSAS:2000), CATI
Nonresponse Bias Analysis Report. Andrew Malizio

No. Title NCES contact 2002-06 The Measurement of Instructional Background Indicators: Cognitive Laboratory
Investigations of the Responses of Fourth and Eighth Grade Students and Teachers to Questionnaire Items
Arnold Goldstein
2003-03 Education Longitudinal Study: 2002 (ELS: 2002) Field Test Report Jeffrey Owings Teachers
98–13 Response Variance in the 1994–95 Teacher Follow-up Survey Steven Kaufman 1999–14 1994–95 Teacher Followup Survey: Data File User’s Manual, Restricted-Use Codebook Kerry Gruber 2000–10 2002-07
A Research Agenda for the 1999–2000 Schools and Staffing Survey Teacher Quality, School Context, and Student Race/Ethnicity: Findings from the Eighth
Grade National Assessment of Educational Progress 2000 Mathematics Assessment
Dan Kasprzyk Janis Brown
Teachers – instructional practices of
98–08 The Redesign of the Schools and Staffing Survey for 1999–2000: A Position Paper Dan Kasprzyk 2002-06 The Measurement of Instructional Background Indicators: Cognitive Laboratory
Investigations of the Responses of Fourth and Eighth Grade Students and Teachers to Questionnaire Items
Arnold Goldstein
Teachers – opinions regarding safety
98–08 The Redesign of the Schools and Staffing Survey for 1999–2000: A Position Paper Dan Kasprzyk Teachers – performance evaluations
1999–04 Measuring Teacher Qualifications Dan Kasprzyk Teachers – qualifications of
1999–04 Measuring Teacher Qualifications Dan Kasprzyk Teachers – salaries of
94–05 Cost-of-Education Differentials Across the States William J. Fowler, Jr. Training
2000–16a Lifelong Learning NCES Task Force: Final Report Volume I Lisa Hudson 2000–16b Lifelong Learning NCES Task Force: Final Report Volume II Lisa Hudson Variance estimation
2000–03 Strengths and Limitations of Using SUDAAN, Stata, and WesVarPC for Computing Variances from NCES Data Sets
Ralph Lee
2000–04 Selected Papers on Education Surveys: Papers Presented at the 1998 and 1999 ASA and 1999 AAPOR Meetings
Dan Kasprzyk
2001–18 A Study of Variance Estimation Methods Ralph Lee Violence
97–09 Status of Data on Crime and Violence in Schools: Final Report Lee Hoffman Vocational education
95–12 Rural Education Data User’s Guide Samuel Peng 1999–05 Procedures Guide for Transcript Studies Dawn Nelson 1999–06 1998 Revision of the Secondary School Taxonomy Dawn Nelson

![Decision 15 2006 by MOF 200306 [E]](https://static.fdocuments.us/doc/165x107/553d5c675503468c338b462d/decision-15-2006-by-mof-200306-e.jpg)