National Center for Bureau of Justice
191
National Center for Bureau of Justice Education Statistics Statistics October 2001 U.S. Department of Education, Office of Educational Research and Improvement, NCES 2002113 U.S. Department of Justice, Office of Justice Programs, NCJ-190075 U.S. Department of Education Office of Educational Research and Improvement National Center for Education Statistics U.S. Department of Justice Office of Justice Programs Bureau of Justice Statistics Indicators of 2001
Transcript of National Center for Bureau of Justice

National Center for Bureau of Justice Education Statistics Statistics
October 2001
U.S. Department of Education, Office of Educational Research and Improvement, NCES 2002�113 U.S. Department of Justice, Office of Justice Programs, NCJ-190075
U.S. Department of Education Office of Educational Research and Improvement National Center for Education Statistics
U.S. Department of Justice Office of Justice Programs
Bureau of Justice Statistics
Indicators of
2001
BJS
This report is one in a series. More recent editions may be available. To view a list of all in the series go to http://www.ojp.usdoj.gov/bjs/pubalp2.htm#indicators


October 2001
Indicators of School Crime and Safety: 2001 Phillip Kaufman Xianglei Chen Susan P. Choy Katharin Peter MPR Associates, Inc. Sally A. Ruddy Amanda K. Miller Jill K. Fleury Education Statistics Services Institute Kathryn A. Chandler National Center for Education Statistics Michael G. Planty Michael R. Rand Bureau of Justice Statistics
U.S. Department of Education, Office of Educational Research and Improvement, NCES 2002�113 U.S. Department of Justice, Office of Justice Programs, NCJ-190075
U.S. Department of Education Office of Educational Research and Improvement National Center for Education Statistics
U.S. Department of Justice Office of Justice Programs
Bureau of Justice Statistics

U.S. Department of Education U.S. Department of Justice Rod Paige, Secretary John Ashcroft, Attorney General Office of Educational Research and Improvement Office of Justice Programs Grover J. Whitehurst, Assistant Secretary Mary Lou Leary, Acting Assistant Attorney General National Center for Education Statistics Bureau of Justice Statistics Gary W. Phillips, Acting Commissioner Lawrence A. Greenfeld, Acting Director
The National Center for Education Statistics (NCES) is the primary federal entity for collecting, analyzing, and reporting data related to education in the United States and other nations. It fulfills a congressional mandate to collect, collate, analyze, and report full and complete statistics on the condition of education in the United States; conduct and publish reports and specialized analyses of the meaning and significance of such statistics; assist state and local education agencies in improving their statistical systems; and report on education activities in foreign countries.
The Bureau of Justice Statistics (BJS) is the primary federal entity for collecting, analyzing, publishing, and disseminating statistical information about crime, its perpetrators and victims, and the operation of the justice system at all levels of government. These data are critical to federal, state, and local policy-makers in combating crime and ensuring that justice is both efficient and evenhanded.
October 2001 Suggested Citation Kaufman, P., Chen, X., Choy, S.P., Peter, K., Ruddy, S.A., Miller, A.K., Fleury, J.K., Chandler, K.A., Planty, M.G., and Rand, M.R. Indicators of School Crime and Safety: 2001. U.S. Departments of Education and Justice. NCES 2002�113/NCJ-190075. Washington, DC: 2001. This publication can be downloaded from the World Wide Web at http://nces.ed.gov or http://www.ojp.usdoj.gov/bjs/. Single hard copies can be ordered through ED Pubs at 1-877-4ED-PUBS (NCES 2002�113) (TTY/TDD 1-877-576-7734), and the Bureau of Justice Statistics Clearinghouse at 1-800-732-3277 (NCJ-190075). Contact at NCES: Kathryn Chandler (202) 502-7326 E-mail: [email protected] Contact at BJS: Michael Rand (202) 616-3494 E-mail: [email protected]
Foreword iii
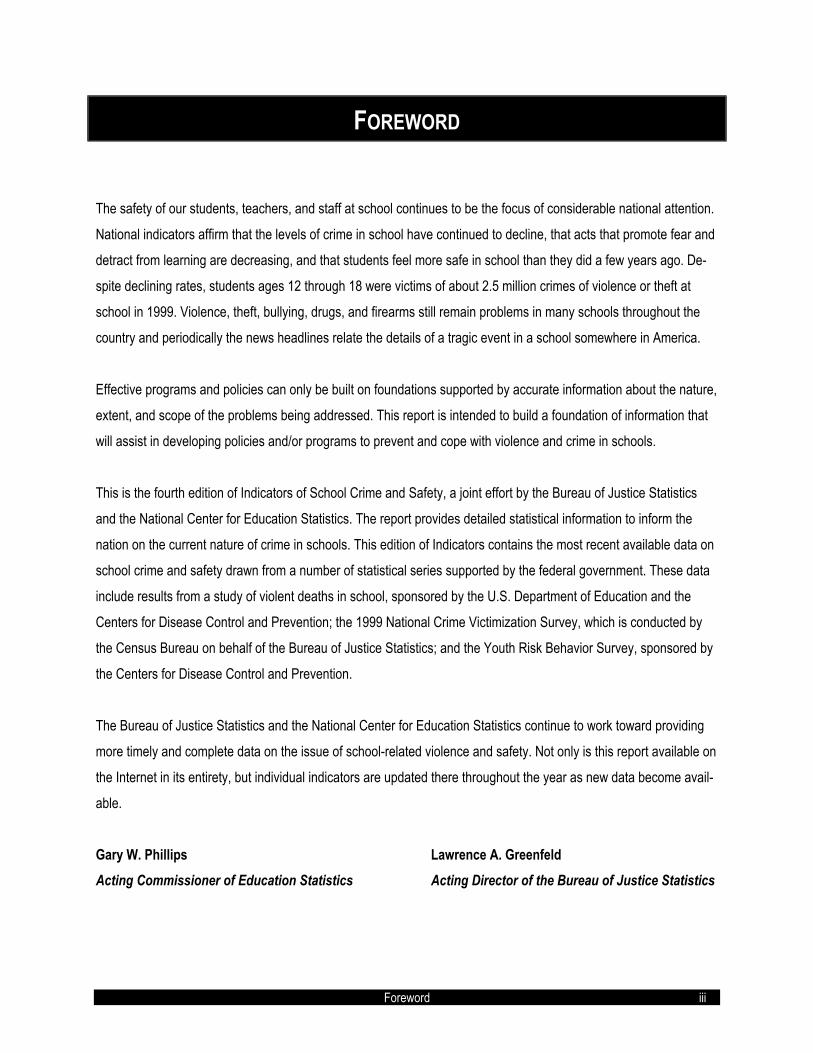
FOREWORD
The safety of our students, teachers, and staff at school continues to be the focus of considerable national attention.
National indicators affirm that the levels of crime in school have continued to decline, that acts that promote fear and
detract from learning are decreasing, and that students feel more safe in school than they did a few years ago. De-
spite declining rates, students ages 12 through 18 were victims of about 2.5 million crimes of violence or theft at
school in 1999. Violence, theft, bullying, drugs, and firearms still remain problems in many schools throughout the
country and periodically the news headlines relate the details of a tragic event in a school somewhere in America.
Effective programs and policies can only be built on foundations supported by accurate information about the nature,
extent, and scope of the problems being addressed. This report is intended to build a foundation of information that
will assist in developing policies and/or programs to prevent and cope with violence and crime in schools.
This is the fourth edition of Indicators of School Crime and Safety, a joint effort by the Bureau of Justice Statistics
and the National Center for Education Statistics. The report provides detailed statistical information to inform the
nation on the current nature of crime in schools. This edition of Indicators contains the most recent available data on
school crime and safety drawn from a number of statistical series supported by the federal government. These data
include results from a study of violent deaths in school, sponsored by the U.S. Department of Education and the
Centers for Disease Control and Prevention; the 1999 National Crime Victimization Survey, which is conducted by
the Census Bureau on behalf of the Bureau of Justice Statistics; and the Youth Risk Behavior Survey, sponsored by
the Centers for Disease Control and Prevention.
The Bureau of Justice Statistics and the National Center for Education Statistics continue to work toward providing
more timely and complete data on the issue of school-related violence and safety. Not only is this report available on
the Internet in its entirety, but individual indicators are updated there throughout the year as new data become avail-
able.
Gary W. Phillips Lawrence A. Greenfeld Acting Commissioner of Education Statistics Acting Director of the Bureau of Justice Statistics


Executive Summary v
EXECUTIVE SUMMARY
Schools should be safe and secure places for all students, teachers, and staff members. Without a safe learning
environment, teachers cannot teach and students cannot learn. Student safety is of concern outside of school as
well. In fact, as the data in this report show, more serious victimizations happen away from school than at school.1 In
1999, students were more than two times as likely to be victims of serious violent crime away from school as at
school (Indicator 2).2
In 1999, students ages 12 through 18 were victims of about 2.5 million total crimes at school. In that same year,
these students were victims of about 186,000 serious violent crimes at school (that is, rape, sexual assault, robbery,
and aggravated assault) (Indicator 2). There were also 47 school-associated violent deaths in the United States be-
tween July 1, 1998, and June 30, 1999, including 38 homicides, 33 of which involved school-aged children (Indicator 1).
The total nonfatal victimization rate for young people generally declined between 1992 and 1999. The percentage of
students being victimized at school also declined over the last few years. Between 1995 and 1999, the percentage of
students who reported being victims of crime at school decreased from 10 percent to 8 percent (Indicator 3). This
decline was due in large part to the decrease in percentages of students in grades 7 through 9 who were victimized.
Between 1995 and 1999, the prevalence of reported victimization dropped from 11 percent to 8 percent for 7th grad-
ers, from 11 percent to 8 percent for 8th graders, and from 12 percent to 9 percent for 9th graders.
However, the prevalence rates of some types of crimes at school have not changed. For example, between 1993
and 1999, the percentage of students in grades 9 through 12 who were threatened or injured with a weapon on
school property in the past 12 months remained constant�at about 7 to 8 percent (Indicator 4).
As the rate of victimization in schools has declined or remained constant, students also seem to feel more secure at
school now than just a few years ago. The percentage of students ages 12 through 18 who reported avoiding one or
more places at school for their own safety decreased between 1995 and 1999�from 9 to 5 percent (Indicator 13).
Furthermore, the percentage of students who reported that street gangs were present at their schools decreased
1These data do not take into account the number of hours that students spend on school property and the number of hours they spend else-where. 2�Students� refers to persons 12 though 18 years of age who have attended any grade equal to or less than high school. An uncertain percent-age of these persons may not have attended school during the survey reference period.

vi Executive Summary
from 1995 to 1999. In 1999, 17 percent of students ages 12 through 18 reported that they had street gangs at their
schools compared with 29 percent in 1995 (Indicator 15).
There was an increase in the use of marijuana among students in grades 9 through 12 between 1993 and 1995, but
percentages of students reporting marijuana use were similar in 1995, 1997, and 1999. In 1999, about 27 percent of
these students had used marijuana in the last 30 days (Indicator 18). Furthermore, in 1995, 1997, and 1999, about
one-third of these students (between 30 and 32 percent) reported that someone had offered, sold, or given them an
illegal drug on school property�an increase from 24 percent in 1993 (Indicator 19). Therefore, the data shown in
this report present a mixed picture of school safety. While overall school crime rates have declined, violence, gangs,
and drugs are still present, indicating that more work needs to be done.
ORGANIZATION OF THE CURRENT REPORT
This report, the fourth in a series of annual reports on school crime and safety from the Bureau of Justice Statistics
(BJS) and the National Center for Education Statistics (NCES), presents the latest available data on school crime
and student safety. The report repeats many indicators from the 2000 report but also provides updated data on fatal
and nonfatal student victimization, nonfatal teacher victimization, students being threatened or injured with a weapon
at school, fights at school, students carrying weapons to school, students� use of alcohol and marijuana, and student
reports of drug availability on school property.
The report is organized as a series of indicators, with each indicator presenting data on a different aspect of school
crime and safety. It starts with the most serious violence. There are five sections to the report: Violent Deaths at
School; Nonfatal Student VictimizationStudent Reports; Violence and Crime at SchoolPublic School Princi-
pal/Disciplinarian Reports; Nonfatal Teacher Victimization at SchoolTeacher Reports; and School Environment.
Each section contains a set of indicators that, taken together, describe a distinct aspect of school crime and safety.
Rather than relying on data from a large omnibus survey of school crime and safety, this report uses a variety of
independent data sources from federal departments and agencies including the BJS, NCES, and the Centers for
Disease Control and Prevention. Each data source has an independent sample design, data collection method, and
questionnaire design, all of which may be influenced by the unique perspective of the primary funding agency. By
combining multiple and independent sources of data, it is hoped that this report will present a more complete portrait
of school crime and safety than would be possible with any single source of information.
Executive Summary vii
However, because the report relies on so many different data sets, the age groups, the time periods, and the types
of respondents analyzed can vary from indicator to indicator. Readers should keep this in mind as they compare
data from different indicators. Furthermore, while every effort has been made to keep key definitions consistent
across indicators, different surveys sometimes use different definitions, such as those for specific crimes and �at
school.�3 Therefore, caution should be used in making comparisons between results from different data sets. De-
scriptions of these data sets are located in appendix B of this report.
KEY FINDINGS
All of the comparisons described in this report were statistically significant at the 0.05 level. Some of the key findings
from the various sections of this report are as follows:4
VIOLENT DEATHS AT SCHOOL
From July 1, 1998, through June 30, 1999, there were 47 school-associated violent deaths in the United States.
Thirty-eight of these violent deaths were homicides, six were suicides, two were killed by a law enforcement officer in
the line of duty, and one was unintentional (Indicator 1). Thirty-three of the 38 school-associated homicides were of
school-aged children. By comparison, a total of 2,407 children ages 5 through 19 were victims of homicide in the
United States from July 1, 1998, through June 30, 1999. Four of the six school-associated suicides occurring from
July 1, 1998, through June 30, 1999, were of school-aged children. A total of 1,854 children ages 5 through 19
committed suicide that year.
NONFATAL STUDENT VICTIMIZATIONSTUDENT REPORTS
Students ages 12 through 18 were more likely to be victims of nonfatal serious violent crime�including rape, sexual
assault, robbery, and aggravated assault�away from school than when they were at school (Indicator 2). In 1999,
students in this age range were victims of about 476,000 serious violent crimes away from school, compared with
about 186,000 at school.
! The percentage of students in grades 9 through 12 who have been threatened or injured with a weapon on
school property5 has not changed significantly in recent years. In 1993, 1995, 1997, and 1999, about 7 to 8 per-
3Readers should consult the glossary of terms in appendix C for specific definitions used in each survey. 4See appendix B for details on the statistical methodology. 5Definitions for �on school property� and �at school� may differ. See appendix C for specific definitions.

viii Executive Summary
cent of students reported being threatened or injured with a weapon such as a gun, knife, or club on school
property in the past 12 months (Indicator 4).
! In 1999, 12- through 18-year-old students living in urban and suburban locales were equally vulnerable to seri-
ous violent crime at school. Away from school, however, urban students were more vulnerable to serious violent
crime than were suburban students, and suburban students were more likely to experience serious violent vic-
timization than were rural students. Yet, student vulnerability to theft at school and away from school in 1999
was similar in urban, suburban, and rural areas (Indicator 2).
! Younger students (ages 12 through 14) were more likely than older students (ages 15 through 18) to be victims
of crime at school. However, older students were more likely than younger students to be victimized away from
school (Indicator 2).
VIOLENCE AND CRIME AT SCHOOLPUBLIC SCHOOL PRINCIPAL/DISCIPLINARIAN REPORTS
In 1996�97, 10 percent of all public schools reported at least one serious violent crime to the police or a law en-
forcement representative. Principals� reports of serious violent crimes included murder, rape or other type of sexual
battery, suicide, physical attack or fight with a weapon, or robbery. Another 47 percent of public schools reported at
least one less serious violent or nonviolent crime (but not a serious violent one). Crimes in this category include
physical attack or fight without a weapon, theft/larceny, and vandalism. The remaining 43 percent of public schools
did not report any of these crimes to the police (Indicator 7).
! Elementary schools were much less likely than either middle or high schools to report any type of crime in
1996�97. Elementary schools were much more likely to report vandalism (31 percent) than any other crime (19
percent or less) (Indicator 8).
! At the middle and high school levels, physical attack or fight without a weapon was generally the most com-
monly reported crime in 1996�97 (9 and 8 per 1,000 students, respectively). Theft or larceny was more common
at the high school than at the middle school level (6 versus 4 per 1,000 students) (Indicator 8).
NONFATAL TEACHER VICTIMIZATION AT SCHOOLTEACHER REPORTS
Over the 5-year period from 1995 through 1999, teachers were victims of approximately 1,708,000 nonfatal crimes
at school, including 1,073,000 thefts and 635,000 violent crimes (rape or sexual assault, robbery, and aggravated
and simple assault) (Indicator 9). On average, this translates into 79 crimes per 1,000 teachers per year.
Executive Summary ix
! During the 1995 through 1999 period, senior high school and middle/junior high school teachers were more
likely to be victims of violent crimes (most of which were simple assaults) than elementary school teachers (38
and 54, respectively, versus 16 crimes per 1,000 teachers) (Indicator 9).
! Teachers were differentially victimized by violent crimes at school according to where they taught. Over the 5-
year period from 1995 through 1999, urban teachers were more likely to be victims of violent crimes than subur-
ban and rural teachers (39 versus 22 and 20, respectively, per 1,000 teachers) (Indicator 9).
! In the 1993�94 school year, 12 percent of all elementary and secondary school teachers were threatened with
injury by a student, and 4 percent were physically attacked by a student. This represented about 341,000
teachers who were victims of threats of injury by students that year, and 119,000 teachers who were victims of
attacks by students (Indicator 10).
SCHOOL ENVIRONMENT
Between 1995 and 1999, the percentages of students who felt unsafe while they were at school and while they were
going to and from school decreased. In 1995, 9 percent of students ages 12 through 18 sometimes or most of the
time feared they were going to be attacked or harmed at school. In 1999, this percentage had fallen to 5 percent.
During the same period, the percentage of students fearing they would be attacked while traveling to and from
school fell from 7 percent to 4 percent (Indicator 12).
! Between 1993 and 1999, the percentage of students in grades 9 through 12 who reported carrying a weapon on
school property within the previous 30 days fell from 12 percent to 7 percent (about a 42 percent reduction) (In-
dicator 11).
! Between 1995 and 1999, the percentage of students ages 12 through 18 who avoided one or more places at
school for fear of their own safety decreased, from 9 to 5 percent. (Indicator 13).
! In 1999, about 13 percent of students ages 12 through 18 reported that someone at school had used hate-
related words against them. That is, in the prior 6 months someone at school called them a derogatory word
having to do with race/ethnicity, religion, disability, gender, or sexual orientation. In addition, about 36 percent of
students saw hate-related graffiti at school (Indicator 14).
! Between 1995 and 1999, the percentage of students who reported that street gangs were present at their
schools decreased. In 1995, 29 percent of students reported gangs being present in their schools. By 1999, this
percentage had fallen to 17 percent (Indicator 15).
x Executive Summary
! In 1999, about 5 percent of students in grades 9 through 12 had at least one drink of alcohol on school property
in the previous 30 days. Half of students (about 50 percent) had at least one drink anywhere during the same
period (Indicator 17).
! There was an increase in the use of marijuana among students in grades 9 through 12 anywhere and on school
property between 1993 and 1995, but no change between 1995, 1997, and 1999. About one-quarter (27 per-
cent) of students reported using marijuana anywhere in the last 30 days in 1999 and 7 percent reported using
marijuana on school property (Indicator 18).
! In 1995, 1997, and 1999, about one-third of all students in grades 9 through 12 (between 30 and 32 percent)
reported that someone had offered, sold, or given them an illegal drug on school property. This was an increase
from 1993 when 24 percent of such students reported that illegal drugs were available to them on school prop-
erty (Indicator 19).

Acknowledgments xi
ACKNOWLEDGMENTS
The authors wish to thank the heads of their respective agencies, Gary W. Phillips of the National Center for Educa-
tion Statistics (NCES) and Lawrence Greenfield of the Bureau of Justice Statistics (BJS), for supporting this report. We also appreciate the support provided by Bill Modzeleski of the Safe and Drug-free Schools program. Their sup-
port of our larger data collection and reporting agendas on school crime and safety make this report possible.
From BJS, we wish to thank Callie Rennison of the Victimization Statistics Branch for her work in preparing and veri-
fying data from the NCVS.
From NCES, we wish to thank Bruce Taylor, Ilona Berkovits, and Patt Dabbs, who served as reviewers. They each
provided input that substantially improved the publication.
Outside of NCES and BJS, school crime experts who reviewed the report were John Bishop of Cornell University,
Joseph Moone of the Office of Juvenile Justice and Delinquency Prevention, and Joanne Wiggins of the Planning
and Evaluation Service of the U. S. Department of Education. Their advice was gratefully accepted. We particularly
appreciated their willingness to review the report under very strict time constraints.
Without the assistance of the following staff at MPR Associates this report could not have been produced: Barbara
Kridl (overall production and proofreading), Francesca Tussing (production, proofreading, layout, and editing), An-
drea Livingston (editing), and Leslie Retallick (figure design and text layout). They provided invaluable editorial,
graphic, and production assistance.


Table of Contents xiii
TABLE OF CONTENTS
Page Foreword............................................................................................................................................................... iii Executive Summary .............................................................................................................................................. v Acknowledgments................................................................................................................................................. xi List of Tables......................................................................................................................................................... xv List of Figures ....................................................................................................................................................... xxi
Violent Deaths at School....................................................................................................................................... 1 1. Violent deaths at school and away from school....................................................................................... 2
Nonfatal Student Victimization�Student Reports ................................................................................................ 3 2. Victimization of students at school and away from school....................................................................... 4 3. Prevalence of students being victimized at school .................................................................................. 8 4. Prevalence of students being threatened or injured with a weapon on school property.......................... 9 5. Prevalence of students involved in physical fights on school property.................................................... 11 6. Prevalence of students being bullied at school........................................................................................ 13
Violence and Crime at School�Public School Principal/Disciplinarian Reports .................................................. 15 7. Crimes reported to the police................................................................................................................... 16 8. Specific crimes reported to the police...................................................................................................... 18
Nonfatal Teacher Victimization at School�Teacher Reports............................................................................... 21 9. Nonfatal teacher victimization at school .................................................................................................. 22 10. Prevalence of teachers being threatened with injury or attacked by students......................................... 24
School Environment.............................................................................................................................................. 25 11. Prevalence of students carrying weapons on school property ................................................................ 26 12. Students� perceptions of personal safety at school and when traveling to and from school.................... 28 13. Students� reports of avoiding places in school......................................................................................... 30 14. Students� reports of being called hate-related words and seeing hate-related graffiti ............................. 32 15. Students� reports of gangs at school ....................................................................................................... 33 16. Public school principals� reports of discipline problems at school ........................................................... 35 17. Prevalence of students using alcohol ...................................................................................................... 36 18. Prevalence of students using marijuana.................................................................................................. 38 19. Prevalence of students reporting drugs were made available to them on school property ..................... 40
Supplemental Tables ............................................................................................................................................ 43
Standard Error Tables........................................................................................................................................... 85

xiv Table of Contents
Page
Appendix A. School Practices and Policies Related to Safety and Discipline ...................................................... 127
Appendix B. Technical Notes................................................................................................................................ 141
Appendix C. Glossary of Terms............................................................................................................................ 163

List of Tables xv
LIST OF TABLES
Table Page
2.1. Number of nonfatal crimes against students ages 12 through 18 occurring at school or on the way to or from school, by type of crime and selected student characteristics: 1992 to 1999 ............................ 45
2.2. Number of nonfatal crimes against students ages 12 through 18 occurring at school or on the way to or from school per 1,000 students, by type of crime and selected student characteristics: 1992 to 1999........................................................................................................................................................ 48
2.3. Number of nonfatal crimes against students ages 12 through 18 occurring away from school, by type of crime and selected student characteristics: 1992 to 1999.................................................................. 51
2.4. Number of nonfatal crimes against students ages 12 through 18 occurring away from school per 1,000 students, by type of crime and selected student characteristics: 1992 to 1999 ........................... 54
3.1. Percentage of students ages 12 through 18 who reported criminal victimization at school during the previous 6 months, by type of victimization and selected student characteristics: 1995 and 1999........ 57
4.1. Percentage of students in grades 9 through 12 who reported being threatened or injured with a weapon on school property during the last 12 months, by selected student characteristics: 1993, 1995, 1997, and 1999............................................................................................................................. 58
5.1. Percentage of students in grades 9 through 12 who reported having been in a physical fight in the last 12 months, by selected student characteristics: 1993, 1995, 1997, and 1999 ................................ 59
6.1. Percentage of students ages 12 through 18 who reported being bullied at school during the previous 6 months, by gender and selected student characteristics: 1999........................................................... 60
7.1. Percentage of public schools that reported one or more criminal incidents to police, by seriousness of the incident, urbanicity, and selected school characteristics: 1996�97.............................................. 61
7.2. Number of public schools that reported one or more criminal incidents to police, by seriousness of the incident, urbanicity, and selected school characteristics: 1996�97.................................................. 62
7.3. Number of criminal incidents occurring in public schools reported to police, by seriousness of the incident, urbanicity, and selected school characteristics: 1996�97........................................................ 63
7.4. Number of criminal incidents reported to police per 1,000 public school students, by seriousness of the incident, urbanicity, and selected school characteristics: 1996�97.................................................. 64
8.1. Percentage of public schools that reported one or more incidents of serious violent crime to police, by type of incident, urbanicity, and selected school characteristics: 1996�97 ....................................... 65
8.2. Percentage of public schools that reported one or more less serious violent or nonviolent criminal incidents to police, by type of incident, urbanicity, and selected school characteristics: 1996�97......... 66

xvi List of Tables
Table Page
8.3. Number of public schools that reported one or more incidents of serious violent crime to police, by type of incident, urbanicity, and selected school characteristics: 1996�97 ............................................ 67
8.4. Number of public schools that reported one or more less serious violent or nonviolent criminal inci-dents to police, by type of incident, urbanicity, and selected school characteristics: 1996�97 .............. 68
8.5. Number of serious violent criminal incidents occurring in public schools reported to police, by type of incident, urbanicity, and selected school characteristics: 1996�97........................................................ 69
8.6. Number of less serious violent or nonviolent criminal incidents occurring in public schools reported to police, by type of incident, urbanicity, and selected school characteristics: 1996�97............................ 70
8.7. Number of serious violent criminal incidents reported to police per 1,000 public school students, by type of incident, urbanicity, and selected school characteristics: 1996�97 ............................................ 71
8.8. Number of less serious violent or nonviolent criminal incidents reported to police per 1,000 public school students, by type of incident, urbanicity, and selected school characteristics: 1996�97 ............ 72
9.1. Number of nonfatal crimes against teachers and average annual number of crimes per 1,000 teach-ers at school, by type of crime and selected teacher characteristics: Aggregated from 1995 to 1999... 73
10.1. Percentage and number of teachers who reported that they were threatened with injury or that they were physically attacked by a student during the past 12 months, by urbanicity and selected teacher and school characteristics: 1993�94 school year................................................................................... 74
11.1. Percentage of students in grades 9 through 12 who reported carrying a weapon on school property at least 1 day in the past 30 days, by selected student characteristics: 1993, 1995, 1997, and 1999... 75
11.2. Percentage of students in grades 9 through 12 who reported carrying a weapon anywhere at least 1 day in the past 30 days, by selected student characteristics: 1993, 1995, 1997, and 1999................... 76
12.1. Percentage of students ages 12 through 18 who reported fearing being attacked or harmed at school or on the way to and from school during the previous 6 months, by selected student characteristics: 1989, 1995, and 1999............................................................................................................................. 77
13.1. Percentage of students ages 12 through 18 who reported that they avoided one or more places in school during the previous 6 months, by selected student characteristics: 1989, 1995, and 1999........ 78
14.1. Percentage of students ages 12 through 18 who reported being targets of hate-related words or who saw hate-related graffiti at school during the previous 6 months, by selected student characteristics: 1999........................................................................................................................................................ 79
15.1. Percentage of students ages 12 through 18 who reported that street gangs were present at school during the previous 6 months, by selected student characteristics: 1989, 1995, and 1999 ................... 80
16.1 Percentage and number of public schools that reported that 1 or more of 17 discipline issues was a serious problem in their school, by urbanicity and selected school characteristics: 1996�97................ 81
List of Tables xvii
Table Page
17.1. Percentage of students in grades 9 through 12 who reported using alcohol in the last 30 days, by selected student characteristics: 1993, 1995, 1997, and 1999 .............................................................. 82
18.1. Percentage of students in grades 9 through 12 who reported using marijuana in the last 30 days, by selected student characteristics: 1993, 1995, 1997, and 1999 .............................................................. 83
19.1. Percentage of students in grades 9 through 12 who reported that drugs were made available to them on school property during the last 12 months, by selected student characteristics: 1993, 1995, 1997, and 1999................................................................................................................................................. 84
Standard Error Tables
S2.1. Standard errors for table 2.1: Number of nonfatal crimes against students ages 12 through 18 occur-ring at school or on the way to or from school, by type of crime and selected student characteristics: 1992 to 1999........................................................................................................................................... 87
S2.2. Standard errors for table 2.2: Number of nonfatal crimes against students ages 12 through 18 occur-ring at school or on the way to or from school per 1,000 students, by type of crime and selected stu-dent characteristics: 1992 to 1999.......................................................................................................... 90
S2.3. Standard errors for table 2.3: Number of nonfatal crimes against students ages 12 through 18 occur-ring away from school, by type of crime and selected student characteristics: 1992 to 1999................ 93
S2.4. Standard errors for table 2.4: Number of nonfatal crimes against students ages 12 through 18 occur-ring away from school per 1,000 students, by type of crime and selected student characteristics: 1992 to 1999........................................................................................................................................... 96
S3.1. Standard errors for table 3.1: Percentage of students ages 12 through 18 who reported criminal vic-timization at school during the previous 6 months, by type of victimization and selected student char-acteristics: 1995 and 1999...................................................................................................................... 99
S4.1. Standard errors for table 4.1: Percentage of students in grades 9 through 12 who reported being threatened or injured with a weapon on school property during the last 12 months, by selected stu-dent characteristics: 1993, 1995, 1997, and 1999.................................................................................. 100
S5.1. Standard errors for table 5.1: Percentage of students in grades 9 through 12 who reported having been in a physical fight in the last 12 months, by selected student characteristics: 1993, 1995, 1997, and 1999................................................................................................................................................. 101
S6.1. Standard errors for table 6.1: Percentage of students ages 12 through 18 who reported being bullied at school during the previous 6 months, by gender and selected student characteristics: 1999............ 102
S7.1. Standard errors for table 7.1: Percentage of public schools that reported one or more criminal inci-dents to police, by seriousness of the incident, urbanicity, and selected school characteristics: 1996�97............................................................................................................................................................ 103
S7.2. Standard errors for table 7.2: Number of public schools that reported one or more criminal incidents to police, by seriousness of the incident, urbanicity, and selected school characteristics: 1996�97 ..... 104

xviii List of Tables
Table Page
S7.3. Standard errors for table 7.3: Number of criminal incidents occurring in public schools reported to police, by seriousness of the incident, urbanicity, and selected school characteristics: 1996�97 ......... 105
S7.4. Standard errors for table 7.4: Number of criminal incidents reported to police per 1,000 public school students, by seriousness of the incident, urbanicity, and selected school characteristics: 1996�97 ..... 106
S8.1. Standard errors for table 8.1: Percentage of public schools that reported one or more incidents of serious violent crime to police, by type of incident, urbanicity, and selected school characteristics: 1996�97.................................................................................................................................................. 107
S8.2. Standard errors for table 8.2: Percentage of public schools that reported one or more less serious violent or nonviolent criminal incidents to police, by type of incident, urbanicity, and selected school characteristics: 1996�97......................................................................................................................... 108
S8.3. Standard errors for table 8.3: Number of public schools that reported one or more incidents of seri-ous violent crime to police, by type of incident, urbanicity, and selected school characteristics: 1996�97............................................................................................................................................................ 109
S8.4. Standard errors for table 8.4: Number of public schools that reported one or more less serious violent or nonviolent criminal incidents to police, by type of incident, urbanicity, and selected school charac-teristics: 1996�97 ................................................................................................................................... 110
S8.5. Standard errors for table 8.5: Number of serious violent criminal incidents occurring in public schools reported to police, by type of incident, urbanicity, and selected school characteristics: 1996�97 ......... 111
S8.6. Standard errors for table 8.6: Number of less serious violent or nonviolent criminal incidents occur-ring in public schools reported to police, by type of incident, urbanicity, and selected school charac-teristics: 1996�97 ................................................................................................................................... 112
S8.7. Standard errors for table 8.7: Number of serious violent criminal incidents reported to police per 1,000 public school students, by type of incident, urbanicity, and selected school characteristics: 1996�97.................................................................................................................................................. 113
S8.8. Standard errors for table 8.8: Number of less serious violent or nonviolent criminal incidents reported to police per 1,000 public school students, by type of incident, urbanicity, and selected school char-acteristics: 1996�97................................................................................................................................ 114
S9.1. Standard errors for table 9.1: Number of nonfatal crimes against teachers and average annual num-ber of crimes per 1,000 teachers at school, by type of crime and selected teacher characteristics: Aggregated from 1995 to 1999............................................................................................................... 115
S10.1. Standard errors for table 10.1: Percentage and number of teachers who reported that they were threatened with injury or that they were physically attacked by a student during the past 12 months, by urbanicity and selected teacher and school characteristics: 1993�94 school year ........................... 116
S11.1. Standard errors for table 11.1: Percentage of students in grades 9 through 12 who reported carrying a weapon on school property at least 1 day in the past 30 days, by selected student characteristics: 1993, 1995, 1997, and 1999................................................................................................................... 117

List of Tables xix
Table Page
S11.2. Standard errors for table 11.2: Percentage of students in grades 9 through 12 who reported carrying a weapon anywhere at least 1 day in the past 30 days, by selected student characteristics: 1993, 1995, 1997, and 1999............................................................................................................................. 118
S12.1. Standard errors for table 12.1: Percentage of students ages 12 through 18 who reported fearing be-ing attacked or harmed at school or on the way to and from school during the previous 6 months, by selected student characteristics: 1989, 1995, and 1999 ........................................................................ 119
S13.1. Standard errors for table 13.1: Percentage of students ages 12 through 18 who reported that they avoided one or more places in school during the previous 6 months, by selected student characteris-tics: 1989, 1995, and 1999 ..................................................................................................................... 120
S14.1 Standard errors for table 14.1: Percentage of students ages 12 through 18 who reported being tar-gets of hate-related words or who saw hate-related graffiti at school during the previous 6 months, by selected student characteristics: 1999 ................................................................................................... 121
S15.1. Standard errors for table 15.1: Percentage of students ages 12 through 18 who reported that street gangs were present at school during the previous 6 months, by selected student characteristics: 1989, 1995, and 1999............................................................................................................................. 122
S16.1. Standard errors for table 16.1: Percentage and number of public schools that reported that 1 or more of 17 discipline issues was a serious problem in their school, by urbanicity and selected school char-acteristics: 1996�97................................................................................................................................ 123
S17.1. Standard errors for table 17.1: Percentage of students in grades 9 through 12 who reported using alcohol in the last 30 days, by selected student characteristics: 1993, 1995, 1997, and 1999 .............. 124
S18.1. Standard errors for table 18.1: Percentage of students in grades 9 through 12 who reported using marijuana in the last 30 days, by selected student characteristics: 1993, 1995, 1997, and 1999.......... 125
S19.1. Standard errors for table 19.1: Percentage of students in grades 9 through 12 who reported that drugs were made available to them on school property during the last 12 months, by selected stu-dent characteristics: 1993, 1995, 1997, and 1999.................................................................................. 126
Appendix Tables
A1. Percentage of public schools that reported that they have a zero tolerance policy for various speci-fied student offenses, by selected school characteristics: 1996�97....................................................... 129
A2. Percentage of public schools that reported that students were required to wear school uniforms, by selected school characteristics: 1996�97............................................................................................... 130
A3. Percentage of public schools that reported that they use various types of security measures at their schools, by selected school characteristics: 1996�97............................................................................ 131
A4. Percentage of public schools that reported various levels of police or other law enforcement repre-sentatives� presence during a typical week, by selected school characteristics: 1996�97 .................... 132

xx List of Tables
Table Page
A5. Percentage of public schools that reported formal school violence prevention or reduction programs or efforts, by selected school characteristics: 1996�97.......................................................................... 133
A6. Number and percentage of schools in which specified disciplinary actions were taken against stu-dents, total number of actions taken, and percentage of specific disciplinary actions taken against students, by type of infraction: 1996�97................................................................................................. 134
A7. Standard errors for table A1: Percentage of public schools that reported that they have a zero toler-ance policy for various specified student offenses, by selected school characteristics: 1996�97 ......... 135
A8. Standard errors for table A2: Percentage of public schools that reported that students were required to wear school uniforms, by selected school characteristics: 1996�97.................................................. 136
A9. Standard errors for table A3: Percentage of public schools that reported that they use various types of security measures at their schools, by selected school characteristics: 1996�97 ............................. 137
A10. Standard errors for table A4: Percentage of public schools that reported various levels of police or other law enforcement representatives� presence during a typical week, by selected school charac-teristics: 1996�97 ................................................................................................................................... 138
A11. Standard errors for table A5: Percentage of public schools that reported formal school violence pre-vention or reduction programs or efforts, by selected school characteristics: 1996�97......................... 139
A12. Standard errors for table A6: Number and percentage of schools in which specified disciplinary actions were taken against students, total number of actions taken, and percentage of specific disci-plinary actions taken against students, by type of infraction: 1996�97 .................................................. 140
B1. Descriptions of data sources and samples used in the report................................................................ 153
B2. Wording of survey questions used to construct indicators ..................................................................... 154
B3. Methods used to calculate standard errors of statistics for different surveys ......................................... 161
List of Figures xxi
LIST OF FIGURES
Figure Page
1.1. Number of murders and suicides of students at school and of youth ages 5 through 19 away from school: 1998�99 ..................................................................................................................................... 2
2.1. Number of nonfatal crimes against students ages 12 through 18 per 1,000 students, by type of crime and location: 1992 to 1999 ..................................................................................................................... 5
2.2 Number of nonfatal crimes against students ages 12 through 18 occurring at school or going to or from school per 1,000 students, by type of crime and selected student characteristics: 1999............... 6
2.3 Number of nonfatal crimes against students ages 12 through 18 occurring away from school per 1,000 students, by type of crime and selected student characteristics: 1999 ........................................ 7
3.1. Percentage of students ages 12 through 18 who reported criminal victimization at school during the previous 6 months, by grade level: 1995 and 1999................................................................................ 8
4.1. Percentage of students in grades 9 through 12 who reported being threatened or injured with a weapon on school property during the last 12 months, by gender: 1993, 1995, 1997, and 1999 .......... 9
4.2. Percentage of students in grades 9 through 12 who reported being threatened or injured with a weapon on school property during the last 12 months, by grade: 1993, 1995, 1997, and 1999 ............ 10
5.1. Percentage of students in grades 9 through 12 who reported having been in a physical fight in the last 12 months, by gender: 1993, 1995, 1997, and 1999 ....................................................................... 12
5.2. Percentage of students in grades 9 through 12 who reported having been in a physical fight in the last 12 months, by grade: 1993, 1995, 1997, and 1999 ......................................................................... 12
6.1. Percentage of students ages 12 through 18 who reported being bullied at school during the previous 6 months, by grade level and gender: 1999 ........................................................................................... 13
7.1. Percentage distribution of public schools according to types of crimes reported to police: 1996�97..... 16
7.2. Percentage of public schools that reported one or more criminal incidents to police and number of incidents reported per 1,000 students, by seriousness of crimes, instructional level, and urbanicity: 1996�97.................................................................................................................................................. 17
8.1. Percentage of public schools that reported one or more criminal incidents to police, by type of crime and instructional level: 1996�97 ............................................................................................................. 18
8.2. Number of crimes per 1,000 public school students, by type of crime, instructional level, and urbanic-ity: 1996�97 ............................................................................................................................................ 19

xxii List of Figures
Figure Page
9.1. Average annual number of nonfatal crimes against teachers at school per 1,000 teachers, by type of crime and selected characteristics: Aggregated from 1995 to 1999....................................................... 23
10.1. Percentage of teachers who reported that they were threatened with injury or that they were physi-cally attacked by a student from school during the past 12 months, by urbanicity and control: 1993�94 school year ........................................................................................................................................ 24
11.1. Percentage of students in grades 9 through 12 who reported carrying a weapon at least 1 day in the past 30 days, by gender: 1993, 1995, 1997, and 1999 .......................................................................... 27
11.2. Percentage of students in grades 9 through 12 who reported carrying a weapon at least 1 day in the past 30 days, by grade: 1993, 1995, 1997, and 1999 ............................................................................ 27
12.1. Percentage of students ages 12 through 18 who reported fearing being attacked or harmed at school during the previous 6 months, by race/ethnicity: 1989, 1995, and 1999 ................................................ 29
12.2. Percentage of students ages 12 through 18 who reported fearing being attacked or harmed on the way to and from school during the previous 6 months, by race/ethnicity: 1989, 1995, and 1999 .......... 29
13.1. Percentage of students ages 12 through 18 who reported that they avoided one or more places in school during the previous 6 months, by race/ethnicity: 1989, 1995, and 1999..................................... 31
13.2. Percentage of students ages 12 through 18 who reported that they avoided one or more places in school during the previous 6 months, by urbanicity: 1989, 1995, and 1999........................................... 31
14.1. Percentage of students ages 12 through 18 who reported being targets of hate-related words or who saw hate-related graffiti at school during the previous 6 months, by gender and race/ethnicity: 1999........................................................................................................................................................ 32
15.1. Percentage of students ages 12 through 18 who reported that street gangs were present at school during the previous 6 months, by control of school: 1989, 1995, and 1999 ........................................... 33
15.2. Percentage of students ages 12 through 18 who reported that street gangs were present at school during the previous 6 months, by urbanicity: 1989, 1995, and 1999 ...................................................... 34
15.3. Percentage of students ages 12 through 18 who reported that street gangs were present at school during the previous 6 months, by race/ethnicity: 1989, 1995, and 1999 ................................................ 34
16.1. Percentage of public schools that reported that 1 or more of 17 discipline issues was a serious prob-lem in their school, by instructional level and urbanicity: 1996�97......................................................... 35
17.1. Percentage of students in grades 9 through 12 who reported using alcohol in the last 30 days, by gender: 1993, 1995, 1997, and 1999 ..................................................................................................... 36
17.2. Percentage of students in grades 9 through 12 who reported using alcohol in the last 30 days, by grade: 1993, 1995, 1997, and 1999 ....................................................................................................... 37
18.1. Percentage of students in grades 9 through 12 who reported using marijuana in the last 30 days, by gender: 1993, 1995, 1997, and 1999 ..................................................................................................... 38

List of Figures xxiii
Figure Page
18.2. Percentage of students in grades 9 through 12 who reported using marijuana in the last 30 days, by grade: 1993, 1995, 1997, and 1999 ....................................................................................................... 39
19.1. Percentage of students in grades 9 through 12 who reported that drugs were made available to them on school property during the last 12 months, by gender: 1993, 1995, 1997, and 1999........................ 40
19.2. Percentage of students in grades 9 through 12 who reported that drugs were made available to them on school property during the last 12 months, by race/ethnicity: 1999................................................... 41
Violent Deaths at School

2 Violent Deaths at School
1. Violent deaths at school and away from school*
Violent deaths are tragic events that affect not only the individuals and their families directly involved but also everyone in the schools where they occur. Violent deaths at school receive national attention; accurate data on the magnitude of this problem are important. *This indicator has been updated to include 1999 data.
! From July 1, 1998 through June 30, 1999, there were 47 school-associated violent deaths in the United States.1 Thirty-eight of these vio-lent deaths were homicides, six were suicides, two were killed by a law enforcement officer in the line of duty, and one was unintentional.
! Thirty-three of the 38 school-associated homicides were of school-aged children. There were a total of 2,407 homicides of children ages 5 through 19 occurring from July 1, 1998 through June 30, 1999.
! Four of the six school-associated suicides occurring between July 1, 1998 through June 30, 1999 were of school-aged children. There were a total of 1,854 suicides of children ages 5 through 19 occurring in the 1999 calen-dar year.
1See glossary for definition of school-associated violent deaths.
Figure 1.1.�Number of murders and suicides of students at school and of youth ages 5 through 19Figure 1.1.�away from school: 1998�99
1Student murders and suicides at school, July 1, 1998 to June 30, 1999.2Murders of youth ages 5 through 19 away from school, July 1, 1998 to June 30, 1999.3Suicides of youth ages 5 through 19 away from school, during calendar year, 1999.
NOTE: �At school� includes on school property, on the way to or from school, and while attending or traveling to or from a school-sponsored event.
SOURCE: Special tabulation using preliminary data from the School Associated Violent Deaths Study, 1998�1999; Special tabulation using the FBISupplementary Homicide Reports, 1998 and 1999; Special tabulation using preliminary data from U.S. Department of Health and Human Services,Public Health Service, Centers for Disease Control and Prevention, National Center for Health Statistics, Vital Statistics of the United States, 1998and 1999.
Murders
2,3742
331
Total2,407
Suicides
1,8503
41
Total1,854
Away from schoolAt school

Nonfatal Student Victimization�
Student Reports
4 Nonfatal Student Victimization
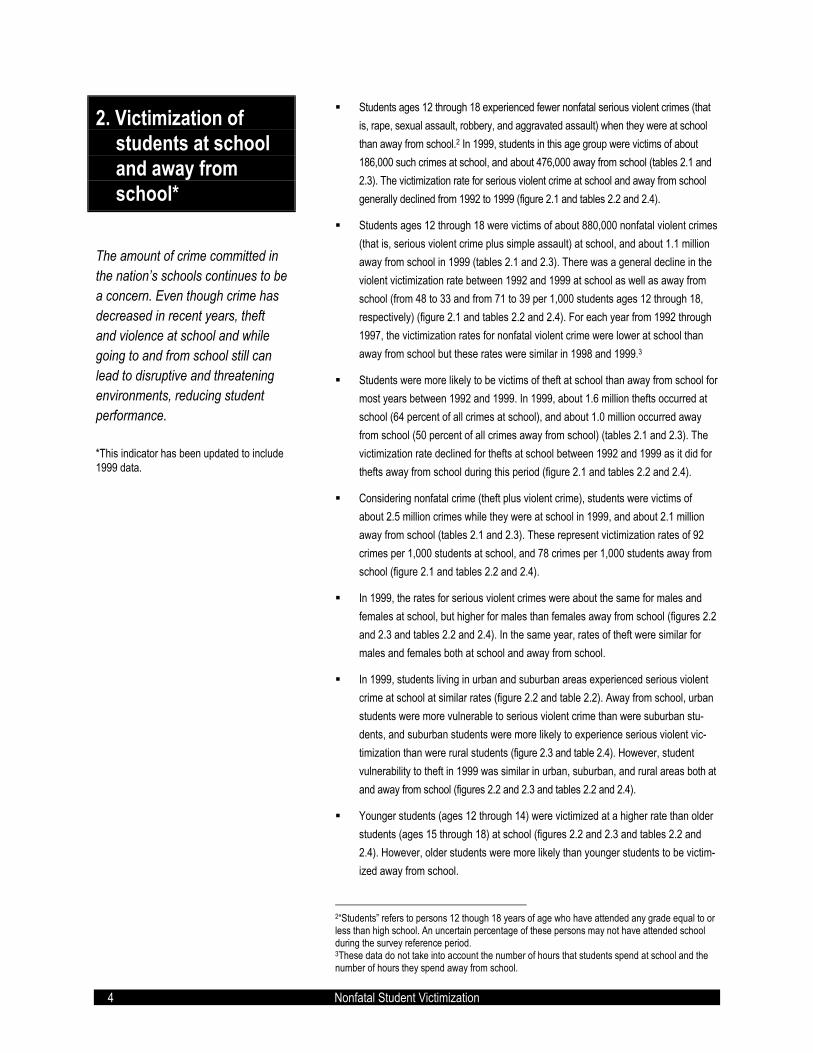
2. Victimization of students at school and away from school*
The amount of crime committed in the nation�s schools continues to be a concern. Even though crime has decreased in recent years, theft and violence at school and while going to and from school still can lead to disruptive and threatening environments, reducing student performance. *This indicator has been updated to include 1999 data.
! Students ages 12 through 18 experienced fewer nonfatal serious violent crimes (that is, rape, sexual assault, robbery, and aggravated assault) when they were at school than away from school.2 In 1999, students in this age group were victims of about 186,000 such crimes at school, and about 476,000 away from school (tables 2.1 and 2.3). The victimization rate for serious violent crime at school and away from school generally declined from 1992 to 1999 (figure 2.1 and tables 2.2 and 2.4).
! Students ages 12 through 18 were victims of about 880,000 nonfatal violent crimes (that is, serious violent crime plus simple assault) at school, and about 1.1 million away from school in 1999 (tables 2.1 and 2.3). There was a general decline in the violent victimization rate between 1992 and 1999 at school as well as away from school (from 48 to 33 and from 71 to 39 per 1,000 students ages 12 through 18, respectively) (figure 2.1 and tables 2.2 and 2.4). For each year from 1992 through 1997, the victimization rates for nonfatal violent crime were lower at school than away from school but these rates were similar in 1998 and 1999.3
! Students were more likely to be victims of theft at school than away from school for most years between 1992 and 1999. In 1999, about 1.6 million thefts occurred at school (64 percent of all crimes at school), and about 1.0 million occurred away from school (50 percent of all crimes away from school) (tables 2.1 and 2.3). The victimization rate declined for thefts at school between 1992 and 1999 as it did for thefts away from school during this period (figure 2.1 and tables 2.2 and 2.4).
! Considering nonfatal crime (theft plus violent crime), students were victims of about 2.5 million crimes while they were at school in 1999, and about 2.1 million away from school (tables 2.1 and 2.3). These represent victimization rates of 92 crimes per 1,000 students at school, and 78 crimes per 1,000 students away from school (figure 2.1 and tables 2.2 and 2.4).
! In 1999, the rates for serious violent crimes were about the same for males and females at school, but higher for males than females away from school (figures 2.2 and 2.3 and tables 2.2 and 2.4). In the same year, rates of theft were similar for males and females both at school and away from school.
! In 1999, students living in urban and suburban areas experienced serious violent crime at school at similar rates (figure 2.2 and table 2.2). Away from school, urban students were more vulnerable to serious violent crime than were suburban stu-dents, and suburban students were more likely to experience serious violent vic-timization than were rural students (figure 2.3 and table 2.4). However, student vulnerability to theft in 1999 was similar in urban, suburban, and rural areas both at and away from school (figures 2.2 and 2.3 and tables 2.2 and 2.4).
! Younger students (ages 12 through 14) were victimized at a higher rate than older students (ages 15 through 18) at school (figures 2.2 and 2.3 and tables 2.2 and 2.4). However, older students were more likely than younger students to be victim-ized away from school.
2�Students� refers to persons 12 though 18 years of age who have attended any grade equal to or less than high school. An uncertain percentage of these persons may not have attended school during the survey reference period. 3These data do not take into account the number of hours that students spend at school and the number of hours they spend away from school.

Nonfatal Student Victimization 5
Figure 2.1.�Number of nonfatal crimes against students ages 12 through 18 per 1,000 students,Figure 1.1.�by type of crime and location: 1992 to 1999
NOTE: Serious violent crimes include rape, sexual assault, robbery, and aggravated assault. Violent crimes include serious violent crimes andsimple assault. Total crimes include violent crimes and theft. �At school� includes inside the school building, on school property, or on the way to orfrom school.
SOURCE: U.S. Department of Justice, Bureau of Justice Statistics, National Crime Victimization Survey, 1992 to 1999.
At school Away from school
Total
0
50
100
150
200
1992 1993 1994 1995 1996 1997 1998 1999
Numberper 1,000
0
50
100
150
200
Thefts
0
50
100
150
200
1992 1993 1994 1995 1996 1997 1998 1999
Numberper 1,000
0
50
100
150
200
Violent crimes
0
50
100
150
200
1992 1993 1994 1995 1996 1997 1998 1999
Numberper 1,000
0
50
100
150
200
Serious violent crimes
0
50
100
150
200
1992 1993 1994 1995 1996 1997 1998 1999
Numberper 1,000
0
50
100
150
200

6 Nonfatal Student Victimization
Figure 2.2.�Number of nonfatal crimes against students ages 12 through 18 occurring at schoolFigure 1.2.�or going to or from school per 1,000 students, by type of crime and selected studentFigure 1.2.�characteristics: 1999
NOTE: Serious violent crimes include rape, sexual assault, robbery, and aggravated assault. Violent crimes include serious violent crimes andsimple assault. Total crimes include violent crimes and theft. �At school� includes inside the school building, on school property, or on the way to orfrom school. Detail may not add to totals because of rounding.
SOURCE: U.S. Department of Justice, Bureau of Justice Statistics, National Crime Victimization Survey, 1999.
Gender
98
6237
8
8557
286
0
50
100
150
200
Total Theft Violent Serious violentType of crime
Numberper 1,000
Male Female
Age
120
7446
11
7048
234
0
50
100
150
200
Total Theft Violent Serious violentType of crime
Numberper 1,000
12�14 years 15�18 years
Urbanicity
9363
299
94
5836
8
8658
282
0
50
100
150
200
Total Theft Violent Serious violentType of crime
Numberper 1,000
Urban Suburban Rural

Nonfatal Student Victimization 7
Figure 2.3.�Number of nonfatal crimes against students ages 12 through 18 occurring away fromFigure 1.3.�school per 1,000 students, by type of crime and selected student characteristics: 1999
NOTE: Serious violent crimes include rape, sexual assault, robbery, and aggravated assault. Violent crimes include serious violent crimes andsimple assault. Total crimes include violent crimes and theft. Detail may not add to totals because of rounding.
SOURCE: U.S. Department of Justice, Bureau of Justice Statistics, National Crime Victimization Survey, 1999.
Gender
89
43 4622
66
34 3113
0
50
100
150
200
Total Theft Violent Serious violentType of crime
Numberper 1,000
Male Female
Age
5934 25
11
93
43 5023
0
50
100
150
200
Total Theft Violent Serious violentType of crime
Numberper 1,000
12�14 years 15�18 years
Urbanicity
90
42 4728
81
40 4116
5430 24
80
50
100
150
200
Total Theft Violent Serious violentType of crime
Numberper 1,000
Urban Suburban Rural

8 Nonfatal Student Victimization
3. Prevalence of students being victimized at school*
Some of the crimes committed against students involve violence, while others involve their property. Presenting information on the prevalence of victimization for stu-dents helps clarify what percentage of students are affected by different types of crime. *This indicator repeats information from the 2000 Indicators of School Crime and Safety report.
! In 1999, a smaller percentage of students ages 12 through 18 reported being victims of nonfatal crimes (including either theft or violent crimes) at school during the previous 6 months than in 1995 (10 percent and 8 per-cent, respectively)(figure 3.1 and table 3.1). About 7 percent in 1995 were victims of theft compared with 6 percent in 1999. Also, 3 percent of stu-dents in 1995 reported being victims of violence at school compared with 2 percent in 1999.
! The decline in the prevalence of victimization between 1995 and 1999 was due in part to a decline for students in grades 7 through 9 (figure 3.1 and table 3.1). Between 1995 and 1999, the prevalence of reported victimiza-tion dropped from 11 percent to 8 percent for 7th graders, from 11 percent to 8 percent for 8th graders, and from 12 percent to 9 percent for 9th graders. During the same period, the prevalence of victimization remained relatively constant for 6th, 10th, 11th, and 12th graders.
! In both 1995 and 1999, public school students were more likely to report having been victims of violent crime during the previous 6 months than were private school students (table 3.1). Public school students were also more likely than private school students to report being victims of theft at school in 1995, but equally likely to experience theft in 1999.
Figure 3.1.�Percentage of students ages 12 through 18 who reported criminal victimization atFigure 3.1.�school during the previous 6 months, by grade level: 1995 and 1999Figure 3.1.�Figure 3.1.�
NOTE: This figure presents the prevalence of total victimization, which is a combination of violent victimization and theft. �At school� means in theschool building, on school property, or on the way to or from school. (See Technical Notes in appendix B for further information.)
SOURCE: U.S. Department of Justice, Bureau of Justice Statistics, School Crime Supplement to the National Crime Victimization Survey,January�June 1995 and 1999.
10 10 11 11 12
9 7 6
8 8 8 8 9 8 7 5
0
5
10
15
20
All grades 6th 7th 8th 9th 10th 11th 12thGrade
Percent
19951999

Nonfatal Student Victimization 9
4. Prevalence of students being threatened or injured with a weapon on school property*
Every year, some students are threatened or injured with a weapon while they are on school property. The percentages of students victimized in this way provide an important measure of how safe our schools are and how this is changing over time. *This indicator has been updated to include 1999 data.
! The percentage of students in grades 9 through 12 who were threatened or injured with a weapon on school property in the 12 months before the survey has remained constant in recent years (figure 4.1 and table 4.1). In 1993, 1995, 1997, and 1999, about 7 to 8 percent of students reported being threatened or injured with a weapon such as a gun, knife, or club on school property.
! In each survey year, males were more likely than females to report being threatened or injured with a weapon on school property (figure 4.1 and table 4.1). For example, in 1999, 10 percent of males reported being threatened or injured in the past year, compared with 6 percent of females.
! Of 9th through 12th grade students, those students in lower grades were more likely to be threatened or injured with a weapon on school property than were students in higher grades in all survey years (figure 4.2 and table 4.1).
! There were no racial/ethnic differences in the percentages of students being threatened or injured with a weapon on school property in 1999 (table 4.1).4
4While there appear to be large differences among racial/ethnic groups, these differences are associated with large standard errors and are not statistically significant.
Figure 4.1.�Percentage of students in grades 9 through 12 who reported being threatened orFigure 3.1.�injured with a weapon on school property during the last 12 months, by gender:Figure 3.1.�1993, 1995, 1997, and 1999
Figure 3.1.�
*The response rate for this survey was less than 70 percent and a full nonresponse bias analysis has not been done to date.
NOTE: �On school property� was not defined for survey respondents.
SOURCE: Centers for Disease Control and Prevention, National Center for Chronic Disease Prevention and Health Promotion, Youth RiskBehavior Surveillance System (YRBSS), �Youth Risk Behavior Survey� (YRBS), 1993, 1995, 1997, and 1999.
6
10
8
4
7
6
11
5
9
7
10
8
0 2 4 6 8 10 12 14 16 18 20
Female
Male
Total
Percent
1993 1995*1997*1999*

10 Nonfatal Student Victimization
Figure 4.2.�Percentage of students in grades 9 through 12 who reported being threatened orFigure 3.2.�injured with a weapon on school property during the last 12 months, by grade:Figure 3.2.�1993, 1995, 1997, and 1999
*The response rate for this survey was less than 70 percent and a full nonresponse bias analysis has not been done to date.
NOTE: �On school property� was not defined for survey respondents.
SOURCE: Centers for Disease Control and Prevention, National Center for Chronic Disease Prevention and Health Promotion, Youth RiskBehavior Surveillance System (YRBSS), �Youth Risk Behavior Survey� (YRBS), 1993, 1995, 1997, and 1999.
5
6
8
11
8
6
6
8
10
7
7
8
10
10
6
7
7
9
78
0 2 4 6 8 10 12 14 16 18 20
12th grade
11th grade
10th grade
9th grade
Total
Percent
1993 1995*1997*1999*

Nonfatal Student Victimization 11
5. Prevalence of stu-dents involved in physical fights on school property*
Schools where there are numerous physical fights may not be able to maintain a focused learning envi-ronment. Students who are con-stantly involved in fights on school property cannot be ready to learn. *This indicator has been updated to include 1999 data.
! In all years, students were more likely to report being in a fight anywhere5 than to report being in a fight on school property in the last 12 months (figure 5.1 and table 5.1). In 1999, 36 percent of students in grades 9 through 12 reported that they had been in a physical fight anywhere. In that same year, about 14 percent of all students said that they had been in a physical fight on school property.
! The percentage of students who reported being in a fight anywhere de-clined from 1993 to 1999�from 42 percent in 1993 to 36 percent in 1999 (figure 5.1 and table 5.1). Similarly, the percentages of students who re-ported fighting on school property for these years also declined, from 16 percent in 1993 to 14 percent in 1999.
! In all survey years, males were more likely than females to have been in a fight anywhere and on school property (figure 5.1 and table 5.1). In 1999, 44 percent of males said they had been in a fight anywhere, and 19 per-cent said they had been in a fight on school property. In that same year, about 27 percent of females reported they had been in a fight anywhere, and 10 percent said they had been in a fight on school property.
! Of 9th through 12th grade students, those in lower grades reported being in more fights than students in higher grades anywhere and on school property in all survey years (figure 5.2 and table 5.1).
! In 1999, Asian students were less likely than students from other ra-cial/ethnic backgrounds to report being in a fight anywhere (23 percent for Asian students compared to 33 to 51 percents for all other students) (table 5.1). In addition, they were less likely to report being in a fight on school property than black or African American, Native Hawaiian or other Pacific Islander, and Hispanic or Latino students (10 percent compared to 19, 25, and 16 percent, respectively).
5The term �anywhere� is not used in the YRBS questionnaire. Rather, students are sim-ply asked how many times in the last 12 months they had been in a physical fight.

12 Nonfatal Student Victimization
Figure 5.1.�Percentage of students in grades 9 through 12 who reported having been in a physicalFigure 5.1.�fight in the last 12 months, by gender: 1993, 1995, 1997, and 1999
*The response rate for this survey was less than 70 percent and a full nonresponse bias analysis has not been done to date.
NOTE: �On school property� was not defined for survey respondents. The term �anywhere� is not used in the YRBS questionnaire. Rather,students are simply asked how many times in the last 12 months they had been in a physical fight.
SOURCE: Centers for Disease Control and Prevention, National Center for Chronic Disease Prevention and Health Promotion, Youth RiskBehavior Surveillance System (YRBSS), �Youth Risk Behavior Survey� (YRBS), 1993, 1995, 1997, and 1999.
Anywhere
27
26
31
32
44
46
46
51
36
37
39
42
0 20 40 60 80 100
1999*
1997*
1995*
1993
Percent
On school property
10
9
10
9
19
20
21
24
14
15
16
16
0 20 40 60 80 100
1999*
1997*
1995*
1993
Percent
TotalMaleFemale
Figure 5.2.�Percentage of students in grades 9 through 12 who reported having been in a physicalFigure 6.1.�fight in the last 12 months, by grade: 1993, 1995, 1997, and 1999
*The response rate for this survey was less than 70 percent and a full nonresponse bias analysis has not been done to date.
NOTE: �On school property� was not defined for survey respondents. The term �anywhere� is not used in the YRBS questionnaire. Rather,students are simply asked how many times in the last 12 months they had been in a physical fight.
SOURCE: Centers for Disease Control and Prevention, National Center for Chronic Disease Prevention and Health Promotion, Youth RiskBehavior Surveillance System (YRBSS), �Youth Risk Behavior Survey� (YRBS), 1993, 1995, 1997, and 1999.
Anywhere
30
29
31
35
31
34
37
41
38
40
40
42
41
45
47
50
36
37
39
42
0 20 40 60 80 100
1999*
1997*
1995*
1993
Percent
On school property
8
10
11
11
11
13
14
14
17
17
17
19
21
22
23
14
15
16
16
17
0 20 40 60 80 100
1999*
1997*
1995*
1993
Percent
Total9th grade10th grade11th grade12th grade

Nonfatal Student Victimization 13
6. Prevalence of students being bullied at school*
Bullying contributes to a climate of fear and intimidation in schools. Students ages 12 through 18 were asked if they had been bullied (that is, picked on or made to do things they did not want to do) at school. *This indicator repeats information from the 2000 Indicators of School Crime and Safety report.
! In 1999, about 5 percent of students ages 12 through 18 reported that they had been bullied at school in the last 6 months (table 6.1). In general, females were as likely as males to report being bullied.
! Males were more likely to be bullied in grades 6 and 7 than were females (12 percent versus 7 percent respectively), while there was little difference in the percentage of males and females being bullied in the other two grade levels (table 6.1 and figure 6.1).
! There were few differences among racial/ethnic groups in the percentage of students who reported being bullied (table 6.1). The exception was that white and black students were more likely to report being victimized by bullies than were students of other, non-Hispanic origin. About 2 percent in this group, which includes Asians, Pacific Islanders, American Indians, and Alaskan Natives, reported being bullied, compared with about 5 percent of white and 6 percent of black students.
! Students in lower grades were more likely to be bullied than students in higher grades (table 6.1 and figure 6.1). About 10 percent of students in grades 6 and 7 reported being bullied, compared with about 5 percent of students in grades 8 and 9 and about 2 percent in grades 10 through 12.
Figure 6.1.�Percentage of students ages 12 through 18 who reported being bullied at schoolFigure 6.1.�during the previous 6 months, by grade level and gender: 1999
NOTE: �At school� means in the school building, on the school grounds, or on a school bus.
SOURCE: U.S. Department of Justice, Bureau of Justice Statistics, School Crime Supplement to the National Crime Victimization Survey, January�June, 1999.
75 5 5
2 2 3
1012
0
5
10
15
20
Total Male Female
Percent
6th�7th 8th�9th 10th�12th

Nonfatal Student Victimization�
Student Reports

Violence and Crime at School�
Public School Principal/Disciplinarian Reports

16 Violence and Crime at School
7. Crimes reported to the police*
The number of crimes that principals indicated they reported to police or other law enforcement representatives is a useful measure of the occurrences of serious crimes in the nation�s schools. The percentage of schools reporting crimes provides an indication of how widespread crime is, while the number of crimes reported provides information on the magnitude of the problem. *This indicator repeats information from the 2000 Indicators of School Crime and Safety report.
! In 1996�97, 10 percent of all public schools reported at least one serious violent crime to a law enforcement representative (figure 7.1 and table 7.1). Another 47 percent of public schools reported a less serious violent or nonviolent crime (but not a serious violent one). The remaining 43 percent of public schools did not report any of these crimes to the police.
! The vast majority of crimes reported by public schools were of the less serious violent or nonviolent type in 1996�97 (402,000 out of the 424,000 total crimes reported to the police) (table 7.3).
! The percentage of schools reporting crimes was similar at the middle and high school levels (figure 7.2 and table 7.1). At each level, about 20 percent of the schools reported at least one serious violent crime, and about 55 percent reported at least one less serious violent or nonviolent crime, but no serious violent crime in 1996�97.
! The numbers of reported incidents per 1,000 students were similar for middle and high schools for both serious violent and less serious violent and nonviolent crimes (figure 7.2 and table 7.4). For both types of crimes, there was a lower rate at the elementary level than at the middle or high school levels.
! The percentage of schools reporting at least one serious violent crime was much higher in cities (17 percent) than in towns (5 percent) or rural areas (8 percent) during 1996�97 (figure 7.2 and table 7.1).
Figure 7.1.�Percentage distribution of public schools according to types of crimes reported toFigure 6.1.�police: 1996�97
NOTE: Serious violent crimes include murder, rape or other type of sexual battery, suicide, physical attack or fight with a weapon, or robbery. Lessserious or nonviolent crimes include physical attack or fight without a weapon, theft/larceny, and vandalism. Schools were asked to report crimesthat took place in school buildings, on school buses, on school grounds, and at places holding school-sponsored events.
SOURCE: U.S. Department of Education, National Center for Education Statistics, Fast Response Survey System, �Principal/School Disciplinarian Survey on School Violence,� FRSS 63, 1997.
None
Less serious or nonviolent crime, but no serious violent crime
Serious violent crime
10%
43%
47%

Violence and Crime at School 17
Figure 7.2.�Percentage of public schools that reported one or more criminal incidents to policeFigure 7.2.�and number of incidents reported per 1,000 students, by seriousness of crimes,Figure 7.2.�instructional level, and urbanicity: 1996�97
NOTE: Serious violent crimes include murder, rape or other type of sexual battery, suicide, physical attack or fight with a weapon, or robbery. Lessserious or nonviolent crimes include physical attack or fight without a weapon, theft/larceny, and vandalism. Schools were asked to report crimesthat took place in school buildings, on school buses, on school grounds, and at places holding school-sponsored events.
SOURCE: U.S. Department of Education, National Center for Education Statistics, Fast Response Survey System, �Principal/School Disciplinarian Survey on School Violence,� FRSS 63, 1997.
56
55
41
19
21
0 20 40 60 80 100
High
Middle
Elementary
4
17
15
3
0 5 10 15 20
High
Middle
Elementary0.1
0.9
1.0
Percent of public schools
3.4
15.3
17.0
Less serious violent or nonviolent crimeSerious violent crime
9
10
9
11
0.4
0.3
0.4
0.9
0 5 10 15 20
Rural
Town
Urban fringe
City
8
11
17
58
47
42
5
39
0 20 40 60 80 100
Rural
Town
Urban fringe
City
Percent of public schools
Public schools reporting incidents
Number of incidents per 1,000
Number of incidents per 1,000 public school students Number of incidents per 1,000 public school students
Less serious violent or nonviolent crime onlySerious violent crime
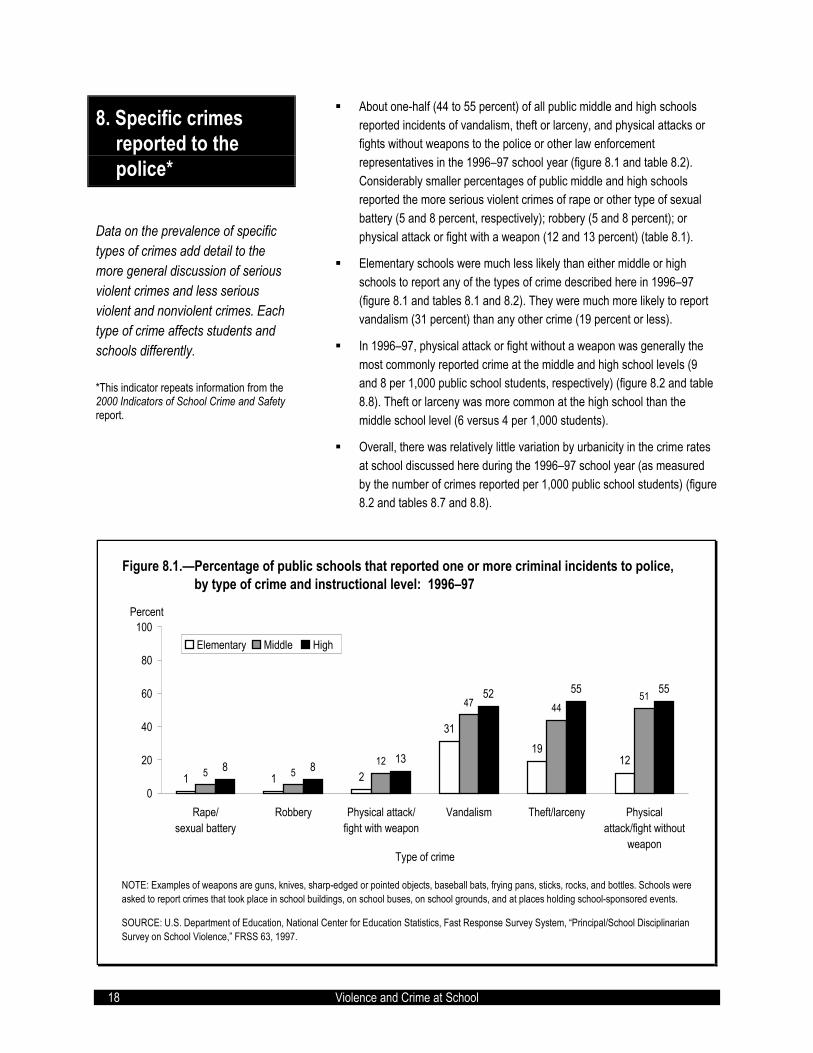
18 Violence and Crime at School
8. Specific crimes reported to the police*
Data on the prevalence of specific types of crimes add detail to the more general discussion of serious violent crimes and less serious violent and nonviolent crimes. Each type of crime affects students and schools differently. *This indicator repeats information from the 2000 Indicators of School Crime and Safety report.
! About one-half (44 to 55 percent) of all public middle and high schools reported incidents of vandalism, theft or larceny, and physical attacks or fights without weapons to the police or other law enforcement representatives in the 1996�97 school year (figure 8.1 and table 8.2). Considerably smaller percentages of public middle and high schools reported the more serious violent crimes of rape or other type of sexual battery (5 and 8 percent, respectively); robbery (5 and 8 percent); or physical attack or fight with a weapon (12 and 13 percent) (table 8.1).
! Elementary schools were much less likely than either middle or high schools to report any of the types of crime described here in 1996�97 (figure 8.1 and tables 8.1 and 8.2). They were much more likely to report vandalism (31 percent) than any other crime (19 percent or less).
! In 1996�97, physical attack or fight without a weapon was generally the most commonly reported crime at the middle and high school levels (9 and 8 per 1,000 public school students, respectively) (figure 8.2 and table 8.8). Theft or larceny was more common at the high school than the middle school level (6 versus 4 per 1,000 students).
! Overall, there was relatively little variation by urbanicity in the crime rates at school discussed here during the 1996�97 school year (as measured by the number of crimes reported per 1,000 public school students) (figure 8.2 and tables 8.7 and 8.8).
Figure 8.1.�Percentage of public schools that reported one or more criminal incidents to police,Figure 9.1.�by type of crime and instructional level: 1996�97
NOTE: Examples of weapons are guns, knives, sharp-edged or pointed objects, baseball bats, frying pans, sticks, rocks, and bottles. Schools wereasked to report crimes that took place in school buildings, on school buses, on school grounds, and at places holding school-sponsored events.
SOURCE: U.S. Department of Education, National Center for Education Statistics, Fast Response Survey System, �Principal/School Disciplinarian Survey on School Violence,� FRSS 63, 1997.
1 1 2
1912
5 512
47 4451
8 8 13
52 55 55
31
0
20
40
60
80
100
Rape/sexual battery
Robbery Physical attack/fight with weapon
Vandalism Theft/larceny Physicalattack/fight without
weaponType of crime
Percent
Elementary Middle High

Violence and Crime at School 19
Figure 8.2.�Number of crimes per 1,000 public school students, by type of crime, instructional level,Figure 9.2.�and urbanicity: 1996�97
*Less than 0.05.
NOTE: Examples of weapons are guns, knives, sharp-edged or pointed objects, baseball bats, frying pans, sticks, rocks, and bottles. Schools wereasked to report crimes that took place in school buildings, on school buses, on school grounds, and at places holding school-sponsored events.
SOURCE: U.S. Department of Education, National Center for Education Statistics, Fast Response Survey System, �Principal/School Disciplinarian Survey on School Violence,� FRSS 63, 1997.
0.2 0.4 0.42.6 3.2
4.9
0.1 0.1 0.22.3
4.4
0.1 0.22.5 2.9
4.6
0.1 0.32.4 2.61.8
0.0*3.5
0.10
5
10
15
20
Rape/sexualbattery
Robbery Physicalattack/fight with
weapon
Vandalism Theft/larceny Physicalattack/fight without
weapon
City Urban fringe Town Rural
Number per 1,000
Type of crime
Urbanicity
0.1 0.9 1.00.2 0.3 0.52.8 3.7
8.7
0.2 0.4
3.45.6
8.0
1.60.0* 0.0* 0.5
0
5
10
15
20
Rape/sexualbattery
Robbery Physicalattack/fight with
weapon
Vandalism Theft/larceny Physicalattack/fight without
weapon
Elementary Middle High
Number per 1,000
Type of crime
Instructional level
Nonfatal Teacher Victimization at School�
Teacher Reports

22 Nonfatal Teacher Victimization
9. Nonfatal teacher victimization at school*
Students are not the only ones who are victims of crime at school. Teachers in school can also be the targets of violence and theft. In addition to the personal toll such violence takes on teachers, those who worry about their safety may have difficulty teaching and may leave the profession altogether. Information on the number of crimes against teachers at school can help show how severe and widespread the problem is. *This indicator has been updated to include 1999 data.
! Over the 5-year period from 1995 through 1999, teachers were the victims of approximately 1,708,000 nonfatal crimes at school, including 1,073,000 thefts and 635,000 violent crimes (rape or sexual assault, robbery, aggra-vated assault, and simple assault) (table 9.1). On average, this translates into 342,000 nonfatal crimes per year, or 79 crimes per 1,000 teachers per year. Among the violent crimes against teachers during this 5-year period, there were about 69,000 serious violent crimes (11 percent of the violent crimes), including rape or sexual assault, robbery, and aggravated as-sault. On average, this translates into 14,000 serious violent crimes per year.
! During the 1995�99 period, the average annual rate of serious violent crime was similar for teachers (on average, 3 per 1,000 teachers), regard-less of their instructional level, gender, race/ethnicity, and the urbanicity of the schools where they taught (figure 9.1 and table 9.1).6
! During the 1995�99 period, senior high school and middle/junior high school teachers were more likely to be victims of violent crimes (most of which were simple assaults) than elementary school teachers (38 and 54, respectively, versus 16 crimes per 1,000 teachers) (figure 9.1 and table 9.1).
! During the 1995�99 period, senior high school and middle/junior high school teachers were more likely to experience theft at school than ele-mentary school teachers (61 and 66, respectively, versus 38 thefts per 1,000 teachers) (figure 9.1 and table 9.1).
! The average annual violent crime rate for teachers at school varied by gender (figure 9.1 and table 9.1). Over the 5-year period from 1995 through 1999, male teachers were more likely to be victims of violent crimes than female teachers (51 versus 22 crimes per 1,000 teachers).
! Teachers were differentially victimized by violent crimes at school accord-ing to where they taught (figure 9.1 and table 9.1). For example, over the 5-year period from 1995 through 1999, urban teachers were more likely to be victims of violent crimes than suburban and rural teachers (39 versus 22 and 20, respectively, per 1,000 teachers). Teachers in urban areas were more likely to experience theft at school than those in rural areas (58 and 34 respectively, per 1,000 teachers) but no more likely than suburban teachers.
6The average annual rate is the sum of all teacher victimizations across five years di-vided by the sum of all teachers over those five years.

Nonfatal Teacher Victimization 23
Figure 9.1.�Average annual number of nonfatal crimes against teachers at school per 1,000Figure 9.1.�teachers, by type of crime and selected characteristics: Aggregated from 1995 to 1999
NOTE: Serious violent crimes include rape, sexual assault, robbery, and aggravated assault. Violent crimes include serious violent crimes andsimple assault. Total crimes include violent crimes and theft. The data were aggregated from 1995 to 1999 due to the small number of teachers ineach year�s sample. Detail may not add to totals because of rounding. �At school� includes inside the school building, on school property, at worksite, or while working. For thefts, �while working� was not considered since thefts of teachers� property kept at school can occur when teachers arenot present.
SOURCE: U.S. Department of Justice, Bureau of Justice Statistics, National Crime Victimization Survey, 1995 to 1999.
5338
164
119
6654
4
99
6138
20
255075
100125150
Total Theft Violent Serious violent
Elementary Middle/junior high Senior high
Number per 1,000
Instructional level
95
43 51
5
7452
223
0255075
100125150
Total Theft Violent Serious violent
Male Female
Number per 1,000Gender
97
5839
4
7048
223
5434
202
0255075
100125150
Total Theft Violent Serious violent
Urban Suburban Rural
Number per 1,000Urbanicity

24 Nonfatal Teacher Victimization
10. Prevalence of teachers being threatened with injury or attacked by students*
Some of the offenses against teachers are committed by stu-dents. Data on physical attacks and threats against elementary and secondary teachers by students can provide a snapshot of the prevalence of this problem. *This indicator repeats information from the 2000 Indicators of School Crime and Safety report.
! In the 1993�94 school year, 12 percent of all elementary and secondary school teachers (341,000) were threatened with injury by a student from their school, and 4 percent (119,000) were physically attacked by a stu-dent (table 10.1).
! Teachers in central city schools were more likely to be victims than were teachers in urban fringe or rural schools in 1993�94 (table 10.1). About 15 percent of teachers in central city schools had been threatened with injury by students, compared with 11 and 10 percent of teachers in urban fringe and rural schools. About 6 percent of teachers in central city schools had been attacked by students, compared with 4 and 3 percent of teachers in urban fringe and rural schools.
! Public school teachers were more likely than private school teachers to be victimized by students in school in 1993�94 (figure 10.1 and table 10.1). Almost 13 percent of public school teachers had been threatened with in-jury by students, compared with 4 percent of private school teachers, and 4 percent of public school teachers had been physically attacked by stu-dents, compared with 2 percent of private school teachers. Teachers in public central city schools were about five times more likely to be targets of threats of injury and about three times more likely to be targets of at-tacks than their colleagues in private central city schools.
! In 1993�94, secondary school teachers were more likely than elementary school teachers to have been threatened with injury by a student from their school (15 percent versus 9 percent) (table 10.1). However, elemen-tary school teachers were more likely than secondary school teachers to have been physically attacked by a student (5 percent versus 3 percent). The prevalence of teacher victimization by students did not vary according to the racial/ethnic backgrounds of teachers.
Figure 10.1.�Percentage of teachers who reported that they were threatened with injury or thatFigure 10.1.�they were physically attacked by a student from school during the past 12 months,Figure 10.1.�by urbanicity and control: 1993�94 school year
SOURCE: U.S. Department of Education, National Center for Education Statistics, Schools and Staffing Survey, 1993�94 (Teacher and SchoolQuestionnaires).
13
18
1210
46
4 34 35 5
2 2 3 2
05
101520
Total Central city Urban fringe Rural Total Central city Urban fringe Rural
Percent
Public Private
Teachers physically attacked by a studentTeachers threatened with injury by a student

School Environment
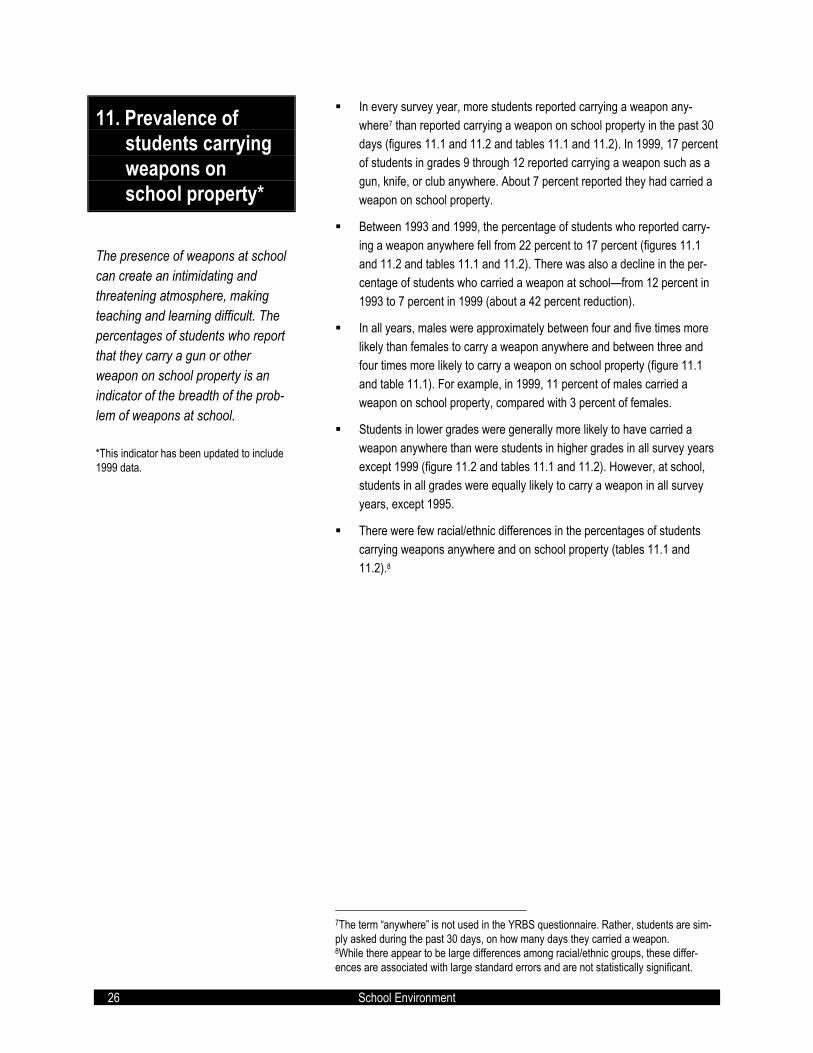
26 School Environment
11. Prevalence of students carrying weapons on school property*
The presence of weapons at school can create an intimidating and threatening atmosphere, making teaching and learning difficult. The percentages of students who report that they carry a gun or other weapon on school property is an indicator of the breadth of the prob-lem of weapons at school. *This indicator has been updated to include 1999 data.
! In every survey year, more students reported carrying a weapon any-where7 than reported carrying a weapon on school property in the past 30 days (figures 11.1 and 11.2 and tables 11.1 and 11.2). In 1999, 17 percent of students in grades 9 through 12 reported carrying a weapon such as a gun, knife, or club anywhere. About 7 percent reported they had carried a weapon on school property.
! Between 1993 and 1999, the percentage of students who reported carry-ing a weapon anywhere fell from 22 percent to 17 percent (figures 11.1 and 11.2 and tables 11.1 and 11.2). There was also a decline in the per-centage of students who carried a weapon at school�from 12 percent in 1993 to 7 percent in 1999 (about a 42 percent reduction).
! In all years, males were approximately between four and five times more likely than females to carry a weapon anywhere and between three and four times more likely to carry a weapon on school property (figure 11.1 and table 11.1). For example, in 1999, 11 percent of males carried a weapon on school property, compared with 3 percent of females.
! Students in lower grades were generally more likely to have carried a weapon anywhere than were students in higher grades in all survey years except 1999 (figure 11.2 and tables 11.1 and 11.2). However, at school, students in all grades were equally likely to carry a weapon in all survey years, except 1995.
! There were few racial/ethnic differences in the percentages of students carrying weapons anywhere and on school property (tables 11.1 and 11.2).8
7The term �anywhere� is not used in the YRBS questionnaire. Rather, students are sim-ply asked during the past 30 days, on how many days they carried a weapon. 8While there appear to be large differences among racial/ethnic groups, these differ-ences are associated with large standard errors and are not statistically significant.

School Environment 27
Figure 11.1.�Percentage of students in grades 9 through 12 who reported carrying a weapon atFigure 11.1.�least 1 day in the past 30 days, by gender: 1993, 1995, 1997, and 1999
*The response rate for this survey was less than 70 percent and a full nonresponse bias analysis has not been done to date.
NOTE: �On school property� was not defined for survey respondents. The term �anywhere� is not used in the YRBS questionnaire. Rather,students are simply asked during the past 30 days, on how many days they carried a weapon.
SOURCE: Centers for Disease Control and Prevention, National Center for Chronic Disease Prevention and Health Promotion, Youth RiskBehavior Surveillance System (YRBSS), �Youth Risk Behavior Survey� (YRBS), 1993, 1995, 1997, and 1999.
On school property
3
4
5
5
11
13
14
18
7
9
10
12
0 10 20 30 40 50
1999*
1997*
1995*
1993
Percent
TotalMaleFemale
Anywhere
6
7
8
9
29
28
31
34
17
18
20
22
0 10 20 30 40 50
1999*
1997*
1995*
1993
Percent
Figure 11.2.�Percentage of students in grades 9 through 12 who reported carrying a weapon atFigure 11.2.�least 1 day in the past 30 days, by grade: 1993, 1995, 1997, and 1999
*The response rate for this survey was less than 70 percent and a full nonresponse bias analysis has not been done to date.
NOTE: �On school property� was not defined for survey respondents. The term �anywhere� is not used in the YRBS questionnaire. Rather,students are simply asked during the past 30 days, on how many days they carried a weapon.
SOURCE: Centers for Disease Control and Prevention, National Center for Chronic Disease Prevention and Health Promotion, Youth RiskBehavior Surveillance System (YRBSS), �Youth Risk Behavior Survey� (YRBS), 1993, 1995, 1997, and 1999.
Anywhere
16
15
16
20
16
18
20
22
19
17
21
21
18
23
23
26
17
18
20
22
0 10 20 30 40 50
1999*
1997*
1995*
1993
Percent
On school property
6
7
8
11
7
9
10
12
7
8
10
12
7
10
11
13
7
9
10
12
0 10 20 30 40 50
1999*
1997*
1995*
1993
Percent
Total9th grade10th grade11th grade12th grade

28 School Environment
12. Students� perceptions of personal safety at school and when traveling to and from school*
One consequence of school vio-lence is the fear that it can instill in students. Students who fear for their own safety may not be able or ready to learn. Concerns about vulnerability to attacks by others at school and on the way to and from school may also have a detrimental effect on the school environment and learning. *This indicator repeats information from the 2000 Indicators of School Crime and Safety report. Comparisons between the 1989 data and the 1995 and 1999 data should be made with caution due to changes in the questionnaire. See appendix B for details.
! Between 1995 and 1999, there were decreases in the percentages of students feeling unsafe while they were at school and while they were go-ing to and from school (figures 12.1 and 12.2 and table 12.1). In 1995, 9 percent of students ages 12 through 18 sometimes or most of the time feared they were going to be attacked or harmed at school, while in 1999 this percentage fell to 5 percent. Between these years, the percentage of students fearing they would be attacked while traveling to and from school fell from 7 percent to 4 percent.
! Between 1995 and 1999, there was a decline in fear of attacks at school and when traveling to and from school among all racial/ethnic groups. However, in both years, larger percentages of black and Hispanic students than white students feared such attacks (figures 12.1 and 12.2 and table 12.1).
! In both 1995 and 1999, students in lower grades were more likely to fear for their safety at school than were students in higher grades (table 12.1). For example, in 1999, 9 percent of students in grade 6 feared for their safety while at school, compared with 3 percent of students in grade 12.
! Between 1995 and 1999 there was a decline in fear of attacks at school and to and from school within almost all grades. However, in both 1995 and 1999, students in lower grades were also more likely than students in higher grades to fear being attacked on the way to and from school (table 12.1).
! Between 1995 and 1999 there was a decline in fear of attacks at school and to and from school for students in all areas�urban, suburban and ru-ral. However, in 1999, as in 1995, students in urban schools were more likely than students in suburban or rural schools to fear being attacked at school and when travelling to and from school (table 12.1).

School Environment 29
Figure 12.1.�Percentage of students ages 12 through 18 who reported fearing being attackedFigure 12.1.�or harmed at school during the previous 6 months, by race/ethnicity: 1989, 1995,Figure 12.1.�and 1999
NOTE: Comparisons between the 1989 data and the 1995 and 1999 data should be made with caution due to changes in the questionnaire. Also,the 1989 data include students ages 12 through 19. See appendix B for details. Includes students who reported that they sometimes or most of thetime feared being victimized in this way. �At school� means in the school building, on the school grounds, or on a school bus.
SOURCE: U.S. Department of Justice, Bureau of Justice Statistics, School Crime Supplement to the National Crime Victimization Survey, January�June, 1989, 1995, and 1999.
64
7
1189
6
1316
9
5 4
9 8
4
0
5
10
15
20
Total White,non-Hispanic
Black,non-Hispanic
Hispanic Other,non-Hispanic
Percent
1989 1995 1999
Figure 12.2.�Percentage of students ages 12 through 18 who reported fearing being attackedFigure 12.2.�or harmed on the way to and from school during the previous 6 months, by race/Figure 12.2.�ethnicity: 1989, 1995, and 1999
NOTE: Comparisons between the 1989 data and the 1995 and 1999 data should be made with caution due to changes in the questionnaire. Also,the 1989 data include students ages 12 through 19. See appendix B for details. Includes students who reported that they sometimes or most of thetime feared being victimized in this way. �At school� means in the school building, on the school grounds, or on a school bus.
SOURCE: U.S. Department of Justice, Bureau of Justice Statistics, School Crime Supplement to the National Crime Victimization Survey, January�June, 1989, 1995, and 1999.
4 3
810
674
13 13
8
4 2
8 8
4
0
5
10
15
20
Total White,non-Hispanic
Black,non-Hispanic
Hispanic Other,non-Hispanic
Percent
1989 1995 1999

30 School Environment
13. Students� reports of avoiding places in school*
One consequence of crime in school is that students begin to perceive specific areas in school as unsafe. In trying to ensure their own safety, they begin to avoid these areas. Changes in the per-centage of students avoiding areas in school may be a good barometer of how safe schools areat least in the minds of those who attend these schools.
*This indicator repeats information from the 2000 Indicators of School Crime and Safety report. Comparisons between the 1989 data and the 1995 and 1999 data should be made with caution due to changes in the questionnaire. See appendix B for details.
! Between 1995 and 1999, there was a decrease in the percentage of stu-dents ages 12 through 18 who avoided one or more places in school�from 9 percent in 1995 to 5 percent in 1999 (figure 13.1 and table 13.1). Despite this decline, this percentage still represented 1.1 million students in 1999 who reported avoiding some areas in school out of fear for their own safety.
! The percentage of students of all racial/ethnic groups avoiding specific areas in school fell between 1995 and 1999 (figure 13.1 and table 13.1). In both 1995 and 1999, black and Hispanic students were more likely to avoid areas in school than were white students.
! Between 1995 and 1999, there was a decrease in the percentage of stu-dents reporting avoiding areas in school among students of almost all grade levels (table 13.1). However, in both years, students in lower grades were more likely than students in higher grades to report avoiding areas in school.
! While in 1995, students in urban areas were more likely than suburban students to avoid areas in school (12 percent versus 8 percent, respec-tively), by 1999 urban and suburban students were equally as likely to avoid areas in school (figure 13.2 and table 13.1).
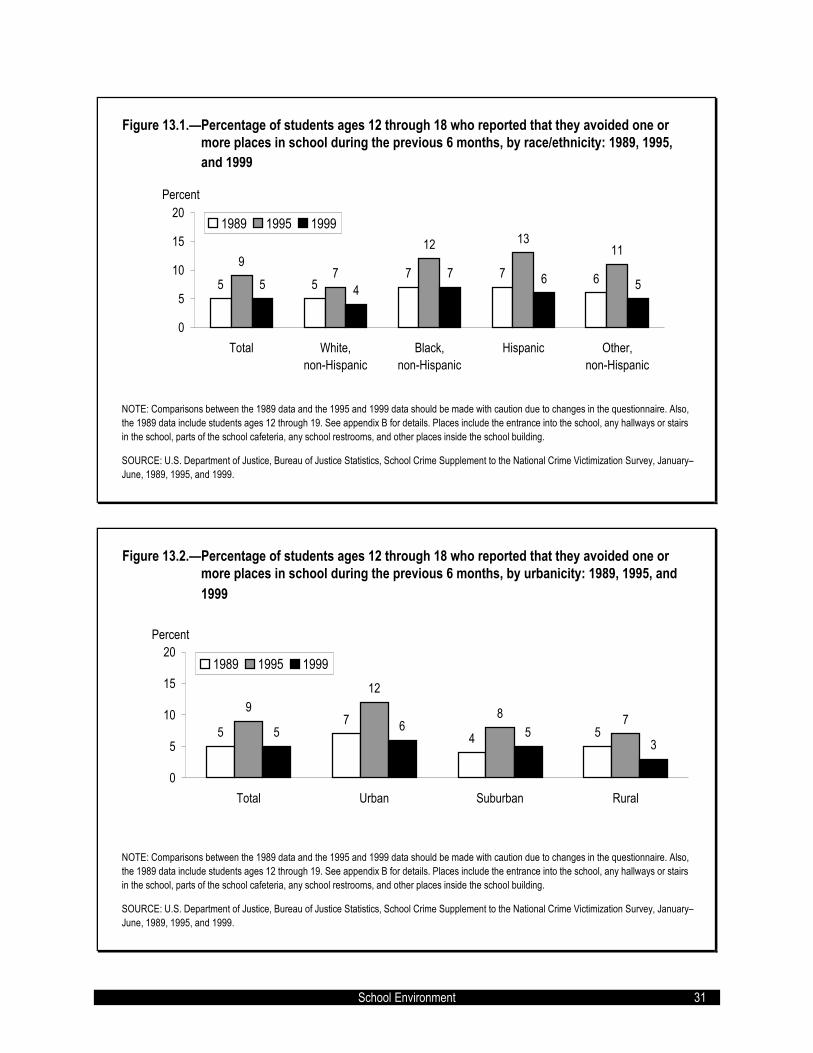
School Environment 31
Figure 13.1.�Percentage of students ages 12 through 18 who reported that they avoided one orFigure 13.1.�more places in school during the previous 6 months, by race/ethnicity: 1989, 1995,Figure 13.1.�and 1999
NOTE: Comparisons between the 1989 data and the 1995 and 1999 data should be made with caution due to changes in the questionnaire. Also,the 1989 data include students ages 12 through 19. See appendix B for details. Places include the entrance into the school, any hallways or stairsin the school, parts of the school cafeteria, any school restrooms, and other places inside the school building.
SOURCE: U.S. Department of Justice, Bureau of Justice Statistics, School Crime Supplement to the National Crime Victimization Survey, January�June, 1989, 1995, and 1999.
5 57 7 6
97
12 1311
5 47 6 5
0
5
10
15
20
Total White,non-Hispanic
Black,non-Hispanic
Hispanic Other,non-Hispanic
Percent
1989 1995 1999
Figure 13.2.�Percentage of students ages 12 through 18 who reported that they avoided one orFigure 14.2.�more places in school during the previous 6 months, by urbanicity: 1989, 1995, andFigure 14.2.�1999
NOTE: Comparisons between the 1989 data and the 1995 and 1999 data should be made with caution due to changes in the questionnaire. Also,the 1989 data include students ages 12 through 19. See appendix B for details. Places include the entrance into the school, any hallways or stairsin the school, parts of the school cafeteria, any school restrooms, and other places inside the school building.
SOURCE: U.S. Department of Justice, Bureau of Justice Statistics, School Crime Supplement to the National Crime Victimization Survey, January�June, 1989, 1995, and 1999.
57
4 5
912
8 75 6 5
3
0
5
10
15
20
Total Urban Suburban Rural
Percent
1989 1995 1999

32 School Environment
14. Students� reports of being called hate-related words and seeing hate-related graffiti*
A student�s exposure to hate-related words or symbols at school can increase his or her feeling of vulnerability. An environment in which students are confronted with discriminatory behavior is not conducive to learning and creates a climate of hostility. *This indicator repeats information from the 2000 Indicators of School Crime and Safety report.
! In 1999, about 13 percent of students ages 12 through 18 reported that someone at school had used hate-related words against them (figure 14.1 and table 14.1). That is, in the prior 6 months someone at school called them a derogatory word having to do with race/ethnicity, religion, disability, gender, or sexual orientation. In addition, about 36 percent of students saw hate-related graffiti at school.
! There was very little variation in these percentages based on the location of the students� households (table 14.1). Students in urban, suburban, and rural households were equally as likely to report being called hate-related words and to see hate-related graffiti.
! Females were more likely than males to report being targets of derogatory words and were also more likely to report seeing hate-related graffiti at their school (figure 14.1 and table 14.1). About 14 percent of females reported being called hate words in 1999, compared with 12 percent of males. About 39 percent of females had seen hate-related graffiti, compared with 34 percent of males.
! Black students were more likely than white or Hispanic students to report being called hate words (table 14.1). About 17 percent of black students ages 12 through 18 reported being targets of derogatory words, compared with 13 percent of white students and 12 percent of Hispanic students.9 Students of all racial/ethnic groups were equally likely to report hate-related graffiti at school.
9The percentage of other, non-Hispanic students who were victimized by hate-related words was similar to that for white, non-Hispanic, black, non-Hispanic, and Hispanic students.
Figure 14.1.�Percentage of students ages 12 through 18 who reported being targets of hate-relatedFigure 15.1.�words or who saw hate-related graffiti at school during the previous 6 months,Figure 15.1.�by gender and race/ethnicity: 1999
NOTE: �At school� means in the school building, on the school grounds, or on a school bus.
SOURCE: U.S. Department of Justice, Bureau of Justice Statistics, School Crime Supplement to the National Crime Victimization Survey, January�June, 1999.
Hate-related words
1612
1713
1412
13
0 10 20 30 40 50
Other, non-Hispanic
Hispanic
Black, non-Hispanic
White, non-Hispanic
Female
Male
Total
Percent
Hate-related graffiti
3236
3836
3934
36
0 10 20 30 40 50
Other, non-Hispanic
Hispanic
Black, non-Hispanic
White, non-Hispanic
Female
Male
Total
Percent

School Environment 33
15. Students� reports of gangs at school*
Street gangs are organized groups that are often involved in drugs, weapons trafficking, and violence. The presence of street gangs in school can be very disruptive to the school environment. Street gangs may not only create fear among students but also increase the level of violence in school. The percentage of students who report the presence of street gangs in their schools indicates the existence and severity of the gang problem in schools. *This indicator repeats information from the 2000 Indicators of School Crime and Safety report. Comparisons between the 1989 data and the 1995 and 1999 data should be made with caution due to changes in the questionnaire. See appendix B for details.
! Between 1995 and 1999, the percentage of students who reported that street gangs were present at their schools decreased (figure 15.1 and table 15.1). In 1995, 29 percent of students reported street gangs being present in their schools. By 1999, this percentage had fallen to 17 percent.
! Gangs were more likely to be reported in public schools than in private schools (figure 15.1 and table 15.1). In 1999, 19 percent of students in public schools reported that street gangs were present in their schools, compared with 4 percent in private schools. A similar pattern of results was reported in 1995. However, between these two years, the percentage of public school students reporting that gangs were present in their schools decreased by about 40 percent (from 31 percent in 1995 to 19 percent in 1999) as did the percentage of private school students reporting gang presence (from 7 percent to 4 percent).
! In 1999, urban students were more likely to report that there were street gangs at their schools (25 percent) than were suburban and rural students (16 percent and 11 percent, respectively) (figure 15.2 and table 15.1). Between 1995 and 1999, reports of gang presence decreased regardless of students� place of residence.
! In both years, Hispanic and black students were more likely than white students to report the existence of street gangs in their schools. In 1995, Hispanic students were more likely than black students to do so (figure 15.3 and table 15.1), while in 1999 they were equally as likely. Between 1995 and 1999, reports of gang presence decreased for whites, blacks, Hispanics, and students of other race/ethnicities.
Figure 15.1.�Percentage of students ages 12 through 18 who reported that street gangs were presentFigure 14.1.�at school during the previous 6 months, by control of school: 1989, 1995, and 1999
NOTE: Comparisons between the 1989 data and the 1995 and 1999 data should be made with caution due to changes in the questionnaire.Also, the 1989 data include students ages 12 through 19. See appendix B for details. This indicator is based on an item from earlier in the SCSquestionnaire, before �at school� was defined for the respondent.
SOURCE: U.S. Department of Justice, Bureau of Justice Statistics, School Crime Supplement to the National Crime Victimization Survey, January�June, 1989, 1995, and 1999.
15 16
4
29 31
7
17 19
4
0
10
20
30
40
50
Total Public Private
Percent
1989 1995 1999

34 School Environment
Figure 15.2.�Percentage of students ages 12 through 18 who reported that street gangs wereFigure 14.2.�present at school during the previous 6 months, by urbanicity: 1989, 1995, andFigure 14.2.�1999
NOTE: Comparisons between the 1989 data and the 1995 and 1999 data should be made with caution due to changes in the questionnaire.Also, the 1989 data include students ages 12 through 19. See appendix B for details. This indicator is based on an item from earlier in the SCSquestionnaire, before �at school� was defined for the respondent.
SOURCE: U.S. Department of Justice, Bureau of Justice Statistics, School Crime Supplement to the National Crime Victimization Survey, January�June, 1989, 1995, and 1999.
25
148
41
2620
2516
11
0
10
20
30
40
50
Urban Suburban Rural
Percent
1989 1995 1999
Figure 15.3.�Percentage of students ages 12 through 18 who reported that street gangs wereFigure 14.2.�present at school during the previous 6 months, by race/ethnicity: 1989, 1995, andFigure 14.2.�1999
NOTE: Comparisons between the 1989 data and the 1995 and 1999 data should be made with caution due to changes in the questionnaire.Also, the 1989 data include students ages 12 through 19. See appendix B for details. This indicator is based on an item from earlier in the SCSquestionnaire, before �at school� was defined for the respondent.
SOURCE: U.S. Department of Justice, Bureau of Justice Statistics, School Crime Supplement to the National Crime Victimization Survey, January�June, 1989, 1995, and 1999.
1220
322523
35
50
32
13
25 2818
01020304050
White, non-Hispanic Black, non-Hispanic Hispanic Other, non-Hispanic
Percent
1989 1995 1999

School Environment 35
16. Public school prin-cipals� reports of discipline prob-lems at school*
Discipline problems in a school may contribute to an overall climate in which violence may occur. Schools that suffer from student drug or alcohol use, racial tensions, or verbal and physical abuse of teachers may be filled with pressures that result in school violence. *This indicator repeats information from the 2000 Indicators of School Crime and Safety report.
! During the 1996�97 school year, 16 percent of all public school principals reported that one or more discipline issues had been a serious problem in their school10 (figure 16.1 and table 16.1). About the same percentage of principals in city, urban fringe, town, and rural settings reported one or more serious discipline problems.
! Public elementary schools were the least likely to report any serious discipline issues, followed by middle schools and then high schools (figure 16.1 and table 16.1). About 8 percent of elementary school principals reported one or more of these issues as a serious problem, while 18 percent of principals in middle schools and 37 percent of those in high schools did so.
! While overall there were no significant differences in reported serious problems by urbanicity, a greater percentage of principals in public city high schools than in rural high schools reported having serious discipline problems47 percent compared with 28 percent (figure 16.1 and table 16.1).
10These issues were student tardiness, student absenteeism/class cutting, physical conflicts among students, robbery or theft of items worth over $10, vandalism of school property, student alcohol use, student drug use, sale of drugs on school grounds, student tobacco use, student possession of weapons, trespassing, verbal abuse of teachers, physical abuse of teachers, teacher absenteeism, teacher alcohol or drug use, racial tensions, and gangs.
Figure 16.1.�Percentage of public schools that reported that 1 or more of 17 discipline issues* wasFigure 15.1.�a serious problem in their school, by instructional level and urbanicity: 1996�97
*Student tardiness, student absenteeism/class cutting, physical conflicts among students, robbery or theft of items worth over $10, vandalism ofschool property, student alcohol use, student drug use, sale of drugs on school grounds, student tobacco use, student possession of weapons,trespassing, verbal abuse of teachers, physical abuse of teachers, teacher absenteeism, teacher alcohol or drug use, racial tensions, and gangs.
NOTE: �At school� was not defined for the survey respondent.
SOURCE: U.S. Department of Education, National Center for Education Statistics, Fast Response Survey System, �Principal/School DisciplinarianSurvey on School Violence,� FRSS 63, 1997.
8
18
37
1912
24
47
147
15
46
16
6
19
38
169
17
28
16
01020304050
Total Elementary school Middle school High school
Total City Urban fringe Town Rural
Percent

36 School Environment
17. Prevalence of students using alcohol*
The consumption of alcohol by students on school property, a crime in itself, may also lead to other crimes and misbehavior. It can lead to a school environment that is harmful to students, teachers, and staff. *This indicator has been updated to include 1999 data.
! In 1999, 50 percent of students in grades 9 through 12 had at least one drink of alcohol anywhere11 in the 30 days before being surveyed (figure 17.1 and table 17.1). A much smaller percentage (5 percent) had at least one drink on school property during the same period.
! Approximately the same percentage of students had consumed alcohol in 1999 as in 1993, 1995, and 1997�both anywhere and on school property.
! In every survey year except for 1995, males were more likely than females to have used alcohol anywhere (figure 17.1 and table 17.1). Furthermore, in every survey year, males were more likely than females to use alcohol on school property. For example, in 1999, 6 percent of males had used alcohol on school property compared with 4 percent of females.
! In every survey year, students in higher grades were more likely to report drinking alcohol anywhere than were students in lower grades (figure 17.2 and table 17.1). However, in every survey year, students in all grades were equally likely to report drinking alcohol on school property.
! Asian students were less likely to use alcohol anywhere than students of any other racial/ethnic background in 1999 (26 percent for Asian students compared to 40 to 61 percent for all other students) (table 17.1). They also were less likely to report using alcohol on school property than black or African American, white, and Hispanic or Latino students (2 percent compared to 4, 5, and 7 percent, respectively).
11The term �anywhere� is not used in the YRBS questionnaire. Rather, students are simply asked during the past 30 days, on how many days did they have at least one drink of alcohol.
Figure 17.1.�Percentage of students in grades 9 through 12 who reported using alcoholFigure 16.1.�in the last 30 days, by gender: 1993, 1995, 1997, and 1999
*The response rate for this survey was less than 70 percent and a full nonresponse bias analysis has not been done to date.NOTE: �On school property� was not defined for survey respondents. The term �anywhere� is not used in the YRBS questionnaire. Rather,students are simply asked during the past 30 days, on how many days did they have at least one drink of alcohol.SOURCE: Centers for Disease Control and Prevention, National Center for Chronic Disease Prevention and Health Promotion, Youth RiskBehavior Surveillance System (YRBSS), �Youth Risk Behavior Survey� (YRBS), 1993, 1995, 1997, and 1999.
Anywhere
48
48
50
46
52
53
53
50
50
51
52
48
0 20 40 60 80 100
1999*
1997*
1995*
1993
Percent
On school property
4
4
5
4
6
7
7
6
5
6
6
5
0 20 40 60 80 100
1999*
1997*
1995*
1993
Percent
TotalMaleFemale

School Environment 37
Figure 17.2.�Percentage of students in grades 9 through 12 who reported using alcoholFigure 16.2.�in the last 30 days, by grade: 1993, 1995, 1997, and 1999
*The response rate for this survey was less than 70 percent and a full nonresponse bias analysis has not been done to date.
NOTE: �On school property� was not defined for survey respondents. The term �anywhere� is not used in the YRBS questionnaire. Rather,students are simply asked during the past 30 days, on how many days did they have at least one drink of alcohol.
SOURCE: Centers for Disease Control and Prevention, National Center for Chronic Disease Prevention and Health Promotion, Youth RiskBehavior Surveillance System (YRBSS), �Youth Risk Behavior Survey� (YRBS), 1993, 1995, 1997, and 1999.
Anywhere
62
57
57
56
51
53
54
50
50
47
50
44
41
44
46
41
50
51
52
48
0 20 40 60 80 100
1999*
1997*
1995*
1993
Percent
On school property
5
6
6
6
5
6
6
5
5
5
6
4
6
8
5
5
6
6
5
5
0 20 40 60 80 100
1999*
1997*
1995*
1993
Percent
Total9th grade10th grade11th grade12th grade
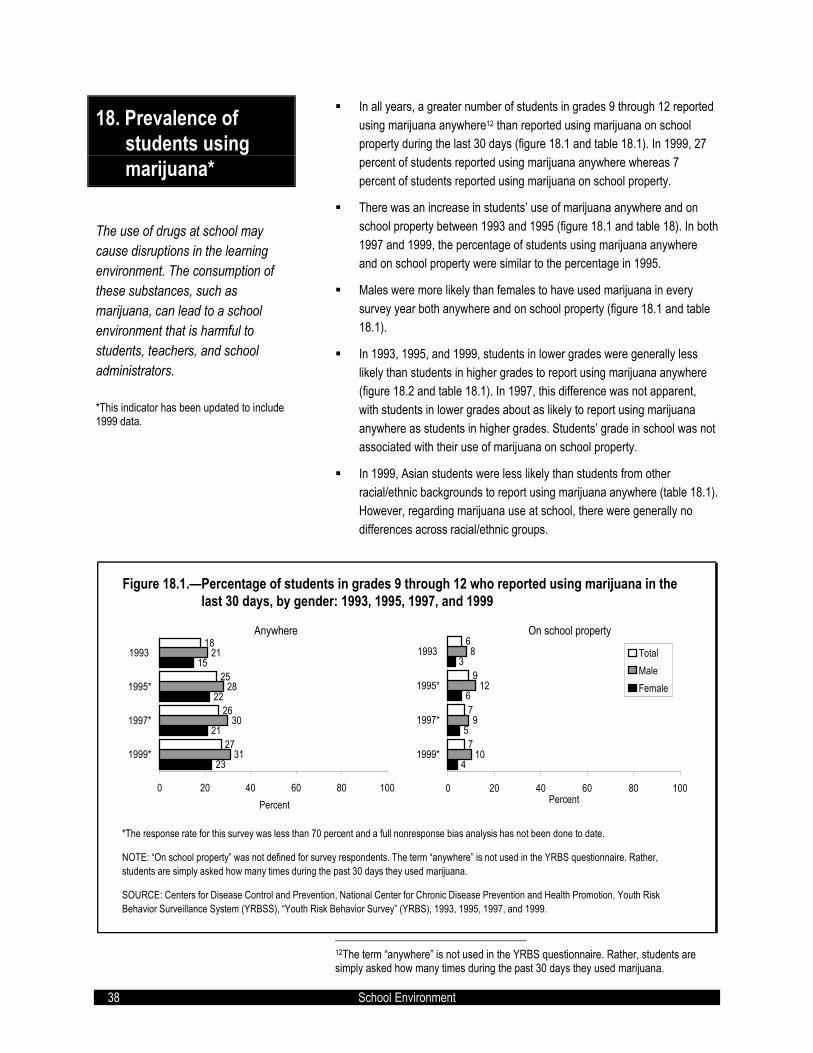
38 School Environment
18. Prevalence of students using marijuana*
The use of drugs at school may cause disruptions in the learning environment. The consumption of these substances, such as marijuana, can lead to a school environment that is harmful to students, teachers, and school administrators. *This indicator has been updated to include 1999 data.
! In all years, a greater number of students in grades 9 through 12 reported using marijuana anywhere12 than reported using marijuana on school property during the last 30 days (figure 18.1 and table 18.1). In 1999, 27 percent of students reported using marijuana anywhere whereas 7 percent of students reported using marijuana on school property.
! There was an increase in students� use of marijuana anywhere and on school property between 1993 and 1995 (figure 18.1 and table 18). In both 1997 and 1999, the percentage of students using marijuana anywhere and on school property were similar to the percentage in 1995.
! Males were more likely than females to have used marijuana in every survey year both anywhere and on school property (figure 18.1 and table 18.1).
! In 1993, 1995, and 1999, students in lower grades were generally less likely than students in higher grades to report using marijuana anywhere (figure 18.2 and table 18.1). In 1997, this difference was not apparent, with students in lower grades about as likely to report using marijuana anywhere as students in higher grades. Students� grade in school was not associated with their use of marijuana on school property.
! In 1999, Asian students were less likely than students from other racial/ethnic backgrounds to report using marijuana anywhere (table 18.1). However, regarding marijuana use at school, there were generally no differences across racial/ethnic groups.
12The term �anywhere� is not used in the YRBS questionnaire. Rather, students are simply asked how many times during the past 30 days they used marijuana.
Figure 18.1.�Percentage of students in grades 9 through 12 who reported using marijuana in theFigure 17.1.�last 30 days, by gender: 1993, 1995, 1997, and 1999
*The response rate for this survey was less than 70 percent and a full nonresponse bias analysis has not been done to date.
NOTE: �On school property� was not defined for survey respondents. The term �anywhere� is not used in the YRBS questionnaire. Rather,students are simply asked how many times during the past 30 days they used marijuana.
SOURCE: Centers for Disease Control and Prevention, National Center for Chronic Disease Prevention and Health Promotion, Youth RiskBehavior Surveillance System (YRBSS), �Youth Risk Behavior Survey� (YRBS), 1993, 1995, 1997, and 1999.
Anywhere
23
21
22
15
31
30
28
21
27
26
25
18
0 20 40 60 80 100
1999*
1997*
1995*
1993
Percent
On school property
4
5
6
3
10
9
12
8
7
7
9
6
0 20 40 60 80 100
1999*
1997*
1995*
1993
Percent
TotalMaleFemale

School Environment 39
Figure 18.2.�Percentage of students in grades 9 through 12 who reported using marijuana in theFigure 16.1.�last 30 days, by grade: 1993, 1995, 1997, and 1999
*The response rate for this survey was less than 70 percent and a full nonresponse bias analysis has not been done to date.
NOTE: �On school property� was not defined for survey respondents. The term �anywhere� is not used in the YRBS questionnaire. Rather,students are simply asked how many times during the past 30 days they used marijuana.
SOURCE: Centers for Disease Control and Prevention, National Center for Chronic Disease Prevention and Health Promotion, Youth RiskBehavior Surveillance System (YRBSS), �Youth Risk Behavior Survey� (YRBS), 1993, 1995, 1997, and 1999.
Anywhere
32
27
26
22
27
29
28
18
28
25
26
17
22
24
21
13
27
26
25
18
0 20 40 60 80 100
1999*
1997*
1995*
1993
Percent
On school property
7
6
8
5
7
8
9
7
8
6
10
7
7
8
9
4
7
7
9
6
0 20 40 60 80 100
1999*
1997*
1995*
1993
Percent
Total9th grade10th grade11th grade12th grade
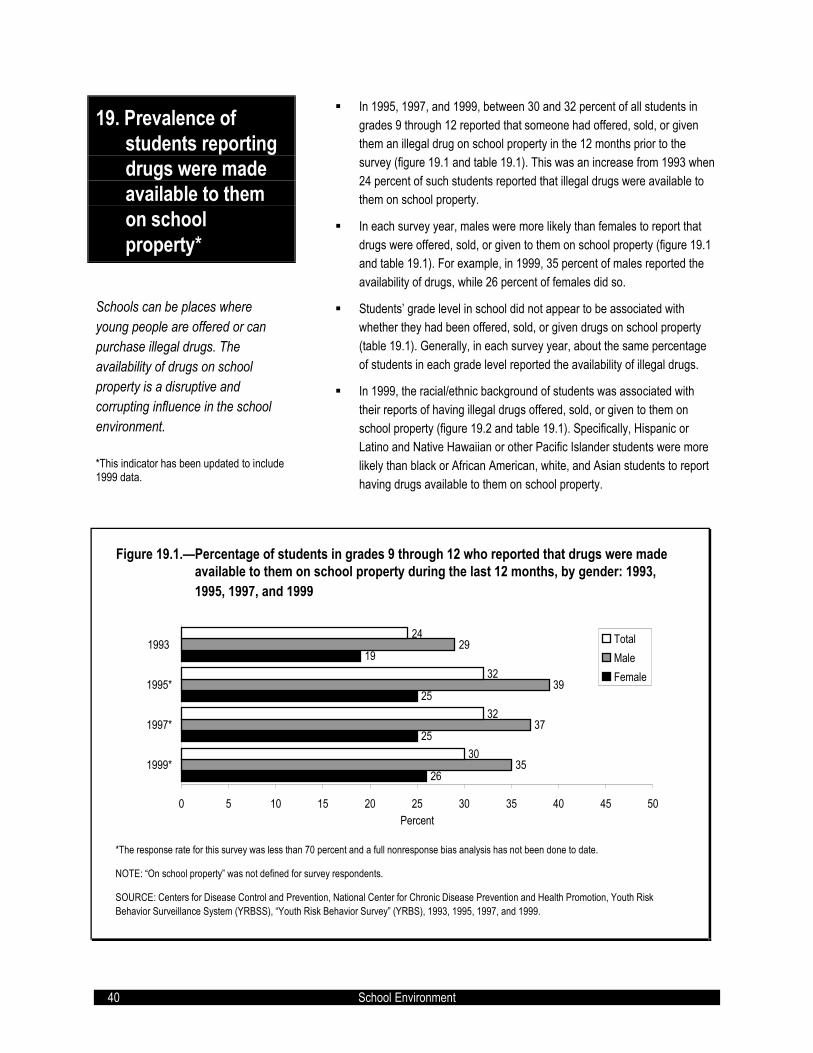
40 School Environment
19. Prevalence of students reporting drugs were made available to them on school property*
Schools can be places where young people are offered or can purchase illegal drugs. The availability of drugs on school property is a disruptive and corrupting influence in the school environment. *This indicator has been updated to include 1999 data.
! In 1995, 1997, and 1999, between 30 and 32 percent of all students in grades 9 through 12 reported that someone had offered, sold, or given them an illegal drug on school property in the 12 months prior to the survey (figure 19.1 and table 19.1). This was an increase from 1993 when 24 percent of such students reported that illegal drugs were available to them on school property.
! In each survey year, males were more likely than females to report that drugs were offered, sold, or given to them on school property (figure 19.1 and table 19.1). For example, in 1999, 35 percent of males reported the availability of drugs, while 26 percent of females did so.
! Students� grade level in school did not appear to be associated with whether they had been offered, sold, or given drugs on school property (table 19.1). Generally, in each survey year, about the same percentage of students in each grade level reported the availability of illegal drugs.
! In 1999, the racial/ethnic background of students was associated with their reports of having illegal drugs offered, sold, or given to them on school property (figure 19.2 and table 19.1). Specifically, Hispanic or Latino and Native Hawaiian or other Pacific Islander students were more likely than black or African American, white, and Asian students to report having drugs available to them on school property.
Figure 19.1.�Percentage of students in grades 9 through 12 who reported that drugs were madeFigure 18.1.�available to them on school property during the last 12 months, by gender: 1993,Figure 18.1.�1995, 1997, and 1999
*The response rate for this survey was less than 70 percent and a full nonresponse bias analysis has not been done to date.
NOTE: �On school property� was not defined for survey respondents.
SOURCE: Centers for Disease Control and Prevention, National Center for Chronic Disease Prevention and Health Promotion, Youth RiskBehavior Surveillance System (YRBSS), �Youth Risk Behavior Survey� (YRBS), 1993, 1995, 1997, and 1999.
26
25
25
19
35
37
39
29
30
32
32
24
0 5 10 15 20 25 30 35 40 45 50
1999*
1997*
1995*
1993
Percent
TotalMaleFemale

School Environment 41
Figure 19.2.�Percentage of students in grades 9 through 12 who reported that drugs were madeFigure 18.2.�available to them on school property during the last 12 months, by race/ethnicity:1
Figure 18.2.�19992
1Hispanics and Latinos are not included in these race/ethnicity categories unless specified.2The response rate for this survey was less than 70 percent and a full nonresponse bias analysis has not been done to date.
NOTE: �On school property� was not defined for survey respondents.
SOURCE: Centers for Disease Control and Prevention, National Center for Chronic Disease Prevention and Health Promotion, Youth RiskBehavior Surveillance System (YRBSS), �Youth Risk Behavior Survey� (YRBS), 1993, 1995, 1997, and 1999.
37
36
29
47
25
26
31
0 5 10 15 20 25 30 35 40 45 50
Hispanic or Latino
Multiple - non-Hispanic
White
Native Hawaiian/other Pacific Islander
Black or African American
Asian
American Indian/Alaskan Native
Percent


Supplemental Tables 43
SUPPLEMENTAL TABLES

Table 2.1.�Number of nonfatal crimes against students ages 12 through 18 occurring at school or on the way to or from school, by type of crime Table 2.1.�and selected student characteristics: 1992 to 1999
Serious Serious SeriousStudent characteristics Total Theft Violent violent1 Total Theft Violent violent1 Total Theft Violent violent1
Total 3,409,200 2,260,500 1,148,600 245,400 3,795,200 2,357,000 1,438,200 306,700 3,795,500 2,371,500 1,424,000 322,400
Gender Male 2,058,400 1,278,000 780,400 183,200 2,168,000 1,275,100 892,900 180,200 2,109,600 1,265,600 844,000 200,600 Female 1,350,700 982,500 368,200 62,200 1,627,200 1,081,900 545,300 126,500 1,685,800 1,105,800 580,000 121,700
Age 12�14 1,858,900 1,134,200 724,700 172,000 2,123,200 1,241,100 882,100 182,400 2,140,000 1,246,500 893,400 201,800 15�18 1,550,300 1,126,400 423,900 73,300 1,672,100 1,115,900 556,100 124,300 1,655,500 1,124,900 530,600 120,600
Race/ethnicity White, non-Hispanic 2,526,700 1,694,300 832,400 148,000 2,832,800 1,775,700 1,057,100 188,400 2,670,800 1,726,600 944,300 179,700 Black, non-Hispanic 443,300 262,300 181,000 71,500 507,800 300,600 207,200 88,100 552,800 320,100 232,700 60,000 Hispanic 299,200 191,300 107,900 25,900 335,500 193,800 141,600 25,100 431,700 234,000 197,700 70,200 Other, non-Hispanic 111,600 95,300 16,300 � 90,700 64,200 26,500 5,100 105,600 68,300 37,200 12,500
Urbanicity Urban 883,000 572,300 310,700 95,600 967,200 557,100 410,200 100,700 978,200 534,800 443,400 140,300 Suburban 1,809,200 1,226,700 582,500 115,000 2,023,000 1,319,500 703,500 135,300 2,036,300 1,293,400 742,900 153,600 Rural 717,000 461,500 255,500 34,700 804,900 480,500 324,500 70,700 780,900 543,300 237,700 28,500
Household income Less than $7,500 249,300 132,800 116,400 27,400 253,600 105,900 147,700 27,900 185,000 90,600 94,400 40,400 $7,500�14,999 335,800 196,700 139,200 38,300 340,100 205,000 135,100 36,400 322,100 202,300 119,800 15,900 $15,000�24,999 415,200 199,700 215,600 53,100 489,000 266,500 222,500 36,000 494,900 312,400 182,500 44,100 $25,000�34,999 489,800 334,700 155,100 16,900 684,300 471,100 213,200 36,600 572,200 313,500 258,700 55,100 $35,000�49,999 765,000 564,000 201,000 38,600 670,900 418,500 252,400 58,200 741,500 473,500 268,000 50,500 $50,000�74,999 511,100 406,500 104,600 12,000 639,300 430,800 208,500 43,200 668,000 421,300 246,700 53,300 $75,000 or more 382,300 252,000 130,300 31,000 406,700 300,700 106,000 19,700 438,900 314,500 124,400 19,800
NOTE: See footnotes at end of table.
1992 1993 1994
Supplemental Tables 45
2
2222
2
22 2
2
22
2
2
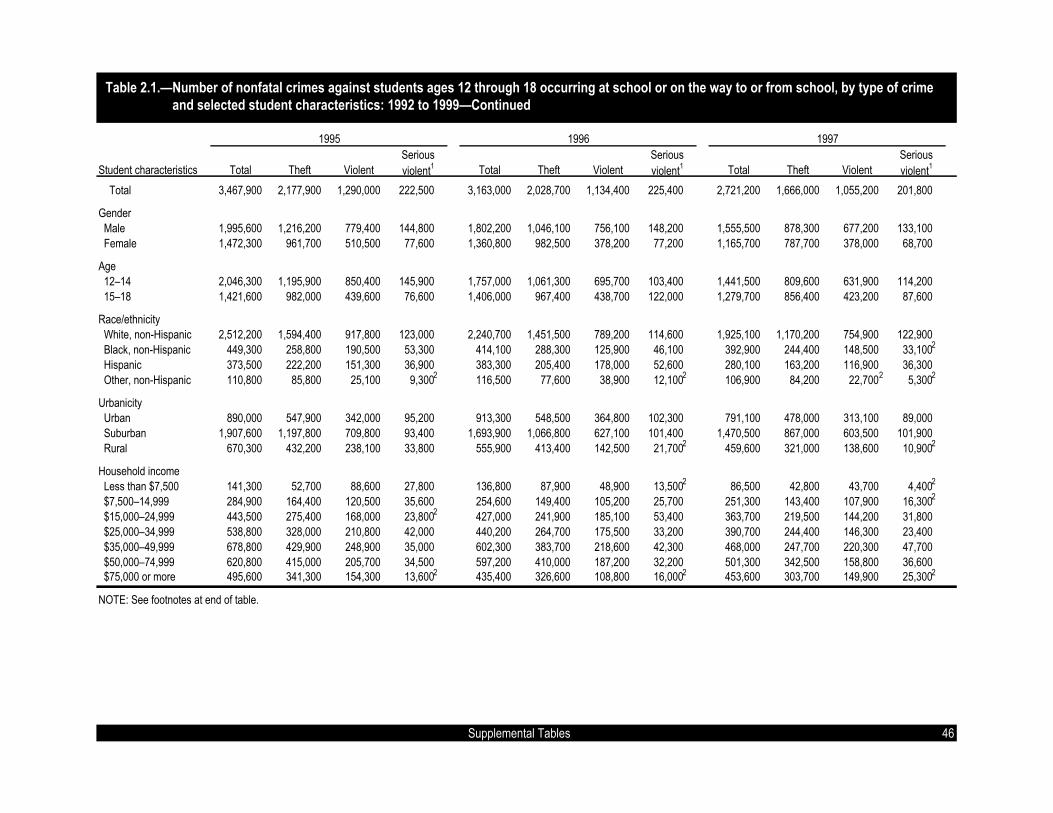
Table 2.1.�Number of nonfatal crimes against students ages 12 through 18 occurring at school or on the way to or from school, by type of crime Table 2.1.�and selected student characteristics: 1992 to 1999�Continued
Serious Serious SeriousStudent characteristics Total Theft Violent violent1 Total Theft Violent violent1 Total Theft Violent violent1
Total 3,467,900 2,177,900 1,290,000 222,500 3,163,000 2,028,700 1,134,400 225,400 2,721,200 1,666,000 1,055,200 201,800
Gender Male 1,995,600 1,216,200 779,400 144,800 1,802,200 1,046,100 756,100 148,200 1,555,500 878,300 677,200 133,100 Female 1,472,300 961,700 510,500 77,600 1,360,800 982,500 378,200 77,200 1,165,700 787,700 378,000 68,700
Age 12�14 2,046,300 1,195,900 850,400 145,900 1,757,000 1,061,300 695,700 103,400 1,441,500 809,600 631,900 114,200 15�18 1,421,600 982,000 439,600 76,600 1,406,000 967,400 438,700 122,000 1,279,700 856,400 423,200 87,600
Race/ethnicity White, non-Hispanic 2,512,200 1,594,400 917,800 123,000 2,240,700 1,451,500 789,200 114,600 1,925,100 1,170,200 754,900 122,900 Black, non-Hispanic 449,300 258,800 190,500 53,300 414,100 288,300 125,900 46,100 392,900 244,400 148,500 33,100 Hispanic 373,500 222,200 151,300 36,900 383,300 205,400 178,000 52,600 280,100 163,200 116,900 36,300 Other, non-Hispanic 110,800 85,800 25,100 9,300 116,500 77,600 38,900 12,100 106,900 84,200 22,700 5,300
Urbanicity Urban 890,000 547,900 342,000 95,200 913,300 548,500 364,800 102,300 791,100 478,000 313,100 89,000 Suburban 1,907,600 1,197,800 709,800 93,400 1,693,900 1,066,800 627,100 101,400 1,470,500 867,000 603,500 101,900 Rural 670,300 432,200 238,100 33,800 555,900 413,400 142,500 21,700 459,600 321,000 138,600 10,900
Household income Less than $7,500 141,300 52,700 88,600 27,800 136,800 87,900 48,900 13,500 86,500 42,800 43,700 4,400 $7,500�14,999 284,900 164,400 120,500 35,600 254,600 149,400 105,200 25,700 251,300 143,400 107,900 16,300 $15,000�24,999 443,500 275,400 168,000 23,800 427,000 241,900 185,100 53,400 363,700 219,500 144,200 31,800 $25,000�34,999 538,800 328,000 210,800 42,000 440,200 264,700 175,500 33,200 390,700 244,400 146,300 23,400 $35,000�49,999 678,800 429,900 248,900 35,000 602,300 383,700 218,600 42,300 468,000 247,700 220,300 47,700 $50,000�74,999 620,800 415,000 205,700 34,500 597,200 410,000 187,200 32,200 501,300 342,500 158,800 36,600 $75,000 or more 495,600 341,300 154,300 13,600 435,400 326,600 108,800 16,000 453,600 303,700 149,900 25,300
NOTE: See footnotes at end of table.
1995 1996 1997
Supplemental Tables 46
2
2
2
2
2
2
2
2
2
2
2
22
2

Table 2.1.�Number of nonfatal crimes against students ages 12 through 18 occurring at school or on the way to or from school, by type of crime Table 2.1.�and selected student characteristics: 1992 to 1999�Continued
Serious SeriousStudent characteristics Total Theft Violent violent1 Total Theft Violent violent1
Total 2,715,600 1,562,300 1,153,200 252,700 2,489,700 1,605,500 884,100 185,600
Gender Male 1,536,100 814,900 721,300 144,200 1,366,500 853,500 513,000 111,200 Female 1,179,400 747,500 431,900 108,400 1,123,200 752,000 371,200 74,300
Age 12�14 1,475,100 769,300 705,800 162,200 1,426,300 883,000 543,200 127,000 15�18 1,240,500 793,000 447,400 90,500 1,063,400 722,500 340,900 58,600
Race/ethnicity White, non-Hispanic 1,824,300 1,038,800 785,500 157,100 1,689,500 1,107,300 582,200 95,300 Black, non-Hispanic 464,000 265,700 198,200 48,100 438,200 260,000 178,200 58,900 Hispanic 315,100 185,900 129,200 42,600 245,400 161,300 84,100 25,700 Other, non-Hispanic 105,700 67,600 38,100 4,900 93,300 62,300 31,000 5,600
Urbanicity Urban 865,000 503,600 361,400 99,100 681,600 466,500 215,100 63,700 Suburban 1,319,500 771,000 548,400 91,700 1,340,700 825,800 514,900 110,400 Rural 531,100 287,700 243,400 61,900 467,300 313,200 154,100 11,400
Household income Less than $7,500 136,500 69,900 66,700 21,100 94,900 42,000 52,900 17,200 $7,500�14,999 242,600 95,700 146,900 30,400 148,500 88,300 60,300 8,900 $15,000�24,999 428,700 218,300 210,400 35,400 285,900 183,200 102,700 27,400 $25,000�34,999 351,100 173,000 178,200 52,100 250,400 166,900 83,500 5,900 $35,000�49,999 361,500 239,100 122,400 27,200 440,600 270,700 169,900 24,600 $50,000�74,999 497,400 306,700 190,600 45,000 449,200 274,300 174,900 53,900 $75,000 or more 453,000 303,500 149,500 23,800 501,400 395,600 105,700 28,400
�No cases are reported in this cell, although the event defined by this cell could have been reported by some students with these characteristics had a different sample been drawn.1Serious violent crimes are also included in violent crimes.2Estimate based on fewer than 10 cases.
NOTE: Serious violent crimes include rape, sexual assault, robbery, and aggravated assault. Violent crimes include serious violent crimes and simple assault. Total crimes include violent crimes andtheft. �At school� includes inside the school building, on school property, or on the way to or from school. Because of rounding or missing data, detail may not add to totals. Numbers are rounded tothe nearest 100.
SOURCE: U.S. Department of Justice, Bureau of Justice Statistics, National Crime Victimization Survey, 1992 to 1999. Supplemental Tables 47
1998 1999
2
22
2
2
2
22
2
2
2
22

Table 2.2.�Number of nonfatal crimes against students ages 12 through 18 occurring at school or on the way to or from school per 1,000 students, Table 2.2.�by type of crime and selected student characteristics: 1992 to 1999
Serious Serious SeriousStudent characteristics Total Theft Violent violent1 Total Theft Violent violent1 Total Theft Violent violent1
Total 144 95 48 10 155 96 59 12 150 94 56 13
Gender Male 168 105 64 15 171 101 70 14 162 97 65 15 Female 117 85 32 5 137 91 46 11 137 90 47 10
Age 12�14 172 105 67 16 190 111 79 16 187 109 78 18 15�18 120 87 33 6 125 83 42 9 119 81 38 9
Race/ethnicity White, non-Hispanic 156 105 52 9 170 106 63 11 156 101 55 11 Black, non-Hispanic 114 67 46 18 128 76 52 22 140 81 59 15 Hispanic 113 72 41 10 118 68 50 9 137 74 63 22 Other, non-Hispanic 129 110 19 � 99 70 29 6 109 71 39 13
Urbanicity Urban 141 92 50 15 145 84 62 15 143 78 65 21 Suburban 155 105 50 10 174 113 60 12 169 107 62 13 Rural 124 80 44 6 129 77 52 11 121 84 37 4
Household income Less than $7,500 123 65 57 14 123 51 71 13 96 47 49 21 $7,500�14,999 111 65 46 13 123 74 49 13 119 75 44 6 $15,000�24,999 125 60 65 16 137 75 62 10 134 85 50 12 $25,000�34,999 137 94 43 5 187 128 58 10 162 89 73 16 $35,000�49,999 180 133 47 9 157 98 59 14 164 105 59 11 $50,000�74,999 150 119 31 4 170 115 56 12 166 105 61 13 $75,000 or more 206 136 70 17 193 143 50 9 179 129 51 8
NOTE: See footnotes at end of table.
48
1992 1993 1994
Supplemental Tables
22
2
2222
2
2
2
2
2
2
2
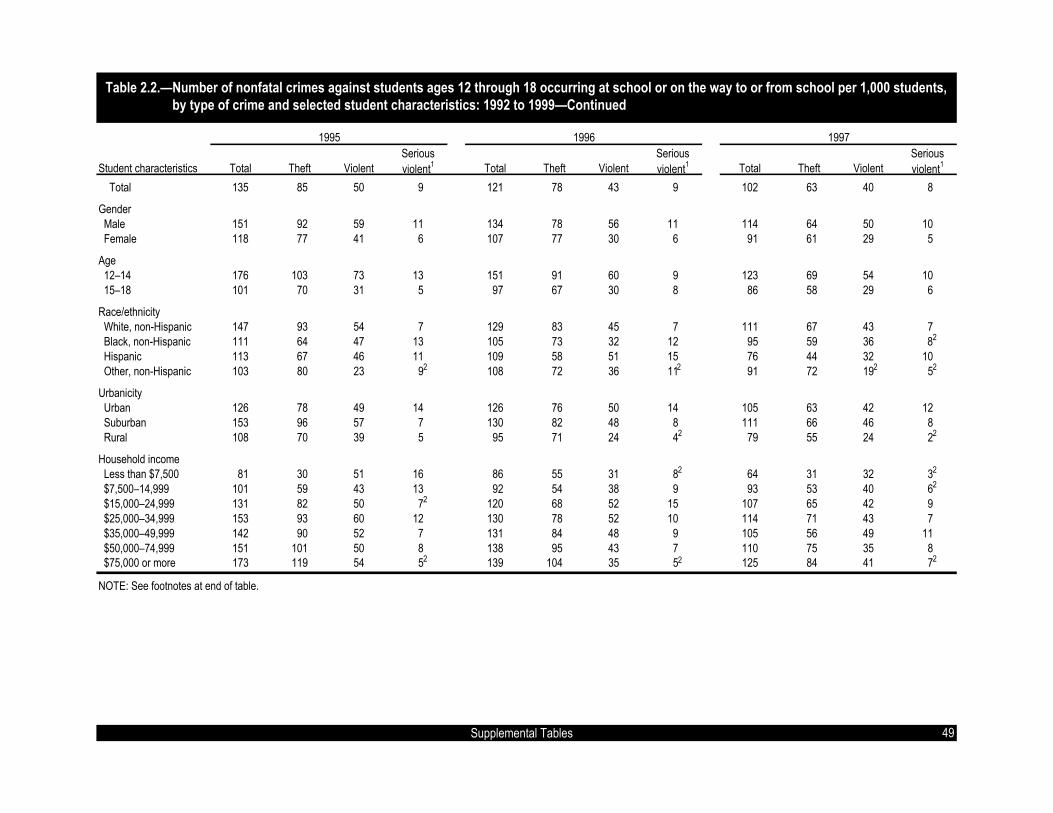
Table 2.2.�Number of nonfatal crimes against students ages 12 through 18 occurring at school or on the way to or from school per 1,000 students, Table 2.2.�by type of crime and selected student characteristics: 1992 to 1999�Continued
Serious Serious SeriousStudent characteristics Total Theft Violent violent1 Total Theft Violent violent1 Total Theft Violent violent1
Total 135 85 50 9 121 78 43 9 102 63 40 8
Gender Male 151 92 59 11 134 78 56 11 114 64 50 10 Female 118 77 41 6 107 77 30 6 91 61 29 5
Age 12�14 176 103 73 13 151 91 60 9 123 69 54 10 15�18 101 70 31 5 97 67 30 8 86 58 29 6
Race/ethnicity White, non-Hispanic 147 93 54 7 129 83 45 7 111 67 43 7 Black, non-Hispanic 111 64 47 13 105 73 32 12 95 59 36 8 Hispanic 113 67 46 11 109 58 51 15 76 44 32 10 Other, non-Hispanic 103 80 23 9 108 72 36 11 91 72 19 5
Urbanicity Urban 126 78 49 14 126 76 50 14 105 63 42 12 Suburban 153 96 57 7 130 82 48 8 111 66 46 8 Rural 108 70 39 5 95 71 24 4 79 55 24 2
Household income Less than $7,500 81 30 51 16 86 55 31 8 64 31 32 3 $7,500�14,999 101 59 43 13 92 54 38 9 93 53 40 6 $15,000�24,999 131 82 50 7 120 68 52 15 107 65 42 9 $25,000�34,999 153 93 60 12 130 78 52 10 114 71 43 7 $35,000�49,999 142 90 52 7 131 84 48 9 105 56 49 11 $50,000�74,999 151 101 50 8 138 95 43 7 110 75 35 8 $75,000 or more 173 119 54 5 139 104 35 5 125 84 41 7
NOTE: See footnotes at end of table.
49
1995 1996 1997
Supplemental Tables
2
2
2
2
2
2
2
2
2
2
2
22
2

Table 2.2.�Number of nonfatal crimes against students ages 12 through 18 occurring at school or on the way to or from school per 1,000 students, Table 2.2.�by type of crime and selected student characteristics: 1992 to 1999�Continued
Serious SeriousStudent characteristics Total Theft Violent violent1 Total Theft Violent violent1
Total 101 58 43 9 92 59 33 7
Gender Male 111 59 52 10 98 62 37 8 Female 91 58 33 8 85 57 28 6
Age 12�14 125 65 60 14 120 74 46 11 15�18 83 53 30 6 70 48 23 4
Race/ethnicity White, non-Hispanic 105 60 45 9 98 64 34 6 Black, non-Hispanic 111 64 48 12 106 63 43 14 Hispanic 82 48 34 11 62 40 21 6 Other, non-Hispanic 89 57 32 4 77 52 26 5
Urbanicity Urban 117 68 49 13 93 63 29 9 Suburban 97 56 40 7 94 58 36 8 Rural 93 50 43 11 86 58 28 2
Household income Less than $7,500 110 56 53 17 86 38 48 15 $7,500�14,999 97 38 59 12 70 42 29 4 $15,000�24,999 126 64 62 10 90 58 32 9 $25,000�34,999 102 50 52 15 77 51 26 2 $35,000�49,999 86 57 29 6 108 66 42 6 $50,000�74,999 110 68 42 10 100 61 39 12 $75,000 or more 112 75 37 6 108 85 23 6
�No cases are reported in this cell, although the event defined by this cell could have been reported by some students with these characteristics had a different sample been drawn.1Serious violent crimes are also included in violent crimes.2Estimate based on fewer than 10 cases.
NOTE: Serious violent crimes include rape, sexual assault, robbery, and aggravated assault. Violent crimes include serious violent crimes and simple assault. Total crimes include violent crimes andtheft. �At school� includes inside the school building, on school property, or on the way to or from school. Population sizes are 23,740,295 students ages 12 through 18 in 1992; 24,557,779 in 1993;25,326,989 in 1994; 25,715,220 in 1995; 26,151,364 in 1996; 26,548,142 in 1997; 26,806,268 in 1998; and 27,012,660 in 1999. Because of rounding or missing data, detail may not add to totals.
SOURCE: U.S. Department of Justice, Bureau of Justice Statistics, National Crime Victimization Survey, 1992 to 1999.
50 Supplemental Tables
1998 1999
2
22
2
2
2
22
2
2
2
22

Table 2.3.�Number of nonfatal crimes against students ages 12 through 18 occurring away from school, by type of crime and selected student Table 2.3.�characteristics: 1992 to 1999
Serious Serious SeriousStudent characteristics Total Theft Violent violent1 Total Theft Violent violent1 Total Theft Violent violent1
Total 3,286,800 1,607,600 1,679,200 750,200 3,419,700 1,691,800 1,728,000 849,500 3,258,100 1,521,700 1,736,400 832,700
Gender Male 1,967,600 1,000,400 967,300 433,300 2,009,000 1,001,100 1,007,900 527,800 1,921,200 866,200 1,055,000 522,800 Female 1,319,200 607,200 712,000 316,900 1,410,800 690,700 720,100 321,700 1,336,800 655,400 681,400 309,900
Age 12�14 1,253,700 685,900 567,800 249,700 1,236,200 655,800 580,500 280,500 1,132,900 572,200 560,700 231,400 15�18 2,033,100 921,700 1,111,400 500,500 2,183,500 1,036,000 1,147,500 569,000 2,125,200 949,500 1,175,700 601,300
Race/ethnicity White, non-Hispanic 2,294,400 1,152,100 1,142,300 450,800 2,322,900 1,128,700 1,194,200 502,600 2,209,500 1,048,100 1,161,400 482,300 Black, non-Hispanic 461,300 227,100 234,200 139,000 597,600 302,100 295,400 193,500 499,200 229,900 269,300 170,400 Hispanic 383,400 163,900 219,500 113,200 380,600 187,800 192,900 129,300 423,300 191,800 231,500 141,500 Other, non-Hispanic 132,400 59,600 72,800 40,900 94,600 61,300 33,400 19,200 99,400 47,600 51,700 25,300
Urbanicity Urban 1,124,200 532,400 591,900 265,800 1,245,900 589,000 657,000 354,200 1,095,100 489,500 605,600 320,200 Suburban 1,658,000 838,400 819,600 360,100 1,515,400 771,700 743,700 364,700 1,592,300 729,700 862,600 396,000 Rural 504,500 236,800 267,700 124,300 658,400 331,200 327,200 130,700 570,700 302,400 268,200 116,500
Household income Less than $7,500 379,500 192,900 186,600 75,200 423,500 180,300 243,300 107,100 354,400 157,800 196,600 108,600 $7,500�14,999 491,500 197,500 294,000 168,600 494,800 261,600 233,200 136,900 389,900 170,800 219,200 116,500 $15,000�24,999 592,300 246,500 345,800 143,500 563,600 257,100 306,500 152,700 426,100 179,000 247,100 110,800 $25,000�34,999 501,400 217,400 284,000 121,600 503,500 258,600 244,800 124,900 487,200 226,000 261,200 122,300 $35,000�49,999 479,800 242,600 237,200 80,200 549,500 253,600 295,900 144,700 494,200 233,500 260,700 120,900 $50,000�74,999 373,700 221,700 152,000 60,000 380,200 217,000 163,200 76,200 483,500 248,700 234,700 105,900 $75,000 or more 243,700 151,700 92,000 34,600 222,000 122,800 99,300 38,100 292,700 156,200 136,500 60,000
NOTE: See footnotes at end of table.
51
1992 1993 1994
Supplemental Tables
2
2
2

Table 2.3.�Number of nonfatal crimes against students ages 12 through 18 occurring away from school, by type of crime and selected student Table 2.3.�characteristics: 1992 to 1999�Continued
Serious Serious SeriousStudent characteristics Total Theft Violent violent1 Total Theft Violent violent1 Total Theft Violent violent1
Total 3,058,300 1,561,800 1,496,500 599,000 3,050,600 1,622,900 1,427,700 670,600 3,107,300 1,551,600 1,555,800 635,900
Gender Male 1,786,900 883,000 903,900 374,600 1,890,300 1,004,000 886,400 421,200 1,806,000 914,600 891,400 361,300 Female 1,271,400 678,800 592,600 224,400 1,160,200 618,900 541,300 249,300 1,301,400 637,000 664,400 274,600
Age 12�14 1,040,200 556,100 484,100 178,300 1,058,100 600,800 457,200 209,100 1,030,700 557,600 473,100 190,300 15�18 2,018,100 1,005,700 1,012,400 420,700 1,992,500 1,022,000 970,500 461,400 2,076,600 994,000 1,082,600 445,600
Race/ethnicity White, non-Hispanic 2,048,300 1,075,900 972,400 373,100 2,030,000 1,078,400 951,600 391,700 2,089,200 1,037,500 1,051,700 414,900 Black, non-Hispanic 512,100 254,200 257,800 98,200 522,800 265,300 257,500 157,400 520,500 271,300 249,200 109,900 Hispanic 349,800 144,000 205,700 95,500 349,200 186,600 162,600 94,200 404,300 191,400 213,000 94,400 Other, non-Hispanic 114,000 64,800 49,200 23,400 112,000 72,000 40,000 24,800 67,900 36,900 31,000 12,400
Urbanicity Urban 1,057,300 518,000 539,400 229,900 993,000 494,800 498,200 274,800 1,079,800 531,600 548,300 270,700 Suburban 1,463,700 776,900 686,900 277,000 1,481,200 800,500 680,700 294,600 1,504,600 772,400 732,300 268,600 Rural 537,200 267,000 270,300 92,100 576,400 327,700 248,700 101,100 522,800 247,600 275,200 96,600
Household income Less than $7,500 329,100 162,000 167,100 68,500 284,800 134,500 150,300 103,000 181,200 97,800 83,400 31,300 $7,500�14,999 428,100 191,400 236,700 97,100 422,400 213,300 209,100 127,200 443,900 167,200 276,700 137,600 $15,000�24,999 491,400 289,100 202,300 86,100 468,600 218,800 249,800 109,800 388,700 209,600 179,000 74,300 $25,000�34,999 411,700 203,700 208,000 76,000 377,600 215,900 161,700 68,100 420,600 202,000 218,700 81,500 $35,000�49,999 486,000 238,800 247,300 104,200 465,800 250,300 215,600 69,500 510,100 308,300 201,800 81,600 $50,000�74,999 442,100 225,000 217,000 96,400 394,500 245,100 149,300 72,300 445,000 203,400 241,600 89,600 $75,000 or more 288,900 140,000 148,900 38,300 324,900 218,400 106,500 29,300 384,100 199,600 184,500 79,500
NOTE: See footnotes at end of table.
52
1995 1996 1997
Supplemental Tables
2 2 2

Table 2.3.�Number of nonfatal crimes against students ages 12 through 18 occurring away from school, by type of crime and selected student Table 2.3.�characteristics: 1992 to 1999�Continued
Serious SeriousStudent characteristics Total Theft Violent violent1 Total Theft Violent violent1
Total 2,534,500 1,236,400 1,298,100 550,200 2,106,600 1,048,200 1,058,300 476,400
Gender Male 1,493,600 732,700 761,000 364,900 1,240,800 595,700 645,200 303,600 Female 1,040,900 503,700 537,100 185,300 865,700 452,600 413,200 172,800
Age 12�14 761,000 430,800 330,200 131,900 702,100 401,500 300,600 126,900 15�18 1,773,500 805,600 967,900 418,300 1,404,500 646,800 757,700 349,500
Race/ethnicity White, non-Hispanic 1,698,800 832,900 865,900 331,000 1,341,000 685,100 655,800 266,700 Black, non-Hispanic 394,000 200,600 193,400 106,000 360,400 172,300 188,100 97,700 Hispanic 311,300 122,300 189,100 95,300 312,500 141,500 171,000 99,900 Other, non-Hispanic 104,800 68,200 36,600 15,800 62,400 35,400 27,000 12,100
Urbanicity Urban 869,600 389,200 480,400 229,400 660,500 311,300 349,200 206,200 Suburban 1,333,400 656,900 676,500 275,900 1,153,100 575,300 577,800 228,500 Rural 331,500 190,300 141,200 44,900 292,900 161,600 131,300 41,700
Household income Less than $7,500 137,700 51,500 86,200 39,200 184,300 82,100 102,200 50,600 $7,500�14,999 350,200 162,100 188,100 56,800 200,600 114,200 86,400 54,100 $15,000�24,999 379,700 181,200 198,500 103,100 245,900 114,900 131,000 52,700 $25,000�34,999 360,700 165,700 195,000 107,200 281,500 144,800 136,700 38,200 $35,000�49,999 406,900 237,600 169,300 83,600 300,400 160,200 140,200 61,800 $50,000�74,999 341,200 147,300 193,900 70,300 313,700 146,600 167,100 93,400 $75,000 or more 317,000 176,700 140,300 53,400 344,600 179,000 165,600 70,300 1Serious violent crimes are also included in violent crimes.2Estimate based on fewer than 10 cases.
NOTE: Serious violent crimes include rape, sexual assault, robbery, and aggravated assault. Violent crimes include serious violent crimes and simple assault. Total crimes include violent crimes andtheft. Because of rounding or missing data, detail may not add to totals. Numbers are rounded to the nearest 100.
SOURCE: U.S. Department of Justice, Bureau of Justice Statistics, National Crime Victimization Survey, 1992 to 1999.53 Supplemental Tables
19991998
2
2
2 2
2

Table 2.4.�Number of nonfatal crimes against students ages 12 through 18 occurring away from school per 1,000 students, by type of crime and Table 2.4.�selected student characteristics: 1992 to 1999
Serious Serious SeriousStudent characteristics Total Theft Violent violent1 Total Theft Violent violent1 Total Theft Violent violent1
Total 138 68 71 32 139 69 70 35 129 60 69 33
Gender Male 161 82 79 35 159 79 80 42 147 66 81 40 Female 115 53 62 28 119 58 61 27 109 53 55 25
Age 12�14 116 63 53 23 111 59 52 25 99 50 49 20 15�18 157 71 86 39 163 77 86 43 153 68 85 43
Race/ethnicity White, non-Hispanic 142 71 71 28 139 68 72 30 129 61 68 28 Black, non-Hispanic 118 58 60 36 151 76 74 49 127 58 68 43 Hispanic 145 62 83 43 134 66 68 46 134 61 73 45 Other, non-Hispanic 153 69 84 47 103 67 36 21 103 49 54 26
Urbanicity Urban 180 85 95 43 187 89 99 53 160 72 89 47 Suburban 142 72 70 31 130 66 64 31 132 61 72 33 Rural 87 41 46 21 105 53 52 21 88 47 42 18
Household income Less than $7,500 187 95 92 37 205 87 118 52 185 82 102 57 $7,500�14,999 162 65 97 56 180 95 85 50 144 63 81 43 $15,000�24,999 178 74 104 43 158 72 86 43 116 49 67 30 $25,000�34,999 140 61 80 34 137 71 67 34 138 64 74 35 $35,000�49,999 113 57 56 19 129 59 69 34 110 52 58 27 $50,000�74,999 110 65 45 18 101 58 43 20 120 62 58 26 $75,000 or more 131 82 50 19 106 58 47 18 120 64 56 25
NOTE: See footnotes at end of table.
54
1992 1993 1994
Supplemental Tables
2
2
2

Table 2.4.�Number of nonfatal crimes against students ages 12 through 18 occurring away from school per 1,000 students, by type of crime and Table 2.4.�selected student characteristics: 1992 to 1999�Continued
Serious Serious SeriousStudent characteristics Total Theft Violent violent1 Total Theft Violent violent1 Total Theft Violent violent1
Total 119 61 58 23 117 62 55 26 117 58 59 24
Gender Male 135 67 68 28 141 75 66 31 132 67 65 26 Female 102 54 48 18 91 49 43 20 101 49 52 21
Age 12�14 89 48 42 15 91 52 39 18 88 48 40 16 15�18 143 71 72 30 137 70 67 32 140 67 73 30
Race/ethnicity White, non-Hispanic 119 63 57 22 117 62 55 22 120 60 61 24 Black, non-Hispanic 127 63 64 24 132 67 65 40 126 65 60 27 Hispanic 106 43 62 29 99 53 46 27 110 52 58 26 Other, non-Hispanic 106 60 46 22 104 67 37 23 58 32 27 11
Urbanicity Urban 150 74 77 33 137 68 69 38 143 70 73 36 Suburban 117 62 55 22 113 61 52 23 114 58 55 20 Rural 87 43 44 15 99 56 43 17 90 43 47 17
Household income Less than $7,500 189 93 96 39 179 85 94 65 133 72 61 23 $7,500�14,999 152 68 84 35 153 77 76 46 164 62 102 51 $15,000�24,999 146 86 60 26 132 62 70 31 114 62 53 22 $25,000�34,999 117 58 59 22 112 64 48 20 123 59 64 24 $35,000�49,999 102 50 52 22 102 55 47 15 114 69 45 18 $50,000�74,999 107 55 53 23 91 57 35 17 98 45 53 20 $75,000 or more 101 49 52 13 104 70 34 9 106 55 51 22
NOTE: See footnotes at end of table.
55
1995 1996 1997
Supplemental Tables
22 2

Table 2.4.�Number of nonfatal crimes against students ages 12 through 18 occurring away from school per 1,000 students, by type of crime and Table 2.4.�selected student characteristics: 1992 to 1999�Continued
Serious SeriousStudent characteristics Total Theft Violent violent1 Total Theft Violent violent1
Total 95 46 48 21 78 39 39 18
Gender Male 108 53 55 26 89 43 46 22 Female 80 39 41 14 66 34 31 13
Age 12�14 65 37 28 11 59 34 25 11 15�18 118 54 64 28 93 43 50 23
Race/ethnicity White, non-Hispanic 98 48 50 19 77 40 38 15 Black, non-Hispanic 95 48 46 25 87 42 45 24 Hispanic 81 32 49 25 78 35 43 25 Other, non-Hispanic 88 57 31 13 52 29 22 10
Urbanicity Urban 117 52 65 31 90 42 47 28 Suburban 98 48 50 20 81 40 41 16 Rural 58 33 25 8 54 30 24 8
Household income Less than $7,500 111 41 69 31 166 74 92 46 $7,500�14,999 140 65 75 23 95 54 41 26 $15,000�24,999 112 53 59 30 77 36 41 17 $25,000�34,999 105 48 57 31 86 44 42 12 $35,000�49,999 97 57 40 20 74 39 34 15 $50,000�74,999 75 33 43 16 70 33 37 21 $75,000 or more 78 44 35 13 74 39 36 15 1Serious violent crimes are also included in violent crimes.2Estimate based on fewer than 10 cases.
NOTE: Serious violent crimes include rape, sexual assault, robbery, and aggravated assault. Violent crimes include serious violent crimes and simple assault. Total crimes include violent crimes andtheft. Population sizes are 23,740,295 students ages 12 through 18 in 1992; 24,557,779 in 1993; 25,326,989 in 1994; 25,715,220 in 1995; 26,151,364 in 1996; 26,548,142 in 1997; 26,806,268 in1998; and 27,012,660 in 1999. Because of rounding or missing data, detail may not add to totals.
SOURCE: U.S. Department of Justice, Bureau of Justice Statistics, National Crime Victimization Survey, 1992 to 1999.56
1998 1999
Supplemental Tables
2
2
2 2
2

Table 3.1.�Percentage of students ages 12 through 18 who reported criminal victimization at school during the previous 6 months, by type of Table 3.1.�victimization and selected student characteristics: 1995 and 1999
Student characteristics1 Total1 Theft Violent2 Serious violent3 Total1 Theft Violent2 Serious violent3
Total 9.5 7.1 3.0 0.7 7.6 5.7 2.3 0.5
Gender Male 10.0 7.1 3.5 0.9 7.8 5.7 2.5 0.6 Female 9.0 7.1 2.4 0.4 7.3 5.7 2.0 0.5
Race/ethnicity White, non-Hispanic 9.8 7.4 3.0 0.6 7.5 5.8 2.1 0.4 Black, non-Hispanic 10.2 7.1 3.4 1.0 9.9 7.4 3.5 1.2 Hispanic 7.6 5.8 2.7 0.9 5.7 3.9 1.9 0.6 Other, non-Hispanic 8.8 6.5 2.5 0.5 6.4 4.4 2.2 �
Grade 6th 9.6 5.4 5.1 1.5 8.0 5.2 3.8 1.3 7th 11.2 8.1 3.8 0.9 8.2 6.0 2.6 0.9 8th 10.5 7.9 3.1 0.8 7.6 5.9 2.4 0.5 9th 11.9 9.1 3.4 0.7 8.9 6.5 3.2 0.6 10th 9.1 7.7 2.1 0.4 8.0 6.5 1.7 0.5 11th 7.3 5.5 1.9 0.4 7.2 5.5 1.8 0.1 12th 6.1 4.6 1.9 0.4 4.8 4.0 0.8 0.3
Urbanicity Urban 9.3 6.6 3.3 1.3 8.4 6.9 2.3 0.7 Suburban 10.3 7.6 3.5 0.6 7.6 5.4 2.4 0.5 Rural 8.3 6.8 1.8 0.3 6.4 5.0 1.9 0.4
Control Public 9.8 7.3 3.1 0.7 7.9 5.9 2.5 0.6 Private 6.6 5.2 1.7 0.1 4.5 4.3 0.3 �
�No cases are reported in this cell, although the event defined by this cell could have been reported by some students with these characteristics had a different sample been drawn.1Total victimization is a combination of violent victimization and theft. If the student reported an incident in either, he or she is counted as having experienced �total� victimization. If the studentreported having experienced both, he or she is counted once under �total� victimization.2Violent crimes include rape, sexual assault, robbery, aggravated assault, and simple assault.3Serious violent crimes include rape, sexual assault, robbery, and aggravated assault. Serious violent crimes are also included in violent crimes.
NOTE: �At school� includes inside the school building, on school property, or on the way to or from school. Because of rounding or missing data, detail may not add to totals.
SOURCE: U.S. Department of Justice, Bureau of Justice Statistics, School Crime Supplement to the National Crime Victimization Survey, January�June 1995 and 1999.57
1995 1999
Supplemental Tables

Table 4.1.�Percentage of students in grades 9 through 12 who reported being threatened or injured with a weapon on school property during the Table 5.1.�last 12 months, by selected student characteristics: 1993, 1995, 1997, and 1999
Student characteristics 1993 19951 19971 19991
Total 7.3 8.4 7.4 7.7
Gender Male 9.2 10.9 10.2 9.5 Female 5.4 5.8 4.0 5.8
Race/ethnicity2
American Indian or Alaska Native § § § 13.2 Asian § § § 7.7 Black or African-American § § § 7.6 Native Hawaiian or other Pacific Islander § § § 15.6 White § § § 6.6 Multiple, non-Hispanic § § § 9.3 Hispanic or Latino § § § 9.8
Grade 9th 9.4 9.6 10.1 10.5 10th 7.3 9.6 7.9 8.2 11th 7.3 7.7 5.9 6.1 12th 5.5 6.7 5.8 5.1 §The response categories for race/ethnicity changed in 1999 making comparisons of some categories with earlier years problematic.1The response rate for this survey was less than 70 percent and a full nonresponse bias analysis has not been done to date.2Hispanics and Latinos are not included in these race/ethnicity categories unless specified.
NOTE: �On school property� was not defined for survey respondents.
SOURCE: Centers for Disease Control and Prevention, National Center for Chronic Disease Prevention and Health Promotion, Youth Risk Behavior Surveillance System (YRBSS), �Youth RiskBehavior Survey� (YRBS), 1993, 1995, 1997, and 1999.
58 Supplemental Tables

Table 5.1.�Percentage of students in grades 9 through 12 who reported having been in a physical fight in the last 12 months, by selected student Table 6.1.�characteristics: 1993, 1995, 1997, and 1999
Student characteristics 1993 19951 19971 19991 1993 19951 19971 19991
Total 41.8 38.7 36.6 35.7 16.2 15.5 14.8 14.2
Gender Male 51.2 46.1 45.5 44.0 23.5 21.0 20.0 18.5 Female 31.7 30.6 26.0 27.3 8.6 9.5 8.6 9.8
Race/ethnicity2
American Indian or Alaska Native § § § 48.7 § § § 16.2 Asian § § § 22.7 § § § 10.4 Black or African-American § § § 41.4 § § § 18.7 Native Hawaiian or other Pacific Islander § § § 50.7 § § § 25.3 White § § § 33.1 § § § 12.3 Multiple, non-Hispanic § § § 40.2 § § § 16.9 Hispanic or Latino § § § 39.9 § § § 15.7
Grade 9th 50.4 47.3 44.8 41.1 23.1 21.6 21.3 18.6 10th 42.2 40.4 40.2 37.7 17.2 16.5 17.0 17.2 11th 40.5 36.9 34.2 31.3 13.8 13.6 12.5 10.8 12th 34.8 31.0 28.8 30.4 11.4 10.6 9.5 8.1 §The response categories for race/ethnicity changed in 1999 making comparisons of some categories with earlier years problematic.1The response rate for this survey was less than 70 percent and a full nonresponse bias analysis has not been done to date.2Hispanics and Latinos are not included in these race/ethnicity categories unless specified.
NOTE: �On school property� was not defined for survey respondents. The term �anywhere� is not used in the YRBS questionnaire. Rather, students are simply asked how many times in the last 12months they had been in a physical fight.
SOURCE: Centers for Disease Control and Prevention, National Center for Chronic Disease Prevention and Health Promotion, Youth Risk Behavior Surveillance System (YRBSS), �Youth RiskBehavior Survey� (YRBS), 1993, 1995, 1997, and 1999.
59
Anywhere On school property
Supplemental Tables

Table 6.1.�Percentage of students ages 12 through 18 who reported being bullied at school during the previous 6 months, by gender and selected Table 6.1.�student characteristics: 1999
Student characteristics Total Male Female
Total 5.1 5.4 4.8
Race/ethnicity White, non-Hispanic 5.3 5.6 5.1 Black, non-Hispanic 5.5 6.0 4.9 Hispanic 4.4 4.6 4.1 Other, non-Hispanic 2.5 3.1 1.9
Grade 6th 10.5 12.6 8.0 7th 9.0 10.9 7.0 8th 5.5 5.1 6.0 9th 5.0 5.2 4.8 10th 3.2 2.7 3.7 11th 2.6 2.1 3.2 12th 1.2 0.7 1.7
Urbanicity Urban 5.0 5.9 4.1 Suburban 4.9 5.2 4.5 Rural 5.8 5.2 6.5
Control Public 5.3 5.6 5.1 Private 2.8 3.5 2.1NOTE: �At school� means in the school building, on the school grounds, or on a school bus. Population size is 24,614,000 students ages 12 through 18 in 1999.
SOURCE: U.S. Department of Justice, Bureau of Justice Statistics, School Crime Supplement to the National Crime Victimization Survey, January�June 1999.
60 Supplemental Tables

Table 7.1.�Percentage of public schools that reported one or more criminal incidents to police, by seriousness of the incident, urbanicity, and Table 8.1.�selected school characteristics: 1996�97
Urban Urban UrbanSchool characteristics Total City fringe Town Rural Total City fringe Town Rural Total City fringe Town Rural
Total 56.7 59.3 58.4 63.2 46.9 10.1 16.8 11.2 5.4 7.8 46.5 42.4 46.7 57.8 39.2
Instructional level Elementary school 45.1 46.9 47.0 52.6 34.2 4.2 6.1 3.3 2.0 5.1 40.8 40.8 43.2 50.6 29.1 Middle school 74.1 86.7 78.8 70.0 62.0 18.7 35.8 21.7 7.0 15.0 55.4 50.9 57.1 63.0 47.0 High school 76.9 88.8 84.0 84.2 64.1 20.6 48.0 33.0 12.7 9.4 55.9 39.9 49.4 71.5 54.7
Region Northeast 51.6 51.9 49.3 53.7 52.5 6.8 9.5 6.9 2.6 11.0 44.7 42.2 42.4 51.2 41.5 Southeast 58.8 55.1 65.5 64.8 51.1 9.2 17.3 13.2 4.9 4.9 49.6 37.8 52.3 59.9 46.2 Central 50.8 52.5 51.7 59.9 43.6 11.1 16.4 12.4 6.4 10.2 39.7 36.1 39.3 53.4 33.5 West 64.3 69.8 69.9 72.5 45.8 11.9 20.2 13.3 7.2 5.7 51.9 49.5 54.4 65.3 40.0
School enrollment Less than 300 37.8 � � 44.9 38.0 3.9 � � 8.8 2.5 33.8 � � 36.1 35.5 300�999 59.6 54.2 59.2 67.3 56.8 9.3 12.5 9.0 3.2 13.9 50.2 41.7 49.5 64.1 42.9 1,000 or more 89.1 93.1 86.7 86.5 � 32.9 44.2 29.8 15.9 � 56.0 48.1 56.9 70.6 �
Minority enrollment Less than 5 percent 46.7 � 47.2 53.9 40.8 5.8 � 5.9 3.3 7.3 40.9 � 41.3 50.5 33.5 5�19 percent 57.7 52.0 62.9 64.0 45.0 10.9 14.5 11.3 10.6 6.8 46.6 37.4 51.1 53.5 38.1 20�49 percent 58.1 54.7 58.5 66.7 53.3 11.1 19.1 10.1 5.0 8.0 47.0 35.6 48.4 61.7 45.3 50 percent or more 68.3 64.8 62.3 81.5 74.9 14.7 17.6 17.8 4.4 11.6 53.1 47.1 42.6 77.1 63.3
Free/reduced-price lunch eligibility Less than 20 percent 54.4 50.6 57.3 64.2 41.2 8.6 12.2 9.9 7.1 5.6 45.8 38.2 47.4 57.1 35.7 21�34 percent 53.2 56.0 65.5 57.2 39.5 11.7 18.4 13.3 7.1 11.6 41.6 37.5 52.2 50.2 27.9 35�49 percent 59.4 76.1 53.3 63.1 52.5 11.6 34.2 8.6 3.0 8.6 47.8 41.5 44.7 60.1 43.9 50�74 percent 58.8 60.8 54.7 66.6 52.0 8.9 22.9 10.3 2.0 2.3 49.5 37.9 42.4 64.6 49.8 75 percent or more 59.2 58.5 � � � 10.2 8.4 � � � 49.0 50.2 � � �
�Fewer than 30 sample cases.
NOTE: Serious violent crimes include murder, rape or other type of sexual battery, suicide, physical attack or fight with a weapon, or robbery. Less serious violent or nonviolent crimes includephysical attack or fight without a weapon, theft/larceny, and vandalism. Any incidents refer to any of the crimes listed. Not included are any crimes not listed here and any crimes not reported topolice. Schools were asked to report crimes that took place in school buildings, on school buses, on school grounds, and at places holding school-sponsored events. Population size is 78,000 publicschools.
SOURCE: U.S. Department of Education, National Center for Education Statistics, Fast Response Survey System, �Principal/School Disciplinarian Survey on School Violence,� FRSS 63, 1997.61
Less serious violent or nonviolent incidents
Supplemental Tables
Any incidents Serious violent incidents and no serious violent incidents

Table 7.2.�Number of public schools that reported one or more criminal incidents to police, by seriousness of the incident, urbanicity, and Table 8.2.�selected school characteristics: 1996�97
Urban Urban UrbanSchool characteristics Total City fringe Town Rural Total City fringe Town Rural Total City fringe Town Rural
Total 44,000 10,600 11,000 12,400 9,900 7,900 3,000 2,100 1,100 1,600 36,100 7,600 8,900 11,400 8,300
Instructional level Elementary school 21,600 5,900 5,900 5,800 4,100 2,000 800 400 200 600 19,600 5,100 5,500 5,600 3,500 Middle school 10,400 2,600 2,800 3,100 1,900 2,600 1,100 800 300 500 7,800 1,600 2,000 2,800 1,400 High school 12,000 2,200 2,300 3,500 4,000 3,200 1,200 900 500 600 8,700 1,000 1,400 3,000 3,400
Region Northeast 7,800 1,500 2,700 2,300 1,200 1,000 300 400 100 300 6,700 1,300 2,300 2,200 900 Southeast 10,000 2,100 2,200 3,200 2,500 1,600 600 400 200 200 8,400 1,400 1,700 3,000 2,300 Central 11,400 2,500 2,500 3,000 3,500 2,500 800 600 300 800 8,900 1,700 1,900 2,700 2,700 West 14,800 4,600 3,600 3,900 2,700 2,800 1,300 700 400 300 12,000 3,300 2,900 3,500 2,400
School enrollment Less than 300 7,700 � � 2,100 4,400 800 � � 400 300 6,900 � � 1,700 4,100 300�999 29,800 7,200 8,200 9,200 5,200 4,600 1,700 1,300 400 1,300 25,100 5,600 6,900 8,700 3,900 1,000 or more 6,600 2,800 2,400 1,100 � 2,400 1,300 800 200 � 4,100 1,400 1,500 900 �
Minority enrollment Less than 5 percent 11,300 � 1,800 4,200 4,800 1,400 � 200 300 900 9,900 � 1,500 4,000 4,000 5�19 percent 10,100 1,800 3,900 3,000 1,400 1,900 500 700 500 200 8,200 1,300 3,200 2,500 1,200 20�49 percent 10,300 2,700 3,100 2,500 2,000 2,000 900 500 200 300 8,300 1,700 2,600 2,300 1,700 50 percent or more 11,900 5,600 2,300 2,300 1,600 2,600 1,500 700 100 300 9,300 4,100 1,600 2,200 1,400
Free/reduced-price lunch eligibility Less than 20 percent 10,000 1,400 4,000 3,000 1,700 1,600 300 700 300 200 8,500 1,000 3,300 2,600 1,500 21�34 percent 9,200 1,500 2,600 2,900 2,200 2,000 500 500 400 700 7,200 1,000 2,100 2,600 1,600 35�49 percent 7,700 1,700 1,400 2,100 2,500 1,500 800 200 100 400 6,200 900 1,100 2,000 2,100 50�74 percent 9,400 2,400 1,700 3,000 2,300 1,400 900 300 100 100 7,900 1,500 1,400 2,900 2,200 75 percent or more 7,400 3,700 � � � 1,300 500 � � � 6,100 3,200 � � �
�Fewer than 30 sample cases.
NOTE: Serious violent crimes include murder, rape or other type of sexual battery, suicide, physical attack or fight with a weapon, or robbery. Less serious violent or nonviolent crimes includephysical attack or fight without a weapon, theft/larceny, and vandalism. Any incidents refer to any of the crimes listed. Not included are any crimes not listed here and any crimes not reported topolice. Schools were asked to report crimes that took place in school buildings, on school buses, on school grounds, and at places holding school-sponsored events. Population size is 78,000public schools. Because of rounding or missing data, detail may not add to totals. Numbers are rounded to the nearest 100.
SOURCE: U.S. Department of Education, National Center for Education Statistics, Fast Response Survey System, �Principal/School Disciplinarian Survey on School Violence,� FRSS 63, 1997.62
Less serious violent or nonviolent incidentsSerious violent incidents
Supplemental Tables
Any incidents and no serious violent incidents

Table 7.3.�Number of criminal incidents occurring in public schools reported to police, by seriousness of the incident, urbanicity, and selected Table 8.3.�school characteristics: 1996�97
Urban Urban UrbanSchool characteristics Total City fringe Town Rural Total City fringe Town Rural Total City fringe Town Rural
Total 424,500 146,700 110,600 103,800 63,400 22,600 11,900 4,700 2,800 3,100 401,900 134,800 105,900 101,000 60,200
Instructional level Elementary school 78,700 19,000 25,900 22,200 11,600 2,900 1,400 400 200 900 75,800 17,600 25,500 22,000 10,800 Middle school 136,400 61,000 32,600 29,800 13,000 7,800 5,200 1,400 400 800 128,600 55,800 31,200 29,400 12,200 High school 209,400 66,800 52,000 51,900 38,700 11,900 5,300 2,900 2,200 1,500 197,500 61,500 49,200 49,700 37,200
Region Northeast 67,400 19,000 23,500 17,500 7,400 3,200 1,800 700 400 500 64,200 17,300 22,800 17,200 6,900 Southeast 95,400 24,400 34,600 20,700 15,700 4,100 1,600 1,600 300 600 91,300 22,800 32,900 20,400 15,200 Central 95,000 34,800 16,400 21,800 21,900 7,800 4,700 1,000 500 1,700 87,200 30,200 15,400 21,300 20,200 West 166,700 68,500 36,100 43,800 18,300 7,500 3,900 1,400 1,700 400 159,200 64,600 34,600 42,100 17,900
School enrollment Less than 300 40,000 � � 14,800 21,700 2,300 � � 1,600 600 37,700 � � 13,200 21,200 300�999 204,100 61,900 41,500 63,000 37,700 10,800 5,800 1,700 800 2,500 193,400 56,100 39,800 62,300 35,200 1,000 or more 180,400 82,800 67,700 26,000 � 9,600 6,000 3,000 500 � 170,800 76,800 64,700 25,500 �
Minority enrollment Less than 5 percent 66,200 � 9,100 27,000 26,400 1,800 � 200 300 1,300 64,500 � 8,900 26,800 25,100 5�19 percent 88,800 15,700 35,200 28,500 9,300 4,100 1,000 1,000 1,800 200 84,700 14,700 34,200 26,700 9,100 20�49 percent 103,500 37,900 31,600 20,700 13,400 5,200 2,800 1,300 600 500 98,300 35,100 30,300 20,100 12,800 50 percent or more 159,400 89,000 34,700 21,400 14,300 11,500 8,000 2,200 200 1,100 147,900 81,000 32,500 21,200 13,200
Free/reduced-price lunch eligibility Less than 20 percent 91,700 18,100 34,300 27,300 12,000 2,900 900 1,000 600 400 88,800 17,200 33,300 26,700 11,600 21�34 percent 83,900 22,800 26,900 21,400 12,800 5,300 2,000 2,000 400 900 78,600 20,900 24,900 21,000 11,900 35�49 percent 72,900 23,600 15,700 16,600 17,100 3,300 2,000 300 400 600 69,600 21,600 15,400 16,200 16,400 50�74 percent 93,900 45,900 17,000 21,400 9,700 5,500 4,400 900 100 100 88,500 41,500 16,100 21,200 9,600 75 percent or more 75,800 35,900 � � � 5,400 2,500 � � � 70,400 33,500 � � �
�Fewer than 30 sample cases.
NOTE: Serious violent crimes include murder, rape or other type of sexual battery, suicide, physical attack or fight with a weapon, or robbery. Less serious violent or nonviolent crimes includephysical attack or fight without a weapon, theft/larceny, and vandalism. Any incidents refer to any of the crimes listed. Not included are any crimes not listed here and any crimes not reported topolice. Schools were asked to report crimes that took place in school buildings, on school buses, on school grounds, and at places holding school-sponsored events. Because of rounding or missingdata, detail may not add to totals. Numbers are rounded to the nearest 100.
SOURCE: U.S. Department of Education, National Center for Education Statistics, Fast Response Survey System, �Principal/School Disciplinarian Survey on School Violence,� FRSS 63, 1997.63 Supplemental Tables
Less serious violent or nonviolent incidentsSerious violent incidentsAny incidents

Table 7.4.�Number of criminal incidents reported to police per 1,000 public school students, by seriousness of the incident, urbanicity, and Table 9.4.�selected school characteristics: 1996�97
Urban Urban UrbanSchool characteristics Total City fringe Town Rural Total City fringe Town Rural Total City fringe Town Rural
Total 10.0 11.6 8.8 10.2 9.0 0.5 0.9 0.4 0.3 0.4 9.5 10.7 8.4 9.9 8.5
Instructional level Elementary school 3.5 2.7 3.9 4.5 3.0 0.1 0.2 0.1 0.0 0.2 3.4 2.5 3.8 4.5 2.8 Middle school 16.2 24.8 12.6 13.0 12.2 0.9 2.1 0.6 0.2 0.8 15.3 22.6 12.0 12.9 11.4 High school 18.1 20.9 15.7 17.6 18.1 1.0 1.7 0.9 0.8 0.7 17.0 19.3 14.9 16.8 17.4
Region Northeast 8.1 8.8 7.7 8.2 7.4 0.4 0.8 0.2 0.2 0.5 7.7 8.0 7.5 8.0 6.9 Southeast 9.2 9.1 13.6 7.2 7.0 0.4 0.6 0.6 0.1 0.3 8.8 8.5 13.0 7.1 6.7 Central 9.5 13.7 5.9 9.4 9.6 0.8 1.8 0.4 0.2 0.7 8.8 11.9 5.5 9.2 8.9 West 12.2 13.1 8.7 15.5 12.1 0.5 0.7 0.3 0.6 0.3 11.6 12.4 8.4 14.8 11.8
School enrollment Less than 300 10.7 � � 17.1 11.2 0.6 � � 1.8 0.3 10.1 � � 15.3 10.9 300�999 7.3 8.0 5.2 8.3 8.0 0.4 0.8 0.2 0.1 0.5 6.9 7.3 5.0 8.2 7.5 1,000 or more 16.9 18.2 17.0 15.3 � 0.9 1.3 0.8 0.3 � 16.0 16.8 16.3 15.0 �
Minority enrollment Less than 5 percent 6.9 � 4.6 7.6 7.3 0.2 � 0.1 0.1 0.3 6.7 � 4.4 7.6 7.0 5�19 percent 8.7 7.4 8.1 11.1 8.0 0.4 0.5 0.2 0.7 0.2 8.3 6.9 7.9 10.4 7.8 20�49 percent 10.2 11.6 9.7 9.7 8.9 0.5 0.9 0.4 0.3 0.4 9.7 10.8 9.3 9.4 8.5 50 percent or more 13.2 13.1 11.8 13.3 20.0 1.0 1.2 0.8 0.1 1.6 12.3 12.0 11.1 13.2 18.4
Free/reduced-price lunch eligibility Less than 20 percent 8.1 9.1 6.8 9.9 8.0 0.3 0.5 0.2 0.2 0.3 7.9 8.6 6.6 9.7 7.8 21�34 percent 9.2 11.3 10.5 8.2 6.5 0.6 1.0 0.8 0.2 0.5 8.6 10.3 9.7 8.1 6.0 35�49 percent 10.7 13.7 10.3 9.4 9.6 0.5 1.2 0.2 0.2 0.4 10.2 12.5 10.1 9.2 9.2 50�74 percent 11.7 16.1 8.7 9.8 9.1 0.7 1.5 0.4 0.1 0.1 11.0 14.5 8.3 9.8 9.0 75 percent or more 11.2 9.2 � � � 0.8 0.6 � � � 10.4 8.6 � � �
�Fewer than 30 sample cases.
NOTE: Serious violent crimes include murder, rape or other type of sexual battery, suicide, physical attack or fight with a weapon, or robbery. Less serious violent or nonviolent crimes includephysical attack or fight without a weapon, theft/larceny, and vandalism. Any incidents refer to any of the crimes listed. Not included are any crimes not listed here and any crimes not reported topolice. Schools were asked to report crimes that took place in school buildings, on school buses, on school grounds, and at places holding school-sponsored events. Population size is 42,336,819public school students.
SOURCE: U.S. Department of Education, National Center for Education Statistics, Fast Response Survey System, �Principal/School Disciplinarian Survey on School Violence,� FRSS 63, 1997.64 Supplemental Tables
Any incidents Serious violent incidents Less serious violent or nonviolent incidents
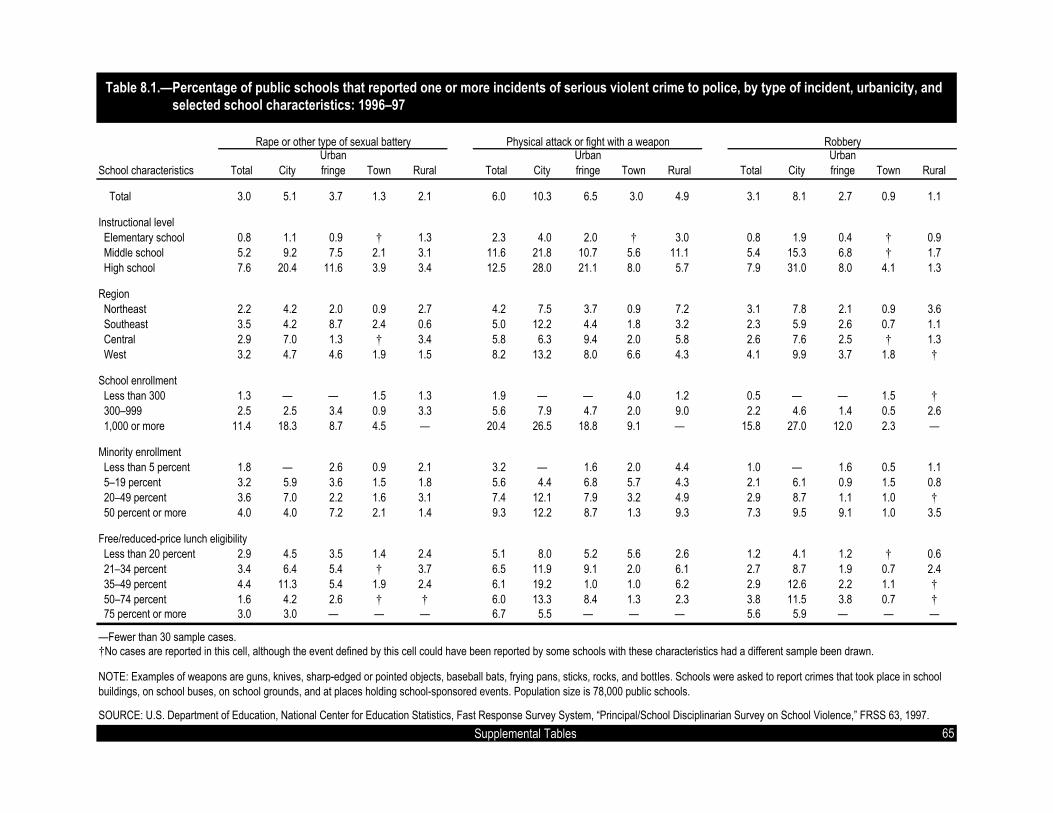
Table 8.1.�Percentage of public schools that reported one or more incidents of serious violent crime to police, by type of incident, urbanicity, and Table 9.1.�selected school characteristics: 1996�97
Urban Urban UrbanSchool characteristics Total City fringe Town Rural Total City fringe Town Rural Total City fringe Town Rural
Total 3.0 5.1 3.7 1.3 2.1 6.0 10.3 6.5 3.0 4.9 3.1 8.1 2.7 0.9 1.1
Instructional level Elementary school 0.8 1.1 0.9 � 1.3 2.3 4.0 2.0 � 3.0 0.8 1.9 0.4 � 0.9 Middle school 5.2 9.2 7.5 2.1 3.1 11.6 21.8 10.7 5.6 11.1 5.4 15.3 6.8 � 1.7 High school 7.6 20.4 11.6 3.9 3.4 12.5 28.0 21.1 8.0 5.7 7.9 31.0 8.0 4.1 1.3
Region Northeast 2.2 4.2 2.0 0.9 2.7 4.2 7.5 3.7 0.9 7.2 3.1 7.8 2.1 0.9 3.6 Southeast 3.5 4.2 8.7 2.4 0.6 5.0 12.2 4.4 1.8 3.2 2.3 5.9 2.6 0.7 1.1 Central 2.9 7.0 1.3 � 3.4 5.8 6.3 9.4 2.0 5.8 2.6 7.6 2.5 � 1.3 West 3.2 4.7 4.6 1.9 1.5 8.2 13.2 8.0 6.6 4.3 4.1 9.9 3.7 1.8 �
School enrollment Less than 300 1.3 � � 1.5 1.3 1.9 � � 4.0 1.2 0.5 � � 1.5 � 300�999 2.5 2.5 3.4 0.9 3.3 5.6 7.9 4.7 2.0 9.0 2.2 4.6 1.4 0.5 2.6 1,000 or more 11.4 18.3 8.7 4.5 � 20.4 26.5 18.8 9.1 � 15.8 27.0 12.0 2.3 �
Minority enrollment Less than 5 percent 1.8 � 2.6 0.9 2.1 3.2 � 1.6 2.0 4.4 1.0 � 1.6 0.5 1.1 5�19 percent 3.2 5.9 3.6 1.5 1.8 5.6 4.4 6.8 5.7 4.3 2.1 6.1 0.9 1.5 0.8 20�49 percent 3.6 7.0 2.2 1.6 3.1 7.4 12.1 7.9 3.2 4.9 2.9 8.7 1.1 1.0 � 50 percent or more 4.0 4.0 7.2 2.1 1.4 9.3 12.2 8.7 1.3 9.3 7.3 9.5 9.1 1.0 3.5
Free/reduced-price lunch eligibility Less than 20 percent 2.9 4.5 3.5 1.4 2.4 5.1 8.0 5.2 5.6 2.6 1.2 4.1 1.2 � 0.6 21�34 percent 3.4 6.4 5.4 � 3.7 6.5 11.9 9.1 2.0 6.1 2.7 8.7 1.9 0.7 2.4 35�49 percent 4.4 11.3 5.4 1.9 2.4 6.1 19.2 1.0 1.0 6.2 2.9 12.6 2.2 1.1 � 50�74 percent 1.6 4.2 2.6 � � 6.0 13.3 8.4 1.3 2.3 3.8 11.5 3.8 0.7 � 75 percent or more 3.0 3.0 � � � 6.7 5.5 � � � 5.6 5.9 � � �
�Fewer than 30 sample cases.�No cases are reported in this cell, although the event defined by this cell could have been reported by some schools with these characteristics had a different sample been drawn.
NOTE: Examples of weapons are guns, knives, sharp-edged or pointed objects, baseball bats, frying pans, sticks, rocks, and bottles. Schools were asked to report crimes that took place in schoolbuildings, on school buses, on school grounds, and at places holding school-sponsored events. Population size is 78,000 public schools.
SOURCE: U.S. Department of Education, National Center for Education Statistics, Fast Response Survey System, �Principal/School Disciplinarian Survey on School Violence,� FRSS 63, 1997.65
Rape or other type of sexual battery Physical attack or fight with a weapon Robbery
Supplemental Tables
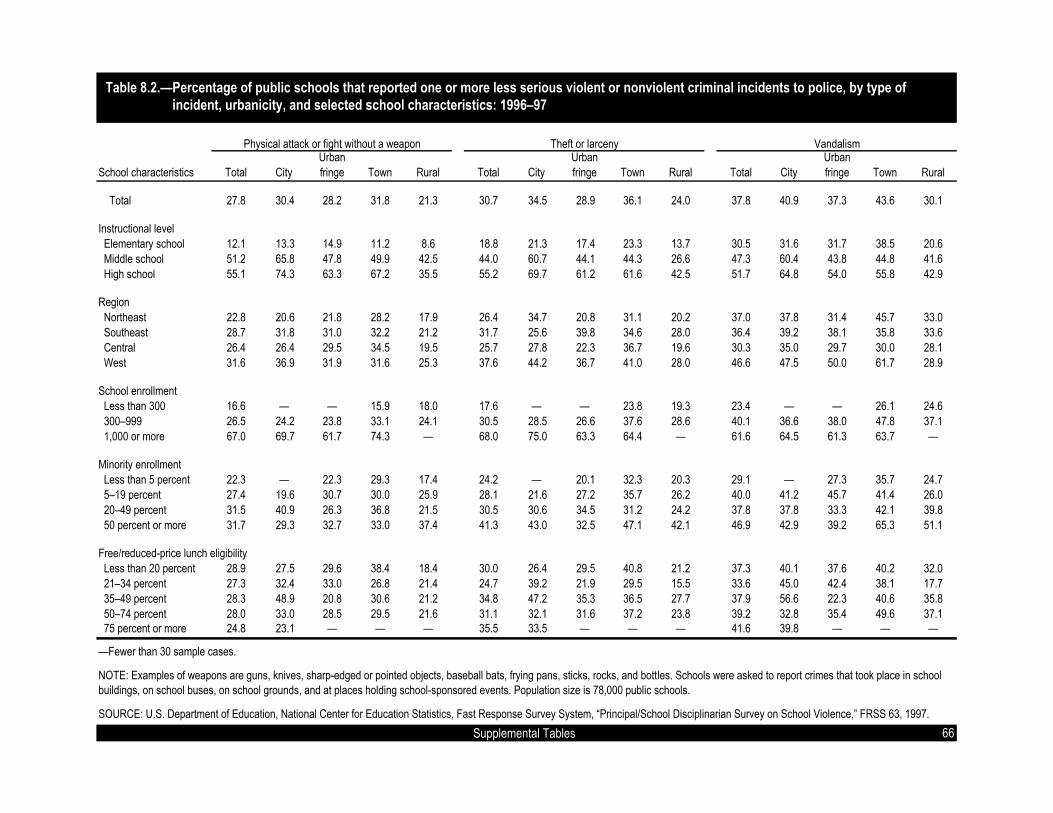
Table 8.2.�Percentage of public schools that reported one or more less serious violent or nonviolent criminal incidents to police, by type of Table 9.2.�incident, urbanicity, and selected school characteristics: 1996�97
Urban Urban UrbanSchool characteristics Total City fringe Town Rural Total City fringe Town Rural Total City fringe Town Rural
Total 27.8 30.4 28.2 31.8 21.3 30.7 34.5 28.9 36.1 24.0 37.8 40.9 37.3 43.6 30.1
Instructional level Elementary school 12.1 13.3 14.9 11.2 8.6 18.8 21.3 17.4 23.3 13.7 30.5 31.6 31.7 38.5 20.6 Middle school 51.2 65.8 47.8 49.9 42.5 44.0 60.7 44.1 44.3 26.6 47.3 60.4 43.8 44.8 41.6 High school 55.1 74.3 63.3 67.2 35.5 55.2 69.7 61.2 61.6 42.5 51.7 64.8 54.0 55.8 42.9
Region Northeast 22.8 20.6 21.8 28.2 17.9 26.4 34.7 20.8 31.1 20.2 37.0 37.8 31.4 45.7 33.0 Southeast 28.7 31.8 31.0 32.2 21.2 31.7 25.6 39.8 34.6 28.0 36.4 39.2 38.1 35.8 33.6 Central 26.4 26.4 29.5 34.5 19.5 25.7 27.8 22.3 36.7 19.6 30.3 35.0 29.7 30.0 28.1 West 31.6 36.9 31.9 31.6 25.3 37.6 44.2 36.7 41.0 28.0 46.6 47.5 50.0 61.7 28.9
School enrollment Less than 300 16.6 � � 15.9 18.0 17.6 � � 23.8 19.3 23.4 � � 26.1 24.6 300�999 26.5 24.2 23.8 33.1 24.1 30.5 28.5 26.6 37.6 28.6 40.1 36.6 38.0 47.8 37.1 1,000 or more 67.0 69.7 61.7 74.3 � 68.0 75.0 63.3 64.4 � 61.6 64.5 61.3 63.7 �
Minority enrollment Less than 5 percent 22.3 � 22.3 29.3 17.4 24.2 � 20.1 32.3 20.3 29.1 � 27.3 35.7 24.7 5�19 percent 27.4 19.6 30.7 30.0 25.9 28.1 21.6 27.2 35.7 26.2 40.0 41.2 45.7 41.4 26.0 20�49 percent 31.5 40.9 26.3 36.8 21.5 30.5 30.6 34.5 31.2 24.2 37.8 37.8 33.3 42.1 39.8 50 percent or more 31.7 29.3 32.7 33.0 37.4 41.3 43.0 32.5 47.1 42.1 46.9 42.9 39.2 65.3 51.1
Free/reduced-price lunch eligibility Less than 20 percent 28.9 27.5 29.6 38.4 18.4 30.0 26.4 29.5 40.8 21.2 37.3 40.1 37.6 40.2 32.0 21�34 percent 27.3 32.4 33.0 26.8 21.4 24.7 39.2 21.9 29.5 15.5 33.6 45.0 42.4 38.1 17.7 35�49 percent 28.3 48.9 20.8 30.6 21.2 34.8 47.2 35.3 36.5 27.7 37.9 56.6 22.3 40.6 35.8 50�74 percent 28.0 33.0 28.5 29.5 21.6 31.1 32.1 31.6 37.2 23.8 39.2 32.8 35.4 49.6 37.1 75 percent or more 24.8 23.1 � � � 35.5 33.5 � � � 41.6 39.8 � � �
�Fewer than 30 sample cases.
NOTE: Examples of weapons are guns, knives, sharp-edged or pointed objects, baseball bats, frying pans, sticks, rocks, and bottles. Schools were asked to report crimes that took place in schoolbuildings, on school buses, on school grounds, and at places holding school-sponsored events. Population size is 78,000 public schools.
SOURCE: U.S. Department of Education, National Center for Education Statistics, Fast Response Survey System, �Principal/School Disciplinarian Survey on School Violence,� FRSS 63, 1997.66 Supplemental Tables
Physical attack or fight without a weapon Theft or larceny Vandalism

Table 8.3.�Number of public schools that reported one or more incidents of serious violent crime to police, by type of incident, urbanicity, and Table 9.3.�selected school characteristics: 1996�97
Urban Urban UrbanSchool characteristics Total City fringe Town Rural Total City fringe Town Rural Total City fringe Town Rural
Total 2,326 912 707 256 451 4,695 1,845 1,230 580 1,039 2,389 1,461 520 171 237
Instructional level Elementary school 404 141 115 � 149 1,108 499 254 � 355 395 239 53 � 103 Middle school 731 281 265 91 93 1,626 665 379 247 335 760 467 242 � 51 High school 1,192 491 328 164 209 1,960 681 597 334 349 1,235 755 226 171 83
Region Northeast 333 124 112 36 61 627 224 203 36 165 468 233 116 36 82 Southeast 595 155 290 120 31 850 456 146 90 158 394 220 85 36 52 Central 661 327 61 � 273 1,313 298 454 98 463 582 356 123 � 103 West 738 307 245 100 86 1,904 868 427 356 253 946 652 196 98 �
School enrollment Less than 300 255 � � 68 154 383 � � 187 135 101 � � 68 � 300�999 1,232 334 473 128 297 2,804 1,051 658 273 821 1,123 619 194 73 237 1,000 or more 840 545 235 60 � 1,508 794 512 120 � 1,166 810 326 30 �
Minority enrollment Less than 5 percent 430 � 97 66 247 773 � 61 158 515 231 � 61 36 133 5�19 percent 557 210 223 68 56 974 156 418 265 136 366 215 57 68 26 20�49 percent 636 341 116 62 117 1,320 589 424 121 185 520 424 59 36 � 50 percent or more 704 342 272 60 31 1,628 1,060 328 36 203 1,273 822 344 30 78
Free/reduced-price lunch eligibility Less than 20 percent 531 123 244 66 98 946 218 359 261 108 222 110 86 � 26 21�34 percent 589 167 217 � 205 1,120 308 368 100 344 473 226 77 36 133 35�49 percent 566 250 138 62 117 785 426 26 32 301 373 279 57 36 � 50�74 percent 250 166 85 � � 959 528 271 60 100 607 456 121 30 � 75 percent or more 373 191 � � � 844 349 � � � 698 373 � � �
�Fewer than 30 sample cases.�No cases are reported in this cell, although the event defined by this cell could have been reported by some schools with these characteristics had a different sample been drawn.
NOTE: Examples of weapons are guns, knives, sharp-edged or pointed objects, baseball bats, frying pans, sticks, rocks, and bottles. Schools were asked to report crimes that took place in schoolbuildings, on school buses, on school grounds, and at places holding school-sponsored events. Population size is 78,000 public schools. Because of rounding or missing data, detail may not addto totals.
SOURCE: U.S. Department of Education, National Center for Education Statistics, Fast Response Survey System, �Principal/School Disciplinarian Survey on School Violence,� FRSS 63, 1997.67 Supplemental Tables
Physical attack or fight with a weaponRape or other type of sexual battery Robbery

Table 8.4.�Number of public schools that reported one or more less serious violent or nonviolent criminal incidents to police, by type of incident, Table 9.4.�urbanicity, and selected school characteristics: 1996�97
Physical attack or fight without a weapon Theft or larceny VandalismUrban Urban Urban
School characteristics Total City fringe Town Rural Total City fringe Town Rural Total City fringe Town Rural
Total 21,600 5,500 5,400 6,200 4,500 23,800 6,200 5,400 7,100 5,100 29,300 7,400 7,000 8,500 6,400
Instructional level Elementary school 5,800 1,700 1,900 1,200 1,000 9,000 2,700 2,200 2,600 1,600 14,600 3,900 4,000 4,200 2,400 Middle school 7,200 2,000 1,700 2,200 1,300 6,200 1,900 1,600 1,900 800 6,600 1,800 1,600 2,000 1,300 High school 8,600 1,800 1,800 2,800 2,200 8,600 1,700 1,700 2,600 2,600 8,100 1,600 1,500 2,300 2,600
Region Northeast 3,400 600 1,200 1,200 400 4,000 1,000 1,100 1,300 500 5,600 1,100 1,700 2,000 800 Southeast 4,900 1,200 1,000 1,600 1,000 5,400 1,000 1,300 1,700 1,400 6,200 1,500 1,300 1,800 1,700 Central 5,900 1,200 1,400 1,700 1,500 5,800 1,300 1,100 1,800 1,600 6,800 1,600 1,400 1,500 2,200 West 7,300 2,400 1,700 1,700 1,500 8,700 2,900 1,900 2,200 1,700 10,700 3,100 2,600 3,300 1,700
School enrollment Less than 300 3,400 � � 700 2,100 3,600 � � 1,100 2,200 4,700 � � 1,200 2,800 300�999 13,300 3,200 3,300 4,500 2,200 15,200 3,800 3,700 5,100 2,600 20,000 4,900 5,200 6,500 3,400 1,000 or more 4,900 2,100 1,700 1,000 � 5,000 2,200 1,700 900 � 4,500 1,900 1,700 800 �
Minority enrollment Less than 5 percent 5,400 � 800 2,300 2,000 5,900 � 700 2,500 2,400 7,000 � 1,000 2,800 2,900 5�19 percent 4,800 700 1,900 1,400 800 4,900 800 1,700 1,700 800 7,000 1,500 2,800 1,900 800 20�49 percent 5,600 2,000 1,400 1,400 800 5,400 1,500 1,800 1,200 900 6,700 1,800 1,800 1,600 1,500 50 percent or more 5,500 2,500 1,200 1,000 800 7,200 3,700 1,200 1,400 900 8,200 3,700 1,400 1,900 1,100
Free/reduced-price lunch eligibility Less than 20 percent 5,300 700 2,100 1,800 800 5,500 700 2,100 1,900 900 6,900 1,100 2,600 1,800 1,300 21�34 percent 4,700 800 1,300 1,400 1,200 4,300 1,000 900 1,500 900 5,800 1,200 1,700 1,900 1,000 35�49 percent 3,700 1,100 500 1,000 1,000 4,500 1,000 900 1,200 1,300 4,900 1,300 600 1,300 1,700 50�74 percent 4,500 1,300 900 1,300 1,000 5,000 1,300 1,000 1,700 1,100 6,200 1,300 1,100 2,200 1,600 75 percent or more 3,100 1,500 � � � 4,400 2,100 � � � 5,200 2,500 � � �
�Fewer than 30 sample cases.
NOTE: Examples of weapons are guns, knives, sharp-edged or pointed objects, baseball bats, frying pans, sticks, rocks, and bottles. Schools were asked to report crimes that took place in schoolbuildings, on school buses, on school grounds, and at places holding school-sponsored events. Population size is 78,000 public schools. Because of rounding or missing data, detail may not addto totals. Numbers are rounded to the nearest 100.
SOURCE: U.S. Department of Education, National Center for Education Statistics, Fast Response Survey System, �Principal/School Disciplinarian Survey on School Violence,� FRSS 63, 1997.68 Supplemental Tables

Table 8.5.�Number of serious violent criminal incidents occurring in public schools reported to police, by type of incident, urbanicity, and selected Table 9.5.�school characteristics: 1996�97
Urban Urban UrbanSchool characteristics Total City fringe Town Rural Total City fringe Town Rural Total City fringe Town Rural
Total 4,200 1,900 1,100 300 800 11,000 5,400 2,100 1,700 1,800 7,200 4,500 1,500 600 500
Instructional level Elementary school 700 300 100 � 300 1,600 900 300 � 500 400 200 100 � 100 Middle school 1,400 600 600 100 200 4,100 2,700 600 300 500 2,300 1,900 300 � 100 High school 2,100 1,100 500 200 400 5,300 1,800 1,200 1,400 800 4,400 2,400 1,200 600 300
Region Northeast 500 200 200 � 100 1,100 600 300 � 200 1,600 900 200 300 200 Southeast 1,200 400 500 200 200 1,600 900 500 100 200 1,300 300 700 � 300 Central 1,200 600 100 � 500 4,300 2,400 500 200 1,100 2,100 1,600 400 � 100 West 1,300 700 400 100 100 3,900 1,600 700 1,300 400 2,200 1,600 300 300 �
School enrollment Less than 300 300 � � 100 200 1,400 � � 1,000 300 200 � � 200 � 300�999 2,000 600 700 100 600 5,700 3,300 700 300 1,400 3,000 1,900 300 300 500 1,000 or more 1,800 1,300 500 100 � 3,900 2,100 1,300 400 � 3,900 2,600 1,300 100 �
Minority enrollment Less than 5 percent 700 � 100 100 500 900 � 100 200 600 300 � 100 � 200 5�19 percent 800 400 300 100 100 2,400 400 600 1,300 100 600 300 100 200 100 20�49 percent 1,500 800 300 100 200 2,200 1,100 600 200 300 1,500 900 300 300 � 50 percent or more 1,200 700 400 100 � 5,400 3,900 700 � 800 4,800 3,400 1,100 100 300
Free/reduced-price lunch eligibility Less than 20 percent 800 300 300 100 200 1,400 300 400 500 200 700 300 300 � 100 21�34 percent 1,100 400 400 � 400 2,400 900 1,000 100 400 1,500 700 600 � 200 35�49 percent 1,000 500 100 100 200 1,500 1,000 � � 400 900 500 100 300 � 50�74 percent 600 400 200 � � 2,900 2,300 500 100 100 2,000 1,700 200 100 � 75 percent or more 600 400 � � � 2,700 900 � � � 2,000 1,200 � � �
�Fewer than 30 sample cases.�No cases are reported in this cell, although the event defined by this cell could have been reported by some schools with these characteristics had a different sample been drawn.�Values are less than 50.
NOTE: Examples of weapons are guns, knives, sharp-edged or pointed objects, baseball bats, frying pans, sticks, rocks, and bottles. Schools were asked to report crimes that took place in schoolbuildings, on school buses, on school grounds, and at places holding school-sponsored events. Because of rounding or missing data, detail may not add to totals. Numbers are rounded to thenearest 100.
SOURCE: U.S. Department of Education, National Center for Education Statistics, Fast Response Survey System, �Principal/School Disciplinarian Survey on School Violence,� FRSS 63, 1997.69
Rape or other type of sexual battery RobberyPhysical attack or fight with a weapon
Supplemental Tables

Table 8.6.�Number of less serious violent or nonviolent criminal incidents occurring in public schools reported to police, by type of incident, Table 9.6.�urbanicity, and selected school characteristics: 1996�97
Urban Urban UrbanSchool characteristics Total City fringe Town Rural Total City fringe Town Rural Total City fringe Town Rural
Total 187,900 62,100 54,800 46,300 24,700 115,500 39,900 28,300 29,000 18,300 98,500 32,700 22,800 25,700 17,200
Instructional level Elementary school 21,500 2,900 8,300 7,400 3,000 19,500 5,700 6,400 4,600 2,900 34,800 9,000 10,800 10,000 5,000 Middle school 73,300 34,100 19,100 14,700 5,400 31,500 12,300 8,100 7,700 3,400 23,800 9,400 4,000 7,000 3,400 High school 93,100 25,200 27,400 24,300 16,300 64,600 22,000 13,800 16,700 12,100 39,900 14,300 8,000 8,700 8,900
Region Northeast 29,100 8,800 12,200 5,000 3,000 18,100 4,000 6,000 5,500 2,600 17,100 4,400 4,700 6,700 1,200 Southeast 50,700 9,800 22,700 11,400 6,800 23,300 7,400 6,400 5,300 4,200 17,300 5,600 3,900 3,700 4,200 Central 45,600 18,300 8,200 10,900 8,200 23,000 7,500 4,200 6,000 5,300 18,600 4,400 3,000 4,400 6,700 West 62,500 25,200 11,700 19,000 6,700 51,200 21,100 11,700 12,200 6,200 45,500 18,300 11,200 10,900 5,000
School enrollment Less than 300 15,600 � � 5,800 8,200 9,900 � � 3,200 6,100 12,300 � � 4,200 6,900 300�999 87,900 27,500 18,400 27,600 14,500 51,400 13,500 9,900 17,400 10,700 54,000 15,100 11,600 17,300 10,000 1,000 or more 84,400 34,200 35,300 12,900 � 54,200 25,900 18,300 8,400 � 32,200 16,700 11,000 4,200 �
Minority enrollment Less than 5 percent 24,300 � 3,100 11,200 8,300 21,400 � 3,400 8,100 8,700 18,700 � 2,400 7,500 8,100 5�19 percent 35,600 5,500 15,600 10,500 3,900 29,400 5,800 10,500 9,500 3,600 19,700 3,400 8,000 6,700 1,600 20�49 percent 54,000 16,800 17,500 13,400 6,200 25,900 11,000 8,800 3,000 3,100 18,500 7,300 4,000 3,700 3,400 50 percent or more 72,600 38,100 18,500 9,800 6,200 34,800 21,500 5,500 4,900 2,900 40,400 21,400 8,500 6,600 4,000
Free/reduced-price lunch eligibility Less than 20 percent 40,000 6,400 16,100 12,900 4,500 29,500 7,200 10,100 8,300 3,900 19,300 3,600 7,100 5,500 3,200 21�34 percent 34,900 8,800 13,800 7,300 5,000 26,100 7,400 6,200 8,100 4,400 17,700 4,700 4,900 5,600 2,500 35�49 percent 33,300 10,700 8,700 7,200 6,800 21,600 6,500 5,100 5,100 4,900 14,700 4,400 1,600 4,000 4,800 50�74 percent 45,900 22,900 9,200 10,100 3,700 22,400 10,600 4,500 4,800 2,500 20,100 8,000 2,500 6,400 3,300 75 percent or more 28,800 13,200 � � � 15,800 8,200 � � � 25,800 12,000 � � �
�Fewer than 30 sample cases.
NOTE: Examples of weapons are guns, knives, sharp-edged or pointed objects, baseball bats, frying pans, sticks, rocks, and bottles. Schools were asked to report crimes that took place in schoolbuildings, on school buses, on school grounds, and at places holding school-sponsored events. Because of rounding or missing data, detail may not add to totals. Numbers are rounded to thenearest 100.
SOURCE: U.S. Department of Education, National Center for Education Statistics, Fast Response Survey System, �Principal/School Disciplinarian Survey on School Violence,� FRSS 63, 1997.70
Physical attack or fight without a weapon Theft or larceny Vandalism
Supplemental Tables
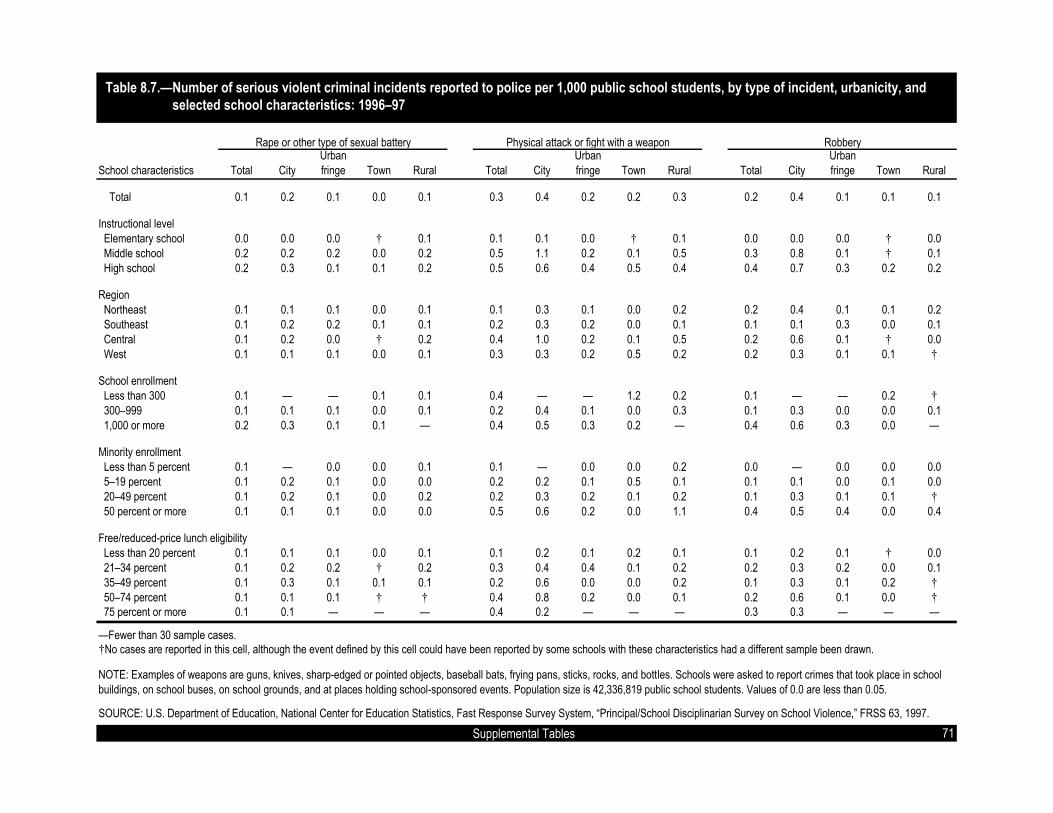
Table 8.7.�Number of serious violent criminal incidents reported to police per 1,000 public school students, by type of incident, urbanicity, and Table 9.7.�selected school characteristics: 1996�97
Urban Urban UrbanSchool characteristics Total City fringe Town Rural Total City fringe Town Rural Total City fringe Town Rural
Total 0.1 0.2 0.1 0.0 0.1 0.3 0.4 0.2 0.2 0.3 0.2 0.4 0.1 0.1 0.1
Instructional level Elementary school 0.0 0.0 0.0 � 0.1 0.1 0.1 0.0 � 0.1 0.0 0.0 0.0 � 0.0 Middle school 0.2 0.2 0.2 0.0 0.2 0.5 1.1 0.2 0.1 0.5 0.3 0.8 0.1 � 0.1 High school 0.2 0.3 0.1 0.1 0.2 0.5 0.6 0.4 0.5 0.4 0.4 0.7 0.3 0.2 0.2
Region Northeast 0.1 0.1 0.1 0.0 0.1 0.1 0.3 0.1 0.0 0.2 0.2 0.4 0.1 0.1 0.2 Southeast 0.1 0.2 0.2 0.1 0.1 0.2 0.3 0.2 0.0 0.1 0.1 0.1 0.3 0.0 0.1 Central 0.1 0.2 0.0 � 0.2 0.4 1.0 0.2 0.1 0.5 0.2 0.6 0.1 � 0.0 West 0.1 0.1 0.1 0.0 0.1 0.3 0.3 0.2 0.5 0.2 0.2 0.3 0.1 0.1 �
School enrollment Less than 300 0.1 � � 0.1 0.1 0.4 � � 1.2 0.2 0.1 � � 0.2 � 300�999 0.1 0.1 0.1 0.0 0.1 0.2 0.4 0.1 0.0 0.3 0.1 0.3 0.0 0.0 0.1 1,000 or more 0.2 0.3 0.1 0.1 � 0.4 0.5 0.3 0.2 � 0.4 0.6 0.3 0.0 �
Minority enrollment Less than 5 percent 0.1 � 0.0 0.0 0.1 0.1 � 0.0 0.0 0.2 0.0 � 0.0 0.0 0.0 5�19 percent 0.1 0.2 0.1 0.0 0.0 0.2 0.2 0.1 0.5 0.1 0.1 0.1 0.0 0.1 0.0 20�49 percent 0.1 0.2 0.1 0.0 0.2 0.2 0.3 0.2 0.1 0.2 0.1 0.3 0.1 0.1 � 50 percent or more 0.1 0.1 0.1 0.0 0.0 0.5 0.6 0.2 0.0 1.1 0.4 0.5 0.4 0.0 0.4
Free/reduced-price lunch eligibility Less than 20 percent 0.1 0.1 0.1 0.0 0.1 0.1 0.2 0.1 0.2 0.1 0.1 0.2 0.1 � 0.0 21�34 percent 0.1 0.2 0.2 � 0.2 0.3 0.4 0.4 0.1 0.2 0.2 0.3 0.2 0.0 0.1 35�49 percent 0.1 0.3 0.1 0.1 0.1 0.2 0.6 0.0 0.0 0.2 0.1 0.3 0.1 0.2 � 50�74 percent 0.1 0.1 0.1 � � 0.4 0.8 0.2 0.0 0.1 0.2 0.6 0.1 0.0 � 75 percent or more 0.1 0.1 � � � 0.4 0.2 � � � 0.3 0.3 � � �
�Fewer than 30 sample cases.�No cases are reported in this cell, although the event defined by this cell could have been reported by some schools with these characteristics had a different sample been drawn.
NOTE: Examples of weapons are guns, knives, sharp-edged or pointed objects, baseball bats, frying pans, sticks, rocks, and bottles. Schools were asked to report crimes that took place in schoolbuildings, on school buses, on school grounds, and at places holding school-sponsored events. Population size is 42,336,819 public school students. Values of 0.0 are less than 0.05.
SOURCE: U.S. Department of Education, National Center for Education Statistics, Fast Response Survey System, �Principal/School Disciplinarian Survey on School Violence,� FRSS 63, 1997.71
Rape or other type of sexual battery Physical attack or fight with a weapon Robbery
Supplemental Tables

Table 8.8.�Number of less serious violent or nonviolent criminal incidents reported to police per 1,000 public school students, by type of incident, Table 9.8.�urbanicity, and selected school characteristics: 1996�97
Urban Urban UrbanSchool characteristics Total City fringe Town Rural Total City fringe Town Rural Total City fringe Town Rural
Total 4.4 4.9 4.4 4.6 3.5 2.7 3.2 2.3 2.9 2.6 2.3 2.6 1.8 2.5 2.4
Instructional level Elementary school 1.0 0.4 1.2 1.5 0.8 0.9 0.8 1.0 0.9 0.7 1.6 1.3 1.6 2.0 1.3 Middle school 8.7 13.8 7.4 6.4 5.1 3.7 5.0 3.1 3.4 3.2 2.8 3.8 1.5 3.1 3.1 High school 8.0 7.9 8.3 8.2 7.6 5.6 6.9 4.2 5.7 5.6 3.4 4.5 2.4 2.9 4.2
Region Northeast 3.5 4.1 4.0 2.3 3.0 2.2 1.9 1.9 2.6 2.6 2.0 2.1 1.5 3.1 1.2 Southeast 4.9 3.6 8.9 4.0 3.0 2.3 2.7 2.5 1.9 1.9 1.7 2.1 1.5 1.3 1.9 Central 4.6 7.2 2.9 4.7 3.6 2.3 2.9 1.5 2.6 2.3 1.9 1.7 1.1 1.9 3.0 West 4.6 4.8 2.8 6.7 4.4 3.7 4.0 2.8 4.3 4.1 3.3 3.5 2.7 3.8 3.3
School enrollment Less than 300 4.2 � � 6.7 4.2 2.6 � � 3.7 3.1 3.3 � � 4.9 3.6 300�999 3.1 3.6 2.3 3.6 3.1 1.8 1.8 1.2 2.3 2.3 1.9 2.0 1.5 2.3 2.1 1,000 or more 7.9 7.5 8.9 7.6 � 5.1 5.7 4.6 4.9 � 3.0 3.7 2.8 2.5 �
Minority enrollment Less than 5 percent 2.5 � 1.6 3.2 2.3 2.2 � 1.7 2.3 2.4 2.0 � 1.2 2.1 2.3 5�19 percent 3.5 2.6 3.6 4.1 3.3 2.9 2.7 2.4 3.7 3.1 1.9 1.6 1.8 2.6 1.4 20�49 percent 5.3 5.2 5.4 6.3 4.2 2.5 3.4 2.7 1.4 2.1 1.8 2.3 1.2 1.7 2.3 50 percent or more 6.0 5.6 6.3 6.1 8.7 2.9 3.2 1.9 3.0 4.1 3.4 3.2 2.9 4.1 5.6
Free/reduced-price lunch eligibility Less than 20 percent 3.5 3.2 3.2 4.7 3.0 2.6 3.6 2.0 3.0 2.6 1.7 1.8 1.4 2.0 2.1 21�34 percent 3.8 4.3 5.3 2.8 2.5 2.8 3.6 2.4 3.1 2.2 1.9 2.3 1.9 2.1 1.3 35�49 percent 4.9 6.2 5.7 4.1 3.8 3.2 3.8 3.4 2.9 2.7 2.2 2.5 1.0 2.3 2.7 50�74 percent 5.7 8.0 4.7 4.6 3.5 2.8 3.7 2.3 2.2 2.4 2.5 2.8 1.3 2.9 3.1 75 percent or more 4.3 3.4 � � � 2.3 2.1 � � � 3.8 3.1 � � �
�Fewer than 30 sample cases.
NOTE: Examples of weapons are guns, knives, sharp-edged or pointed objects, baseball bats, frying pans, sticks, rocks, and bottles. Schools were asked to report crimes that took place in schoolbuildings, on school buses, on school grounds, and at places holding school-sponsored events. Population size is 42,336,819 public school students.
SOURCE: U.S. Department of Education, National Center for Education Statistics, Fast Response Survey System, �Principal/School Disciplinarian Survey on School Violence,� FRSS 63, 1997.
72 Supplemental Tables
Physical attack or fight without a weapon Theft or larceny Vandalism

Table 9.1.�Number of nonfatal crimes against teachers and average annual number of crimes per 1,000 teachers at school, by type of crime and Table 9.1.�selected teacher characteristics: Aggregated from 1995 to 1999
Serious SeriousTeacher characteristics Total Theft Violent violent Total Theft Violent violent
Total 1,707,800 1,073,200 634,700 68,700 79 50 29 3
Instructional level Elementary 599,200 424,000 175,200 41,100 53 38 16 4 Middle/junior high 516,800 284,600 232,200 15,300 119 66 54 4 Senior high 591,900 364,600 227,300 12,300 99 61 38 2
Gender Male 501,300 229,300 272,100 27,400 95 43 51 5 Female 1,206,500 843,900 362,600 41,300 74 52 22 3
Race/ethnicity White, non-Hispanic 1,451,500 913,300 538,200 56,100 82 52 30 3 Black, non-Hispanic 119,700 77,600 42,200 12,600 59 38 21 6 Hispanic 112,500 63,200 49,200 � 92 52 40 � Other, non-Hispanic 7,900 7,900 � � 24 24 � �
Urbanicity2
Urban 969,200 582,200 387,000 37,500 97 58 39 4 Suburban 474,600 325,400 149,200 19,600 70 48 22 3 Rural 205,000 127,500 77,600 7,400 54 34 20 2�No cases were reported in this cell, although the crime defined by the cell could have happened to some teachers with these characteristics if a different sample had been drawn.1The estimate was based on fewer than 10 cases.2Teachers teaching in more than one school in different locales are not included.
NOTE: Serious violent crimes include rape, sexual assault, robbery, and aggravated assault. Violent crimes include serious violent crimes and simple assault. Total crimes include violent crimes andtheft. �At school� includes inside the school building, on school property, at work site, or while working. For thefts, �while working� was not considered since thefts of teachers� property kept at schoolcan occur when teachers are not present. The data were aggregated from 1995 to 1999 due to the small number of teachers in each year�s sample. On average, there were about 4.3 million teachersper year over the 5-year period for a total population size of 21,533,739 teachers. The average annual number of full-time-equivalent teachers is approximately 2.9 million, based on estimates fromthe U.S. Department of Education, National Center for Education Statistics, Schools and Staffing Survey 1993 to 1994. The population reported here includes part-time teachers as well as otherinstructional and support staff. Because of rounding or missing data, detail may not add to totals. Total crime numbers are rounded to the nearest 100.
SOURCE: U.S. Department of Justice, Bureau of Justice Statistics, National Crime Victimization Survey, 1995 to 1999.
73
Total crimes from 1995 to 1999 Average annual number of crimes per 1,000 teachers
Supplemental Tables
1
1
1
1 1
1
1
1
1
1
11
1
1

Table 10.1.�Percentage and number of teachers who reported that they were threatened with injury or that they were physically attacked by Table 11.1.�a student during the past 12 months, by urbanicity and selected teacher and school characteristics: 1993�94 school year
Urban Small Urban Small Urban Small Urban SmallCentral fringe/ town/ Central fringe/ town/ Central fringe/ town/ Central fringe/ town/
Selected characteristics Total city large town rural Total city large town rural Total city large town rural Total city large town rural
Total 11.7 15.1 10.7 9.8 341,000 132,100 99,600 109,300 4.1 5.6 4.0 3.1 119,200 48,100 37,000 34,100
Gender Male 14.7 19.5 14.0 11.8 115,900 45,100 33,800 37,000 3.9 5.8 3.6 2.7 30,800 13,500 8,800 8,500 Female 10.5 13.5 9.5 9.1 225,100 87,000 65,800 72,400 4.2 5.4 4.1 3.3 88,400 34,600 28,200 25,700
Race/ethnicity White, non-Hispanic 11.5 15.4 10.5 9.9 294,300 103,900 88,400 102,000 4.1 5.7 3.9 3.1 102,700 37,900 32,800 32,000 Black, non-Hispanic 11.9 13.0 12.6 8.5 23,600 14,600 5,300 3,700 3.9 4.2 4.3 2.4 7,700 4,800 1,900 1,000 Hispanic 13.1 15.3 10.6 10.1 15,800 10,200 3,400 2,200 5.2 6.4 4.3 2.7 6,100 4,200 1,300 500 Other, non-Hispanic 13.4 16.9 13.0 9.4 7,300 3,300 2,500 1,400 5.2 6.6 5.0 3.6 2,800 1,200 1,000 500
Teacher level Elementary 8.7 11.7 7.4 7.3 133,600 56,300 35,900 41,400 4.9 6.5 4.6 3.8 75,400 31,100 22,400 22,000 Secondary 15.0 19.3 14.2 12.5 207,400 75,800 63,700 67,900 3.2 4.3 3.2 2.2 43,800 17,000 14,600 12,200
Control Public 12.8 17.8 11.6 10.2 325,400 126,800 92,600 106,000 4.4 6.4 4.2 3.2 110,700 45,100 32,900 32,600 Private 4.2 3.3 5.0 4.6 15,600 5,300 7,000 3,300 2.3 1.9 2.9 2.1 8,500 3,000 4,000 1,500
NOTE: Population size is 2,940,000 teachers. Because of rounding or missing data, detail may not add to totals. Numbers are rounded to the nearest 100.
SOURCE: U.S. Department of Education, National Center for Education Statistics, Schools and Staffing Survey, 1993�94 (Teacher and School Questionnaires).
74
Teachers threatened with injury by a student Teachers physically attacked by a student
Supplemental Tables
Percent Number Percent Number
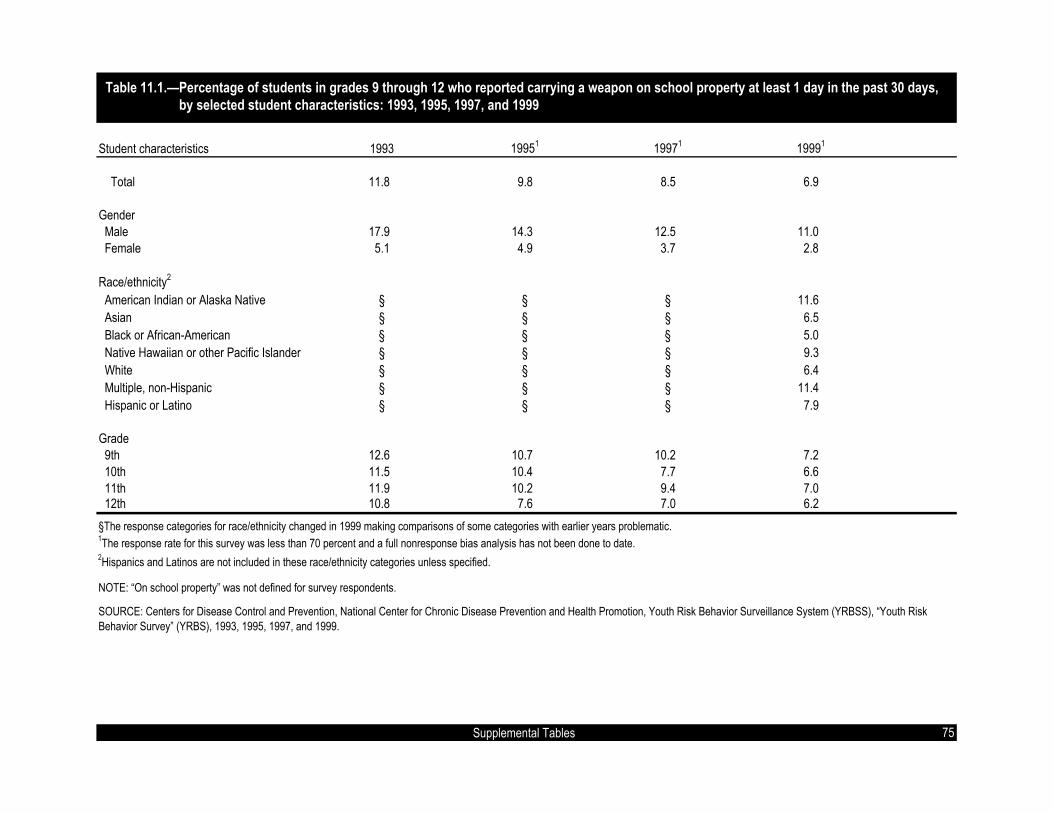
Table 11.1.�Percentage of students in grades 9 through 12 who reported carrying a weapon on school property at least 1 day in the past 30 days, Table 12.1.�by selected student characteristics: 1993, 1995, 1997, and 1999
Student characteristics 1993 19951 19971 19991
Total 11.8 9.8 8.5 6.9
Gender Male 17.9 14.3 12.5 11.0 Female 5.1 4.9 3.7 2.8
Race/ethnicity2
American Indian or Alaska Native § § § 11.6 Asian § § § 6.5 Black or African-American § § § 5.0 Native Hawaiian or other Pacific Islander § § § 9.3 White § § § 6.4 Multiple, non-Hispanic § § § 11.4 Hispanic or Latino § § § 7.9
Grade 9th 12.6 10.7 10.2 7.2 10th 11.5 10.4 7.7 6.6 11th 11.9 10.2 9.4 7.0 12th 10.8 7.6 7.0 6.2 §The response categories for race/ethnicity changed in 1999 making comparisons of some categories with earlier years problematic.1The response rate for this survey was less than 70 percent and a full nonresponse bias analysis has not been done to date.2Hispanics and Latinos are not included in these race/ethnicity categories unless specified.
NOTE: �On school property� was not defined for survey respondents.
SOURCE: Centers for Disease Control and Prevention, National Center for Chronic Disease Prevention and Health Promotion, Youth Risk Behavior Surveillance System (YRBSS), �Youth RiskBehavior Survey� (YRBS), 1993, 1995, 1997, and 1999.
75 Supplemental Tables

Table 11.2.�Percentage of students in grades 9 through 12 who reported carrying a weapon anywhere at least 1 day in the past 30 days, by Table 13.2.�selected student characteristics: 1993, 1995, 1997, and 1999
Student characteristics 1993 19951 19971 19991
Total 22.1 20.0 18.3 17.3
Gender Male 34.3 31.1 27.7 28.6 Female 9.2 8.3 7.0 6.0
Race/ethnicity2
American Indian or Alaska Native § § § 21.8 Asian § § § 13.0 Black or African-American § § § 17.2 Native Hawaiian or other Pacific Islander § § § 25.3 White § § § 16.4 Multiple, non-Hispanic § § § 22.2 Hispanic or Latino § § § 18.7
Grade 9th 25.5 22.6 22.6 17.6 10th 21.4 21.1 17.4 18.7 11th 21.5 20.3 18.2 16.1 12th 19.9 16.1 15.4 15.9 §The response categories for race/ethnicity changed in 1999 making comparisons of some categories with earlier years problematic.1The response rate for this survey was less than 70 percent and a full nonresponse bias analysis has not been done to date.2Hispanics and Latinos are not included in these race/ethnicity categories unless specified.
NOTE: The term �anywhere� is not used in the YRBS questionnaire. Rather, students are simply asked during the past 30 days, on how many days they carried a weapon.
SOURCE: Centers for Disease Control and Prevention, National Center for Chronic Disease Prevention and Health Promotion, Youth Risk Behavior Surveillance System (YRBSS), �Youth RiskBehavior Survey� (YRBS), 1993, 1995, 1997, and 1999.
76 Supplemental Tables

Table 12.1.�Percentage of students ages 12 through 18 who reported fearing being attacked or harmed at school or on the way to and from school Table 13.1.�during the previous 6 months, by selected student characteristics: 1989, 1995, and 1999
Feared attack or harm at school1 Feared attack or harm on the way to and from school1
Student characteristics1 19892 19951 19991 19892 19951 19991
Total 5.5 8.6 5.3 4.4 6.5 3.9
Gender Male 5.7 8.3 4.9 3.8 5.3 3.4 Female 5.4 8.9 5.7 5.1 7.9 4.5
Race/ethnicity White, non-Hispanic 4.4 6.3 3.9 2.8 3.8 2.1 Black, non-Hispanic 6.8 13.4 9.0 7.9 13.1 8.2 Hispanic 11.4 15.5 8.1 10.1 13.4 7.6 Other, non-Hispanic 8.0 9.4 4.2 6.0 8.2 3.8
Grade 6th 8.8 11.8 9.3 7.3 7.2 4.7 7th 9.4 11.0 7.5 6.4 8.9 4.7 8th 5.4 9.2 6.0 3.9 6.9 3.8 9th 5.0 9.1 5.2 4.5 6.2 3.6 10th 5.0 7.5 4.5 3.6 6.3 4.4 11th 3.4 5.8 3.3 3.8 5.5 3.0 12th 2.5 5.9 2.5 2.7 4.2 3.2
Urbanicity Urban 7.5 12.3 7.3 8.2 11.7 7.5 Suburban 4.8 7.4 4.9 3.5 5.1 2.9 Rural 4.8 7.0 3.8 2.2 4.0 1.8
Control Public 5.9 9.1 5.7 4.5 6.7 4.0 Private 1.7 3.3 1.7 4.3 5.0 2.81Includes students who reported that they sometimes or most of the time feared being victimized in this way.2Students ages 12 through 19.
NOTE: Comparisons between the 1989 data and the 1995 and 1999 data should be made with caution due to changes in the questionnaire. See appendix B for details. "At school" means in theschool building, on the school grounds, or on a school bus. Population sizes are 21,554,000 students ages 12 through 19 in 1989, 23,601,000 students ages 12 through 18 in 1995, and 24,614,000students ages 12 through 18 in 1999.
SOURCE: U.S. Department of Justice, Bureau of Justice Statistics, School Crime Supplement to the National Crime Victimization Survey, January�June 1989, 1995, and 1999.77 Supplemental Tables

Table 13.1.�Percentage of students ages 12 through 18 who reported that they avoided one or more places in school during the previous 6 Table 14.1.�months, by selected student characteristics: 1989, 1995, and 1999
Student characteristics 1989* 1995 1999
Total 5.1 8.7 4.6
Gender Male 5.1 8.8 4.6 Female 5.1 8.5 4.6
Race/ethnicity White, non-Hispanic 4.5 7.1 3.8 Black, non-Hispanic 6.8 12.1 6.7 Hispanic 6.5 12.9 6.2 Other, non-Hispanic 6.3 11.1 5.4
Grade 6th 6.9 11.6 5.9 7th 7.7 11.8 6.1 8th 4.7 8.8 5.5 9th 6.0 9.5 5.3 10th 4.3 7.8 4.7 11th 3.4 6.9 2.5 12th 3.3 4.1 2.4
Urbanicity Urban 6.9 11.7 5.8 Suburban 4.1 7.9 4.7 Rural 5.1 7.0 3.0
Control Public 5.4 9.3 5.0 Private 1.5 2.2 1.6*Students ages 12 through 19.
NOTE: Comparisons between the 1989 data and the 1995 and 1999 data should be made with caution due to changes in the questionnaire. See appendix B for details. Places include the entranceinto the school, any hallways or stairs in the school, parts of the school cafeteria, any school restrooms, and other places inside the school building. Population sizes are 21,554,000 students ages 12through 19 in 1989, 23,601,000 students ages 12 through 18 in 1995, and 24,614,000 students ages 12 through 18 in 1999.
SOURCE: U.S. Department of Justice, Bureau of Justice Statistics, School Crime Supplement to the National Crime Victimization Survey, January�June 1989, 1995, and 1999.78 Supplemental Tables

Table 14.1.�Percentage of students ages 12 through 18 who reported being targets of hate-related words or who saw hate-related graffiti at Table 16.1.�school during the previous 6 months, by selected student characteristics: 1999
Student characteristics Hate-related words Hate-related graffiti
Total 13.2 36.3
Gender Male 12.3 33.8 Female 14.3 38.9
Race/ethnicity White, non-Hispanic 12.6 36.4 Black, non-Hispanic 16.5 37.6 Hispanic 12.1 35.6 Other, non-Hispanic 15.5 32.2
Grade 6th 13.0 30.3 7th 15.7 34.9 8th 16.0 35.6 9th 13.2 39.2 10th 11.8 38.9 11th 10.5 37.0 12th 11.7 35.6
Urbanicity Urban 14.0 37.0 Suburban 13.3 37.3 Rural 12.2 32.7
Control Public 13.8 38.0 Private 8.1 20.7NOTE: �At school� means in the school building, on the school grounds, or on a school bus. Population size is 24,614,000 students ages 12 through 18 in 1999.
SOURCE: U.S. Department of Justice, Bureau of Justice Statistics, School Crime Supplement to the National Crime Victimization Survey, January�June 1999.
79 Supplemental Tables

Table 15.1.�Percentage of students ages 12 through 18 who reported that street gangs were present at school during the previous 6 months, Table 16.1.�by selected student characteristics: 1989, 1995, and 1999
Student characteristics 1989* 1995 1999
Total 15.3 28.5 17.3
Gender Male 15.8 29.1 17.5 Female 14.8 27.9 17.1
Race/ethnicity White, non-Hispanic 11.7 23.1 13.1 Black, non-Hispanic 19.8 35.2 24.7 Hispanic 31.6 50.2 28.3 Other, non-Hispanic 25.4 31.6 17.9
Grade 6th 10.3 15.7 9.2 7th 16.6 26.5 12.0 8th 13.6 28.8 12.9 9th 19.6 32.4 22.7 10th 16.0 33.6 22.1 11th 15.3 30.3 19.6 12th 14.2 27.3 20.0
Urbanicity Urban 24.8 40.7 25.1 Suburban 14.0 26.4 15.8 Rural 7.8 20.1 11.1
Control Public 16.4 30.7 18.6 Private 4.4 6.9 4.4 *Students ages 12 through 19.
NOTE: Comparisons between the 1989 data and the 1995 and 1999 data should be made with caution due to changes in the questionnaire. See appendix B for details. This indicator is based on anitem from earlier in the SCS questionnaire, before �at school� was defined for the respondent. Population sizes are 21,554,000 students ages 12 through 19 in 1989, 23,601,000 students ages 12through 18 in 1995, and 24,614,000 students ages 12 through 18 in 1999.
SOURCE: U.S. Department of Justice, Bureau of Justice Statistics, School Crime Supplement to the National Crime Victimization Survey, January�June 1989, 1995, and 1999.80 Supplemental Tables

Table 16.1.�Percentage and number of public schools that reported that 1 or more of 17 discipline issues* was a serious problem in their school, Table 17.1.�by urbanicity and selected school characteristics: 1996�97
School characteristics Total City Urban fringe Town Rural Total City Urban fringe Town Rural
Total 16.0 18.6 14.1 15.7 15.7 12,400 3,300 2,700 3,100 3,300
Instructional level Elementary school 8.4 11.7 6.6 6.2 9.1 4,100 1,500 800 700 1,100 Middle school 18.4 23.8 15.2 18.5 16.6 2,600 700 500 800 500 High school 36.9 47.3 46.1 37.9 28.0 5,800 1,200 1,300 1,600 1,700
Region Northeast 13.2 22.5 9.5 13.8 8.8 2,000 700 500 600 200 Southeast 18.4 18.7 15.3 20.1 18.5 3,100 700 500 1,000 900 Central 13.6 12.2 16.2 15.0 11.9 3,100 600 800 800 900 West 18.3 21.2 16.3 13.7 21.1 4,300 1,400 900 700 1,200
School size Less than 300 9.5 10.0 � 8.0 12.0 1,900 200 � 400 1,400 300�999 15.4 15.4 11.8 16.3 19.6 7,700 2,100 1,600 2,200 1,800 1,000 or more 37.6 37.4 38.3 37.2 34.7 2,800 1,100 1,000 500 100
Minority enrollment Less than 5 percent 10.3 5.5 7.1 13.8 9.4 2,500 � 300 1,100 1,100 5�19 percent 17.3 15.2 16.5 21.2 15.3 3,000 500 1,000 1,000 500 20�49 percent 17.0 17.5 12.8 13.0 26.2 3,000 900 700 500 1,000 50 percent or more 21.7 21.8 18.9 16.4 33.1 3,800 1,900 700 500 700
Free/reduced-price lunch eligibility Less than 20 percent 13.1 15.7 11.8 17.4 9.0 2,400 400 800 800 400 21�34 percent 15.6 22.9 17.0 15.4 11.4 2,700 600 700 800 600 35�49 percent 19.0 28.5 1.9 23.1 21.0 2,500 600 � 800 1,000 50�74 percent 16.0 14.0 25.4 9.3 17.8 2,600 600 800 400 800 75 percent or more 17.5 17.6 13.8 14.4 23.8 2,200 1,100 300 300 500
*Student tardiness, student absenteeism/class cutting, physical conflicts among students, robbery or theft of items worth over $10, vandalism of school property, student alcohol use, student druguse, sale of drugs on school grounds, student tobacco use, student possession of weapons, trespassing, verbal abuse of teachers, physical abuse of teachers, teacher absenteeism, teacher alcoholor drug use, racial tensions, and gangs.�No cases are reported in this cell, although the event defined by this cell could have been reported by some students with these characteristics had a different sample been drawn.�Values are less than 50.
NOTE: �At school� was not defined for the questionnaire respondent. Population size is 78,000 public schools. Because of rounding or missing data, detail may not add to totals. Numbers arerounded to the nearest 100.
SOURCE: U.S. Department of Education, National Center for Education Statistics, Fast Response Survey System, �Principal/School Disciplinarian Survey on School Violence,� FRSS 63, 1997.
81
Percent Number
Supplemental Tables
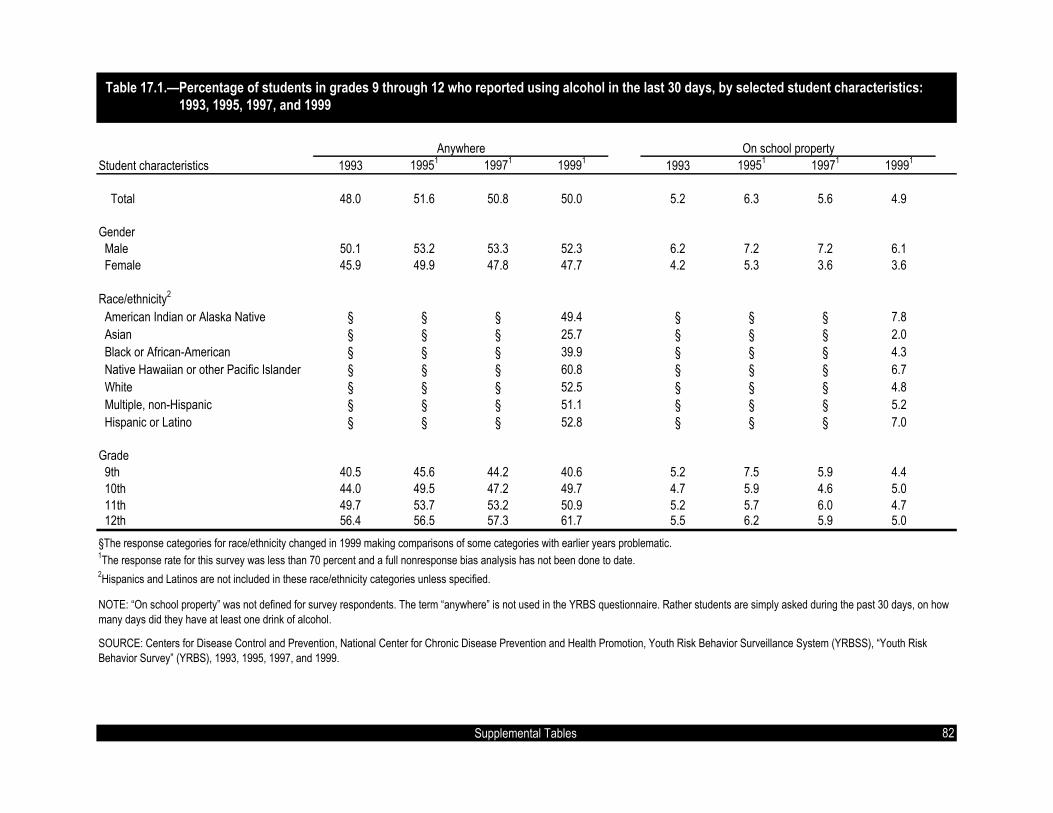
Table 17.1.�Percentage of students in grades 9 through 12 who reported using alcohol in the last 30 days, by selected student characteristics: Table 18.1.�1993, 1995, 1997, and 1999
Student characteristics 1993 19951 19971 19991 1993 19951 19971 19991
Total 48.0 51.6 50.8 50.0 5.2 6.3 5.6 4.9
Gender Male 50.1 53.2 53.3 52.3 6.2 7.2 7.2 6.1 Female 45.9 49.9 47.8 47.7 4.2 5.3 3.6 3.6
Race/ethnicity2
American Indian or Alaska Native § § § 49.4 § § § 7.8 Asian § § § 25.7 § § § 2.0 Black or African-American § § § 39.9 § § § 4.3 Native Hawaiian or other Pacific Islander § § § 60.8 § § § 6.7 White § § § 52.5 § § § 4.8 Multiple, non-Hispanic § § § 51.1 § § § 5.2 Hispanic or Latino § § § 52.8 § § § 7.0
Grade 9th 40.5 45.6 44.2 40.6 5.2 7.5 5.9 4.4 10th 44.0 49.5 47.2 49.7 4.7 5.9 4.6 5.0 11th 49.7 53.7 53.2 50.9 5.2 5.7 6.0 4.7 12th 56.4 56.5 57.3 61.7 5.5 6.2 5.9 5.0§The response categories for race/ethnicity changed in 1999 making comparisons of some categories with earlier years problematic.1The response rate for this survey was less than 70 percent and a full nonresponse bias analysis has not been done to date.2Hispanics and Latinos are not included in these race/ethnicity categories unless specified.
NOTE: �On school property� was not defined for survey respondents. The term �anywhere� is not used in the YRBS questionnaire. Rather students are simply asked during the past 30 days, on howmany days did they have at least one drink of alcohol.
SOURCE: Centers for Disease Control and Prevention, National Center for Chronic Disease Prevention and Health Promotion, Youth Risk Behavior Surveillance System (YRBSS), �Youth RiskBehavior Survey� (YRBS), 1993, 1995, 1997, and 1999.
82
Anywhere On school property
Supplemental Tables

Table 18.1.�Percentage of students in grades 9 through 12 who reported using marijuana in the last 30 days, by selected student characteristics: Table 19.1.�1993, 1995, 1997, and 1999
Student characteristics 1993 19951 19971 19991 1993 19951 19971 19991
Total 17.7 25.3 26.2 26.7 5.6 8.8 7.0 7.2
Gender Male 20.6 28.4 30.2 30.8 7.8 11.9 9.0 10.1 Female 14.6 22.0 21.4 22.6 3.3 5.5 4.6 4.4
Race/ethnicity2
American Indian or Alaska Native § § § 36.2 § § § 8.9 Asian § § § 13.5 § § § 4.3 Black or African-American § § § 26.4 § § § 7.2 Native Hawaiian or other Pacific Islander § § § 33.8 § § § 11.0 White § § § 26.4 § § § 6.5 Multiple, non-Hispanic § § § 29.1 § § § 7.8 Hispanic or Latino § § § 28.2 § § § 10.7
Grade 9th 13.2 20.9 23.6 21.7 4.4 8.7 8.1 6.6 10th 16.5 25.5 25.0 27.8 6.5 9.8 6.4 7.6 11th 18.4 27.6 29.3 26.7 6.5 8.6 7.9 7.0 12th 22.0 26.2 26.6 31.5 5.1 8.0 5.7 7.3 §The response categories for race/ethnicity changed in 1999 making comparisons of some categories with earlier years problematic.1The response rate for this survey was less than 70 percent and a full nonresponse bias analysis has not been done to date.2Hispanics and Latinos are not included in these race/ethnicity categories unless specified.
NOTE: �On school property� was not defined for survey respondents. The term �anywhere� is not used in the YRBS questionnaire. Rather, students are simply asked how many times during the past30 days they used marijuana.
SOURCE: Centers for Disease Control and Prevention, National Center for Chronic Disease Prevention and Health Promotion, Youth Risk Behavior Surveillance System (YRBSS), �Youth RiskBehavior Survey� (YRBS), 1993, 1995, 1997, and 1999.
83
Anywhere On school property
Supplemental Tables

Table 19.1.�Percentage of students in grades 9 through 12 who reported that drugs were made available to them on school property during the Table 20.1.�last 12 months, by selected student characteristics: 1993, 1995, 1997, and 1999
Student characteristics 1993 19951 19971 19991
Total 24.0 32.1 31.7 30.2
Gender Male 28.5 38.8 37.4 34.7 Female 19.1 24.8 24.7 25.7
Race/ethnicity2
American Indian or Alaska Native § § § 30.6 Asian § § § 25.7 Black or African-American § § § 25.3 Native Hawaiian or other Pacific Islander § § § 46.9 White § § § 28.8 Multiple, non-Hispanic § § § 36.0 Hispanic or Latino § § § 36.9
Grade 9th 21.8 31.1 31.4 27.6 10th 23.7 35.0 33.4 32.1 11th 27.5 32.8 33.2 31.1 12th 23.0 29.1 29.0 30.5§The response categories for race/ethnicity changed in 1999 making comparisons of some categories with earlier years problematic.1The response rate for this survey was less than 70 percent and a full nonresponse bias analysis has not been done to date.2Hispanics and Latinos are not included in these race/ethnicity categories unless specified.
NOTE: �On school property� was not defined for survey respondents.
SOURCE: Centers for Disease Control and Prevention, National Center for Chronic Disease Prevention and Health Promotion, Youth Risk Behavior Surveillance System (YRBSS), �Youth RiskBehavior Survey� (YRBS), 1993, 1995, 1997, and 1999.
84 Supplemental Tables

Standard Error Tables 85
STANDARD ERROR TABLES

Table S2.1.�Standard errors for table 2.1: Number of nonfatal crimes against students ages 12 through 18 occurring at school or on the way to or Table S2.1.�from school, by type of crime and selected student characteristics: 1992 to 1999
Serious Serious SeriousStudent characteristics Total Theft Violent violent1 Total Theft Violent violent1 Total Theft Violent violent1
Total 198,370 153,120 100,850 40,700 162,900 120,580 88,770 35,470 145,100 107,810 78,580 32,520
Gender Male 144,430 107,630 79,880 34,510 114,440 82,460 66,440 26,230 100,210 73,110 57,220 24,820 Female 111,330 91,740 51,360 19,040 95,770 74,610 49,550 21,540 87,190 67,350 45,770 18,780
Age 12�14 135,560 100,080 76,430 33,310 112,960 81,110 65,960 26,410 101,110 72,440 59,200 24,910 15�18 121,170 99,660 55,740 20,810 97,400 76,030 50,130 21,330 86,220 68,050 43,440 18,690
Race/ethnicity White, non-Hispanic 164,190 127,990 83,030 30,630 135,350 101,090 73,570 26,900 116,160 88,490 61,210 23,330 Black, non-Hispanic 57,210 42,280 34,270 20,530 47,520 35,070 28,380 17,650 44,500 32,380 27,000 12,760 Hispanic 45,580 35,360 25,710 11,920 37,350 27,330 22,930 9,000 38,500 27,080 24,620 13,900 Other, non-Hispanic 26,190 24,010 9,350 � 17,940 14,860 9,260 3,930 17,370 13,690 9,880 5,570
Urbanicity Urban 86,020 66,450 46,580 24,050 69,720 50,180 41,960 18,990 62,530 43,640 39,100 20,320 Suburban 133,300 104,970 67,150 26,630 109,610 84,200 57,610 22,360 98,030 74,090 53,010 21,370 Rural 75,950 58,570 41,650 13,920 62,430 46,010 36,640 15,660 54,610 44,040 27,320 8,580
Household income Less than $7,500 41,070 28,830 26,810 12,280 31,820 19,530 23,470 9,520 23,720 15,970 16,330 10,320 $7,500�14,999 48,700 35,910 29,600 14,670 37,650 28,210 22,340 10,960 32,500 24,940 18,620 6,310 $15,000�24,999 55,070 36,220 37,820 17,480 46,480 32,730 29,550 10,900 41,700 31,930 23,540 10,820 $25,000�34,999 60,640 48,610 31,440 9,530 56,670 45,480 28,840 10,990 45,410 32,000 28,670 12,190 $35,000�49,999 78,940 65,880 36,360 14,740 56,010 42,450 31,740 14,090 52,950 40,630 29,250 11,630 $50,000�74,999 62,170 54,390 25,270 7,970 54,430 43,170 28,480 12,010 49,760 37,960 27,910 11,970 $75,000 or more 52,490 41,320 28,530 13,110 41,750 35,070 19,540 7,920 38,870 32,060 19,010 7,080
NOTE: See footnotes at end of table.
1992 1993 1994
Standard Error Tables 87
2
2
2
2
2
2
2 2
2
22
2
2
2

Table S2.1.�Standard errors for table 2.1: Number of nonfatal crimes against students ages 12 through 18 occurring at school or on the way to or Table S2.1.�from school, by type of crime and selected student characteristics: 1992 to 1999�Continued
Serious Serious SeriousStudent characteristics Total Theft Violent violent1 Total Theft Violent violent1 Total Theft Violent violent1
Total 137,010 102,220 73,970 26,320 135,320 102,390 71,600 27,750 135,390 93,670 71,460 27,750
Gender Male 96,800 71,360 54,550 20,680 95,130 68,170 56,080 21,930 89,920 64,160 55,150 22,070 Female 80,210 61,890 42,460 14,670 80,010 65,630 37,320 15,310 75,780 60,210 39,470 15,420
Age 12�14 98,330 70,630 57,480 20,770 93,650 68,770 53,370 17,970 85,940 61,180 52,980 20,300 15�18 78,500 62,680 38,910 14,570 81,630 65,020 40,680 19,680 80,080 63,220 42,090 17,580
Race/ethnicity White, non-Hispanic 111,780 84,240 60,170 18,890 108,940 83,240 57,530 19,010 102,130 75,950 58,740 21,130 Black, non-Hispanic 39,410 28,680 24,110 11,970 39,340 31,920 20,030 11,590 40,350 30,880 23,430 10,460 Hispanic 35,400 26,300 21,190 9,840 37,610 26,330 24,290 12,440 33,330 24,680 20,560 10,980 Other, non-Hispanic 17,830 15,500 8,020 4,770 19,190 15,360 10,590 5,730 19,580 17,210 8,580 4,050
Urbanicity Urban 59,070 44,260 33,640 16,410 62,800 46,360 36,550 17,860 60,360 45,120 35,480 17,730 Suburban 94,130 70,700 51,590 16,240 91,550 68,980 50,180 17,780 86,960 63,680 51,590 19,080 Rural 49,870 38,530 27,350 9,390 46,730 39,300 21,450 7,770 44,120 35,980 22,560 5,860
Household income Less than $7,500 20,400 11,900 15,770 8,460 20,970 16,440 11,960 6,060 17,530 12,010 12,140 3,680 $7,500�14,999 30,290 22,200 18,680 9,650 29,740 22,030 18,140 8,500 31,700 23,140 19,780 7,230 $15,000�24,999 39,110 29,710 22,470 7,800 40,040 28,880 24,830 12,540 39,190 29,360 23,210 10,260 $25,000�34,999 43,830 32,840 25,530 10,540 40,760 30,400 24,100 9,730 40,860 31,200 23,400 8,730 $35,000�49,999 50,240 38,410 28,050 9,560 48,990 37,630 27,270 11,070 45,400 31,440 29,420 12,720 $50,000�74,999 47,650 37,630 25,180 9,490 48,750 39,110 24,990 9,570 47,280 37,860 24,490 11,050 $75,000 or more 41,730 33,600 21,430 5,820 40,500 34,290 18,480 6,620 44,580 35,320 23,710 9,100
NOTE: See footnotes at end of table.
Standard Error Tables 88
1995 1996 1997
2
2
2
2
2
2
2
2
22
2
2
2
2

Table S2.1.�Standard errors for table 2.1: Number of nonfatal crimes against students ages 12 through 18 occurring at school or on the way to or Table S2.1.�from school, by type of crime and selected student characteristics: 1992 to 1999�Continued
Serious SeriousStudent characteristics Total Theft Violent violent1 Total Theft Violent violent1
Total 149,930 103,930 85,310 33,210 125,980 95,930 66,490 26,370
Gender Male 102,780 68,310 63,240 23,850 86,840 65,080 47,860 19,710 Female 86,560 64,680 45,950 20,230 76,970 60,260 39,490 15,730
Age 12�14 100,100 65,870 62,380 25,550 89,160 66,440 49,540 21,240 15�18 89,430 67,140 46,960 18,240 74,430 58,820 37,560 13,790
Race/ethnicity White, non-Hispanic 115,070 79,760 66,740 25,070 99,010 76,300 51,640 18,070 Black, non-Hispanic 48,030 34,220 28,740 12,790 43,570 32,050 25,760 13,830 Hispanic 37,920 27,680 22,380 11,960 30,990 24,330 16,850 8,830 Other, non-Hispanic 19,930 15,470 11,240 3,770 17,860 14,270 9,760 3,950
Urbanicity Urban 70,950 50,520 41,210 19,210 56,790 45,230 28,710 14,450 Suburban 93,090 65,960 53,270 18,380 85,820 63,790 47,970 19,630 Rural 52,210 35,890 32,470 14,720 45,280 35,740 23,710 5,720
Household income Less than $7,500 23,100 15,760 15,350 8,150 18,030 11,500 13,040 7,110 $7,500�14,999 32,410 18,830 24,110 9,940 23,220 17,310 14,010 5,040 $15,000�24,999 45,740 30,430 29,780 10,800 33,880 26,170 18,840 9,130 $25,000�34,999 40,490 26,530 26,990 13,370 31,360 24,810 16,780 4,060 $35,000�49,999 41,210 32,130 21,690 9,350 43,720 32,810 25,070 8,610 $50,000�74,999 50,130 37,300 28,090 12,330 44,220 33,070 25,490 13,170 $75,000 or more 47,320 37,070 24,360 8,700 47,220 41,010 19,150 9,300
�No cases are reported in this cell, although the event defined by this cell could have been reported by some students with these characteristics had a different sample been drawn.1Serious violent crimes are also included in violent crimes.2Estimate based on fewer than 10 cases.
NOTE: Serious violent crimes include rape, sexual assault, robbery, and aggravated assault. Violent crimes include serious violent crimes and simple assault. Total crimes include violent crimes andtheft. �At school� includes inside the school building, on school property, or on the way to or from school. Standard errors are rounded to the nearest 10.
SOURCE: U.S. Department of Justice, Bureau of Justice Statistics, National Crime Victimization Survey, 1992 to 1999.
1998
Standard Error Tables 89
1999
2
22
2
2
2
2
22222
2

Table S2.2.�Standard errors for table 2.2: Number of nonfatal crimes against students ages 12 through 18 occurring at school or on the way to or Table S2.2.�from school per 1,000 students, by type of crime and selected student characteristics: 1992 to 1999
Serious Serious SeriousStudent characteristics Total Theft Violent violent1 Total Theft Violent violent1 Total Theft Violent violent1
Total 7.2 5.8 4.0 1.7 5.7 4.4 3.4 1.4 4.9 3.8 2.9 1.3
Gender Male 10.0 7.9 6.1 2.8 7.7 5.9 4.9 2.0 6.6 5.1 4.1 1.9 Female 8.6 7.3 4.3 1.6 7.0 5.7 4.0 1.8 6.2 5.0 3.5 1.5
Age 12�14 10.6 8.3 6.6 3.0 8.4 6.5 5.4 2.3 7.4 5.7 4.8 2.1 15�18 8.3 7.0 4.1 1.6 6.4 5.2 3.6 1.6 5.5 4.5 3.0 1.3
Race/ethnicity White, non-Hispanic 8.7 7.1 4.8 1.9 6.9 5.4 4.1 1.6 5.8 4.7 3.4 1.3 Black, non-Hispanic 13.3 10.2 8.4 5.2 10.7 8.2 6.8 4.3 10.0 7.6 6.5 3.2 Hispanic 15.6 12.5 9.4 4.5 11.9 9.1 7.7 3.1 10.8 8.0 7.4 4.3 Other, non-Hispanic 27.5 25.5 10.6 � 18.2 15.4 9.9 4.3 16.5 13.4 9.9 5.7
Urbanicity Urban 12.1 9.7 7.1 3.8 9.2 6.9 5.9 2.8 8.0 5.9 5.4 2.9 Suburban 9.8 8.1 5.4 2.2 8.0 6.4 4.6 1.9 6.9 5.5 4.1 1.7 Rural 11.7 9.4 6.9 2.4 8.9 6.8 5.6 2.5 7.6 6.3 4.1 1.3
Household income Less than $7,500 18.3 13.4 12.6 6.0 13.9 9.0 10.7 4.5 11.4 8.0 8.1 5.3 $7,500�14,999 14.6 11.2 9.4 4.8 12.3 9.6 7.8 3.9 10.8 8.6 6.6 2.3 $15,000�24,999 14.8 10.3 10.7 5.2 11.5 8.6 7.8 3.0 10.1 8.0 6.1 2.9 $25,000�34,999 15.1 12.5 8.4 2.7 13.2 11.1 7.4 3.0 11.2 8.4 7.6 3.4 $35,000�49,999 15.9 13.8 8.2 3.4 11.4 9.1 7.0 3.3 10.1 8.2 6.1 2.5 $50,000�74,999 16.0 14.4 7.2 2.3 12.5 10.4 7.2 3.2 10.7 8.6 6.6 2.9 $75,000 or more 23.9 19.9 14.5 7.0 17.0 14.8 8.9 3.7 13.7 11.8 7.4 2.9
NOTE: See footnotes at end of table.
90
1992 1993 1994
Standard Error Tables
22
2
2222
2
2
2
2
2
2
2

Table S2.2.�Standard errors for table 2.2: Number of nonfatal crimes against students ages 12 through 18 occurring at school or on the way to or Table S2.2.�from school per 1,000 students, by type of crime and selected student characteristics: 1992 to 1999�Continued
Serious Serious SeriousStudent characteristics Total Theft Violent violent1 Total Theft Violent violent1 Total Theft Violent violent1
Total 4.6 3.6 2.7 1.0 4.6 3.6 2.6 1.0 4.3 3.3 2.6 1.0
Gender Male 6.3 4.9 3.9 1.5 6.2 4.7 3.9 1.6 6.0 4.4 3.8 1.6 Female 5.7 4.6 3.2 1.2 5.6 4.7 2.8 1.2 5.4 4.4 3.0 1.2
Age 12�14 7.1 5.5 4.6 1.8 7.0 5.4 4.3 1.5 6.6 4.9 4.3 1.7 15�18 5.0 4.1 2.7 1.0 5.1 4.2 2.7 1.3 5.0 4.0 2.8 1.2
Race/ethnicity White, non-Hispanic 5.6 4.4 3.3 1.1 5.5 4.4 3.1 1.1 5.3 4.1 3.2 1.2 Black, non-Hispanic 8.8 6.7 5.7 2.9 9.1 7.6 4.9 2.9 9.0 7.1 5.5 2.5 Hispanic 9.7 7.5 6.1 2.9 9.7 7.1 6.6 3.5 8.5 6.5 5.4 3.0 Other, non-Hispanic 15.4 13.6 7.3 4.4 16.4 13.5 9.5 5.3 15.7 13.9 7.2 3.5
Urbanicity Urban 7.4 5.8 4.5 2.3 7.7 5.9 4.8 2.4 7.3 5.6 4.5 2.3 Suburban 6.5 5.1 3.9 1.3 6.1 4.8 3.6 1.3 6.0 4.5 3.7 1.4 Rural 7.3 5.8 4.2 1.5 7.3 6.3 3.6 1.3 7.1 5.9 3.8 1.0
Household income Less than $7,500 10.9 6.6 8.7 4.8 12.3 9.9 7.3 3.8 12.2 8.6 8.7 2.7 $7,500�14,999 9.9 7.5 6.4 3.4 9.9 7.6 6.3 3.0 10.7 8.1 7.0 2.7 $15,000�24,999 10.3 8.2 6.4 2.3 10.2 7.6 6.7 3.5 10.4 8.1 6.5 3.0 $25,000�34,999 10.9 8.6 6.9 3.0 10.8 8.4 6.8 2.9 10.7 8.5 6.5 2.5 $35,000�49,999 9.3 7.4 5.6 2.0 9.5 7.6 5.7 2.4 9.2 6.6 6.3 2.8 $50,000�74,999 10.1 8.3 5.8 2.3 10.0 8.3 5.5 2.2 9.3 7.7 5.2 2.4 $75,000 or more 12.6 10.6 7.1 2.0 11.5 10.0 5.7 2.1 10.9 9.0 6.3 2.5
NOTE: See footnotes at end of table.
91 Standard Error Tables
1995 1996 1997
2
2
2
2
2
2
2
2
2 2
2
22
2

Table S2.2.�Standard errors for table 2.2: Number of nonfatal crimes against students ages 12 through 18 occurring at school or on the way to or Table S2.2.�from school per 1,000 students, by type of crime and selected student characteristics: 1992 to 1999�Continued
Serious SeriousStudent characteristics Total Theft Violent violent1 Total Theft Violent violent1
Total 4.8 3.3 3.1 1.7 4.3 3.4 2.4 1.0
Gender Male 6.4 4.4 4.3 2.5 5.7 4.4 3.3 1.4 Female 5.7 4.0 3.6 1.9 5.4 4.3 2.9 1.2
Age 12�14 6.1 4.2 3.8 1.9 6.7 5.2 4.0 1.8 15�18 5.9 4.1 4.0 2.4 4.6 3.7 2.4 0.9
Race/ethnicity White, non-Hispanic 5.6 3.9 3.7 1.9 5.2 4.1 2.9 1.0 Black, non-Hispanic 9.7 6.9 6.4 4.3 9.5 7.3 6.0 3.3 Hispanic 9.0 5.8 6.5 4.4 7.3 5.9 4.1 2.2 Other, non-Hispanic 15.4 12.3 9.0 5.5 13.9 11.3 7.9 3.2
Urbanicity Urban 8.3 5.7 5.8 3.6 7.1 5.8 3.8 1.9 Suburban 6.0 4.2 3.9 2.1 5.5 4.2 3.2 1.4 Rural 7.0 5.1 4.4 2.2 7.7 6.2 4.2 1.1
Household income Less than $7,500 16.8 10.6 13.0 8.5 15.1 10.0 11.3 6.3 $7,500�14,999 13.3 9.0 10.0 5.2 10.3 7.9 6.5 2.4 $15,000�24,999 11.4 7.8 8.0 5.1 9.8 7.8 5.8 2.8 $25,000�34,999 10.7 7.2 7.7 5.2 8.9 7.2 5.0 1.2 $35,000�49,999 9.3 7.2 5.7 3.7 9.7 7.5 5.9 2.1 $50,000�74,999 8.7 5.9 5.9 3.3 9.0 6.9 5.4 2.9 $75,000 or more 9.2 6.9 5.6 3.1 9.2 8.1 4.0 2.0 �No cases are reported in this cell, although the event defined by this cell could have been reported by some students with these characteristics had a different sample been drawn.1Serious violent crimes are also included in violent crimes.2Estimate based on fewer than 10 cases.
NOTE: Serious violent crimes include rape, sexual assault, robbery, and aggravated assault. Violent crimes include serious violent crimes and simple assault. Total crimes include violent crimes andtheft. �At school� includes inside the school building, on school property, or on the way to or from school. Population sizes are 23,740,295 students ages 12 through 18 in 1992; 24,557,779 in 1993;25,326,989 in 1994; 25,715,220 in 1995; 26,151,364 in 1996; 26,548,142 in 1997; 26,806,268 in 1998; and 27,012,660 in 1999.
SOURCE: U.S. Department of Justice, Bureau of Justice Statistics, National Crime Victimization Survey, 1992 to 1999.92
1998
Standard Error Tables
1999
2
22
2
2
2
2
22222
2

Table S2.3.�Standard errors for table 2.3: Number of nonfatal crimes against students ages 12 through 18 occurring away from school, by type of Table S2.3.�crime and selected student characteristics: 1992 to 1999
Serious Serious SeriousStudent characteristics Total Theft Violent violent1 Total Theft Violent violent1 Total Theft Violent violent1
Total 193,820 123,910 127,290 78,020 152,470 98,100 99,400 64,490 134,190 82,740 89,860 56,760
Gender Male 140,430 92,750 90,880 56,450 109,140 71,190 71,480 48,610 95,760 58,520 65,980 43,260 Female 109,740 68,810 75,630 47,110 87,720 56,990 58,420 36,460 76,340 49,480 50,640 31,880
Age 12�14 106,380 73,970 66,140 41,110 80,910 55,260 51,410 33,710 68,930 45,640 45,090 26,970 15�18 143,320 88,270 98,850 61,410 114,950 72,680 77,330 50,810 102,070 61,870 70,520 47,000
Race/ethnicity White, non-Hispanic 154,560 101,040 100,510 57,770 119,490 76,560 79,230 47,240 104,620 65,720 69,990 41,250 Black, non-Hispanic 58,550 38,950 39,640 29,570 52,300 35,170 34,720 27,310 42,100 26,870 29,410 22,690 Hispanic 52,580 32,420 38,210 26,400 40,170 26,850 27,260 21,800 38,210 24,250 26,980 20,450 Other, non-Hispanic 28,790 18,600 20,730 15,200 18,350 14,490 10,470 7,820 16,820 11,280 11,790 8,050
Urbanicity Urban 99,540 63,680 67,780 42,600 81,300 51,860 55,320 38,540 67,510 41,610 47,200 32,490 Suburban 126,290 83,390 82,260 50,710 91,660 60,880 59,550 39,190 85,110 52,770 58,370 36,750 Rural 61,700 39,890 42,770 27,800 55,390 37,070 36,820 21,930 45,560 31,440 29,340 18,360
Household income Less than $7,500 52,270 35,520 34,870 21,100 42,740 26,240 31,080 19,650 34,450 21,730 24,590 17,660 $7,500�14,999 60,760 36,000 45,120 32,940 46,810 32,390 30,340 22,500 36,420 22,720 26,150 18,360 $15,000�24,999 67,810 40,810 49,530 30,100 50,530 32,070 35,460 23,910 38,360 23,330 28,000 17,850 $25,000�34,999 61,480 38,000 44,240 27,460 47,290 32,180 31,190 21,390 41,500 26,610 28,900 18,860 $35,000�49,999 59,910 40,440 39,930 21,850 49,780 31,820 34,750 23,210 41,850 27,110 28,870 18,740 $50,000�74,999 51,800 38,420 31,080 18,670 40,150 29,130 24,820 16,310 41,310 28,100 27,190 17,410 $75,000 or more 40,540 31,050 23,550 13,900 29,510 21,190 18,850 11,230 30,850 21,610 20,040 12,770
NOTE: See footnotes at end of table.
1992 1993 1994
Standard Error Tables 93
2 2
2

Table S2.3.�Standard errors for table 2.3: Number of nonfatal crimes against students ages 12 through 18 occurring away from school, by type of Table S2.3.�crime and selected student characteristics: 1992 to 1999�Continued
Serious Serious SeriousStudent characteristics Total Theft Violent violent1 Total Theft Violent violent1 Total Theft Violent violent1
Total 126,520 83,180 81,020 46,650 132,260 89,160 82,400 52,210 147,650 94,140 94,300 54,410
Gender Male 90,390 58,790 59,620 35,460 97,990 66,500 61,680 39,730 103,690 67,780 66,720 39,020 Female 73,320 50,240 46,360 26,450 72,590 49,790 46,000 29,380 84,290 54,470 55,860 33,330
Age 12�14 64,900 44,650 41,160 23,230 68,640 48,920 41,670 26,600 72,930 50,320 45,670 27,080 15�18 97,480 63,580 63,840 37,930 101,250 67,210 65,150 41,890 113,410 71,320 75,180 44,090
Race/ethnicity White, non-Hispanic 98,390 66,240 62,300 35,380 102,430 69,440 64,380 38,090 113,860 73,230 73,840 42,290 Black, non-Hispanic 42,540 28,390 28,610 16,690 45,070 30,440 29,930 22,680 48,310 33,100 31,540 19,970 Hispanic 34,080 20,620 25,180 16,430 35,640 24,940 23,090 17,070 41,650 27,170 28,850 18,380 Other, non-Hispanic 18,120 13,310 11,470 7,730 18,770 14,740 10,740 8,340 15,370 11,100 10,120 6,270
Urbanicity Urban 65,540 42,830 43,860 26,810 66,050 43,640 43,820 31,060 75,050 48,910 49,820 33,060 Suburban 79,920 54,450 50,600 29,810 84,280 58,030 52,680 32,320 92,330 61,160 59,220 32,910 Rural 43,750 29,190 29,400 16,110 47,740 34,360 29,340 17,750 48,430 31,420 33,370 18,610
Household income Less than $7,500 32,900 22,020 22,400 13,710 31,700 20,780 22,100 17,930 26,350 18,740 17,180 10,170 $7,500�14,999 38,310 24,180 27,260 16,590 39,790 26,900 26,600 20,140 43,990 25,190 33,470 22,610 $15,000�24,999 41,520 30,550 24,940 15,530 42,270 27,290 29,420 18,570 40,710 28,590 26,170 16,140 $25,000�34,999 37,450 25,040 25,340 14,510 37,290 27,080 23,020 14,300 42,630 28,010 29,290 16,970 $35,000�49,999 41,260 27,390 27,940 17,240 42,130 29,450 27,060 14,460 47,740 35,610 27,990 16,980 $50,000�74,999 39,040 26,490 25,950 16,520 38,240 29,100 22,020 14,780 44,050 28,110 30,990 17,860 $75,000 or more 30,540 20,300 21,010 10,030 34,190 27,260 18,260 9,110 40,430 27,820 26,620 16,740
NOTE: See footnotes at end of table.
Standard Error Tables 94
1995 1996 1997
2 2 2

Table S2.3.�Standard errors for table 2.3: Number of nonfatal crimes against students ages 12 through 18 occurring away from school, by type of Table S2.3.�crime and selected student characteristics: 1992 to 1999�Continued
Serious SeriousStudent characteristics Total Theft Violent violent1 Total Theft Violent violent1
Total 143,160 89,240 92,110 53,370 113,540 73,780 74,210 45,800
Gender Male 100,920 63,870 65,420 41,450 81,830 52,350 54,930 35,090 Female 79,870 50,530 52,580 27,620 65,650 44,420 42,080 25,310
Age 12�14 65,420 45,880 39,010 22,650 57,810 41,370 34,880 21,230 15�18 112,950 67,820 76,230 45,060 88,320 55,010 60,540 38,120
Race/ethnicity White, non-Hispanic 109,800 69,270 71,000 39,070 85,840 56,960 55,480 32,530 Black, non-Hispanic 43,440 28,950 28,330 19,970 38,810 25,270 26,580 18,320 Hispanic 37,640 21,680 27,950 18,790 35,690 22,580 25,160 18,550 Other, non-Hispanic 19,840 15,540 11,000 6,980 14,280 10,480 9,050 5,920
Urbanicity Urban 71,190 43,110 49,070 31,340 55,720 35,610 38,090 28,020 Suburban 93,720 59,630 60,740 35,000 78,220 51,270 51,410 29,730 Rural 39,100 28,060 23,560 12,310 34,360 24,360 21,650 11,450
Household income Less than $7,500 23,220 13,280 17,740 11,420 26,270 16,630 18,790 12,730 $7,500�14,999 40,430 25,540 27,870 14,030 27,580 20,010 17,110 13,200 $15,000�24,999 42,470 27,260 28,770 19,650 31,030 20,080 21,610 13,010 $25,000�34,999 41,160 25,870 28,470 20,100 33,570 22,880 22,140 10,920 $35,000�49,999 44,300 32,010 26,200 17,440 34,870 24,240 22,470 14,200 $50,000�74,999 39,790 24,150 28,370 15,810 35,770 23,040 24,830 17,870 $75,000 or more 38,060 26,860 23,470 13,550 37,800 25,830 24,700 15,250 1Serious violent crimes are also included in violent crimes.2Estimate based on fewer than 10 cases.
NOTE: Serious violent crimes include rape, sexual assault, robbery, and aggravated assault. Violent crimes include serious violent crimes and simple assault. Total crimes include violent crimes andtheft. Standard errors are rounded to the nearest 10.
SOURCE: U.S. Department of Justice, Bureau of Justice Statistics, National Crime Victimization Survey, 1992 to 1999.
1998
Standard Error Tables 95
1999
2
2
2 2
2
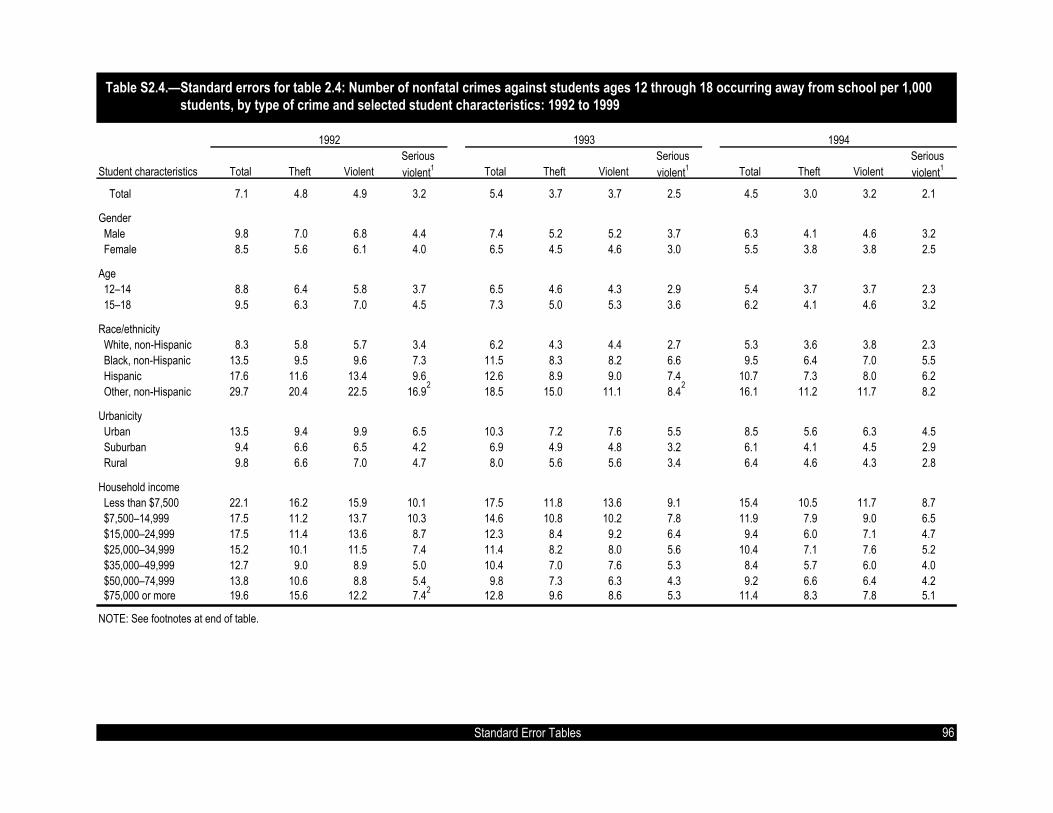
Table S2.4.�Standard errors for table 2.4: Number of nonfatal crimes against students ages 12 through 18 occurring away from school per 1,000 Table S2.4.�students, by type of crime and selected student characteristics: 1992 to 1999
Serious Serious SeriousStudent characteristics Total Theft Violent violent1 Total Theft Violent violent1 Total Theft Violent violent1
Total 7.1 4.8 4.9 3.2 5.4 3.7 3.7 2.5 4.5 3.0 3.2 2.1
Gender Male 9.8 7.0 6.8 4.4 7.4 5.2 5.2 3.7 6.3 4.1 4.6 3.2 Female 8.5 5.6 6.1 4.0 6.5 4.5 4.6 3.0 5.5 3.8 3.8 2.5
Age 12�14 8.8 6.4 5.8 3.7 6.5 4.6 4.3 2.9 5.4 3.7 3.7 2.3 15�18 9.5 6.3 7.0 4.5 7.3 5.0 5.3 3.6 6.2 4.1 4.6 3.2
Race/ethnicity White, non-Hispanic 8.3 5.8 5.7 3.4 6.2 4.3 4.4 2.7 5.3 3.6 3.8 2.3 Black, non-Hispanic 13.5 9.5 9.6 7.3 11.5 8.3 8.2 6.6 9.5 6.4 7.0 5.5 Hispanic 17.6 11.6 13.4 9.6 12.6 8.9 9.0 7.4 10.7 7.3 8.0 6.2 Other, non-Hispanic 29.7 20.4 22.5 16.9 18.5 15.0 11.1 8.4 16.1 11.2 11.7 8.2
Urbanicity Urban 13.5 9.4 9.9 6.5 10.3 7.2 7.6 5.5 8.5 5.6 6.3 4.5 Suburban 9.4 6.6 6.5 4.2 6.9 4.9 4.8 3.2 6.1 4.1 4.5 2.9 Rural 9.8 6.6 7.0 4.7 8.0 5.6 5.6 3.4 6.4 4.6 4.3 2.8
Household income Less than $7,500 22.1 16.2 15.9 10.1 17.5 11.8 13.6 9.1 15.4 10.5 11.7 8.7 $7,500�14,999 17.5 11.2 13.7 10.3 14.6 10.8 10.2 7.8 11.9 7.9 9.0 6.5 $15,000�24,999 17.5 11.4 13.6 8.7 12.3 8.4 9.2 6.4 9.4 6.0 7.1 4.7 $25,000�34,999 15.2 10.1 11.5 7.4 11.4 8.2 8.0 5.6 10.4 7.1 7.6 5.2 $35,000�49,999 12.7 9.0 8.9 5.0 10.4 7.0 7.6 5.3 8.4 5.7 6.0 4.0 $50,000�74,999 13.8 10.6 8.8 5.4 9.8 7.3 6.3 4.3 9.2 6.6 6.4 4.2 $75,000 or more 19.6 15.6 12.2 7.4 12.8 9.6 8.6 5.3 11.4 8.3 7.8 5.1
NOTE: See footnotes at end of table.
96
1992 1993 1994
Standard Error Tables
2
2
2

Table S2.4.�Standard errors for table 2.4: Number of nonfatal crimes against students ages 12 through 18 occurring away from school per 1,000 Table S2.4.�students, by type of crime and selected student characteristics: 1992 to 1999�Continued
Serious Serious SeriousStudent characteristics Total Theft Violent violent1 Total Theft Violent violent1 Total Theft Violent violent1
Total 4.3 3.0 2.9 1.8 4.5 3.2 2.9 1.9 4.7 3.2 3.2 2.0
Gender Male 6.0 4.1 4.2 2.6 6.3 4.6 4.3 2.8 6.4 4.5 4.5 2.7 Female 5.3 3.8 3.5 2.1 5.2 3.7 3.4 2.3 5.8 3.9 4.0 2.5
Age 12�14 5.1 3.6 3.4 2.0 5.4 4.0 3.4 2.2 5.6 4.0 3.7 2.3 15�18 6.0 4.2 4.2 2.6 6.1 4.3 4.2 2.8 6.4 4.4 4.6 2.8
Race/ethnicity White, non-Hispanic 5.1 3.6 3.4 2.0 5.2 3.7 3.5 2.1 5.0 3.9 3.9 2.3 Black, non-Hispanic 9.4 6.6 6.7 4.0 10.2 7.2 7.1 5.5 9.1 7.5 7.2 4.7 Hispanic 9.4 6.0 7.2 4.8 9.3 6.7 6.3 4.7 9.9 7.0 7.4 4.9 Other, non-Hispanic 15.6 11.8 10.3 7.1 16.1 13.0 9.7 7.6 1.1 9.2 8.5 5.3
Urbanicity Urban 8.1 5.6 5.8 3.7 8.0 5.6 5.7 4.1 8.5 6.0 6.1 4.2 Suburban 5.7 4.1 3.8 2.3 5.7 4.1 3.8 2.4 6.0 4.3 4.1 2.4 Rural 6.5 4.5 4.5 2.6 7.4 5.6 4.8 3.0 7.6 5.2 5.5 3.1
Household income Less than $7,500 16.2 11.7 11.9 7.6 17.3 12.2 12.9 10.7 17.4 13.0 12.0 7.3 $7,500�14,999 12.0 8.1 9.0 5.7 12.7 9.1 9.0 7.0 14.0 8.8 11.3 8.0 $15,000�24,999 10.8 8.4 7.0 4.5 10.6 7.3 7.8 5.1 10.7 7.9 7.3 4.6 $25,000�34,999 9.6 6.7 6.8 4.0 10.0 7.6 6.5 4.2 11.1 7.7 8.0 4.8 $35,000�49,999 7.9 5.5 5.6 3.5 8.4 6.1 5.6 3.1 9.6 7.4 6.0 3.7 $50,000�74,999 8.6 6.1 6.0 3.9 8.1 6.4 4.9 3.4 8.8 5.9 6.4 3.8 $75,000 or more 9.8 6.8 7.0 3.5 9.9 8.2 5.6 2.9 10.1 7.3 7.0 4.5
NOTE: See footnotes at end of table.
97 Standard Error Tables
1995 1996 1997
22 2

Table S2.4.�Standard errors for table 2.4: Number of nonfatal crimes against students ages 12 through 18 occurring away from school per 1,000 Table S2.4.�students, by type of crime and selected student characteristics: 1992 to 1999�Continued
Serious SeriousStudent characteristics Total Theft Violent violent1 Total Theft Violent violent1
Total 4.8 3.3 3.1 1.7 3.9 2.6 2.6 1.7
Gender Male 6.4 4.4 4.3 2.5 5.4 3.6 3.8 2.5 Female 5.7 4.0 3.6 1.9 4.7 3.3 3.1 1.9
Age 12�14 6.1 4.2 3.8 1.9 4.6 3.3 2.8 1.8 15�18 5.9 4.1 4.0 2.4 5.4 3.5 3.8 2.5
Race/ethnicity White, non-Hispanic 5.6 3.9 3.7 1.9 4.6 3.2 3.1 1.8 Black, non-Hispanic 9.7 6.9 6.4 4.3 8.6 5.8 6.1 4.3 Hispanic 9.0 5.8 6.5 4.4 8.3 5.5 6.0 4.5 Other, non-Hispanic 15.4 12.3 9.0 5.5 11.3 8.5 7.3 4.9
Urbanicity Urban 8.3 5.7 5.8 3.6 6.9 4.6 4.9 3.7 Suburban 6.0 4.2 3.9 2.1 5.1 3.5 3.5 2.1 Rural 7.0 5.1 4.4 2.2 6.0 4.3 3.9 2.1
Household income Less than $7,500 16.8 10.6 13.0 8.5 20.7 14.1 15.7 11.0 $7,500�14,999 13.3 9.0 10.0 5.2 12.0 9.0 7.8 6.1 $15,000�24,999 11.4 7.8 8.0 5.1 9.1 6.1 6.5 4.0 $25,000�34,999 10.7 7.2 7.7 5.2 9.5 6.7 6.5 3.3 $35,000�49,999 9.3 7.2 5.7 3.7 8.0 5.7 5.3 3.4 $50,000�74,999 8.7 5.9 5.9 3.3 7.4 4.9 5.3 3.9 $75,000 or more 9.2 6.9 5.6 3.1 7.6 5.3 5.1 3.2 1Serious violent crimes are also included in violent crimes.2Estimate based on fewer than 10 cases.
NOTE: Serious violent crimes include rape, sexual assault, robbery, and aggravated assault. Violent crimes include serious violent crimes and simple assault. Total crimes include violent crimes andtheft. Population sizes are 23,740,295 students ages 12 through 18 in 1992; 24,557,779 in 1993; 25,326,989 in 1994; 25,715,220 in 1995; 26,151,364 in 1996; 26,548,142 in 1997; 26,806,268 in1998; and 27,012,660 in 1999.
SOURCE: U.S. Department of Justice, Bureau of Justice Statistics, National Crime Victimization Survey, 1992 to 1999.98
1998
Standard Error Tables
1999
2
2
2 2
2

Table S3.1.�Standard errors for table 3.1: Percentage of students ages 12 through 18 who reported criminal victimization at school during the Table S3.1.�previous 6 months, by type of victimization and selected student characteristics: 1995 and 1999
Student characteristics1 Total1 Theft Violent2 Serious violent3 Total1 Theft Violent2 Serious violent3
Total 0.35 0.29 0.21 0.09 0.35 0.32 0.18 0.09
Gender Male 0.46 0.38 0.27 0.14 0.46 0.41 0.26 0.12 Female 0.47 0.41 0.25 0.10 0.46 0.43 0.22 0.12
Race/ethnicity White, non-Hispanic 0.37 0.32 0.23 0.09 0.44 0.43 0.22 0.09 Black, non-Hispanic 1.04 0.85 0.61 0.31 0.85 0.77 0.55 0.33 Hispanic 0.90 0.78 0.43 0.30 0.77 0.61 0.38 0.22 Other, non-Hispanic 1.54 1.40 0.87 0.34 1.28 0.98 0.81 �
Grade 6th 0.97 0.66 0.73 0.42 1.24 0.97 0.76 0.40 7th 0.81 0.71 0.54 0.24 0.81 0.73 0.43 0.27 8th 0.78 0.72 0.44 0.23 0.84 0.81 0.44 0.22 9th 0.88 0.77 0.50 0.21 0.79 0.71 0.47 0.18 10th 0.76 0.72 0.36 0.17 0.82 0.73 0.39 0.23 11th 0.74 0.66 0.40 0.16 0.88 0.67 0.58 0.14 12th 0.74 0.67 0.41 0.21 0.81 0.71 0.31 0.15
Urbanicity Urban 0.64 0.51 0.40 0.24 0.69 0.59 0.38 0.19 Suburban 0.49 0.40 0.30 0.12 0.43 0.36 0.26 0.11 Rural 0.79 0.66 0.31 0.10 0.96 0.95 0.50 0.18
Control Public 0.38 0.32 0.22 0.10 0.37 0.34 0.20 0.10 Private 0.90 0.74 0.45 0.11 0.80 0.78 0.16 �
�No cases are reported in this cell, although the event defined by this cell could have been reported by some students with these characteristics had a different sample been drawn.1Total victimization is a combination of violent victimization and theft. If the student reported an incident in either, he or she is counted as having experienced �total� victimization. If the studentreported having experienced both, he or she is counted once under �total� victimization.2Violent crimes include rape, sexual assault, robbery, aggravated assault, and simple assault.3Serious violent crimes include rape, sexual assault, robbery, and aggravated assault. Serious violent crimes are also included in violent crimes.
NOTE: �At school� includes inside the school building, on school property, or on the way to or from school.
SOURCE: U.S. Department of Justice, Bureau of Justice Statistics, School Crime Supplement to the National Crime Victimization Survey, January�June 1995 and 1999.
1995 1999
99 Standard Error Tables

Table S4.1.�Standard errors for table 4.1: Percentage of students in grades 9 through 12 who reported being threatened or injured with a weapon Table S5.1.�on school property during the last 12 months, by selected student characteristics: 1993, 1995, 1997, and 1999
Student characteristics 1993 19951 19971 19991
Total 0.44 0.52 0.45 0.42
Gender Male 0.64 0.57 0.71 0.81 Female 0.40 0.68 0.32 0.63
Race/ethnicity2
American Indian or Alaska Native § § § 5.45 Asian § § § 1.04 Black or African-American § § § 0.85 Native Hawaiian or other Pacific Islander § § § 4.58 White § § § 0.37 Multiple, non-Hispanic § § § 1.19 Hispanic or Latino § § § 1.07
Grade 9th 0.92 0.96 1.02 0.95 10th 0.59 1.03 1.14 0.91 11th 0.64 0.64 0.70 0.49 12th 0.62 0.57 0.80 0.79§The response categories for race/ethnicity changed in 1999 making comparisons of some categories with earlier years problematic.1The response rate for this survey was less than 70 percent and a full nonresponse bias analysis has not been done to date.2Hispanics and Latinos are not included in these race/ethnicity categories unless specified.
NOTE: �On school property� was not defined for survey respondents.
SOURCE: Centers for Disease Control and Prevention, National Center for Chronic Disease Prevention and Health Promotion, Youth Risk Behavior Surveillance System (YRBSS), �Youth RiskBehavior Survey� (YRBS), 1993, 1995, 1997, and 1999.
100 Standard Error Tables

Table S5.1.�Standard errors for table 5.1: Percentage of students in grades 9 through 12 who reported having been in a physical fight in the last Table S6.1.�12 months, by selected student characteristics: 1993, 1995, 1997, and 1999
Student characteristics 1993 19951 19971 19991 1993 19951 19971 19991
Total 0.99 1.14 1.01 1.24 0.59 0.79 0.64 0.64
Gender Male 1.05 1.09 1.07 1.34 0.71 0.90 1.04 0.74 Female 1.19 1.49 1.26 1.74 0.73 1.03 0.78 0.94
Race/ethnicity2
American Indian or Alaska Native § § § 6.70 § § § 5.23 Asian § § § 2.73 § § § 0.93 Black or African-American § § § 3.13 § § § 1.50 Native Hawaiian or other Pacific Islander § § § 3.55 § § § 4.50 White § § § 1.50 § § § 0.88 Multiple, non-Hispanic § § § 2.81 § § § 2.36 Hispanic or Latino § § § 1.73 § § § 1.00
Grade 9th 1.54 2.22 1.98 2.06 1.55 1.79 1.29 1.04 10th 1.45 1.49 1.91 2.13 1.07 1.57 1.67 1.23 11th 1.52 1.48 1.72 1.63 1.27 1.00 0.87 1.03 12th 1.56 1.71 1.36 1.95 0.66 0.73 0.73 0.99§The response categories for race/ethnicity changed in 1999 making comparisons of some categories with earlier years problematic.1The response rate for this survey was less than 70 percent and a full nonresponse bias analysis has not been done to date.2Hispanics and Latinos are not included in these race/ethnicity categories unless specified.
NOTE: �On school property� was not defined for survey respondents. The term �anywhere� is not used in the YRBS questionnaire. Rather, students are simply asked how many times in the last 12months they had been in a physical fight.
SOURCE: Centers for Disease Control and Prevention, National Center for Chronic Disease Prevention and Health Promotion, Youth Risk Behavior Surveillance System (YRBSS), �Youth RiskBehavior Survey� (YRBS), 1993, 1995, 1997, and 1999.
Anywhere On school property
101 Standard Error Tables
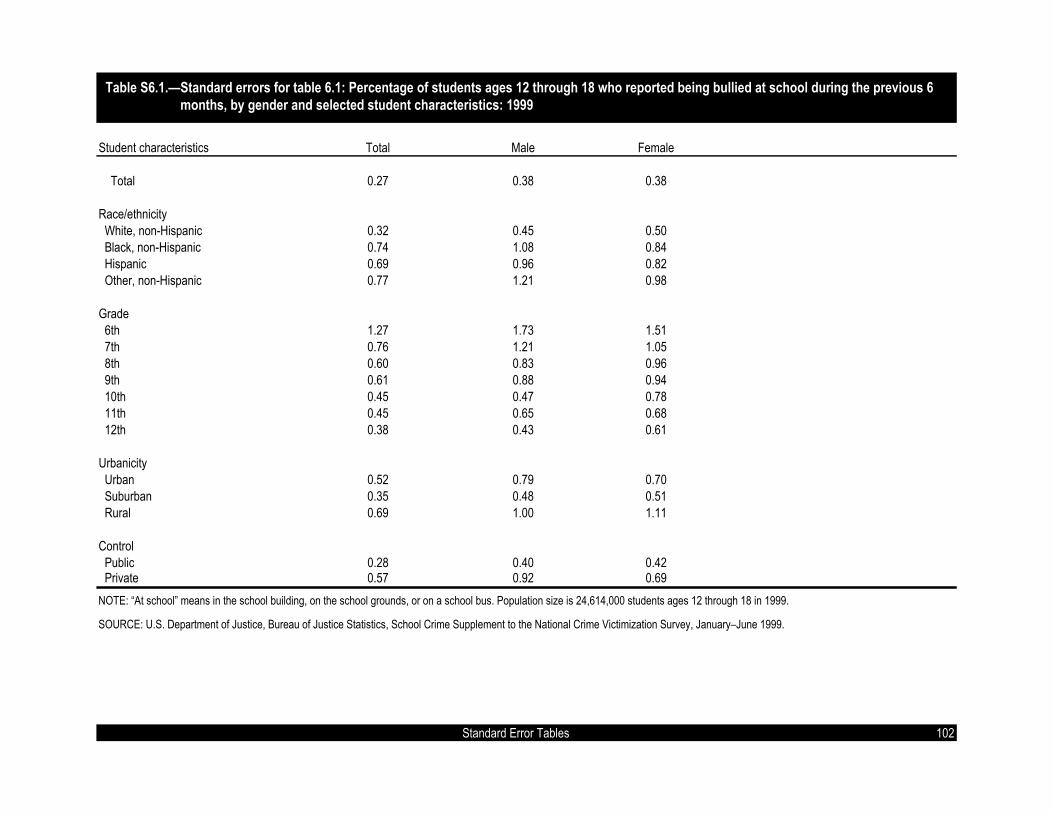
Table S6.1.�Standard errors for table 6.1: Percentage of students ages 12 through 18 who reported being bullied at school during the previous 6 Table S6.1.�months, by gender and selected student characteristics: 1999
Student characteristics Total Male Female
Total 0.27 0.38 0.38
Race/ethnicity White, non-Hispanic 0.32 0.45 0.50 Black, non-Hispanic 0.74 1.08 0.84 Hispanic 0.69 0.96 0.82 Other, non-Hispanic 0.77 1.21 0.98
Grade 6th 1.27 1.73 1.51 7th 0.76 1.21 1.05 8th 0.60 0.83 0.96 9th 0.61 0.88 0.94 10th 0.45 0.47 0.78 11th 0.45 0.65 0.68 12th 0.38 0.43 0.61
Urbanicity Urban 0.52 0.79 0.70 Suburban 0.35 0.48 0.51 Rural 0.69 1.00 1.11
Control Public 0.28 0.40 0.42 Private 0.57 0.92 0.69NOTE: �At school� means in the school building, on the school grounds, or on a school bus. Population size is 24,614,000 students ages 12 through 18 in 1999.
SOURCE: U.S. Department of Justice, Bureau of Justice Statistics, School Crime Supplement to the National Crime Victimization Survey, January�June 1999.
102 Standard Error Tables

Table S7.1.�Standard errors for table 7.1: Percentage of public schools that reported one or more criminal incidents to police, by seriousness of Table S9.1.�the incident, urbanicity, and selected school characteristics: 1996�97
Less serious violent or nonviolent incidentsAny incidents Serious violent incidents and no serious violent incidents
Urban Urban UrbanSchool characteristics Total City fringe Town Rural Total City fringe Town Rural Total City fringe Town Rural
Total 2.09 3.74 3.16 3.84 4.21 0.77 2.11 1.81 1.43 1.46 2.14 4.05 3.23 3.74 4.13
Instructional level Elementary school 3.21 5.34 4.92 6.12 6.24 1.07 2.41 1.70 2.05 2.18 3.19 5.52 4.65 5.99 6.08 Middle school 2.29 2.80 4.47 4.77 7.17 1.87 4.12 5.04 2.62 4.95 2.76 3.85 5.40 4.79 6.99 High school 2.38 3.02 5.07 4.16 4.86 2.07 3.37 5.74 3.30 2.64 2.98 3.87 6.04 5.20 5.20
Region Northeast 4.38 10.37 7.20 8.32 11.77 1.11 2.47 2.40 1.49 4.45 4.66 10.03 7.07 8.37 11.61 Southeast 3.79 7.58 8.98 8.22 7.24 1.63 4.96 4.81 2.00 2.27 3.92 7.44 8.89 7.78 7.10 Central 4.52 6.95 8.14 7.68 7.39 2.21 4.93 4.47 4.55 3.57 4.05 6.21 7.44 6.90 6.75 West 3.50 5.72 6.88 6.88 7.76 1.39 3.71 3.53 2.69 2.64 3.72 6.86 6.47 7.18 7.79
School enrollment Less than 300 4.87 � � 10.09 5.99 1.42 � � 5.60 1.23 4.44 � � 9.22 5.93 300�999 2.19 4.05 3.53 3.68 5.21 1.16 2.60 2.23 0.83 3.18 2.47 4.41 3.78 3.60 5.33 1,000 or more 2.26 2.86 3.66 8.23 � 2.39 4.26 4.30 5.65 � 3.19 5.12 5.01 8.95 �
Minority enrollment Less than 5 percent 3.67 � 8.08 6.18 5.40 1.34 � 3.00 1.26 2.20 3.47 � 8.22 6.14 5.06 5�19 percent 3.84 7.56 6.21 7.09 10.41 2.09 5.33 3.30 5.14 2.88 3.62 8.27 5.92 6.77 9.63 20�49 percent 3.65 6.78 7.51 7.96 9.16 1.58 4.42 3.00 2.17 4.12 3.58 6.32 7.49 8.59 8.95 50 percent or more 3.19 4.75 7.04 8.46 10.22 1.76 2.51 4.68 2.62 5.36 3.89 4.92 7.81 8.79 10.59
Free/reduced-price lunch eligibility Less than 20 percent 3.33 8.84 6.14 7.03 9.20 1.53 3.30 2.72 2.44 2.73 3.23 8.41 5.90 6.56 8.88 21�34 percent 4.25 10.27 8.63 7.72 6.99 1.97 5.60 3.89 4.46 4.47 4.27 9.82 8.97 7.23 6.48 35�49 percent 5.01 8.62 12.35 9.64 7.80 2.32 8.94 5.28 1.80 3.33 4.97 10.73 11.85 9.45 7.87 50�74 percent 4.06 7.83 9.39 9.00 8.83 1.38 4.96 4.95 1.51 1.60 4.47 7.33 9.72 9.29 9.03 75 percent or more 4.67 6.73 � � � 1.73 1.74 � � � 4.75 6.54 � � �
�Fewer than 30 sample cases.
NOTE: Serious violent crimes include murder, rape or other type of sexual battery, suicide, physical attack or fight with a weapon, or robbery. Less serious violent or nonviolent crimes includephysical attack or fight without a weapon, theft/larceny, and vandalism. Any incidents refer to any of the crimes listed. Not included are any crimes not listed here and any crimes not reported topolice. Schools were asked to report crimes that took place in school buildings, on school buses, on school grounds, and at places holding school-sponsored events. Population size is 78,000 publicschools.
SOURCE: U.S. Department of Education, National Center for Education Statistics, Fast Response Survey System, �Principal/School Disciplinarian Survey on School Violence,� FRSS 63, 1997.103 Standard Error Tables

Table S7.2.�Standard errors for table 7.2: Number of public schools that reported one or more criminal incidents to police, by seriousness of the Table S9.2.�incident, urbanicity, and selected school characteristics: 1996�97
Less serious violent or nonviolent incidentsAny incidents Serious violent incidents and no serious violent incidents
Urban Urban UrbanSchool characteristics Total City fringe Town Rural Total City fringe Town Rural Total City fringe Town Rural
Total 1,680 720 620 790 910 590 360 340 280 310 1,710 780 650 760 880
Instructional level Elementary school 1,530 700 610 700 740 520 300 210 40 260 1,510 730 590 680 700 Middle school 340 100 190 220 250 260 130 180 110 150 410 120 190 230 230 High school 420 90 150 240 330 310 80 160 140 160 510 100 170 270 350
Region Northeast 850 310 480 450 330 150 70 120 60 90 870 310 480 450 330 Southeast 770 410 390 480 420 260 170 160 100 110 800 380 370 450 410 Central 1,200 420 500 500 630 500 210 220 230 290 1,070 390 440 410 570 West 1,010 530 510 460 490 310 240 180 150 150 1,040 550 480 450 490
School enrollment Less than 300 1,080 � � 550 730 290 � � 260 140 980 � � 490 720 300�999 1,170 570 550 630 490 570 350 320 120 290 1,290 600 550 600 500 1,000 or more 270 200 140 140 � 160 90 120 70 � 300 220 150 150 �
Minority enrollment Less than 5 percent 940 � 360 530 670 310 � 110 100 260 920 � 360 530 620 5�19 percent 830 380 500 400 370 370 190 210 240 90 770 350 440 340 350 20�49 percent 820 390 470 360 420 280 210 160 90 160 790 350 470 360 390 50 percent or more 880 470 340 390 340 270 190 190 70 110 930 500 330 390 350
Free/reduced-price lunch eligibility Less than 20 percent 730 240 520 390 400 260 80 180 100 110 740 240 500 390 400 21�34 percent 910 280 510 460 400 360 130 140 230 250 840 270 500 380 370 35�49 percent 730 340 320 350 470 300 250 130 60 160 710 260 310 350 460 50�74 percent 990 430 400 570 510 240 180 150 70 70 970 380 390 570 500 75 percent or more 780 480 � � � 220 90 � � � 740 490 � � ��Fewer than 30 sample cases.
NOTE: Serious violent crimes include murder, rape or other type of sexual battery, suicide, physical attack or fight with a weapon, or robbery. Less serious violent or nonviolent crimes includephysical attack or fight without a weapon, theft/larceny, and vandalism. Any incidents refer to any of the crimes listed. Not included are any crimes not listed here and any crimes not reported topolice. Schools were asked to report crimes that took place in school buildings, on school buses, on school grounds, and at places holding school-sponsored events. Population size is 78,000public schools. Standard errors are rounded to the nearest 10.
SOURCE: U.S. Department of Education, National Center for Education Statistics, Fast Response Survey System, �Principal/School Disciplinarian Survey on School Violence,� FRSS 63, 1997.104 Standard Error Tables

Table S7.3.�Standard errors for table 7.3: Number of criminal incidents occurring in public schools reported to police, by seriousness of the Table S9.3.�incident, urbanicity, and selected school characteristics: 1996�97
Any incidents Serious violent incidents Less serious violent or nonviolent incidentsUrban Urban Urban
School characteristics Total City fringe Town Rural Total City fringe Town Rural Total City fringe Town Rural
Total 27,560 17,190 16,040 9,220 8,850 3,290 2,630 980 1,340 730 26,020 14,930 15,680 8,940 8,530
Instructional level Elementary school 10,890 2,860 8,990 5,840 3,460 780 590 210 230 400 10,960 2,680 8,990 5,830 3,440 Middle school 15,620 14,810 8,350 4,420 2,980 2,440 2,450 420 140 340 13,790 12,510 8,210 4,390 2,890 High school 14,920 5,560 9,420 6,710 6,610 1,820 750 850 1,270 560 14,270 5,300 8,800 6,320 6,400
Region Northeast 12,490 3,830 9,630 3,870 2,940 630 550 220 290 170 12,270 3,610 9,610 3,860 2,900 Southeast 12,040 3,850 11,720 4,100 3,990 1,060 530 840 110 330 11,430 3,560 11,090 4,030 3,840 Central 15,180 12,600 4,310 4,480 5,480 2,520 2,420 420 280 670 13,350 10,340 4,190 4,420 5,110 West 12,200 7,490 7,050 8,870 4,320 1,420 730 390 1,290 230 12,060 7,220 6,960 8,420 4,270
School enrollment Less than 300 7,850 � � 5,310 4,840 1,320 � � 1,300 320 7,150 � � 4,350 4,700 300�999 16,700 13,520 6,580 6,900 6,290 2,760 2,460 400 310 660 15,020 11,310 6,410 6,860 6,050 1,000 or more 17,840 6,700 14,760 5,660 � 1,230 780 910 230 � 17,280 6,360 14,350 5,640 �
Minority enrollment Less than 5 percent 8,580 � 3,330 4,300 6,340 440 � 110 100 400 8,480 � 3,330 4,280 6,240 5�19 percent 10,230 3,200 6,570 6,210 2,700 1,400 370 300 1,250 100 9,660 3,090 6,400 5,590 2,680 20�49 percent 14,080 6,120 10,170 5,970 3,340 920 600 540 330 300 13,590 5,870 10,010 5,880 3,140 50 percent or more 21,850 16,420 10,920 4,830 4,270 2,850 2,530 850 90 560 19,960 14,130 10,360 4,820 3,920
Free/reduced-price lunch eligibility Less than 20 percent 9,860 3,360 6,040 4,930 3,900 580 350 360 240 180 9,780 3,200 5,970 4,890 3,890 21�34 percent 11,630 3,300 9,240 4,650 3,420 1,060 590 830 240 370 10,960 3,030 8,510 4,560 3,400 35�49 percent 11,430 5,130 8,640 3,270 4,280 750 670 150 300 270 11,180 4,900 8,640 3,180 4,180 50�74 percent 16,070 14,040 6,320 4,710 3,190 2,460 2,470 350 80 70 14,280 11,760 6,110 4,710 3,190 75 percent or more 10,620 5,010 � � � 1,340 500 � � � 10,110 4,740 � � �
�Fewer than 30 sample cases.
NOTE: Serious violent crimes include murder, rape or other type of sexual battery, suicide, physical attack or fight with a weapon, or robbery. Less serious violent or nonviolent crimes includephysical attack or fight without a weapon, theft/larceny, and vandalism. Any incidents refer to any of the crimes listed. Not included are any crimes not listed here and any crimes not reported topolice. Schools were asked to report crimes that took place in school buildings, on school buses, on school grounds, and at places holding school-sponsored events. Standard errors are rounded tothe nearest 10.
SOURCE: U.S. Department of Education, National Center for Education Statistics, Fast Response Survey System, �Principal/School Disciplinarian Survey on School Violence,� FRSS 63, 1997.
105 Standard Error Tables

Table S7.4.�Standard errors for table 7.4: Number of criminal incidents reported to police per 1,000 public school students, by seriousness of the Table S9.4.�incident, urbanicity, and selected school characteristics: 1996�97
Less serious violent or nonviolent incidentsUrban Urban Urban
School characteristics Total City fringe Town Rural Total City fringe Town Rural Total City fringe Town Rural
Total 0.67 1.42 1.27 0.96 1.25 0.08 0.21 0.08 0.13 0.10 0.63 1.24 1.24 0.93 1.20
Instructional level Elementary school 0.49 0.43 1.31 1.22 0.90 0.04 0.09 0.03 0.05 0.11 0.49 0.40 1.32 1.21 0.90 Middle school 1.84 5.94 3.25 2.00 2.76 0.29 0.99 0.16 0.06 0.31 1.62 5.01 3.19 1.98 2.70 High school 1.33 1.75 2.94 2.34 2.99 0.16 0.22 0.26 0.43 0.27 1.27 1.69 2.75 2.18 2.88
Region Northeast 1.41 1.69 2.95 1.69 2.71 0.08 0.26 0.07 0.14 0.18 1.38 1.59 2.95 1.69 2.67 Southeast 1.22 1.39 4.75 1.29 1.59 0.10 0.19 0.33 0.04 0.14 1.16 1.31 4.50 1.27 1.55 Central 1.46 5.32 1.40 1.69 2.42 0.25 1.01 0.14 0.12 0.29 1.27 4.37 1.37 1.68 2.26 West 0.94 1.28 1.63 3.29 3.14 0.10 0.12 0.10 0.46 0.16 0.93 1.26 1.60 3.12 3.09
School enrollment Less than 300 1.89 � � 6.19 2.36 0.35 � � 1.52 0.16 1.73 � � 5.05 2.29 300�999 0.61 1.77 0.83 0.96 1.35 0.10 0.32 0.05 0.04 0.14 0.55 1.48 0.81 0.96 1.30 1,000 or more 1.68 1.61 3.56 � 3.82 0.12 0.17 0.23 0.13 � 1.62 1.54 3.46 3.21 �
Minority enrollment Less than 5 percent 0.88 � 1.49 1.19 1.71 0.05 � 0.06 0.03 0.11 0.86 � 1.49 1.19 1.69 5�19 percent 0.90 1.55 1.37 2.50 1.94 0.13 0.17 0.06 0.49 0.08 0.87 1.52 1.35 2.25 1.94 20�49 percent 1.29 1.61 3.12 2.63 2.11 0.09 0.19 0.17 0.15 0.19 1.25 1.54 3.07 2.61 2.00 50 percent or more 1.83 2.64 3.85 2.40 5.68 0.25 0.39 0.29 0.06 0.77 1.65 2.29 3.66 2.40 5.22
Free/reduced-price lunch eligibility Less than 20 percent 0.80 1.68 1.07 1.68 2.64 0.05 0.17 0.07 0.09 0.13 0.80 1.61 1.06 1.66 2.63 21�34 percent 1.34 1.69 3.50 1.85 1.76 0.11 0.29 0.32 0.09 0.18 1.27 1.57 3.22 1.83 1.76 35�49 percent 1.76 2.72 5.75 2.24 2.38 0.11 0.38 0.10 0.17 0.16 1.72 2.64 5.76 2.18 2.33 50�74 percent 1.95 4.78 3.20 1.64 2.67 0.31 0.86 0.18 0.04 0.07 1.71 4.00 3.10 1.65 2.67 75 percent or more 1.48 1.38 � � � 0.21 0.12 � � � 1.38 1.31 � � �
�Fewer than 30 sample cases.
NOTE: Serious violent crimes include murder, rape or other type of sexual battery, suicide, physical attack or fight with a weapon, or robbery. Less serious violent or nonviolent crimes includephysical attack or fight without a weapon, theft/larceny, and vandalism. Any incidents refer to any of the crimes listed. Not included are any crimes not listed here and any crimes not reported topolice. Schools were asked to report crimes that took place in school buildings, on school buses, on school grounds, and at places holding school-sponsored events. Population size is 42,336,819public school students.
SOURCE: U.S. Department of Education, National Center for Education Statistics, Fast Response Survey System, �Principal/School Disciplinarian Survey on School Violence,� FRSS 63, 1997.106
Any incidents Serious violent incidents
Standard Error Tables
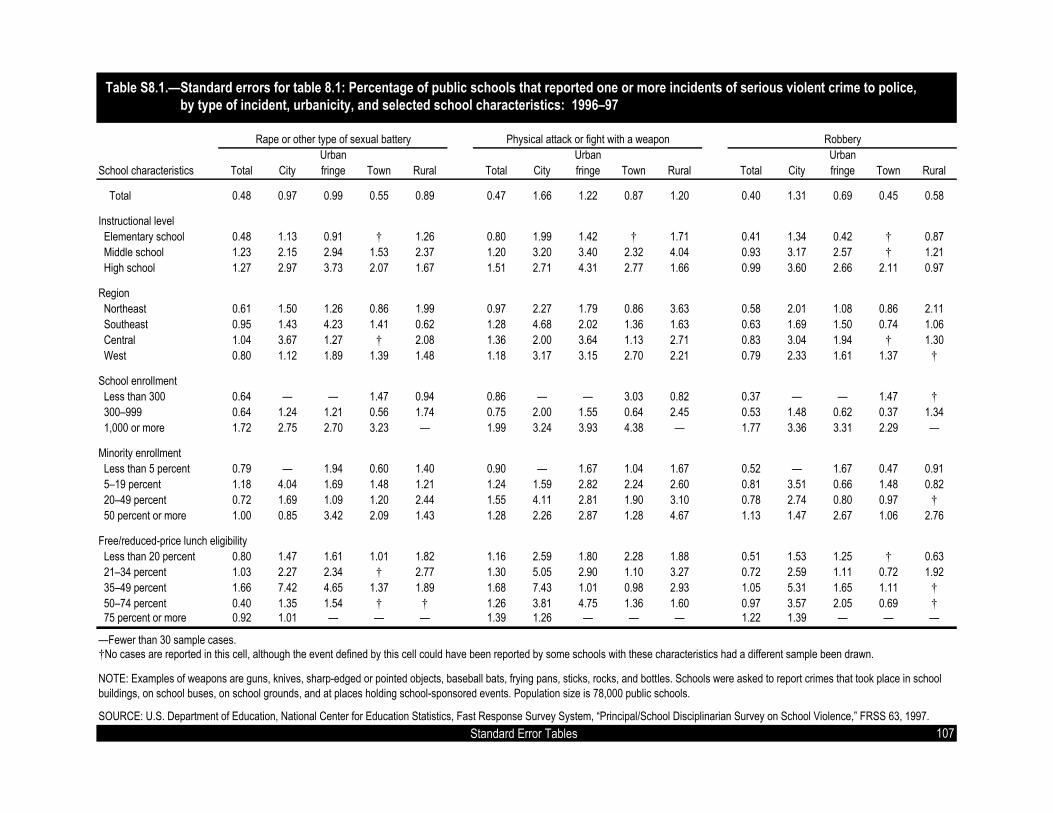
Table S8.1.�Standard errors for table 8.1: Percentage of public schools that reported one or more incidents of serious violent crime to police, Table S9.1.�by type of incident, urbanicity, and selected school characteristics: 1996�97
Rape or other type of sexual battery Physical attack or fight with a weapon RobberyUrban Urban Urban
School characteristics Total City fringe Town Rural Total City fringe Town Rural Total City fringe Town Rural
Total 0.48 0.97 0.99 0.55 0.89 0.47 1.66 1.22 0.87 1.20 0.40 1.31 0.69 0.45 0.58
Instructional level Elementary school 0.48 1.13 0.91 � 1.26 0.80 1.99 1.42 � 1.71 0.41 1.34 0.42 � 0.87 Middle school 1.23 2.15 2.94 1.53 2.37 1.20 3.20 3.40 2.32 4.04 0.93 3.17 2.57 � 1.21 High school 1.27 2.97 3.73 2.07 1.67 1.51 2.71 4.31 2.77 1.66 0.99 3.60 2.66 2.11 0.97
Region Northeast 0.61 1.50 1.26 0.86 1.99 0.97 2.27 1.79 0.86 3.63 0.58 2.01 1.08 0.86 2.11 Southeast 0.95 1.43 4.23 1.41 0.62 1.28 4.68 2.02 1.36 1.63 0.63 1.69 1.50 0.74 1.06 Central 1.04 3.67 1.27 � 2.08 1.36 2.00 3.64 1.13 2.71 0.83 3.04 1.94 � 1.30 West 0.80 1.12 1.89 1.39 1.48 1.18 3.17 3.15 2.70 2.21 0.79 2.33 1.61 1.37 �
School enrollment Less than 300 0.64 � � 1.47 0.94 0.86 � � 3.03 0.82 0.37 � � 1.47 � 300�999 0.64 1.24 1.21 0.56 1.74 0.75 2.00 1.55 0.64 2.45 0.53 1.48 0.62 0.37 1.34 1,000 or more 1.72 2.75 2.70 3.23 � 1.99 3.24 3.93 4.38 � 1.77 3.36 3.31 2.29 �
Minority enrollment Less than 5 percent 0.79 � 1.94 0.60 1.40 0.90 � 1.67 1.04 1.67 0.52 � 1.67 0.47 0.91 5�19 percent 1.18 4.04 1.69 1.48 1.21 1.24 1.59 2.82 2.24 2.60 0.81 3.51 0.66 1.48 0.82 20�49 percent 0.72 1.69 1.09 1.20 2.44 1.55 4.11 2.81 1.90 3.10 0.78 2.74 0.80 0.97 � 50 percent or more 1.00 0.85 3.42 2.09 1.43 1.28 2.26 2.87 1.28 4.67 1.13 1.47 2.67 1.06 2.76
Free/reduced-price lunch eligibility Less than 20 percent 0.80 1.47 1.61 1.01 1.82 1.16 2.59 1.80 2.28 1.88 0.51 1.53 1.25 � 0.63 21�34 percent 1.03 2.27 2.34 � 2.77 1.30 5.05 2.90 1.10 3.27 0.72 2.59 1.11 0.72 1.92 35�49 percent 1.66 7.42 4.65 1.37 1.89 1.68 7.43 1.01 0.98 2.93 1.05 5.31 1.65 1.11 � 50�74 percent 0.40 1.35 1.54 � � 1.26 3.81 4.75 1.36 1.60 0.97 3.57 2.05 0.69 � 75 percent or more 0.92 1.01 � � � 1.39 1.26 � � � 1.22 1.39 � � �
�Fewer than 30 sample cases.�No cases are reported in this cell, although the event defined by this cell could have been reported by some schools with these characteristics had a different sample been drawn.
NOTE: Examples of weapons are guns, knives, sharp-edged or pointed objects, baseball bats, frying pans, sticks, rocks, and bottles. Schools were asked to report crimes that took place in schoolbuildings, on school buses, on school grounds, and at places holding school-sponsored events. Population size is 78,000 public schools.
SOURCE: U.S. Department of Education, National Center for Education Statistics, Fast Response Survey System, �Principal/School Disciplinarian Survey on School Violence,� FRSS 63, 1997.107 Standard Error Tables

Table S8.2.�Standard errors for table 8.2: Percentage of public schools that reported one or more less serious violent or nonviolent criminal Table S9.2.�incidents to police, by type of incident, urbanicity, and selected school characteristics: 1996�97
Physical attack or fight without a weapon Theft or larceny VandalismUrban Urban Urban
School characteristics Total City fringe Town Rural Total City fringe Town Rural Total City fringe Town Rural
Total 1.14 2.41 2.60 2.32 2.62 1.54 2.66 2.41 3.45 3.33 1.65 3.17 2.89 3.53 3.72
Instructional level Elementary school 1.69 3.12 3.50 3.46 3.42 2.04 3.51 3.37 5.24 4.20 2.27 4.25 4.27 5.52 5.02 Middle school 2.34 3.41 4.80 4.69 6.57 2.46 4.08 5.32 5.32 5.62 2.61 3.80 5.00 4.83 7.07 High school 2.94 4.00 6.10 5.34 4.49 3.11 4.44 6.23 5.55 5.07 2.69 3.60 6.12 5.87 5.40
Region Northeast 2.26 4.59 4.62 5.39 7.05 3.31 8.48 4.72 7.14 6.81 3.56 9.35 5.76 9.15 11.56 Southeast 2.67 6.52 7.44 5.90 4.29 3.63 5.16 8.52 7.23 6.74 3.15 5.74 8.25 6.47 6.90 Central 2.55 6.01 6.51 6.07 4.39 2.66 5.30 5.12 6.23 5.25 3.58 6.63 5.80 5.27 6.34 West 2.99 4.87 6.20 5.92 5.66 3.02 5.08 6.76 6.58 7.23 3.49 4.92 6.89 7.00 6.84
School enrollment Less than 300 2.85 � � 4.59 4.10 3.11 � � 7.56 4.59 3.92 � � 8.19 5.24 300�999 1.44 3.05 3.01 3.04 3.03 1.83 3.23 3.08 3.91 4.05 1.69 3.75 3.63 3.49 4.82 1,000 or more 2.97 4.75 6.01 8.88 � 3.24 3.78 5.59 9.17 � 3.28 5.08 5.49 8.84 �
Minority enrollment Less than 5 percent 2.40 � 7.00 4.06 3.72 2.83 � 5.50 5.62 4.19 3.29 � 6.70 5.59 4.47 5�19 percent 3.03 4.90 5.73 5.65 7.79 3.09 4.84 4.99 6.70 7.73 2.97 7.00 5.55 6.93 10.26 20�49 percent 2.88 6.66 5.66 6.71 5.45 3.28 5.42 6.80 6.97 6.93 3.46 5.79 6.06 8.28 8.08 50 percent or more 3.13 3.46 7.54 8.41 10.07 3.47 4.37 7.83 9.33 11.43 3.34 4.36 7.25 9.31 10.57
Free/reduced-price lunch eligibility Less than 20 percent 2.47 5.79 4.07 5.28 6.02 2.74 5.42 4.32 6.22 5.99 3.58 8.40 5.84 7.22 8.96 21�34 percent 2.90 7.63 7.50 5.25 5.86 2.95 8.44 4.78 6.07 3.86 3.98 9.58 8.13 7.07 4.88 35�49 percent 3.45 9.38 7.77 7.84 5.02 4.77 9.71 10.22 7.49 6.81 4.38 9.50 7.86 8.35 7.28 50�74 percent 3.43 7.03 6.74 6.43 6.57 3.56 6.44 7.40 8.62 7.31 3.57 5.73 10.60 9.11 8.26 75 percent or more 2.99 4.51 � � � 3.90 5.53 � � � 3.88 5.83 � � �
�Fewer than 30 sample cases.
NOTE: Examples of weapons are guns, knives, sharp-edged or pointed objects, baseball bats, frying pans, sticks, rocks, and bottles. Schools were asked to report crimes that took place in schoolbuildings, on school buses, on school grounds, and at places holding school-sponsored events. Population size is 78,000 public schools.
SOURCE: U.S. Department of Education, National Center for Education Statistics, Fast Response Survey System, �Principal/School Disciplinarian Survey on School Violence,� FRSS 63, 1997.108 Standard Error Tables

Table S8.3.�Standard errors for table 8.3: Number of public schools that reported one or more incidents of serious violent crime to police, by type Table S9.3.�of incident, urbanicity, and selected school characteristics: 1996�97
Urban Urban UrbanSchool characteristics Total City fringe Town Rural Total City fringe Town Rural Total City fringe Town Rural
Total 371.5 175.0 186.3 106.3 187.1 365.1 285.3 229.4 170.7 252.0 306.5 234.4 127.8 87.9 122.6
Instructional level Elementary school 229.4 21.5 17.3 � 24.8 383.0 245.1 178.4 � 204.4 197.7 167.5 8.0 � 16.6 Middle school 169.1 66.0 104.5 67.0 71.9 170.4 98.4 123.6 100.4 121.7 128.7 96.5 90.7 � 35.9 High school 197.5 71.2 106.9 85.7 102.4 235.3 66.5 119.6 116.4 102.9 151.7 84.1 73.5 87.9 59.8
Region Northeast 88.2 40.4 66.9 5.2 42.9 136.2 59.5 94.5 5.2 73.8 80.7 54.2 56.7 5.2 46.5 Southeast 155.3 47.5 137.3 71.6 4.3 210.1 173.6 63.9 67.0 78.2 105.1 62.0 49.2 5.2 7.6 Central 231.3 166.5 11.0 � 165.7 304.2 78.1 181.5 55.7 215.4 185.6 130.2 93.3 � 16.6 West 176.7 61.6 102.4 74.6 12.8 281.8 210.3 158.2 147.4 129.0 174.4 157.5 80.7 73.9 �
School enrollment Less than 300 129.2 � � 10.2 108.6 174.1 � � 139.7 94.8 74.9 � � 10.2 � 300�999 317.8 165.5 170.0 75.6 158.8 377.7 268.9 219.3 90.0 223.6 261.8 196.8 86.6 50.9 122.6 1,000 or more 119.7 70.6 72.9 42.0 � 137.9 85.6 105.7 57.7 � 122.3 93.6 89.2 4.8 �
Minority enrollment Less than 5 percent 188.2 � 70.5 46.6 164.6 211.5 � 11.0 80.6 198.4 125.8 � 11.0 5.2 107.0 5�19 percent 215.8 143.3 107.1 10.2 39.6 207.3 47.0 176.9 99.3 79.1 142.7 122.7 40.9 10.2 3.7 20�49 percent 125.8 73.1 56.6 44.0 90.9 265.6 198.1 147.3 73.0 117.2 144.5 135.5 42.3 5.2 � 50 percent or more 169.5 66.6 133.7 8.9 4.3 208.0 179.0 99.7 5.2 93.9 180.8 112.2 96.0 4.8 57.5
Free/reduced-price lunch eligibility Less than 20 percent 147.7 37.4 109.3 46.6 73.8 198.7 64.8 122.9 97.6 75.8 95.8 42.1 14.3 � 3.7 21�34 percent 176.4 50.7 89.6 � 153.2 232.4 124.5 108.1 56.6 184.0 123.7 61.2 43.3 5.2 107.0 35�49 percent 214.7 163.8 116.6 44.0 90.9 219.6 184.9 4.1 4.6 135.3 135.9 125.3 40.9 5.2 � 50�74 percent 64.7 48.9 48.2 � � 213.3 139.5 151.3 8.9 70.6 151.2 142.2 59.8 4.8 � 75 percent or more 104.3 54.3 � � � 174.3 67.3 � � � 150.5 77.6 � � �
�Fewer than 30 sample cases.�No cases are reported in this cell, although the event defined by this cell could have been reported by some schools with these characteristics had a different sample been drawn.
NOTE: Examples of weapons are guns, knives, sharp-edged or pointed objects, baseball bats, frying pans, sticks, rocks, and bottles. Schools were asked to report crimes that took place in schoolbuildings, on school buses, on school grounds, and at places holding school-sponsored events. Population size is 78,000 public schools.
SOURCE: U.S. Department of Education, National Center for Education Statistics, Fast Response Survey System, �Principal/School Disciplinarian Survey on School Violence,� FRSS 63, 1997.109
Rape or other type of sexual battery Physical attack or fight with a weapon Robbery
Standard Error Tables

Table S8.4.�Standard errors for table 8.4: Number of public schools that reported one or more less serious violent or nonviolent criminal incidents Table S9.4.�to police, by type of incident, urbanicity, and selected school characteristics: 1996�97
Physical attack or fight without a weapon Theft or larceny VandalismUrban Urban Urban
School characteristics Total City fringe Town Rural Total City fringe Town Rural Total City fringe Town Rural
Total 930 420 520 450 560 1,200 460 470 680 700 1,330 560 560 700 800
Instructional level Elementary school 820 390 450 370 400 980 430 430 590 490 1,100 530 530 620 600 Middle school 340 100 170 210 210 350 130 190 220 170 400 120 200 210 220 High school 460 120 180 250 280 520 100 180 260 320 450 90 170 260 340
Region Northeast 380 90 270 210 160 490 240 260 320 170 650 280 340 450 280 Southeast 440 260 240 300 210 660 210 300 400 360 540 300 310 300 360 Central 710 270 350 360 350 620 260 260 350 400 900 370 310 300 540 West 680 330 340 330 310 680 400 360 360 430 830 450 440 450 400
School enrollment Less than 300 620 � � 230 490 650 � � 360 540 850 � � 400 640 300�999 740 410 430 440 280 950 430 430 600 380 870 530 540 520 450 1,000 or more 230 130 180 140 � 290 190 180 140 � 280 160 170 140 �
Minority enrollment Less than 5 percent 600 � 270 350 440 630 � 210 430 490 860 � 300 450 530 5�19 percent 590 170 360 240 260 580 160 320 290 260 710 340 410 340 360 20�49 percent 570 330 310 270 210 660 270 400 290 280 680 330 340 320 340 50 percent or more 580 280 260 270 190 710 410 260 320 280 860 410 300 370 260
Free/reduced-price lunch eligibility Less than 20 percent 460 130 300 260 250 580 100 330 320 250 710 230 450 330 400 21�34 percent 530 150 320 230 340 510 200 200 300 210 700 280 410 390 250 35�49 percent 460 270 180 250 250 620 290 260 250 380 620 330 190 260 400 50�74 percent 610 270 270 290 300 700 220 280 440 360 760 260 370 500 420 75 percent or more 380 280 � � � 590 350 � � � 660 410 � � �
�Fewer than 30 sample cases.
NOTE: Examples of weapons are guns, knives, sharp-edged or pointed objects, baseball bats, frying pans, sticks, rocks, and bottles. Schools were asked to report crimes that took place in schoolbuildings, on school buses, on school grounds, and at places holding school-sponsored events. Standard errors are rounded to the nearest 10.
SOURCE: U.S. Department of Education, National Center for Education Statistics, Fast Response Survey System, �Principal/School Disciplinarian Survey on School Violence,� FRSS 63, 1997.110 Standard Error Tables

Table S8.5.�Standard errors for table 8.5: Number of serious violent criminal incidents occurring in public schools reported to police, by type of Table S9.5.�incident, urbanicity, and selected school characteristics: 1996�97
Urban Urban UrbanSchool characteristics Total City fringe Town Rural Total City fringe Town Rural Total City fringe Town Rural
Total 680 440 290 120 360 1,880 1,520 370 960 590 1,540 1,190 620 360 290
Instructional level Elementary school 420 280 110 � 300 560 450 180 � 270 200 170 50 � 100 Middle school 360 170 240 70 140 1,440 1,450 220 110 290 1,020 1,030 120 � 70 High school 340 240 150 100 190 1,080 300 310 910 410 890 470 600 360 270
Region Northeast 140 80 90 � 70 260 190 160 � 90 400 300 90 290 90 Southeast 330 210 220 90 150 420 340 240 70 80 660 120 550 � 260 Central 480 360 60 � 330 1,580 1,460 210 190 560 1,010 970 320 � 100 West 340 170 180 70 90 1,000 370 260 950 220 470 440 120 210 �
School enrollment Less than 300 170 � � 70 160 980 � � 950 280 210 � � 200 � 300�999 570 360 250 80 340 1,570 1,490 230 100 480 1,250 980 120 290 290 1,000 or more 310 250 150 70 � 520 380 330 220 � 770 470 600 60 �
Minority enrollment Less than 5 percent 340 � 70 50 330 230 � 60 80 220 140 � 60 � 120 5�19 percent 330 280 140 70 40 970 200 250 900 80 250 130 70 200 50 20�49 percent 320 210 190 70 170 480 390 230 140 210 500 240 260 290 � 50 percent or more 260 170 190 60 � 1,510 1,480 270 � 480 1,430 1,110 550 60 260
Free/reduced-price lunch eligibility Less than 20 percent 240 140 140 50 140 320 110 130 240 120 340 140 320 � 50 21�34 percent 360 110 160 � 300 480 340 310 80 190 610 300 540 � 120 35�49 percent 410 360 120 70 170 460 420 � � 220 360 200 70 290 � 50�74 percent 220 150 170 � � 1,460 1,460 210 60 70 1,020 1,020 100 60 � 75 percent or more 150 110 � � � 980 170 � � � 520 370 � � �
�Fewer than 30 sample cases.�No cases are reported in this cell, although the event defined by this cell could have been reported by some schools with these characteristics had a different sample been drawn.�Values are less than 50.
NOTE: Examples of weapons are guns, knives, sharp-edged or pointed objects, baseball bats, frying pans, sticks, rocks, and bottles. Schools were asked to report crimes that took place in schoolbuildings, on school buses, on school grounds, and at places holding school-sponsored events. Standard errors are rounded to the nearest 10.
SOURCE: U.S. Department of Education, National Center for Education Statistics, Fast Response Survey System, �Principal/School Disciplinarian Survey on School Violence,� FRSS 63, 1997.111 Standard Error Tables
RobberyPhysical attack or fight with a weaponRape or other type of sexual battery

Table S8.6.�Standard errors for table 8.6: Number of less serious violent or nonviolent criminal incidents occurring in public schools reported to Table S9.6.�police, by type of incident, urbanicity, and selected school characteristics: 1996�97
Physical attack or fight without a weapon Theft or larceny VandalismUrban Urban Urban
School characteristics Total City fringe Town Rural Total City fringe Town Rural Total City fringe Town Rural
Total 17,030 9,220 11,540 5,770 4,300 8,400 4,190 4,130 3,550 3,590 5,580 3,380 3,510 2,780 2,650
Instructional level Elementary school 7,000 830 5,250 4,710 1,640 3,390 1,260 2,810 1,110 1,060 4,210 1,790 3,000 2,160 1,310 Middle school 10,430 8,860 6,450 2,360 1,500 3,370 2,510 1,700 1,560 1,160 2,280 1,650 650 1,470 1,080 High school 9,360 2,430 7,340 3,420 3,610 5,660 2,790 2,470 3,120 2,660 2,870 1,730 1,400 1,470 1,680
Region Northeast 6,820 2,090 6,060 1,120 1,450 4,830 970 3,010 1,570 1,510 2,380 1,050 1,170 2,060 480 Southeast 8,800 1,850 9,210 2,880 2,400 3,150 1,630 1,690 1,300 1,290 1,840 1,090 1,210 870 1,010 Central 10,030 8,160 2,880 2,390 2,930 2,800 1,940 1,100 1,330 1,920 2,690 910 730 1,120 1,790 West 7,300 3,430 3,070 5,610 1,960 4,970 2,880 2,710 3,160 1,700 4,400 2,870 3,120 2,100 1,470
School enrollment Less than 300 3,700 � � 2,440 2,230 2,270 � � 1,090 1,720 2,450 � � 1,590 1,790 300�999 10,730 8,210 4,900 4,920 3,560 4,450 2,340 1,460 2,380 2,620 4,140 2,240 1,880 2,330 1,660 1,000 or more 11,520 2,950 10,340 3,220 � 5,290 2,990 3,830 2,530 � 3,610 2,060 3,070 1,130 �
Minority enrollment Less than 5 percent 3,250 � 1,210 2,050 2,530 3,620 � 1,660 1,550 2,780 2,770 � 820 1,650 1,800 5�19 percent 5,120 1,590 3,780 2,330 1,560 4,520 1,550 2,540 2,520 1,220 2,870 640 1,570 1,780 770 20�49 percent 9,330 3,260 6,970 5,130 1,950 4,050 2,290 2,940 730 1,060 2,220 1,380 920 970 770 50 percent or more 13,700 8,840 8,310 3,040 2,820 4,590 3,540 1,390 1,380 1,030 5,170 3,010 2,980 1,830 1,340
Free/reduced-price lunch eligibility Less than 20 percent 5,550 1,570 3,590 2,890 1,740 3,940 1,680 2,060 1,980 1,700 2,330 650 1,370 1,110 990 21�34 percent 7,730 1,560 7,020 1,530 1,790 4,360 1,330 2,070 2,550 1,690 2,330 940 1,160 1,690 930 35�49 percent 6,980 2,890 5,600 2,150 2,300 3,780 1,920 2,680 1,130 1,410 1,970 1,130 630 870 1,250 50�74 percent 9,870 8,360 4,680 2,690 1,510 3,400 2,830 1,470 1,350 1,070 2,560 2,010 790 1,620 1,310 75 percent or more 5,940 2,390 � � � 2,700 1,510 � � � 4,310 2,110 � � �
�Fewer than 30 sample cases.
NOTE: Examples of weapons are guns, knives, sharp-edged or pointed objects, baseball bats, frying pans, sticks, rocks, and bottles. Schools were asked to report crimes that took place in schoolbuildings, on school buses, on school grounds, and at places holding school-sponsored events. Population size is 78,000 public schools. Standard errors are rounded to the nearest 10.
SOURCE: U.S. Department of Education, National Center for Education Statistics, Fast Response Survey System, �Principal/School Disciplinarian Survey on School Violence,� FRSS 63, 1997.112 Standard Error Tables

Table S8.7.�Standard errors for table 8.7: Number of serious violent criminal incidents reported to police per 1,000 public school students, by Table S9.7.�type of incident, urbanicity, and selected school characteristics: 1996�97
Urban Urban UrbanSchool characteristics Total City fringe Town Rural Total City fringe Town Rural Total City fringe Town Rural
Total 0.02 0.04 0.02 0.02 0.05 0.04 0.12 0.03 0.10 0.08 0.04 0.09 0.05 0.04 0.04
Instructional level Elementary school 0.02 0.02 0.02 � 0.08 0.03 0.07 0.02 � 0.07 0.02 0.02 0.02 � 0.02 Middle school 0.04 0.07 0.09 0.02 0.13 0.17 0.59 0.08 0.05 0.26 0.12 0.41 0.05 � 0.07 High school 0.03 0.07 0.04 0.03 0.09 0.09 0.09 0.09 0.31 0.19 0.07 0.12 0.18 0.12 0.12
Region Northeast 0.02 0.04 0.03 0.02 0.07 0.03 0.09 0.05 0.02 0.10 0.05 0.14 0.03 0.14 0.09 Southeast 0.03 0.08 0.09 0.03 0.07 0.04 0.12 0.10 0.02 0.04 0.06 0.04 0.22 0.02 0.12 Central 0.05 0.15 0.02 � 0.14 0.16 0.60 0.07 0.08 0.24 0.10 0.40 0.12 � 0.02 West 0.03 0.03 0.05 0.02 0.06 0.07 0.07 0.07 0.34 0.15 0.03 0.06 0.03 0.08 �
School enrollment Less than 300 0.05 � � 0.08 0.08 0.26 � � 1.11 0.14 0.06 � � 0.24 � 300�999 0.02 0.05 0.03 0.02 0.07 0.06 0.19 0.03 0.02 0.10 0.05 0.13 0.02 0.02 0.06 1,000 or more 0.03 0.06 0.04 0.04 � 0.05 0.09 0.08 0.12 � 0.07 0.08 0.15 0.02 �
Minority enrollment Less than 5 percent 0.04 � 0.02 0.02 0.09 0.03 � 0.02 0.02 0.06 0.02 � 0.02 0.02 0.02 5�19 percent 0.03 0.13 0.03 0.02 0.02 0.09 0.10 0.05 0.35 0.07 0.02 0.06 0.02 0.08 0.02 20�49 percent 0.03 0.07 0.06 0.02 0.12 0.05 0.12 0.07 0.06 0.14 0.05 0.07 0.08 0.14 � 50 percent or more 0.02 0.03 0.06 0.02 0.02 0.13 0.23 0.09 0.02 0.66 0.12 0.17 0.19 0.02 0.38
Free/reduced-price lunch eligibility Less than 20 percent 0.02 0.07 0.03 0.02 0.09 0.03 0.06 0.03 0.09 0.08 0.03 0.07 0.06 � 0.02 21�34 percent 0.04 0.06 0.06 � 0.16 0.05 0.17 0.12 0.03 0.09 0.07 0.14 0.21 0.02 0.06 35�49 percent 0.06 0.22 0.08 0.04 0.10 0.07 0.24 0.02 0.02 0.13 0.05 0.11 0.05 0.17 � 50�74 percent 0.03 0.05 0.09 � � 0.19 0.51 0.11 0.02 0.07 0.13 0.35 0.05 0.02 � 75 percent or more 0.03 0.03 � � � 0.15 0.05 � � � 0.07 0.06 � � �
�Fewer than 30 sample cases.�No cases are reported in this cell, although the event defined by this cell could have been reported by some schools with these characteristics had a different sample been drawn.
NOTE: Examples of weapons are guns, knives, sharp-edged or pointed objects, baseball bats, frying pans, sticks, rocks, and bottles. Schools were asked to report crimes that took place in schoolbuildings, on school buses, on school grounds, and at places holding school-sponsored events. Population size is 42,336,819 public school students. Values of 0.0 are less than 0.05.
SOURCE: U.S. Department of Education, National Center for Education Statistics, Fast Response Survey System, �Principal/School Disciplinarian Survey on School Violence,� FRSS 63, 1997.113 Standard Error Tables
Rape or other type of sexual battery Physical attack or fight with a weapon Robbery

Table S8.8.�Standard errors for table 8.8: Number of less serious violent or nonviolent criminal incidents reported to police per 1,000 public school Table S9.8.�students, by type of incident, urbanicity, and selected school characteristics: 1996�97
Urban Urban UrbanSchool characteristics Total City fringe Town Rural Total City fringe Town Rural Total City fringe Town Rural
Total 0.41 0.76 0.93 0.59 0.61 0.20 0.34 0.33 0.35 0.51 0.13 0.27 0.26 0.29 0.36
Instructional level Elementary school 0.31 0.12 0.79 0.97 0.43 0.15 0.18 0.42 0.22 0.28 0.19 0.27 0.43 0.45 0.34 Middle school 1.23 3.56 2.51 1.08 1.38 0.39 1.00 0.66 0.70 1.10 0.27 0.65 0.25 0.63 1.01 High school 0.84 0.80 2.29 1.18 1.66 0.50 0.90 0.77 1.04 1.23 0.23 0.50 0.42 0.53 0.74
Region Northeast 0.78 0.93 1.90 0.50 1.31 0.56 0.42 0.93 0.68 1.52 0.27 0.49 0.36 0.95 0.42 Southeast 0.90 0.71 3.77 0.91 1.03 0.30 0.64 0.66 0.44 0.52 0.17 0.33 0.45 0.32 0.42 Central 0.99 3.41 0.98 0.92 1.30 0.27 0.82 0.36 0.53 0.86 0.25 0.36 0.23 0.45 0.75 West 0.55 0.62 0.73 2.03 1.40 0.39 0.56 0.68 1.19 1.20 0.31 0.48 0.71 0.72 1.03
School enrollment Less than 300 0.92 � � 2.81 1.11 0.59 � � 1.26 0.87 0.60 � � 1.88 0.87 300�999 0.39 1.07 0.63 0.68 0.76 0.16 0.30 0.19 0.32 0.56 0.15 0.29 0.23 0.31 0.36 1,000 or more 1.12 0.77 2.58 1.82 � 0.46 0.66 0.91 1.49 � 0.32 0.44 0.72 0.65 �
Minority enrollment Less than 5 percent 0.32 � 0.57 0.56 0.69 0.38 � 0.79 0.42 0.76 0.29 � 0.35 0.49 0.48 5�19 percent 0.49 0.76 0.83 0.98 1.35 0.44 0.78 0.57 0.98 0.90 0.24 0.28 0.32 0.70 0.58 20�49 percent 0.89 0.93 2.16 2.34 1.32 0.37 0.65 0.87 0.34 0.67 0.20 0.34 0.28 0.41 0.45 50 percent or more 1.16 1.40 2.95 1.69 3.81 0.38 0.57 0.48 0.77 1.54 0.40 0.47 1.02 1.02 1.93
Free/reduced-price lunch eligibility Less than 20 percent 0.48 0.81 0.67 1.03 1.13 0.32 0.81 0.36 0.67 1.19 0.19 0.36 0.25 0.40 0.66 21�34 percent 0.89 0.84 2.73 0.63 0.93 0.47 0.65 0.80 0.97 0.89 0.27 0.46 0.38 0.69 0.45 35�49 percent 1.06 1.80 3.74 1.38 1.26 0.58 1.01 1.78 0.73 0.85 0.30 0.48 0.43 0.54 0.67 50�74 percent 1.20 2.90 2.48 1.06 1.30 0.41 0.99 0.69 0.52 0.97 0.29 0.64 0.39 0.63 1.16 75 percent or more 0.89 0.67 � � � 0.37 0.39 � � � 0.57 0.55 � � �
�Fewer than 30 sample cases.
NOTE: Examples of weapons are guns, knives, sharp-edged or pointed objects, baseball bats, frying pans, sticks, rocks, and bottles. Schools were asked to report crimes that took place in schoolbuildings, on school buses, on school grounds, and at places holding school-sponsored events. Population size is 42,336,819 public school students.
SOURCE: U.S. Department of Education, National Center for Education Statistics, Fast Response Survey System, �Principal/School Disciplinarian Survey on School Violence,� FRSS 63, 1997.114
Physical attack or fight without a weapon Theft or larceny Vandalism
Standard Error Tables

Table S9.1.�Standard errors for table 9.1: Number of nonfatal crimes against teachers and average annual number of crimes per 1,000 teachers Table S9.1.�at school, by type of crime and selected teacher characteristics: Aggregated from 1995 to 1999
Serious SeriousTeacher characteristics Total Theft Violent violent Total Theft Violent violent
Total 100,170 76,350 56,540 16,880 4.3 3.4 2.5 0.8
Instructional level Elementary 54,730 45,090 27,790 12,890 4.6 3.9 2.4 1.2 Middle/junior high 50,360 36,180 32,380 7,750 10.6 7.9 7.1 1.8 Senior high 54,350 41,470 32,000 6,920 8.4 6.6 5.2 1.2
Gender Male 49,510 32,150 35,300 10,440 8.6 5.8 6.4 2.0 Female 81,710 66,490 41,340 12,930 4.7 3.9 2.5 0.8
Race/ethnicity White, non-Hispanic 91,030 69,570 51,520 15,170 4.7 3.7 2.8 0.9 Black, non-Hispanic 22,650 17,990 13,070 7,010 10.7 8.6 6.3 3.4 Hispanic 21,910 16,160 14,170 � 16.8 12.8 11.3 � Other, non-Hispanic 5,520 5,520 � � 16.5 16.5 � �
Urbanicity2
Urban 71,990 53,850 42,860 12,300 6.6 5.1 4.1 1.2 Suburban 48,020 38,950 25,490 8,790 6.7 5.5 3.7 1.3 Rural 30,260 23,420 17,990 5,340 7.6 6.0 4.7 1.4 �No cases were reported in this cell, although the crime defined by the cell could have happened to some teachers with these characteristics if a different sample had been drawn.1The estimate was based on fewer than 10 cases.2Teachers teaching in more than one school in different locales are not included.
NOTE: Serious violent crimes include rape, sexual assault, robbery, and aggravated assault. Violent crimes include serious violent crimes and simple assault. Total crimes include violent crimes andtheft. �At school� includes inside the school building, on school property, at work site, or while working. For thefts, �while working� was not considered since thefts of teachers� property kept at schoolcan occur when teachers are not present. The data were aggregated from 1995 to 1999 due to the small number of teachers in each year�s sample. On average, there were about 4.3 million teachersper year over the 5-year period for a total population size of 21,533,739 teachers. The average annual number of full-time-equivalent teachers is approximately 2.9 million, based on estimates fromthe U.S. Department of Education, National Center for Education Statistics, Schools and Staffing Survey 1993 to 1994. The population reported here includes part-time teachers as well as otherinstructional and support staff. Total crime numbers are rounded to the nearest 10.
SOURCE: U.S. Department of Justice, Bureau of Justice Statistics, National Crime Victimization Survey, 1995 to 1999.
115
Total crimes from 1995 to 1999 Average annual number of crimes per 1,000 teachers
Standard Error Tables
1
1
1
1
1
1 1 1 1
1
1
1
1
1

Table S10.1.�Standard errors for table 10.1: Percentage and number of teachers who reported that they were threatened with injury or that they Table S10.1.�were physically attacked by a student during the past 12 months, by urbanicity and selected teacher and school characteristics: Table S10.1.�1993�94 school year
Percent Number Percent NumberUrban Small Urban Small Urban Small Urban Small
Central fringe/ town/ Central fringe/ town/ Central fringe/ town/ Central fringe/ town/Selected characteristics Total city large town rural Total city large town rural Total city large town rural Total city large town rural
Total 0.23 0.40 0.40 0.29 7,040 4,360 3,840 3,550 0.13 0.23 0.20 0.18 3,890 2,230 2,300 1,920
Gender Male 0.40 0.87 0.61 0.51 3,870 2,470 1,720 1,760 0.21 0.58 0.29 0.26 1,760 1,350 740 900 Female 0.20 0.59 0.47 0.30 5,530 3,830 3,300 2,640 0.18 0.34 0.31 0.22 3,840 2,220 2,170 1,640
Race/ethnicity White, non-Hispanic 0.24 0.54 0.43 0.30 6,280 3,870 3,720 3,400 0.16 0.31 0.20 0.19 3,970 2,160 2,100 1,940 Black, non-Hispanic 0.61 0.90 1.30 1.16 1,400 1,190 630 500 0.40 0.69 1.18 0.71 860 830 530 310 Hispanic 1.32 2.10 1.40 1.94 1,840 1,650 490 450 0.99 1.57 1.14 0.66 1,260 1,170 380 130 Other, non-Hispanic 1.08 2.02 2.08 1.26 680 510 420 200 0.76 1.60 1.52 0.79 450 340 300 120
Teacher level Elementary 0.30 0.67 0.52 0.38 4,480 3,400 2,700 2,290 0.20 0.43 0.32 0.27 3,250 2,170 1,700 1,560 Secondary 0.28 0.49 0.51 0.42 5,380 2,780 2,790 2,450 0.14 0.25 0.26 0.20 1,980 1,030 1,190 1,120
Control Public 0.26 0.56 0.42 0.32 6,960 4,420 3,450 3,500 0.14 0.29 0.27 0.19 3,690 2,350 2,130 1,890 Private 0.29 0.38 0.67 0.61 1,100 610 990 480 0.23 0.31 0.46 0.56 850 500 660 420
NOTE: Population size is 2,940,000 teachers. Standard error numbers are rounded to the nearest 10.
SOURCE: U.S. Department of Education, National Center for Education Statistics, Schools and Staffing Survey, 1993�94 (Teacher and School Questionnaires).
116
Teachers threatened with injury by a student Teachers physically attacked by a student
Standard Error Tables

Table S11.1.�Standard errors for table 11.1: Percentage of students in grades 9 through 12 who reported carrying a weapon on school property Table S11.1.�at least 1 day in the past 30 days, by selected student characteristics: 1993, 1995, 1997, and 1999
Student characteristics 1993 19951 19971 19991
Total 0.73 0.45 0.64 0.60
Gender Male 0.96 0.76 1.50 1.08 Female 0.65 0.53 0.37 0.38
Race/ethnicity2
American Indian or Alaska Native § § § 5.16 Asian § § § 1.44 Black or African-American § § § 0.49 Native Hawaiian or other Pacific Islander § § § 2.70 White § § § 0.87 Multiple, non-Hispanic § § § 2.73 Hispanic or Latino § § § 0.74
Grade 9th 0.73 0.76 0.90 1.07 10th 0.97 0.78 0.99 0.81 11th 1.41 0.94 1.33 0.55 12th 0.83 0.68 0.91 0.80 §The response categories for race/ethnicity changed in 1999 making comparisons of some categories with earlier years problematic.1The response rate for this survey was less than 70 percent and a full nonresponse bias analysis has not been done to date.2Hispanics and Latinos are not included in these race/ethnicity categories unless specified.
NOTE: �On school property� was not defined for survey respondents.
SOURCE: Centers for Disease Control and Prevention, National Center for Chronic Disease Prevention and Health Promotion, Youth Risk Behavior Surveillance System (YRBSS), �Youth RiskBehavior Survey� (YRBS), 1993, 1995, 1997, and 1999.
117 Standard Error Tables

Table S11.2.�Standard errors for table 11.2: Percentage of students in grades 9 through 12 who reported carrying a weapon anywhere at least 1 Table S12.2.�day in the past 30 days, by selected student characteristics: 1993, 1995, 1997, and 1999
Student characteristics 1993 19951 19971 19991
Total 1.18 0.66 0.91 1.00
Gender Male 1.68 1.03 1.57 1.76 Female 0.85 0.72 0.54 0.56
Race/ethnicity2
American Indian or Alaska Native § § § 5.60 Asian § § § 2.02 Black or African-American § § § 2.68 Native Hawaiian or other Pacific Islander § § § 4.81 White § § § 1.40 Multiple, non-Hispanic § § § 3.20 Hispanic or Latino § § § 1.34
Grade 9th 1.42 1.24 1.34 1.68 10th 1.11 0.94 1.33 1.31 11th 1.66 1.40 1.69 1.21 12th 1.46 0.93 1.65 1.46 §The response categories for race/ethnicity changed in 1999 making comparisons of some categories with earlier years problematic.1The response rate for this survey was less than 70 percent and a full nonresponse bias analysis has not been done to date.2Hispanics and Latinos are not included in these race/ethnicity categories unless specified.
NOTE: The term �anywhere� is not used in the YRBS questionnaire. Rather, students are simply asked during the past 30 days, on how many days they carried a weapon.
SOURCE: Centers for Disease Control and Prevention, National Center for Chronic Disease Prevention and Health Promotion, Youth Risk Behavior Surveillance System (YRBSS), �Youth RiskBehavior Survey� (YRBS), 1993, 1995, 1997, and 1999.
118 Standard Error Tables

Table S12.1.�Standard errors for table 12.1: Percentage of students ages 12 through 18 who reported fearing being attacked or harmed at school Table S13.1.�or on the way to and from school during the previous 6 months, by selected student characteristics: 1989, 1995, and 1999
Feared attack or harm at school1 Feared attack or harm on the way to and from school1
Student characteristics1 19892 19951 19991 19892 19951 19991
Total 0.27 0.34 0.29 0.25 0.30 0.25
Gender Male 0.39 0.47 0.39 0.32 0.34 0.31 Female 0.39 0.46 0.44 0.38 0.48 0.40
Race/ethnicity White, non-Hispanic 0.29 0.33 0.28 0.23 0.24 0.19 Black, non-Hispanic 0.76 1.07 0.97 0.82 1.12 1.03 Hispanic 1.24 1.08 0.94 1.18 1.11 0.92 Other, non-Hispanic 1.70 1.44 0.99 1.49 1.34 1.04
Grade 6th 1.17 1.06 1.25 1.08 0.82 0.77 7th 0.91 0.92 0.71 0.77 0.78 0.53 8th 0.70 0.74 0.65 0.60 0.61 0.57 9th 0.66 0.73 0.60 0.63 0.76 0.60 10th 0.69 0.71 0.57 0.59 0.70 0.63 11th 0.56 0.65 0.52 0.59 0.64 0.52 12th 0.49 0.87 0.54 0.51 0.66 0.72
Urbanicity Urban 0.61 0.72 0.58 0.63 0.69 0.66 Suburban 0.38 0.43 0.37 0.32 0.38 0.27 Rural 0.50 0.69 0.55 0.34 0.44 0.44
Control Public 0.30 0.38 0.31 0.26 0.32 0.25 Private 0.53 0.67 0.55 0.83 0.78 0.741Includes students who reported that they sometimes or most of the time feared being victimized in this way.2Students ages 12 through 19.
NOTE: Comparisons between the 1989 data and the 1995 and 1999 data should be made with caution due to changes in the questionnaire. See appendix B for details. "At school" means in theschool building, on the school grounds, or on a school bus. Population sizes are 21,554,000 students ages 12 through 19 in 1989, 23,601,000 students ages 12 through 18 in 1995, and 24,614,000students ages 12 through 18 in 1999.
SOURCE: U.S. Department of Justice, Bureau of Justice Statistics, School Crime Supplement to the National Crime Victimization Survey, January�June 1989, 1995, and 1999.119 Standard Error Tables

Table S13.1.�Standard errors for table 13.1: Percentage of students ages 12 through 18 who reported that they avoided one or more places in Table S14.1.�school during the previous 6 months, by selected student characteristics: 1989, 1995, and 1999
Student characteristics 1989* 1995 1999
Total 0.26 0.29 0.29
Gender Male 0.37 0.43 0.35 Female 0.38 0.46 0.39
Race/ethnicity White, non-Hispanic 0.29 0.32 0.27 Black, non-Hispanic 0.76 1.01 0.90 Hispanic 0.97 0.97 0.73 Other, non-Hispanic 1.53 1.61 0.99
Grade 6th 1.05 0.99 0.92 7th 0.83 0.89 0.72 8th 0.65 0.77 0.70 9th 0.72 0.71 0.63 10th 0.64 0.75 0.61 11th 0.56 0.64 0.46 12th 0.56 0.74 0.51
Urbanicity Urban 0.59 0.73 0.48 Suburban 0.35 0.40 0.38 Rural 0.52 0.65 0.56
Control Public 0.29 0.33 0.31 Private 0.50 0.47 0.45*Students ages 12 through 19.
NOTE: Comparisons between the 1989 data and the 1995 and 1999 data should be made with caution due to changes in the questionnaire. See appendix B for details. Places include the entranceinto the school, any hallways or stairs in the school, parts of the school cafeteria, any school restrooms, and other places inside the school building. Population sizes are 21,554,000 students ages 12through 19 in 1989, 23,601,000 students ages 12 through 18 in 1995, and 24,614,000 students ages 12 through 18 in 1999.
SOURCE: U.S. Department of Justice, Bureau of Justice Statistics, School Crime Supplement to the National Crime Victimization Survey, January�June 1989, 1995, and 1999. Standard Error Tables 120

Table S14.1.�Standard errors for table 14.1: Percentage of students ages 12 through 18 who reported being targets of hate-related words or who Table S15.1.�saw hate-related graffiti at school during the previous 6 months, by selected student characteristics: 1999
Student characteristics Hate-related words Hate-related graffiti
Total 0.53 0.94
Gender Male 0.66 1.06 Female 0.70 1.14
Race/ethnicity White, non-Hispanic 0.67 1.20 Black, non-Hispanic 1.17 1.71 Hispanic 1.07 1.46 Other, non-Hispanic 1.95 2.53
Grade 6th 1.34 1.82 7th 1.14 1.43 8th 0.99 1.51 9th 0.91 1.55 10th 1.09 1.77 11th 1.03 1.74 12th 1.25 2.04
Urbanicity Urban 0.78 1.18 Suburban 0.53 1.12 Rural 1.75 2.60
Control Public 0.56 0.97 Private 1.04 1.85NOTE: �At school� means in the school building, on the school grounds, or on a school bus. Population size is 24,614,000 students ages 12 through 18 in 1999.
SOURCE: U.S. Department of Justice, Bureau of Justice Statistics, School Crime Supplement to the National Crime Victimization Survey, January�June 1999.
121 Standard Error Tables

Table S15.1.�Standard errors for table 15.1: Percentage of students ages 12 through 18 who reported that street gangs were present at school Table S16.1.�during the previous 6 months, by selected student characteristics: 1989, 1995, and 1999
Student characteristics 1989* 1995 1999
Total 0.43 0.65 0.64
Gender Male 0.61 0.81 0.72 Female 0.61 0.79 0.78
Race/ethnicity White, non-Hispanic 0.46 0.69 0.67 Black, non-Hispanic 1.21 1.73 1.80 Hispanic 1.82 1.79 1.68 Other, non-Hispanic 2.74 2.71 1.98
Grade 6th 1.26 1.06 1.23 7th 1.17 1.15 0.95 8th 1.06 1.23 1.09 9th 1.20 1.30 1.35 10th 1.16 1.53 1.42 11th 1.12 1.44 1.25 12th 1.09 1.50 1.52
Urbanicity Urban 1.00 1.34 1.02 Suburban 0.61 0.77 0.68 Rural 0.63 1.73 2.06
Control Public 0.47 0.71 0.70 Private 0.84 0.81 0.83*Students ages 12 through 19.
NOTE: Comparisons between the 1989 data and the 1995 and 1999 data should be made with caution due to changes in the questionnaire. See appendix B for details. This indicator is based on anitem from earlier in the SCS questionnaire, before �at school� was defined for the respondent. Population sizes are 21,554,000 students ages 12 through 19 in 1989, 23,601,000 students ages 12through 18 in 1995, and 24,614,000 students ages 12 through 18 in 1999.
SOURCE: U.S. Department of Justice, Bureau of Justice Statistics, School Crime Supplement to the National Crime Victimization Survey, January�June 1989, 1995, and 1999.122 Standard Error Tables

Table S16.1.�Standard errors for table 16.1: Percentage and number of public schools that reported that 1 or more of 17 discipline issues* was Table S17.1.�a serious problem in their school, by urbanicity and selected school characteristics: 1996�97
Urban UrbanSchool characteristics Total City fringe Town Rural Total City fringe Town Rural
Total 1.25 2.34 1.96 1.93 2.74 970 410 360 380 590
Instructional level Elementary school 1.62 3.35 2.46 2.45 3.54 780 410 300 270 420 Middle school 1.77 3.61 3.46 4.13 4.62 250 110 120 180 140 High school 2.49 4.14 5.84 4.87 4.61 390 120 160 210 280
Region Northeast 2.37 7.33 2.70 4.76 3.75 350 220 140 200 80 Southeast 2.32 5.24 5.06 5.21 4.82 410 220 170 270 250 Central 1.97 4.12 4.93 4.56 3.98 470 180 260 240 320 West 2.61 3.93 4.50 4.20 5.90 590 260 240 220 360
School size Less than 300 2.12 5.17 � 3.66 3.31 440 70 � 170 400 300�999 1.47 3.07 2.38 2.60 3.64 750 410 340 360 330 1,000 or more 2.93 4.62 4.72 8.59 15.85 240 130 130 100 60
Minority enrollment Less than 5 percent 1.53 4.65 3.04 2.89 2.28 360 40 110 230 270 5�19 percent 2.12 5.04 3.95 5.31 6.83 410 180 250 240 230 20�49 percent 3.03 4.57 4.12 3.89 8.55 490 210 220 140 340 50 percent or more 2.70 3.54 4.65 5.87 9.41 500 320 190 180 190
Free/reduced-price lunch eligibility Less than 20 percent 1.44 5.01 2.69 3.42 3.71 290 130 170 170 140 21�34 percent 2.52 7.32 5.34 4.78 3.84 420 180 190 250 200 35�49 percent 3.09 9.72 1.43 6.69 6.07 430 240 40 230 310 50�74 percent 2.52 4.05 8.08 3.63 6.77 430 160 270 170 310 75 percent or more 2.94 4.09 6.08 5.94 7.36 370 260 140 120 160
*Student tardiness, student absenteeism/class cutting, physical conflicts among students, robbery or theft of items worth over $10, vandalism of school property, student alcohol use, student druguse, sale of drugs on school grounds, student tobacco use, student possession of weapons, trespassing, verbal abuse of teachers, physical abuse of teachers, teacher absenteeism, teacher alcoholor drug use, racial tensions, and gangs.�No cases are reported in this cell, although the event defined by this cell could have been reported by some students with these characteristics had a different sample been drawn.
NOTE: �At school� was not defined for the questionnaire respondent. Population size is 78,000 public schools. Standard error numbers are rounded to the nearest 10.
SOURCE: U.S. Department of Education, National Center for Education Statistics, Fast Response Survey System, �Principal/School Disciplinarian Survey on School Violence,� FRSS 63, 1997.
123 Standard Error Tables
Percent Number

Table S17.1.�Standard errors for table 17.1: Percentage of students in grades 9 through 12 who reported using alcohol in the last 30 days, Table S16.1�by selected student characteristics: 1993, 1995, 1997, and 1999
Student characteristics 1993 19951 19971 19991 1993 19951 19971 19991
Total 1.06 1.19 1.43 1.27 0.39 0.45 0.34 0.38
Gender Male 1.23 1.33 1.22 1.47 0.39 0.50 0.66 0.56 Female 1.32 1.79 1.99 1.43 0.54 0.70 0.37 0.35
Race/ethnicity2
American Indian or Alaska Native § § § 6.43 § § § 4.87 Asian § § § 2.23 § § § 0.40 Black or African-American § § § 4.08 § § § 0.51 Native Hawaiian or other Pacific Islander § § § 4.91 § § § 1.64 White § § § 1.57 § § § 0.56 Multiple, non-Hispanic § § § 3.88 § § § 1.04 Hispanic or Latino § § § 2.28 § § § 0.82
Grade 9th 1.79 1.87 3.12 2.23 0.38 0.90 0.83 0.57 10th 2.00 2.38 2.19 1.91 0.43 0.88 0.71 0.68 11th 1.73 1.51 1.49 1.94 0.80 0.86 0.86 0.53 12th 1.35 1.64 2.50 2.24 0.64 0.58 0.66 0.89§The response categories for race/ethnicity changed in 1999 making comparisons of some categories with earlier years problematic.1The response rate for this survey was less than 70 percent and a full nonresponse bias analysis has not been done to date.2Hispanics and Latinos are not included in these race/ethnicity categories unless specified.
NOTE: �On school property� was not defined for survey respondents. The term �anywhere� is not used in the YRBS questionnaire. Rather students are simply asked during the past 30 days, on howmany days did they have at least one drink of alcohol.
SOURCE: Centers for Disease Control and Prevention, National Center for Chronic Disease Prevention and Health Promotion, Youth Risk Behavior Surveillance System (YRBSS), �Youth RiskBehavior Survey� (YRBS), 1993, 1995, 1997, and 1999.
124
On school propertyAnywhere
Standard Error Tables

Table S18.1.�Standard errors for table 18.1: Percentage of students in grades 9 through 12 who reported using marijuana in the last 30 days, Table S19.1.�by selected student characteristics: 1993, 1995, 1997, and 1999
Student characteristics 1993 19951 19971 19991 1993 19951 19971 19991
Total 1.22 1.03 1.11 1.28 0.65 0.59 0.52 0.74
Gender Male 1.23 1.08 1.46 1.93 0.83 0.85 0.68 1.31 Female 1.02 1.44 1.04 0.94 0.48 0.72 0.56 0.42
Race/ethnicity2
American Indian or Alaska Native § § § 6.54 § § § 5.07 Asian § § § 2.14 § § § 0.74 Black or African-American § § § 3.50 § § § 1.10 Native Hawaiian or other Pacific Islander § § § 3.80 § § § 2.90 White § § § 1.59 § § § 0.85 Multiple, non-Hispanic § § § 4.00 § § § 1.81 Hispanic or Latino § § § 2.27 § § § 1.21
Grade 9th 1.10 1.83 1.95 1.94 0.40 1.38 0.90 1.00 10th 1.79 1.89 1.29 2.11 0.94 0.87 0.73 1.10 11th 1.77 1.35 1.81 2.45 1.07 0.62 1.17 0.78 12th 1.40 2.35 2.09 2.83 0.78 1.15 0.61 1.15§The response categories for race/ethnicity changed in 1999 making comparisons of some categories with earlier years problematic.1The response rate for this survey was less than 70 percent and a full nonresponse bias analysis has not been done to date.2Hispanics and Latinos are not included in these race/ethnicity categories unless specified.
NOTE: �On school property� was not defined for survey respondents. The term �anywhere� is not used in the YRBS questionnaire. Rather, students are simply asked how many times during the past30 days they used marijuana.
SOURCE: Centers for Disease Control and Prevention, National Center for Chronic Disease Prevention and Health Promotion, Youth Risk Behavior Surveillance System (YRBSS), �Youth RiskBehavior Survey� (YRBS), 1993, 1995, 1997, and 1999.
Anywhere On school property
125 Standard Error Tables

Table S19.1.�Standard errors for table 19.1: Percentage of students in grades 9 through 12 who reported that drugs were made available to them Table S20.1.�on school property during the last 12 months, by selected student characteristics: 1993, 1995, 1997, and 1999
Student characteristics 1993 19951 19971 19991
Total 1.18 1.55 1.43 1.21
Gender Male 1.50 1.73 1.19 1.69 Female 1.31 1.43 1.22 1.23
Race/ethnicity2
American Indian or Alaska Native § § § 5.91 Asian § § § 2.56 Black or African-American § § § 2.02 Native Hawaiian or other Pacific Islander § § § 4.38 White § § § 1.47 Multiple, non-Hispanic § § § 2.83 Hispanic or Latino § § § 1.89
Grade 9th 1.24 1.69 2.33 2.54 10th 1.86 1.54 1.71 1.98 11th 0.16 1.88 1.42 2.14 12th 1.82 2.63 1.80 1.16§The response categories for race/ethnicity changed in 1999 making comparisons of some categories with earlier years problematic.1The response rate for this survey was less than 70 percent and a full nonresponse bias analysis has not been done to date.2Hispanics and Latinos are not included in these race/ethnicity categories unless specified.
NOTE: �On school property� was not defined for survey respondents.
SOURCE: Centers for Disease Control and Prevention, National Center for Chronic Disease Prevention and Health Promotion, Youth Risk Behavior Surveillance System (YRBSS), �Youth RiskBehavior Survey� (YRBS), 1993, 1995, 1997, and 1999.
126 Standard Error Tables

Appendix A. School Practices and Policies 127
APPENDIX A. SCHOOL PRACTICES AND POLICIES RELATED TO SAFETY AND DISCIPLINE*
*This appendix repeats information from the 2000 Indicators of School Crime and Safety report.
Concern over school crime and violence has prompted many public schools to take various measures to reduce and prevent violence and ensure safety in schools. Such measures include adopting zero tolerance policies; requiring stu-dents to wear uniforms; employing various security measures such as requiring visitor sign-in and using metal detectors; having police or other law enforcement representatives stationed at the school; and offering students various types of violence prevention programs. Presented in this appendix are data on the im-plementation of such safety measures in public schools. This report does not evaluate the effectiveness of any of these efforts or strategies, and the inclusion of a strategy does not suggest that it is endorsed by the National Center for Education Statistics (NCES) or the Bureau of Justice Statistics (BJS) as an ef-fective means of reducing or preventing violence. Likewise, the omission of a possible strategy does not suggest it is rejected by NCES or BJS as a policy to reduce or prevent violence. This information, along with supporting tables, was drawn from a recent NCES report titled Violence and Discipline Problems in U.S. Public Schools: 1996�97 (NCES 98-030). The report was based on data from the 1996�97 Fast Response Survey System (FRSS) Principal/School Discipli-narian Survey on School Violence. Readers should consult that report for more detailed findings on variation by school characteristics.
Zero Tolerance Policies
! Most public schools reported having zero tolerance policies toward serious student offenses (table A1). A �zero tolerance policy� was defined as a school or district policy that mandates predetermined consequences or pun-ishments for specific offenses. At least 9 out of 10 schools reported zero tolerance policies for firearms (94 percent) and weapons other than firearms (91 percent). Eighty-seven percent of schools had policies of zero tolerance for alcohol and 88 percent had zero tolerance policies for drugs. Most schools also had zero tolerance policies for violence and tobacco (79 per-cent each).
School Uniforms ! Requiring students to wear school uniforms was not common. Three per-cent of all public schools required students to wear uniforms during the 1996�97 school year (table A2).

128 Appendix A. School Practices and Policies
Security Measures ! Schools took a number of measures to secure their schools. For example, 96 percent of public schools reported that visitors were required to sign in before entering the school building (table A3); 80 percent of public schools reported having a closed campus policy that prohibited most students from leaving the campus for lunch; 53 percent of public schools controlled access to their school building; and 24 percent of public schools controlled access to their school grounds. In addition, 19 percent of public schools reported conducting drug sweeps, with middle schools and high schools being more likely to use drug sweeps than elementary schools (36 and 45 percent, re-spectively, versus 5 percent). While 4 percent of public schools reported that they performed random metal detector checks on students, daily use of metal detectors as a security measure was not common: only 1 percent of public schools reported taking this measure.
Presence of Police or Other Law Enforcement Representatives in Schools
! In addition to the security measures described above, 6 percent of public schools reported having police or other law enforcement representatives stationed 30 hours or more at the school in a typical week during the 1996�97 school year; 1 percent of schools had them stationed from 10 to 29 hours; and 3 percent had them stationed from 1 to 9 hours. Twelve percent of schools did not have police or other law enforcement representatives sta-tioned during a typical week but made them available as needed, and 78 percent of schools did not have any such persons stationed at their schools (table A4).
Violence Prevention or Reduction Programs
! A majority of public schools (78 percent) reported having some type of for-mal school violence prevention or reduction program (table A5). The per-centage of schools with both 1-day and ongoing programs (43 percent) was higher than schools with only ongoing programs (24 percent) and schools with only 1-day programs (11 percent).
Policies to Prevent Firearms in School
! In the 1996�97 school year, there were over 5,000 student expulsions for possession or use of a firearm (table A6). An additional 3,300 students were transferred to alternative schools for possession or use of a firearm, while 8,144 were placed in out-of-school suspensions lasting 5 or more days. About 5 percent of all public schools (or 4,170) took one or more of these actions.

Appendix A. School Practices and Policies 129
Table A1.�Percentage of public schools that reported that they have a zero tolerance policy for various Table A1.�specified student offenses, by selected school characteristics: 1996�97
Weapons otherSchool characteristics Violence Firearms than firearms Alcohol Drugs Tobacco
All public schools 79 94 91 87 88 79
Instructional level Elementary school 79 93 91 87 88 82 Middle school 75 95 90 86 90 77 High school 80 96 92 86 89 72
School enrollment Less than 300 76 93 89 84 84 76 300�999 79 94 91 88 89 82 1,000 or more 86 98 93 85 92 72
Locale City 87 97 95 89 91 83 Urban fringe 82 95 90 88 90 80 Town 71 90 86 82 83 77 Rural 76 94 92 88 89 78
Region Northeast 78 89 90 83 84 79 Southeast 83 95 89 90 92 80 Central 72 93 88 82 83 75 West 83 97 95 91 93 83
Percent minority enrollment Less than 5 percent 71 92 88 82 83 75 5�19 percent 79 94 92 89 90 80 20�49 percent 83 95 90 87 89 79 50 percent or more 85 97 94 90 92 83
Percent of students eligible for free or reduced-price school lunch Less than 20 percent 76 92 88 86 87 77 20�34 percent 77 94 90 87 88 82 35�49 percent 79 97 95 89 92 81 70�74 percent 80 95 90 85 88 79 75 percent or more 84 95 93 87 89 81
SOURCE: U.S. Department of Education, National Center for Education Statistics, Fast Response Survey System, �Principal/SchoolDisciplinarian Survey on School Violence,� FRSS 63, 1997.
Types of offenses

130 Appendix A. School Practices and Policies
Table A2.�Percentage of public schools that reported that students were required to wear school Table A2.�uniforms, by selected school characteristics: 1996�97
School characteristics Uniforms required
All public schools 3
Instructional level Elementary school 4 Middle school 4 High school (*)
School enrollment Less than 300 � 300�999 4 1,000 or more 8
Locale City 9 Urban fringe 6 Town (*) Rural (*)
Region Northeast 1 Southeast 4 Central 2 West 6
Percent minority enrollment Less than 5 percent (*) 5�19 percent � 20�49 percent 2 50 percent or more 13
Percent of students eligible for free or reduced-price school lunch Less than 20 percent (*) 20�34 percent 1 35�49 percent 2 70�74 percent 5 75 percent or more 11 *Less than 0.5 percent.�No cases are reported in this cell, although the event defined by this cell could have been reported by some students with thesecharacteristics had a different sample been drawn.
SOURCE: U.S. Department of Education, National Center for Education Statistics, Fast Response Survey System, �Principal/SchoolDisciplinarian Survey on School Violence,� FRSS 63, 1997.

Appendix A. School Practices and Policies 131
Table A3.�Percentage of public schools that reported that they use various types of security measures Table A3.�at their schools, by selected school characteristics: 1996�97
Closed Studentscampus Random must passfor most Controlled Controlled metal through
Visitors students access to access to One or detectors metalmust during school school more drug check on detectors
School characteristics sign in lunch buildings grounds sweeps students each day
All public schools 96 80 53 24 19 4 1
Instructional level Elementary school 96 76 57 25 5 1 (*) Middle school 96 93 51 22 36 7 1 High school 97 78 40 25 45 9 2
School enrollment Less than 300 91 67 40 16 22 (*) 1 300�999 98 84 57 24 15 4 1 1,000 or more 99 82 55 49 34 15 3
Locale City 100 81 62 35 12 8 2 Urban fringe 98 85 68 31 13 3 (*) Town 96 77 49 20 23 2 1 Rural 92 75 33 13 27 2 (*)
Region Northeast 98 83 70 30 6 1 (*) Southeast 99 86 52 28 24 9 1 Central 95 76 48 12 17 1 1 West 94 76 46 31 25 4 1
Percent minority enrollment Less than 5 percent 94 77 42 14 17 (*) � 5�19 percent 97 81 55 22 23 1 (*) 20�49 percent 98 77 55 27 18 6 (*) 50 percent or more 97 84 63 38 18 9 4
Percent of students eligible for free or reduced-price school lunch Less than 20 percent 94 74 50 18 17 1 � 20�34 percent 99 77 51 19 20 3 (*) 35�49 percent 96 80 49 25 22 5 (*) 70�74 percent 95 85 57 27 22 4 1 75 percent or more 97 83 58 37 13 8 5*Less than 0.5 percent.�No cases are reported in this cell, although the event defined by this cell could have been reported by some students with thesecharacteristics had a different sample been drawn.
SOURCE: U.S. Department of Education, National Center for Education Statistics, Fast Response Survey System, �Principal/SchoolDisciplinarian Survey on School Violence,� FRSS 63, 1997.

132 Appendix A. School Practices and Policies
Table A4.�Percentage of public schools that reported various levels of police or other law Table A4.�enforcement representatives� presence during a typical week, by selected school Table A4.�characteristics: 1996�97
Stationed at school Not stationed during None stationed30 hours 10�29 1�9 a typical week, but at school
School characteristics or more hours hours available as needed during 1996�97
All public schools 6 1 3 12 78
Instructional level Elementary school 1 1 1 8 89 Middle school 10 3 5 17 65 High school 19 2 6 18 54
School enrollment Less than 300 1 (*) 1 9 89 300�999 4 1 3 12 80 1,000 or more 39 5 7 15 34
Locale City 13 4 3 11 69 Urban fringe 7 1 2 11 80 Town 5 1 4 11 78 Rural 1 (*) 2 14 83
Region Northeast 6 (*) 2 11 81 Southeast 9 2 2 11 77 Central 4 2 3 11 81 West 7 1 4 14 74
Percent minority enrollment Less than 5 percent 1 1 3 10 85 5�19 percent 6 1 3 10 80 20�49 percent 7 1 2 13 77 50 percent or more 13 3 3 14 67
Percent of students eligible for free or reduced-price school lunch Less than 20 percent 5 1 4 10 79 20�34 percent 7 1 2 10 80 35�49 percent 5 (*) 3 12 80 70�74 percent 6 2 1 13 78 75 percent or more 8 2 4 14 72*Less than 0.5 percent.
SOURCE: U.S. Department of Education, National Center for Education Statistics, Fast Response Survey System, �Principal/SchoolDisciplinarian Survey on School Violence,� FRSS 63, 1997.
Police or other law enforcement representatives

Appendix A. School Practices and Policies 133
Table A5.�Percentage of public schools that reported formal school violence prevention or reduction Table A5.�programs or efforts, by selected school characteristics: 1996�97
Any Only 1-day Only ongoing Both 1-day andSchool characteristics programs programs programs ongoing programs
All public schools 78 11 24 43
Instructional level Elementary school 78 9 28 42 Middle school 82 7 19 56 High school 74 20 15 38
School enrollment Less than 300 68 14 20 34 300�999 81 10 26 45 1,000 or more 84 8 17 59
Locale City 87 5 25 57 Urban fringe 82 5 30 47 Town 72 11 22 38 Rural 73 21 18 35
Region Northeast 75 8 27 40 Southeast 84 13 28 44 Central 76 9 21 46 West 77 14 20 43
Percent minority enrollment Less than 5 percent 67 11 20 36 5�19 percent 78 10 24 44 20�49 percent 86 12 30 44 50 percent or more 84 10 22 52
Percent of students eligible for free or reduced-price school lunch Less than 20 percent 73 8 22 43 20�34 percent 75 6 24 44 35�49 percent 81 15 27 40 70�74 percent 80 16 20 44 75 percent or more 85 12 26 47
SOURCE: U.S. Department of Education, National Center for Education Statistics, Fast Response Survey System, �Principal/SchoolDisciplinarian Survey on School Violence,� FRSS 63, 1997.
Percent of schools with:

134 Appendix A. School Practices and Policies
Table A6.�Number and percentage of schools in which specified disciplinary actions were taken against Table A6.�students, total number of actions taken, and percentage of specific disciplinary actions taken Table A6.�against students, by type of infraction: 1996�97
Total number Percentof schools of schools
taking one or taking one or Total number Transfers to Out-of-schoolmore of these more of these of these alternative suspensions
specified specified specified schools or lasting 5 orInfraction actions actions actions taken Expulsions programs more days
Possession or use of a firearm 4,170 5 16,587 5,143 3,301 8,144
Possession or use of a weapon 16,740 22 58,554 13,698 12,943 31,970 other than a firearm
Possession, distribution, or use of 20,960 27 170,464 30,522 34,255 105,723 alcohol or drugs, including tobacco
Physical attacks or fights 30,160 39 330,696 50,961 62,108 217,627
SOURCE: U.S. Department of Education, National Center for Education Statistics, Fast Response Survey System, �Principal/SchoolDisciplinarian Survey on School Violence,� FRSS 63, 1997.
Number of actions taken

Appendix A. School Practices and Policies 135
Table A7.�Standard errors for table A1: Percentage of public schools that reported that they have a zero Table A6.�tolerance policy for various specified student offenses, by selected school characteristics: Table A6.�1996�97
Weapons otherSchool characteristics Violence Firearms than firearms Alcohol Drugs Tobacco
All public schools 1.6 1.0 1.2 1.2 1.1 1.5
Instructional level Elementary school 2.4 1.6 1.8 1.8 1.8 2.1 Middle school 2.3 1.4 1.7 2.0 1.8 2.3 High school 2.0 1.1 1.5 2.2 1.9 2.4
School enrollment Less than 300 3.8 2.7 3.1 3.6 3.6 3.8 300�999 1.8 1.0 1.2 1.2 1.2 1.5 1,000 or more 2.4 0.7 1.8 2.3 1.7 2.8
Locale City 2.5 1.4 1.6 2.2 2.1 2.3 Urban fringe 2.7 1.5 2.2 2.4 2.2 2.6 Town 3.2 2.4 2.5 2.7 2.7 3.1 Rural 3.5 2.0 2.3 2.4 2.3 2.9
Region Northeast 3.6 2.5 2.4 2.9 2.9 3.6 Southeast 2.6 1.3 2.1 1.5 1.4 2.7 Central 3.4 2.1 2.8 3.0 3.0 3.3 West 2.3 1.3 1.5 1.9 1.8 2.0
Percent minority enrollment Less than 5 percent 3.4 2.7 2.9 2.9 2.9 3.2 5�19 percent 3.9 1.8 2.2 2.6 2.6 2.9 20�49 percent 2.4 1.8 2.2 2.2 2.2 2.5 50 percent or more 2.2 1.2 1.4 1.9 1.9 2.1
Percent of students eligible for free or reduced-price school lunch Less than 20 percent 3.4 2.2 2.6 2.6 2.7 3.0 20�34 percent 3.7 2.7 2.9 3.1 3.0 3.2 35�49 percent 4.2 1.8 1.9 2.8 2.8 3.2 70�74 percent 3.2 1.8 2.3 3.1 2.8 3.2 75 percent or more 3.6 2.2 2.4 3.2 3.2 3.4
SOURCE: U.S. Department of Education, National Center for Education Statistics, Fast Response Survey System, �Principal/SchoolDisciplinarian Survey on School Violence,� FRSS 63, 1997.
Types of offenses

136 Appendix A. School Practices and Policies
Table A8.�Standard errors for table A2: Percentage of public schools that reported that students were Table A7.�required to wear school uniforms, by selected school characteristics: 1996�97
School characteristics Uniforms required
All public schools 0.6
Instructional level Elementary school 0.9 Middle school 0.8 High school �
School enrollment Less than 300 � 300�999 0.9 1,000 or more 2.2
Locale City 1.9 Urban fringe 1.8 Town � Rural �
Region Northeast 0.9 Southeast 1.4 Central 1.0 West 1.4
Percent minority enrollment Less than 5 percent � 5�19 percent � 20�49 percent 1.0 50 percent or more 2.3
Percent of students eligible for free or reduced-price school lunch Less than 20 percent � 20�34 percent 0.7 35�49 percent 1.2 70�74 percent 1.6 75 percent or more 2.6�Estimate of standard error is not derived because it is based on a statistic estimated at less than 0.5 percent or at 100 percent.�No cases are reported in this cell, although the event defined by this cell could have been reported by some students with thesecharacteristics had a different sample been drawn.
SOURCE: U.S. Department of Education, National Center for Education Statistics, Fast Response Survey System, �Principal/SchoolDisciplinarian Survey on School Violence,� FRSS 63, 1997.

Appendix A. School Practices and Policies 137
Table A9.�Standard errors for table A3: Percentage of public schools that reported that they use various Table A8.�types of security measures at their schools, by selected school characteristics: 1996�97
Closed Studentscampus Random must passfor most Controlled Controlled metal through
Visitors students access to access to One or detectors metalmust during school school more drug check on detectors
School characteristics sign in lunch buildings grounds sweeps students each day
All public schools 0.9 1.7 1.9 1.5 1.1 0.4 0.3
Instructional level Elementary school 1.4 2.5 2.8 2.3 1.3 0.5 � Middle school 1.2 1.7 2.7 1.9 2.4 1.0 0.4 High school 1.0 2.2 2.3 2.0 3.2 1.1 0.7
School enrollment Less than 300 3.0 3.9 3.7 3.2 3.2 � 0.4 300�999 0.6 1.8 2.4 2.1 1.1 0.6 0.4 1,000 or more 0.5 2.5 3.3 3.3 2.8 1.9 0.9
Locale City � 2.9 3.2 3.7 1.0 1.0 0.5 Urban fringe 1.2 2.8 3.6 3.6 1.5 0.8 � Town 1.5 3.6 3.7 2.7 2.8 0.8 0.8 Rural 2.4 3.4 3.8 2.8 3.0 1.0 �
Region Northeast 1.2 4.0 3.9 3.9 1.2 0.5 � Southeast 0.9 2.8 3.9 2.8 2.4 1.4 0.7 Central 1.5 3.3 3.2 2.6 2.4 0.3 0.3 West 1.8 3.9 3.8 2.9 2.4 0.9 0.7
Percent minority enrollment Less than 5 percent 2.3 3.3 3.6 2.6 2.4 � � 5�19 percent 1.1 3.2 3.9 3.0 2.6 0.7 � 20�49 percent 0.9 3.9 4.0 3.2 2.5 1.2 � 50 percent or more 1.6 3.2 4.1 3.8 2.1 1.3 1.2
Percent of students eligible for free or reduced-price school lunch Less than 20 percent 2.4 3.5 3.6 2.7 2.2 0.5 � 20�34 percent 0.5 3.6 4.6 3.5 3.0 0.8 � 35�49 percent 2.1 3.2 5.0 3.0 3.0 1.3 � 70�74 percent 1.9 4.0 4.4 3.9 2.9 0.8 0.4 75 percent or more 1.7 4.5 5.1 5.0 2.2 1.6 1.5�Estimate of standard error is not derived because it is based on a statistic estimated at less than 0.5 percent or at 100 percent.�No cases are reported in this cell, although the event defined by this cell could have been reported by some students with thesecharacteristics had a different sample been drawn.
SOURCE: U.S. Department of Education, National Center for Education Statistics, Fast Response Survey System, �Principal/SchoolDisciplinarian Survey on School Violence,� FRSS 63, 1997.

138 Appendix A. School Practices and Policies
Table A10.�Standard errors for table A4: Percentage of public schools that reported various levels of Table A10.�police or other law enforcement representatives� presence during a typical week, by selected Table A10.�school characteristics: 1996�97
Stationed at school Not stationed during None stationed30 hours 10�29 1�9 a typical week, but at school
School characteristics or more hours hours available as needed during 1996�97
All public schools 0.4 0.3 0.4 1.0 1.1
Instructional level Elementary school 0.5 0.4 0.6 1.4 1.5 Middle school 1.3 0.8 1.1 1.9 2.4 High school 1.6 0.7 1.0 2.1 2.9
School enrollment Less than 300 0.4 � 0.5 2.4 2.8 300�999 0.6 0.4 0.6 1.2 1.3 1,000 or more 2.6 1.4 1.2 2.0 3.2
Locale City 1.4 1.2 0.8 2.9 3.1 Urban fringe 1.0 0.2 0.6 1.9 2.2 Town 0.9 0.5 1.1 1.6 1.9 Rural 0.5 � 0.8 2.3 2.5
Region Northeast 1.6 � 0.9 2.0 2.5 Southeast 1.1 0.8 0.8 2.1 2.5 Central 0.8 0.8 0.8 1.9 2.1 West 0.9 0.5 0.8 2.1 2.6
Percent minority enrollment Less than 5 percent 0.3 0.3 0.8 1.7 1.8 5�19 percent 0.9 0.3 0.8 1.8 2.3 20�49 percent 0.9 0.4 0.8 2.7 3.2 50 percent or more 1.7 1.3 0.9 2.6 3.1
Percent of students eligible for free or reduced-price school lunch Less than 20 percent 0.8 0.5 1.0 1.8 2.2 20�34 percent 1.0 0.5 0.7 1.9 2.3 35�49 percent 1.2 � 1.1 2.9 3.3 70�74 percent 1.2 0.9 0.4 2.6 3.2 75 percent or more 2.0 1.3 1.4 3.7 4.4�Estimate of standard error is not derived because it is based on a statistic estimated at less than 0.5 percent or at 100 percent.
SOURCE: U.S. Department of Education, National Center for Education Statistics, Fast Response Survey System, �Principal/SchoolDisciplinarian Survey on School Violence,� FRSS 63, 1997.
Police or other law enforcement representatives
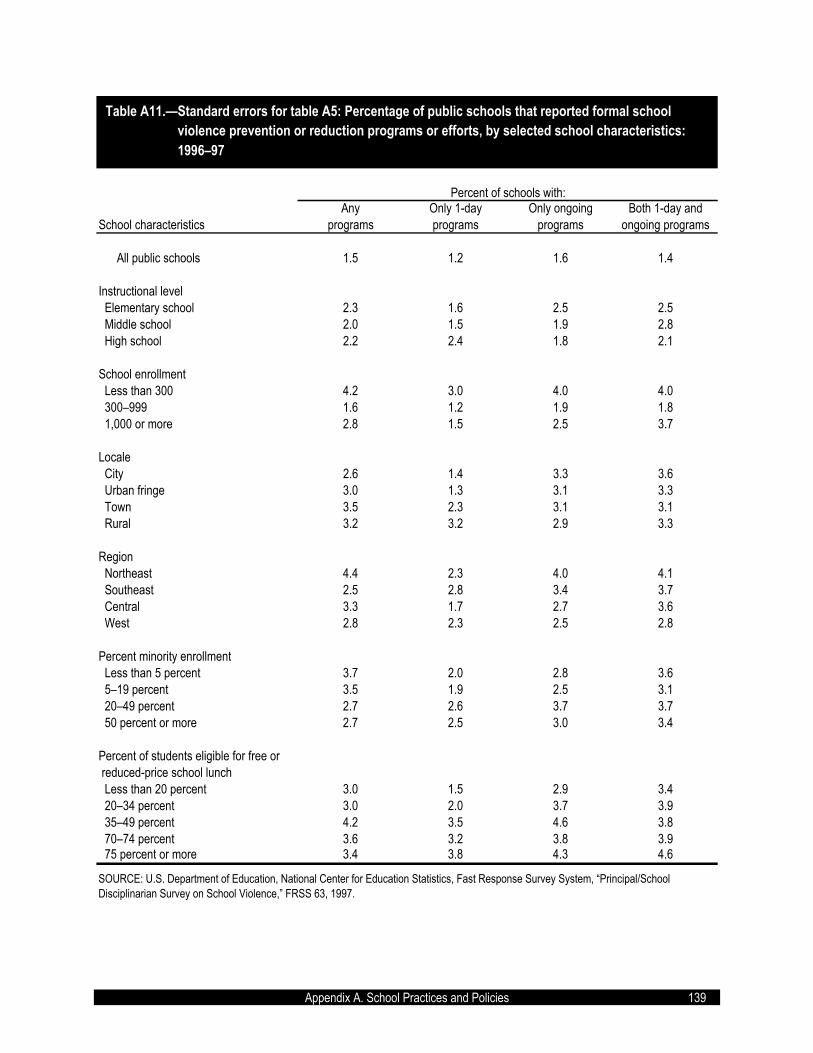
Appendix A. School Practices and Policies 139
Table A11.�Standard errors for table A5: Percentage of public schools that reported formal school Table A10.�violence prevention or reduction programs or efforts, by selected school characteristics: Table A10.�1996�97
Any Only 1-day Only ongoing Both 1-day andSchool characteristics programs programs programs ongoing programs
All public schools 1.5 1.2 1.6 1.4
Instructional level Elementary school 2.3 1.6 2.5 2.5 Middle school 2.0 1.5 1.9 2.8 High school 2.2 2.4 1.8 2.1
School enrollment Less than 300 4.2 3.0 4.0 4.0 300�999 1.6 1.2 1.9 1.8 1,000 or more 2.8 1.5 2.5 3.7
Locale City 2.6 1.4 3.3 3.6 Urban fringe 3.0 1.3 3.1 3.3 Town 3.5 2.3 3.1 3.1 Rural 3.2 3.2 2.9 3.3
Region Northeast 4.4 2.3 4.0 4.1 Southeast 2.5 2.8 3.4 3.7 Central 3.3 1.7 2.7 3.6 West 2.8 2.3 2.5 2.8
Percent minority enrollment Less than 5 percent 3.7 2.0 2.8 3.6 5�19 percent 3.5 1.9 2.5 3.1 20�49 percent 2.7 2.6 3.7 3.7 50 percent or more 2.7 2.5 3.0 3.4
Percent of students eligible for free or reduced-price school lunch Less than 20 percent 3.0 1.5 2.9 3.4 20�34 percent 3.0 2.0 3.7 3.9 35�49 percent 4.2 3.5 4.6 3.8 70�74 percent 3.6 3.2 3.8 3.9 75 percent or more 3.4 3.8 4.3 4.6
SOURCE: U.S. Department of Education, National Center for Education Statistics, Fast Response Survey System, �Principal/SchoolDisciplinarian Survey on School Violence,� FRSS 63, 1997.
Percent of schools with:

140 Appendix A. School Practices and Policies
Table A12.�Standard errors for table A6: Number and percentage of schools in which specified Table A12.�disciplinary actions were taken against students, total number of actions taken, and Table A12.�percentage of specific disciplinary actions taken against students, by type of infraction: Table A12.�1996�97
Total number Percentof schools of schools
taking one or taking one or Total number Transfers to Out-of-schoolmore of these more of these of these alternative suspensions
specified specified specified schools or lasting 5 orInfraction actions actions actions taken Expulsions programs more days
Possession or use of a firearm 480.6 0.6 3,778.2 1,094 1,139 2,495
Possession or use of a weapon 969.1 1.3 3,781.8 1,091 1,304 2,714 other than a firearm
Possession, distribution, or use of 782.7 1.0 8,734.6 2,767 4,129 6,234 alcohol or drugs, including tobacco
Physical attacks or fights 1,081.4 1.4 15,964.2 5,537 8,125 12,087
SOURCE: U.S. Department of Education, National Center for Education Statistics, Fast Response Survey System, �Principal/SchoolDisciplinarian Survey on School Violence,� FRSS 63, 1997.
Number of actions taken

Appendix B. Technical Notes 141
APPENDIX B. TECHNICAL NOTES
General Information
The information presented in this report was obtained from many data sources, including databases from the National Center for Education Statistics (NCES), the Centers for Disease Control and Prevention (CDC), and the Bureau of Jus-tice Statistics (BJS). While some of the data were collected from universe sur-veys, most were gathered by sample surveys. Some questions from different surveys may appear the same, but they were actually asked of different popula-tions of students (e.g., high school seniors or students in grades 9 through 12); in different years; about experiences that occurred within different periods of time (e.g., in the past 4 weeks or during the past 12 months); and at different locations (e.g., in school or at home). Readers of this report should take particu-lar care when comparing data from the different data sources. Because of the variation in collection procedures, timing, phrasing of questions, and so forth, the results from the different sources may not be strictly comparable. After introduc-ing the data sources used for this report, the next section discusses the accu-racy of estimates and describes the statistical procedures used.
Sources of Data Table B1 presents some key information for each of the data sets used in the report, including the survey year(s), target population, response rate, and sam-ple size. The remainder of the section briefly describes each data set and pro-vides directions for obtaining more information. The exact wording of the interview questions used to construct the indicators are presented in table B2.
Schools and Staffing Survey (SASS)
This report draws upon data on teacher victimization from the 1993�94 Schools and Staffing Survey (SASS:93�94), which provides national- and state-level data on public and private schools, principals, school districts, and teachers. The 1993�94 survey was the third in a series of cross-sectional, school-focused sur-veys, following ones conducted in 1990�91 and 1987�88. It consisted of four sets of linked questionnaires, including surveys of schools, the principals of each selected school, a subsample of teachers within each school, and public school districts. Data were collected by multistage sampling. Stratified by state, control, type, association membership, and grade level (for private schools), schools were sampled first. Approximately 9,900 public schools and 3,300 private schools were selected to participate in the 1993�94 SASS. Within each school, teachers were further stratified into one of five teacher types in the following hi-erarchy: 1) Asian or Pacific Islander; 2) American Indian, Aleut, or Eskimo; 3) bilingual/ESL; 4) new teachers (those with 1 to 3 years of experience); and

142 Appendix B. Technical Notes
5) experienced teachers (those with more than 3 years of experience). Within each teacher stratum, teachers were selected systematically with equal probabil-ity. Approximately 56,700 public school teachers and 11,500 private school teachers were sampled.
This report focuses on teachers� responses. The overall weighted response rates were 84 percent for public school teachers and 73 percent for private school teachers. In the Public School Teacher Questionnaire, 91 percent of the items had a response rate of 90 percent or more, and in the Private School Teacher Questionnaire, 89 percent of the items had this level of response. Val-ues were imputed for questionnaire items that should have been answered but were not. For additional information about SASS, refer to R. Abramson, C. Cole, S. Fondelier, B. Jackson, R. Parmer, and S. Kaufman, 1996, 1993�94 Schools and Staffing Survey: Sample Design and Estimation (NCES 96�089), or contact:
Kerry Gruber National Center for Education Statistics 1990 K Street NW Washington, DC 20006 Telephone: (202) 502-7349 E-mail: [email protected]
National School-Based Youth Risk Behavior Survey (YRBS)
The National School-Based Youth Risk Behavior Survey (YRBS) is one compo-nent of the Youth Risk Behavior Surveillance System (YRBSS), an epidemiol-ogical surveillance system developed by the Centers for Disease Control and Prevention (CDC) to monitor the prevalence of youth behaviors that most influ-ence health. The YRBS focuses on priority health-risk behaviors established during youth that result in the most significant mortality, morbidity, disability, and social problems during both youth and adulthood. This report uses 1993, 1995, 1997, and 1999 YRBS data.
The YRBS used a three-stage cluster sampling design to produce a nationally representative sample of students in grades 9 through 12 in the United States. The target population consisted of all public and private school students in grades 9 through 12 in the 50 states and the District of Columbia. The first-stage sampling frame included selecting primary sampling units (PSUs) from strata formed on the basis of urbanization and the relative percentage of black and Hispanic students in the PSU. These PSUs are either large counties or groups of smaller, adjacent counties. At the second stage, schools were selected with probability proportional to school enrollment size. Schools with substantial num-bers of black and Hispanic students were sampled at relatively higher rates than all other schools. The final stage of sampling consisted of randomly selecting

Appendix B. Technical Notes 143
within each chosen school at each grade 9 through 12 one or two intact classes of a required subject, such as English or social studies. All students in selected classes were eligible to participate. Approximately 16,300, 10,900, 16,300, and 15,300 students were selected to participate in the 1993, 1995, 1997, and 1999 surveys, respectively.
The overall response rate was 70 percent for the 1993 survey, 60 percent for the 1995 survey, 69 percent for the 1997 survey, and 66 percent for the 1999 sur-vey. NCES standards call for response rates of 70 percent or better and bias analyses are called for by NCES when that percentage is not achieved. For the YRBS data, a full nonresponse bias analysis has not been done to date. The weights were developed to adjust for nonresponse and the oversampling of black and Hispanic students in the sample. The final weights were normalized so that only weighted proportions of students (not weighted counts of students) in each grade matched national population projections.
In 1999, in accordance with changes to the Office of Management and Budget�s standards for the classification of federal data on race and ethnicity, the YRBS item on race/ethnicity was modified. The version of the race and ethnicity ques-tion used in 1993, 1995, and 1997 was:
How do you describe yourself? 1 White - not Hispanic 2 Black - not Hispanic 3 Hispanic or Latino 4 Asian or Pacific Islander 5 American Indian or Alaskan Native 6 Other The version used in 1999 was:
How do you describe yourself? (Select one or more responses.) A. American Indian or Alaska Native B. Asian C. Black or African American D. Hispanic or Latino E. Native Hawaiian or Other Pacific Islander F. White This new version of the question used in 1999 results in the possibility of re-spondents marking more than one category. While more accurately reflecting respondents� racial and ethnic identity, the new item cannot be directly com-

144 Appendix B. Technical Notes
pared to responses to the old item. Thus, comparisons of responses by race/ethnicity between the 1999 YRBS and prior years� YRBS are not advisable. For additional information about the YRBS, contact:
Laura Kann Division of Adolescent and School Health National Center for Chronic Disease Prevention and Health Promotion Centers for Disease Control and Prevention, Mailstop K-33 4770 Buford Highway NE Atlanta, GA 30341 Telephone: (404) 488-5330 E-mail: [email protected]
Fast Response Survey System: Principal/School Disciplinarian Survey on School Violence
The Principal/School Disciplinarian Survey was conducted through the NCES Fast Response Survey System (FRSS) during the spring and summer of 1997. The FRSS is a survey system designed to collect small amounts of issue-oriented data with minimal burden on respondents and within a relatively short time frame. The FRSS Principal/School Disciplinarian Survey focused on inci-dents of specific crimes/offenses and a variety of specific discipline issues in public schools. The survey was conducted with a nationally representative sam-ple of regular public elementary, middle, and high schools in the 50 states and the District of Columbia. Special education, alternative and vocational schools, schools in the territories, and schools that taught only prekindergarten, kinder-garten, or adult education were not included in the sample.
The sample of public schools was selected from the 1993�94 NCES Common Core of Data (CCD) Public School Universe File. The sample was stratified by instructional level, locale, and school size. Within the primary strata, schools were also sorted by geographic region and by percent minority enrollment. The sample sizes were then allocated to the primary strata in rough proportion to the aggregate square root of the size of enrollment of schools in the stratum. A total of 1,415 schools were selected. Among them, 11 schools were found no longer to be in existence, and 1,234 schools completed the survey. In April 1997, ques-tionnaires were mailed to school principals, who were asked to complete the survey or to have it completed by the person most knowledgeable about disci-pline issues at the school. The raw response rate was 88 percent (1,234 schools divided by the 1,404 eligible schools in the sample). The weighted overall re-sponse rate was 89 percent, and item nonresponse rates ranged from 0 percent to 0.9 percent. The weights were developed to adjust for the variable probabili-ties of selection and differential nonresponse and can be used to produce na-tional estimates for regular public schools in the 1996�97 school year. For more

Appendix B. Technical Notes 145
information about the FRSS: Principal/School Disciplinarian Survey on School Violence, contact:
Shelley Burns National Center for Education Statistics 1990 K Street NW Washington, DC 20006 Telephone: (202) 502-7319 E-mail: [email protected]
National Crime Victimization Survey (NCVS)
The National Crime Victimization Survey (NCVS), administered for the U.S. Bu-reau of Justice Statistics by the Census Bureau, is the nation�s primary source of information on crime victimization and the victims of crime. Initiated in 1972 and redesigned in 1992, the NCVS collects detailed information on the frequency and nature of the crimes of rape, sexual assault, robbery, aggravated and simple assault, theft, household burglary, and motor vehicle theft experienced by Americans and their households each year. The survey measures crimes re-ported as well as those not reported to police.
The NCVS sample consists of about 50,000 households selected using a strati-fied, multistage cluster design. In the first stage, the primary sampling units (PSUs), consisting of counties or groups of counties, were selected. In the sec-ond stage, smaller areas, called Enumeration Districts (EDs), were selected from each sampled PSU. Finally, from selected EDs, clusters of four households, called segments, were selected for interview. At each stage, the selection was done proportionate to population size in order to create a self-weighting sample. The final sample was augmented to account for housing units constructed after the decennial Census. Within each sampled household, Census Bureau person-nel interviewed all household members ages 12 and older to determine whether they had been victimized by the measured crimes during the 6 months preced-ing the interview. About 90,000 persons ages 12 and older are interviewed each 6 months. Households remain in the sample for 3 years and are interviewed 7 times at 6-month intervals. The initial interview at each sample unit is used only to bound future interviews to establish a time frame to avoid duplication of crimes uncovered in these subsequent interviews. After their seventh interview, households are replaced by new sample households. The NCVS has consis-tently obtained a response rate of about 95 percent at the household level. Dur-ing the study period, the completion rates for persons within households were about 91 percent. Thus, final response rates were about 86 percent. Weights were developed to permit estimates for the total U.S. population 12 years and older. For more information about the NCVS, contact:
146 Appendix B. Technical Notes
Michael Rand Victimization Statistics U.S. Bureau of Justice Statistics 810 7th Street NW Washington, DC 20531 Telephone: (202) 616-3494 E-mail: [email protected] Internet: www.ojp.usdoj.gov/bjs/
School Crime Supplement (SCS)
Created as a supplement to the NCVS and co-designed by the National Center for Education Statistics and Bureau of Justice Statistics, the School Crime Sup-plement (SCS) survey was conducted in 1989, 1995, and 1999 to collect addi-tional information about school-related victimizations on a national level. The survey was designed to assist policymakers as well as academic researchers and practitioners at the federal, state, and local levels so that they can make informed decisions concerning crime in schools. The SCS asks students a num-ber of key questions about their experiences with and perceptions of crime and violence that occurred inside their school, on school grounds, or on the way to or from school. Additional questions not included in the NCVS were also added to the SCS, such as those concerning preventive measures used by the school, students� participation in afterschool activities, students� perceptions of school rules, the presence of weapons and street gangs in school, the presence of hate-related words and graffiti in school, student reports of bullying at school, and the availability of drugs and alcohol in school, as well as attitudinal ques-tions relating to fear of victimization and avoidance behavior in school.
In 1989, 1995, and 1999, the SCS was conducted for a 6-month period from January through June in all households selected for the NCVS (see discussion above for information about the sampling design). It should be noted that the initial NCVS interview is included in the SCS data analysis. Within these house-holds, the eligible respondents for the SCS were those household members who had attended school at any time during the 6 months preceding the interview, and were enrolled in grades 6 through 12 in a school that would help them ad-vance toward eventually receiving a high school diploma. Eligible respondents were asked the supplemental questions in the SCS only after completing their entire NCVS interview. For the 1989 and the 1995 SCS, 19-year-old household members also were considered eligible for the SCS interview. This upper age range was lowered to 18 for eligibility in the 1999 SCS because it was deter-mined that most 19-year-olds did not meet the other eligibility requirement of being currently enrolled in a secondary school. In this report, 19-year-olds were excluded from the analysis of the 1995 data in order to meet the eligibility

Appendix B. Technical Notes 147
requirements and to allow for comparisons to the 1999 SCS. However, the 19-year-olds were not dropped from the analysis of the 1989 data.
Comparisons between the 1989 data and the 1995 and 1999 data should be made with caution due to the redesign of the NCVS in 1992. A new victimization screening procedure, put in place in 1992, was meant to elicit a more complete tally of victimization incidents than did the one used in prior NCVS collections. Therefore, NCVS item-based cross-year changes in reported victimization rates, or lack thereof, may only be the result of changes in how the questions were asked and not of actual changes in the incidence of victimization. Because NCVS questionnaires were completed before students were given the SCS, it is likely that these changes to the NCVS victimization screening procedures differ-entially affected responses to the 1989 and 1995 SCS victimization items. Other items in this report, such as fear at school, avoidance of places at school, and reports of gangs at school, followed the victimization items on the SCS survey.
Unlike prior Indicators reports, the prevalence of victimization for 1995 and 1999 was calculated by using NCVS incident variables appended to the 1995 and 1999 SCS data files. The NCVS type of crime variable was used to classify vic-timizations of students in the SCS as serious violent, violent, or theft. The NCVS variables asking where the incident happened and what the victim was doing when it happened were used to ascertain whether the incident happened at school. For prevalence of victimization, the NCVS definition of �at school� in-cludes in the school building, on school property, or on the way to or from school.
Total victimization is a combination of violent victimization and theft. If the stu-dent reported an incident of either, he or she is counted as having experienced �total� victimization. If the student reported having experienced both, he or she is counted once under �total� victimization. Serious violent crimes include rape, sexual assault, robbery, and aggravated assault. Violent crimes include serious violent crimes and simple assault.
A total of 10,449 students participated in the 1989 SCS, 9,728 in the 1995 SCS, and 8,398 in 1999. In the 1999 SCS, the household completion rate was 94 per-cent. In the 1989 and 1995 SCS, the household completion rates were 97 per-cent and 95 percent, respectively; and the student completion rates were 86 percent and 78 percent, respectively. For the 1999 SCS, the student completion rate was 78 percent. Thus, the overall SCS response rate (calculated by multi-plying the household completion rate by the student completion rate) was 84 percent in 1989, 74 percent in 1995, and 73 percent in 1999. Response rates for most survey items were high�mostly over 95 percent of all eligible respondents. The weights were developed to compensate for differential probabilities of selec-tion and nonresponse. The weighted data permit inferences about the eligible

148 Appendix B. Technical Notes
student population who were enrolled in schools in 1989, 1995, and 1999. For more information about SCS, contact:
Kathryn A. Chandler National Center for Education Statistics 1990 K Street NW Washington, DC 20006 Telephone: (202) 502-7326 E-mail: [email protected]
School Associated Violent Death Study (SAVD)
The School Associated Violent Death Study (SAVD) is an epidemiological study developed by the Centers for Disease Control and Prevention in conjunction with the U.S. Department of Education and the U.S. Department of Justice. SAVD seeks to describe the epidemiology of school-associated violent deaths, identify common features of these deaths, estimate the rate of school-associated violent death in the United States, and identify potential risk factors for these deaths. The study includes descriptive data on all school-associated violent deaths in the United States, including all homicides, suicides, and firearm-related deaths where the fatal injury occurred on the campus of a functioning elementary or secondary school, while the victim was on the way to or from regular sessions at such a school, or while attending or on the way to or from an official school-sponsored event. Victims of such events include nonstudents as well as stu-dents and staff members. SAVD includes descriptive information about the school, event, victim(s), and offender(s). The first SAVD study collected data for July 1, 1992�June 30, 1994 and the follow-up study includes July 1, 1994�June 30, 1999. The follow-up study is nearing completion, and data presented in this report include preliminary findings for the 1998�1999 school year.
SAVD uses a four-step process to identify and collect data on school-associated violent deaths. Cases were initially identified through a search of the Lexis/Nexis and Dialog newspaper and media databases. Then police officials are contacted to confirm the details of the case to determine if the event meets the case defini-tion. Once a case is confirmed, a police official and a school official are inter-viewed in regards to details about the school, event, victim(s), and offender(s). If police officials are unwilling or unable to complete the interview, a copy of the full police report is obtained. The information obtained about schools includes school demographics, attendance/absentee rates, suspension/expulsions and mobility, school history of weapon carrying, security measures, violence preven-tion activities, school response to the event, and school policies about weapon carrying. Event information includes the location of injury, the context of injury (while classes held, during break, etc.), motives for injury, method of injury, and

Appendix B. Technical Notes 149
school and community events happening around the time period. Information obtained on victim(s) and offender(s) includes demographics, circumstances of the event (date/time, alcohol or drug use, number of persons involved), types and origins of weapons, criminal history, psychological risk factors, school-related problems, extracurricular activities, and family history including structure and stressors.
One hundred and five school-associated violent deaths were identified from July 1, 1992�June 30, 1994 (See Kachur et al. June 12, 1996. JAMA. 275:22: 1729�1733). While the current study is still ongoing, over 250 school-associated vio-lent deaths have been identified for July 1, 1994�June 30, 1999. The first study achieved a response rate of 85 percent for police officials and 81 percent for school officials. To date, the current study has achieved 96 percent for police officials and 79 percent for school officials. For additional information about SAVD, contact:
Mark Anderson Division of Violence Prevention National Center for Injury Prevention and Control Centers for Disease Control and Prevention, Mailstop K60 4770 Buford Highway NE Atlanta, GA 30341 Telephone: (770) 488-4762 E-mail: [email protected]
Accuracy of Estimates
The accuracy of any statistic is determined by the joint effects of �nonsampling� and �sampling� errors. Both types of error affect the estimates presented in this report. Several sources can contribute to nonsampling errors. For example, members of the population of interest are inadvertently excluded from the sam-pling frame; sampled members refuse to answer some of the survey questions (item nonresponse) or all of the survey questions (questionnaire nonresponse); mistakes are made during data editing, coding, or entry; the responses that re-spondents provide differ from the �true� responses; or measurement instruments such as tests or questionnaires fail to measure the characteristics they are in-tended to measure. Although nonsampling errors due to questionnaire and item nonresponse can be reduced somewhat by the adjustment of sample weights and imputation procedures, correcting nonsampling errors or gauging the effects of these errors is usually difficult.
Sampling errors occur because observations are made on samples rather than on entire populations. Surveys of population universes are not subject to sam-pling errors. Estimates based on a sample will differ somewhat from those that would have been obtained by a complete census of the relevant population

150 Appendix B. Technical Notes
using the same survey instruments, instructions, and procedures. The standard error of a statistic is a measure of the variation due to sampling; it indicates the precision of the statistic obtained in a particular sample. In addition, the standard errors for two sample statistics can be used to estimate the precision of the dif-ference between the two statistics and to help determine whether the difference based on the sample is large enough so that it represents the population differ-ence.
Most of the data used in this report were obtained from complex sampling de-signs rather than a simple random design. In these sampling designs, data were collected through stratification, clustering, unequal selection probabilities, or multistage sampling. These features of the sampling usually result in estimated statistics that are more variable (that is, have larger standard errors) than they would have been if they had been based on data from a simple random sample of the same size. Therefore, calculation of standard errors requires procedures that are markedly different from the ones used when the data are from a simple random sample. The Taylor series approximation technique or the balanced repeated replication (BRR) method was used to estimate most of the statistics and their standard errors in this report. Table B3 lists the various methods used to compute standard errors for different data sets.
Standard error calculation for data from the National Crime Victimization Survey and the School Crime Supplement relied on a combination of procedures. For statistics based on the 1995 and 1999 SCS data, the Taylor series approxima-tion method using PSU and strata variables available from the data set was em-ployed. For statistics based on all years of NCVS data and the 1989 SCS data, standard errors were derived from a formula developed by the Census Bureau, which consists of three generalized variance function (gvf) constant parameters that represent the curve fitted to the individual standard errors calculated using the Jackknife Repeated Replication technique. The formulas used to compute the adjusted standard errors associated with percentages or population counts can be found in table B3.
Statistical Procedures
The comparisons in the text have been tested for statistical significance to en-sure that the differences are larger than might be expected due to sampling variations. Unless otherwise noted, all statements cited in the report are statisti-cally significant at the .05 level. Several test procedures were used, depending upon the type of data being analyzed and the nature of the statement being tested. The primary test procedure used in this report was the Student�s t statis-tic, which tests the difference between two sample estimates, for example, be-tween males and females. The formula used to compute the t statistic is as follows:

Appendix B. Technical Notes 151
t = E - Ese +se
1 2
12
22
(1)
where E1 and E2 are the estimates to be compared and se1 and se2 are their corresponding standard errors. Note that this formula is valid only for independ-ent estimates. When the estimates are not independent (for example, when comparing a total percentage with that for a subgroup included in the total), a covariance term (i.e., 2*se1*se2) must be added to the denominator of the for-mula:
t E Ese se 2 se se
1 2
12
22
1 2
= −+ + ∗ ∗
(2)
Once the t value was computed, it was compared with the published tables of values at certain critical levels, called alpha levels. For this report, an alpha value of 0.05 was used, which has a t value of 1.96. If the t value was larger than 1.96, then the difference between the two estimates was statistically signifi-cant at the 95 percent level.
When multiple comparisons among more than two groups were made, for ex-ample, among racial/ethnic groups, a Bonferroni adjustment to the significance level was used to ensure that the significance level for the tests as a group was at the .05 level. Generally, when multiple statistical comparisons are made, it becomes increasingly likely that an indication of a population difference is erro-neous. Even when there is no difference in the population, at an alpha of .05, there is still a 5 percent chance of concluding that an observed t value representing one comparison in the sample is large enough to be statistically significant. As the number of comparisons increase, the risk of making such an erroneous inference also increases. The Bonferroni procedure corrects the sig-nificance (or alpha) level for the total number of comparisons made within a par-ticular classification variable. For each classification variable, there are (K*(K�1)/2) possible comparisons (or nonredundant pairwise combinations), where K is the number of categories. The Bonferroni procedure divides the alpha level for a single t test by the number of possible pairwise comparisons in order to produce a new alpha level that is corrected for the fact that multiple contrasts are being made. As a result, the t value for a certain alpha level (e.g., .05) increases, which makes it more difficult to claim that the difference observed is statistically significant.
Finally, a linear trend test was used when a statement describing a linear trend, rather than the differences between two discrete categories, was made. This test allows one to examine whether, for example, the percentage of students using drugs increased (or decreased) over time or whether the percentage of students who reported being physically attacked in school increased (or decreased) with

152 Appendix B. Technical Notes
their age. Based on a regression with, for example, student�s age as the inde-pendent variable and whether a student was physically attacked as the depend-ent variable, the test involves computing the regression coefficient (b) and its corresponding standard error (se). The ratio of these two (b/se) is the test statis-tic t. If t is greater than 1.96, the critical value for one comparison at the .05 al-pha level, the hypothesis that there is a linear relationship between student�s age and being physically attacked is not rejected.
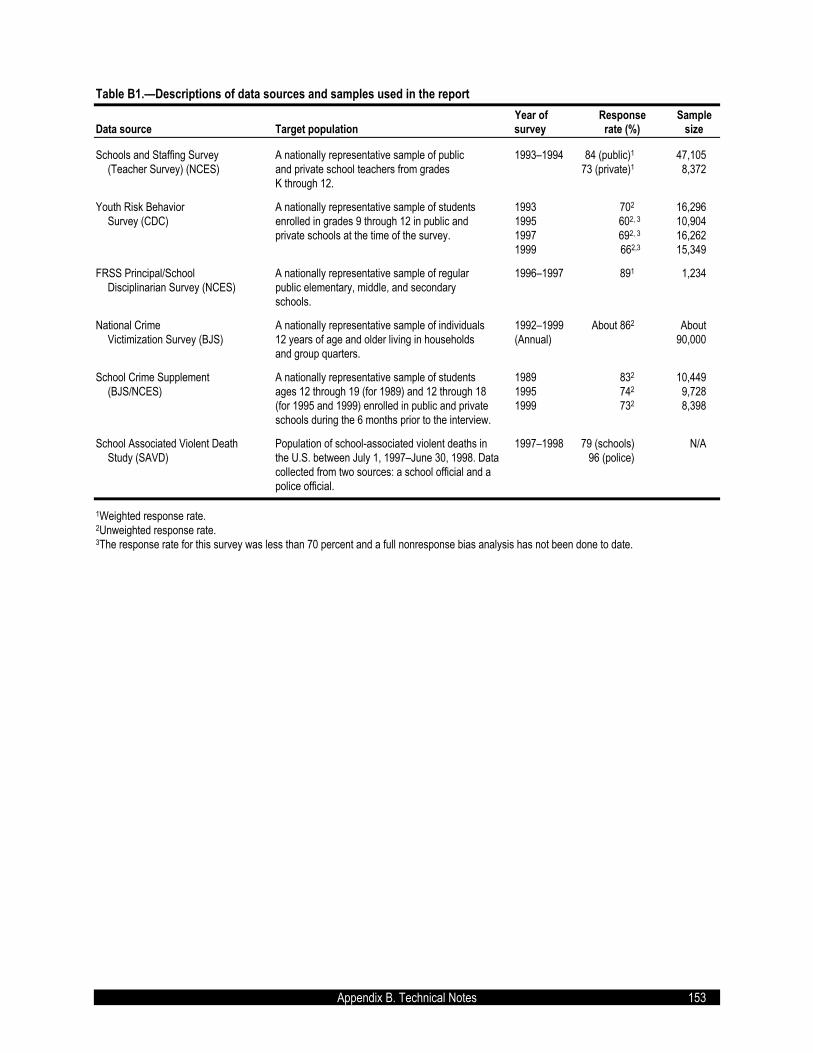
Appendix B. Technical Notes 153
Table B1.�Descriptions of data sources and samples used in the report
Year of Response Sample Data source Target population survey rate (%) size Schools and Staffing Survey A nationally representative sample of public 1993�1994 84 (public)1 47,105 (Teacher Survey) (NCES) and private school teachers from grades 73 (private)1 8,372 K through 12. Youth Risk Behavior A nationally representative sample of students 1993 702 16,296 Survey (CDC) enrolled in grades 9 through 12 in public and 1995 602, 3 10,904 private schools at the time of the survey. 1997 692, 3 16,262 1999 662,3 15,349 FRSS Principal/School A nationally representative sample of regular 1996�1997 891 1,234 Disciplinarian Survey (NCES) public elementary, middle, and secondary schools. National Crime A nationally representative sample of individuals 1992�1999 About 862 About Victimization Survey (BJS) 12 years of age and older living in households (Annual) 90,000 and group quarters. School Crime Supplement A nationally representative sample of students 1989 832 10,449 (BJS/NCES) ages 12 through 19 (for 1989) and 12 through 18 1995 742 9,728 (for 1995 and 1999) enrolled in public and private 1999 732 8,398 schools during the 6 months prior to the interview. School Associated Violent Death Population of school-associated violent deaths in 1997�1998 79 (schools) N/A Study (SAVD) the U.S. between July 1, 1997�June 30, 1998. Data 96 (police) collected from two sources: a school official and a police official.
1Weighted response rate. 2Unweighted response rate. 3The response rate for this survey was less than 70 percent and a full nonresponse bias analysis has not been done to date.

Appendix B. Technical Notes 154
Table B2.�Wording of survey questions used to construct indicators
Survey Questions Response Categories Nonfatal Student Victimization National Crime Victimization Survey1 • I�m going to read some examples that will give you an idea of the kinds of crimes this study Yes/No; if yes, What (Screen Questionnaire) covers. As I go through them, tell me if any of these happened to you in the last 6 months. happened? If yes, how That is since ________, 19__. Was something belonging to you stolen, such as many times? Things that you carry, like luggage, a wallet, purse, briefcase, book Clothing, jewelry, or calculator Bicycle or sports equipment Or did anyone attempt to steal anything belonging to you? • (Other than any incidents already mentioned,) Since ______, 19__ were you attacked or Yes/No; if yes, what threatened or did you have something stolen from you happened? If yes, how At work or school many times? Or did anyone attempt to attack or attempt to steal anything belonging to you from any of these places? • (Other than any incidents already mentioned,) has anyone attacked or threatened you in Yes/No; if yes, what any of these ways (exclude telephone threats): happened? If yes, how With any weapon, for instance, a gun or knife many times? With anything like a baseball bat, frying pan, scissors, or stick By something thrown, such as a rock or bottle Include any grabbing, punching, or choking Any rape, attempted rape or other type of sexual attack Any face to face threats Or any attack or threat or use of force by anyone at all? Please mention it even if you are not certain it was a crime. • People often don�t think of incidents committed by someone they know. (Other than any Yes/No; if yes, what incidents already mentioned,) did you have something stolen from you or were you happened? If yes, how attacked or threatened by (exclude telephone threats): many times? Someone at work or school? • Incidents involving forced or unwanted sexual acts are often difficult to talk about. (Other Yes/No; if yes, what than any incidents already mentioned,) Have you been forced or coerced to engage in happened? If yes, how unwanted sexual activity by: many times? Someone you didn�t know before A casual acquaintance Or someone you know well?

Appendix B. Technical Notes 155
Table B2.�Wording of survey questions used to construct indicators�Continued
Survey Questions Response Categories National Crime Victimization Survey1 (Incident Report) • Where did this incident happen? In own home or lodging/Near
own home/At, in or near a friend�s/relative�s/neighbor�s home/Commercial places/ Parking lots/garages/School/ Open areas, on street or pub-lic transportation/Other
• What were you doing when this incident (happened/started)? Working or on duty/
On the way to or from work/On the way to or from school/On the way to of from other place/Shopping, errands/ Attending school/Leisure activity away from home/ Sleeping/Other activities at home/Other
Youth Risk Behavior Survey • During the past 12 months, how many times has someone threatened or injured you with 0 times/1 time/2�3 times/4�5 a weapon such as a gun, knife, or club on school property? times/6�7 times/8�9 times/ 10�11 times/12 or more times • During the last 12 months, how many times were you in a physical fight? 0 times/1 time/2�3 times/4�5 times/6�7 times/8�9 times/ 10�11 times/12 or more times • During the last 12 months, how many times were you in a physical fight 0 times/1 time/2�3 times/4�5 on school property? times/6�7 times/8�9 times/ 10�11 times/12 or more times

Appendix B. Technical Notes 156
Table B2.�Wording of survey questions used to construct indicators�Continued
Survey Questions Response Categories
School Crime Supplement1 • During the last 6 months, have you been bullied at school? That is, has anyone picked on Yes/No you a lot or tried to make you do things you didn�t want to do like give them money? You may include incidents you reported before.
Violence and Crime at School FRSS Principal/School • During the 1996�97 school year, how many incidents involving each type of the following Actual number of Disciplinarian Survey crimes or offenses have occurred at your school? Only include incidents in which police or incidents in which other law enforcement representatives were contacted. police or other law en- Murder forcement representatives Rape or other type of sexual battery were contacted Suicide Physical attack or fight with a weapon Physical attack or fight without a weapon Robbery Theft/larceny Vandalism Nonfatal Teacher Victimization National Crime Victimization Survey1 • I�m going to read some examples that will give you an idea of the kinds of crimes this Yes/No; if yes, What (Screen Questionnaire) study covers. As I go through them, tell me if any of these happened to you in the last 6 happened? If yes, how months. That is since ________, 19__. many times? Was something belonging to you stolen, such as Things that you carry, like luggage, a wallet, purse, briefcase, book Clothing, jewelry, or calculator Bicycle or sports equipment Or did anyone attempt to steal anything belonging to you? • (Other than any incidents already mentioned,) Since ______, 19__ were you attacked or Yes/No; if yes, What threatened or did you have something stolen from you happened? If yes, how At work or school many times? Or did anyone attempt to attack or attempt to steal anything belonging to you from any of these places?
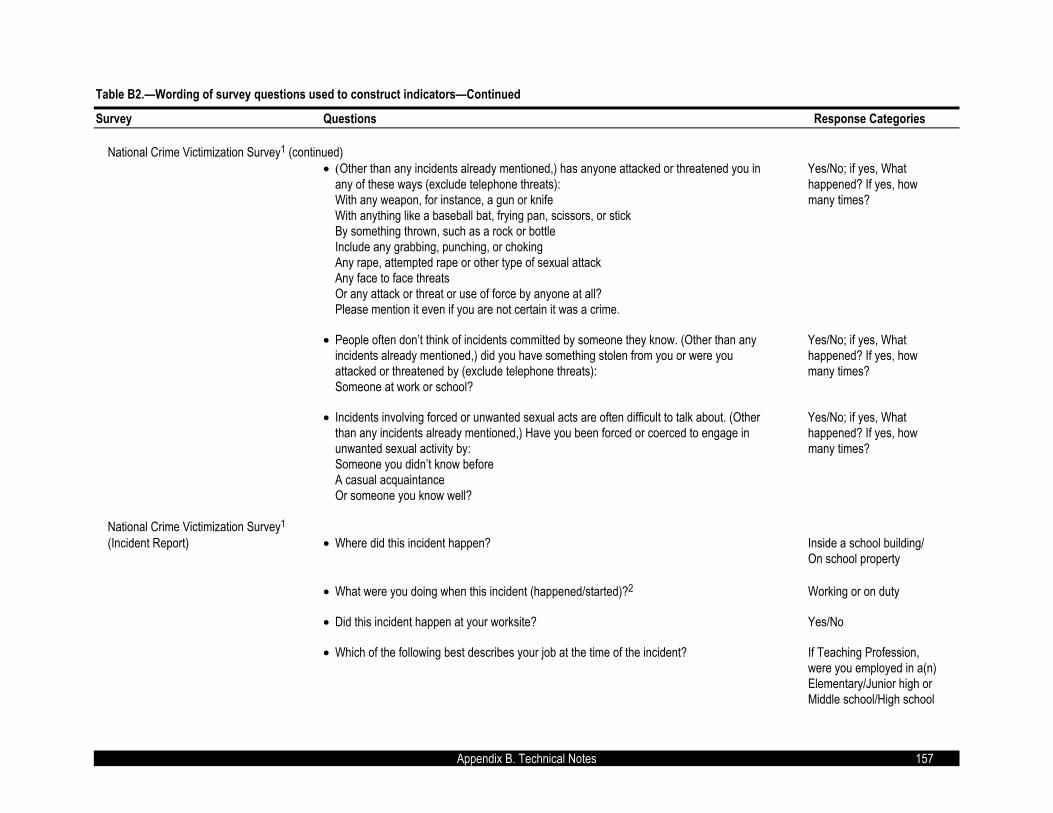
Appendix B. Technical Notes 157
Table B2.�Wording of survey questions used to construct indicators�Continued
Survey Questions Response Categories National Crime Victimization Survey1 (continued) • (Other than any incidents already mentioned,) has anyone attacked or threatened you in Yes/No; if yes, What any of these ways (exclude telephone threats): happened? If yes, how With any weapon, for instance, a gun or knife many times? With anything like a baseball bat, frying pan, scissors, or stick By something thrown, such as a rock or bottle Include any grabbing, punching, or choking Any rape, attempted rape or other type of sexual attack Any face to face threats Or any attack or threat or use of force by anyone at all? Please mention it even if you are not certain it was a crime. • People often don�t think of incidents committed by someone they know. (Other than any Yes/No; if yes, What incidents already mentioned,) did you have something stolen from you or were you happened? If yes, how attacked or threatened by (exclude telephone threats): many times? Someone at work or school? • Incidents involving forced or unwanted sexual acts are often difficult to talk about. (Other Yes/No; if yes, What than any incidents already mentioned,) Have you been forced or coerced to engage in happened? If yes, how unwanted sexual activity by: many times? Someone you didn�t know before A casual acquaintance Or someone you know well? National Crime Victimization Survey1 (Incident Report) • Where did this incident happen? Inside a school building/ On school property • What were you doing when this incident (happened/started)?2 Working or on duty
• Did this incident happen at your worksite? Yes/No
• Which of the following best describes your job at the time of the incident? If Teaching Profession, were you employed in a(n)
Elementary/Junior high or Middle school/High school

Appendix B. Technical Notes 158
Table B2.�Wording of survey questions used to construct indicators�Continued
Survey Questions Response Categories
Schools and Staffing Survey • Has a student (from this school) threatened to injure you in the past 12 months? Yes/No • Has a student (from this school) physically attacked you in the past 12 months? Yes/No School Environment Youth Risk Behavior Survey • During the past 30 days, on how many days did you carry a weapon such as a gun, knife, 0 days/1 day/2�3 days/4�5 or club? days/6 or more • During the past 30 days, on how many days did you carry a weapon such as a gun, knife, 0 days/1 day/2�3 days/4�5 or club on school property? days/6 or more • During the past 30 days, on how many days did you have at least one drink of alcohol? 0 days/ 1�2 days/ 3�5 days/6�9 days/
10 to 19 days/20�29 days/all 30 days
• During the past 30 days, on how many days did you have at least one drink of alcohol on 0 days/1�2 days/ school property? 3�5 days/6�9 days/ 10 to 19 days/20�29 days/all 30 days • During the past 30 days, how many times did you use marijuana? 0 times/1�2 times/3�9 times/10�19 times/20�39 times/40 or more times • During the past 30 days, how many times did you use marijuana on school property? 0 times/1�2 times/3�9 times/10�19 times/20�39 times/40 or more times • During the past 12 months, has anyone offered, sold or given you an illegal drug on Yes/No school property?
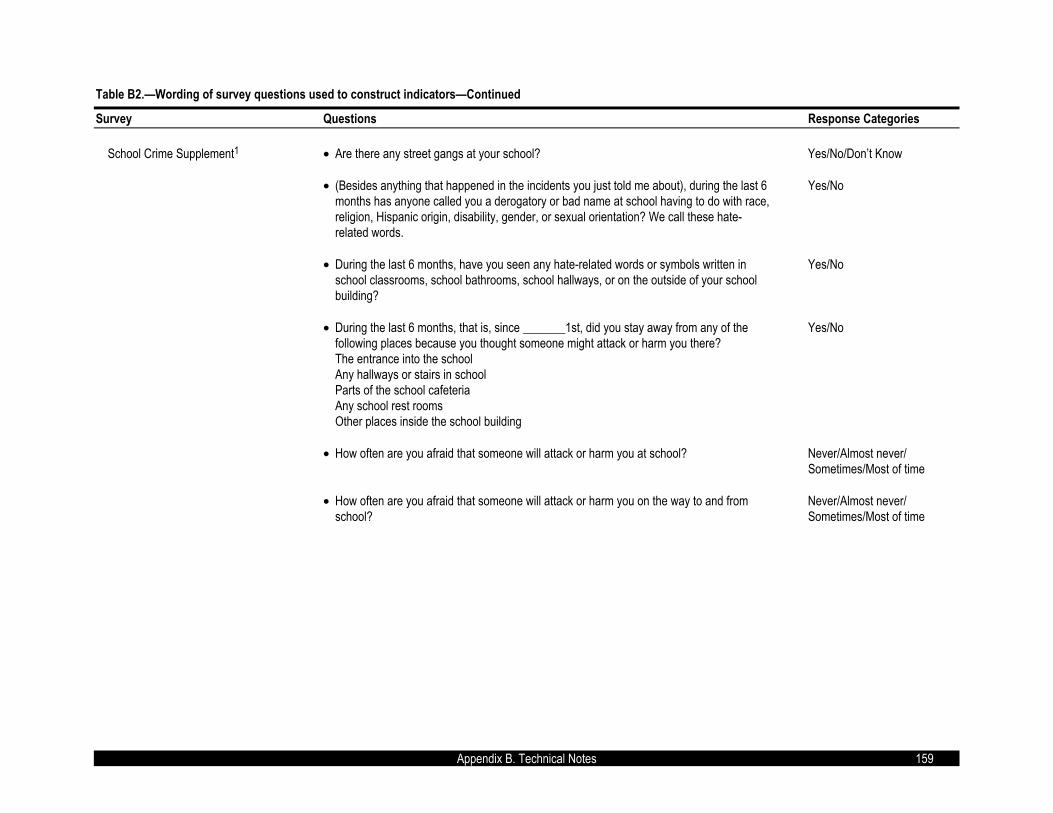
Appendix B. Technical Notes 159
Table B2.�Wording of survey questions used to construct indicators�Continued
Survey Questions Response Categories
School Crime Supplement1 • Are there any street gangs at your school? Yes/No/Don�t Know
• (Besides anything that happened in the incidents you just told me about), during the last 6 Yes/No months has anyone called you a derogatory or bad name at school having to do with race, religion, Hispanic origin, disability, gender, or sexual orientation? We call these hate- related words.
• During the last 6 months, have you seen any hate-related words or symbols written in Yes/No school classrooms, school bathrooms, school hallways, or on the outside of your school building?
• During the last 6 months, that is, since _______1st, did you stay away from any of the Yes/No following places because you thought someone might attack or harm you there? The entrance into the school Any hallways or stairs in school Parts of the school cafeteria Any school rest rooms Other places inside the school building • How often are you afraid that someone will attack or harm you at school? Never/Almost never/ Sometimes/Most of time • How often are you afraid that someone will attack or harm you on the way to and from Never/Almost never/ school? Sometimes/Most of time

Appendix B. Technical Notes 160
Table B2.�Wording of survey questions used to construct indicators�Continued
Survey Questions Response Categories FRSS Principal/School • Circle the number indicating to what extent, if any, each of the following has been a 1) Serious/2) Moderate/ Disciplinarian Survey problem in your school during the 1996�97 school year: 3) Minor/4) Not a problem Student tardiness Student absenteeism/class cutting Physical conflicts among students Robbery or theft of items over $10 Vandalism of school property Student alcohol use Student drug use Sale of drugs on school grounds Student tobacco use Student possession of weapons Trespassing Verbal abuse of teachers Physical abuse of teachers Teacher absenteeism Teacher alcohol or drug use Racial tensions Gangs
1Readers should note that this table reflects the most recent version of the NCVS (1998) and SCS (1999) instruments. Survey items shown here may have changed from past NCVS and SCS collec-tions. 2Estimates of teacher victimizations include crimes occurring to teachers at school (location), or at the worksite (location), or while working (activity). For thefts, activity was not considered, since thefts of teachers� property kept at school can occur when teachers are not present.

Appendix B. Technical Notes 161
Table B3.�Methods used to calculate standard errors of statistics for different surveys
Survey Year Method of calculation National Crime Victimization Survey 1992 to 1999 Standard errors of crime level data and aggregated crime rates per 1,000 persons were calculated using three generalized variance function (gvf) constant parameters (denoted as a, b, and c) and formulas published in the Methodology Section of Criminal Victimization in the United States�Statistical Tables
(NCJ184938) on the Bureau of Justice Statistics web site: http://www.ojp.usdoj.gov/bjs/abstract/cvusst.htm.
The formula used to calculate standard errors (q) of crime level data (x) is:
3/22 cx bx ax ++
where x is the estimated number of crimes of interest, and a, b, and c are gvf constant parameters. The formula used to calculate standard errors of aggregated crime rates per 1,000 persons (r) is:
(y)r)/-1000rcr(r)/y-br(1000 + where r is the aggregate crime rate (i.e., 1000* total crimes / total population), y is the aggregated base population, and b and c are gvf constant parameters. The three gvf constant parameters associated with the specific years are: Year a b c 1992 -0.00013407 4,872 3.858 1993 -0.00007899 2,870 2.273 1994 -0.00006269 2,278 1.804 1995 -0.00006269 2,278 1.804 1996 -0.00006863 2,494 1.975 1997 0.00016972 2,945 2.010 1998 0.00001297 2,656 3.390 1999 -0.00026646 2,579 2.826 Aggregated data -0.00002061 3,705 1.688 from 1995 to 99
Readers should note that the annual parameters pub-lished in this year�s report differ slightly from those pro-vided in previous reports.
School Crime Supplement 1989, 1995, Standard errors of percentage and population counts were and 1999 calculated using the Taylor series approximation method
using PSU and strata variables from the 1995 and 1999 data sets. Another way in which the standard errors can be calculated for these years is by using the generalized vari-ance function (gvf) constant parameters (denoted as a, b & c). The gvf parameters were used to calculate the standard errors for the 1989 data in this report.

162 Appendix B. Technical Notes
Table B3.�Methods used to calculate standard errors of statistics for different surveys�Continued
Survey Year Method of calculation The formula used to calculate standard errors for percentages (p) is:
yppcpypbp /)(/)1( −+− where p is the percentage or interest expressed as a proportion, y is the size of the population to which the percent applies, and b and c are gvf constant parameters. After the standard error is estimated, it is multiplied by 100 to make it applicable to the percentage. The formula used to calculate standard errors of population counts (x) is: 3/22 cx bx ax ++ where x is the estimated number of students who experienced a given event, and a, b, and c are gvf constant parameters. The three gvf constant parameters associated with the specific years are: Year a b c 1989 -0.00001559 3,108 0.000 1995 -0.00006269 2,278 1.804 1999 -0.00026646 2,579 2.826 Schools and Staffing Survey 1993�1994 Balanced repeated replication method using replicate weights available from the data set. FRSS Principal/School 1997 Jackknife replication method using replicate weights Disciplinarian Survey available from the data set. Youth Risk Behavior Survey 1993, 1995, Taylor series approximation method using PSU and 1997, and 1999 strata variables available from the data set.

Appendix C. Glossary of Terms 163
APPENDIX C. GLOSSARY OF TERMS
General Terms
Cluster sampling Cluster sampling is a technique in which the sampling of respondents or sub-jects occurs within clusters or groups. For example, selecting students by sam-pling schools and the students that attend that school.
Crime Any violation of a statute or regulation or any act that the government has de-termined is injurious to the public, including felonies and misdemeanors. Such violation may or may not involve violence, and it may affect individuals or prop-erty.
Incident A specific criminal act or offense involving one or more victims and one or more offenders.
Multi-stage sampling A survey sampling technique in which there is more than one wave of sampling. That is, one sample of units is drawn, and then another sample is drawn within that sample. For example, at the first stage, a number of Census blocks may be sampled out of all the Census blocks in the United States. At the second stage, households are sampled within the previously sampled Census blocks.
Prevalence The percentage of the population directly affected by crime in a given period. This rate is based upon specific information elicited directly from the respondent regarding crimes committed against his or her person, against his or her prop-erty, or against an individual bearing a unique relationship to him or her. It is not based upon perceptions and beliefs about, or reactions to, criminal acts.
School An education institution consisting of one or more of grades K through 12.
School crime Any criminal activity that is committed on school property.
School year The 12-month period of time denoting the beginning and ending dates for school accounting purposes, usually from July 1 through June 30.
Stratification Stratification is a survey sampling technique in which the target population is divided into mutually exclusive groups or strata based on some variable or vari-ables (e.g., metropolitan area) and sampling of units occurs separately within each stratum.

164 Appendix C. Glossary of Terms
Unequal probabilities A survey sampling technique in which sampled units do not have the same probability of selection into the sample. For example, the investigator may over-sample minority students in order to increase the sample sizes of minority stu-dents. Minority students would then be more likely than other students to be sampled.
Specific Terms Used in Various Surveys
National Crime Victimization Survey
At school (students) Inside the school building, on school property (school parking area, play area, school bus, etc.), or on the way to or from school.
At school (teachers) Inside the school building, on school property (school parking area, play area, school bus, etc.), at work site, or while working. For thefts, �while working� was not considered, since thefts of teachers� property kept at school can occur when teachers are not present.
Aggravated assault Attack or attempted attack with a weapon, regardless of whether or not an injury occurs, and attack without a weapon when serious injury results.
Rape Forced sexual intercourse including both psychological coercion as well as physical force. Forced sexual intercourse means vaginal, anal, or oral penetra-tion by the offender(s). This category also includes incidents where the penetra-tion is from a foreign object such as a bottle.
Robbery Completed or attempted theft, directly from a person, of property or cash by force or threat of force, with or without a weapon, and with or without injury.
Rural A place not located inside the Metropolitan Statistical Area (MSA). This category includes a variety of localities, ranging from sparsely populated rural areas to cit-ies with populations of less than 50,000.
Serious violent crime Rape, sexual assault, robbery, or aggravated assault.
Sexual assault A wide range of victimizations, separate from rape or attempted rape. These crimes include attacks or attempted attacks generally involving unwanted sexual contact between the victim and offender. Sexual assault may or may not involve force and includes such things as grabbing or fondling. Sexual assault also in-cludes verbal threats.

Appendix C. Glossary of Terms 165
Simple assault Attack without a weapon resulting either in no injury, minor injury, or in undeter-mined injury requiring less than 2 days of hospitalization. Also includes at-tempted assault without a weapon.
Suburban A county or counties containing a central city, plus any contiguous counties that are linked socially and economically to the central city. On the data tables, sub-urban areas are categorized as those portions of metropolitan areas situated �outside central cities.�
Theft Completed or attempted theft of property or cash without personal contact.
Victimization A crime as it affects one individual person or household. For personal crimes, the number of victimizations is equal to the number of victims involved. The number of victimizations may be greater than the number of incidents because more than one person may be victimized during an incident.
Victimization rate A measure of the occurrence of victimizations among a specific population group.
Violent crime Rape, sexual assault, robbery, or assault.
Urban The largest city (or grouping of cities) in an MSA.
School Crime Supplement
Any victimization Combination of violent and property victimization. If a student reported an inci-dent of either, he or she is counted as having experienced any victimization. If the student reported having experienced both, he or she is counted once under �any victimization.�
At school In the school building, on the school grounds, or on a school bus.
Property victimization Theft of property from a student�s desk, locker, or other locations at school.
Violent victimization Physical attacks or taking property from the student directly by force, weapons, or threats.
Youth Risk Behavior Survey
On school property On school property is included in the question wording but was not defined for respondents.

166 Appendix C. Glossary of Terms
Weapon Examples of weapons appearing in the questionnaire include guns, knives, and clubs.
Illegal drugs Examples of illegal drugs were marijuana, cocaine, inhalants, steroids, or pre-scription drugs without a doctor�s permission, heroin, and methamphetamines.
FRSS Principal/School Disciplinarian Survey
At school In school buildings, on school buses, on school grounds, or at places that hold school-sponsored events or activities, but are not officially on school grounds.
Central region Illinois, Indiana, Iowa, Kansas, Michigan, Minnesota, Missouri, Nebraska, North Dakota, Ohio, South Dakota, and Wisconsin.
City A central city of a Metropolitan Statistical Area (MSA).
Elementary school A school that has a low grade of 3 or less and a high grade of 1 through 8.
Free/reduced-price The percent of students enrolled in the school who are eligible for the federally lunch funded free or reduced-price lunch program.
High school/combined A school that has a low grade of 9 through 12 and a high grade of 10 through 12. Schools that do not precisely meet these qualifications, and are not elementary and middle schools, are classified as �combined� and are included in the analy-ses with high schools.
Less serious or Physical attack or fight without a weapon, theft or larceny, or vandalism. nonviolent crime
Minority enrollment The percentage of students enrolled in the school whose race or ethnicity is classified as one of the following: American Indian or Alaskan Native, Asian or Pacific Islander, black, or Hispanic, based on data in the 1993�94 Common Core of Data (CCD) file.
Middle school A school that has a low grade of 4 through 9 and a high grade of 4 through 9.
Northeast region Connecticut, Delaware, District of Columbia, Maine, Maryland, Massachusetts, New Hampshire, New Jersey, New York, Pennsylvania, Rhode Island, and Ver-mont.
Robbery The taking or attempting to take anything of value that is owned by another per-son or organization, under confrontational circumstances by force or threat of force or violence and/or by putting the victim in fear.
Appendix C. Glossary of Terms 167
Physical attack or fight An actual and intentional touching or striking of another person against his or her will, or the intentional causing of bodily harm to an individual. This category should be used only when the attack is serious enough to warrant calling the po-lice or other law enforcement representative.
Rural A place with a population less than 2,500 and defined as rural by the U.S. Bu-reau of the Census.
School enrollment Total number of students enrolled as defined by the 1993�94 CCD.
Serious violent crime Murder, suicide, rape or sexual battery, physical attack or fight with a weapon, or robbery.
Sexual battery An incident that includes rape, fondling, indecent liberties, child molestation, or sodomy.
Southeast region Alabama, Arkansas, Florida, Georgia, Kentucky, Louisiana, Mississippi, North Carolina, South Carolina, Tennessee, Virginia, and West Virginia.
Theft or larceny The unlawful taking of another person�s property without personal confrontation, threat, violence, or bodily harm.
Town A place not within an MSA, but with a population greater than or equal to 2,500 and defined as urban by the U.S. Bureau of the Census.
Urban fringe A place within an MSA of a central city, but not primarily its central city.
Vandalism The damage or destruction of school property.
West region Alaska, Arizona, California, Colorado, Hawaii, Idaho, Montana, Nevada, New Mexico, Oklahoma, Oregon, Texas, Utah, Washington, and Wyoming.
Schools and Staffing Survey
Central city A large central city (a central city of a Metropolitan Statistical Area [MSA] with population greater than or equal to 400,000, or a population density greater than or equal to 6,000 per square mile) or a mid-size central city (a central city of an MSA, but not designated as a large central city).
Elementary school An elementary school teacher is one who, when asked for the grades taught, teachers checked: 1) only �ungraded� and was designated as an elementary teacher on
the list of teachers provided by the school; 2) 6th grade or lower, or �ungraded,� and no grade higher than 6th; 3) 6th grade or lower and 7th grade or higher, and

168 Appendix C. Glossary of Terms
reported a primary assignment of prekindergarten, kindergarten, or general ele-mentary; 4) 7th and 8th grades only, and reported a primary assignment of pre-kindergarten, kindergarten, or general elementary; 5) 6th grade or lower and 7th grade or higher, and reported a primary assignment of special education and was designated as an elementary teacher on the list of teachers provided by the school; or 6) 7th and 8th grades only, and reported a primary assignment of special education and was designated as an elementary teacher on the list of teachers provided by the school. A teacher at school that has grade 6 or lower, or one that is �ungraded� with no grade higher than the 8th.
Rural or small town Rural area (a place with a population of less than 2,500 and defined as rural by the U.S. Bureau of the Census) or a small town (a place not within an MSA, with a population of less than 25,000, but greater than or equal to 2,500, and defined as nonurban by the U.S. Bureau of the Census).
Secondary school A secondary school teacher is one who, when asked for the grades taught, teachers checked: 1) �ungraded� and was designated as a secondary teacher on the list
of teachers provided by the school; 2) 6th grade or lower and 7th grade or higher, and reported a primary assignment other than prekindergarten, kinder-garten, or general elementary; 3) 9th grade or higher, or 9th grade or higher and �ungraded�; 4) 7th and 8th grades only, and reported a primary assignment other than prekindergarten, kindergarten, general elementary, or special education; 5) 7th and 8th grades only, and reported a primary assignment of special educa-tion and was designated as a secondary teacher on the list of teachers provided by the school; or 6) 6th grade or lower and 7th grade or higher, or 7th and 8th grades only, and was not categorized above as either elementary or secondary.
Urban fringe or Urban fringe of a large or mid-size city (a place within an MSA of a mid-size large town central city and defined as urban by the U.S. Bureau of the Census) or a large
town (a place not within an MSA, but with a population greater or equal to 25,000 and defined as urban by the U.S. Bureau of the Census).
S. Patrick Kachur et al., �School-Associated Violent Deaths in the United States, 1992 to 1994�
Homicide An act involving a killing of one person by another resulting from interpersonal violence.
School-associated A homicide or suicide in which the fatal injury occurred on the campus of a violent death functioning elementary or secondary school in the United States, while the victim
was on the way to or from regular sessions at such a school, or while the victim

Appendix C. Glossary of Terms 169
was attending or traveling to or from an official school-sponsored event. Victims included nonstudents as well as students and staff members.
Suicide An act of taking one's own life voluntarily and intentionally.