NATIONAL BUREAU OF ECONOMIC RESEARCH AND … · THE IMPACT OF COMPARATIVE EFFECTIVENESS RESEARCH ON...
27
NBER WORKING PAPER SERIES THE IMPACT OF COMPARATIVE EFFECTIVENESS RESEARCH ON HEALTH AND HEALTH CARE SPENDING Anirban Basu Tomas J. Philipson Working Paper 15633 http://www.nber.org/papers/w15633 NATIONAL BUREAU OF ECONOMIC RESEARCH 1050 Massachusetts Avenue Cambridge, MA 02138 January 2010 We are thankful for comments from the referees and the editor Tom McGuire and research assistance from Cindy Yuan . In addition, we appreciate the comments from seminar participants of the 2009 Annual Health Economics Meeting, the NBER 2010 Health Care Meetings, the 2010 ASHE Meetings, The 2010 AdvaMed Meetings, the University of Chicago, Rice University, University of Houston, and the Wharton School. Dr. Basu acknowledges support from a research grant from the National Institute of Mental Health, 1R01MH083706 – 01. Dr. Philipson acknowledges support from the Stigler Center for Study of the Economy and the State at the University of Chicago as well as the National Pharmaceutical Council. ¸˛¸˛The statements, findings, conclusions, views, and opinions contained and expressed in this article are based in part on data obtained under license from the following IMS Health Incorporated information service(s): National Disease and Therapeutic Index™ (2003-2008), IMS Health Incorporated. All Rights Reserved. The statements, findings, conclusions, views, and opinions contained and expressed herein are not necessarily those of IMS Health Incorporated, any of its affiliated or subsidiary entities, or the National Bureau of Economic Research. NBER working papers are circulated for discussion and comment purposes. They have not been peer- reviewed or been subject to the review by the NBER Board of Directors that accompanies official NBER publications. © 2010 by Anirban Basu and Tomas J. Philipson. All rights reserved. Short sections of text, not to exceed two paragraphs, may be quoted without explicit permission provided that full credit, including © notice, is given to the source.
Transcript of NATIONAL BUREAU OF ECONOMIC RESEARCH AND … · THE IMPACT OF COMPARATIVE EFFECTIVENESS RESEARCH ON...
NBER WORKING PAPER SERIES
THE IMPACT OF COMPARATIVE EFFECTIVENESS RESEARCH ON HEALTHAND HEALTH CARE SPENDING
Anirban BasuTomas J. Philipson
Working Paper 15633http://www.nber.org/papers/w15633
NATIONAL BUREAU OF ECONOMIC RESEARCH1050 Massachusetts Avenue
Cambridge, MA 02138January 2010
We are thankful for comments from the referees and the editor Tom McGuire and research assistancefrom Cindy Yuan . In addition, we appreciate the comments from seminar participants of the 2009Annual Health Economics Meeting, the NBER 2010 Health Care Meetings, the 2010 ASHE Meetings,The 2010 AdvaMed Meetings, the University of Chicago, Rice University, University of Houston,and the Wharton School. Dr. Basu acknowledges support from a research grant from the NationalInstitute of Mental Health, 1R01MH083706 – 01. Dr. Philipson acknowledges support from the StiglerCenter for Study of the Economy and the State at the University of Chicago as well as the NationalPharmaceutical Council. ¸˛¸˛The statements, findings, conclusions, views, and opinions containedand expressed in this article are based in part on data obtained under license from the following IMSHealth Incorporated information service(s): National Disease and Therapeutic Index™ (2003-2008),IMS Health Incorporated. All Rights Reserved. The statements, findings, conclusions, views, andopinions contained and expressed herein are not necessarily those of IMS Health Incorporated, anyof its affiliated or subsidiary entities, or the National Bureau of Economic Research.
NBER working papers are circulated for discussion and comment purposes. They have not been peer-reviewed or been subject to the review by the NBER Board of Directors that accompanies officialNBER publications.
© 2010 by Anirban Basu and Tomas J. Philipson. All rights reserved. Short sections of text, not toexceed two paragraphs, may be quoted without explicit permission provided that full credit, including© notice, is given to the source.
The Impact of Comparative Effectiveness Research on Health and Health Care SpendingAnirban Basu and Tomas J. PhilipsonNBER Working Paper No. 15633January 2010, Revised November 2010JEL No. I0,I1,I11,I18
ABSTRACT
Public technology assessments in general and Comparative Effectiveness Research (CER) in particularhave been justified by offsetting benefits of improving patient health and reducing health care spending.However, little conceptual and empirical understanding exists concerning the quantitative impactof public technology assessments such as CER. This is needed to assess whether CER has benefitsthat outweighs its investment costs. This paper provides a systematic framework to analyze the impactof CER on health outcomes and medical care spending. We interpret CER to infuse evidence on productquality into the market place declaring product winners and losers. This shifts demand by patientsand doctors as well as coverage by third party payers towards the winners of CER studies and awayfrom losers. We trace out the spending and health implications of such responses to evidence on productquality in privately and publicly financed health care markets. We simulate these effects for antipsychoticsthat are among the largest drug classes of the US Medicaid program and for which CER has been conductedby means of the CATIE trial in 1999. Our main conclusion, from both the conceptual and empiricalanalysis, is that investments into CER may not always have the intended benefits of lowering spendingand improving health outcomes. Because CER may result in higher spending and worse health, itis important to have methods to evaluate quantitatively the impacts of CER investments.
Anirban BasuSection of of Hospital MedicineDepartment of MedicineUniversity of Chicago5841 S. Maryland AvenueMC-2007, AMD B226CChicago, IL 60637and [email protected]
Tomas J. PhilipsonIrving B. Harris Graduate Schoolof Public Policy StudiesThe University of Chicago1155 E 60th StreetChicago, IL 60637and [email protected]
3
Section 1: Introduction
The debate about the appropriate role of public technology assessments has a long history in
the US.1 More recently, as both private and public payers attempt to improve the efficiency of health
care spending, comparative effectiveness research (CER) has been offered as a potential solution. The
rationale for CER is that better evidence about what works and does not work in health care can
improve the productivity of health care spending through improved patient outcomes at lower spending
levels. (FCCCER Report 2009; IOM 2009) Moreover, recent public subsidization of CER through the 2009
American Recovery and Reinvestment Act (ARRA) has raised awareness and funding for CER.
However, although CER has been positioned as a means to improve health and potentially lower costs,
little is understood about how exactly this will take place and how the infusion of evidence into health
care markets through CER studies will translate into different health care decisions. Despite the
emphasis placed on publicly subsidized evidence being infused into the market place, and CER in
particular, there has been little explicit and quantitative analysis of the potential impact it may have on
health or medical care spending. Indeed, little is understood about the conditions necessary for CER to
have its intended effects. Given this lack of understanding of the impact of CER, the purpose of this
paper is to attempt to provide a framework to quantitatively evaluate, in a consistent and systematic
way, the effects of CER.
The paper may be outlined as follows. Section 2 specifies the economic context in which we analyze the
impact of public technology assessments such as CER. We interpret the infusion of evidence generated
by public subsidies for CER as an increase in the demand for some treatments at the expense of others.
This section also considers the health‐ and cost implications of such CER‐induced demand shifts in a
private market as sales of winners of CER studies rise and the corresponding sales of losers fall. Indeed,
changes in sales due to changes in quality evidence are frequent in medical product markets. For
example, following the reports of the potential side effects of Avandia in 2007, it was reported that new
prescriptions fell by about 40 percent2.
Section 3 analyzes these impacts in a subsidized market where the treatments that fare better under
CER are the ones that receive better coverage, e.g. through less formulary restrictions, changes in prior
authorization requirements, or lower co‐pays. Thus, we perceive two responses by the market to the
infusion of CER findings: the first is by patients and doctors and the second, potentially lagged, is by
third‐party payers, whether public or private.
Section 4 discusses the impacts of CER‐responsive coverage decisions when there is heterogeneity in
treatment effects. An important issue here is that CER may favor one treatment, deemed “the best” by
1 They date back at least to the 1970s with the National Center for Health Services Research and the US Congress Office of Technology Assessment. See Malani and Philipson (2010) for a more detailed discussion. 2 Wall Street Journal Online (http://online.wsj.com/article/SB118545484246978888.html).
4
some summary statistic, even though the best treatment varies across patients. This implies that when
coverage responds to the new CER evidence, some patients face higher prices for their best therapy
while other see price reductions. This leads to an indeterminate effect on health outcomes.
Section 5 provides an illustrative empirical simulation of the discussed effects. We consider Medicaid
coverage changes due to recent CER evidence in the case of antipsychotic drugs. This drug class is
among the top spending classes overall and particularly in Medicaid. After the results of a CER study in
2006, the CATIE trial, there has been considerable debate about changing coverage due to the evidence
generated. Using the observed heterogeneity in treatment effects from the CATIE trial, we quantify the
discussed indeterminate impact on health if Medicaid were to respond in coverage to the CER by only
covering the antipsychotic deemed most cost‐effective in the CER. In such a case, we find that negative
impact on health outcomes surpasses the reduction in spending by an amount valued at 5% of class
spending.
Our main conclusion therefore, from both the conceptual and empirical analysis, is that investments into
CER, as it is currently practiced, may not have the intended benefits of lowering spending and improving
health outcomes. This occurs under fairly natural economic predictions of how markets respond to the
infusion of new quality information. We conclude in section 6 by discussing future research in the area
of quantitative evaluation of CER and how such analysis may inform the development of improved
methods for CER.
Section 2: Impact of Effectiveness‐ and Comparative Effectiveness Studies in a Private Market
This section specifies the framework in which health and spending implications are analyzed. We first
discuss the impact of effectiveness evidence on spending and health for a single product3 and then
expand the analysis to consider CER for multiple products.
2.1: Effectiveness Evidence, Spending and Health Outcomes
Consider first when there is a single product priced at p with true the true quality or
effectiveness q, representing its treatment effect relative to the alternative, normalized to have zero
quality4. We represent the effectiveness evidence by a scalar e for which higher values are more
favorable evidence, e.g. this scalar could represent the sample mean of health outcomes in a
3 Pauly and Blavin (2008) discusses related normative aspects of treatment coverage under insurance. 4 Throughout, we discuss health effects concerning this measured health outcomes. However, overall health effects may differ if substitution occurs across health behavior or products with changes in demand of the discussed treatment.
5
randomized trial against the status quo treatment. We let D(p, e) denote the demand function for the
product given the evidence about product quality. We assume that better demonstrated effectiveness
raises demand, De > 0, but does not affect supply.
To illustrate such a demand function, consider when individuals have expected utility
represented by the expected mean of the treatment effectiveness net of price. Now consider the
canonical case under normal priors over a normally distributed mean when evidence is a sample average
of the outcome. This well‐known case implies a posterior mean, z, which is a weighted average of the
prior mean, z0, and the evidence e as in
0(1 )* *z w z w e (1)
where the weight, w, depends the relative precisions of priors and data5. This implies that the product is
purchased whenever the posterior mean for effectiveness is larger than the price
z ≥ p (2)
The more favorable the evidence is (larger w or e), and the better opinion about the treatment before
the evidence (larger z0), the more likely the purchase. Given a heterogeneous population that differs in
their unobservable priors and weights according to the distribution H(z0,w), the quantity demanded,
D(p, e), is the share of the population under H that demands the products under a given observable
price and evidence level.
Demand, together with supply, generates an equilibrium price, denoted P, and the corresponding
equilibrium quantity, Y = D(p, e). These in turn generate aggregate equilibrium spending and health
outcomes according to
S = Y*P (3)
Q = Y*q (4)
Now consider an effectiveness study that generates the evidence e’ thereby replacing the evidence prior
to the study e. Generally, we will denote primed quantities as post‐CER levels and unprimed as pre‐CER
levels. If the evidence is more favorable than prior to the study, e’≥ e, then the posterior is z’=(1‐w)*z +
w*e’ and demand rises. We will throughout be concerned with only the normal case when an increase in
demand raises the equilibrium price and quantity, Y’ ≥ Y and P’ ≥ P, an implication consistent with many
standard models of different market structures on the supply side6. A special case of this would be
5 Specifically, under normal prior normal data likelihood conjugacy, w = (2)/(2 + s2/n), where 2 is the prior uncertainty about the mean effect, s2 is the standard deviation of effect in the data (evidence) and n is the sample size for the data. 6 Under a monopoly the price is determined by P = argmax D(p, e)*p ‐ C(D(p, e)) where C is the cost function and under competitive conditions is determined by D(P, e) = S(P) where S(P) is the supply function. In these extreme cases and other intermediate cases, we will assume an outward shift in demand always raises price weakly. For
6
constant returns and competitive supply when there would be no equilibrium price effects: P’ = P. Now
consider when the evidence is valid in the sense that evidence in favor of the status quo is consistent
with true quality being higher: e’ ≥ e if and only if q ≥ e. This directly implies that both spending and
health increases with the new evidence if it is more favorable than before the study: e’≥ e if and only if
S’ ≥ S & Q’ ≥ Q. To summarize, if evidence is interpreted as an observable signal of the unobservable
true quality of a product, changes in evidence have many of the same implications for price and
spending as standard shifts in demand induced by quality changes.
2.2 Comparative Effectiveness, Spending, and Health Outcomes
Now consider two treatments with true qualities or effectiveness levels, q = (q1, q2). For example, these
two treatments may be first and second generation treatments for a given clinical condition. The
evidence generated by CER is now represented by the two scalars, e = (e1, e2). The demand for the two
treatments as a function of prices and evidence on both products are D1(p, e) and D2(p, e). Given the
implicit focus of CER on substitutable treatments, we assume that the products are substitutes in both
prices and evidence. In other words, demand for a given treatment falls on its own price and the
evidence of the other treatment, but rises with the price of the other treatments and its own evidence.
As an example, consider the analogous case to the example of net expected benefits under
normality as discussed for the single product case. If two mutually exclusive treatments are considered,
then the first is demanded whenever its expected net benefit is larger than that for the second
(1 ‐ w1)*z1 + w1*e1 ‐ p1 ≥ (1 ‐ w2)*z2 + w2*e2 ‐ p2 (5)
The relative strength of the evidence, compared to the relative prices, determines the demand for the
two products. Similar to before, given a distribution of the vector of unobservable priors and weights (z,
w), the demands, D1(p, e) and D2(p, e), of the two treatments are functions of the observable prices and
evidence.
The infusion of CER evidence into the market may affect equilibrium quantities and prices denoted Y =
(Y1, Y2) and P = (P1,P2), which in turn determine aggregate equilibrium spending and health according to
S = S1 + S2 (6)
Q = Q1 + Q2. (7)
Without loss of generality, we assume that the first (second) treatment is the winner (loser) of the CER
in the sense that quality evidence is improved (worsened) by the CER
example, under monopoly pricing we assume that an increase in scope of demand (DOES THIS MEAN MARKET GROWTH? OR SHIFT IN DEMAND?) does not lower the elasticity of demand.
7
1 1'e e & 2 2'e e (8)
Holding prices constant, the CER causes the demand for the first (second) product to rise (fall);
D1(p, e’) ≥ D1(p, e) & D2(p, e’) ≤ D2(p, e) (9)
This occurs because the two treatments are substitutes in evidence in the sense discussed above.
Now consider the standard case7 when the rise (fall) in demand of the first product implies a weakly
higher (lower) price and quantity as in
1 1P P & 2 2P P and 1 1Y Y & 2 2Y Y (10)
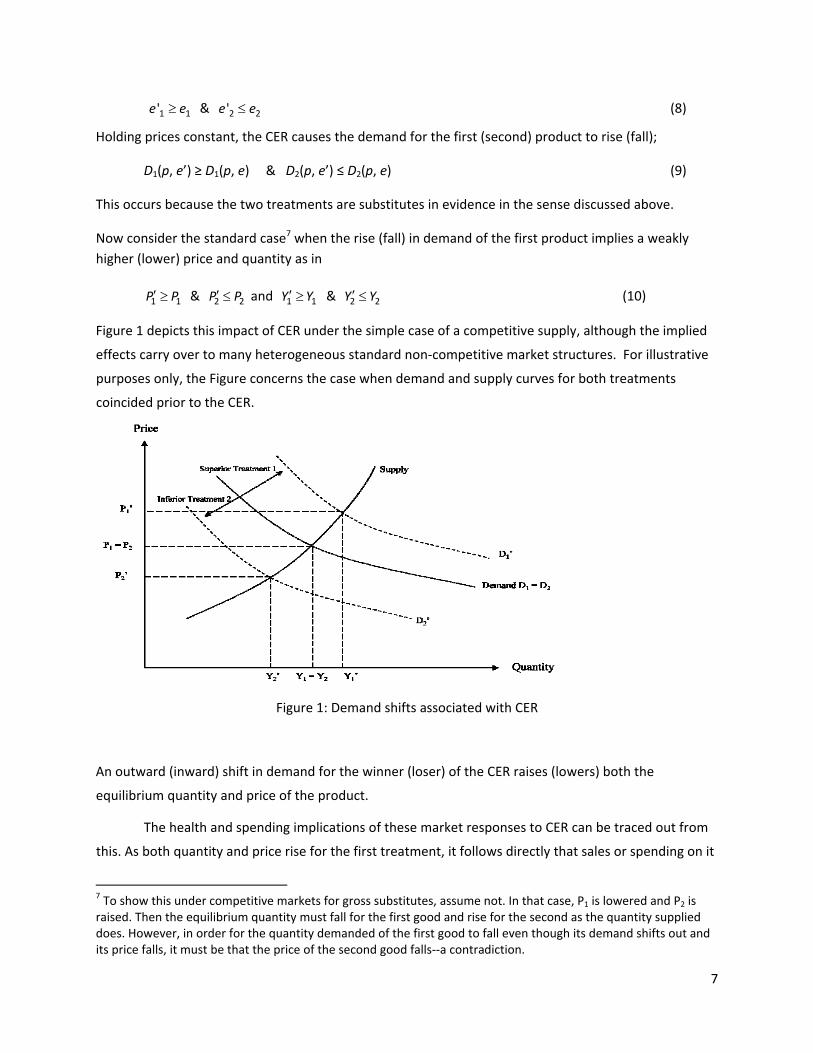
Figure 1 depicts this impact of CER under the simple case of a competitive supply, although the implied
effects carry over to many heterogeneous standard non‐competitive market structures. For illustrative
purposes only, the Figure concerns the case when demand and supply curves for both treatments
coincided prior to the CER.
Figure 1: Demand shifts associated with CER
An outward (inward) shift in demand for the winner (loser) of the CER raises (lowers) both the
equilibrium quantity and price of the product.
The health and spending implications of these market responses to CER can be traced out from
this. As both quantity and price rise for the first treatment, it follows directly that sales or spending on it
7 To show this under competitive markets for gross substitutes, assume not. In that case, P1 is lowered and P2 is raised. Then the equilibrium quantity must fall for the first good and rise for the second as the quantity supplied does. However, in order for the quantity demanded of the first good to fall even though its demand shifts out and its price falls, it must be that the price of the second good falls‐‐a contradiction.
8
rises; S1’ ≥ S1. By an analog argument, the spending on the second treatment will fall; S2’ ≤ S2. The impact
on overall spending S’‐ S is thus indeterminate as overall spending may rise or fall, depending on
whether the increase in sales of the winner dominates the fall in sales of the loser. However, the
aggregate health effect is clearly positive, Q’ ≥ Q, as long as the evidence of the CER is valid in the sense
that the winner of the CER is indeed of higher quality: 1 1'e e and 2 2'e e if and only if 1 2q q . This is
because quantity is increased for the winner of the CER at the expense of the loser8. Thus, if the
intended overall effects of CER are lower spending and higher health, the effect on spending is
inconsistent with that intention while the second effect on health is consistent.
Section 3: Impact of CER in a Subsidized Market
In most countries, health care markets are subsidized, thereby separating supply‐prices received by
sellers and demand‐prices paid by patients. For example, the US government, through the Medicare and
Medicaid programs, pays manufacturers and providers at prices above the co‐pays of enrollees. In a
subsidized market, CER will impact health and spending not only through the basic demand shifts
discussed earlier but also through any changes in subsidy levels due to the CER. For example, Medicare
or Medicaid may favor winners of CER studies through lower co‐pays, reduced prior authorization, or
higher reimbursement rates to manufacturers9.
For a given subsidy level s, let the equilibrium quantity, supply and demand prices for a treatment be
denoted by Y(s), PS(s) , PD(s) where PS(s)= PD(s) + s and Y(s)=D(PD(s),e) = S(PS(s)). It is well known that
increasing the subsidy raises the supply price, lowers the demand price, and raises the equilibrium
quantity: dPS/ds ≥ 0, dPD/ds ≤ 0 , dY/ds ≥ 0.
Consider now s = (s1, s2) as the subsidy levels for the two treatments and when CER leads governments
to subsidize the winner more at the expense of the loser
1 1s s & 2 2s s (11)
Now consider the price and quantity effects of when a CER study not only raises demand as before, but
also changes subsidy levels to favor winners over losers. Thus, for the winner of the CER, not only does
the demand shifts outward as before, but the subsidy also rises. This is a principal rationale for value‐
based insurance designs: reduce financial barriers (such as co‐pays) for the patients so that they are
induced to use treatments that provide value (Fendrick et al., 2001). Likewise, for the loser of the
CER, not only does the demand shift inward as before, but the subsidy also falls.
8 If there are more than two mutually exclusive treatments, then market expansion effects would require stronger substitution assumptions. 9 The current CER efforts in ARRA (2009) does not regulate payer responses to CER evidence.
9
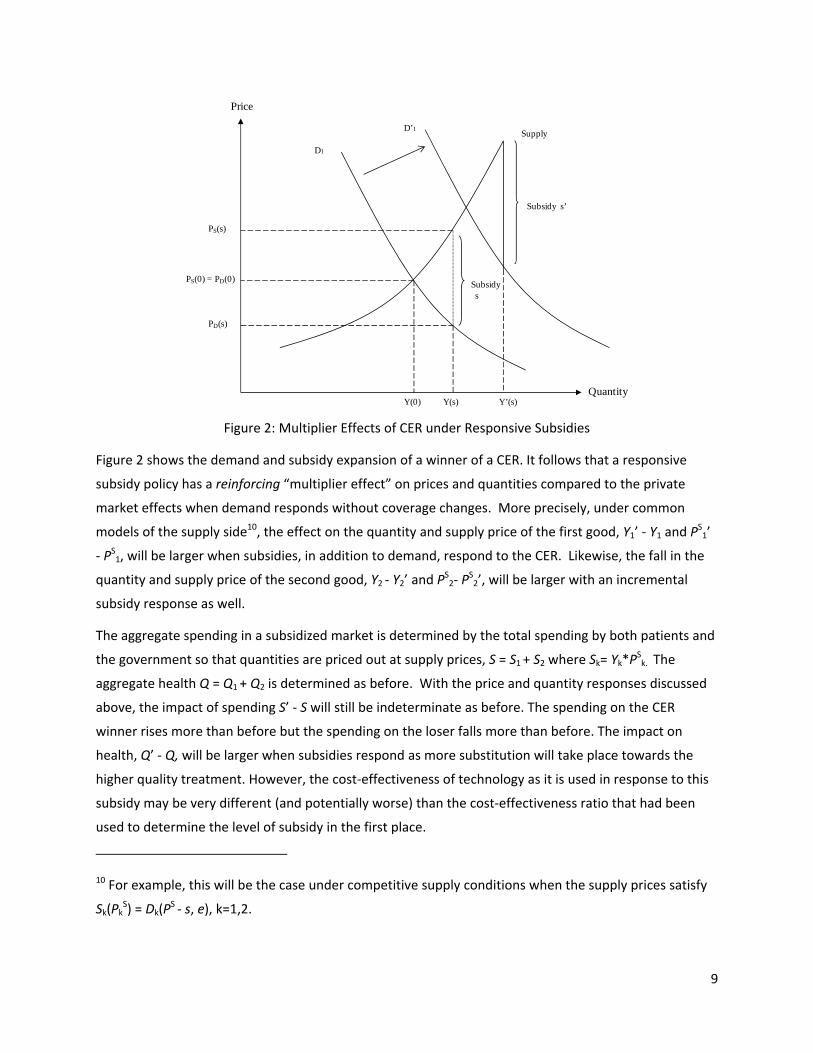
Figure 2: Multiplier Effects of CER under Responsive Subsidies
Figure 2 shows the demand and subsidy expansion of a winner of a CER. It follows that a responsive
subsidy policy has a reinforcing “multiplier effect” on prices and quantities compared to the private
market effects when demand responds without coverage changes. More precisely, under common
models of the supply side10, the effect on the quantity and supply price of the first good, Y1’ ‐ Y1 and PS1’
‐ PS1, will be larger when subsidies, in addition to demand, respond to the CER. Likewise, the fall in the
quantity and supply price of the second good, Y2 ‐ Y2’ and PS2‐ P
S2’, will be larger with an incremental
subsidy response as well.
The aggregate spending in a subsidized market is determined by the total spending by both patients and
the government so that quantities are priced out at supply prices, S = S1 + S2 where Sk= Yk*PSk. The
aggregate health Q = Q1 + Q2 is determined as before. With the price and quantity responses discussed
above, the impact of spending S’ ‐ S will still be indeterminate as before. The spending on the CER
winner rises more than before but the spending on the loser falls more than before. The impact on
health, Q’ ‐ Q, will be larger when subsidies respond as more substitution will take place towards the
higher quality treatment. However, the cost‐effectiveness of technology as it is used in response to this
subsidy may be very different (and potentially worse) than the cost‐effectiveness ratio that had been
used to determine the level of subsidy in the first place.
10 For example, this will be the case under competitive supply conditions when the supply prices satisfy
Sk(PkS) = Dk(P
S ‐ s, e), k=1,2.
Price
Quantity
PS(s)
PS(0) = PD(0)
PD(s)
Y(0) Y(s)
Supply
Subsidys
Subsidy s’
Y’(s)
D1
D’1
10
This positive analysis of the effects of subsidy responses on spending and health do not consider the
equally important normative issues of optimal subsidy design. For example, if there is some inefficient
matching in the first place a valid CER may well improve welfare under optimal subsidies but the payer
responses compounding the private responses may indeed go too far. More generally, our positive
analysisof spending and health do not conflict with the normative principals of value‐based insurance
designs (Chernew et al., 2007; Goldman and Philipson, 2007, Pauly and Blavin, 2008).
Section 4: Impact of CER under Heterogeneous Treatment Effects
This section extends the previous analysis of health‐ and spending impacts of CER by considering
heterogeneity in treatment effects or quality across patients. As opposed to the previous sections, a
responsive subsidy policy may adversely affect health outcomes under heterogeneous treatment
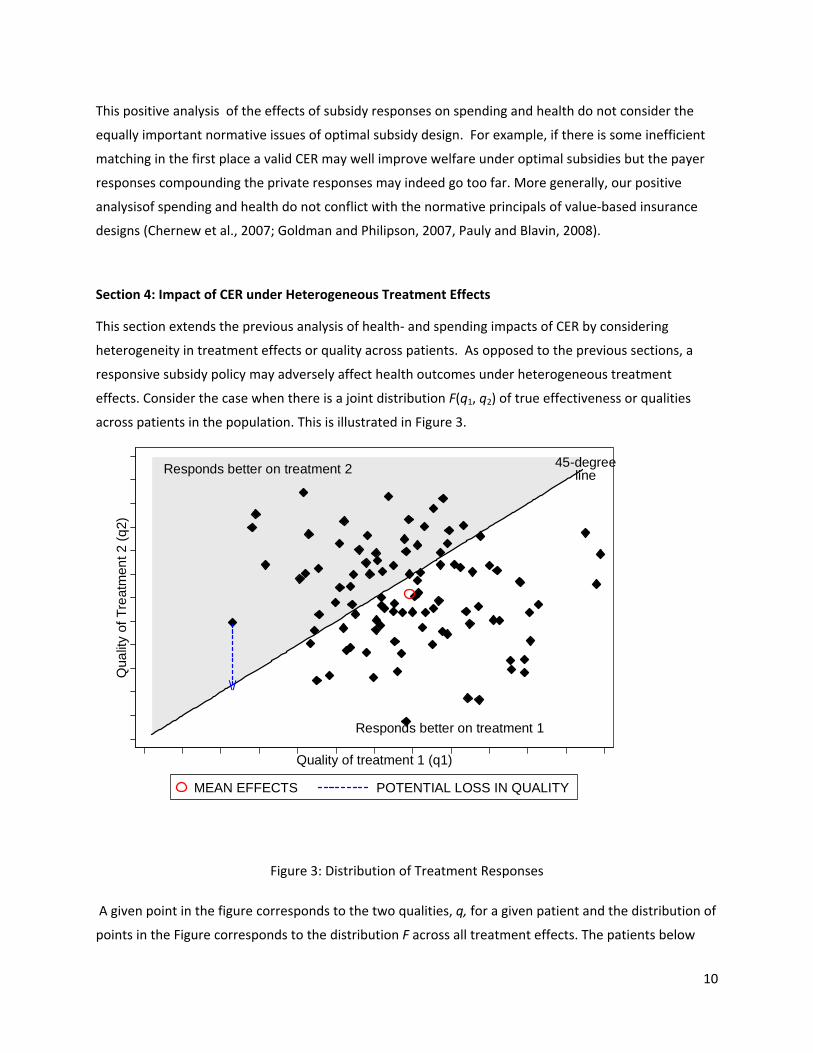
effects. Consider the case when there is a joint distribution F(q1, q2) of true effectiveness or qualities
across patients in the population. This is illustrated in Figure 3.
Figure 3: Distribution of Treatment Responses
A given point in the figure corresponds to the two qualities, q, for a given patient and the distribution of
points in the Figure corresponds to the distribution F across all treatment effects. The patients below
Responds better on treatment 2
Responds better on treatment 1
45-degreeline
\/
Qua
lity
of T
reat
men
t 2 (
q2)
Quality of treatment 1 (q1)
MEAN EFFECTS POTENTIAL LOSS IN QUALITY
11
(above) the 45‐degree line are those benefitting more from the first (second) treatment, thereby making
up the two groups above. As revealed in the Figure, the first treatment is the winner, say due to that it
had a larger mean treatment effect than the second treatment. Consider when a responsive subsidy
policy favors the first treatment. Specifically consider if it had a higher mean or median treatment effect
than the second treatment in the CER study and that this resulted in substitution towards the first
treatment by all groups. This may imply that health is adversely affected for those in the group above
the 45 degree line. However, the overall population impact will depend on the degree of self‐selection
that existed before the subsidy. That is, how many of the patients, both above and below the 45 degree
line, actually chose the second treatment before the subsidy. This notion is formalized below.
Conditional on a given set of true effects q = (q1, q2), demand is a function of price and evidence as
before and represented by D1(p, e|q) and D2(p, e|q). Aggregate health outcomes of the population is
determined by the conditional demand functions aggregated up over all true quality levels. For example,
the aggregate health outcome for patients taking the second treatment is given by:
Q2=W∫∫ D2(p,e|q)q2 dF(q| q1 ≥q2) + (1‐W)∫∫ D2 (p,e|q)q2 dF(q| q1 < q2) (12)
where W is the fraction of patients for whom the first treatment is of higher effectiveness. The
aggregate health outcome in the population is given by Q = Q1 + Q2. The impact of CER on aggregate
health outcome depends on how the CER leads patients on the two treatments to move towards their
most‐ or least effective treatment. In the expression above for the health associated with the second
treatment, the first term represents patients who would benefit from moving to the first treatment and
the second term patients who would not.
Now consider a subsidy response for a public subsidy program for a poor population such as e.g.
Medicaid in the US. In particular, consider when the CER that raises the demand price for the loser of
the CER, the second treatment, beyond the reach of the patient population. Consequently, aggregate
demands for the two treatment D'1 = D1 + D2 and D'2 = 0 respectively due to that all patients of the loser
of the CER switch to the winner. Thus, the effect of CER on total aggregate health is driven by patients
who change their treatment choice from the second to the first treatment in response to the subsidy
change induced by the CER. For those who were on the loser of CER prior to the subsidy response, the
impact on health will be negative for those whom the loser of the CER was most effective, q2 ≥q1, but
positive for the those for whom the winner of the CER was q1 ≥q2. More generally, a responsive subsidy
lowers the price of most effective care for people who should be treated by the winner of the CER.
However, it also raises the price of most effective care for people who should be on the loser of the CER.
The relative magnitude of these two effects determines the overall health effects.
The basic issue is that two aspects drive overall health outcomes when coverage is responsive to the
aggregate CER evidence. The first is heterogeneous treatment effects and that price responses lead
12
patients to switch away from their best treatment compared to those who switch towards their best
treatment. The issue is that the evidence from CER is used to form product‐specific coverage policies.
This is a problem when treatment effects are patient‐specific. Heterogeneity is necessary but not
sufficient for this to occur; what is needed is that the joint distribution of treatment effects, F, has a
support that spans both sides of the 45‐degree line as illustrated in the Figure 3 so that that both groups
are occupied; Pr(q1 ≥ q2)*Pr(q1 < q2) > 0.
Section 5: Empirical Analysis of Responsive Subsidies for Antipsychotics
In this section, we conduct an illustrative empirical analysis of the potential impact of CER responsive
subsidies using the case of antipsychotic drugs. These drugs represent one of the largest drug classes in
Medicaid, one of the major US public subsidy programs (Bruen and Ghosh, 2004).
We find that if Medicaid coverage policy had responded to the CER results of CATIE by providing partial
coverage that only reimburses for first generation drugs and risperidone (one of the second generation
drugs), then compared to the pre‐CER policy of covering all drugs, it would save about 40% of $2B class
spending over one and half years. However, taking into account the observed heterogeneity in
treatment effects, limiting access to all but one second generation drug would incur a net loss valued at
about 25% of class spending. Thus, for one the largest drug classes in one of the major health care
subsidy programs, heterogeneity alters not only the magnitude but also the sign of the effect on
outcomes due to reimbursement responses to CER studies.
5.1 Interpreting the CATIE Trial CER in our Framework
Antipsychotic drugs represent the primary treatment for patients with schizophrenia. Beginning
in 1990, a second generation of antipsychotic drugs, also known as atypical antipsychotics (AA), was
introduced. These drugs are believed to cause less movement disorders as side effects compared to the
first generation antipsychotics (also known as “typicals” or neuroleptics) (Kane, 2004; Meltzer 2009).
More recently, some of the second generation antipsychotics have been linked to increased metabolic
side‐effects such as weight gain and diabetes (Meltzer, 2005).
Following a series of many small comparative effectiveness studies conducted on this issue (Polsky et al.,
2006; Leucht et al., 2009), a large pragmatic comparative effectiveness trial, called CATIE, was
conducted for antipsychotics in the US (Lieberman et al, 2005). The CATIE results found equivalence in
the effectiveness for a first generation antipsychotic drug (typical or FGA) and all second generation
antipsychotics (atypicals or SGAs) drugs (Lieberman et al, 2005; Rosenheck et al, 2006). Based on these
results, many argued that Medicaid should preferentially subsidize FGAs over SGAs (Banthin and Miller,
13
2006; Rosenheck et al., 2007; NY Times, 2005; Soumerai and Law, 2007). Subsequent to the release of
CATIE, approximately 40% of the state‐run Medicaid programs have instituted prior authorization
restrictions on some SGAs (Polinski et al, 2007). Little is known about the quantitative health and
spending effects of such coverage proposals and policies. To better understand such effects, we
simulate the impact on health and spending for the counter‐factual case of providing only partial
coverage or no coverage for SGAs11.
In our framework, we interpret the CATIE trial as a typical CER and then consider the health and
spending implications of subsidies, within Medicaid, responding to the evidence generated by this CER
study. More precisely, we let the FGAs be treatment 1 and the SGAs represent treatment 2 according to
our earlier notations. In other words, our analysis is set up such that the FGAs are the winner of the CER
and the SGAs are the losers of the CER. We will assume, given the poverty of the patient population,
that without subsidies there would be no demand for these therapies: D1(c, e) = D2(c, e) = 0. Thus, in this
particular case, the private demand and price‐effects are nullified as all utilization is determined by
subsidy policy. Therefore, any viable Medicaid market would need to have supply prices PS (provider
reimbursement) at or above costs, denoted Z, but demand prices PD (patient co‐pays) at or below costs.
i.e, PS Z ≥PD = PS ‐ s, where s is the subsidy.
Given such subsidy levels for both treatments before the CER, consider if a Medicaid program were to
respond to the evidence of the CER by only covering the FGAs (winner) but not the SGAs (loser) of the
CER represented by CATIE. This would entail that the condition above was satisfied for the winner but
not the loser after the CER, thereby raising demand prices for the SGAs relative to the FGAs and
eliminating the market for the SGAs but expanding the market for the FGAs
D1’ = D1 + D2 & D2’ = 0, implying 0 = Y2’ < Y2 & Y1’ > Y1. (16)
Such an effect due to responsive subsidies from a traditional CER may lead to adverse health effects on
the aggregate due to heterogeneity in treatment effects in this population. Specifically, under pre‐CER
subsidies, patients and their physicians are at liberty to switch drugs with ease so that they can identify
and settle on the drug that gives the most benefit. However, due to third‐party reimbursement under
risk‐sharing the relative costs and benefits facing patients and physicians or providers may not
correspond to the true ones. Patients for whom q1 > q2 are more likely to identify and continue taking
FGAs and vice versa for those patients where q1>q2. With CER responsive subsidy however, a shift in the
distribution of uses happen: patients who were receiving SGAs (q2 > q1) will be forced to take FGAs,
thereby diminishing their health. Thus the overall effect on aggregate health, Q, would be driven by the the impact on those who were consuming SGAs before the subsidy policy but forced to take a FGA
under the altered subsidy policy. Note that under the pre‐CER policy, patients can have repeated trials
11 This no‐coverage reimbursement response is inconsistent with current law and therefore the partial coverage scenario is our primary counterfactual policy. However, we include the no‐coverage scenario to understand the desirability of future policies and laws that may potentially alter those currently in place.
14
of all medication options. Thus, patients who truly preferred the FGAs to SGAs, q1 > q2, would eventually
have been induced to take FGAs under pre‐CER policy and therefore a CER‐responsive exclusive subsidy
for the FGAs cannot induce increases in health for this cohort. Thus Q is most likely negative.
In the analysis below we calculate the average health outcome effects for the entire Medicaid
population under alternative access policies. The differences between these scenarios will be based on
the sub‐group of Medicaid patients for whom an atypical was the best therapy.
5.2 Policy scenarios
The first policy is the Pre‐CATIE scenario that assumes status quo coverage and allows full
reimbursement for both generations of antipsychotic drugs. Since the second‐generation drugs are
more costly, this resembles a greater subsidy on the second generation drugs compared to first
generation drugs (i.e. s2 ≥ s1). Under this policy, the demand for these drugs are partly determined by
the demand prices faced by the patients, which are close to zero (PD(s) = 0), so that overall spending
closely coincides with the supply prices, PS, and is mostly incurred by Medicaid.12 Demand is also
affected by heterogeneity in treatment effects: with unrestricted coverage physicians are able to try out
alternative drugs and settle on a drug that appears to produce better quality for an individual patient.
To simulate the effects of CER‐responsive subsidy policies, we compare the pre‐CATIE scenario with two
hypothetical (counter‐factual) post‐ CER scenarios ‐ the Partial Coverage policy and the No Coverage
policy.
Under the Partial Coverage scenario, only risperidone (an SGA) is covered along with FGA, thereby
allowing equilibrium quantity demanded for SGAs, Y2’, to be positive. All other second generation drugs
are not included in the formulary, and therefore are not covered. We consider risperidone to be the only
atypical reimbursed under the Partial Coverage policy as it is the only generic SGA available in the
market and consistently finds itself on the top tier of preferred drug lists across most Medicaid
programs.
Under the No Coverage policy the responsive subsidy policy entails that none of the second generation
drugs are covered: s2’ = 0. Given the low income of the Medicaid population, this is assumed to
eliminate demand in this population so that the post‐CER quantity satisfies Y2’ = 0. This case is included
not because of its likelihood of being adopted but to trace out the implications of the common policy
12 Total Medicaid expenditures on antipsychotic medication increased from $484 million in 1995 to $1.3 billion in 1998 (Lewin Group, 2000). In 2004, the annual health care costs for patients with schizophrenia is estimated to be about US $28 billion, of which nearly one‐third can be attributed to pharmacy costs (Gilmer et al., 2004). More recent estimates suggest that expenditures on antipsychotic medications across all payers have crossed $10 billion this year and account for a third to a half of all mental health expenditures (NIMH, 2006).
15
prescription that only the most cost‐effective care reimbursed. When care that is not cost‐effective is
not reimbursed, poor individuals cannot access it and this has important health effects under
heterogeneity.
5.3. Methods
We evaluate each policy described above over an 18‐month period, corresponding to the length of the
CATIE trial. We focus on three second‐generation antipsychotic drugs (risperidone, olanzapine,
quetiapine), as well as one first generation drug, perphenazine. These comprise nearly 70% of the
market of antipsychotic prescriptions written in the United States. Wu et al. (2006) estimated
prevalence of diagnosed schizophrenia among non‐elderly Medicaid patients to be 1.66%. We apply this
estimate to the 15 million non‐elderly adult Medicaid enrollees (www.statehealthfacts.org) to obtain a
total number of 250,000 non‐elderly adult enrollees with schizophrenia who are affected by alternative
policies.
Total costs under each policy is calculated based on monthly costs estimates from CATIE data and those
reported by Rosenheck et al (2006).
We first calculate the baseline QALY level where the pre‐treatment (baseline) quality of life weight for
this population (= 0.68) persists throughout the 18‐month period (i.e. 0.68*1.5 = 1.02 QALY per patient).
This is the same under each of the counterfactual policy scenarios. Next we model the deviations in
quality of life over the same time window under alternative policies and add the additional QALYs
gained or lost to the baseline level. These additional gains or losses in QALYs are calculated using an
area‐under‐the‐curve approach based on the time trajectory of quality of life weights. Specifically, we
approximate this area with a triangle whose slope is determined by the rate of change in QOL weight
over time under each scenario. We now describe the calculations for costs and benefits under each
policy in more details.
5.3.a. Pre‐CATIE scenario
Under this policy, irrespective of the drug that a patient initiates on, the physician can switch patients as
needed to an alternative drug that may be more efficacious for that patient. We capture the overall
effect of these switches using the intention‐to‐treat rate of change in QOL over time for specific drug
initiations from CATIE data (shown in Figure 4 and summarized in Table A1).13
13 These intention‐to‐treat effects represent the average quality levels for a given initial drug assignments after incorporating the effect of trial‐and‐error selection into the best treatment. We apply mixed effects linear models to individual‐level longitudinal quality of life data from CATIE and estimate the intention‐to‐treat effects of the
16
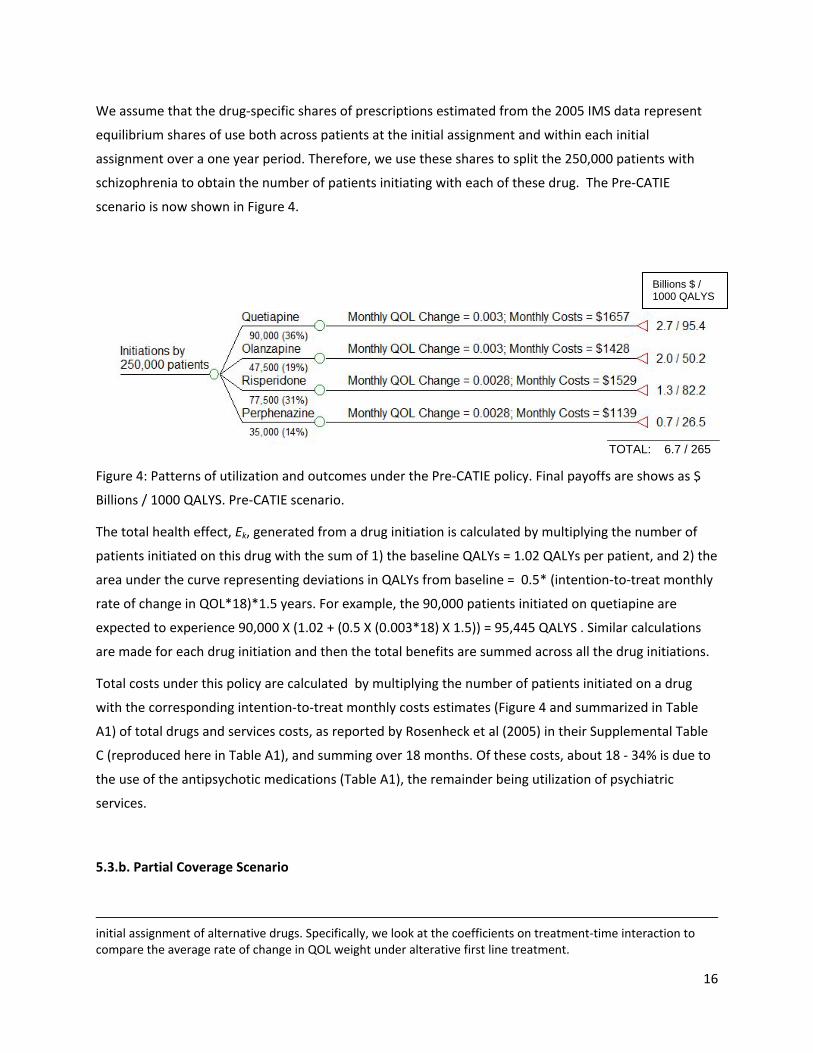
We assume that the drug‐specific shares of prescriptions estimated from the 2005 IMS data represent
equilibrium shares of use both across patients at the initial assignment and within each initial
assignment over a one year period. Therefore, we use these shares to split the 250,000 patients with
schizophrenia to obtain the number of patients initiating with each of these drug. The Pre‐CATIE
scenario is now shown in Figure 4.
Figure 4: Patterns of utilization and outcomes under the Pre‐CATIE policy. Final payoffs are shows as $
Billions / 1000 QALYS. Pre‐CATIE scenario.
The total health effect, Ek, generated from a drug initiation is calculated by multiplying the number of
patients initiated on this drug with the sum of 1) the baseline QALYs = 1.02 QALYs per patient, and 2) the
area under the curve representing deviations in QALYs from baseline = 0.5* (intention‐to‐treat monthly
rate of change in QOL*18)*1.5 years. For example, the 90,000 patients initiated on quetiapine are
expected to experience 90,000 X (1.02 + (0.5 X (0.003*18) X 1.5)) = 95,445 QALYS . Similar calculations
are made for each drug initiation and then the total benefits are summed across all the drug initiations.
Total costs under this policy are calculated by multiplying the number of patients initiated on a drug
with the corresponding intention‐to‐treat monthly costs estimates (Figure 4 and summarized in Table
A1) of total drugs and services costs, as reported by Rosenheck et al (2005) in their Supplemental Table
C (reproduced here in Table A1), and summing over 18 months. Of these costs, about 18 ‐ 34% is due to
the use of the antipsychotic medications (Table A1), the remainder being utilization of psychiatric
services.
5.3.b. Partial Coverage Scenario
initial assignment of alternative drugs. Specifically, we look at the coefficients on treatment‐time interaction to compare the average rate of change in QOL weight under alterative first line treatment.
Billions $ / 1000 QALYS
TOTAL: 6.7 / 265
17
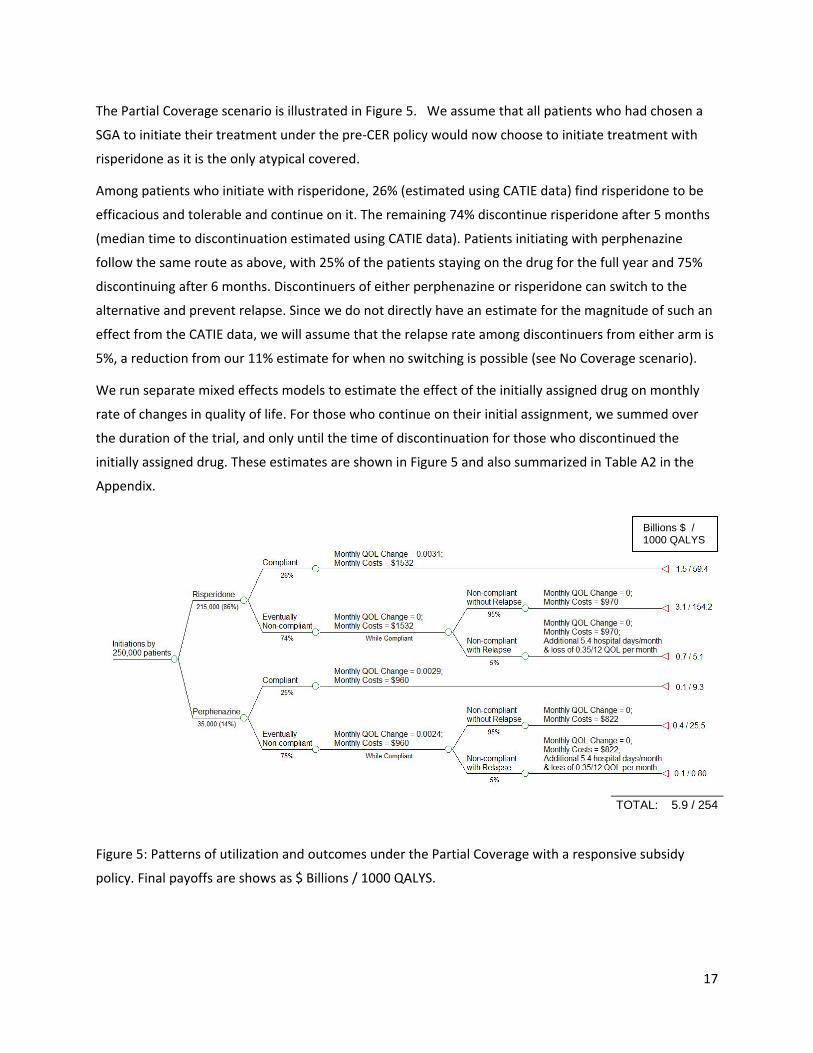
The Partial Coverage scenario is illustrated in Figure 5. We assume that all patients who had chosen a
SGA to initiate their treatment under the pre‐CER policy would now choose to initiate treatment with
risperidone as it is the only atypical covered.
Among patients who initiate with risperidone, 26% (estimated using CATIE data) find risperidone to be
efficacious and tolerable and continue on it. The remaining 74% discontinue risperidone after 5 months
(median time to discontinuation estimated using CATIE data). Patients initiating with perphenazine
follow the same route as above, with 25% of the patients staying on the drug for the full year and 75%
discontinuing after 6 months. Discontinuers of either perphenazine or risperidone can switch to the
alternative and prevent relapse. Since we do not directly have an estimate for the magnitude of such an
effect from the CATIE data, we will assume that the relapse rate among discontinuers from either arm is
5%, a reduction from our 11% estimate for when no switching is possible (see No Coverage scenario).
We run separate mixed effects models to estimate the effect of the initially assigned drug on monthly
rate of changes in quality of life. For those who continue on their initial assignment, we summed over
the duration of the trial, and only until the time of discontinuation for those who discontinued the
initially assigned drug. These estimates are shown in Figure 5 and also summarized in Table A2 in the
Appendix.
Figure 5: Patterns of utilization and outcomes under the Partial Coverage with a responsive subsidy
policy. Final payoffs are shows as $ Billions / 1000 QALYS.
Billions $ / 1000 QALYS
TOTAL: 5.9 / 254
18
For continuers, we apply the same method as under the pre‐CER policy, where total QALYs are
calculated by multiplying the number of continuers with the sum of the baseline QALY and the area
under the curve for deviations from baseline QALYs based on drug ‐specific monthly rate of change in
QOL (as indicated in Figure 5 and summarized in Table A2).
For discontinuers who do not relapse, the deviations from baseline QALYs are calculated only up to the
month where discontinuation occurs. Thereafter, baseline QALYs are assumed to persist (this allows us
to obtain a conservative estimate for the adverse effects on health since no further deterioration is
accounted for) . Patients who relapse after discontinuation, on average, spend 5.4 additional days per
month (valued at $1000/day) in psychiatric hospitals14 (Ascher‐Svanum et al., 2010) and experience a
loss in quality of life of 0.35/12 per patient per month over the remaining duration of the 18‐month
period (Lenert et al. 2004).15
Costs for the compliant groups under each drug initiation are calculated based on the estimates of total
drugs and services reported by Rosenheck et al (2005) in their Supplemental Table D, where treatment
crossovers were excluded. The same monthly costs are applied to the noncompliant group during the
month when they were on their initial assignment. After discontinuation, patients continue to
accumulate the assignment‐specific average monthly service costs (but not any drug costs16) .
Note that compared to the pre‐CER scenario, estimates of the Q for Partial Coverage arise due to the
adverse impact on the health of patients who discontinue initial assignments and face limited options of
alternative medications to switch to.
5.3.c. No Coverage Scenario
The No Coverage scenario is illustrated in Figure 6. We assume that all schizophrenia patients are
initiated with perphenazine, 25% these patients (estimated using CATIE data) find perphenazine to be
efficacious and tolerable and therefore continue on it. The remaining 75% discontinue perphenazine
after six months (median time to discontinuation estimated using CATIE data) but are not able to switch
14 Based on Weiden and Olfson (1995) estimate of two hospitalization associated with relapse, we use Ascher‐Svanum et al. 's (2010) RR category to represent the utilizations associated with relapse. Conservatively, we use their comparison of the RR group to that of the NR group (ideally this should have been the NN group, which would mean a bigger difference, but such data were not reported) in terms of psychiatric hospitalizations: 1.46 hospitalizations/year * 51.24 days/admission vs 0.99 hospitalizations/year*9.84 days/admission, which amounts to a difference of 65 hospital days/year of about 5.4 days/month. 15 The drop is QOL could range from 0.45 to 0.25 based on moving from a mild to extreme or moderate to extreme symptom severity levels. We choose the mid‐point as the baseline level for our analyses and conduct a sensitivity analysis with the most conservative value (0.25). 16 To obtain a conservative estimate on costs, we did not include costs of concomitant medications, as part of these costs may be due to the use of antipsychotics themselves.
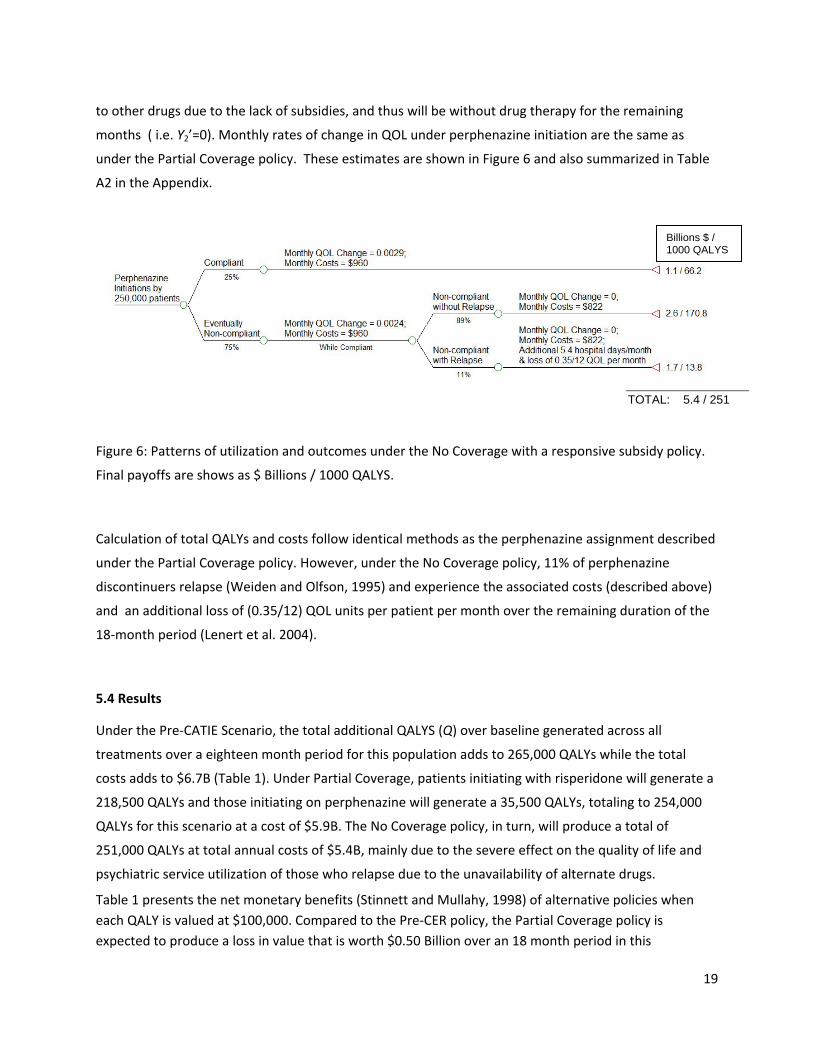
19
to other drugs due to the lack of subsidies, and thus will be without drug therapy for the remaining
months ( i.e. Y2’=0). Monthly rates of change in QOL under perphenazine initiation are the same as
under the Partial Coverage policy. These estimates are shown in Figure 6 and also summarized in Table
A2 in the Appendix.
Figure 6: Patterns of utilization and outcomes under the No Coverage with a responsive subsidy policy.
Final payoffs are shows as $ Billions / 1000 QALYS.
Calculation of total QALYs and costs follow identical methods as the perphenazine assignment described
under the Partial Coverage policy. However, under the No Coverage policy, 11% of perphenazine
discontinuers relapse (Weiden and Olfson, 1995) and experience the associated costs (described above)
and an additional loss of (0.35/12) QOL units per patient per month over the remaining duration of the
18‐month period (Lenert et al. 2004).
5.4 Results
Under the Pre‐CATIE Scenario, the total additional QALYS (Q) over baseline generated across all
treatments over a eighteen month period for this population adds to 265,000 QALYs while the total
costs adds to $6.7B (Table 1). Under Partial Coverage, patients initiating with risperidone will generate a
218,500 QALYs and those initiating on perphenazine will generate a 35,500 QALYs, totaling to 254,000
QALYs for this scenario at a cost of $5.9B. The No Coverage policy, in turn, will produce a total of
251,000 QALYs at total annual costs of $5.4B, mainly due to the severe effect on the quality of life and
psychiatric service utilization of those who relapse due to the unavailability of alternate drugs.
Table 1 presents the net monetary benefits (Stinnett and Mullahy, 1998) of alternative policies when
each QALY is valued at $100,000. Compared to the Pre‐CER policy, the Partial Coverage policy is
expected to produce a loss in value that is worth $0.50 Billion over an 18 month period in this
Billions $ / 1000 QALYS
TOTAL: 5.4 / 251
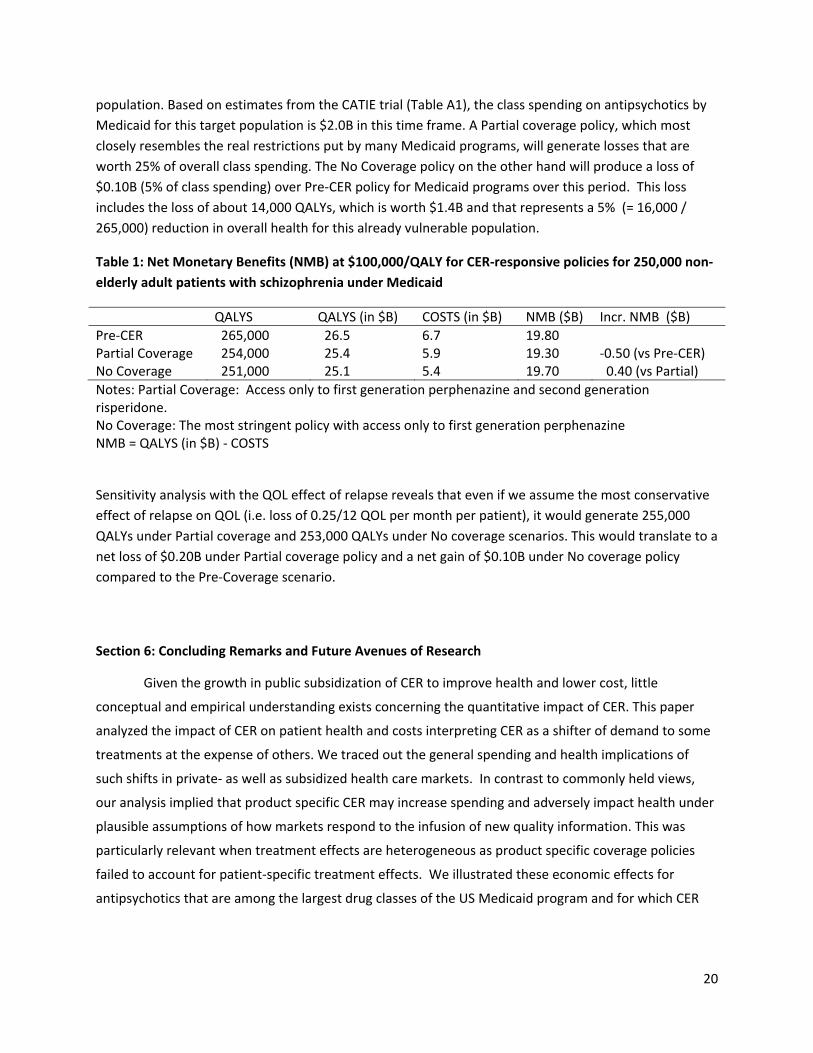
20
population. Based on estimates from the CATIE trial (Table A1), the class spending on antipsychotics by
Medicaid for this target population is $2.0B in this time frame. A Partial coverage policy, which most
closely resembles the real restrictions put by many Medicaid programs, will generate losses that are
worth 25% of overall class spending. The No Coverage policy on the other hand will produce a loss of
$0.10B (5% of class spending) over Pre‐CER policy for Medicaid programs over this period. This loss
includes the loss of about 14,000 QALYs, which is worth $1.4B and that represents a 5% (= 16,000 /
265,000) reduction in overall health for this already vulnerable population.
Table 1: Net Monetary Benefits (NMB) at $100,000/QALY for CER‐responsive policies for 250,000 non‐
elderly adult patients with schizophrenia under Medicaid
QALYS QALYS (in $B) COSTS (in $B) NMB ($B) Incr. NMB ($B)
Pre‐CER 265,000 26.5 6.7 19.80 Partial Coverage 254,000 25.4 5.9 19.30 ‐0.50 (vs Pre‐CER) No Coverage 251,000 25.1 5.4 19.70 0.40 (vs Partial)
Notes: Partial Coverage: Access only to first generation perphenazine and second generation risperidone. No Coverage: The most stringent policy with access only to first generation perphenazine NMB = QALYS (in $B) ‐ COSTS
Sensitivity analysis with the QOL effect of relapse reveals that even if we assume the most conservative
effect of relapse on QOL (i.e. loss of 0.25/12 QOL per month per patient), it would generate 255,000
QALYs under Partial coverage and 253,000 QALYs under No coverage scenarios. This would translate to a
net loss of $0.20B under Partial coverage policy and a net gain of $0.10B under No coverage policy
compared to the Pre‐Coverage scenario.
Section 6: Concluding Remarks and Future Avenues of Research
Given the growth in public subsidization of CER to improve health and lower cost, little
conceptual and empirical understanding exists concerning the quantitative impact of CER. This paper
analyzed the impact of CER on patient health and costs interpreting CER as a shifter of demand to some
treatments at the expense of others. We traced out the general spending and health implications of
such shifts in private‐ as well as subsidized health care markets. In contrast to commonly held views,
our analysis implied that product specific CER may increase spending and adversely impact health under
plausible assumptions of how markets respond to the infusion of new quality information. This was
particularly relevant when treatment effects are heterogeneous as product specific coverage policies
failed to account for patient‐specific treatment effects. We illustrated these economic effects for
antipsychotics that are among the largest drug classes of the US Medicaid program and for which CER
21
has been conducted. We simulated that if subsidies were eliminated for all but one atypical based on
CATIE trial, a loss of value at 5% of class spending would be observed17.
The main conclusion of our analysis is that simplistic thinking about the impact of traditionally
perceived CER may have adverse effects. However, this does not mean that public technology
assessments in health care in general, or CER in particular, may not have a useful role to play. The
analysis suggests several future research issues that we list here to enable a better understanding of
that role. .
Decentralized vs. Centralized Production of Evidence
Our analysis of the impact of CER‐responsive subsidies suggests that a better understanding is
needed as to how CER should be stratified towards obtaining the right treatments for the right sub‐
populations rather than focused on a “best” treatment for all patients. It is recognized that “one size fits
all” treatment evaluations may be harmful and the main remedy proposed has been sub‐population
analysis. However, simply doing a sub‐population analysis for many demographic groups neither solves
the problem (given within‐group heterogeneity) nor is practical in terms of bureaucratic decision‐making
with many separate subgroups facing differential reimbursement.. A better understanding needs to be
developed about when individual‐level attempts to learn about treatment effects through trial and error
(“decentralized patient controlled cross‐over trials”) dominate or is dominated by centralized evidence
such as publicly funded CER. When heterogeneity clouds the applicability of centralized studies to
individual patients, the “make or buy”‐decision of generating evidence on person‐specific treatment
effects needs to be better understood. An individual ultimately cares about her own treatment effect,
the question is how costly it is to learn that effect through personal consumption versus publicly funded
CER.
CER for Sequenced Care
17 Concerns about the implications of CER‐responsive subsidy policies in the face of heterogeneous treatment
effects cut across many other clinical scenarios. The literature is voluminous on the many other classes to which
our analysis may generalize including, for example, the use of antipsychotics drugs in Alzheimer’s disease
(Schneider et al., 2006), use of antihypertensive drugs (Matchar et al., 2008) and the treatments for clinically
localized prostate cancer (Wilt et al., 2008).
22
Traditional RCTs that focus on intention‐to‐treat effects are not useful when there is sequencing
of treatments over time with a first line therapy, second line therapy and so on. This is because RCTs
generate marginal distributions of treatment responses. What would be more valuable to know would
be conditional distributions of treatment responses of the second stage, conditional on failure of the
first‐stage. If there is dependence in treatment responses, as suggested by the data we considered from
the CATIE trial, learning about the joint distribution is of great value (Basu, 2009). CER should be
tailored to incorporate such dependence when trial and error of finding the right treatment for the right
patient is of importance.
Procedures vs. Medical Products as the Domain for Public CER
Intellectual property on medical products such as drugs and devices implies strong incentives for
manufacturers to get the right information generated about the quality of their products or the lack of
quality of their competitors’ products18. This is in opposition to procedures which, without patents, have
no owners with similar protective interests. In addition, many countries mandate quality evidence to be
produced before marketing (in the US through the FDA). This suggests that a useful role for public
subsidies of these activities would be for procedures and not products. This is supported by evidence
showing that the share of private funding for technology assessments was higher for patented medical
products than it was for generic products or procedures. Procedural CER is of importance for reducing
health care variations documented by the Dartmouth Atlas, whereby it has been suggested that less
cost‐efficient regions could adopt the procedures of more cost‐efficient regions. However, the spending
implications of such procedural CER may not be as perceived when more cost‐efficient care reduces
prices but expands quantity.
The Endogenous Nature of Pricing in response to Reimbursement Policy Based on CER
A better understanding is needed of how optimal pricing of therapies responds to subsidy policies that
are based on CER. Manufacturers will likely re‐price products to become eligible for reimbursement in
the wake of new evidence and subsidies. In particular, for our case of antipsychotics, the debate about
whether second generation treatments should be reimbursed at par with first generation treatments is
somewhat misguided. This is because it relies on the evidence prior to reimbursement change to argue
that higher‐priced second generation treatments are equally effective within their class, but less cost‐
effective than lower‐priced first generation treatments. However, prices after CER studies will adjust,
depending on whatever the responsive subsidy rules are. Thus, endogenous pricing is central to any
conclusion of appropriate reimbursement policy based on CER. Therefore, the cost‐savings calculated
18 A mitigating factor is that private incentives may under‐produce CER when ex‐ante losses to the funder from unfavorable results outweigh gains from favorable results.
23
are likely an upper bound and should be contrasted to cost‐savings that occur with a given
reimbursement rule in place.
The implications for R&D and product approval
A special case of our analysis concerns the public technology assessments that occur through
the approval process rather than the reimbursement process. Consider when the second treatment is
one of three possibilities: the existing treatment that is already on the market, no treatment, or a
placebo treatment. Now interpret the last treatment as the one being studied for potential marketing
approval to enter the market. This is a special case of the framework above because when the
investigated drug is a loser compared to the winner on the market, a lack of approval is an extreme form
of a responsive subsidy that raises the price enough to completely eliminate all demand for the loser. In
other words, investigating a drug and not approving it is equivalent to imposing a prohibitive tax for the
loser of the study. This special case is important because the discussed implications about CER translate
into R&D implications through the FDA approval process. In particular, the FDA approval process is
product‐specific as opposed to being concerned with matching patients to the therapies that work best
for each patient. Indeed, many patient groups often disagree with the outcomes of the FDA approval‐ or
withdrawal process due to the heterogeneity discussed here; just as the perceived paradigm for CER is
“one‐size‐fits‐all”, so is the existing paradigm for approval and withdrawal. We believe these unique
R&D implications of CER and the product approval process deserve more attention.
More generally, as a better understanding develops on these and related topics, we hope that
improved evaluation can take place regarding the value of public technology assessments in general,
and CER in particular. As it stands right now, there are no methods to quantitatively assess the impact
of these activities and why they improve on private sector activities aimed at the same purpose. We
hope that quantitative frameworks similar to the ones discussed here will help bridge that gap, making
precise assessments of the value of public subsidies for technology assessments feasible and more
common. Indeed, the indeterminate effect on cost‐effectiveness of CER discussed suggests that the CER
of CER needs to be better understood and deserves more attention by health economists.
24
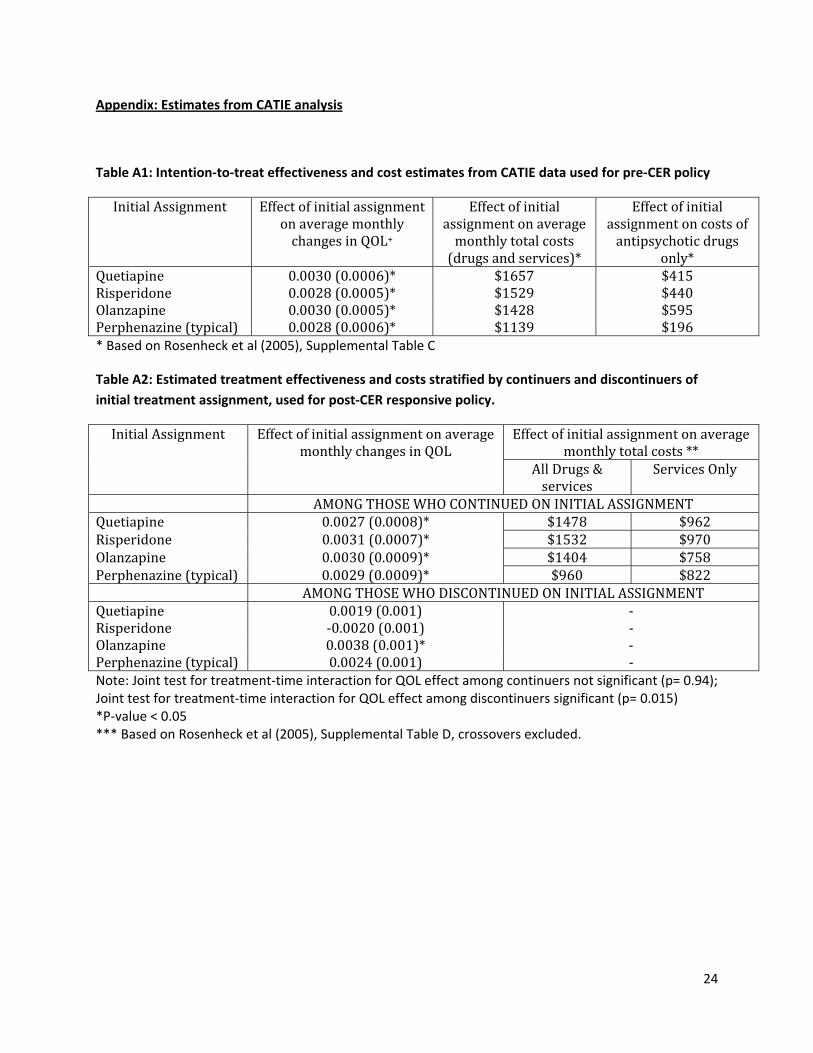
Appendix: Estimates from CATIE analysis
Table A1: Intention‐to‐treat effectiveness and cost estimates from CATIE data used for pre‐CER policy
Initial Assignment Effect of initial assignment on average monthly changes in QOL+
Effect of initial assignment on average monthly total costs (drugs and services)*
Effect of initial assignment on costs of antipsychotic drugs
only* Quetiapine 0.0030 (0.0006)* $1657 $415Risperidone 0.0028 (0.0005)* $1529 $440Olanzapine 0.0030 (0.0005)* $1428 $595Perphenazine (typical) 0.0028 (0.0006)* $1139 $196* Based on Rosenheck et al (2005), Supplemental Table C
Table A2: Estimated treatment effectiveness and costs stratified by continuers and discontinuers of
initial treatment assignment, used for post‐CER responsive policy.
Initial Assignment Effect of initial assignment on average monthly changes in QOL
Effect of initial assignment on average monthly total costs **
All Drugs & services
Services Only
AMONG THOSE WHO CONTINUED ON INITIAL ASSIGNMENTQuetiapine 0.0027 (0.0008)* $1478 $962Risperidone 0.0031 (0.0007)* $1532 $970Olanzapine 0.0030 (0.0009)* $1404 $758Perphenazine (typical) 0.0029 (0.0009)* $960 $822 AMONG THOSE WHO DISCONTINUED ON INITIAL ASSIGNMENTQuetiapine 0.0019 (0.001) ‐ Risperidone ‐0.0020 (0.001) ‐ Olanzapine 0.0038 (0.001)* ‐ Perphenazine (typical) 0.0024 (0.001) ‐ Note: Joint test for treatment‐time interaction for QOL effect among continuers not significant (p= 0.94); Joint test for treatment‐time interaction for QOL effect among discontinuers significant (p= 0.015) *P‐value < 0.05 *** Based on Rosenheck et al (2005), Supplemental Table D, crossovers excluded.
25
References
Banthin, J.S., Miller, G.E. 2006. Trends in Prescription Drug Expenditures by Medicaid Enrollees, Medical Care, 44:I-27–I-35.
Basu, A. 2009. Economics of individualization in comparative effectiveness research and a basis for a patient-centered healthcare. Draft, University of Chicago.
Bruen, B., Ghosh, A. 2004. Medicaid Prescription Drug Spending and Use. Kaiser Commission on Medicaid and the Uninsured Issue Paper. http://www.kff.org/medicaid/upload/Medicaid-Prescription-Drug-Spending-and-Use.pdf, accessed December 21, 2009.
Chernew, ME., Rosen, A., Fendrick, AM. Value-based insurance design. Health Affairs 2007; 26(2): w195-w203.
Federal Coordinating Council for Comparative Effectiveness Research. 2009. Report to the President and the Congress. June 30.
Fendrick, A.M., Smith, D.G., Chernew, M.E., Shah, S.N. A benefit-based copay for prescription drugs: patient contribution based on total benefits, not drug acquisition cost. Am J Manag Care ; 7:861-867.
Gilmer, T.P., Dolder, C.R., Lacro, J.P., Folsom, D.P., Lindamer, L., Garcia, P., Jeste, D.V. 2004, Adherence to treatment with antipsychotic medication and health care costs among Medicaid beneficiaries with schizophrenia. The American Journal of Psychiatry, 161(4), 692-9.
Goldman, D., Philipson, T.J. Integrated Insurance Design in the Presence of Multiple Medical Technologies. American Economic Review 2007; 97(2): 427-432.
IOM Initial National Priorities for Comparative Effectiveness Research: Committee on Comparative Effectiveness Research Prioritization Board on Health Care Services, June 2009.
Kane, J.M. 2004. Tardive dyskinesia rates with atypical antipsychotics in adults: prevalence and incidence. Journal Clinical Psychiatry, 65(suppl 9), 16-20.
Leucht, S., Corves, C., Arbter, D., Engel, R.R., Li, C., & Davis, J.M. 2009. Second-generation versus first-generation antipsychotic drugs for schizophrenia: a meta-analysis. Lancet, 373, 31–41.
Lewin Group. 2000. Access and Utilization of New Antidepressant and Antipsychotic Medications. Report submitted to The Office of the Assistant Secretary for Planning and Evaluation and The National Institute of Mental Health, U.S. Department of Health and Human Services. http://aspe.hhs.gov/health/reports/Psychmedaccess/.
Lenert, L., Sturley, A. P., Rapaport, M.H., Chavez, S., Mohr, P., Rupnow, M. 2004, Public preferences for health states with schizophrenia and a mapping function to estimate utilities from positive and negative syndrome scale scores. Schizophrenia Research, 71, 155–165.
Malani, A. and T. Philipson, (2010), “Government Regulation of Medical Product Safety and Innovation”, forthcoming, Handbook of Pharmaceuticals Markets, edited by P Danzon and S. Nicholson, Oxford University Press.
Matchar, D.B., McCrory, D.C., Orlando, L.A., Patel, M.R., Patel, U.D., Patwardhan, M.B., Powers, B., Samsa, G.P., Gray, R.N. 2008. Systematic Review: Comparative Effectiveness of Angiotensin-Converting Enzyme Inhibitors and Angiotensin II Receptor Blockers for Treating Essential Hypertension. Annals of Internal Medicine 148(1), 16-29.
26
Meltzer, H.Y. 2005. The metabolic consequences of long-term treatment with olanzapine, quetiapine and risperidone: are there differences?” International Journal of Neuropsychopharmacology, 8, 153-6.
Meltzer, H.Y. 2009. Atypical antipsychotic drugs have their merits. Lancet, 373, 1007.
NIMH Perspective on Antipsychotic Reimbursement: Using Results from CATIE. http://www.nimh.nih.gov/about/director/updates/2006/nimh-perspective-on-antipsychotic-reimbursement-using-results-from-the-catie-cost-effectiveness-study.shtml (accessed September 17, 2009)
New York Times Editorial 2005. Comparing schizophrenia drugs. September 21.
Pauly, M. V., Blavin F.E. 2008. Moral Hazard in Insurance, Value-based Cost Sharing, and the Benefits of Blissful Ignorance. Journal of Health Economics, 27, 1407-1417.
Polinski, J. M., Wang, P. S., Fisher, M. A. 2007. Medicaid’s Prior Authorization Program And Access To Atypical Antipsychotic Medications. Health Affairs 26(3), 750-760.
Polsky, D., Doshi, J.A., Bauer, M.S., Glick, H.A. 2006. Clinical trial-based cost-effectiveness analyses of antipsychotic use. Am J Psychiatry, 163, 2047–56.
Rosenheck, R.A. et al. 2007. CATIE Investigator’s Educations Series.
Rosenheck, R.A. et al. 2006. Cost-effectiveness of Second Generation Antipsychotics and Perphenazine in a Randomized Trial of Treatment for Chronic Schizophrenia. American Journal of Psychiatry, 163(12), 2080-9.
Schnider, L.S., Tariot, P.N., Dagerman, K.S., Davis, S.M., Hsiao, J.K., Ismail, M.S., Lebowitz, B. D., Lyketsos, C.G., Ryan, J.M., Stroup, T.S., Sultzer, D.L., Weintraub, D., Lieberman, J.A., for the CATIE-AD Study Group. 2006. Effectiveness of Atypical Antipsychotic Drugs in Patients with Alzheimer's Disease. New England Journal of Medicine, 355(15), 1525-1538
Stinnett, A., Mullahy, J. 1998.Net Health Benefits: A New Framework for the Analysis of Uncertainty in Cost-Effectiveness Analysis. Medical Decision Making 18, S68-S80.
Soumerai, S.B., Law, M.R. 2007. Cost-effectiveness of schizophrenia pharmacotherapy. American Journal Psychiatry 164, 678.
Wilt, T.J., MacDonald, R., Rutks, I., Shamliyan, T.A., Taylor, B.C., Kane, R.L. 2008, Systematic Review: Comparative Effectiveness and Harms of Treatments for Clinically Localized Prostate Cancer. Annals of Internal Medicine 148(6), 435-448.
Weiden, P.J., Oltson, M. 1995. Cost of Relapse in Schizophrenia. Schizophrenia Bulletin, 21(3), 419-429.
Wu, E.Q., Shi, L., Birnbaum, H., Hudson T., Kessler, R. 2006. Annual prevalence of diagnosed schizophrenia in the USA: a claims data analysis approach. Psychological Medicine 36, 1535–1540.

27