NATIONAL BANK OF POLAND WORKING PAPER No. 131
35
The consequences of post-crisis regulatory architecture for banks in Central Eastern Europe Warsaw 2012 Ewa Miklaszewska, Katarzyna Mikołajczyk, Małgorzata Pawłowska NATIONAL BANK OF POLAND WORKING PAPER No. 131
Transcript of NATIONAL BANK OF POLAND WORKING PAPER No. 131
The consequences of post-crisis regulatory architecture for banks
in Central Eastern Europe
Warsaw 2012
Ewa Miklaszewska, Katarzyna Mikołajczyk, Małgorzata Pawłowska
NATIONAL BANK OF POLANDWORKING PAPER
No. 131
Design:
Oliwka s.c.
Layout and print:
NBP Printshop
Published by:
National Bank of Poland Education and Publishing Department 00-919 Warszawa, 11/21 Świętokrzyska Street phone: +48 22 653 23 35, fax +48 22 653 13 21
© Copyright by the National Bank of Poland, 2012
ISSN 2084–624X
http://www.nbp.pl
Ewa Miklaszewska – Cracow University of Economics, Dept. of Finance, Rakowicka 27, 31-510 Kraków, e-mail: [email protected]
Katarzyna Mikołajczyk – Cracow University of Economics, Dept. of Finance, Rakowicka 27, 31-510 Kraków, e-mail: [email protected]
Małgorzata Pawłowska – National Bank of Poland, Economic Institute, Świętokrzyska 11/21, 00-919 Warszawa, e-mail: [email protected]
The views expressed in this paper are views of the authors and do not necessarily reflect those of the National Bank of Poland
WORKING PAPER No. 131 1
Contents
The Consequences of Post-Crisis Regulatory Architecture
for Banks in Central Eastern Europe
Contents
Abstract ........................................................................................................................ 2
1. Introduction ........................................................................................................... 3
2. Building post-crisis regulatory architecture ..................................................... 4
2.1 Literature review ............................................................................................... 4
2.2 The foundations of new European supervisory framework .............................. 5
2.3 New European supervisory architecture and the CEE ...................................... 9
3. Do safe banks create a safe system? CEE experience .................................... 13
3.1 Banking sector in CEE-5 countries: main characteristics ............................... 13
3.2 DEA results on bank efficiency in CEE-5 experience .................................... 17
3.3 Banking market competitive conditions in CEE-5 ......................................... 21
3.4 CEE-5 bank efficiency and soundness ........................................................... 23
4. New European supervisory architecture and CEE-5 banks:
summary of results ............................................................................................. 26
5. Conclusions ........................................................................................................... 28
Literature .................................................................................................................... 29
3
2
5
5
6
10
13
13
17
20
22
28
27
25
Abstract
N a t i o n a l B a n k o f P o l a n d22
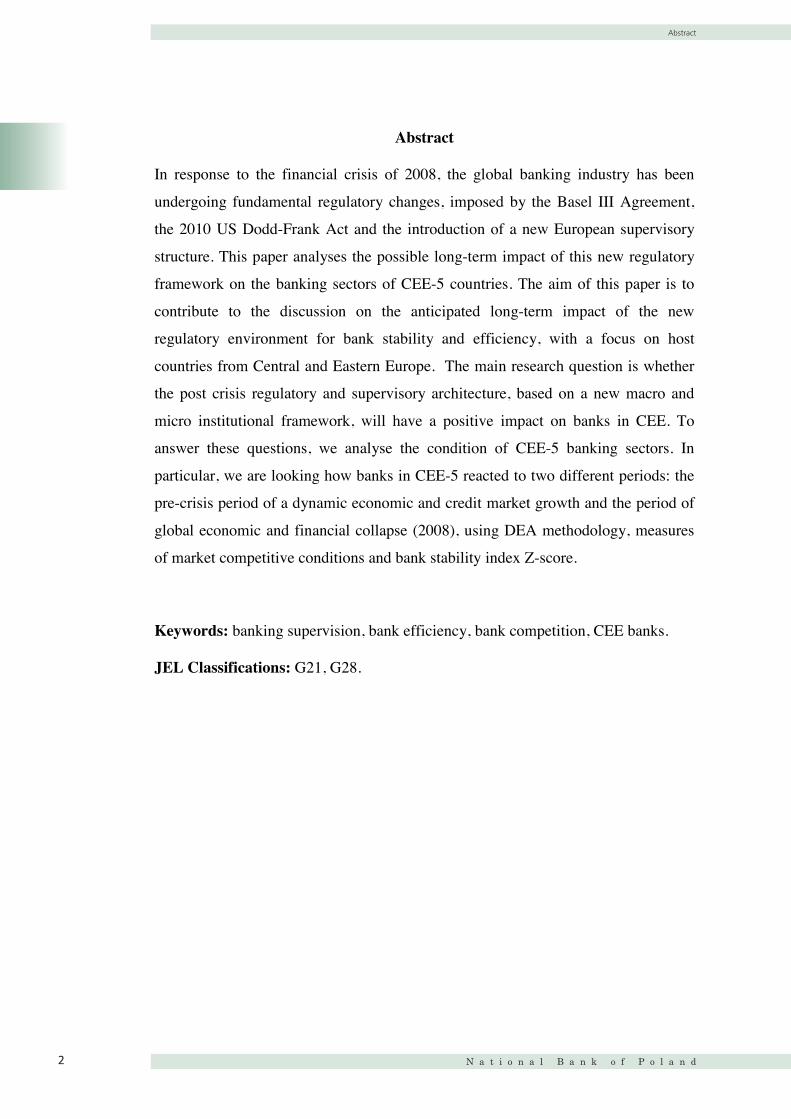
Abstract
In response to the financial crisis of 2008, the global banking industry has been
undergoing fundamental regulatory changes, imposed by the Basel III Agreement,
the 2010 US Dodd-Frank Act and the introduction of a new European supervisory
structure. This paper analyses the possible long-term impact of this new regulatory
framework on the banking sectors of CEE-5 countries. The aim of this paper is to
contribute to the discussion on the anticipated long-term impact of the new
regulatory environment for bank stability and efficiency, with a focus on host
countries from Central and Eastern Europe. The main research question is whether
the post crisis regulatory and supervisory architecture, based on a new macro and
micro institutional framework, will have a positive impact on banks in CEE. To
answer these questions, we analyse the condition of CEE-5 banking sectors. In
particular, we are looking how banks in CEE-5 reacted to two different periods: the
pre-crisis period of a dynamic economic and credit market growth and the period of
global economic and financial collapse (2008), using DEA methodology, measures
of market competitive conditions and bank stability index Z-score.
Keywords: banking supervision, bank efficiency, bank competition, CEE banks.
JEL Classifications: G21, G28.
Introduction
WORKING PAPER No. 131 3
1
3
1. Introduction
Although the 2008 financial crisis affected the entire world, for the first time it was
the leading industrialized nations which were more affected than the emerging
countries, for whom the crisis was largely secondary in nature, in this respect
making the crisis unique (IMF, 2010a). However, its long term consequences, both
direct in terms of changing strategies of foreign owned banks, and indirect in the
form of a necessary adaptation to new global and European regulations, are borne by
all countries.
This paper concentrates on the long-term impact of new, post-crisis regulatory
architecture, on a relatively homogeneous group of Central East European Countries
(CEE-5): Poland, Hungary, Czech Republic, Slovakia and Slovenia. These countries
have been EU members since 2004, with two of them, Slovenia (2007) and Slovakia
(2009), also in the Eurozone. They are at a similar stage of institutional
development, financial and macroeconomic reform, and banking sector depth (IMF,
2010b). Before the global crisis of 2008, they enjoyed rapid growth in the banking
sector, largely due to the increased presence of foreign banks and the adaptation to
the EU legal and institutional framework. However, the global financial crisis has
hampered the dynamics of CEE banking sectors’ growth. Thus the aim of the paper
is to contribute to the discussion on the anticipated long-term impact of post-crisis
regulatory and supervisory architecture, focusing on banks operating in CEE. We
pose the following questions: what were the factors contributing to the efficiency of
CEE banks before the crisis, and consequently, what will be the long-term impact of
the post crisis architecture for for bank stability and efficiency in CEE countries? In
particular, we concentrate on the impact of current European supervisory structure,
and the role played by European Banking Authority (EBA). The empirical part of
the paper is based on the non - parametric Data Envelopment Analysis (DEA)
technique, measures of market competition (the H-statistic) and bank stability index
Z-score, using Bankscope Database.
4
The paper is organised as follows: the first part describes the foundation of post-
crisis European regulatory and supervisory architecture. Following this, we discuss
its possible consequences on banks in CEE. Analyzing the impact of the financial
crisis on CEE banks, we present an empirical analysis of CEE bank efficiency
before and after the crisis (1997-2009), using DEA methodology, market
competition measures and Z-score calculations. In the concluding section we present
the anticipated long-term consequences of the post-crisis regulatory and supervisory
architecture on CEE banks.
2. Building post-crisis regulatory architecture
2.1 Literature review
Financial supervision should ensure systemic stability, safety and soundness of
financial institutions, an efficient and transparent way of conducting transactions
and financial consumer protection (Kuppens et al. 2003). To carry out these
functions effectively, its organizational structure must evolve, so that just as in real
life, form follows function (Acharya et al. 2009). Historically, banks have accepted
tight regulations in exchange for market stability and strong protection, and as a
result there were almost no OECD banking crises till the 1970s (Nier 2010). Banks
were safe, but inefficient, and losing market share to non-banking firms. The period
of liberalisation and deregulation from the 1980s aimed at restoring bank
profitability and facilitating expansion and, in consequence, dramatically influenced
the scale and complexity of banking firms. Table 1 demonstrates how dramatically
the biggest banks’ assets have expanded in the deregulation period.
Table 1. The largest global banks by assets, $ billions, in selected years1985 1995 2004 2009
Top banks Assets Top banks Assets Top banks Assets Top banks Assets Citicorp 167 Deutsche Bank 503 UBS 1 533 BNP Paribas 2 965 Dai-Ichi Kangyo B. 158 Sanwa Bank 501 Citigroup 1 484 RBS 2 750 Fuji Bank 142 Sumitomo Bank 500 Mizuho FG 1 296 Credit Agricole 2 441 Sumitomo Bank 135 Dai-Ichi Kangyo
B. 499 HSBC 1 277 HSBC 2 364
Mitsubishi Bank 133 Fuji Bank 487 Credit Agricole 1 243 Barclays 2 235 BNP 123 Sakura Bank 478 BNP Paribas 1 234 Bank of Am. 2 223 Sanwa Bank 123 Mitsubishi Bank 475 JP Morgan 1 157 Deutsche Bank 2 162 Credit Agricole 123 Norinchukin Bank 430 Deutsche Bank 1 144 JP Morgan 2 032 Bank of America 115 Credit Agricole 386 RBS 1 119 Mitsubishi FG 2 026 Credit Lyonnais 111 Ind. Comm. Bank
of China 374 Bank of
America 1 110 Citigroup 1 857
Source: Data for 1985-2004: The Economist, 2006; for 2009: The Banker, 2010.

Introduction
N a t i o n a l B a n k o f P o l a n d4
1
its possible consequences on banks in CEE. Analyzing the impact of the financial
crisis on CEE banks, we present an empirical analysis of CEE bank efficiency
and competitiveness conduct of banks before and after the crisis, using DEA
methodology, market competition measures and Z-score calculations.
In the concluding section we present the anticipated long-term consequences
of the post-crisis regulatory and supervisory architecture on CEE banks.

Building post-crisis regulatory architecture
WORKING PAPER No. 131 5
2
4
The paper is organised as follows: the first part describes the foundation of post-
crisis European regulatory and supervisory architecture. Following this, we discuss
its possible consequences on banks in CEE. Analyzing the impact of the financial
crisis on CEE banks, we present an empirical analysis of CEE bank efficiency
before and after the crisis (1997-2009), using DEA methodology, market
competition measures and Z-score calculations. In the concluding section we present
the anticipated long-term consequences of the post-crisis regulatory and supervisory
architecture on CEE banks.
2. Building post-crisis regulatory architecture
2.1 Literature review
Financial supervision should ensure systemic stability, safety and soundness of
financial institutions, an efficient and transparent way of conducting transactions
and financial consumer protection (Kuppens et al. 2003). To carry out these
functions effectively, its organizational structure must evolve, so that just as in real
life, form follows function (Acharya et al. 2009). Historically, banks have accepted
tight regulations in exchange for market stability and strong protection, and as a
result there were almost no OECD banking crises till the 1970s (Nier 2010). Banks
were safe, but inefficient, and losing market share to non-banking firms. The period
of liberalisation and deregulation from the 1980s aimed at restoring bank
profitability and facilitating expansion and, in consequence, dramatically influenced
the scale and complexity of banking firms. Table 1 demonstrates how dramatically
the biggest banks’ assets have expanded in the deregulation period.
Table 1. The largest global banks by assets, $ billions, in selected years1985 1995 2004 2009
Top banks Assets Top banks Assets Top banks Assets Top banks Assets Citicorp 167 Deutsche Bank 503 UBS 1 533 BNP Paribas 2 965 Dai-Ichi Kangyo B. 158 Sanwa Bank 501 Citigroup 1 484 RBS 2 750 Fuji Bank 142 Sumitomo Bank 500 Mizuho FG 1 296 Credit Agricole 2 441 Sumitomo Bank 135 Dai-Ichi Kangyo
B. 499 HSBC 1 277 HSBC 2 364
Mitsubishi Bank 133 Fuji Bank 487 Credit Agricole 1 243 Barclays 2 235 BNP 123 Sakura Bank 478 BNP Paribas 1 234 Bank of Am. 2 223 Sanwa Bank 123 Mitsubishi Bank 475 JP Morgan 1 157 Deutsche Bank 2 162 Credit Agricole 123 Norinchukin Bank 430 Deutsche Bank 1 144 JP Morgan 2 032 Bank of America 115 Credit Agricole 386 RBS 1 119 Mitsubishi FG 2 026 Credit Lyonnais 111 Ind. Comm. Bank
of China 374 Bank of
America 1 110 Citigroup 1 857
Source: Data for 1985-2004: The Economist, 2006; for 2009: The Banker, 2010.
5
In the pre-crisis period, the dominant source of bank efficiency stemmed from
expansion into new markets, non depository funding and non interest-based sources
of profits (Demirguc-Kunt and Huizinga 2009), and the adoption of new models for
conducting banking activities, based on product synergies, scale and scope benefits
and global coverage (Acharya et al. 2011). The changes in bank scale and scope of
activities were facilitated by new regulatory philosophy, exemplified by moving
from the Basel 1 to Basel 2 regulatory framework, where market discipline and bank
self-regulation were to replace tight supervision. The increasing complexity of banks
and the expansion of conglomerate structures generated synergies between banking
(regulated) business and relatively unregulated investment activities and offered
both new sources of income and new areas of risk (Allen et al. 2009).
The 2007-2009 crisis demonstrated that Basel 2 was built on many optimistic
assumptions and incorrect trade-offs, namely that regulators do not understand the
complexity of banking activities and that tight supervision should be replaced by
market discipline. Moreover, Basel 2 facilitated bank cooperation with, and the
growth of, the so called shadow banking system (Masera 2010). Consequently,
Basel 2, which looked at isolated areas of risk and focused on partially recognized
threats to financial stability, turned out to be an inadequate regulatory regime and
was largely responsible for the subsequent bank systemic failures in major countries.
2.2 The foundations of new European supervisory framework
The global financial crisis of 2007–2009 forced banks and regulators to rethink
strategic and competitive issues in banking. Banks, which for decades had been
leaders in global efficiency or expansion, turned out to be most affected, requiring
massive public stabilization funds and in some cases rescue by direct government
intervention (Demirgüç-Kunt and Huizinga 2011). The most frequent restructuring
pattern for global banks turned out to be partial or total nationalization (The World
Economic Forum 2010). As a result, large global banks contributed to inflated
budget deficits and dramatically growing public debts in major countries, posing the
danger of systemic risk (Allen et al. 2011).
Building post-crisis regulatory architecture
N a t i o n a l B a n k o f P o l a n d6
2
5
In the pre-crisis period, the dominant source of bank efficiency stemmed from
expansion into new markets, non depository funding and non interest-based sources
of profits (Demirguc-Kunt and Huizinga 2009), and the adoption of new models for
conducting banking activities, based on product synergies, scale and scope benefits
and global coverage (Acharya et al. 2011). The changes in bank scale and scope of
activities were facilitated by new regulatory philosophy, exemplified by moving
from the Basel 1 to Basel 2 regulatory framework, where market discipline and bank
self-regulation were to replace tight supervision. The increasing complexity of banks
and the expansion of conglomerate structures generated synergies between banking
(regulated) business and relatively unregulated investment activities and offered
both new sources of income and new areas of risk (Allen et al. 2009).
The 2007-2009 crisis demonstrated that Basel 2 was built on many optimistic
assumptions and incorrect trade-offs, namely that regulators do not understand the
complexity of banking activities and that tight supervision should be replaced by
market discipline. Moreover, Basel 2 facilitated bank cooperation with, and the
growth of, the so called shadow banking system (Masera 2010). Consequently,
Basel 2, which looked at isolated areas of risk and focused on partially recognized
threats to financial stability, turned out to be an inadequate regulatory regime and
was largely responsible for the subsequent bank systemic failures in major countries.
2.2 The foundations of new European supervisory framework
The global financial crisis of 2007–2009 forced banks and regulators to rethink
strategic and competitive issues in banking. Banks, which for decades had been
leaders in global efficiency or expansion, turned out to be most affected, requiring
massive public stabilization funds and in some cases rescue by direct government
intervention (Demirgüç-Kunt and Huizinga 2011). The most frequent restructuring
pattern for global banks turned out to be partial or total nationalization (The World
Economic Forum 2010). As a result, large global banks contributed to inflated
budget deficits and dramatically growing public debts in major countries, posing the
danger of systemic risk (Allen et al. 2011).
6
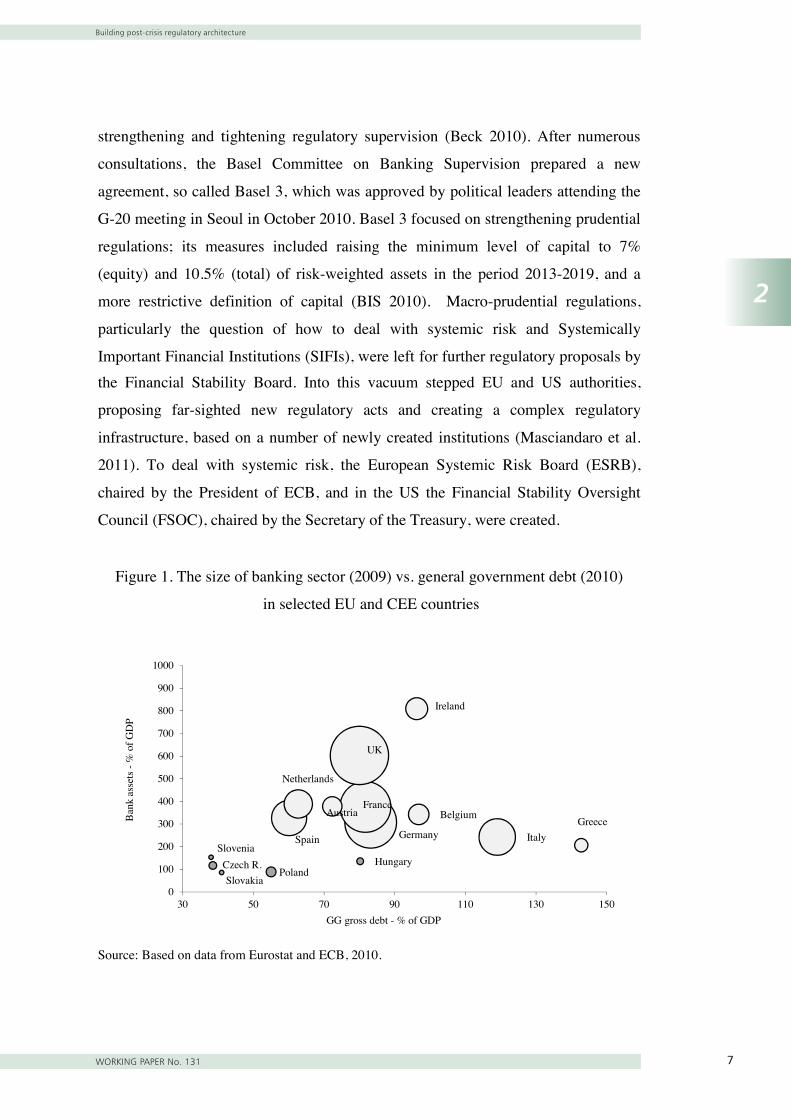
Figure 1. The size of banking sector (2009) vs. general government debt (2010)
in selected EU and CEE countries
Source: Based on data from Eurostat and ECB, 2010.
Figure 1 illustrates that in some countries (e.g. CEE) relatively small banks operate
in relatively safe macroeconomic environment: moderately indebted governments.
However, some European countries have inflated banking sectors’ assets, and a
limited possibility of further government stabilizing intervention, due to large
budget deficits.
By raising new issues, such as systemic risk and the failure of market discipline, the
2008 crisis resulted in the adoption of a new regulatory philosophy: that of
strengthening and tightening regulatory supervision (Beck 2010). After numerous
consultations, the Basel Committee on Banking Supervision prepared a new
agreement, so called Basel 3, which was approved by political leaders attending the
G-20 meeting in Seoul in October 2010. Basel 3 focused on strengthening prudential
regulations; its measures included raising the minimum level of capital to 7%
(equity) and 10.5% (total) of risk-weighted assets in the period 2013-2019, and a
more restrictive definition of capital (BIS 2010). Macro-prudential regulations,
particularly the question of how to deal with systemic risk and Systemically
Important Financial Institutions (SIFIs), were left for further regulatory proposals by
Belgium
Czech R.
Germany
Ireland
Greece
Spain
France
Italy
Hungary
Netherlands
Austria
Poland
Slovenia
Slovakia
UK
0
100
200
300
400
500
600
700
800
900
1000
30 50 70 90 110 130 150
Ban
k as
sets
-%
of G
DP
GG gross debt - % of GDP
Building post-crisis regulatory architecture
WORKING PAPER No. 131 7
2
6
Figure 1. The size of banking sector (2009) vs. general government debt (2010)
in selected EU and CEE countries
Source: Based on data from Eurostat and ECB, 2010.
Figure 1 illustrates that in some countries (e.g. CEE) relatively small banks operate
in relatively safe macroeconomic environment: moderately indebted governments.
However, some European countries have inflated banking sectors’ assets, and a
limited possibility of further government stabilizing intervention, due to large
budget deficits.
By raising new issues, such as systemic risk and the failure of market discipline, the
2008 crisis resulted in the adoption of a new regulatory philosophy: that of
strengthening and tightening regulatory supervision (Beck 2010). After numerous
consultations, the Basel Committee on Banking Supervision prepared a new
agreement, so called Basel 3, which was approved by political leaders attending the
G-20 meeting in Seoul in October 2010. Basel 3 focused on strengthening prudential
regulations; its measures included raising the minimum level of capital to 7%
(equity) and 10.5% (total) of risk-weighted assets in the period 2013-2019, and a
more restrictive definition of capital (BIS 2010). Macro-prudential regulations,
particularly the question of how to deal with systemic risk and Systemically
Important Financial Institutions (SIFIs), were left for further regulatory proposals by
Belgium
Czech R.
Germany
Ireland
Greece
Spain
France
Italy
Hungary
Netherlands
Austria
Poland
Slovenia
Slovakia
UK
0
100
200
300
400
500
600
700
800
900
1000
30 50 70 90 110 130 150
Ban
k as
sets
-%
of G
DP
GG gross debt - % of GDP
7
the Financial Stability Board. Into this vacuum stepped EU and US authorities,
proposing far-sighted new regulatory acts and creating a complex regulatory
infrastructure, based on a number of newly created institutions (Masciandaro et al.
2011). To deal with systemic risk, the European Systemic Risk Board (ESRB),
chaired by the President of ECB, and in the US the Financial Stability Oversight
Council (FSOC), chaired by the Secretary of the Treasury, were created.
The New European Supervisory Architecture was constructed upon three pillars
(Masera 2010 and Masciandaro et al. 2009):
− Macro-prudential supervision, assured by the European Systemic Risk Board
(ESRB), chaired by the President of the ECB. Its members were: the ECB
Vice-President, Governors of the ESCB, Chairs of the EBA, EIOPA, ESMA,
and Representatives of the European Commission. Observers were the
representatives of national supervisors.
− Micro-prudential supervision, based on three sectional authorities: the
European Banking Authority (EBA), European Insurance and Occupational
Pension Authority (EIOPA) and European Securities and Market Authority
(ESMA).
− National supervisors.
The ESRB is a macro-prudential regulator which focuses on the prevention of
systemic risk. It has no legal personality and is operationally supported by the
European Central Bank. The ESRB is designed to ensure that macro-prudential and
macro-economic risks are detected and dealt with. Risks to the financial system can
arise from the failure of one SIFI, but also from the common exposure of large
financial institutions to the same risk factors. The ESRB also has a duty to identify
any serious problems arising in a member state which could endanger EU financial
stability. The main tasks of the ESRB are (Giovanini 2010, Beck et al. 2010):
• to establish adequate procedures to obtain information about macro-economic
risks for financial stability;
• to identify macro-prudential risks in Europe;
6
Figure 1. The size of banking sector (2009) vs. general government debt (2010)
in selected EU and CEE countries
Source: Based on data from Eurostat and ECB, 2010.
Figure 1 illustrates that in some countries (e.g. CEE) relatively small banks operate
in relatively safe macroeconomic environment: moderately indebted governments.
However, some European countries have inflated banking sectors’ assets, and a
limited possibility of further government stabilizing intervention, due to large
budget deficits.
By raising new issues, such as systemic risk and the failure of market discipline, the
2008 crisis resulted in the adoption of a new regulatory philosophy: that of
strengthening and tightening regulatory supervision (Beck 2010). After numerous
consultations, the Basel Committee on Banking Supervision prepared a new
agreement, so called Basel 3, which was approved by political leaders attending the
G-20 meeting in Seoul in October 2010. Basel 3 focused on strengthening prudential
regulations; its measures included raising the minimum level of capital to 7%
(equity) and 10.5% (total) of risk-weighted assets in the period 2013-2019, and a
more restrictive definition of capital (BIS 2010). Macro-prudential regulations,
particularly the question of how to deal with systemic risk and Systemically
Important Financial Institutions (SIFIs), were left for further regulatory proposals by
Belgium
Czech R.
Germany
Ireland
Greece
Spain
France
Italy
Hungary
Netherlands
Austria
Poland
Slovenia
Slovakia
UK
0
100
200
300
400
500
600
700
800
900
1000
30 50 70 90 110 130 150
Ban
k as
sets
-%
of G
DP
GG gross debt - % of GDP
Building post-crisis regulatory architecture
N a t i o n a l B a n k o f P o l a n d8
2
7
the Financial Stability Board. Into this vacuum stepped EU and US authorities,
proposing far-sighted new regulatory acts and creating a complex regulatory
infrastructure, based on a number of newly created institutions (Masciandaro et al.
2011). To deal with systemic risk, the European Systemic Risk Board (ESRB),
chaired by the President of ECB, and in the US the Financial Stability Oversight
Council (FSOC), chaired by the Secretary of the Treasury, were created.
The New European Supervisory Architecture was constructed upon three pillars
(Masera 2010 and Masciandaro et al. 2009):
− Macro-prudential supervision, assured by the European Systemic Risk Board
(ESRB), chaired by the President of the ECB. Its members were: the ECB
Vice-President, Governors of the ESCB, Chairs of the EBA, EIOPA, ESMA,
and Representatives of the European Commission. Observers were the
representatives of national supervisors.
− Micro-prudential supervision, based on three sectional authorities: the
European Banking Authority (EBA), European Insurance and Occupational
Pension Authority (EIOPA) and European Securities and Market Authority
(ESMA).
− National supervisors.
The ESRB is a macro-prudential regulator which focuses on the prevention of
systemic risk. It has no legal personality and is operationally supported by the
European Central Bank. The ESRB is designed to ensure that macro-prudential and
macro-economic risks are detected and dealt with. Risks to the financial system can
arise from the failure of one SIFI, but also from the common exposure of large
financial institutions to the same risk factors. The ESRB also has a duty to identify
any serious problems arising in a member state which could endanger EU financial
stability. The main tasks of the ESRB are (Giovanini 2010, Beck et al. 2010):
• to establish adequate procedures to obtain information about macro-economic
risks for financial stability;
• to identify macro-prudential risks in Europe;
8
• to decide on macro-prudential policy;
• to provide early risk warnings to EU supervisors and other relevant actors;
• to compare observations on macro-economic and prudential developments;
• to determine how to achieve effective follow-up to warnings/recommendations.
An even more challenging task was to establish a pan-European micro-prudential
supervisory structure, as the convergence of supervisory architecture among
European countries is very low (Masciandaro et al. 2009). The aim to harmonize the
supervisory activities in the EU had to reconcile with different national objectives
and institutional arrangements (Masciandaro and Quintyn 2008). The European
Banking Authority is the new micro-prudential bank regulator, with much stronger
prerogatives than that of its predecessor CEBS (Committee of European Banking
Supervisors), which operated in the period 2004-2010. The aim of EBA is to
“safeguard public values, such as the stability of the financial system, the
transparency of markets and financial products and the protection of depositors and
investors” (CEBS 2010). The EBA has broad competencies, including preventing
regulatory arbitrage, guaranteeing a level playing field, strengthening international
supervisory coordination, promoting supervisory convergence and providing advice
to the EU institutions in the areas of banking, payments and e-money regulation as
well as on issues related to corporate governance, auditing and financial reporting.
The main tasks of the EBA are:
• to provide opinions and develop guidelines, recommendations, and draft
regulatory standards,
• to contribute to a common supervisory culture, ensuring consistent and
effective application of the EU Acts,
• to develop common reporting standards (COREP), including credit, market,
operational, and equity capital adequacy ratios,
• to prevent regulatory arbitrage, mediating and settling disagreements
between competent authorities and taking actions, in emergency situations,
• to improve the cooperation of supervisory authorities and to conduct peer
review analyses,
• to cooperate with the ESRB,
Building post-crisis regulatory architecture
WORKING PAPER No. 131 9
2
8
• to decide on macro-prudential policy;
• to provide early risk warnings to EU supervisors and other relevant actors;
• to compare observations on macro-economic and prudential developments;
• to determine how to achieve effective follow-up to warnings/recommendations.
An even more challenging task was to establish a pan-European micro-prudential
supervisory structure, as the convergence of supervisory architecture among
European countries is very low (Masciandaro et al. 2009). The aim to harmonize the
supervisory activities in the EU had to reconcile with different national objectives
and institutional arrangements (Masciandaro and Quintyn 2008). The European
Banking Authority is the new micro-prudential bank regulator, with much stronger
prerogatives than that of its predecessor CEBS (Committee of European Banking
Supervisors), which operated in the period 2004-2010. The aim of EBA is to
“safeguard public values, such as the stability of the financial system, the
transparency of markets and financial products and the protection of depositors and
investors” (CEBS 2010). The EBA has broad competencies, including preventing
regulatory arbitrage, guaranteeing a level playing field, strengthening international
supervisory coordination, promoting supervisory convergence and providing advice
to the EU institutions in the areas of banking, payments and e-money regulation as
well as on issues related to corporate governance, auditing and financial reporting.
The main tasks of the EBA are:
• to provide opinions and develop guidelines, recommendations, and draft
regulatory standards,
• to contribute to a common supervisory culture, ensuring consistent and
effective application of the EU Acts,
• to develop common reporting standards (COREP), including credit, market,
operational, and equity capital adequacy ratios,
• to prevent regulatory arbitrage, mediating and settling disagreements
between competent authorities and taking actions, in emergency situations,
• to improve the cooperation of supervisory authorities and to conduct peer
review analyses,
• to cooperate with the ESRB,
9
• to foster depositor and investor protection, improve transparency and
disclosure of information.
Before the crisis, there was a discussion as to whether banking supervision in the EU
should be centralized in the ECB. After the crisis, one of the arguments for placing it
within an independent external institution (EBA) was that national supervisors in the
EU follow very diverse models: independent integrated institution, supervision
centralized in the central bank, or the so called “twin peaks” model with partial
centralization in two independent authorities. The composition of the ECB
supervisory board illustrates it well: out of a total of 27 EBA supervisory board
members, 14 are national central banks and 13 are independent authorities (EBA
2011).
An even more complex regulatory reorganisation has been carried out in the US.
The Dodd-Frank Act (2010) impacts all federal regulatory agencies and affects
many aspects of the financial services industry. The Financial Stability Oversight
Council (FSOC) is tasked with identifying risks to financial stability, promoting
market discipline and information by eliminating expectations that financial and
non-financial organizations will be shielded from losses in the event of failure, and
responding to emerging systemic threats to financial stability. It is supplemented by
a number of new regulatory institutions and redefinition of powers of the existing
ones. The emerging complex regulatory structure in the US, based on a number of
regulatory agencies, may or may not produce a more efficient and stable financial
system, while being costly and opaque. It reflects the new regulatory philosophy of
“holistic vision” and a diamond regulatory structure, rather than of the ladder
(Masera 2009).
2.3 New European supervisory architecture and the CEE
The new European supervisory architecture, which took effect in 2011, has been the
result of a negative assessment of pre-crisis supervisory structures in highly
developed countries. The European System of Financial Supervisors has potentially
far-reaching powers, which may be in conflict with national supervisory authorities,
Building post-crisis regulatory architecture
N a t i o n a l B a n k o f P o l a n d10
2
9
• to foster depositor and investor protection, improve transparency and
disclosure of information.
Before the crisis, there was a discussion as to whether banking supervision in the EU
should be centralized in the ECB. After the crisis, one of the arguments for placing it
within an independent external institution (EBA) was that national supervisors in the
EU follow very diverse models: independent integrated institution, supervision
centralized in the central bank, or the so called “twin peaks” model with partial
centralization in two independent authorities. The composition of the ECB
supervisory board illustrates it well: out of a total of 27 EBA supervisory board
members, 14 are national central banks and 13 are independent authorities (EBA
2011).
An even more complex regulatory reorganisation has been carried out in the US.
The Dodd-Frank Act (2010) impacts all federal regulatory agencies and affects
many aspects of the financial services industry. The Financial Stability Oversight
Council (FSOC) is tasked with identifying risks to financial stability, promoting
market discipline and information by eliminating expectations that financial and
non-financial organizations will be shielded from losses in the event of failure, and
responding to emerging systemic threats to financial stability. It is supplemented by
a number of new regulatory institutions and redefinition of powers of the existing
ones. The emerging complex regulatory structure in the US, based on a number of
regulatory agencies, may or may not produce a more efficient and stable financial
system, while being costly and opaque. It reflects the new regulatory philosophy of
“holistic vision” and a diamond regulatory structure, rather than of the ladder
(Masera 2009).
2.3 New European supervisory architecture and the CEE
The new European supervisory architecture, which took effect in 2011, has been the
result of a negative assessment of pre-crisis supervisory structures in highly
developed countries. The European System of Financial Supervisors has potentially
far-reaching powers, which may be in conflict with national supervisory authorities,
10
which is a source of apprehension both in old and new EU members. The emerging
complex structure, based on a number of new regulatory agencies, may not produce
the desired more efficient and stable European financial system. There may be some
areas of confusion as to the degree of authority and overlapping areas of regulation,
particularly between the EBA and national regulatory bodies
CEE countries are host markets to global banks, hence regulators are afraid of
further diminishing of their powers. As was noted by the member of the Czech NCB
Board, „there is no one-size-fits-all solution available for all countries”. In his view,
the stability of the financial sector depends on the ability to establish independent,
strong and respected supervision, which constitutes an important argument for
carrying out banking supervision at a national level (Lizal 2011). Shifting decision-
making powers to global or regional financial centres may mean further
marginalization for CEE countries. As CEE countries are relatively new to EU
decision-making processes, they tend to be rule-takers rather than rule-makers, and
the new European financial architecture will only reinforce this.
Moreover, the EU and US new institutional regulatory structures were based on the
perceived necessity to deal with systemic risk. There is lively discussion about the
merits of the new micro-prudential regulations, while macro-prudential solutions
being considered as non-controversial, which may not necessarily be the case for
CEE countries. Macro-prudential regulations entail considerable costs and
regulatory burdens, particularly for countries for which systemic risk is not a major
priority, such as CEE. Moreover, strong macro-prudential regulations are needed if
we do not believe that “strong banks create a strong system”, because of linkages
and global interdependence. However, this view is not universally accepted, as crisis
might be attributed rather to the problems with bank business models and lack of
proper micro-prudential supervision of large banks (Nier 2010).
Before the crisis, many countries had carried out a reform of national supervisory
systems, in many cases towards a supervisory integration, according to a notion that
the structure of supervision should reflect the structure of the market (i.e. integrated,
Building post-crisis regulatory architecture
WORKING PAPER No. 131 11
2
10
which is a source of apprehension both in old and new EU members. The emerging
complex structure, based on a number of new regulatory agencies, may not produce
the desired more efficient and stable European financial system. There may be some
areas of confusion as to the degree of authority and overlapping areas of regulation,
particularly between the EBA and national regulatory bodies
CEE countries are host markets to global banks, hence regulators are afraid of
further diminishing of their powers. As was noted by the member of the Czech NCB
Board, „there is no one-size-fits-all solution available for all countries”. In his view,
the stability of the financial sector depends on the ability to establish independent,
strong and respected supervision, which constitutes an important argument for
carrying out banking supervision at a national level (Lizal 2011). Shifting decision-
making powers to global or regional financial centres may mean further
marginalization for CEE countries. As CEE countries are relatively new to EU
decision-making processes, they tend to be rule-takers rather than rule-makers, and
the new European financial architecture will only reinforce this.
Moreover, the EU and US new institutional regulatory structures were based on the
perceived necessity to deal with systemic risk. There is lively discussion about the
merits of the new micro-prudential regulations, while macro-prudential solutions
being considered as non-controversial, which may not necessarily be the case for
CEE countries. Macro-prudential regulations entail considerable costs and
regulatory burdens, particularly for countries for which systemic risk is not a major
priority, such as CEE. Moreover, strong macro-prudential regulations are needed if
we do not believe that “strong banks create a strong system”, because of linkages
and global interdependence. However, this view is not universally accepted, as crisis
might be attributed rather to the problems with bank business models and lack of
proper micro-prudential supervision of large banks (Nier 2010).
Before the crisis, many countries had carried out a reform of national supervisory
systems, in many cases towards a supervisory integration, according to a notion that
the structure of supervision should reflect the structure of the market (i.e. integrated,
11
synergy-based). Many countries modelled their supervision on the British FSA.
However, the UK was among countries which suffered most from the crisis and
consequently has now been reforming the supervisory regime, featuring a tripartite
model with two supervisory authorities under the authority of the Bank of England:
the Prudential Regulation Authority (PRA) in charge of the prudential regulation of
individual firms, the Consumer Protection and Markets Authority (CPMA)
responsible for consumer protection and the conduct of financial markets; and the
Financial Policy Committee (FPC) responsible for maintaining financial stability by
monitoring and addressing systemic risk that threaten the financial sector as a whole.
The supervisory focus will be much more anticipatory and more judgment-based
(Bank of England 2011).
All CEE-5 countries have adopted an integrated supervisory regime, although
differently placed (Apinis et al. 2010). In the Czech Republic, financial market
supervision has been integrated into the central bank (NCB), since 2006. While the
NCB has traditionally been involved in banking supervision since its establishment
in 1993, the supervision of other financial market sectors (capital markets, insurance
and cooperative banking) was initially carried out by separate supervisors. In order
to provide synergies, the Czech Government carried out a supervisory reform which
resulted in the institutional integration of the financial market supervision authorities
from 2006. Further internal reorganization of supervisory departments took effect on
1 January 2008, when sector supervision was abandoned and replaced with the
functional model, with a Financial Market Committee (FMC) being establish as a
new advisory body in matters of financial market supervision. Also in Slovakia on
the 1st January 2006 the Financial Market Authority was dissolved and its powers
and responsibilities were transferred to the National Bank of Slovakia. The NBS
thus conducts the entire financial market supervision covering banking, capital
market, insurance and pension saving.
Integrated supervision took effect in Hungary in 2000, when the Hungarian Banking
and Capital Market Supervisory Authority and the Supervisory Authority
responsible for the Supervision of Insurance Companies were merged and the
Building post-crisis regulatory architecture
N a t i o n a l B a n k o f P o l a n d12
2
11
synergy-based). Many countries modelled their supervision on the British FSA.
However, the UK was among countries which suffered most from the crisis and
consequently has now been reforming the supervisory regime, featuring a tripartite
model with two supervisory authorities under the authority of the Bank of England:
the Prudential Regulation Authority (PRA) in charge of the prudential regulation of
individual firms, the Consumer Protection and Markets Authority (CPMA)
responsible for consumer protection and the conduct of financial markets; and the
Financial Policy Committee (FPC) responsible for maintaining financial stability by
monitoring and addressing systemic risk that threaten the financial sector as a whole.
The supervisory focus will be much more anticipatory and more judgment-based
(Bank of England 2011).
All CEE-5 countries have adopted an integrated supervisory regime, although
differently placed (Apinis et al. 2010). In the Czech Republic, financial market
supervision has been integrated into the central bank (NCB), since 2006. While the
NCB has traditionally been involved in banking supervision since its establishment
in 1993, the supervision of other financial market sectors (capital markets, insurance
and cooperative banking) was initially carried out by separate supervisors. In order
to provide synergies, the Czech Government carried out a supervisory reform which
resulted in the institutional integration of the financial market supervision authorities
from 2006. Further internal reorganization of supervisory departments took effect on
1 January 2008, when sector supervision was abandoned and replaced with the
functional model, with a Financial Market Committee (FMC) being establish as a
new advisory body in matters of financial market supervision. Also in Slovakia on
the 1st January 2006 the Financial Market Authority was dissolved and its powers
and responsibilities were transferred to the National Bank of Slovakia. The NBS
thus conducts the entire financial market supervision covering banking, capital
market, insurance and pension saving.
Integrated supervision took effect in Hungary in 2000, when the Hungarian Banking
and Capital Market Supervisory Authority and the Supervisory Authority
responsible for the Supervision of Insurance Companies were merged and the
12
Hungarian Financial Supervisory Authority (HU-FSA) was created. Similarly, in
Poland since 2006 the Polish FSA has been the single body responsible for matters
related to the supervision of the financial market (pension funds, capital market,
insurance institutions and electronic money institutions, as well as the
supplementary supervision of financial conglomerates) and from 2008 also
encompassed the banking market. The reasons for this trend towards building an
integrated supervisory system in some CEE countries are unclear. The most frequent
justification was to point out to the creation of synergies, but the financial markets in
CEE are relatively small, without much scope for a synergy effect.
Do safe banks create a safe system? CEE experience
WORKING PAPER No. 131 13
3
13
3 Do safe banks create a safe system? CEE experience
3.1 Banking sector in CEE-5 countries: main characteristics
CEE-5 countries are at a similar stage of institutional development, financial and
macroeconomic reform, and banking sector depth. They share a number of common
characteristics: they are open economies with exports contributing 60-80% of GDP
(with the exception of Poland, which has the largest domestic market), they have
already well established EU legal rules and standards, low wages and educated
workforce and relatively fast economic growth, particularly in the pre-crisis period.
The gap between these countries and developed European economies is narrowing.
CEE countries were before the crisis among the top most attractive regions for
foreign investment, with the share of foreign investors in the banking sector
exceeding on average 80%, with the exception of Slovenia (Ernst &Young 2007).
The process of fundamental bank reforms, economic restructuring and privatization
has now largely been completed in these countries. After EU accession in 2004,
CEE countries enjoyed rapid economic and banking sector growth. The global crisis
of 2007-2009 had a negative effect on the assessment of this region as economic
growth collapsed (fig.2).
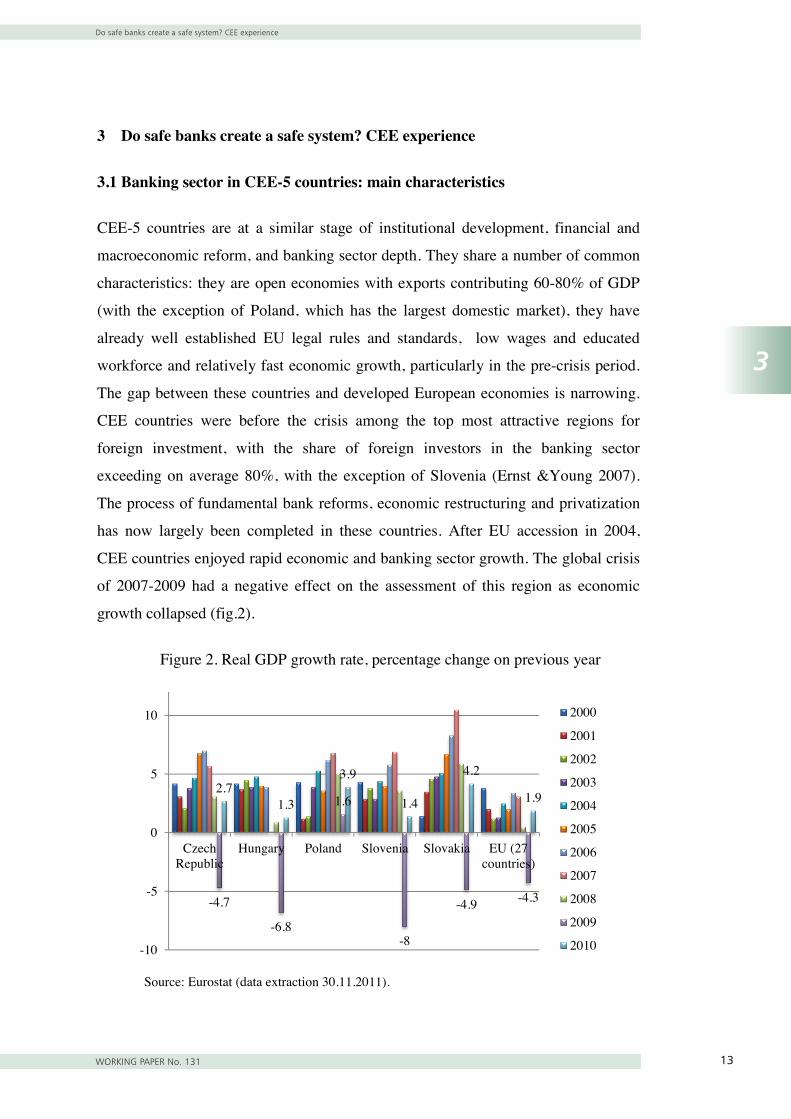
Figure 2. Real GDP growth rate, percentage change on previous year
Source: Eurostat (data extraction 30.11.2011).
-4.7
-6.8
1.6
-8
-4.9 -4.3
2.71.3
3.9
1.4
4.2
1.9
-10
-5
0
5
10
CzechRepublic
Hungary Poland Slovenia Slovakia EU (27countries)
2000
2001
2002
2003
2004
2005
2006
2007
2008
2009
2010
Do safe banks create a safe system? CEE experience
N a t i o n a l B a n k o f P o l a n d14
3
14
The first and the most seriously affected country was Hungary; the sharpest decline
in output was in Slovenia and Slovakia, both of which had seen very dynamic
growth before the crisis, while Poland managed to keep in positive GDP growth and
credit growth throughout the crisis. Before the crisis, CEE countries enjoyed
dynamic banking sector growth and high bank profitability (average ROE above
20% till 2007). Despite numerous gloomy projections, the macro-economic and
profitability figures remained good throughout the crisis: average CEE-5 ROE
dropped to 15% in 2008 and 13% in 2009, but the C/I ratio also fell to 51% in 2009.
Neither was the increase in NPL dramatic: from 3.9% to 5% on average in the same
period (ECB 2005-2009 and IMF 2010a). Thus bank performance in CEE-5
countries was less affected by the crisis than in the old EU countries.
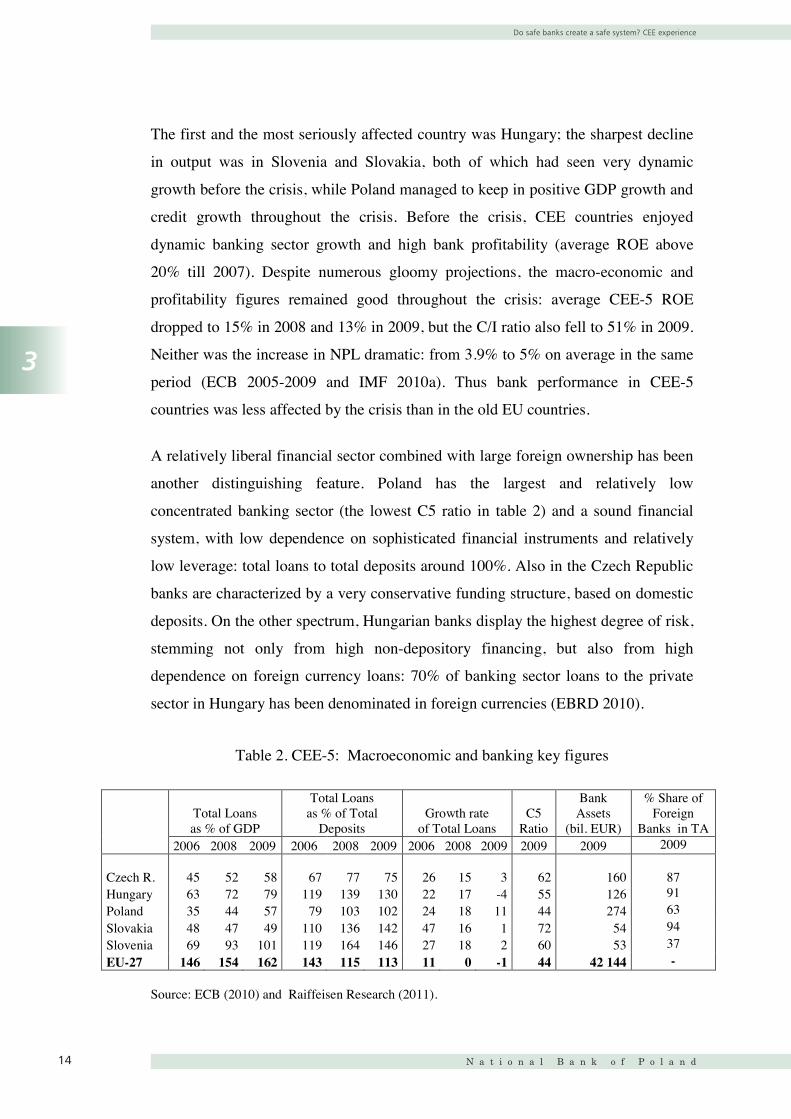
A relatively liberal financial sector combined with large foreign ownership has been
another distinguishing feature. Poland has the largest and relatively low
concentrated banking sector (the lowest C5 ratio in table 2) and a sound financial
system, with low dependence on sophisticated financial instruments and relatively
low leverage: total loans to total deposits around 100%. Also in the Czech Republic
banks are characterized by a very conservative funding structure, based on domestic
deposits. On the other spectrum, Hungarian banks display the highest degree of risk,
stemming not only from high non-depository financing, but also from high
dependence on foreign currency loans: 70% of banking sector loans to the private
sector in Hungary has been denominated in foreign currencies (EBRD 2010).
Table 2. CEE-5: Macroeconomic and banking key figures
Total Loans as % of GDP
Total Loans as % of Total
Deposits Growth rate
of Total Loans C5
Ratio
Bank Assets
(bil. EUR)
% Share of Foreign
Banks in TA2006 2008 2009 2006 2008 2009 2006 2008 2009 2009 2009 2009
Czech R. 45 52 58 67 77 75 26 15 3 62 160 87 Hungary 63 72 79 119 139 130 22 17 -4 55 126 91 Poland 35 44 57 79 103 102 24 18 11 44 274 63 Slovakia 48 47 49 110 136 142 47 16 1 72 54 94 Slovenia 69 93 101 119 164 146 27 18 2 60 53 37 EU-27 146 154 162 143 115 113 11 0 -1 44 42 144 -
Source: ECB (2010) and Raiffeisen Research (2011).
14
The first and the most seriously affected country was Hungary; the sharpest decline
in output was in Slovenia and Slovakia, both of which had seen very dynamic
growth before the crisis, while Poland managed to keep in positive GDP growth and
credit growth throughout the crisis. Before the crisis, CEE countries enjoyed
dynamic banking sector growth and high bank profitability (average ROE above
20% till 2007). Despite numerous gloomy projections, the macro-economic and
profitability figures remained good throughout the crisis: average CEE-5 ROE
dropped to 15% in 2008 and 13% in 2009, but the C/I ratio also fell to 51% in 2009.
Neither was the increase in NPL dramatic: from 3.9% to 5% on average in the same
period (ECB 2005-2009 and IMF 2010a). Thus bank performance in CEE-5
countries was less affected by the crisis than in the old EU countries.
A relatively liberal financial sector combined with large foreign ownership has been
another distinguishing feature. Poland has the largest and relatively low
concentrated banking sector (the lowest C5 ratio in table 2) and a sound financial
system, with low dependence on sophisticated financial instruments and relatively
low leverage: total loans to total deposits around 100%. Also in the Czech Republic
banks are characterized by a very conservative funding structure, based on domestic
deposits. On the other spectrum, Hungarian banks display the highest degree of risk,
stemming not only from high non-depository financing, but also from high
dependence on foreign currency loans: 70% of banking sector loans to the private
sector in Hungary has been denominated in foreign currencies (EBRD 2010).
Table 2. CEE-5: Macroeconomic and banking key figures
Total Loans as % of GDP
Total Loans as % of Total
Deposits Growth rate
of Total Loans C5
Ratio
Bank Assets
(bil. EUR)
% Share of Foreign
Banks in TA2006 2008 2009 2006 2008 2009 2006 2008 2009 2009 2009 2009
Czech R. 45 52 58 67 77 75 26 15 3 62 160 87 Hungary 63 72 79 119 139 130 22 17 -4 55 126 91 Poland 35 44 57 79 103 102 24 18 11 44 274 63 Slovakia 48 47 49 110 136 142 47 16 1 72 54 94 Slovenia 69 93 101 119 164 146 27 18 2 60 53 37 EU-27 146 154 162 143 115 113 11 0 -1 44 42 144 -
Source: ECB (2010) and Raiffeisen Research (2011).
Do safe banks create a safe system? CEE experience
WORKING PAPER No. 131 15
3
15
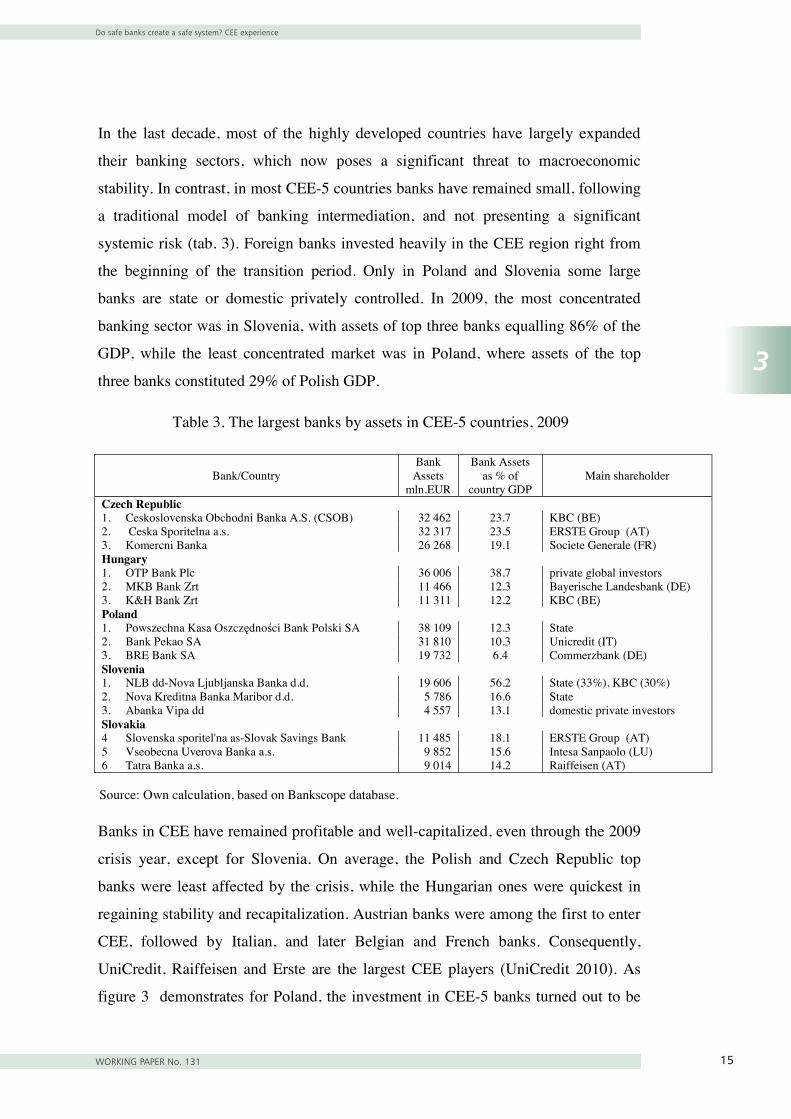
In the last decade, most of the highly developed countries have largely expanded
their banking sectors, which now poses a significant threat to macroeconomic
stability. In contrast, in most CEE-5 countries banks have remained small, following
a traditional model of banking intermediation, and not presenting a significant
systemic risk (tab. 3). Foreign banks invested heavily in the CEE region right from
the beginning of the transition period. Only in Poland and Slovenia some large
banks are state or domestic privately controlled. In 2009, the most concentrated
banking sector was in Slovenia, with assets of top three banks equalling 86% of the
GDP, while the least concentrated market was in Poland, where assets of the top
three banks constituted 29% of Polish GDP.
Table 3. The largest banks by assets in CEE-5 countries, 2009
Bank/Country Bank
Assets mln.EUR
Bank Assets as % of
country GDP Main shareholder
Czech Republic1. Ceskoslovenska Obchodni Banka A.S. (CSOB) 32 462 23.7 KBC (BE) 2. Ceska Sporitelna a.s. 32 317 23.5 ERSTE Group (AT) 3. Komercni Banka 26 268 19.1 Societe Generale (FR) Hungary1. OTP Bank Plc 36 006 38.7 private global investors 2. MKB Bank Zrt 11 466 12.3 Bayerische Landesbank (DE) 3. K&H Bank Zrt 11 311 12.2 KBC (BE) Poland1. Powszechna Kasa Oszczędności Bank Polski SA 38 109 12.3 State 2. Bank Pekao SA 31 810 10.3 Unicredit (IT) 3. BRE Bank SA 19 732 6.4 Commerzbank (DE) Slovenia1. NLB dd-Nova Ljubljanska Banka d.d. 19 606 56.2 State (33%), KBC (30%) 2. Nova Kreditna Banka Maribor d.d. 5 786 16.6 State 3. Abanka Vipa dd 4 557 13.1 domestic private investors Slovakia4 Slovenska sporitel'na as-Slovak Savings Bank 11 485 18.1 ERSTE Group (AT) 5 Vseobecna Uverova Banka a.s. 9 852 15.6 Intesa Sanpaolo (LU) 6 Tatra Banka a.s. 9 014 14.2 Raiffeisen (AT) Source: Own calculation, based on Bankscope database.
Banks in CEE have remained profitable and well-capitalized, even through the 2009
crisis year, except for Slovenia. On average, the Polish and Czech Republic top
banks were least affected by the crisis, while the Hungarian ones were quickest in
regaining stability and recapitalization. Austrian banks were among the first to enter
CEE, followed by Italian, and later Belgian and French banks. Consequently,
UniCredit, Raiffeisen and Erste are the largest CEE players (UniCredit 2010). As
figure 3 demonstrates for Poland, the investment in CEE-5 banks turned out to be
15
In the last decade, most of the highly developed countries have largely expanded
their banking sectors, which now poses a significant threat to macroeconomic
stability. In contrast, in most CEE-5 countries banks have remained small, following
a traditional model of banking intermediation, and not presenting a significant
systemic risk (tab. 3). Foreign banks invested heavily in the CEE region right from
the beginning of the transition period. Only in Poland and Slovenia some large
banks are state or domestic privately controlled. In 2009, the most concentrated
banking sector was in Slovenia, with assets of top three banks equalling 86% of the
GDP, while the least concentrated market was in Poland, where assets of the top
three banks constituted 29% of Polish GDP.
Table 3. The largest banks by assets in CEE-5 countries, 2009
Bank/Country Bank
Assets mln.EUR
Bank Assets as % of
country GDP Main shareholder
Czech Republic1. Ceskoslovenska Obchodni Banka A.S. (CSOB) 32 462 23.7 KBC (BE) 2. Ceska Sporitelna a.s. 32 317 23.5 ERSTE Group (AT) 3. Komercni Banka 26 268 19.1 Societe Generale (FR) Hungary1. OTP Bank Plc 36 006 38.7 private global investors 2. MKB Bank Zrt 11 466 12.3 Bayerische Landesbank (DE) 3. K&H Bank Zrt 11 311 12.2 KBC (BE) Poland1. Powszechna Kasa Oszczędności Bank Polski SA 38 109 12.3 State 2. Bank Pekao SA 31 810 10.3 Unicredit (IT) 3. BRE Bank SA 19 732 6.4 Commerzbank (DE) Slovenia1. NLB dd-Nova Ljubljanska Banka d.d. 19 606 56.2 State (33%), KBC (30%) 2. Nova Kreditna Banka Maribor d.d. 5 786 16.6 State 3. Abanka Vipa dd 4 557 13.1 domestic private investors Slovakia4 Slovenska sporitel'na as-Slovak Savings Bank 11 485 18.1 ERSTE Group (AT) 5 Vseobecna Uverova Banka a.s. 9 852 15.6 Intesa Sanpaolo (LU) 6 Tatra Banka a.s. 9 014 14.2 Raiffeisen (AT) Source: Own calculation, based on Bankscope database.
Banks in CEE have remained profitable and well-capitalized, even through the 2009
crisis year, except for Slovenia. On average, the Polish and Czech Republic top
banks were least affected by the crisis, while the Hungarian ones were quickest in
regaining stability and recapitalization. Austrian banks were among the first to enter
CEE, followed by Italian, and later Belgian and French banks. Consequently,
UniCredit, Raiffeisen and Erste are the largest CEE players (UniCredit 2010). As
figure 3 demonstrates for Poland, the investment in CEE-5 banks turned out to be
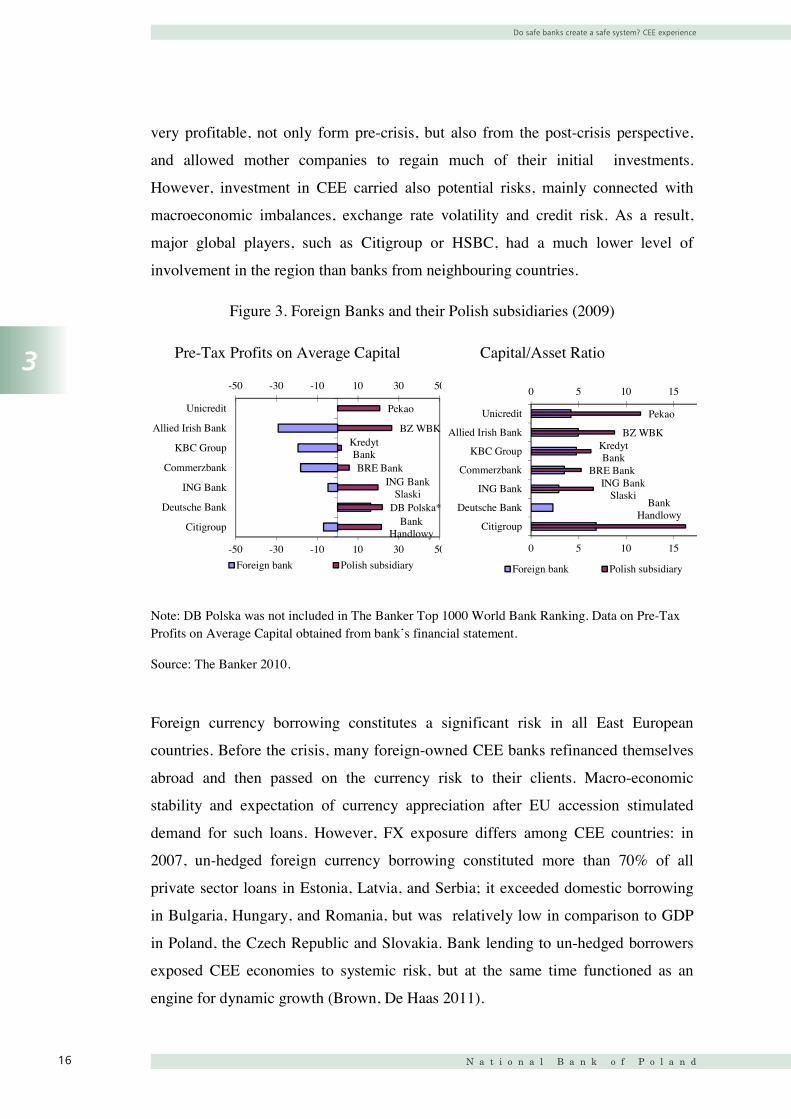
Do safe banks create a safe system? CEE experience
N a t i o n a l B a n k o f P o l a n d16
3
16
very profitable, not only form pre-crisis, but also from the post-crisis perspective,
and allowed mother companies to regain much of their initial investments.
However, investment in CEE carried also potential risks, mainly connected with
macroeconomic imbalances, exchange rate volatility and credit risk. As a result,
major global players, such as Citigroup or HSBC, had a much lower level of
involvement in the region than banks from neighbouring countries.
Figure 3. Foreign Banks and their Polish subsidiaries (2009)
Pre-Tax Profits on Average Capital Capital/Asset Ratio
Note: DB Polska was not included in The Banker Top 1000 World Bank Ranking. Data on Pre-Tax Profits on Average Capital obtained from bank’s financial statement.
Source: The Banker 2010.
Foreign currency borrowing constitutes a significant risk in all East European
countries. Before the crisis, many foreign-owned CEE banks refinanced themselves
abroad and then passed on the currency risk to their clients. Macro-economic
stability and expectation of currency appreciation after EU accession stimulated
demand for such loans. However, FX exposure differs among CEE countries: in
2007, un-hedged foreign currency borrowing constituted more than 70% of all
private sector loans in Estonia, Latvia, and Serbia; it exceeded domestic borrowing
in Bulgaria, Hungary, and Romania, but was relatively low in comparison to GDP
in Poland, the Czech Republic and Slovakia. Bank lending to un-hedged borrowers
exposed CEE economies to systemic risk, but at the same time functioned as an
engine for dynamic growth (Brown, De Haas 2011).
Bank Handlowy
DB Polska*
ING Bank Slaski
BRE Bank
Kredyt Bank
BZ WBK
Pekao
-50 -30 -10 10 30 50
-50 -30 -10 10 30 50
Citigroup
Deutsche Bank
ING Bank
Commerzbank
KBC Group
Allied Irish Bank
Unicredit
Foreign bank Polish subsidiary
Bank Handlowy
ING Bank Slaski
BRE Bank
Kredyt Bank
BZ WBK
Pekao
0 5 10 15
0 5 10 15
Citigroup
Deutsche Bank
ING Bank
Commerzbank
KBC Group
Allied Irish Bank
Unicredit
Foreign bank Polish subsidiary
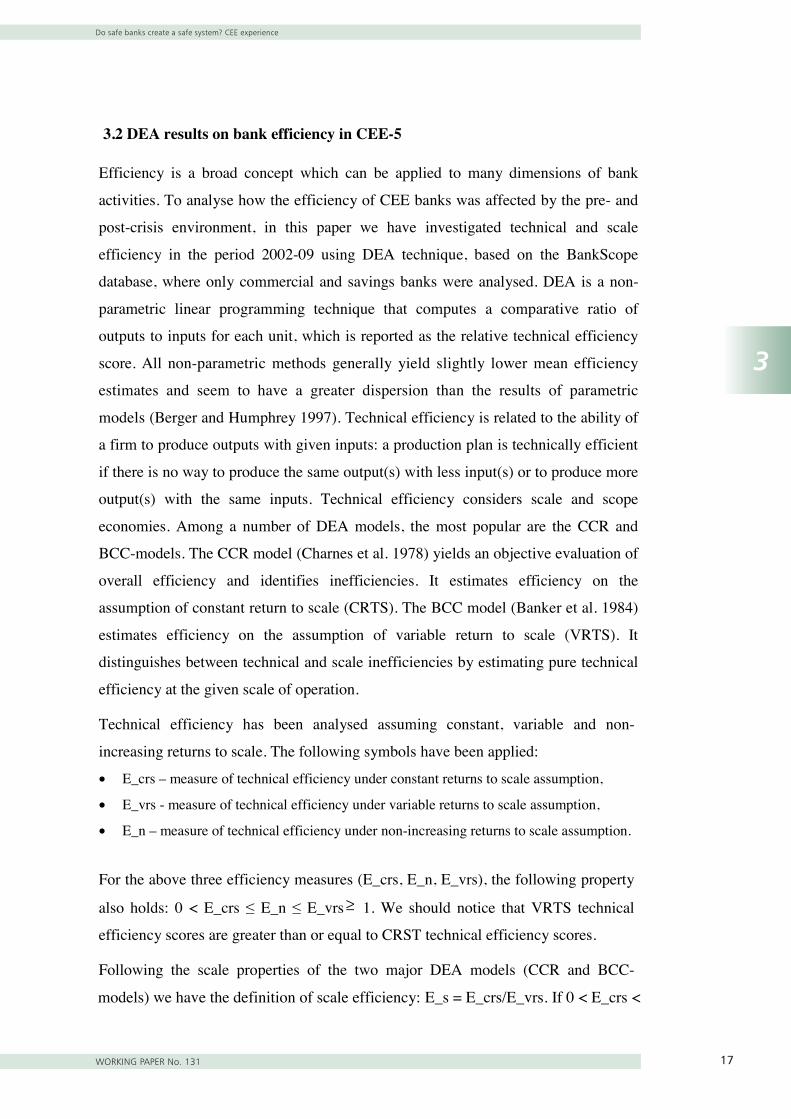
Do safe banks create a safe system? CEE experience
WORKING PAPER No. 131 17
3
17
3.2 DEA results on bank efficiency in CEE-5
Efficiency is a broad concept which can be applied to many dimensions of bank
activities. To analyse how the efficiency of CEE banks was affected by the pre- and
post-crisis environment, in this paper we have investigated technical and scale
efficiency in the period 2002-09 using DEA technique, based on the BankScope
database, where only commercial and savings banks were analysed. DEA is a non-
parametric linear programming technique that computes a comparative ratio of
outputs to inputs for each unit, which is reported as the relative technical efficiency
score. All non-parametric methods generally yield slightly lower mean efficiency
estimates and seem to have a greater dispersion than the results of parametric
models (Berger and Humphrey 1997). Technical efficiency is related to the ability of
a firm to produce outputs with given inputs: a production plan is technically efficient
if there is no way to produce the same output(s) with less input(s) or to produce more
output(s) with the same inputs. Technical efficiency considers scale and scope
economies. Among a number of DEA models, the most popular are the CCR and
BCC-models. The CCR model (Charnes et al. 1978) yields an objective evaluation of
overall efficiency and identifies inefficiencies. It estimates efficiency on the
assumption of constant return to scale (CRTS). The BCC model (Banker et al. 1984)
estimates efficiency on the assumption of variable return to scale (VRTS). It
distinguishes between technical and scale inefficiencies by estimating pure technical
efficiency at the given scale of operation.
Technical efficiency has been analysed assuming constant, variable and non-
increasing returns to scale. The following symbols have been applied:
• E_crs – measure of technical efficiency under constant returns to scale assumption,
• E_vrs - measure of technical efficiency under variable returns to scale assumption,
• E_n – measure of technical efficiency under non-increasing returns to scale assumption.
For the above three efficiency measures (E_crs, E_n, E_vrs), the following property
also holds: 0 < E_crs ≤ E_n ≤ E_vrs ≥ 1. We should notice that VRTS technical
efficiency scores are greater than or equal to CRST technical efficiency scores.
Following the scale properties of the two major DEA models (CCR and BCC-
18
models) we have the definition of scale efficiency: E_s = E_crs/E_vrs. If 0 < E_crs <
E_vrs ≤ 1, this means that scale efficiency e_s< 1 and the given bank/firm is scale
inefficient (but we do not know if it is too big or too small). Based on scale
efficiency measure (E_s) only, it is not possible to distinguish in which region the
given bank/firm is operating: increasing or decreasing returns to scale, to make this
distinction, these measures must be compared with E_n measure. If E_crs = E_n this
means that bank/firm is not scale efficient and is operating with increasing returns to
scale. If E_n > E_crs that bank/firm is operating with decreasing return to scale
(Charnes et al. 1997).
In order to test how bank efficiency changed over the period 2002-2009, an
efficiency analysis has been carried out for the banking sectors in the Czech
Republic, Slovakia, Slovenia, Hungary and Poland. The model chosen for estimation
of efficiency is the expanded BCC model, output-oriented. In the technical
efficiency analysis according to the DEA method, we have applied the classification
of input and output based on value added approach (VAA) proposed by Grigorian
and Manole (2002), were the input was: (x1) - personnel expenses, (x2) - total fixed
assets, (x3) - interest expense. The output was: (y1) - total loans net, (y2) - liquid
assets, (y3) - total deposits.
The results of the efficiency analysis according to DEA method of E_crs and
E_vrs measures in the period 2002-2009 are presented in table 4.
Table 4. Efficiency measures of CEE5 countries
Year 2002 2003 2004 2005 2006 2007 2008 2009 No. of banks
E_crs Czech Republic 0.55 0.74 0.84 0.68 0.81 0.79 0.66 0.80 27 Poland 0.49 0.59 0.71 0.65 0.68 0.32 0.66 0.42 41 Slovakia 0.65 0.96 0.70 0.97 0.97 0.79 0.91 0.87 17 Slovenia 0,44 0.95 0.88 0.88 0.92 0.90 0.82 0.42 19 Hungary 0.30 0.20 0.53 0.55 0.58 0.68 0.59 0.30 32
E_vrs Czech Republic 0.67 0.88 0.94 0.88 0.88 0.92 0.91 0.90 27 Poland 0.80 0.86 0.77 0.81 0.86 0.56 0.85 0.87 41 Slovakia 0.81 0.97 0.78 0.98 0.98 0.93 0.95 0.91 17 Slovenia 0,78 0.97 0.96 0.93 0.94 0.96 0.94 0.73 19 Hungary 0.64 0.52 0.67 0.76 0.82 0.86 0.80 0.73 32
Source: own calculations, Bankscope database.
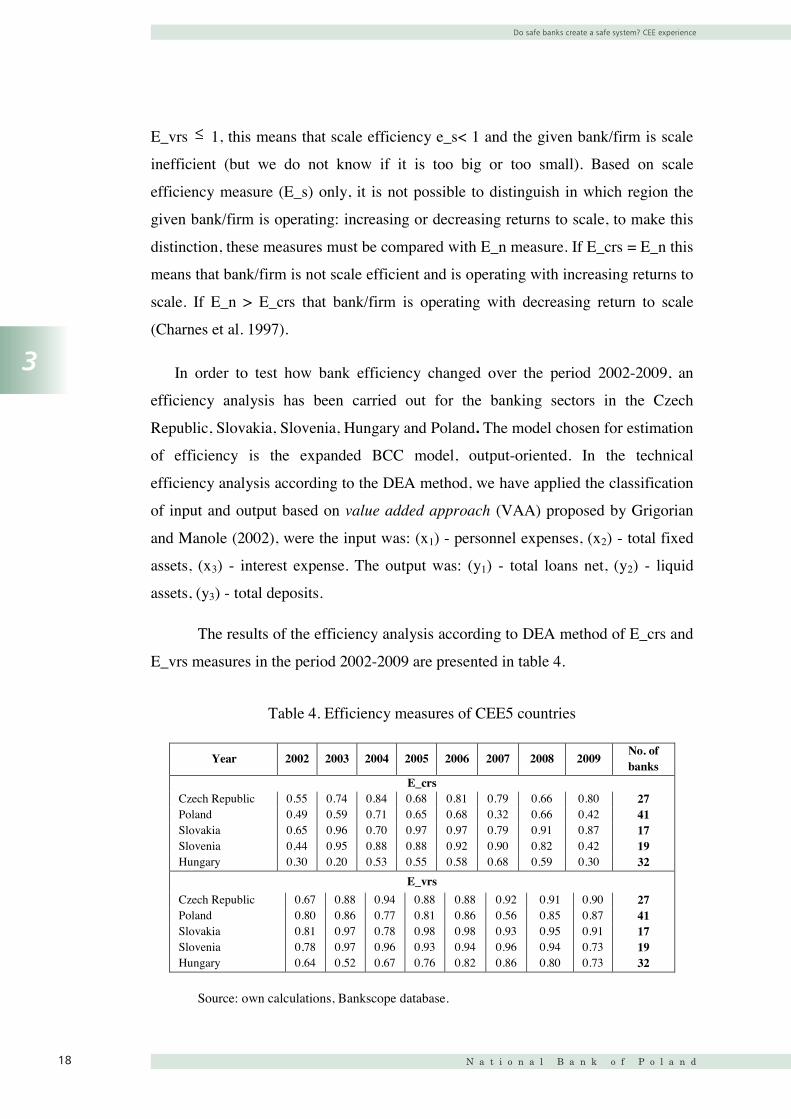
Do safe banks create a safe system? CEE experience
N a t i o n a l B a n k o f P o l a n d18
3
18
models) we have the definition of scale efficiency: E_s = E_crs/E_vrs. If 0 < E_crs <
E_vrs ≤ 1, this means that scale efficiency e_s< 1 and the given bank/firm is scale
inefficient (but we do not know if it is too big or too small). Based on scale
efficiency measure (E_s) only, it is not possible to distinguish in which region the
given bank/firm is operating: increasing or decreasing returns to scale, to make this
distinction, these measures must be compared with E_n measure. If E_crs = E_n this
means that bank/firm is not scale efficient and is operating with increasing returns to
scale. If E_n > E_crs that bank/firm is operating with decreasing return to scale
(Charnes et al. 1997).
In order to test how bank efficiency changed over the period 2002-2009, an
efficiency analysis has been carried out for the banking sectors in the Czech
Republic, Slovakia, Slovenia, Hungary and Poland. The model chosen for estimation
of efficiency is the expanded BCC model, output-oriented. In the technical
efficiency analysis according to the DEA method, we have applied the classification
of input and output based on value added approach (VAA) proposed by Grigorian
and Manole (2002), were the input was: (x1) - personnel expenses, (x2) - total fixed
assets, (x3) - interest expense. The output was: (y1) - total loans net, (y2) - liquid
assets, (y3) - total deposits.
The results of the efficiency analysis according to DEA method of E_crs and
E_vrs measures in the period 2002-2009 are presented in table 4.
Table 4. Efficiency measures of CEE5 countries
Year 2002 2003 2004 2005 2006 2007 2008 2009 No. of banks
E_crs Czech Republic 0.55 0.74 0.84 0.68 0.81 0.79 0.66 0.80 27 Poland 0.49 0.59 0.71 0.65 0.68 0.32 0.66 0.42 41 Slovakia 0.65 0.96 0.70 0.97 0.97 0.79 0.91 0.87 17 Slovenia 0,44 0.95 0.88 0.88 0.92 0.90 0.82 0.42 19 Hungary 0.30 0.20 0.53 0.55 0.58 0.68 0.59 0.30 32
E_vrs Czech Republic 0.67 0.88 0.94 0.88 0.88 0.92 0.91 0.90 27 Poland 0.80 0.86 0.77 0.81 0.86 0.56 0.85 0.87 41 Slovakia 0.81 0.97 0.78 0.98 0.98 0.93 0.95 0.91 17 Slovenia 0,78 0.97 0.96 0.93 0.94 0.96 0.94 0.73 19 Hungary 0.64 0.52 0.67 0.76 0.82 0.86 0.80 0.73 32
Source: own calculations, Bankscope database.
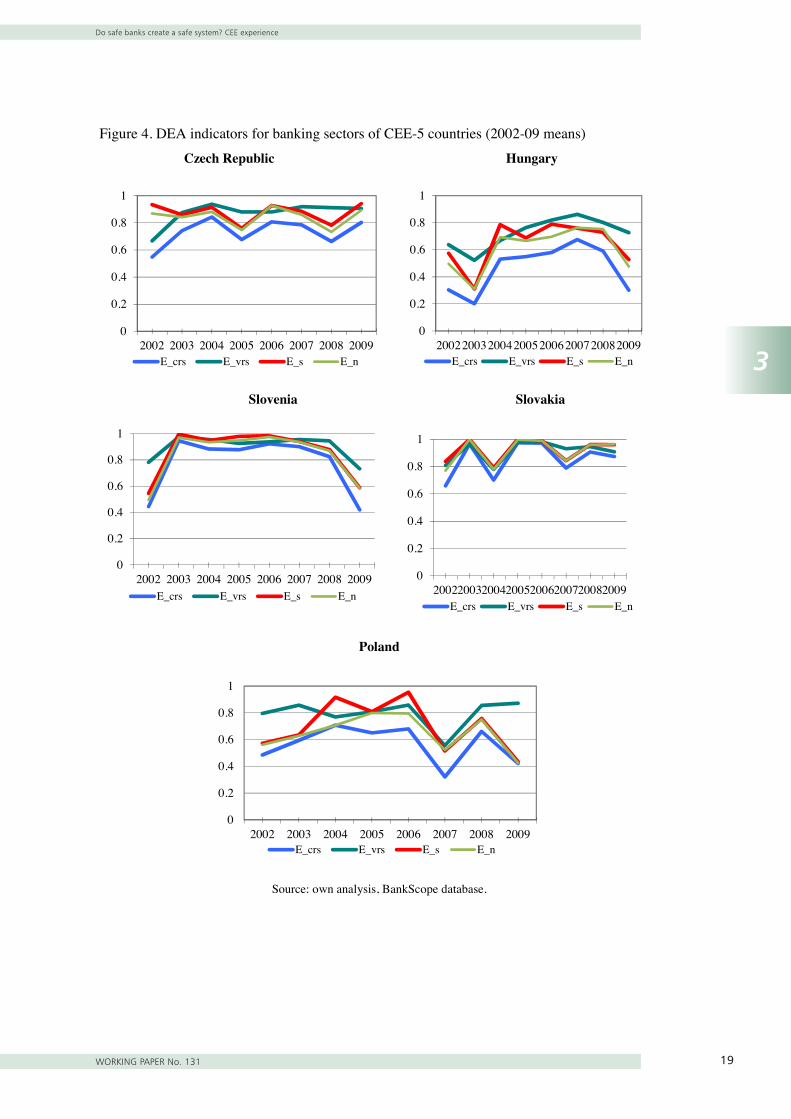
Do safe banks create a safe system? CEE experience
WORKING PAPER No. 131 19
3
20
Figure 4. DEA indicators for banking sectors of CEE-5 countries (2002-09 means)
Czech Republic
Hungary
Slovenia
Slovakia
Poland
Source: own analysis, BankScope database.
0
0.2
0.4
0.6
0.8
1
2002 2003 2004 2005 2006 2007 2008 2009E_crs E_vrs E_s E_n
0
0.2
0.4
0.6
0.8
1
20022003200420052006200720082009E_crs E_vrs E_s E_n
0
0.2
0.4
0.6
0.8
1
2002 2003 2004 2005 2006 2007 2008 2009E_crs E_vrs E_s E_n
0
0.2
0.4
0.6
0.8
1
20022003200420052006200720082009E_crs E_vrs E_s E_n
0
0.2
0.4
0.6
0.8
1
2002 2003 2004 2005 2006 2007 2008 2009E_crs E_vrs E_s E_n
Do safe banks create a safe system? CEE experience
N a t i o n a l B a n k o f P o l a n d20
3
19
The results of the analysis have confirmed that the accession of CEE-5
countries to the EU has boosted the efficiency of commercial banks in the analysed
period, particularly between 2004-2006. However, efficiency in all analysed
countries decreased in 2008-2009, most dramatically for Hungarian banks.
The process of changes of scale efficiency was also analyzed by a
comparison of technical efficiency measures (E_crs, E_vrs, E_n) and scale
efficiency measures (E_s) (see Fig. 4). The result of comparison in 2009 showed
that the majority of examined banks in Poland and the Czech Republic were
operating with increasing or constant returns to scale region (for the majority of
banks E_n = E_crs). The results of the analysis showed that the efficiency of CEE-5
banking sectors increased after EU accession and decreased due to the financial
crisis. The majority of banks in Poland were operating with increasing returns to
scale, which means that there is still room for new M&A.
21
3.3 Banking market competitive conditions in CEE-5
Anayiotos et al. (2010), researching the relative efficiency of East European banks
using DEA technique, showed that DEA efficiency scores before the recent crisis
were strongly linked to the host country level of development. Miklaszewska and
Mikolajczyk (2011) pointed to the importance of bank home-country governance
model: better results were recorded by banks with headquarters in countries with
shareholder model than with the stakeholder model. Lensink et al. (2008) indicated
that domestic institutional structure did matter for bank efficiency. Thus, assuming
the importance of host county conditions, our next step was to compare the
competitive environment in CEE-5 countries. The level of competition of CEE-5
was evaluated using the H-statistic based on the reduced form of revenue equation of
the firms (Panzar and Rosse 1987, Claessens and Laeven 2004, Yildrim and
Philippatoas 2007, Bikker and Bos 2008).
In order to estimate the H-statistic for the Polish banking sector, we used the
reduced form of revenue equation, where the dependent variable IRit is the natural
logarithm of interest income ln(II)it or the natural logarithm of interest income divided
by total assets ln(II/TA)it of bank i in time t, explanatory variables were defined for
each bank i in period t, as follows: w1it – price of funds (relation of interest expenses
to total liabilities); w2it – price of labor (personnel expenses, relation of pay and pay-
related cost to net assets); w3it – price of physical capital (relation of depreciation to
fixed assets), othit – relation of loans to deposit, where: eit – error, a1, a2, a3, d –
regression coefficients1:
ln(IRit) = ci +a1*lnwlit + a2*lnwpit + a3*lnwkit + d*othit+eit [1]
The panel data for this analysis comprises data from BankScope and cover
the period from 2002 to 2009 and two variants of reduced form of revenue equation
were estimated (Pawlowska 2011). The first variant explains the natural logarithm of
interest income divided by total assets ln(II/TA) as a dependent variable, whereas the
1 The sum of regression ratios (a1+a2+a3) determines the value of H statistic for the sector of commercial banks.
19
The results of the analysis have confirmed that the accession of CEE-5
countries to the EU has boosted the efficiency of commercial banks in the analysed
period, particularly between 2004-2006. However, efficiency in all analysed
countries decreased in 2008-2009, most dramatically for Hungarian banks.
The process of changes of scale efficiency was also analyzed by a
comparison of technical efficiency measures (E_crs, E_vrs, E_n) and scale
efficiency measures (E_s) (see Fig. 4). The result of comparison in 2009 showed
that the majority of examined banks in Poland and the Czech Republic were
operating with increasing or constant returns to scale region (for the majority of
banks E_n = E_crs). The results of the analysis showed that the efficiency of CEE-5
banking sectors increased after EU accession and decreased due to the financial
crisis. The majority of banks in Poland were operating with increasing returns to
scale, which means that there is still room for new M&A.
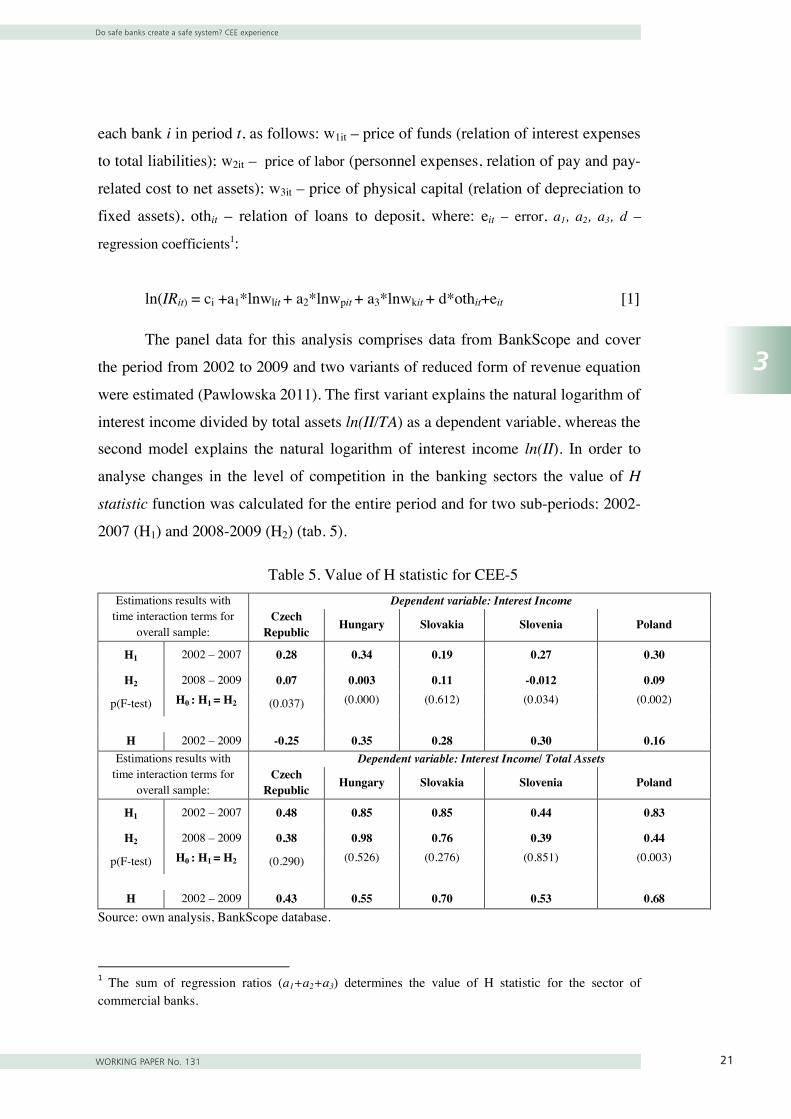
Do safe banks create a safe system? CEE experience
WORKING PAPER No. 131 21
3
21
3.3 Banking market competitive conditions in CEE-5
Anayiotos et al. (2010), researching the relative efficiency of East European banks
using DEA technique, showed that DEA efficiency scores before the recent crisis
were strongly linked to the host country level of development. Miklaszewska and
Mikolajczyk (2011) pointed to the importance of bank home-country governance
model: better results were recorded by banks with headquarters in countries with
shareholder model than with the stakeholder model. Lensink et al. (2008) indicated
that domestic institutional structure did matter for bank efficiency. Thus, assuming
the importance of host county conditions, our next step was to compare the
competitive environment in CEE-5 countries. The level of competition of CEE-5
was evaluated using the H-statistic based on the reduced form of revenue equation of
the firms (Panzar and Rosse 1987, Claessens and Laeven 2004, Yildrim and
Philippatoas 2007, Bikker and Bos 2008).
In order to estimate the H-statistic for the Polish banking sector, we used the
reduced form of revenue equation, where the dependent variable IRit is the natural
logarithm of interest income ln(II)it or the natural logarithm of interest income divided
by total assets ln(II/TA)it of bank i in time t, explanatory variables were defined for
each bank i in period t, as follows: w1it – price of funds (relation of interest expenses
to total liabilities); w2it – price of labor (personnel expenses, relation of pay and pay-
related cost to net assets); w3it – price of physical capital (relation of depreciation to
fixed assets), othit – relation of loans to deposit, where: eit – error, a1, a2, a3, d –
regression coefficients1:
ln(IRit) = ci +a1*lnwlit + a2*lnwpit + a3*lnwkit + d*othit+eit [1]
The panel data for this analysis comprises data from BankScope and cover
the period from 2002 to 2009 and two variants of reduced form of revenue equation
were estimated (Pawlowska 2011). The first variant explains the natural logarithm of
interest income divided by total assets ln(II/TA) as a dependent variable, whereas the
1 The sum of regression ratios (a1+a2+a3) determines the value of H statistic for the sector of commercial banks.
22
second model explains the natural logarithm of interest income ln(II). In order to
analyse changes in the level of competition in the banking sectors the value of H
statistic function was calculated for the entire period and for two sub-periods: 2002-
2007 (H1) and 2008-2009 (H2) (tab. 5).
Table 5. Value of H statistic for CEE-5 Estimations results with
time interaction terms for overall sample:
Dependent variable: Interest Income Czech
Republic Hungary Slovakia Slovenia Poland
H1 2002 – 2007 0.28 0.34 0.19 0.27 0.30
H2 2008 – 2009 0.07 0.003 0.11 -0.012 0.09
p(F-test) H0 : H1 = H2 (0.037) (0.000) (0.612) (0.034) (0.002)
H 2002 – 2009 -0.25 0.35 0.28 0.30 0.16
Estimations results with time interaction terms for
overall sample:
Dependent variable: Interest Income/ Total Assets Czech
Republic Hungary Slovakia Slovenia Poland
H1 2002 – 2007 0.48 0.85 0.85 0.44 0.83
H2 2008 – 2009 0.38 0.98 0.76 0.39 0.44
p(F-test) H0 : H1 = H2 (0.290) (0.526) (0.276) (0.851) (0.003)
H 2002 – 2009 0.43 0.55 0.70 0.53 0.68
Source: own analysis, BankScope database.
The empirical results with respect to the H-statistic in the period 2002-2009,
have shown that the values of H statistics were higher when the dependent variable
was scaled by assets. The results of the empirical analysis demonstrated that
between 2002 and 2007 (before the financial crisis) commercial banks in CEE-5
operated in the environment of monopolistic competition (values of H statistic were
between 0 and 1). By estimating the different regression equations with interaction
terms for two periods, significant changes over time were found for the two sub-
periods in the overall sample, which was confirmed by the test for significance of
the differences between the two periods (H1 = H2) for the Czech Republic, Slovenia,
Hungary and Poland, mainly when dependent variable was based on the natural
logarithm of interest income ln(II).
The level of competition in the Polish banking sector was similar to the euro
zone countries level (Bikker and Spierdijk, 2008). A strong driver for an increase in
21
3.3 Banking market competitive conditions in CEE-5
Anayiotos et al. (2010), researching the relative efficiency of East European banks
using DEA technique, showed that DEA efficiency scores before the recent crisis
were strongly linked to the host country level of development. Miklaszewska and
Mikolajczyk (2011) pointed to the importance of bank home-country governance
model: better results were recorded by banks with headquarters in countries with
shareholder model than with the stakeholder model. Lensink et al. (2008) indicated
that domestic institutional structure did matter for bank efficiency. Thus, assuming
the importance of host county conditions, our next step was to compare the
competitive environment in CEE-5 countries. The level of competition of CEE-5
was evaluated using the H-statistic based on the reduced form of revenue equation of
the firms (Panzar and Rosse 1987, Claessens and Laeven 2004, Yildrim and
Philippatoas 2007, Bikker and Bos 2008).
In order to estimate the H-statistic for the Polish banking sector, we used the
reduced form of revenue equation, where the dependent variable IRit is the natural
logarithm of interest income ln(II)it or the natural logarithm of interest income divided
by total assets ln(II/TA)it of bank i in time t, explanatory variables were defined for
each bank i in period t, as follows: w1it – price of funds (relation of interest expenses
to total liabilities); w2it – price of labor (personnel expenses, relation of pay and pay-
related cost to net assets); w3it – price of physical capital (relation of depreciation to
fixed assets), othit – relation of loans to deposit, where: eit – error, a1, a2, a3, d –
regression coefficients1:
ln(IRit) = ci +a1*lnwlit + a2*lnwpit + a3*lnwkit + d*othit+eit [1]
The panel data for this analysis comprises data from BankScope and cover
the period from 2002 to 2009 and two variants of reduced form of revenue equation
were estimated (Pawlowska 2011). The first variant explains the natural logarithm of
interest income divided by total assets ln(II/TA) as a dependent variable, whereas the
1 The sum of regression ratios (a1+a2+a3) determines the value of H statistic for the sector of commercial banks.
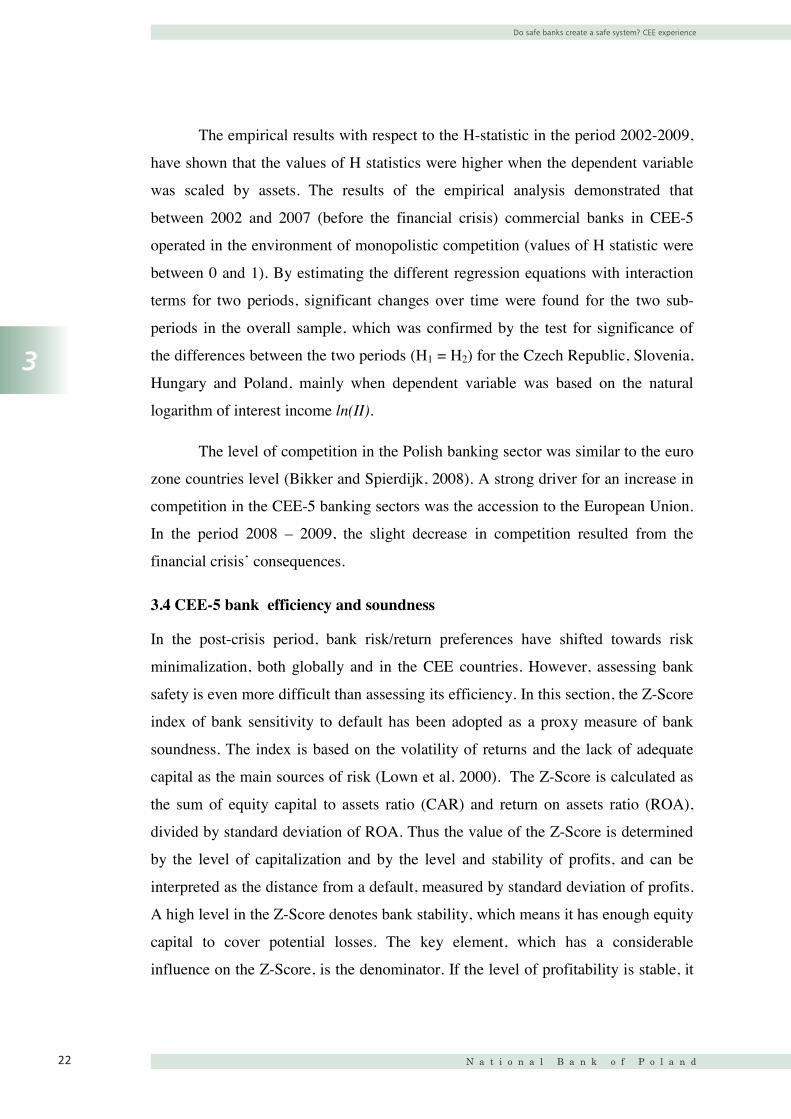
Do safe banks create a safe system? CEE experience
N a t i o n a l B a n k o f P o l a n d22
3
22
second model explains the natural logarithm of interest income ln(II). In order to
analyse changes in the level of competition in the banking sectors the value of H
statistic function was calculated for the entire period and for two sub-periods: 2002-
2007 (H1) and 2008-2009 (H2) (tab. 5).
Table 5. Value of H statistic for CEE-5 Estimations results with
time interaction terms for overall sample:
Dependent variable: Interest Income Czech
Republic Hungary Slovakia Slovenia Poland
H1 2002 – 2007 0.28 0.34 0.19 0.27 0.30
H2 2008 – 2009 0.07 0.003 0.11 -0.012 0.09
p(F-test) H0 : H1 = H2 (0.037) (0.000) (0.612) (0.034) (0.002)
H 2002 – 2009 -0.25 0.35 0.28 0.30 0.16
Estimations results with time interaction terms for
overall sample:
Dependent variable: Interest Income/ Total Assets Czech
Republic Hungary Slovakia Slovenia Poland
H1 2002 – 2007 0.48 0.85 0.85 0.44 0.83
H2 2008 – 2009 0.38 0.98 0.76 0.39 0.44
p(F-test) H0 : H1 = H2 (0.290) (0.526) (0.276) (0.851) (0.003)
H 2002 – 2009 0.43 0.55 0.70 0.53 0.68
Source: own analysis, BankScope database.
The empirical results with respect to the H-statistic in the period 2002-2009,
have shown that the values of H statistics were higher when the dependent variable
was scaled by assets. The results of the empirical analysis demonstrated that
between 2002 and 2007 (before the financial crisis) commercial banks in CEE-5
operated in the environment of monopolistic competition (values of H statistic were
between 0 and 1). By estimating the different regression equations with interaction
terms for two periods, significant changes over time were found for the two sub-
periods in the overall sample, which was confirmed by the test for significance of
the differences between the two periods (H1 = H2) for the Czech Republic, Slovenia,
Hungary and Poland, mainly when dependent variable was based on the natural
logarithm of interest income ln(II).
The level of competition in the Polish banking sector was similar to the euro
zone countries level (Bikker and Spierdijk, 2008). A strong driver for an increase in
23
competition in the CEE-5 banking sectors was the accession to the European Union.
In the period 2008 – 2009, the slight decrease in competition resulted from the
financial crisis’ consequences.
3.4 CEE-5 bank efficiency and soundness
In the post-crisis period, bank risk/return preferences have shifted towards risk
minimalization, both globally and in the CEE countries. However, assessing bank
safety is even more difficult than assessing its efficiency. In this section, the Z-Score
index of bank sensitivity to default has been adopted as a proxy measure of bank
soundness. The index is based on the volatility of returns and the lack of adequate
capital as the main sources of risk (Lown et al. 2000). The Z-Score is calculated as
the sum of equity capital to assets ratio (CAR) and return on assets ratio (ROA),
divided by standard deviation of ROA. Thus the value of the Z-Score is determined
by the level of capitalization and by the level and stability of profits, and can be
interpreted as the distance from a default, measured by standard deviation of profits.
A high level in the Z-Score denotes bank stability, which means it has enough equity
capital to cover potential losses. The key element, which has a considerable
influence on the Z-Score, is the denominator. If the level of profitability is stable, it
contributes to the high value of the index, but during unstable times (increase or
decrease in profits) it causes a sudden decline in the Z-Score.
In this section the Z-Score is calculated in two different ways. Firstly, standard
deviation of ROA is calculated for the whole 2004-2010 period and the denominator
of the Z-Score formula is constant. That allows to express the impact of the value of
ROA and CAR, the volatility of profits averaging for the whole period (fig. 5a)
2
, ;
7.
However, in order to analyze the impact of growing instability on financial markets
after 2007, the average Z-Score was also calculated in 3 year rolling windows,
starting from 2004-2006 period and terminating in 2008-2010 (fig. 5b).
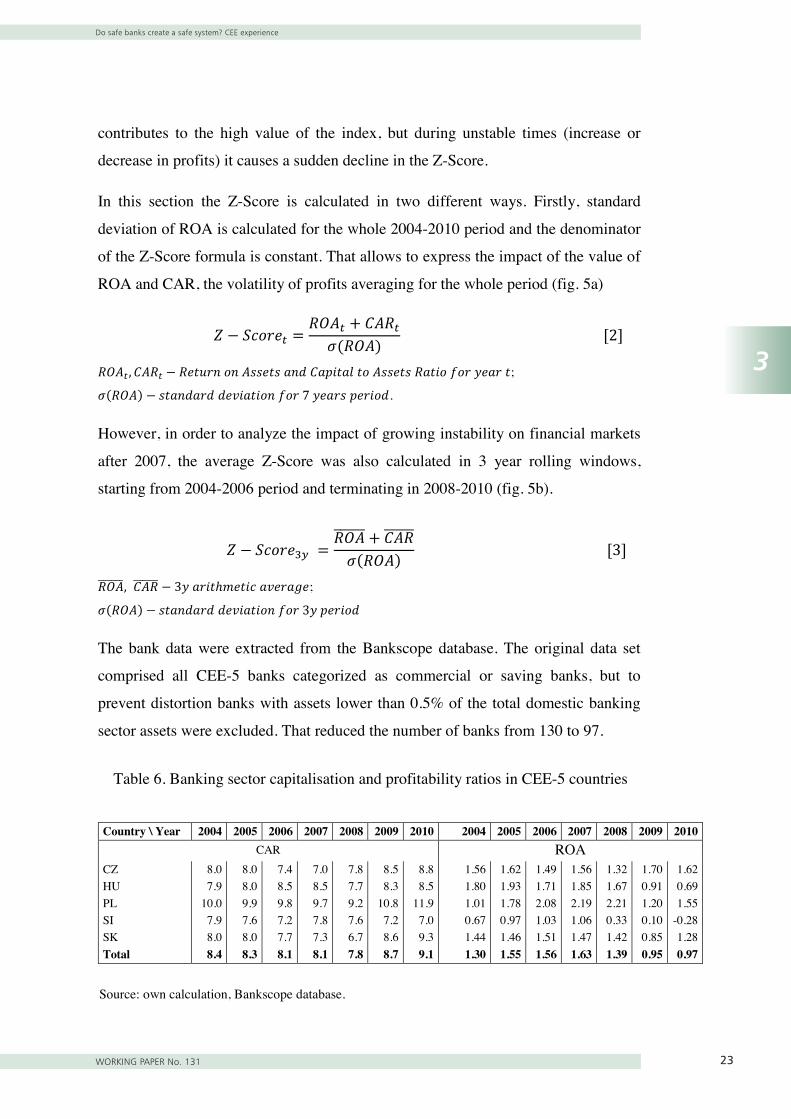
Do safe banks create a safe system? CEE experience
WORKING PAPER No. 131 23
3
23
competition in the CEE-5 banking sectors was the accession to the European Union.
In the period 2008 – 2009, the slight decrease in competition resulted from the
financial crisis’ consequences.
3.4 CEE-5 bank efficiency and soundness
In the post-crisis period, bank risk/return preferences have shifted towards risk
minimalization, both globally and in the CEE countries. However, assessing bank
safety is even more difficult than assessing its efficiency. In this section, the Z-Score
index of bank sensitivity to default has been adopted as a proxy measure of bank
soundness. The index is based on the volatility of returns and the lack of adequate
capital as the main sources of risk (Lown et al. 2000). The Z-Score is calculated as
the sum of equity capital to assets ratio (CAR) and return on assets ratio (ROA),
divided by standard deviation of ROA. Thus the value of the Z-Score is determined
by the level of capitalization and by the level and stability of profits, and can be
interpreted as the distance from a default, measured by standard deviation of profits.
A high level in the Z-Score denotes bank stability, which means it has enough equity
capital to cover potential losses. The key element, which has a considerable
influence on the Z-Score, is the denominator. If the level of profitability is stable, it
contributes to the high value of the index, but during unstable times (increase or
decrease in profits) it causes a sudden decline in the Z-Score.
In this section the Z-Score is calculated in two different ways. Firstly, standard
deviation of ROA is calculated for the whole 2004-2010 period and the denominator
of the Z-Score formula is constant. That allows to express the impact of the value of
ROA and CAR, the volatility of profits averaging for the whole period (fig. 5a)
2
, ;
7.
However, in order to analyze the impact of growing instability on financial markets
after 2007, the average Z-Score was also calculated in 3 year rolling windows,
starting from 2004-2006 period and terminating in 2008-2010 (fig. 5b).
24
3
, 3;
3
The bank data were extracted from the Bankscope database. The original data set
comprised all CEE-5 banks categorized as commercial or saving banks, but to
prevent distortion banks with assets lower than 0.5% of the total domestic banking
sector assets were excluded. That reduced the number of banks from 130 to 97.
Table 6. Banking sector capitalisation and profitability ratios in CEE-5 countries
Country \ Year 2004 2005 2006 2007 2008 2009 2010 2004 2005 2006 2007 2008 2009 2010CAR ROA
CZ 8.0 8.0 7.4 7.0 7.8 8.5 8.8 1.56 1.62 1.49 1.56 1.32 1.70 1.62HU 7.9 8.0 8.5 8.5 7.7 8.3 8.5 1.80 1.93 1.71 1.85 1.67 0.91 0.69PL 10.0 9.9 9.8 9.7 9.2 10.8 11.9 1.01 1.78 2.08 2.19 2.21 1.20 1.55SI 7.9 7.6 7.2 7.8 7.6 7.2 7.0 0.67 0.97 1.03 1.06 0.33 0.10 -0.28SK 8.0 8.0 7.7 7.3 6.7 8.6 9.3 1.44 1.46 1.51 1.47 1.42 0.85 1.28Total 8.4 8.3 8.1 8.1 7.8 8.7 9.1 1.30 1.55 1.56 1.63 1.39 0.95 0.97
Source: own calculation, Bankscope database.
Figure 5. Z-Score for banks in CEE-5 countries
a) calculated for the whole period b) averaged for 3 years rolling windows
Source: own calculation, Bankscope database.
0
10
20
30
40
50
2004
2005
2006
2007
2008
2009
2010
020406080
100120140160180
2004
-200
6
2005
-200
7
2006
-200
8
2007
-200
9
2008
-201
0
CZHUPLSISK
Do safe banks create a safe system? CEE experience
N a t i o n a l B a n k o f P o l a n d24
3
24
3
, 3;
3
The bank data were extracted from the Bankscope database. The original data set
comprised all CEE-5 banks categorized as commercial or saving banks, but to
prevent distortion banks with assets lower than 0.5% of the total domestic banking
sector assets were excluded. That reduced the number of banks from 130 to 97.
Table 6. Banking sector capitalisation and profitability ratios in CEE-5 countries
Country \ Year 2004 2005 2006 2007 2008 2009 2010 2004 2005 2006 2007 2008 2009 2010CAR ROA
CZ 8.0 8.0 7.4 7.0 7.8 8.5 8.8 1.56 1.62 1.49 1.56 1.32 1.70 1.62HU 7.9 8.0 8.5 8.5 7.7 8.3 8.5 1.80 1.93 1.71 1.85 1.67 0.91 0.69PL 10.0 9.9 9.8 9.7 9.2 10.8 11.9 1.01 1.78 2.08 2.19 2.21 1.20 1.55SI 7.9 7.6 7.2 7.8 7.6 7.2 7.0 0.67 0.97 1.03 1.06 0.33 0.10 -0.28SK 8.0 8.0 7.7 7.3 6.7 8.6 9.3 1.44 1.46 1.51 1.47 1.42 0.85 1.28Total 8.4 8.3 8.1 8.1 7.8 8.7 9.1 1.30 1.55 1.56 1.63 1.39 0.95 0.97
Source: own calculation, Bankscope database.
Figure 5. Z-Score for banks in CEE-5 countries
a) calculated for the whole period b) averaged for 3 years rolling windows
Source: own calculation, Bankscope database.
0
10
20
30
40
50
2004
2005
2006
2007
2008
2009
2010
020406080
100120140160180
2004
-200
6
2005
-200
7
2006
-200
8
2007
-200
9
2008
-201
0
CZHUPLSISK
25
When the volatility of profits was flattened for the 7 year period, the value of Z-
Score slowly decreased, on average from 31 to 26 in 2008, and then slightly
increased to 29 in 2010. This resulted from changes in capital ratio, which
diminished till 2008, and then substantially rose, well above the pre-crisis level in all
countries but Slovenia. Poland recorded high bank capitalization and profitability in
2006-2008 period, however it was accompanied by high volatility of ROA, and
consequently Z-Score between 20-25 was much lower than in the Czech Republic
and Slovakia, and similar to Slovenia, where banks had the lowest ROA in CEE-5
region and also low CAR value (tab.6). Calculating the Z-Score in 3 year rolling
windows resulted in its much higher values, particularly in the Czech Republic and
Slovakia in the pre-crisis period. The steepest fall of the Z-Score was in Slovakia,
from 160 to 46, the lowest level, below 30, was in Hungary. Thus our results
indicate a sharp decline in bank safety in CEE-5 countries in 2007-2009 period,
triggered by the crisis. Its main reason was not so much a fall in profitability, which
remained much higher than in most developed economies, but the high volatility of
ROA, resulting from the excessive profitability in pre-crisis period. The
reinvestment of bank profits after 2008 resulted in the increase of the Z-Score in the
period 2008-2010.
New European supervisory architecture and CEE-5 banks: summary of results
WORKING PAPER No. 131 25
4
26
4. New European supervisory architecture and CEE-5 banks: summary of results
This paper presents an analysis of the possible impact of a new post-crisis regulatory
architecture on CEE-5 banks. Economic theory provides some contrasting evidence
as to the impact of bank regulation and supervision on bank performance (e.g. Barth
et al. 2004, 2008 and 2010). Furthermore, as noted by Chortareas et al. (2011), most
research in this area concentrates on banking markets in highly developed countries.
A recent paper by Delis et al. (2011) provides some evidence on the link between
regulation and supervision and bank efficiency from transition economies, which
suggest a negative short term impact. In our paper, the focus has been more on the
longer-term regulatory impact for CEE5 banks.
From the data presented in the empirical part of the paper, it is evident that the 2007-
2009 crisis affected CEE banks to a lesser degree than those in highly developed
countries, although a short-term bank efficiency loss was evident. CEE banks
entered the crisis in good shape, after their successful restructuring in the 1990s and
high economic growth following EU accession. Because of the high profitability
generated by the traditional bank intermediary model, many global risk areas had not
yet developed there, with the result that during the crisis they required less
restructuring than did their global owners. The CEE-5 banks emerged from the 2008
crisis relatively unscathed and not in need of fundamental restructuring. Banking
sector assets in CEE-5 countries have remained relatively small as a percentage of
their GDPs and bank concentration is low, with a resulting low threat of systemic
risk. During the crisis, their global owners behaved responsibly, restraining from
bank decapitalization, although M&A did intensify as a result of restructuring
carried out by bank owners. Market stability, as measured by Z-score index,
decreased initially both for all CEE banking sectors and for the top three banks in
each CEE-5 country, although this trend was reversed during the 2008-2010 period.
It can be concluded that in CEE, strong banks create sound systems, which have
survived the global financial crisis relatively well.
27
In the light of the 2008 crisis, the traditional business model of banking
intermediation, which dominates in Central and Eastern Europe, turned out to be the
safest, although one must be careful not to overstate the virtues of traditional
banking, as this may adversely affect long term growth, which is based on
innovation and risk taking. Nevertheless, CEE banks will have no choice but to
participate in the new European regulatory and supervisory architecture, centered on
the prevention of systemic risk posed by large global banks, at the expense of bank
risk taking, while for CEE-5 banks credit market growth and the introduction of
financial innovations, both based on risk-taking, are of fundamental importance.
Thus the macro-prudential pillar of the new European supervisory architecture
constitutes rather a burden for CEE banks. The assessment of the impact of the
micro-prudential pillar (the EBA) is more ambiguous (Basel Committee on Banking
Supervision, 2010; European Parliament 2011). For countries with a very strong
presence of foreign capital, the role and competencies of the host supervisors are
vital and the EBA coordinating mandate may undermine it. On the other hand,
harmonization of regulatory standards and enhancement of market transparency
should be universally beneficial, also for CEE banks. However, EBA so far had a
limited powers over national supervisors and was unable to deal with “too big to
fail” problem. The newest EU proposals of creating Banking Union is a step to deal
with this issue, by giving strong supervisory powers to ECB and creating a
mechanism of shared bank rescue burden for the euro zone members. However, this
is a step in new direction, changing and weakening the current European supervisory
structure, before it managed to demonstrate its performance. Moreover, instead of
weakening big banks, it will create another rescue vehicle for them. For CEE, with
small and competitive banking sectors, it will create another mechanism for their
marginalization.
New European supervisory architecture and CEE-5 banks: summary of results
N a t i o n a l B a n k o f P o l a n d26
4
27
In the light of the 2008 crisis, the traditional business model of banking
intermediation, which dominates in Central and Eastern Europe, turned out to be the
safest, although one must be careful not to overstate the virtues of traditional
banking, as this may adversely affect long term growth, which is based on
innovation and risk taking. Nevertheless, CEE banks will have no choice but to
participate in the new European regulatory and supervisory architecture, centered on
the prevention of systemic risk posed by large global banks, at the expense of bank
risk taking, while for CEE-5 banks credit market growth and the introduction of
financial innovations, both based on risk-taking, are of fundamental importance.
Thus the macro-prudential pillar of the new European supervisory architecture
constitutes rather a burden for CEE banks. The assessment of the impact of the
micro-prudential pillar (the EBA) is more ambiguous (Basel Committee on Banking
Supervision, 2010; European Parliament 2011). For countries with a very strong
presence of foreign capital, the role and competencies of the host supervisors are
vital and the EBA coordinating mandate may undermine it. On the other hand,
harmonization of regulatory standards and enhancement of market transparency
should be universally beneficial, also for CEE banks. However, EBA so far had a
limited powers over national supervisors and was unable to deal with “too big to
fail” problem. The newest EU proposals of creating Banking Union is a step to deal
with this issue, by giving strong supervisory powers to ECB and creating a
mechanism of shared bank rescue burden for the euro zone members. However, this
is a step in new direction, changing and weakening the current European supervisory
structure, before it managed to demonstrate its performance. Moreover, instead of
weakening big banks, it will create another rescue vehicle for them. For CEE, with
small and competitive banking sectors, it will create another mechanism for their
marginalization.
Conclusions
WORKING PAPER No. 131 27
5
28
5. Conclusions
This paper analyses whether the new European regulatory and supervisory
architecture, based on a relatively complex institutional framework, will provide
more efficient supervision in the EU, thus contributing to market stability and
economic growth. In assessing the cumulative effect of the new European
supervisory architecture, we may conclude that it is based on a restrictive regulatory
system, complex and costly, which includes many new institutions accentuating
stability at the expense of market efficiency and growth. For home countries, the
benefits of the new regulations may well outweigh their costs, particularly for
countries with large banks which pose a systemic risk. For host countries in CEE,
with small, traditionally oriented banks, the opposite may be true. Their pre- and
post-crisis experience support the assertion that strong banks, following healthy
business models and operating in a competitive market structure, create a sound
banking system.
Literature
N a t i o n a l B a n k o f P o l a n d28
29
Literature
Acharya, V., Cooley, T., Richardson, M. P., Walter, I., 2011. Regulating Wall
Street: The Dodd-Frank Act and the new architecture of global finance. Wiley,
New Jersey.
Acharya, V., Wachtel, P., Walter, I., 2009. International alignments of financial
sector regulation. In: Acharya, V., Richardson, M. P. (Eds.), Restoring financial
stability: How to repair a failed system. Wiley, Hoboken, New Jersey.
Allen, F., Babus, A., Carletti, E., 2009. Financial crises: Theory and evidence.
Annual Review of Financial Economics 1, 97-116.
Allen F., Back T., Carletti E., Lane P.R., Schoenmaker D. Wagner W., 2011. Cross-
border banking in Europe: Implications for financial stability and macroeconomic
policies. CEPR, London.
Anayiotos, G., Toroyan, H., Vamvakidis, A., 2010. The efficiency of emerging
Europe’s banking sector before and after the recent economic crisis. Financial
Theory and Practice 34 (3), 247-267.
Apinis, M., Bodzioch, M., Csongradi, E., Filipova, T., Foit, Z., Kotkas, J., Porzycki,
M., Vetrak, M., 2010. The role of national central banks in banking supervision
in selected Central and Eastern European countries, ECB Legal Working Paper
Series 11. Frankfurt.
Banker R. D, A. Charnes, W.W. Cooper, 1984. Some Models for Estimating
Technical and Scale Inefficiencies in Data Envelopment Analysis, Management
Science, vol 30, s. 92-1078.
Barth .J.R.., Capiro, G., Levine, R., 2004. Bank regulation and supervision: what
works best? Journal of Financial Intermediation 13, 205-248.
Barth, J.R., Caprio G., Levine R., 2008. Bank regulations are changing: For better or
worse? Comparative Economic Studies 50, 537-563.
Literature
WORKING PAPER No. 131 2930
Barth, J.R., Lin, C., Ma, Y., Seade, J., Song, F.M., 2010. Do bank regulation,
supervision and monitoring enhance or impede bank efficiency? Available from:
http://papers.ssrn.com/sol3/papers.cfm?abstract_id=1579352.
Basel Committee on Banking Supervision, 2010. An assessment of the long-term
economic impact of stronger capital and liquidity requirements. Available from:
<http://www.bis.org/publ/bcbs173.htm>.
Beck, T., 2010. Regulatory reform after the crisis: Opportunities and pitfalls. CEPR
Discussion Paper 7733.
Berger, A.N., Humphrey, D.B., 1997. Efficiency of financial institutions:
International survey and directions for future research. European Journal of
Operational Research 98 (2), 175-212.
Bikker, J., Bos, J., 2008. Bank performance. A theoretical and empircal framework
for the analysis of profitability. Competition and Efficiency, Routledge, London.
Bikker, J., Spierdijk L., 2008. How banking competition changed over time. DNB
Working paper 167.
BIS, 2010. The Basel Committee’s response to the financial crisis. Report to the
G20, Basel. Available from:
<http://ec.europa.eu/internal_market/consultations/2009/fin_supervision_may_
en.htm>.
Brown, M., De Haas, R., 2011. Foreign currency lending in Emerging Europe:
Bank-level evidence. Paper for the 54th Panel Meeting of Economic Policy.
CEBS Annual Report 2010. Available from: <http://www.eba.europa.eu/>.
Charnes, A., Cooper, W., Golany, W., Seiford, B., Lewin, A.Y., 1997. Data
envelopment analysis, theory, methodology and applications. Kluwer Academic
Publishers, Boston.
Charnes, A., Cooper, W., Rhodes, A., 1978. Measuring the efficiency of decision
making units. European Journal of Operational Research 2 (6), 429-444.
Literature
N a t i o n a l B a n k o f P o l a n d3031
Chortareas, G.E., Girardone, C., Ventouri, A., 2011. Bank supervision, regulation,
and efficiency: Evidence from the European Union. Journal of Financial Stability.
DOI:10.1016/j.jfs.2011.12.001.
Claessens, P., Laeven, L., 2004. What drives bank competition? Same international
evidence. Journal of Money, Credit, and Banking 36 (3), 564-583.
Delis, M., Molyneux, P., Pasiouras, F., 2011. Regulations and productivity growth
in banking: Evidence from transition economies. Journal of Money, Credit and
Banking 43(4), 735-764.
Demirgüç-Kunt, A., Huizinga, H., 2009. Bank activity and funding strategies: The
impact on risk and return. CEPR Discussion Paper 7170.
Demirgüç-Kunt A., Huizinga H., 2011. Do we need big banks? Evidence on
performance, strategy and market discipline. CEPR Discussion Paper 8276.
EBA, 2011. Board of Supervisors. Available from:
<http://www.eba.europa.eu/Aboutus/Organisation/Board-of-
Supervisors/Members-and-Observers.aspx>.
EBRD, 2010. Transition Report. London.
ECB, 2005-2009. EU Banking Sector Stability Reports. Frankfurt.
ECB, 2010. EU Banking Structures. Frankfurt.
Ernst &Young, 2007. European Attractiveness Survey. Available from:
<www.ey.com/attractiveness>.
European Parliament, DG for Internal Policies, 2011. Cumulative assessment of the
impact of various regulatory initiatives on the European banking sector. DG for
Internal Policies. Available from: <http://www.europarl.europa.eu>.
Giovannini, A., 2010. Financial system reform proposals from first principles.
CEPR Policy Insight 4.
Literature
WORKING PAPER No. 131 3132
Grigorian, D.A., Manole, V., 2002. Determinants of commercial bank performance
in transition: An application of data envelopment analysis. IMF Working Paper 2
(146).
IMF, 2010a. Global Financial Stability Report, Washington, DC.
IMF, 2010b. IMF Survey Magazine: Countries & Regions. Available from:
<www.imf.org/external/pubs/ft/ survey/so/2009/INT011409A.htm>.
Kuppens T., Prast H., Wesseling S., 2003. Banking supervision at the crossroads.
Edward Elgar Publishing, Cheltenham.
Lensink, R., Meesters, A., Naaborg, I., 2008. Bank efficiency and foreign
ownership: Do good institutions matter? Journal of Banking and Finance 32, 834-
844.
Lízal, L., 2011. Financial Stability and Regulatory Responsibility. 17th Baltic
Financial Forum. Available from: < http://www.cnb.cz>.
Lown, C., Osler, C., Stragan, P., Sufi, A., 2000. The changing landscape of the
financial services industry: What lies ahead? FRB NY Economic Policy Review
11.
Masciandaro, D., Quintyn, M., 2008. Helping hand or grabbing hand? Politicians,
supervision regime financial structure and market view. North American Journal
of Economics and Finance 19 (2), 153-173.
Masciandaro, D., Nieto, M.J., Quintyn, M., 2009a. Will they sing the same tune?
Measuring convergence in the new European system of financial supervisor.
IMF CEPR Policy Insight 37.
Masciandaro, D., Nieto, M., Quintyn, M., 2009b. Financial supervision in the EU.
Is there convergence in the national architecture? Journal of Financial Regulation
and Compliance 17 (2), 86-92.
Literature
N a t i o n a l B a n k o f P o l a n d3233
Masciandaro, D., Nieto, M. Quintyn, M., 2011. Exploring governance of the new
European Banking Authority – A case for harmonization? Journal of Financial
Stability 7, 204-214.
Masciandaro, D., 2011. Reforming regulation and supervision in Europe: Five
missing lessons from the financial crisis. Paolo Baffi Centre Research Paper
2011-89. Available from: <http://ssrn.com/abstract=1825823> or
<http://dx.doi.org/10.2139/ssrn.1825823>.
Masera, R., 2009. Enhancing European supervision. Paper at the conference:
Towards a new supervisory architecture in Europe. European Parliament,
Bruxelles.
Masera, R., 2010. Reforming financial systems after the crisis: a comparison of EU
and USA. PSL Quarterly Review 63 (255), 299-362.
Miklaszewska, E., Mikolajczyk, K., 2011. Foreign banks in Central Eastern Europe:
Impact of foreign governance on bank performance. In: Molyneux, P. (Eds.), Bank
performance, risk and firm financing. Palgrave Macmillan, Basingstoke, 55-82.
Naaborg, I.J., 2007. Foreign bank entry and performance with a focus on Central and
Eastern Europe. Rijksuniversiteit, Groningen. Available from:
<http://dissertations.ub.rug.nl/FILES/faculties/eco/2007/i.j.naaborg/11_thesis.pdf>
Naaborg, I, Lensink, R., 2008. Banking in transition economies: Does foreign
ownership enhance profitability? European Journal of Finance 14, 545–62.
Nier, E., 2010. On the governance of macroprudential policies. FRB Chicago 13th
International Banking Conference.
Panzar, J.C., Rosse, J.N., 1987. Testing for “monopoly” equilibrium. Journal of
Industrial Economics 35, 443–456.
Pawlowska, M., 2011. Competition in the Polish banking market prior to the recent
crisis - empirical results obtained with the use of three different models for the
period 1997-2007. Bank i Kredyt 5, 5-40.
Literature
WORKING PAPER No. 131 3334
Raiffeisen Research, 2011. CEE Banking Sector Report.
The Bank of England and Prudential Regulation Authority, 2011. Our Approach to
Banking Supervision, BoE and FSA. Available from: <http://www.fsa.gov.uk>.
The Banker, 2010. Top 1000 World Banks: 2010 Results,
www.thebankierdatabase.com.
The Economist, 2006. A Survey of International Banking: Thinking Big, 18 May.
UniCredit Group, 2010. CEE Strategic Analysis, CEE Research.
World Economic Forum Report (2010). The Future of the Global Financial System:
Navigating the Challenges Ahead.
Yildirim, H.P., Philippatos, G.C., 2007. Competition and contestability in Central
and Eastern European banking markets. Managerial Finance 33(3), 195–209.