NATIONAL BANK OF GREECE Strategic Planning & Research · NATIONAL BANK OF GREECE Strategic Planning...
33
NATIONAL BANK OF GREECE Strategic Planning & Research July 2012 Paul Mylonas General Manager Strategy & International Operations, Chief Economist for the Group Andreas Athanasopoulos General Manager Retail Banking
Transcript of NATIONAL BANK OF GREECE Strategic Planning & Research · NATIONAL BANK OF GREECE Strategic Planning...
NATIONAL BANK OF GREECE
Strategic Planning & Research
July 2012
Paul Mylonas
General Manager Strategy &
International Operations,
Chief Economist for the Group
Andreas Athanasopoulos
General Manager Retail Banking
2
While small and medium-sized enterprises (SMEs) are a vital component of the Greek business sector,
knowledge of their structure and dynamics is limited.
This survey aims at filling part of that gap. In view of the lack of published data, this analysis is based
mainly on data drawn from a sample of almost 1,000 enterprises.
Both the structure of our questionnaire and the construction of the business confidence indices were
based on European Commission and OECD harmonized questionnaire standards, in order to: i) achieve
maximum reliability and predictability of indices; and ii) enable comparability with confidence indices
for the business sector as a whole in Greece (such as IOBE indices) and Europe (e.g., those of the EC).
This survey will be carried out each semester so as to form a clear picture of the SMEs’ course over time
(as reflected in the business confidence index).
In this phase of the survey, a cross-section comparison of the indices offers some useful insights into
the growth potential, as well as the inherent challenges faced by SMEs:
Very small enterprises appear to be weakening and this business segment is contracting.
The main problem for SMEs at present is their lack of access to credit, largely reflecting the
substantial reduction in trade credit.
However, using an ordered probit model, we discern a subset of SMEs that remains healthy and
oriented mainly to external markets and new products.
Accordingly, policy regarding SMEs needs to be structured around three core targets:
Reducing operating costs
Enhancing liquidity
Enhancing sales
In brief
Table of contents
3
Introduction: SMEs’ position in the market
NBG’s Survey of Greek SMEs
Methodology
Key findings
Variations by size and sector
The outlook for Greek SMEs
SMEs with growth prospects
Policy directions
Annex: Survey ID
5
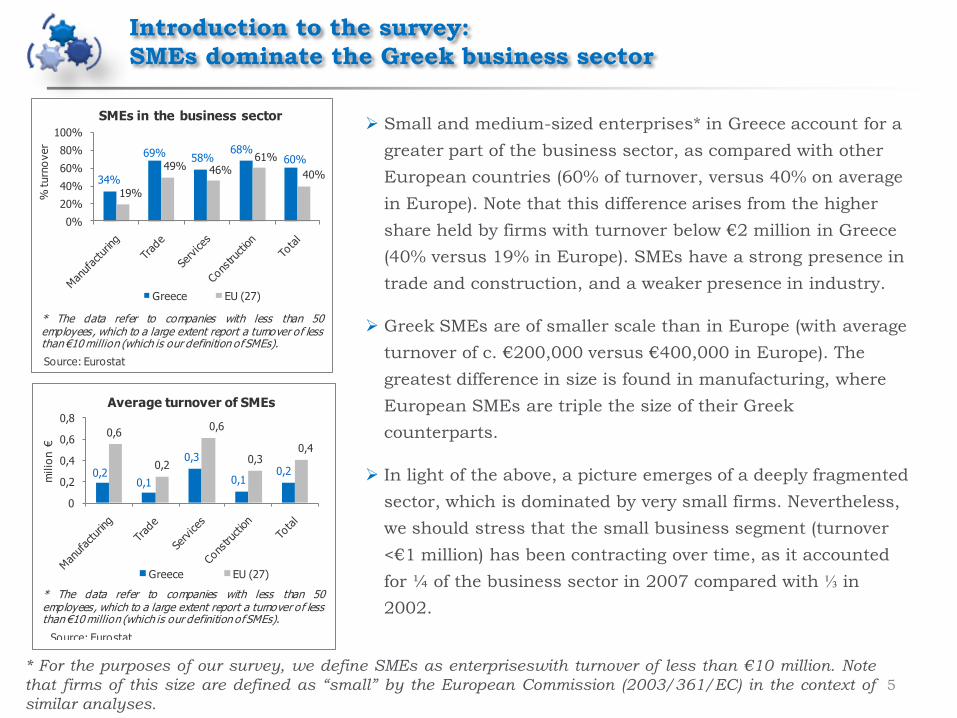
Small and medium-sized enterprises* in Greece account for a
greater part of the business sector, as compared with other
European countries (60% of turnover, versus 40% on average
in Europe). Note that this difference arises from the higher
share held by firms with turnover below €2 million in Greece
(40% versus 19% in Europe). SMEs have a strong presence in
trade and construction, and a weaker presence in industry.
Greek SMEs are of smaller scale than in Europe (with average
turnover of c. €200,000 versus €400,000 in Europe). The
greatest difference in size is found in manufacturing, where
European SMEs are triple the size of their Greek
counterparts.
In light of the above, a picture emerges of a deeply fragmented
sector, which is dominated by very small firms. Nevertheless,
we should stress that the small business segment (turnover
<€1 million) has been contracting over time, as it accounted
for ¼ of the business sector in 2007 compared with ⅓ in
2002.
Introduction to the survey:
SMEs dominate the Greek business sector
* For the purposes of our survey, we define SMEs as enterpriseswith turnover of less than €10 million. Note
that firms of this size are defined as “small” by the European Commission (2003/361/EC) in the context of
similar analyses.
0,20,1
0,3
0,10,2
0,6
0,2
0,6
0,30,4
0
0,2
0,4
0,6
0,8
milio
n €
Average turnover of SMEs
Greece EU (27)
Source: Eurostat
* The data refer to companies with less than 50employees, which to a large extent report a turnover of lessthan €10 million (which is our definition ofSMEs).
34%
69% 58%68%
60%
19%
49% 46%61%
40%
0%
20%
40%
60%
80%
100%
% turn
over
SMEs in the business sector
Greece EU (27)
Source: Eurostat
* The data refer to companies with less than 50employees, which to a large extent report a turnover of lessthan €10 million (which is our definition ofSMEs).

Half of SMEs turnover derives from small firms and half from
medium-sized firms
6
The approximately 750,000 SMEs in Greece generate turnover of around €150 billion.
4/5 of SMEs are sole proprietorships, which account for a corresponding share of the total domestic
business sector (compared with just ½ of the business sector in Europe).
Although sole proprietorships comprise the majority of SMEs, the greater share of turnover (over 60%) is
produced by companies of various legal status (SA, limited partnership, limited liability, etc.).
Number of SMEs
747,800 firms
Sole proprietorships
79%
Companies
21%
Small
78%
Medium
1%
Small
18%
Medium
3%
* For the purposes of the survey, small enterprises are those reporting turnover of less than €1 million and medium-sized
enterprises are those reporting turnover of between €1 million and €10 million.
Turnover of SMEs
€150 billion
Sole proprietorships
38%
Companies
62%
Small
32%
Medium
6%
Small
18%
Medium
44%
* For the purposes of the survey, small enterprises are those reporting turnover of less than €1 million and medium-sized
enterprises are those reporting turnover of between €1 million and €10 million.
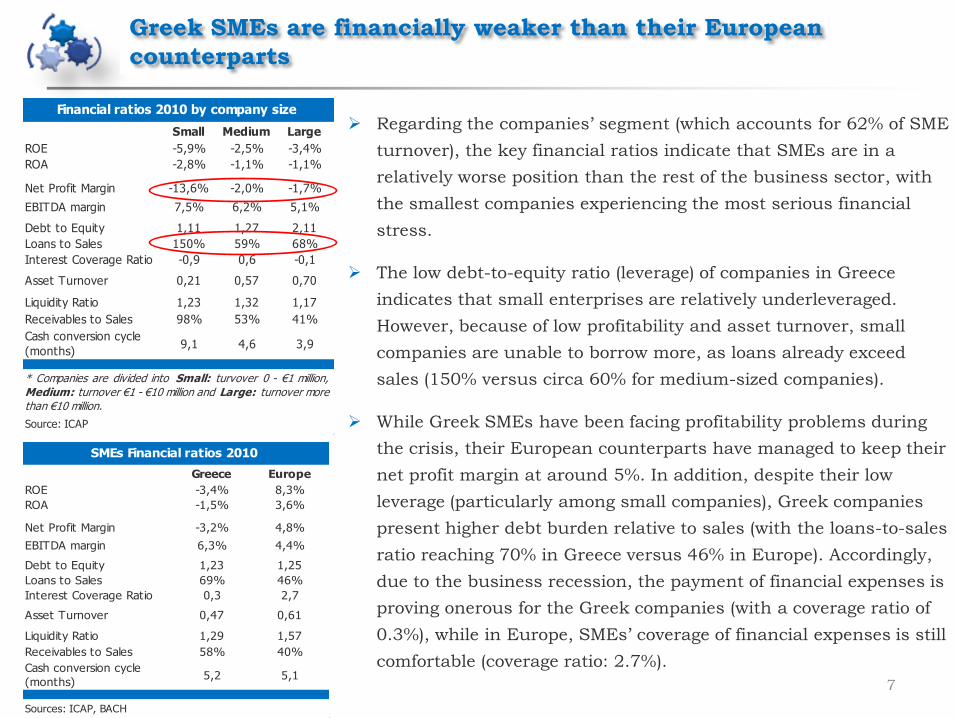
Greek SMEs are financially weaker than their European
counterparts
7
Regarding the companies’ segment (which accounts for 62% of SME
turnover), the key financial ratios indicate that SMEs are in a
relatively worse position than the rest of the business sector, with
the smallest companies experiencing the most serious financial
stress.
The low debt-to-equity ratio (leverage) of companies in Greece
indicates that small enterprises are relatively underleveraged.
However, because of low profitability and asset turnover, small
companies are unable to borrow more, as loans already exceed
sales (150% versus circa 60% for medium-sized companies).
While Greek SMEs have been facing profitability problems during
the crisis, their European counterparts have managed to keep their
net profit margin at around 5%. In addition, despite their low
leverage (particularly among small companies), Greek companies
present higher debt burden relative to sales (with the loans-to-sales
ratio reaching 70% in Greece versus 46% in Europe). Accordingly,
due to the business recession, the payment of financial expenses is
proving onerous for the Greek companies (with a coverage ratio of
0.3%), while in Europe, SMEs’ coverage of financial expenses is still
comfortable (coverage ratio: 2.7%).
Small Medium Large
ROE -5,9% -2,5% -3,4%
ROA -2,8% -1,1% -1,1%
Net Profit Margin -13,6% -2,0% -1,7%
EBITDA margin 7,5% 6,2% 5,1%
Debt to Equity 1,11 1,27 2,11
Loans to Sales 150% 59% 68%
Interest Coverage Ratio -0,9 0,6 -0,1
Asset Turnover 0,21 0,57 0,70
Liquidity Ratio 1,23 1,32 1,17
Receivables to Sales 98% 53% 41%
Cash conversion cycle
(months)9,1 4,6 3,9
Source: ICAP
Financial ratios 2010 by company size
* Companies are divided into Small: turvover 0 - €1 million,Medium: turnover €1 - €10 million and Large: turnover more than €10 million.
Greece Europe
ROE -3,4% 8,3%
ROA -1,5% 3,6%
Net Profit Margin -3,2% 4,8%
EBITDA margin 6,3% 4,4%
Debt to Equity 1,23 1,25
Loans to Sales 69% 46%
Interest Coverage Ratio 0,3 2,7
Asset Turnover 0,47 0,61
Liquidity Ratio 1,29 1,57
Receivables to Sales 58% 40%
Cash conversion cycle
(months)5,2 5,1
Sources: ICAP, BACH
SMEs Financial ratios 2010

8
Small enterprises have been more severely hit in terms of business and profits.
In addition, the increase of the cash conversion cycle* and the reduced ability to cover financial expenses
has served to increase SMEs’ needs for working capital.
The first basic problem of SMEs: Small companies have been
more severely hit by the crisis…
-30%
-20%
-10%
0%
10%
20%
2007 2008 2009 2010 2011
Growth rate of turnover
by company size
Small Medium Large
Source: ICAP
-30%
-20%
-10%
0%
10%
2007 2008 2009 2010 2011
Net profit margin by company size
Small Medium Large
Source: ICAP
-2
0
2
4
2007 2008 2009 2010 2011
Interest coverage ratio by company size
Small Medium Large
Source: ICAP
0
2
4
6
8
10
12
2007 2008 2009 2010 2011
Mo
nth
s
Cash conversion cycleby company size
Small Medium Large
Source: ICAP
* The cash conversion cycle is a liquidity measure which refers to the time span
between a company’s collecting and disbursing cash (higher cycle means slower
collection).
9
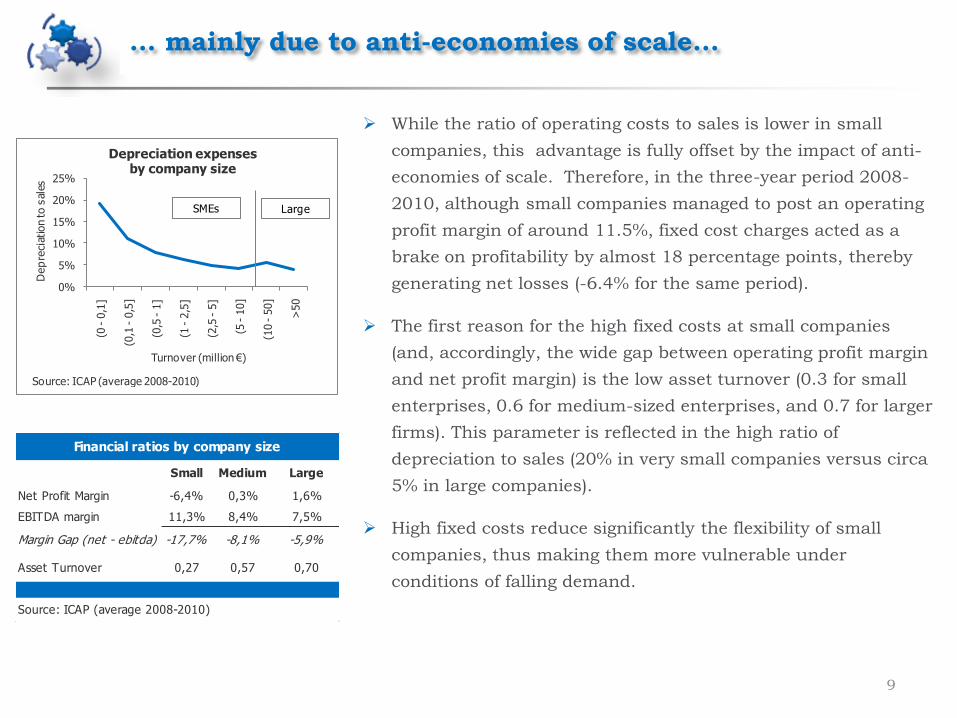
While the ratio of operating costs to sales is lower in small
companies, this advantage is fully offset by the impact of anti-
economies of scale. Therefore, in the three-year period 2008-
2010, although small companies managed to post an operating
profit margin of around 11.5%, fixed cost charges acted as a
brake on profitability by almost 18 percentage points, thereby
generating net losses (-6.4% for the same period).
The first reason for the high fixed costs at small companies
(and, accordingly, the wide gap between operating profit margin
and net profit margin) is the low asset turnover (0.3 for small
enterprises, 0.6 for medium-sized enterprises, and 0.7 for larger
firms). This parameter is reflected in the high ratio of
depreciation to sales (20% in very small companies versus circa
5% in large companies).
High fixed costs reduce significantly the flexibility of small
companies, thus making them more vulnerable under
conditions of falling demand.
… mainly due to anti-economies of scale…
Small Medium Large
Net Profit Margin -6,4% 0,3% 1,6%
EBITDA margin 11,3% 8,4% 7,5%
Margin Gap (net - ebitda) -17,7% -8,1% -5,9%
Asset Turnover 0,27 0,57 0,70
Source: ICAP (average 2008-2010)
Financial ratios by company size
0%
5%
10%
15%
20%
25%
(0 -
0,1
]
(0,1
-0,5
]
(0,5
-1]
(1 -
2,5
]
(2,5
-5]
(5 -
10]
(10 -
50]
>50
Dep
reci
atio
n to
sal
es
Turnover (million €)
Depreciation expenses by company size
Source: ICAP (average 2008-2010)
LargeSMEs

10
Besides high fixed costs, financial expenses also correspond
to a high percentage of sales for small companies (5% versus
2% for large companies in the period 2008-2010). The main
reasons are:
high interest rates (over 8.5% for sole proprietorships
versus 6.5%-5.5% for companies) and
low asset turnover in smaller companies, which limits
the return of their capital and, accordingly, their ability
to borrow (i.e. the debt-to-equity ratio is low, while the
loans-to-sales ratio is high).
However, we should stress that the level of debt of small
Greek companies is lower than their European counterparts.
For instance, the debt-to-equity ratio in small companies
(with turnover less than €2 million) is 1.1 for Greece versus
1.4 in Europe, while the loans-to-sales ratio is close to 100%
for Greece and around 125% for Europe. Under these
conditions, the ratio of financial expenditure to sales is lower
in Greek small companies than in their European
counterparts (5% versus 8%).
… and high cost of financing
0%
2%
4%
6%
8%
10%
(0 - 2] (2 - 10] (10 - 50] > 50
financi
al e
xpen
ses
(% t
urn
over)
Turvover (million €)
Financial expenses (interest)by company size
Greece Europe*
Large
Sources: ICAP, BACH (average 2008-2010)
* European data refer to available countries from the BACH database (Austria, Germany, Spain, France, Italy, Netherlands, Portugal, Poland).
SMEs
0%
20%
40%
60%
80%
100%
120%
(0 - 2] (2 - 10] (10 - 50] > 50
Lo
ans
(long-t
erm
and
sho
rt-t
erm
)%
turn
over
Turnover (million €)
Loans to sales by company size
Greece Europe*
LargeSMEs
* European data refer to available countries from the BACH database (Austria, Germany, Spain, France, Italy, Netherlands, Portugal, Poland).
Sources: ICAP, BACH (average 2008-2010)
The second basic problem for SMEs: Reduced trade credit from
suppliers has disrupted their financing equilibrium
11
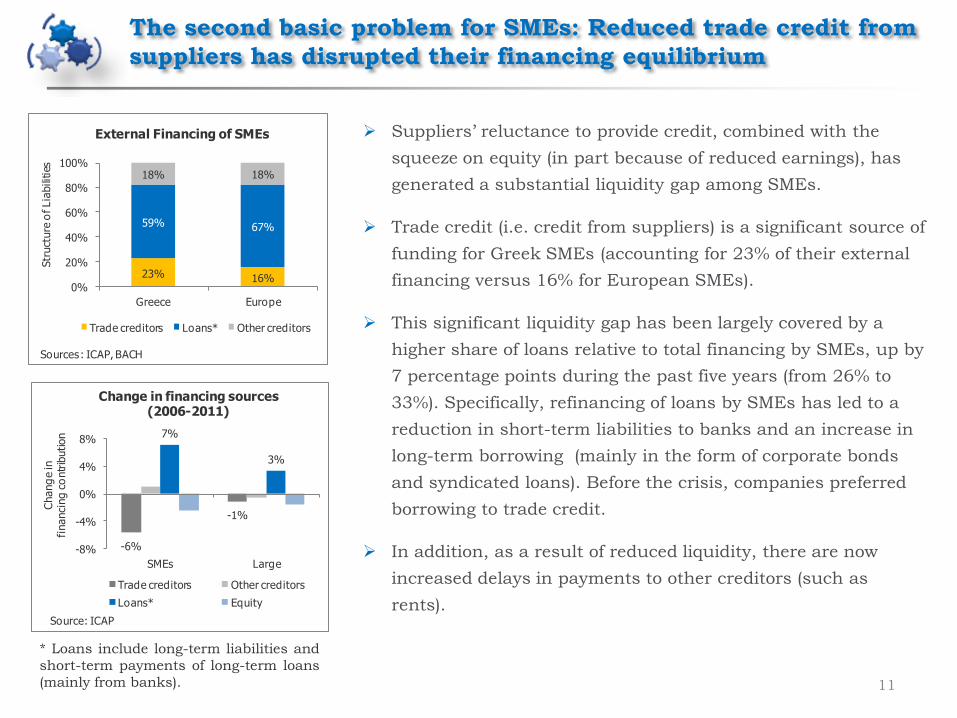
Suppliers’ reluctance to provide credit, combined with the
squeeze on equity (in part because of reduced earnings), has
generated a substantial liquidity gap among SMEs.
Trade credit (i.e. credit from suppliers) is a significant source of
funding for Greek SMEs (accounting for 23% of their external
financing versus 16% for European SMEs).
This significant liquidity gap has been largely covered by a
higher share of loans relative to total financing by SMEs, up by
7 percentage points during the past five years (from 26% to
33%). Specifically, refinancing of loans by SMEs has led to a
reduction in short-term liabilities to banks and an increase in
long-term borrowing (mainly in the form of corporate bonds
and syndicated loans). Before the crisis, companies preferred
borrowing to trade credit.
In addition, as a result of reduced liquidity, there are now
increased delays in payments to other creditors (such as
rents).
23% 16%
59% 67%
18% 18%
0%
20%
40%
60%
80%
100%
Greece Europe
Str
uct
ure
of Lia
bili
ties
External Financing of SMEs
Trade creditors Loans* Other creditors
Sources: ICAP, BACH
* Loans include long-term liabilities and
short-term payments of long-term loans
(mainly from banks).
-6%
-1%
7%
3%
-8%
-4%
0%
4%
8%
SMEs Large
Chang
e in
fi
nanci
ng
co
ntr
ibution
Change in financing sources(2006-2011)
Trade creditors Other creditors
Loans* Equity
Source: ICAP

Sample
13
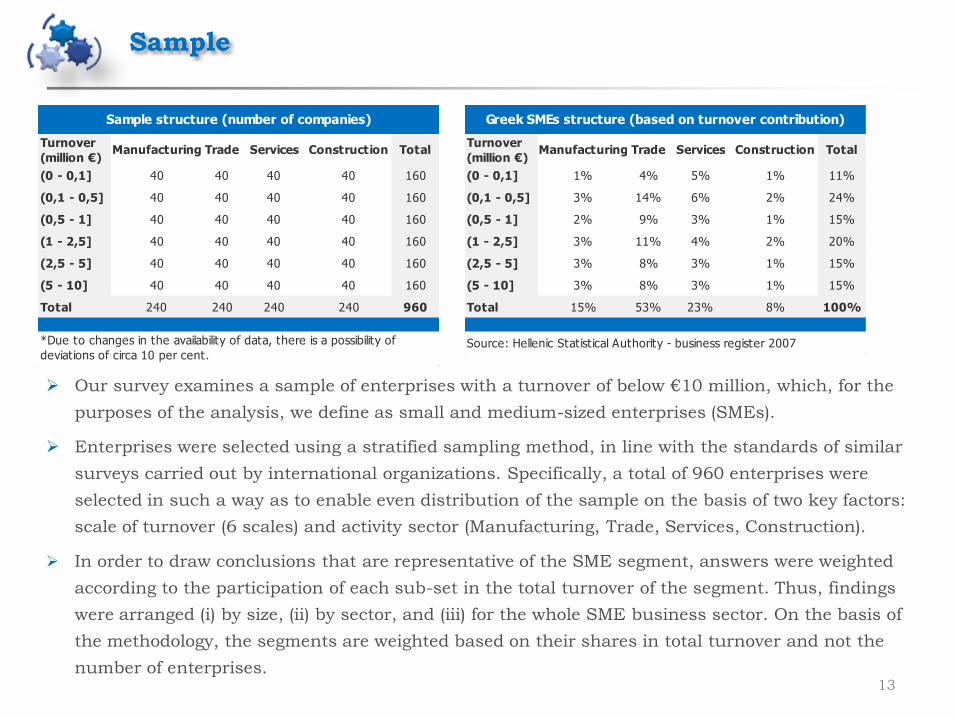
Our survey examines a sample of enterprises with a turnover of below €10 million, which, for the
purposes of the analysis, we define as small and medium-sized enterprises (SMEs).
Enterprises were selected using a stratified sampling method, in line with the standards of similar
surveys carried out by international organizations. Specifically, a total of 960 enterprises were
selected in such a way as to enable even distribution of the sample on the basis of two key factors:
scale of turnover (6 scales) and activity sector (Manufacturing, Trade, Services, Construction).
In order to draw conclusions that are representative of the SME segment, answers were weighted
according to the participation of each sub-set in the total turnover of the segment. Thus, findings
were arranged (i) by size, (ii) by sector, and (iii) for the whole SME business sector. On the basis of
the methodology, the segments are weighted based on their shares in total turnover and not the
number of enterprises.
Turnover
(million €)Manufacturing Trade Services Construction Total
(0 - 0,1] 40 40 40 40 160
(0,1 - 0,5] 40 40 40 40 160
(0,5 - 1] 40 40 40 40 160
(1 - 2,5] 40 40 40 40 160
(2,5 - 5] 40 40 40 40 160
(5 - 10] 40 40 40 40 160
Total 240 240 240 240 960
*Due to changes in the availability of data, there is a possibility of
deviations of circa 10 per cent.
Sample structure (number of companies)
Turnover
(million €)Manufacturing Trade Services Construction Total
(0 - 0,1] 1% 4% 5% 1% 11%
(0,1 - 0,5] 3% 14% 6% 2% 24%
(0,5 - 1] 2% 9% 3% 1% 15%
(1 - 2,5] 3% 11% 4% 2% 20%
(2,5 - 5] 3% 8% 3% 1% 15%
(5 - 10] 3% 8% 3% 1% 15%
Total 15% 53% 23% 8% 100%
Greek SMEs structure (based on turnover contribution)
Source: Hellenic Statistical Authority - business register 2007

Constructing a business confidence index
14
In order to construct a confidence index for SMEs, we included a number of basic questions
regarding the level of business activity in the previous and in the coming semester. The model for the
questions is based on the harmonized questionnaire recommended by the OECD and the European
Commission, thereby enhancing the predictability of the index.
The Index questions have 3 alternative answers: increase (+), no change (=), decrease (-), or above
normal (+), normal (=), below normal (-). To begin with, we convert the number of answers per
category (+,=,-) to percentages and then we calculate the net result by subtracting the (-) from the (+)
percentage. Last, the confidence index for each sector is the average of the net results for the
following questions:
For manufacturing: The level of orders, inventories, and future production trend.
For services: The business situation of the firm in the previous semester, past and future
demand trend.
For trade: Level of inventories, past and future demand.
For construction: Level of backlog, and future employment trend.
For the SME sector, the business confidence index has been estimated as a weighted average of its
subsectors (the weights being the shares of the sectors’ turnover in the economy).
By carrying out the survey on a regular 6-month basis we should be able to form a picture of SMEs’
course over time, as reflected in the index. To draw reliable conclusions, comparison will be made
between the current index level and its long-term average (so as to correct possible over-optimism or
over-pessimism bias).

16
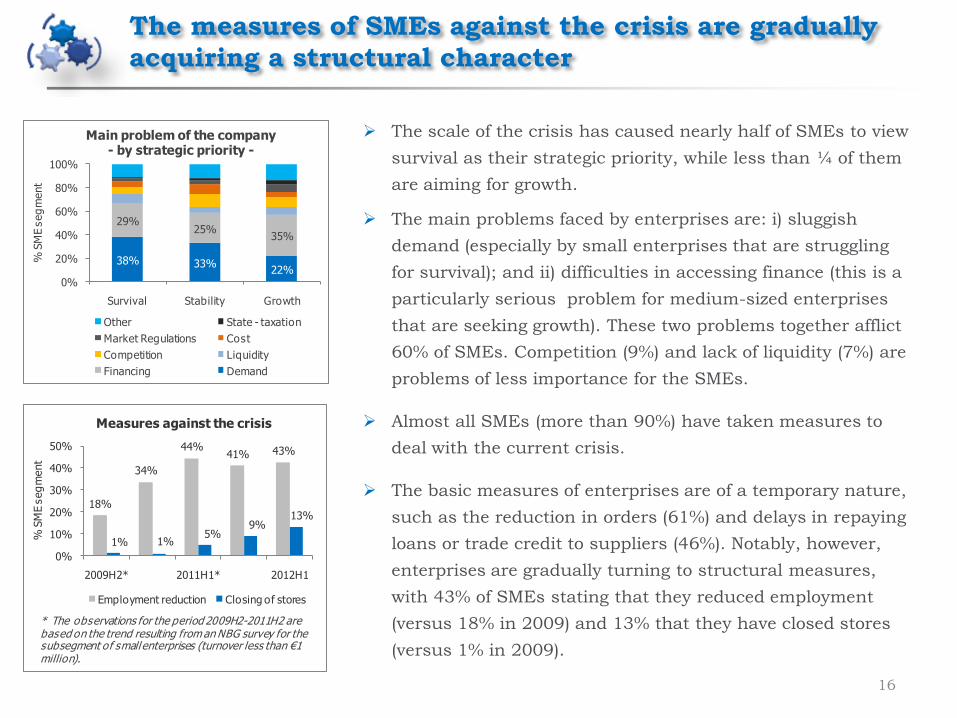
The scale of the crisis has caused nearly half of SMEs to view
survival as their strategic priority, while less than ¼ of them
are aiming for growth.
The main problems faced by enterprises are: i) sluggish
demand (especially by small enterprises that are struggling
for survival); and ii) difficulties in accessing finance (this is a
particularly serious problem for medium-sized enterprises
that are seeking growth). These two problems together afflict
60% of SMEs. Competition (9%) and lack of liquidity (7%) are
problems of less importance for the SMEs.
Almost all SMEs (more than 90%) have taken measures to
deal with the current crisis.
The basic measures of enterprises are of a temporary nature,
such as the reduction in orders (61%) and delays in repaying
loans or trade credit to suppliers (46%). Notably, however,
enterprises are gradually turning to structural measures,
with 43% of SMEs stating that they reduced employment
(versus 18% in 2009) and 13% that they have closed stores
(versus 1% in 2009).
The measures of SMEs against the crisis are gradually
acquiring a structural character
38% 33%22%
29%25%
35%
0%
20%
40%
60%
80%
100%
Survival Stability Growth
% S
ME s
eg
ment
Main problem of the company- by strategic priority -
Other State - taxation
Market Regulations Cost
Competition Liquidity
Financing Demand
18%
34%
44%41% 43%
1% 1%5%
9%13%
0%
10%
20%
30%
40%
50%
2009Η2* 2011Η1* 2012Η1
% S
ME s
eg
ment
Measures against the crisis
Employment reduction Closing of stores
* The observations for the period 2009Η2-2011Η2 are based on the trend resulting from an NBG survey for the subsegment of small enterprises (turnover less than €1 million).
Financing of working capital at SMEs is being hit by the
reduction in trade credit…
17
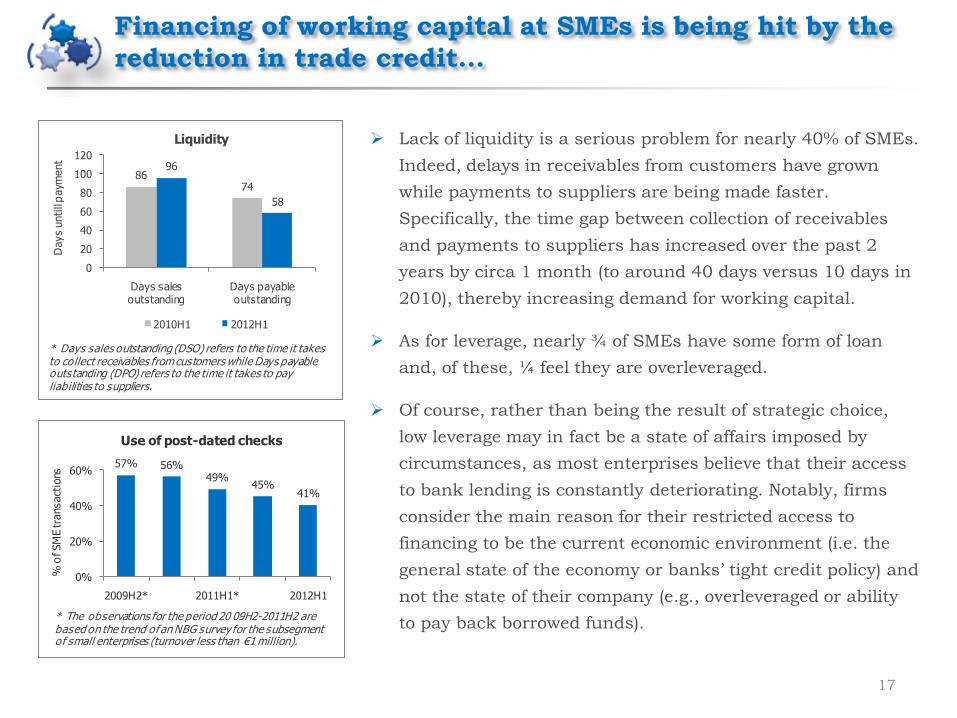
Lack of liquidity is a serious problem for nearly 40% of SMEs.
Indeed, delays in receivables from customers have grown
while payments to suppliers are being made faster.
Specifically, the time gap between collection of receivables
and payments to suppliers has increased over the past 2
years by circa 1 month (to around 40 days versus 10 days in
2010), thereby increasing demand for working capital.
As for leverage, nearly ¾ of SMEs have some form of loan
and, of these, ¼ feel they are overleveraged.
Of course, rather than being the result of strategic choice,
low leverage may in fact be a state of affairs imposed by
circumstances, as most enterprises believe that their access
to bank lending is constantly deteriorating. Notably, firms
consider the main reason for their restricted access to
financing to be the current economic environment (i.e. the
general state of the economy or banks’ tight credit policy) and
not the state of their company (e.g., overleveraged or ability
to pay back borrowed funds).
57% 56%49%
45%41%
0%
20%
40%
60%
2009Η2* 2011Η1* 2012Η1
% o
f SM
E tra
nsact
ions
Use of post-dated checks
* The observations for the period 20 09Η2-2011Η2 are based on the trend of an NBG survey for the subsegment of small enterprises (turnover less than €1 million).
8674
96
58
0
20
40
60
80
100
120
Days sales outstanding
Days payable outstanding
Days u
ntill p
aym
ent
Liquidity
2010Η1 2012Η1
* Days sales outstanding (DSO) refers to the time it takes to collect receivables from customers while Days payable outstanding (DPO) refers to the time it takes to pay liabilities to suppliers.
… while financing of investments is hampered mainly by
low earnings
18
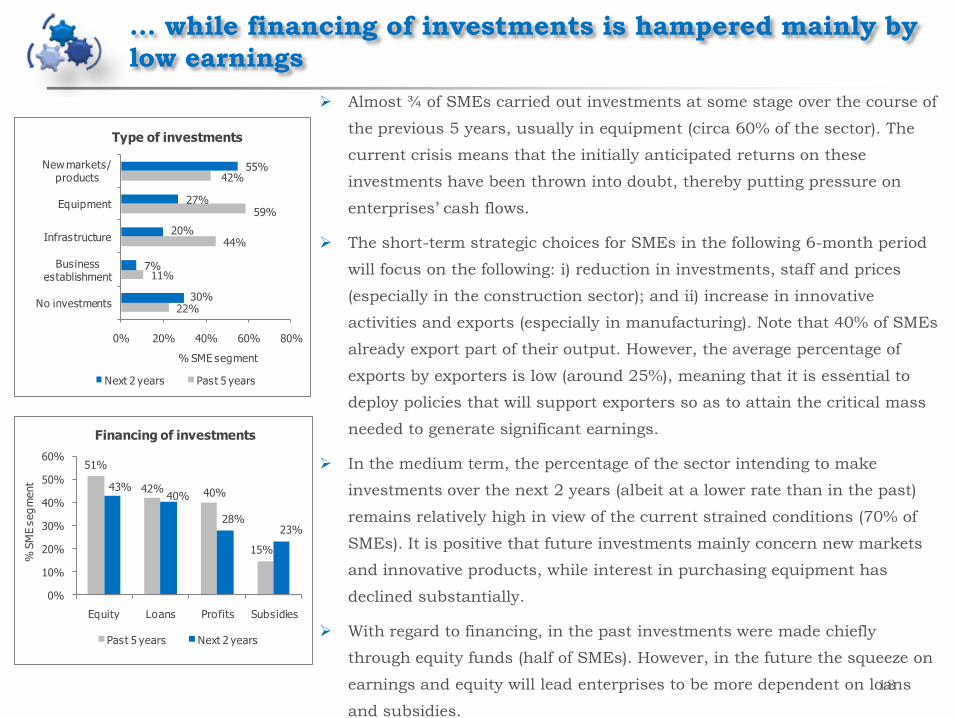
Almost ¾ of SMEs carried out investments at some stage over the course of
the previous 5 years, usually in equipment (circa 60% of the sector). The
current crisis means that the initially anticipated returns on these
investments have been thrown into doubt, thereby putting pressure on
enterprises’ cash flows.
The short-term strategic choices for SMEs in the following 6-month period
will focus on the following: i) reduction in investments, staff and prices
(especially in the construction sector); and ii) increase in innovative
activities and exports (especially in manufacturing). Note that 40% of SMEs
already export part of their output. However, the average percentage of
exports by exporters is low (around 25%), meaning that it is essential to
deploy policies that will support exporters so as to attain the critical mass
needed to generate significant earnings.
In the medium term, the percentage of the sector intending to make
investments over the next 2 years (albeit at a lower rate than in the past)
remains relatively high in view of the current strained conditions (70% of
SMEs). It is positive that future investments mainly concern new markets
and innovative products, while interest in purchasing equipment has
declined substantially.
With regard to financing, in the past investments were made chiefly
through equity funds (half of SMEs). However, in the future the squeeze on
earnings and equity will lead enterprises to be more dependent on loans
and subsidies.
22%
11%
44%
59%
42%
30%
7%
20%
27%
55%
0% 20% 40% 60% 80%
No investments
Business establishment
Infrastructure
Equipment
New markets/ products
% SME segment
Type of investments
Next 2 years Past 5 years
51%
42% 40%
15%
43%40%
28%23%
0%
10%
20%
30%
40%
50%
60%
Equity Loans Profits Subsidies
% S
ME s
eg
ment
Financing of investments
Past 5 years Next 2 years

Business confidence index
20
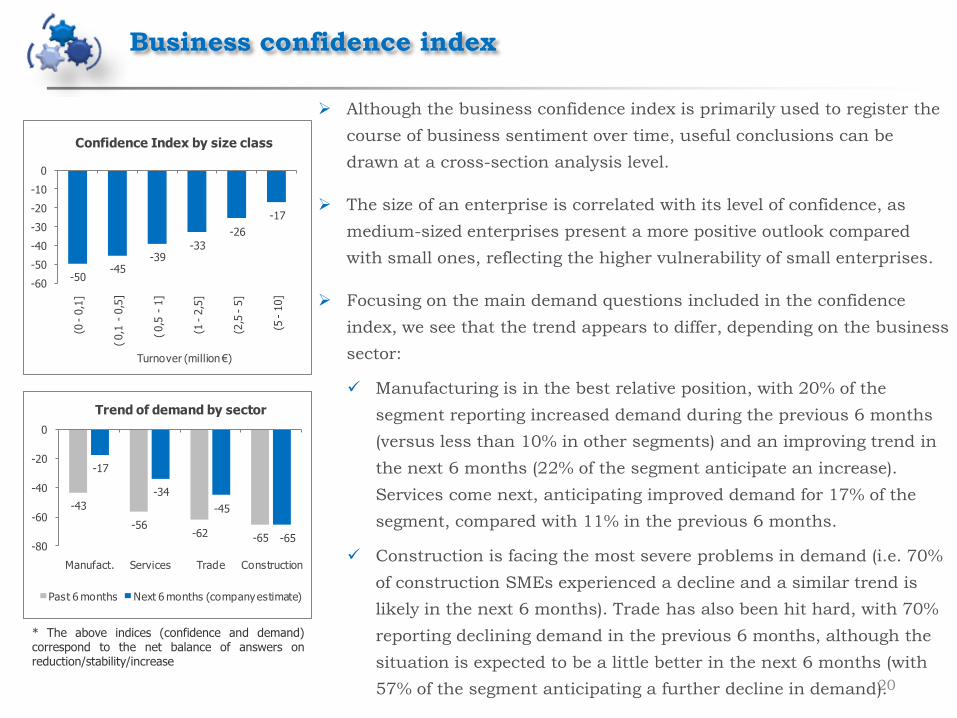
Although the business confidence index is primarily used to register the
course of business sentiment over time, useful conclusions can be
drawn at a cross-section analysis level.
The size of an enterprise is correlated with its level of confidence, as
medium-sized enterprises present a more positive outlook compared
with small ones, reflecting the higher vulnerability of small enterprises.
Focusing on the main demand questions included in the confidence
index, we see that the trend appears to differ, depending on the business
sector:
Manufacturing is in the best relative position, with 20% of the
segment reporting increased demand during the previous 6 months
(versus less than 10% in other segments) and an improving trend in
the next 6 months (22% of the segment anticipate an increase).
Services come next, anticipating improved demand for 17% of the
segment, compared with 11% in the previous 6 months.
Construction is facing the most severe problems in demand (i.e. 70%
of construction SMEs experienced a decline and a similar trend is
likely in the next 6 months). Trade has also been hit hard, with 70%
reporting declining demand in the previous 6 months, although the
situation is expected to be a little better in the next 6 months (with
57% of the segment anticipating a further decline in demand).
* The above indices (confidence and demand)correspond to the net balance of answers onreduction/stability/increase
-50-45
-39-33
-26
-17
-60
-50
-40
-30
-20
-10
0
(0 -
0,1
]
( 0,1
-0,5
]
( 0,5
-1]
(1 -
2,5
]
(2,5
-5]
(5 -
10]
Turnover (million €)
Confidence Index by size class
-43
-56-62 -65
-17
-34
-45
-65-80
-60
-40
-20
0
Manufact. Services Trade Construction
Trend of demand by sector
Past 6 months Next 6 months (company estimate)

Variations depending on size
21
Small enterprises are under greater pressure than
medium-sized enterprises during the current crisis. 65% of
small enterprises state that they have been severely affected
by the crisis, compared with only 30% of medium-sized
enterprises. Likewise, business resilience to the crisis has
declined to 12.5 months for small enterprises and 15.5
months for medium-sized enterprises. Due to the severe
impact of the crisis, most small enterprises state survival as
their strategic priority (54% versus 35% of medium-sized
enterprises).
Medium-sized enterprises view access to financing as their
key problem (reflecting, to a large extent, their greater need
for borrowing in order to finance investments in the future).
Indeed, more medium-sized enterprises invested funds in
the past few years in equipment and new products (85%
versus 65% of small enterprises). Their investment appetite
for the next two years has declined (¾ of medium-sized
companies continue to invest), although their appetite
remains higher than that of small enterprises. Accordingly,
a decline in investment is expected in the next 6 months by
circa 15% of medium-sized enterprises versus 30% of small
ones.
* Numbers1-6 represent enterprises’ range of turnover :
1 : €0-€100,000
2 : €100,000-€500,000
3 : €500,000-€1,000,000
4 : €1,000,000-€2,500,000
5 : €2,500,000-€5,000,000
6 : €5,000,000-€10,000,000
1
2
35
4
6
0,6
0,9
10% 20% 30% 40% 50%
Need for future
investm.
Financing problem
Moderate pressure
Low
High
Little pressure
1
2
3
5
4
6
10
18
6,0 7,0 8,0 9,0
Resilience(months)
Impact of the crisis
Very HighModerate

22
The manufacturing sector has been least affected by the crisis, while construction is facing the
worst problems.
Sector variations
43%
31%
28%
28%
0% 10% 20% 30% 40% 50%
Construction
Trade
Services
Manufacturing
share of each sector which expects a decrease in employment over the next 6 months
Decrese in employment
over the next 6 months
-3,2
-2,5
-1,6
-1,2
-4 -3 -2 -1 0
Construction
Trade
Services
Manufacturing
Scale from -10 (survival) to 10 (growth)
Strategic priority
8,4
7,5
7,0
6,9
0 2 4 6 8 10
Construction
Trade
Services
Manufacturing
Scale from 0 (no impact) to 10 (very high impact)
Impact of the economic crisis
11
13
14
15
0 5 10 15 20
Construction
Manufacturing
Trade
Services
Months
Estimated resilience
against the economic crisis

23
Construction is facing severe liquidity problems (with the gap between days sales outstanding
and days payable outstanding reaching 50 days), while industry has greater needs for
investment funds.
Sector variations
64%
69%
70%
76%
0% 20% 40% 60% 80% 100%
Construction
Services
Trade
Manufacturing
share of each sector which has investment needs
Investment needs
Past 5 years Next 2 years
6,9
5,9
5,8
5,6
0 2 4 6 8 10
Construction
Manufacturing
Services
Trade
Scale from 0 (no problem) to 10 (great problem)
Liquidity problem
70
58
65
54
130
102
98
87
0 50 100 150
Construction
Services
Manufacturing
Trade
Days
Days untill payment
Days sales outstanding (receivables)
Days payable outstanding (trade creditors)
5,0
5,0
4,2
4,1
0 2 4 6 8 10
Trade
Manufacturing
Construction
Services
Scale from 0 (no loan) to 10 (overleverage)
Debt problem
24
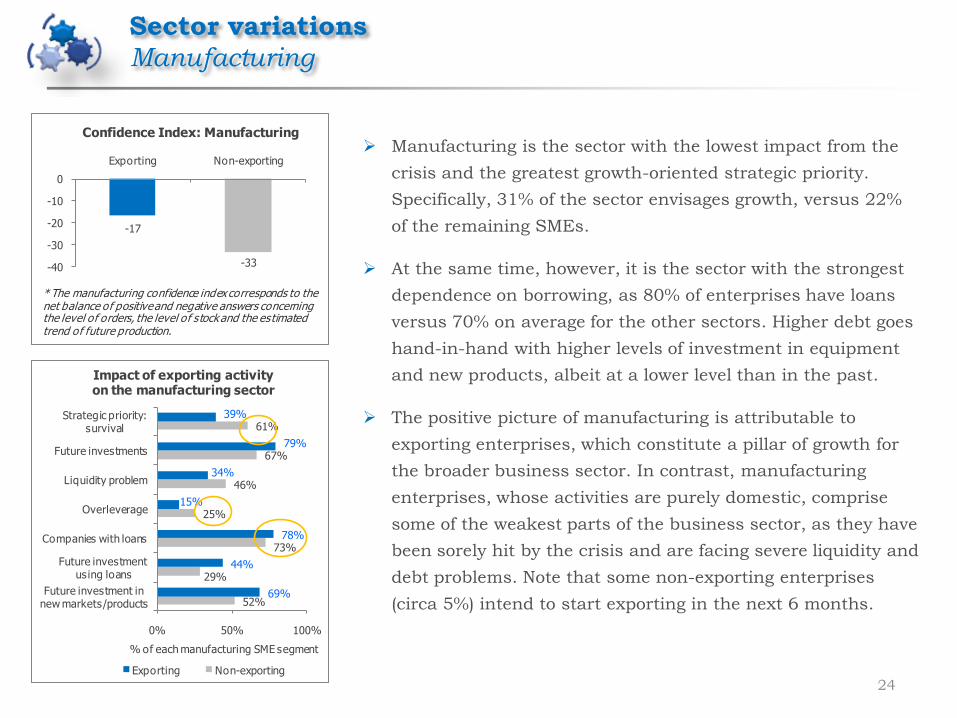
Manufacturing is the sector with the lowest impact from the
crisis and the greatest growth-oriented strategic priority.
Specifically, 31% of the sector envisages growth, versus 22%
of the remaining SMEs.
At the same time, however, it is the sector with the strongest
dependence on borrowing, as 80% of enterprises have loans
versus 70% on average for the other sectors. Higher debt goes
hand-in-hand with higher levels of investment in equipment
and new products, albeit at a lower level than in the past.
The positive picture of manufacturing is attributable to
exporting enterprises, which constitute a pillar of growth for
the broader business sector. In contrast, manufacturing
enterprises, whose activities are purely domestic, comprise
some of the weakest parts of the business sector, as they have
been sorely hit by the crisis and are facing severe liquidity and
debt problems. Note that some non-exporting enterprises
(circa 5%) intend to start exporting in the next 6 months.
Sector variations
Manufacturing
-17
-33-40
-30
-20
-10
0
Exporting Non-exporting
Confidence Index: Manufacturing
* The manufacturing confidence index corresponds to the net balance of positive and negative answers concerning the level of orders, the level of stock and the estimated trend of future production.
52%
29%
73%
25%
46%
67%
61%
69%
44%
78%
15%
34%
79%
39%
0% 50% 100%
Future investment in new markets/products
Future investment using loans
Companies with loans
Overleverage
Liquidity problem
Future investments
Strategic priority: survival
% of each manufacturing SME segment
Impact of exporting activity on the manufacturing sector
Exporting Non-exporting
25
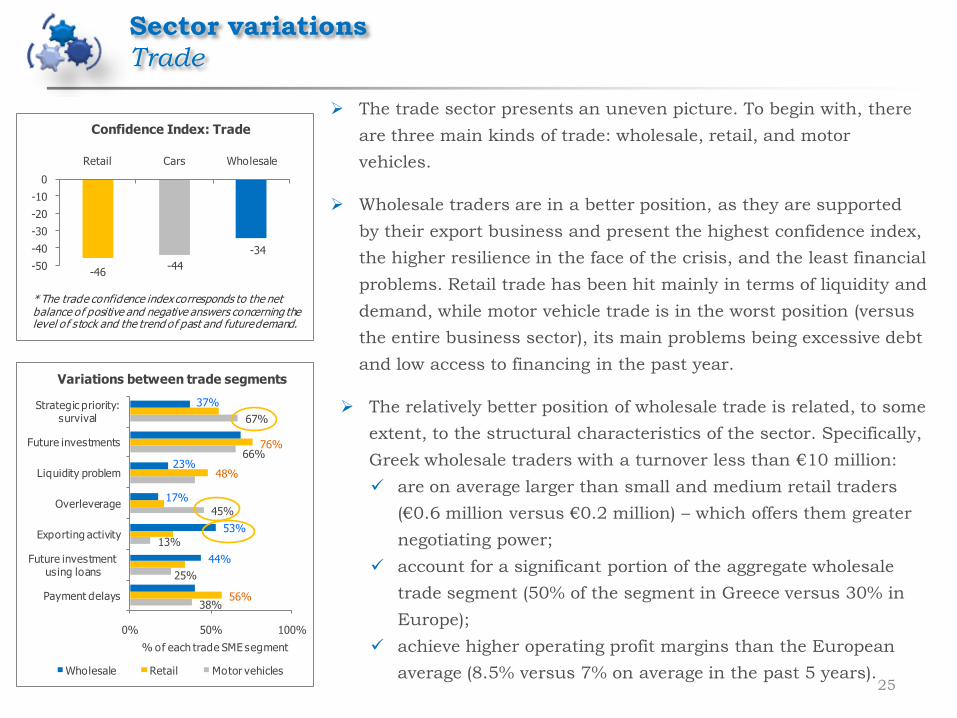
The trade sector presents an uneven picture. To begin with, there
are three main kinds of trade: wholesale, retail, and motor
vehicles.
Wholesale traders are in a better position, as they are supported
by their export business and present the highest confidence index,
the higher resilience in the face of the crisis, and the least financial
problems. Retail trade has been hit mainly in terms of liquidity and
demand, while motor vehicle trade is in the worst position (versus
the entire business sector), its main problems being excessive debt
and low access to financing in the past year.
The relatively better position of wholesale trade is related, to some
extent, to the structural characteristics of the sector. Specifically,
Greek wholesale traders with a turnover less than €10 million:
are on average larger than small and medium retail traders
(€0.6 million versus €0.2 million) – which offers them greater
negotiating power;
account for a significant portion of the aggregate wholesale
trade segment (50% of the segment in Greece versus 30% in
Europe);
achieve higher operating profit margins than the European
average (8.5% versus 7% on average in the past 5 years).
Sector variations
Trade
-46-44
-34
-50
-40
-30
-20
-10
0
Retail Cars Wholesale
Confidence Index: Trade
* The trade confidence index corresponds to the net balance of positive and negative answers concerning the level of stock and the trend of past and future demand.
38%
25%
13%
45%
66%
67%
56%
48%
76%
44%
53%
17%
23%
37%
0% 50% 100%
Payment delays
Future investment using loans
Exporting activity
Overleverage
Liquidity problem
Future investments
Strategic priority: survival
% of each trade SME segment
Variations between trade segments
Wholesale Retail Motor vehicles
26
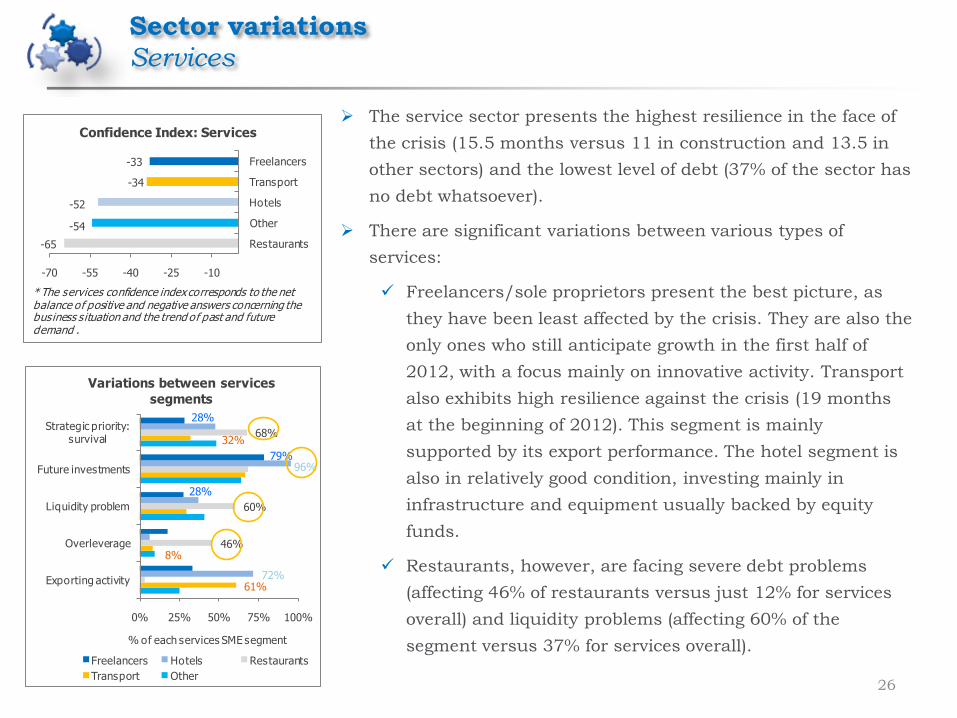
The service sector presents the highest resilience in the face of
the crisis (15.5 months versus 11 in construction and 13.5 in
other sectors) and the lowest level of debt (37% of the sector has
no debt whatsoever).
There are significant variations between various types of
services:
Freelancers/sole proprietors present the best picture, as
they have been least affected by the crisis. They are also the
only ones who still anticipate growth in the first half of
2012, with a focus mainly on innovative activity. Transport
also exhibits high resilience against the crisis (19 months
at the beginning of 2012). This segment is mainly
supported by its export performance. The hotel segment is
also in relatively good condition, investing mainly in
infrastructure and equipment usually backed by equity
funds.
Restaurants, however, are facing severe debt problems
(affecting 46% of restaurants versus just 12% for services
overall) and liquidity problems (affecting 60% of the
segment versus 37% for services overall).
Sector variations
Services
61%
8%
32%
46%
60%
68%
72%
96%
28%
79%
28%
0% 25% 50% 75% 100%
Exporting activity
Overleverage
Liquidity problem
Future investments
Strategic priority: survival
% of each services SME segment
Variations between services
segments
Freelancers Hotels Restaurants
Transport Other
-65
-54
-52
-34
-33
-70 -55 -40 -25 -10
Restaurants
Other
Hotels
Transport
Freelancers
Confidence Index: Services
* The services confidence index corresponds to the net balance of positive and negative answers concerning the business s ituation and the trend of past and future demand .
27
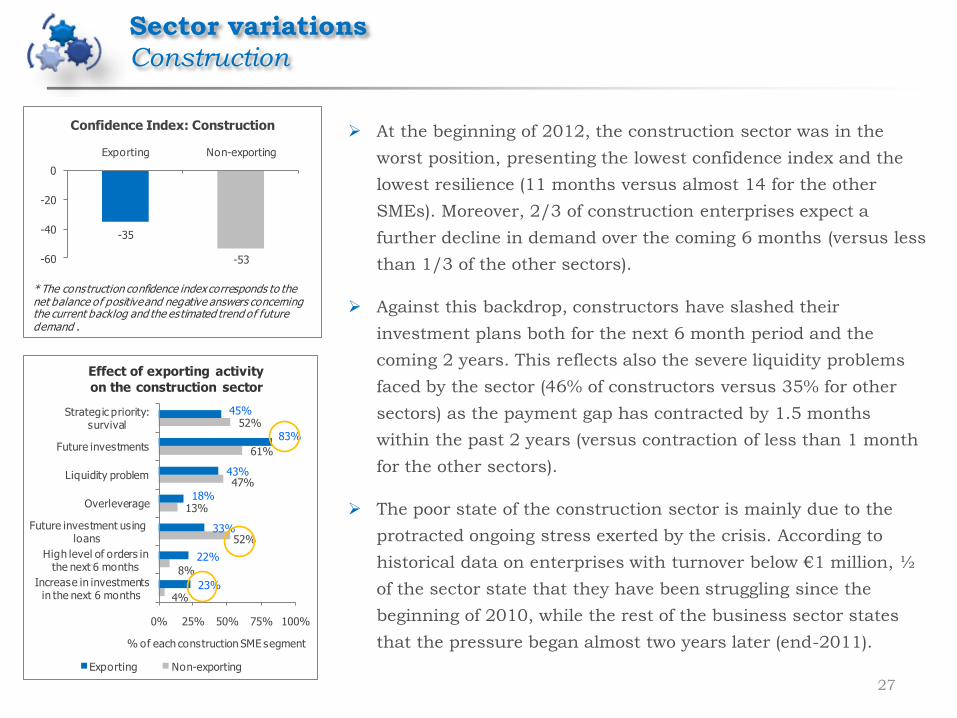
At the beginning of 2012, the construction sector was in the
worst position, presenting the lowest confidence index and the
lowest resilience (11 months versus almost 14 for the other
SMEs). Moreover, 2/3 of construction enterprises expect a
further decline in demand over the coming 6 months (versus less
than 1/3 of the other sectors).
Against this backdrop, constructors have slashed their
investment plans both for the next 6 month period and the
coming 2 years. This reflects also the severe liquidity problems
faced by the sector (46% of constructors versus 35% for other
sectors) as the payment gap has contracted by 1.5 months
within the past 2 years (versus contraction of less than 1 month
for the other sectors).
The poor state of the construction sector is mainly due to the
protracted ongoing stress exerted by the crisis. According to
historical data on enterprises with turnover below €1 million, ½
of the sector state that they have been struggling since the
beginning of 2010, while the rest of the business sector states
that the pressure began almost two years later (end-2011).
Sector variations
Construction
-35
-53-60
-40
-20
0
Exporting Non-exporting
Confidence Index: Construction
* The construction confidence index corresponds to the net balance of positive and negative answers concerning the current backlog and the estimated trend of future demand .
4%
8%
52%
13%
47%
61%
52%
23%
22%
33%
18%
43%
83%
45%
0% 25% 50% 75% 100%
Increase in investments in the next 6 months
High level of orders in the next 6 months
Future investment using loans
Overleverage
Liquidity problem
Future investments
Strategic priority: survival
% of each construction SME segment
Effect of exporting activity
on the construction sector
Exporting Non-exporting


SMEs with growth prospects
Companies with a generally healthy profile
29
Our survey confirms that the SME sector (mainly small
enterprises) has been severely hit by the ongoing crisis.
However, we should stress that 1 out of 4 SMEs stated in the
survey that they envisage growth in the years ahead.
More importantly, these enterprises generally present a healthy
profile and accordingly the growth prospects stated by these
firms reflect more than just optimism. In other words, they
present features that can support their growth prospects:
Low impact of the crisis
Limited need for crisis measures (such as employment
reduction, closing of stores and reduction of orders)
Limited liquidity problems
Small-scale payment delays
Only a slight increase in days sales outstanding
Favourable purchase terms with suppliers
Growth strategy in respect of investments, hirings,
innovative activities, and outward-looking policies for the
next 6-month period. 27%
5%
64%
3%
61%
57%
69%
50%
23%
82%
17%
28%
17%
24%
0% 25% 50% 75% 100%
Increase in innovation in the next 6 months
Increase in employment in the next 6 months
Future investments
No measure against the cris is
Payment delays (to banks or creditors)
Liquidity problem
Very high impact of the cris is
% SME segment
Characteristics of enterprises with
different strategic priorities
Growth Survival
26%11% 8%
38%
38%25%
36%51%
67%
0%
20%
40%
60%
80%
100%
Growth Stability Survival
% S
ME s
eg
ment
Demand trend estimates for enterprises with different
strategic priorities
Increase in demand for the next 6 months
Stability in demand for the next 6 months
Decrease in demand for the next 6 months
30
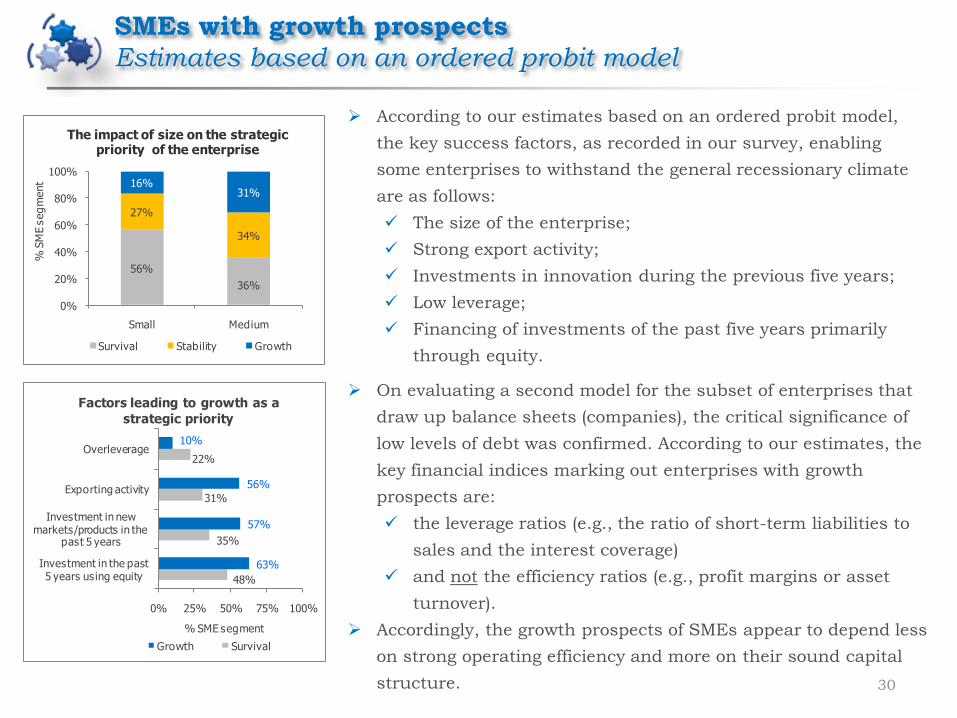
According to our estimates based on an ordered probit model,
the key success factors, as recorded in our survey, enabling
some enterprises to withstand the general recessionary climate
are as follows:
The size of the enterprise;
Strong export activity;
Investments in innovation during the previous five years;
Low leverage;
Financing of investments of the past five years primarily
through equity.
On evaluating a second model for the subset of enterprises that
draw up balance sheets (companies), the critical significance of
low levels of debt was confirmed. According to our estimates, the
key financial indices marking out enterprises with growth
prospects are:
the leverage ratios (e.g., the ratio of short-term liabilities to
sales and the interest coverage)
and not the efficiency ratios (e.g., profit margins or asset
turnover).
Accordingly, the growth prospects of SMEs appear to depend less
on strong operating efficiency and more on their sound capital
structure.
SMEs with growth prospects
Estimates based on an ordered probit model
56%
36%
27%
34%
16%31%
0%
20%
40%
60%
80%
100%
Small Medium
% S
ME s
eg
ment
The impact of size on the strategic priority of the enterprise
Survival Stability Growth
48%
35%
31%
22%
63%
57%
56%
10%
0% 25% 50% 75% 100%
Investment in the past 5 years using equity
Investment in new markets/products in the
past 5 years
Exporting activity
Overleverage
% SME segment
Factors leading to growth as a
strategic priority
Growth Survival
31
The main measures deployed by SMEs to deal with the crisis should focus on reducing their operating
costs. To this end, the following moves may provide impetus:
Organization of SMEs into broader clusters of enterprises belonging to the same business
segment or the same supply chain for a specific product. Such a strategy generates cost sharing
opportunities for marketing, research, and even basic infrastructures.
Provision of incentives for mergers with a view to gaining the necessary size for enterprises to
operate efficiently.
Second, it is crucial that liquidity in SMEs is enhanced. This may be achieved through the following:
Leveraging available EU support mechanisms (NSRF, EIB) for targeted provision of liquidity (e.g.,
to enterprises that export or promote innovation).
Creating equivalent credit tools, such as letters of credit (L/Cs) to international investment
agencies, so as to continue to import raw materials without having to pay in cash.
Last, significant assistance to SMEs could be provided by measures aimed at boosting sales, mainly
by promoting outward-looking strategies:
To focus on exports, SMEs need appropriate training, know-how and financial aid.
The development of a national export strategy could help support such firms, especially by
establishing a well-recognized and reputable national brand.
Policy directions
32
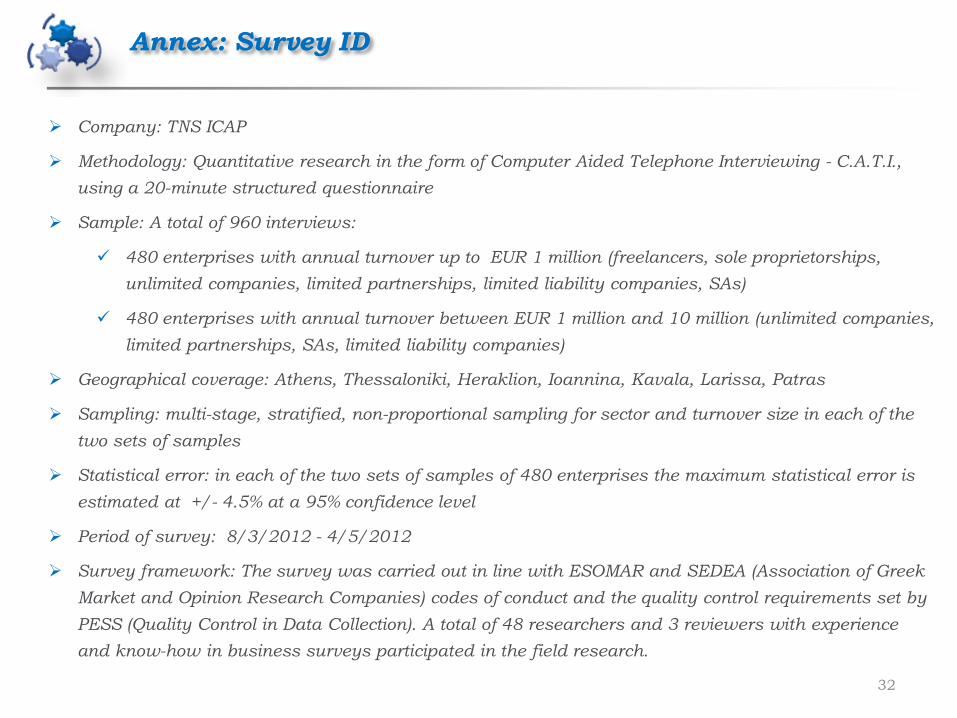
Company: TNS ICAP
Methodology: Quantitative research in the form of Computer Aided Telephone Interviewing - C.A.T.I.,
using a 20-minute structured questionnaire
Sample: A total of 960 interviews:
480 enterprises with annual turnover up to EUR 1 million (freelancers, sole proprietorships,
unlimited companies, limited partnerships, limited liability companies, SAs)
480 enterprises with annual turnover between EUR 1 million and 10 million (unlimited companies,
limited partnerships, SAs, limited liability companies)
Geographical coverage: Athens, Thessaloniki, Heraklion, Ioannina, Kavala, Larissa, Patras
Sampling: multi-stage, stratified, non-proportional sampling for sector and turnover size in each of the
two sets of samples
Statistical error: in each of the two sets of samples of 480 enterprises the maximum statistical error is
estimated at +/- 4.5% at a 95% confidence level
Period of survey: 8/3/2012 - 4/5/2012
Survey framework: The survey was carried out in line with ESOMAR and SEDEA (Association of Greek
Market and Opinion Research Companies) codes of conduct and the quality control requirements set by
PESS (Quality Control in Data Collection). A total of 48 researchers and 3 reviewers with experience
and know-how in business surveys participated in the field research.
Annex: Survey ID
Strategic Planning & Research Division
Survey of Greek SMEsJuly 2012
Analysts:
Fragiska Voumvaki
+30 210-3341549
e-mail: [email protected]
Maria Savva
+30 210-3341646
e-mail: [email protected]
Athanasia Koutouzou
+30 210-3341528
e-mail: [email protected]
This report is provided solely for the information of professional investors who are expected to make their own investment
decisions without undue reliance on its contents. Under no circumstances is it to be used or considered as an offer to sell, or a
solicitation of any offer to buy. Any data provided in this bulletin has been obtained from sources believed to be reliable.
Because of the possibility of error on the part of such sources, National Bank of Greece does not guarantee the accuracy,
timeliness or usefulness of any information. The National Bank of Greece and its affiliate companies accept no liability for any
direct or consequential loss arising from any use of this report.