NATIONAL ASSESSMENT OF VOCATIONAL … ASSESSMENT OF VOCATIONAL EDUCATION FINAL REPORT TO CONGRESS...
29
NATIONAL ASSESSMENT OF VOCATIONAL EDUCATION FINAL REPORT TO CONGRESS Executive Summary U.S. Department of Education Office of the Under Secretary Policy and Program Studies Service
-
Upload
truongthuy -
Category
Documents
-
view
215 -
download
2
Transcript of NATIONAL ASSESSMENT OF VOCATIONAL … ASSESSMENT OF VOCATIONAL EDUCATION FINAL REPORT TO CONGRESS...

NATIONAL ASSESSMENT OFVOCATIONAL EDUCATION
F INAL REPORT TO CONGRESS
Execu t i ve Summar y
U.S. Department of EducationOffice of the Under Secretary
Policy and Program Studies Service

N A V E : F i n a l R e p o r t t o C o n g r e s s i
2004
Marsha SilverbergElizabeth Warner
Michael FongDavid Goodwin
Prepared by:U.S. Department of EducationOffice of the Under Secretary
Policy and Program Studies Service
NATIONAL ASSESSMENT OFVOCATIONAL EDUCATION
F INAL REPORT TO CONGRESSExecut i ve Summary

U.S. Department of EducationRod PaigeSecretary
Policy and Program Studies ServiceAlan GinsburgDirector
Program and Analytic Studies DivisionDavid GoodwinDirector
June 2004
This report is in the public domain. Authorization to reproduce it in whole or in part is granted. While permission to reprint this publication is not necessary, the citation should be: U.S. Department of Education, Office of the Under Secretary, Policy and Program Studies Service, National Assessment of Vocational Education: Final Report to Congress: Executive Summary, Washington, D.C., 2004.
To obtain copies of this report,
write to: ED Pubs, Education Publications Center, U.S. Department of Education, P.O. Box 1398, Jessup, MD 20794-1398;
or fax your request to: (301) 470-1244;
or e-mail your request to: [email protected].
or call in your request toll-free: 1-877-433-7827 (1-877-4-ED-PUBS). If 877 service is not yet avail-able in your area, call 1-800-872-5327 (1-800-USA-LEARN). Those who use a telecommunications device for the deaf (TDD) or a teletypewriter (TTY), should call 1-800-437-0833.
or order online at: www.ed.gov/pubs/edpubs.html.
This report is also available on the Department’s Web site at: www.ed.gov/rschstat/eval/sectech/nave/reports.html.
On request, this publication is available in alternate formats, such as Braille, large print, audiotape or computer diskette. For more information, please contact the Department’s Alternate Format Center (202) 260-9895 or (202) 205-8113.

N A V E : F i n a l R e p o r t t o C o n g r e s s iii
| Acknowledgments |
Acknowledgments
This final report of the National Assessment of Vocational Education (NAVE) benefited
from the contributions of many persons, both inside the U.S. Department of Education
and in other organizations. The NAVE staff would like to extend their appreciation to all
of these individuals and to acknowledge those whose assistance was particularly crucial.
First, the work of the NAVE was conducted under the guidance of an Independent
Advisory Panel, whose names and affiliations appear at the back of this report. Their
insights and support were invaluable, and their constructive advice made both the inter-
im and final NAVE reports better products.
Several colleagues at the Department played important roles. At the Office of Vocational
and Adult Education (OVAE), we are especially grateful for the input and cooperation
provided by Assistant Secretary Susan Sclafani, former Assistant Secretary Carol D’Amico,
Deputy Assistant Secretary Hans Meeder, Dennis Berry, special assistant for research,
Sharon Belli, OVAE’s original liaison to NAVE, and Braden Goetz in OVAE’s policy group.
Our partnership with Lisa Hudson at the National Center for Education Statistics (NCES)
was extremely productive. We also received useful advice from Alan Ginsburg, director of
the Policy and Program Studies Service (PPSS) in the Office of the Under Secretary.
The foundation of this report is the analysis undertaken by a variety of contractors
with whom we collaborated closely. For their careful work with the data and their
help in interpreting results we would like to thank, in particular: (1) Karen Levesque,
Gary Hoachlander, Denise Bradby, Bob Fitzgerald, Paula Hudis, Steve Klein, and Rosio
Bugarin at MPR Associates, (2) Roberto Agodini, Joshua Haimson, John Deke, Tim
Novak, and Stacey Uhl at Mathematica Policy Research, Inc., (3) Tom Bailey and his
team at Teachers College, Columbia University, (4) Ivan Charner and Robin White at the
Academy for Educational Development, and (5) Cathy Stasz and Sue Bodilly at the RAND
Corporation.
We also appreciate the efforts of all those who helped with the production of the report.
Angela Clarke and Ann Nawaz from PPSS assisted with early document preparation and
report dissemination. Barbara Kridl, Andrea Livingston, Leslie Retallick, and the pub-
lishing staff of MPR Associates are responsible for editing the report and providing the
cover and layout design. Edward Ohnemus in the Department’s Office of Public Affairs
reviewed the report for publication.

iv N A V E : F i n a l R e p o r t t o C o n g r e s s
| Acknowledgments |
Finally, we owe our gratitude to the many students and vocational educators across the
country on whom our data and analyses are based. This report is written with sincere
appreciation for their efforts.
In the end, the judgments expressed in this report are those of the authors. While they
are employees of PPSS in the Office of the Under Secretary, this assessment is an inde-
pendent study, as called for by law, and does not necessarily reflect the official views or
policies of the U.S. Department of Education.
Marsha Silverberg
Elizabeth Warner
Michael Fong
David Goodwin

| E x e c u t i v e S u m m a r y |
N A V E : F i n a l R e p o r t t o C o n g r e s s 1
Executive Summary
Eighty-five years ago the federal government first committed to vocational education as
a national priority.1 Since then, the enterprise has grown to encompass a wide variety of
activities, participants, and purposes. Currently, nearly half of all high school students and
about one-third of college students are involved in vocational programs as a major part of
their studies. Perhaps as many as 40 million adults—one in four—engage in short-term,
postsecondary occupational training (Darkenwald and Kim 1998). These individuals come
to vocational education for different reasons, participate in different ways, and take differ-
ent paths afterwards. In an era in which strong skills and lifelong learning are rewarded, the
nature and impact of student experiences in vocational education could have important
implications for the nation’s workforce and America’s place in the global economy.
Federal efforts to improve the quality and availability of vocational programs are
articulated, most recently, in the Carl D. Perkins Vocational and Technical Education
Act (Perkins III).2 Passed in October 1998, this act reflects both continuity with previ-
ous vocational legislation and some substantive departures, specifically in funding and
accountability. As policymakers begin to consider further changes in law—in anticipation
of reauthorization scheduled for 2004—they will be examining vocational education as
a field in transition, prompted by sweeping changes in federal, state, and local educa-
tion and training priorities. This final report of the congressionally-mandated National
Assessment of Vocational Education (NAVE) provides information to enable new policy
to be responsive to these shifts.
A. Key Findings
The National Assessment of Vocational Education (NAVE) was charged with evaluating
the status of vocational education and the impact of Perkins III. After more than three
years of study NAVE finds that:
Vocational education has important short- and medium-run earning benefits for
most students at both the secondary and postsecondary levels, and these benefits
extend to those who are economically disadvantaged.
Over the last decade of academic reforms, secondary students who participate in
vocational programs have increased their academic course taking and achievement,
1The first federal legislation supporting vocational education was the Smith-Hughes Act of 1917.
2Other federal programs, such as student financial aid, tax credits, and the Workforce Investment Act, help provide individuals with access to occupational training at the postsecondary level; the Perkins Act provides support to institutions and programs.

| E x e c u t i v e S u m m a r y |
2 N A V E : F i n a l R e p o r t t o C o n g r e s s
making them better prepared for both college and careers than were their peers in
the past. In fact, students who take both a strong academic curriculum and a voca-
tional program of study—still only 13 percent of high school graduates—may have
better outcomes than those who pursue one or the other.
While positive change is certainly happening at the high school level, secondary
vocational education itself is not likely to be a widely effective strategy for improv-
ing academic achievement or college attendance without substantial modifications
to policy, curriculum, and teacher training. The current legislative approach of
encouraging “integration” as a way to move secondary vocational education toward
supporting academics has been slow to produce significant reforms.
In large part, the pace and path of improvement are hampered by a lack of clarity over
the program’s fundamental purpose and goal. Perkins III offers a conflicted picture of
federal priorities for vocational education improvement—academic achievement, techni-
cal skills, high school completion, postsecondary enrollment and degree completion, and
employment and earnings. Without a clearer focus for the federal investment—amount-
ing to about 5 percent of local spending—around which to rally the commitment and
efforts of vocational teachers, counselors, and administrators, ongoing program progress
in any particular direction is less certain.
This overall assessment draws on evidence addressing three key NAVE questions:
1. How does, or can, vocational education improve the outcomes of secondary stu-
dents who choose to enroll in vocational and technical programs?
2. What is the nature and impact of vocational education at the sub-baccalaureate
level, and what is its relationship to current workforce development efforts?
3. Is the policy shift from set-asides and legislative prescription to flexibility and
accountability likely to improve program quality and student outcomes? How do
special populations fare?
1. How does, or can, vocational education improve the outcomes of secondary students who choose to enroll in vocational and technical programs?
Perkins III and its legislative predecessors have largely focused on improving the prospects
for students who take vocational education in high school, a group that has historically
been considered low achieving and noncollege-bound.3 However, students who partici-
3About 62 percent of Perkins funds are spent at the high school level.

| E x e c u t i v e S u m m a r y |
N A V E : F i n a l R e p o r t t o C o n g r e s s 3
pate most intensively in vocational programs—those we call occupational “concentra-
tors”4—are actually quite diverse; certainly, about a quarter never enroll in postsecondary
education, but a substantial number (18 percent) go on to complete at least a baccalau-
reate degree. The vocational courses most high school students take improve their later
earnings but have no effect on other outcomes that have become central to the mission
of secondary education—such as improving academic achievement or college transitions
(Table 1). Whether the program as currently supported by federal legislation is judged
successful depends on which outcomes are most important to policymakers.
The short- and medium-term benefits of vocational education are most clear
when it comes to its longstanding measure of success—earnings. Several recent
studies highlight the positive average effects of vocational course taking on annual
earnings, measured just over a year or several years after high school graduation.
Seven years after graduation, for example, students earned almost 2 percent more
for each extra high school occupational course they took. That translates into about
Table 1Value-Added Effects of Vocational Education on Student Outcomes:
Summary of Recent Research Evidence
Outcome Effect Research Evidence
Academic achievement 0 Consistent
High school completion 0/+ Mixed
Postsecondary enrollmentShort-run (about one year after high school graduation) –/0 Mixed
Medium-run (seven years after high graduation) 0 One study
Postsecondary completion (seven years after high school graduation)
0 One study
Complete a four-year college degree (vs. associate degree or certificate)
– One study
Short- and medium-run earnings + Consistent
SOURCE: Agodini forthcoming; Agodini and Deke forthcoming; Agodini, Deke, et al. forthcoming; Crain et al. 1999; Hoachlander et al. forthcoming; Kemple and Scott-Clayton 2004; Plank 2001.
+ = vocational education increases the outcome.– = vocational education reduces the outcome.0 = vocational education has no effect on outcome.
4Occupational concentrators are defined as students who earn at least 3.0 occupational credits in one program area.

| E x e c u t i v e S u m m a r y |
4 N A V E : F i n a l R e p o r t t o C o n g r e s s
$450 per course, based on average earnings of about $24,000 (Figure 1); the benefit
would be $1,350 more for the 45 percent of all high school graduates who take at
least three occupational courses, including the quarter of graduates who concentrate
their course taking in one program area (occupational concentrators).
To varying extents, the studies indicate that these benefits extend to the large
group of high school graduates who enroll in postsecondary education and train-
ing, to both economically and educationally disadvantaged students, to those with
disabilities, and to both men and women. In addition, students who complete
the “New Basics” academic curriculum as well as a concentration of occupational
courses—about 13 percent of all graduates—earn more than similar students who
complete the New Basics and little vocational education.5 However, the studies are
more mixed on whether secondary vocational courses benefit the one-quarter of
high school graduates who never enroll in postsecondary education, a group that
has historically been the focus of vocational policy. There are also some important
Figure 1Average Earnings of 1992 High School Graduates, with and without an ExtraOccupational Course: First Year and a Half and Seventh Year after Graduation
SOURCE: Agodini, Deke, et al. forthcoming. Analysis of NELS 1994 and 2000 Follow-up Surveys.*Indicates that the effect is significantly different at the 0.05 level, two-tailed test.
$0
With extraoccupational course
Without extraoccupational course
$10,000
$20,000
$30,000
$40,000Average earnings
Seven years
Years after high school graduation
One year
$6,681 $6,474
$24,391
$455 (1.9%)*
$207 (3.2%)*
$23,936
5The “New Basics” academic curriculum, as measured here, is equivalent to four years of English or language arts, and three years each of math, science, and social studies. Many states are moving to this standard for core high school graduation requirements.

| E x e c u t i v e S u m m a r y |
N A V E : F i n a l R e p o r t t o C o n g r e s s 5
caveats to these earnings results. The evidence that vocational education increases
wages—a proxy for a “better” job—is weaker, and it is likely that the benefits will
continue to decline over time.
Students in vocational programs of study have significantly increased their aca-
demic course taking and achievement over the last decade, although gaps remain.
During the 1990s, successive groups of occupational concentrators took more, and
more rigorous, academic courses along side their vocational curriculum (Table 2).
By the end of the decade, the academic credit gap between them and students who
took little or no vocational education had narrowed substantially. However, there
were still differences between concentrators (51.1 percent) and non-concentrators
(60.3 percent) in the proportion who completed the extensive New Basics core aca-
demic curriculum and larger gaps in the percent that completed a rigorous college
preparatory curriculum (29.2 percent versus 46.2 percent).
Table 2Percentage of Occupational Concentrators and Non-concentrators Completing the
“New Basics” Core Academic Curriculum and a College Prep Curriculum: 1990 and 2000
Academic Indicator 1990 2000Percentage
Change
“New Basics” academic curriculum1
Occupational concentrators 18.5 51.1 +32.6*
Non-concentrators 45.7 60.3 +14.7*
Gap between concentrators and nonconcentrators -27.1 -9.2 -17.9*
College prep curriculum2
Occupational concentrators 10.1 29.2 +19.1*
Non-concentrators 35.9 46.2 +10.3*
Gap between concentrators and nonconcentrators -25.8 -17.0 -8.8*
SOURCE: Levesque 2003b. Analysis of High School Transcripts.1 New Basics = Four years of English and three years of math, science, and social studies.2 The “college-prep curriculum” is defined as earning 4.0 or more credits in English; 3.0 or more credits in mathematics at the algebra 1 or higher level; 2.0 or more credits in biology, chemistry, or physics; 2.0 or more credits in social studies, with at least 1.0 credit in U.S. or world history; and 2.0 or more credits in a single foreign language (see Levesque et al. 2000).
*Statistically significant at the 0.05 level.

| E x e c u t i v e S u m m a r y |
6 N A V E : F i n a l R e p o r t t o C o n g r e s s
More importantly, occupational concentrators also made substantial progress on
academic achievement (Figure 2). The National Assessment of Educational Progress
(NAEP) 12th-grade test scores of occupational concentrators increased during the
decade, by about 8 scale points in reading and 11 scale points in math. Students who
took little or no vocational education increased their reading achievement by about
4 points in reading and experienced no increase in math achievement. As a result of
these trends, the gap between concentrators and non-concentrators remained roughly
stable in reading, while the gap in math achievement was reduced significantly.
The NAEP assessments indicate that there has been substantial progress, but more
work is necessary to raise the achievement levels of all students, particularly those
in vocational programs. Most importantly, occupational concentrators are far less
likely than non-concentrators to be proficient in reading or math, as defined by
their most recent NAEP test scores (Figure 3). If proficiency on the 12th-grade NAEP
assessments is associated with readiness for postsecondary education or success in
the labor market, then these figures suggest a greater focus on academic improve-
ment is needed.
SPORTSMEN
Figure 2
Change in NAEP 12th-Grade Test Scores for Concentrators and Non-concentrators:Reading 1994–1998 and Mathematics 1990–2000
SOURCE: Levesque and Paret forthcoming. Analysis of 12th-Grade NAEP Assessments.
*Difference between concentrators and non-concentrators is statistically significant at the 0.05 level.NOTE: All increases over time are statistically significant at the 0.05 level except for non-concentrators in mathematics.
0
5
10
15
Change incomposite test score
8.0
4.2
11.2
0.4
Concentrators Non-concentrators
Mathematics*Reading

| E x e c u t i v e S u m m a r y |
N A V E : F i n a l R e p o r t t o C o n g r e s s 7
There is little evidence that vocational courses contribute to improving academic
outcomes. The noted improvements in academic performance are likely due to
higher academic graduation requirements and increased emphasis on academic
reforms. Both analyses of high school student data and randomized controlled stud-
ies indicate that, on average, vocational courses and programs do not themselves
“add value” to academic achievement as measured by test scores. Not surprisingly,
substituting additional academic courses for occupational courses does raise achieve-
ment. Moreover, although there is mixed evidence that vocational education reduc-
es dropping out of school, the more rigorous studies suggest there is no effect.
Postsecondary transition rates have increased; vocational courses neither hurt nor
help most students’ chances of going on to college but are associated with a shift from
earning a bachelor’s degree to earning an associate’s degree or certificate. Vocational
education has long been stigmatized as for the “noncollege bound” or as a deterrent to
college, although NAVE finds that neither of these concerns is well founded. The best
available national trend data indicate that higher proportions of occupational concen-
trators are moving on to some form of postsecondary education or training, although
they still participate overall at lower rates than do other students and in particular in
Figure 3Percentage of Concentrators and Non-concentrators Scoring at or above Proficiencyon NAEP 12th-Grade Test Scores: Reading 1994–1998 and Mathematics 1990–2000
0%
10%
20%
30%
40%
50%
21.4*
40.3
29.3*
44.8
3.8*
15.39.5*
17.3
Non-concentratorsConcentrators
SOURCE: Levesque and Paret forthcoming. Analysis of 12th-Grade NAEP Assessments.
*Difference between concentrators and non-concentrators is statistically significant at the 0.05 level.NOTE: All increases over time are statistically significant at the 0.05 level except for non-concentrators in mathematics (1990–2000).
2000199019981994
Reading Mathematics
Percentage scoring ator above proficiency

| E x e c u t i v e S u m m a r y |
8 N A V E : F i n a l R e p o r t t o C o n g r e s s
four-year colleges and universities (Table 3). Many concentrators enroll later, so that
by seven years after graduation nearly three-quarters versus 90 percent of all other stu-
dents have participated to some extent.
However, improvements in postsecondary enrollment do not appear related to voca-
tional course taking. Studies of graduates in both the early and later 1990s indicate
that vocational education itself has no effect on whether students ever attend post-
secondary education or training.6 Moreover, among those who enroll, high school
vocational education is associated with a lower likelihood of completing a bachelor’s
degree program and a corresponding higher likelihood of completing an associate’s
degree or certificate program.
Secondary vocational education is a large component of high school course tak-
ing and serves a diverse set of students, but it is an increasingly smaller share of
the overall curriculum. Nearly every student (96.6 percent) leaves high school hav-
ing taken some vocational education, although the extent of student involvement
varies. By almost any measure, participation remained stable during the last decade
after an earlier period of decline, withstanding schools’ ongoing focus on academic
Table 3Percentage of 1982 and 1992 High School Graduates Who Enrolled in Postsecondary
Education or Training within Two Years after Graduation: 1984 and 1994
Curriculum Path1982
Graduates1992
GraduatesPercentage
Change
1992 Graduates
in Four-Year Institutions
All students 57.3 73.0 +27.4 41.4
Occupational concentrators 41.5 54.7 +31.8 21.3
College preparatory 95.6 93.2 -2.5 73.3
Other/General 61.2 69.1 +12.9 30.4
SOURCE: Levesque et al. 2000. Analysis of the High School and Beyond Longitudinal Study (HS&B) and the National Education Longitudinal Study (NELS).
6Some students enroll in high school vocational education because they do not plan to attend college, so a nega-tive relationship between vocational courses and postsecondary education might be expected. However, even controlling for college plans and other student characteristics, vocational courses have no effect, on average, on postsecondary enrollment.

| E x e c u t i v e S u m m a r y |
N A V E : F i n a l R e p o r t t o C o n g r e s s 9
improvement. While there was little change in the amount of vocational course
work taken by high school students during the 1990s, students earned more aca-
demic credits, thus lowering vocational education’s share of the overall high school
curriculum—from 21.8 percent in 1982 to 17.8 percent in 1990 to 16.2 percent in
2000 (Figure 4). Still, high school students earn, on average, more credits in voca-
tional education (4.0) than in math (3.4) or science (3.1).
Those who participate most intensively—occupational concentrators—are a varied
set of students. However, those who have disabilities or are male, come from lower-
income or rural schools, or arrive at high school with low academic achievement
participate more substantially than do other students. These patterns were generally
stable during the last decade, although vocational education appeared to attract
more academically talented students during the 1990s. Less progress was made on
overcoming gender differences in vocational course participation.
The Perkins quality improvement strategies may be too vague to drive change
without clear direction. Perkins III carried over a variety of strategies from Perkins
II—such as integration of academic and vocational instruction, an all aspects of the
industry emphasis, linkages between secondary and postsecondary programs, col-
laboration with employers, and expanding the use of technology. Several of these
strategies, including integration, are ill defined and that may be a barrier to wider
implementation. In addition, little is known about their effectiveness in improving
Figure 4
Average Credits Earned by High Schools Students, by Type of Course Work: 1982–2000
SOURCE: Levesque 2003b, 2003c. Analysis of National High School Transcripts.1Includes courses such as art, music, and driver’s education.
Year
Credits earned
0
5
10
15
20
25
30
Academic
Vocational
Enrichment1
1994
2.6
4.0
17.6
24.2
1998
2.9
4.0
18.3
25.2
2000
2.9
4.2
18.8
25.9
1992
2.74.0
17.2
23.9
1982
2.6
4.7
14.3
21.6
1990
2.7
4.2
16.7
23.6

| E x e c u t i v e S u m m a r y |
10 N A V E : F i n a l R e p o r t t o C o n g r e s s
student outcomes. Perhaps more importantly, the practices are potentially targeted
toward different outcomes: for example, technology might be expected to affect
occupational-technical skills, integration to affect students’ academic achievement.
The list does not reflect a focused purpose to the federal investment.
Improving teacher quality will be important if vocational education is expected
to alter its mission. Teachers have the most direct impact on instruction and the
earnings benefits for many vocational students may suggest that this instruction is
valued in the labor market. However, federal legislation over the past decade has
tried to guide vocational education toward providing greater support for academic
achievement; student outcomes and program implementation suggest that these
efforts have been less successful. Current vocational teachers are less likely than aca-
demic teachers to have bachelors’ degrees and many do not feel they have received
sufficient professional development on the key strategy of integration. Moreover,
prospective high school vocational teachers (in vocational teacher training pro-
grams) score lower on basic reading and writing tests than do those preparing to be
elementary school teachers and lower on math tests than other secondary teach-
ers (Figure 5). Substantial investments in new recruitment and in-service training
approaches may be required if federal legislation continues to make supporting
academic achievement a priority for vocational education.
Figure 5PRAXIS (Preservice) Reading and Mathematics Scores,
by Type of Prospective Teacher: 1994–1999
174
180
SOURCE: Cramer forthcoming. Analysis of Praxis Test Scores.
NOTE: These results are for the paper-based version of the test.
179
178
177
176
175
174
180
179
178
177
176
175
98–9997–9896–9795–9694–9593–94 98–9997–9896–9795–9694–9593–94
PRAXIS Reading Scores PRAXIS Mathematics Scores
Elementary VocationalSecondary

| E x e c u t i v e S u m m a r y |
N A V E : F i n a l R e p o r t t o C o n g r e s s 11
Tech-Prep was a catalyst for certain vocational reform activities but, because few
schools implement it as a comprehensive program of study, it is now playing less
of a distinctive role. Efforts to promote both integration of academic and vocational
instruction and articulation between secondary and postsecondary education were
stimulated by the Tech-Prep Education Act in Perkins II. However, 12 years later,
few schools implement Tech-Prep as a structured program with at least two years
of clearly linked high school course work and at least two years of related postsec-
ondary course work (the “two-plus-two” design). The most recent estimates suggest
that about 10 percent of Tech-Prep consortia, representing 5 percent of Tech-Prep
students overall, may be promoting this comprehensive two-plus-two approach. In
2001, only seven states reported that they require local grantees to implement Tech-
Prep as a distinct program.
More typically schools implement individual components of the Tech-Prep model—
maintaining articulation agreements, providing professional development on inte-
gration to academic or vocational teachers, or improving career guidance and plan-
ning. Many of these activities are becoming part of secondary vocational education
more broadly, and little change has occurred at the postsecondary level to accom-
modate Tech-Prep students. As a result, Tech-Prep efforts now overlap substantially
with those of regular vocational education.
2. What is the nature and impact of vocational education at the sub-baccalaureate level, and what is its relationship to current workforce development efforts?
Given the labor market value of college credentials, “lifelong learning,” and flexibility in
skills, the role of sub-baccalaureate vocational education is increasingly important. Many
different types of students, with different intentions, cross the doors of community col-
leges and other Perkins-eligible postsecondary institutions; even with this diversity, the
institutions provide services from which most participating students benefit. Relatively
low rates of retention are a concern, however, not only because federal policy has long
encouraged postsecondary degree completion as a strategy for maintaining American
economic competitiveness, but also because individual participants would reap much
greater earnings advantage from staying long enough to earn a credential. An emphasis
on degree completion may be at odds with the shorter-term training emphasized by the
Workforce Investment Act (WIA). But at least so far, integration of decision-making and
services between Perkins and WIA has been limited in most states.

| E x e c u t i v e S u m m a r y |
12 N A V E : F i n a l R e p o r t t o C o n g r e s s
There are significant economic returns to postsecondary vocational education,
with the greatest benefits for those who earn a credential. As was true at the sec-
ondary level, vocational education in community colleges appears to produce a sub-
stantial positive effect on earnings for the vast majority of participants. There are dif-
ferences in these returns, depending on how much course work is completed (Table
4). Some postsecondary vocational participants do benefit from a year’s worth of
vocational course taking even without attaining a credential, earning between 5 and
8 percent more than do high school graduates with similar characteristics. However,
much higher economic rewards go to those who pursue significant amounts of post-
secondary vocational education and earn a degree or certificate; female associate’s
degree holders, for example, earn 47 percent more than similar students with a high
school degree and males earn 30 percent more. These results represent the average
effects of earning postsecondary degrees. Although many economists argue that the
effects vary widely by occupational field, the available data did not permit fields of
study to be analyzed separately.
Fewer than half of postsecondary vocational participants seeking a degree or
certificate take enough courses to earn a credential. Like their academic coun-
terparts, many vocational participants leave sub-baccalaureate institutions and
programs having completed few courses; more than two-thirds of vocational
majors complete the equivalent of a year or less of course work within a five-
year time period. Even among those who enroll with the goal of earning a degree
Table 4Adjusted Percentage Difference in Earnings between Postsecondary Vocational
Program Participants and High School Graduates, by Gender: 2000
Percentage Difference in Earnings1
Returns to: Male Female
One year of postsecondary vocational courses 8.0* 5.4
CredentialInstitutional certificate 6.5 16.3*
Vocational associate degree 30.2* 47.0*
SOURCE: Bailey, Kienzl, and Marcotte forthcoming. Analysis of the National Education Longitudinal Study (NELS).
1Numbers are the actual earnings returns in percentages, calculated by taking the anti-log of the regression coefficients; tests of statistical significance were computed using the original regression coefficients.
*Statistically significant at the 0.05 level.
| E x e c u t i v e S u m m a r y |
N A V E : F i n a l R e p o r t t o C o n g r e s s 13
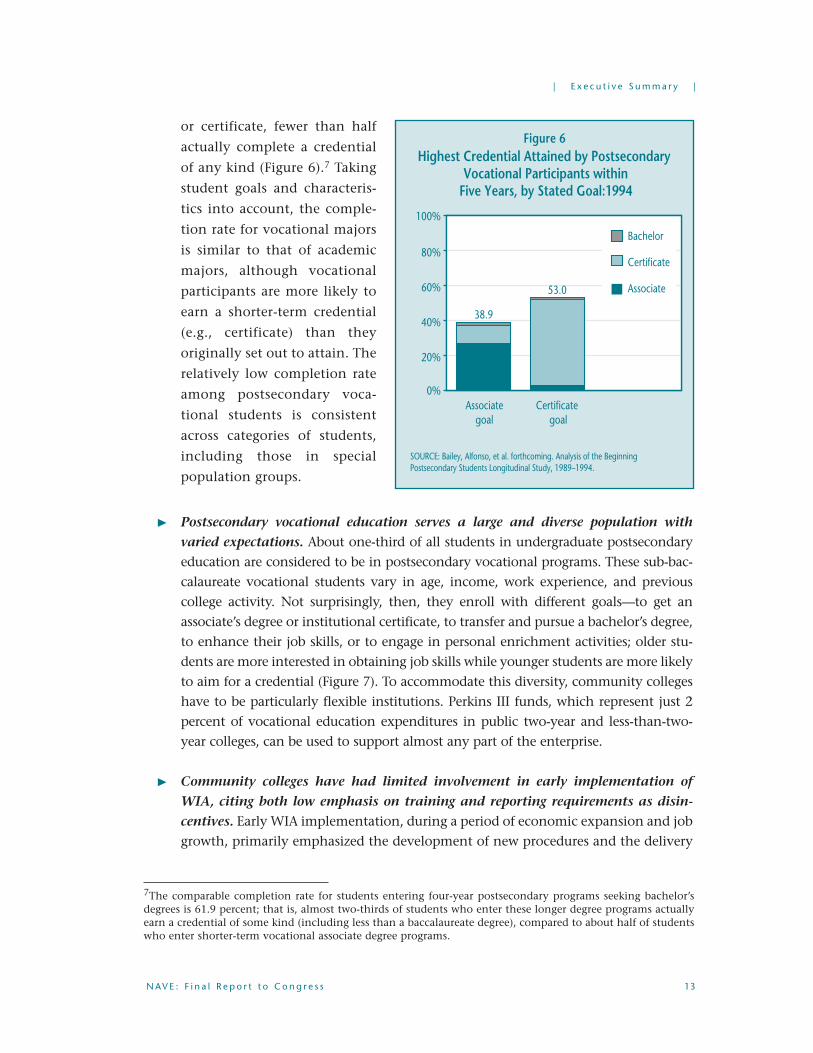
or certificate, fewer than half
actually complete a credential
of any kind (Figure 6).7 Taking
student goals and characteris-
tics into account, the comple-
tion rate for vocational majors
is similar to that of academic
majors, although vocational
participants are more likely to
earn a shorter-term credential
(e.g., certificate) than they
originally set out to attain. The
relatively low completion rate
among postsecondary voca-
tional students is consistent
across categories of students,
including those in special
population groups.
Postsecondary vocational education serves a large and diverse population with
varied expectations. About one-third of all students in undergraduate postsecondary
education are considered to be in postsecondary vocational programs. These sub-bac-
calaureate vocational students vary in age, income, work experience, and previous
college activity. Not surprisingly, then, they enroll with different goals—to get an
associate’s degree or institutional certificate, to transfer and pursue a bachelor’s degree,
to enhance their job skills, or to engage in personal enrichment activities; older stu-
dents are more interested in obtaining job skills while younger students are more likely
to aim for a credential (Figure 7). To accommodate this diversity, community colleges
have to be particularly flexible institutions. Perkins III funds, which represent just 2
percent of vocational education expenditures in public two-year and less-than-two-
year colleges, can be used to support almost any part of the enterprise.
Community colleges have had limited involvement in early implementation of
WIA, citing both low emphasis on training and reporting requirements as disin-
centives. Early WIA implementation, during a period of economic expansion and job
growth, primarily emphasized the development of new procedures and the delivery
Figure 6Highest Credential Attained by Postsecondary
Vocational Participants withinFive Years, by Stated Goal:1994
SOURCE: Bailey, Alfonso, et al. forthcoming. Analysis of the BeginningPostsecondary Students Longitudinal Study, 1989–1994.
0%
20%
40%
60%
80%
100%
Certificategoal
Associategoal
38.9
53.0
Bachelor
Certificate
Associate
7The comparable completion rate for students entering four-year postsecondary programs seeking bachelor’s degrees is 61.9 percent; that is, almost two-thirds of students who enter these longer degree programs actually earn a credential of some kind (including less than a baccalaureate degree), compared to about half of students who enter shorter-term vocational associate degree programs.

| E x e c u t i v e S u m m a r y |
14 N A V E : F i n a l R e p o r t t o C o n g r e s s
of employment information over the kinds of training activities Perkins-eligible
institutions typically provide. There is some evidence that, with the recent economic
downturn, both the availability of training vouchers and policy interest in training
are increasing, but the lack of coordination between WIA and Perkins accountability
measures reportedly still leads to substantial burden for participating institutions.
3. Is the policy shift from set-asides and legislative prescription to flexibility and accountability likely to improve program quality and student outcomes? How do special populations fare?
The funding and accountability changes enacted under Perkins III have been partially
successful in addressing policymakers’ objectives, although much is still in development.
Local grantees are receiving larger dollar amounts and case studies suggest they are able
to distribute secondary Perkins funds to more schools, outcomes consistent with the goal
of directing more money to the local rather than state levels. However, both the tradi-
tional ways in which grantees use their funds and early implementation of the higher
stakes accountability system forecast at best slow change in vocational program quality.
Despite serious commitment among state administrators, technical measurement and
data quality problems hinder widespread use of performance data for program manage-
ment at either the state or local levels. Given these deficiencies, it seems unlikely that,
in the short run, the accountability system will have particular benefits for special popu-
lation students, especially since identifying and collecting data on these students has
proven to be particularly difficult for state and local officials. The effects of eliminating
targeted set-asides intended to promote gender equity is currently unknown.
Figure 7Percentage Distribution of Postsecondary Vocational Students,
by Age and Reported Primary Goal: 1996
0%
20%
40%
60%
80%
100%
Younger than 20 20–23 24–29 Older than 29
30.4
24.6
33.3
11.7
43.6
19.5
20.2
16.7
51.4
26.9
10.011.7
29.3
20.5
37.6
12.5Personal enrichment
Transfer
Degree/certificate
Job skills
SOURCE: Silverberg et al. 2002. Analysis of the National Postsecondary Student Aid Study, 1996.NOTE: Percentages may not add to 100.0 due to rounding.
Age

| E x e c u t i v e S u m m a r y |
N A V E : F i n a l R e p o r t t o C o n g r e s s 15
The new law succeeded in sending a higher share of funds to the local level. The
average size of local grants grew substantially between Perkins II and Perkins III
(approximately 34 percent for secondary and 26 percent for postsecondary grantees)
(Table 5). These increases cannot be fully explained by increases in federal appropria-
tions that go to state grants (just over 15 percent) or a reduction in the number of
grants awarded.
Flexibility provisions are popular, but may be weakening the targeting of funds
to high-poverty communities. Nearly 30 states at the secondary level and 20 at
the postsecondary level use at least one of the flexibility provisions in Perkins III.
The most common choice is the newly established “reserve fund” provision, which
allows states to award 10 percent of local funds to programs in rural and other areas
without using the poverty-weighted legislated formula. Perhaps as a result, the dollar
advantage of high-poverty districts has declined since Perkins II (Table 6).
Perkins III also included several options to allow states to better coordinate federal
vocational funds and activities with those of other federal programs. Only one
state submitted to ED a “consolidated” plan to integrate vocational education with
other education programs, and 12 states submitted “unified” plans in which they
described their expected activities under some combination of the Perkins, WIA,
Table 5Grant Amounts Awarded to Secondary and Postsecondary Recipients:
1992 and 2001
Grant Amounts 1992 2001 DifferencePercentage
Change
Perkins appropriations for state and substate grants (in thousands)1 $954,259 $1,100,000 $145,741 15.3
Average secondary substate grant amount
Current dollars 76,238 101,813 25,575 33.5
Real dollars (2001) 96,670 101,813 5,143 5.3
Average postsecondary substate grant amount
Current dollars 226,019 285,645 59,626 26.4
Real dollars (2001) 286,592 285,645 -947 -0.3
SOURCE: White et al. forthcoming. Analysis of National Survey of State Directors of Vocational Education, Fiscal Data 1992 and 2001.1Overall Perkins appropriations included other programs that on average increased 7.3 percent between 1992 and 2001.

| E x e c u t i v e S u m m a r y |
16 N A V E : F i n a l R e p o r t t o C o n g r e s s
Adult Education, and Vocational Rehabilitation laws. Although, under the ED Flex
program, states received the authority to waive Perkins requirements, states gener-
ally did not exercise that authority.
Implementation is progressing, but so far the performance measurement system
is rarely viewed as a tool for program improvement. The current system, perhaps
the first legislated accountability effort with significant “teeth,” is still evolving
and state officials have demonstrated a serious commitment to it. However, sev-
eral factors limit its likely impact on vocational programs and student outcomes in
the next few years: (1) difficulty collecting data, (2) lack of validity or reliability of
many adopted performance measures, and (3) inconsistent approaches to data col-
lection and reporting within states. Certainly, the current system cannot provide a
reliable, national picture of vocational education performance. Overall, the quality
and reach of the Perkins accountability measures vary considerably by indicator, by
state, within state, and sometimes even within local grantees’ programs. It is there-
fore unsurprising that relatively few states or districts use the performance data for
consequential decision-making.
Table 6Average Perkins Grant Amounts, Adjusted for Student Enrollments,
by LEA Poverty Level: 1992 and 20011
Grant Amount per Secondary Student2
Poverty Level3 1992 2001Percentage
Change
High-poverty school districts $51 $53 3.9
Medium-poverty school districts 28 32 14.3
Low-poverty school districts 32 41 28.1
All school districts 32 40 25.0
SOURCE: White et al. forthcoming. Analysis of National Survey of State Directors of Vocational Education, Fiscal Data 1992 and 2001, and NCES, Common Core of Data (CCD).1Averages based on 29 states for which data were available in both 1992 and 2001 and where more than 80 percent of grantee recipients in a state had an NCES ID.2These calculations adjust for the number of 9th- through 12th-grade students in a district to isolate the effects of targeting from those of enrollments. 3Poverty level is measured by the number of students in a district qualifying for the federal free or reduced-price lunch program: Low poverty = 0 to 9 percent of students in a district qualify; medium poverty = 10 to 49 percent of students; and high poverty = 50 percent or more of students.

| E x e c u t i v e S u m m a r y |
N A V E : F i n a l R e p o r t t o C o n g r e s s 17
Although there have been some cutbacks in staffing dedicated to special popula-
tion services, the full effects on programs and students are unknown. Even with
the elimination of the gender equity set-asides and coordinator requirements, many
states continued to support these efforts, though the amount of staff time seems to
have declined. In 2001, 23 states reported having at least one gender equity coordina-
tor working full- or part-time, but case studies suggest these figures represent reduc-
tions from Perkins II. There were fewer observed effects at the local level, with other
funding sources sometimes making up for the loss of Perkins gender equity grants.
There were cutbacks in targeted programs and services in some communities, but
how these might affect student outcomes cannot be known for several more years.
B. Options for Future Directions8
Despite the current strengths of the vocational education system supported by Perkins
III, there remain ongoing challenges for further improvement. Policymakers may wish to
consider a variety of ways—encompassing broad or more specific strategies—in which to
shape the course of these improvements.
1. Broad Strategies for Promoting Change
There are several possible options that have implications for the structure of a new or
revised law. These broad strategies share a common goal of providing a clearer focus to
federal priorities.
Transform Perkins into a program with clear, focused, and limited objectives.
The Perkins legislation authorizes a stream of funds that provides wide latitude to state
and local grantees in terms of implementation and goals. The law’s reporting requirements
reflect the historical accumulation of purposes that have been laid out for vocational edu-
cation: improving students’ academic and technical skills, enhancing high school comple-
tion, promoting postsecondary enrollment and completion, and ensuring successful labor
market entry and retention.9 All of these, it could be argued, are worthy objectives for
federal policy to address at either the high school or college level, or both.
8Perkins III requires the NAVE to provide “findings and recommendations resulting from the assessment” (Section 114(c)).
9Since federal vocational education legislation was enacted in 1917, the law has responded to changing needs and acquired new objectives. Initially, it was a way to prepare immigrant and rural populations to work in factories and on farms. At some point it became a form of training that might appeal to less academically ori-ented students, perhaps helping to keep them in school by engaging them in activities most relevant to future employment. Over time vocational education was supported as a strategy to keep the United States interna-tionally competitive, by delivering advanced technical training to meet the needs of an increasingly high-tech economy. More recently, vocational education has been promoted as a strategy to enhance academic learning and provide a clearer pathway to success in college.

| E x e c u t i v e S u m m a r y |
18 N A V E : F i n a l R e p o r t t o C o n g r e s s
However, it is reasonable to question the capacity of any single law or any single pro-
gram strategy to succeed on all of these fronts. The diffuse nature of federal priorities for
this stream of funds both reflects and contributes to ambivalence among policymakers
and educators about what “problem” is being addressed by the Perkins legislation, and
impedes efforts to develop clear, focused, and tested education interventions designed to
ameliorate the identified problem.
The federal investment could be more effective if directed toward a narrower set of goals
around which program improvement strategies and accountability systems could be
developed. There are some choices in moving in that direction:
Emphasize immediate goal of education or workforce development. Decision-mak-
ers may want to weigh whether vocational education, or the activities the Perkins
legislation supports, should most directly and immediately contribute to:
• Education, in which the emphasis is primarily on learning academic or occu-
pational skills (or both) while enrolled in school; or
• Workforce development, in which the emphasis is primarily on job and other
post-school outcomes.
These various objectives are certainly interrelated and clarifying the priorities does
not imply that vocational education cannot also have other benefits. Studies clearly
link higher levels of learning and of educational attainment to success in the work-
place (see NAVE Interim Report [Silverberg et al. 2002]). The language in Perkins
III and of vocational advocacy groups suggest that effective technical skills rest on
a strong foundation of academic proficiency. The question is, however, which of
these goals is most critical for Perkins-funded activities? A focus is important for the
federal role of promoting continuing improvement.
Separate the high school and postsecondary components of the Perkins Act versus
keeping them joined in the structure of the law. In some sense, secondary and
postsecondary vocational education share many qualities. Both are elective choices
for students rather than a required curriculum. Both serve an increasingly diverse
set of students, who have widely varying purposes for participating and hopes for
what they will accomplish. When secondary vocational education was clearly a pro-
gram for developing occupational skills and preparing for immediate employment,
the strategies at the two levels were similar. However, that may no longer be the
case. Because the mission of high schools and community and technical colleges
differ, as do the challenges they face, policymakers may decide that federal voca-
tional education should play a different role at each level. For example, although

| E x e c u t i v e S u m m a r y |
N A V E : F i n a l R e p o r t t o C o n g r e s s 19
10Requiring postsecondary institutions to be responsible would not preclude other Perkins institutions—sec-ondary districts, high schools, area vocational centers, adult centers—from playing major roles in these activi-ties, as is appropriate. However, designating the lead institutions in law may help ensure that the activities are a focus of funded efforts.
federal policy may charge secondary vocational education with reinforcing high
schools’ learning objectives, policy may choose to more clearly tie postsecondary
vocational education to workforce development outcomes.
Establishing separate policies and goals for vocational education at the two levels
need not undermine the current federal emphasis on developing clear pathways
from high school to postsecondary education. On the contrary, with two separate
titles or sections, the law could more clearly articulate the specific responsibilities of
secondary and postsecondary institutions to create and maintain those pathways.
Eliminate Tech-Prep as a separate title, folding its key activities into postsecondary institutions’ responsibilities.
Tech-Prep has spurred some important efforts but has not lived up to its promise of
creating rigorous programs of technical study. The Tech-Prep title of the Perkins Act
has become a funding stream like the larger state grant title in Perkins, allowing local
consortia to supplement vocational education or other efforts associated generally with
the spirit of the law (e.g., career development). Rarely are funds focused on developing
the well-defined two-plus-two (2+2) programs that early Tech-Prep advocates promoted:
integrated high school academic and vocational curricula that are “articulated”—linked
through credit transfer agreements—to postsecondary programs. Instead, integration and
articulation have been implemented more on a course-by-course basis. Moreover, these
two key components of Tech-Prep have become more common priorities for vocational
education generally, diminishing the distinctive role that Tech-Prep efforts might play.
Finally, there is some evidence that Tech-Prep funds are not as well targeted to high-pov-
erty areas as are the formula-driven basic grant funds under the Perkins Act.
Despite these limitations, Tech-Prep remains the catalyst for some initiatives and strate-
gies that many consider worth preserving. Two, in particular—convening local partners
to collaborate on postsecondary transition issues and updating articulation agreements—
could instead become required activities for postsecondary Perkins grantees, many of
whom already play this role as part of Tech-Prep consortia.10
This strategy could, in effect, focus the Perkins-funded efforts of eligible postsecondary
institutions on serving their younger students (those transitioning from high school)
rather than on the older adult population. Such an emphasis might be warranted,
because the younger students are less likely to be on a stable trajectory toward labor

| E x e c u t i v e S u m m a r y |
20 N A V E : F i n a l R e p o r t t o C o n g r e s s
market success: they have more limited work histories and previous college or job train-
ing experience, and there is some evidence that earning a credential matters more for
them than for older students. Given that Perkins grants represent about 2 percent of
local community college spending on occupational education, a focus for federal funds
on younger students might also strengthen current efforts to develop rigorous cross-level
course sequences, pathways, or programs of study.
Streamline accountability requirements to align with the more focused objectives.
The current accountability provisions in Perkins III require secondary and postsecondary
grantees to report on a broad array of student outcomes, both those that students achieve
while in school (academic achievement, occupational-technical skill development, school
completion) and those that define their paths after they leave (further education or training
and employment). There are two reasons for reducing the number of indicators:
To limit burden and improve performance data quality. Many states are finding it
burdensome to meet all of the reporting obligations and their current performance
measures and data collection approaches have limited validity and reliability, imped-
ing reliance on them for significant program management decisions. Improvements
in data quality and use are more likely if state and local grantees could concentrate
their efforts on a smaller set of indicators.
To focus program improvement activities. The accountability system is intended to
motivate states, districts, and postsecondary institutions to manage their programs
more effectively. A more limited set of performance indicators, closely aligned to
policymakers’ priorities for the federal investment, could encourage more targeted
improvement efforts.
2. Specific Strategies for Improved Performance
Although there are broad changes to the structure of the law that policymakers could
pursue, there are also individual practices and strategies new legislation could promote
that might improve particular outcomes (Table 7). Ideally, one set of strategies would be
emphasized, tied to a clear declaration of federal priorities. However, the strategies could
also be implemented in combination.
These specific approaches—summarized in Table 7—draw to a large extent on current
research and evaluation analyses, most conducted under the NAVE.

| E x e c u t i v e S u m m a r y |
N A V E : F i n a l R e p o r t t o C o n g r e s s 21
Table 7
Overview of Specific Strategies to Improve Vocational Program Performance, by Federal Priority
Federal Priority for Vocational Education Improvement Strategies
Secondary Level
Enhance academic achievement Make priority more explicit in law
Support curriculum development strengthening aca-demic content of vocational courses
Limit funding to programs with proven academic con-tent
Invest in focused teacher training
Raise occupational and technical skills in high schools
Require content and performance standards for voca-tional courses
Promote aligned end-of-course technical assessments
Include rewards and sanctions
Improve employment and earnings, particu-larly for noncollege-bound students
Encourage implementation of vocational program course sequences
Promote work experience programs
Postsecondary Level
Improve employment and earnings Focus improvement efforts on younger students
Work with high schools to give students realistic sense of college, training, and job requirements
Place more emphasis on support services
3. Closing
Vocational education, increasingly known as career and technical education, is a long-
standing program whose place in American education continues to evolve. The broad-
ening of its goals, the ongoing diversity of participants, and the changing education
and labor market climate in which it operates, suggest vocational education is a flexible
option for schools and students.
With this flexibility comes some challenges, however. At the high school level, partici-
pation in vocational education is an elective choice that faces increasing pressure from
emphasis on academic improvement. For both secondary and postsecondary vocational
education, the wide range of participants and objectives raises a question about how

| E x e c u t i v e S u m m a r y |
22 N A V E : F i n a l R e p o r t t o C o n g r e s s
effective a role federal policy plays and whether that policy can or should promote a
clearer set of priorities. This final NAVE report is designed to contribute to that discussion,
by providing the most up-to-date and comprehensive assessment of vocational education
in the United States and of the effects of the Carl D. Perkins Vocational and Technical
Education Act of 1998.

| E x e c u t i v e S u m m a r y |
N A V E : F i n a l R e p o r t t o C o n g r e s s 23
References
Agodini, Roberto. Forthcoming. Achievement Effects of Vocational and Integrated Studies. Princeton, N.J.: Mathematica Policy Research, Inc.
Agodini, Roberto, and John Deke. Forthcoming. The Relationship between High School Vocational Education and Dropping Out. Princeton, N.J.: Mathematica Policy Research, Inc.
Agodini, Roberto, John Deke, Timothy Novak, and Stacey Uhl. Forthcoming. Vocational Education and Postsecondary Outcomes: Eight Years After High School. Princeton, N.J.: Mathematica Policy Research, Inc.
Bailey, Thomas R., Mariana Alfonso, Marc Scott, and Timothy Leinbach. Forthcoming. Educational Outcomes of Occupational Postsecondary Students. New York: Columbia University, Teachers College, Institute on Education and the Economy.
Bailey, Thomas R., Gregory Kienzl, and David Marcotte. Forthcoming. The Return to a Sub-Baccalaureate Education: The Effects of Schooling, Credentials, and Program of Study on Economic Outcomes. New York: Columbia University, Teachers College, Institute on Education and the Economy.
Crain, R., A. Allen, R. Thaler, D. Sullivan, G. Zellman, J. Little, and D. Quigley. 1999. The Effects of Academic Career Magnet Education on High Schools and Their Graduates. Berkeley, Calif.: University of California, National Center for Research in Vocational Education.
Cramer, Kevin. Forthcoming. The Vocational Teacher Pipeline: How Academically Well- Prepared Is the Next Generation of Vocational Teachers? Washington, D.C.: U.S. Department of Education, Office of the Under Secretary.
Darkenwald, Gordon, and Kwang Kim. 1998. Statistics in Brief: Adults’ Participation in Work-Related Courses: 1994–1995. Washington, D.C.: U.S. Department of Education, Office of Educational Research and Improvement, National Center for Education Statistics. NCES 98–309.
Hoachlander, Gary, Denise Bradby, Robert Fitzgerald, Marcel Paret, Peter Teitelbaum, W. Lee Holcombe, Christopher T. King, and Robert W. Glover. Forthcoming. Career and Technical Education in Two States: Participation and Student Outcomes. A report prepared by MPR Associates and the Ray Marshall Center for the Study of Human Resources, University of Texas at Austin for the National Assessment of Vocational Education. Washington, D.C.: U.S. Department of Education, Office of the Under Secretary.
| E x e c u t i v e S u m m a r y |
24 N A V E : F i n a l R e p o r t t o C o n g r e s s
Kemple, James, and Judith Scott-Clayton. 2004. Career Academies: Impacts on Labor Market Outcomes and Educational Attainment. New York: MDRC.
Levesque, Karen. 2003b. Trends in High School Vocational/Technical Coursetaking: 1982–1998. Washington, D.C.: U.S. Department of Education, Institute of Education Sciences, National Center for Education Statistics. NCES 2003–025.
Levesque, Karen. 2003c. “Analysis of 2000 High School Transcripts.” Tables prepared by MPR Associates for the National Assessment of Vocational Education. Washington, D.C.: U.S. Department of Education, Office of the Under Secretary.
Levesque, Karen, and Marcel Paret. Forthcoming. The Academic Achievement Gains of Occupational Concentrators and Nonconcentrators: 1990–2000. A report prepared by MPR Associates for the National Assessment of Vocational Education. Washington, D.C.: U.S. Department of Education, Office of the Under Secretary.
Levesque, Karen, Doug Lauen, Peter Teitelbaum, Martha Alt, and Sally Librera. 2000. Vocational Education in the United States: Toward the Year 2000. Washington, D.C.: U.S. Department of Education, Office of Educational Research and Improvement, National Center for Education Statistics. NCES 2000–029.
Plank, Stephen. 2001. Career and Technical Education in the Balance: An Analysis of High School Persistence, Academic Achievement, and Postsecondary Destinations. St. Paul, Minn.: National Center for Research in Career and Technical Education, University of Minnesota.
Silverberg, Marsha, Elizabeth Warner, David Goodwin, and Michael Fong. 2002. National Assessment of Vocational Education: Interim Report to Congress. Washington, D.C.: U.S. Department of Education, Office of the Under Secretary.
White, Robin, Ivan Charner, Gail Promboin, Amy Johnson, Glenn Nyre, and Richard Phelps. Forthcoming. The Structures and Challenges of Vocational Education Funding and Accountability Systems. A report prepared by the Academy for Educational Development for the National Assessment of Vocational Education. Washington, D.C.: U.S. Department of Education, Office of the Under Secretary.


![NATIONAL VOCATIONAL EDUCATION QUALIFICATION FRAMEWORK ...€¦ · NATIONAL VOCATIONAL EDUCATION QUALIFICATION FRAMEWORK [NVEQF] ... framed a National Vocational Education Qualification](https://static.fdocuments.us/doc/165x107/5ac361b97f8b9af91c8bec0e/national-vocational-education-qualification-framework-national-vocational.jpg)