
National assessment of cambodia’s main crop and fodder resources
14
“Use of Environmental Animal Health Management Strategies for Decision-Making” 18-19 September 2013 Fairmont Hotel, Makati City, Philippines
-
Upload
sitha-aum -
Category
Presentations & Public Speaking
-
view
76 -
download
2
Transcript of National assessment of cambodia’s main crop and fodder resources
“Use of Environmental Animal Health Management Strategiesfor Decision-Making”
18-19 September 2013Fairmont Hotel, Makati City, Philippines

18-19 September 2013 · Makati City, Philippines
National Assessment of Cambodia’s
Main Crop and Fodder Resources
Aum SithaMonitoring, Evaluation and GIS Specialist
Centre for Livestock and Agricultural Development (CelAgrid)Phnom Penh, Cambodia
18-19 September 2013 · Makati City, Philippines
Presentation Outline
I. Introductiona. Background of the Studyb. Rationale and/or Relevance of the Study
II. Methodology/Activities ConductedIII. ResultsIV. Challenges/ConstraintsV. ConclusionsVI. Next Steps/Way Forward

18-19 September 2013 · Makati City, Philippines
Introduction
Background of the Study
The Centre for Livestock and Agriculture Development (CelAgrid) was, therefore, commissioned to conduct a “Field study on an assessment of Cambodia Crops and Fodder Resources” by Letter of Agreement (LOA/RAP/2010/75) with the Food and Agriculture Organization (FAO) of the United Nations signed on 6 December 2010.
The assessment project started from January 1 to December 31, 2011.
Lack of information of national and spatial database on fodder resources both as a strategic input for Cambodia, the Environmental and Animal Health Management Initiative project raised up a recommend in the inception of the Environmental Animal Health Management Initiative (EAHMI) in Cambodia that "more detailed disaggregated information is needed on the distribution and abundance of fodder and animal feeds resources, and the temporal and spatial patterns of domestic animal resources"(Sar and Bourn, 2010).

18-19 September 2013 · Makati City, Philippines
IntroductionRationale/Relevance of the Study
A range of geospatial datasets have been obtained from various sources by theEnvironmental Animal Health Management Initiative (EAHMI) in Cambodia including: human,livestock and poultry population densities, land cover, topography (elevation above the sealevel), water resources, administrative boundaries, and major towns, rail and road networks.
However, these datasets are by no means complete or up to date, and are frequentlyaggregated to provincial level. A national fodder resources assessment is required to providemeaningful estimates of fodder resources at district level across Cambodia.
The study’s purpose is to conduct a national assessment of Cambodia fodder resources bydistrict and province, Geographical Information System (GIS) and Global Positioning System(GPS) technology and ground truthing in representative field sites across the country. Thestudy was also include the use the latest available spatial data relating to human, livestockand poultry population densities, land cover, topography (elevation above the sea level),water resources, administrative boundaries, and major towns.
18-19 September 2013 · Makati City, Philippines
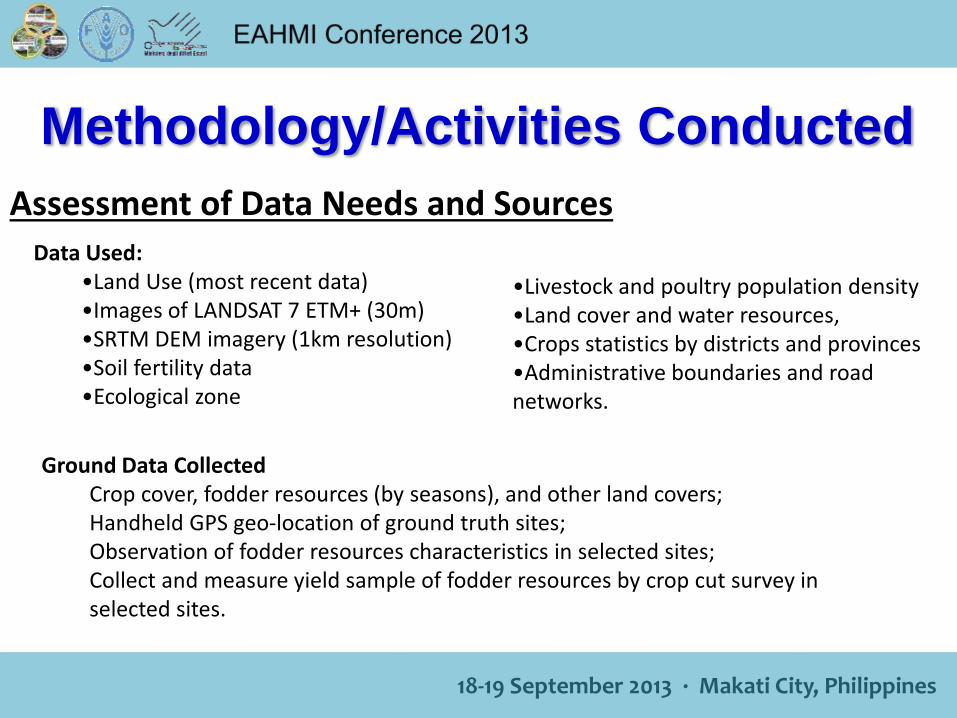
Methodology/Activities Conducted
Assessment of Data Needs and SourcesData Used:
•Land Use (most recent data) •Images of LANDSAT 7 ETM+ (30m)•SRTM DEM imagery (1km resolution)•Soil fertility data•Ecological zone
Ground Data CollectedCrop cover, fodder resources (by seasons), and other land covers;Handheld GPS geo-location of ground truth sites;Observation of fodder resources characteristics in selected sites;Collect and measure yield sample of fodder resources by crop cut survey in selected sites.
•Livestock and poultry population density •Land cover and water resources, •Crops statistics by districts and provinces•Administrative boundaries and road networks.

18-19 September 2013 · Makati City, Philippines
Methodology/Activities Conducted
Training of GIS/GPS and Their Application
All data collectors were trained on how to use GPS, collect data, way of measurement yield’s plots, scaling and calculating yield. Coordination of sample sits were collected by enumerators. Getting GPS points from field, GIS specialist downloaded them from GPS using Arc -GIS version 9.3 mixing with administrative boundary and generated maps of sample sites collected. Software applications used in the survey were ERDAS Imagine 9.2 and Arc-GIS 9.3

18-19 September 2013 · Makati City, Philippines
Methodology/Activities Conducted
Data AnalysisCrop cut survey’s measurement synthesis from manual of Agricultural Statistic and Data Collection on Crop Cutting Survey, Department of Planning and Statistics of MAFF Feb. 2010, Cambodia.
Data analysis was conducted to assess crop and fodder resources as rice (rice’s straw), cassava, corn, sugarcane, and natural grass per hectare for estimating and preparing spatial data on crops and fodder resources by district and province in Cambodia.
Crop cuts weighed separately to obtain wet weights, and after thorough drying re-weighed to obtain dry weights. Average dry weight yields were calculated for each component and multiplied by provincial and district crop areas to provide overall production estimates, and mapped using Geographical Information System (GIS) software, as depicted in maps and poster.
18-19 September 2013 · Makati City, Philippines
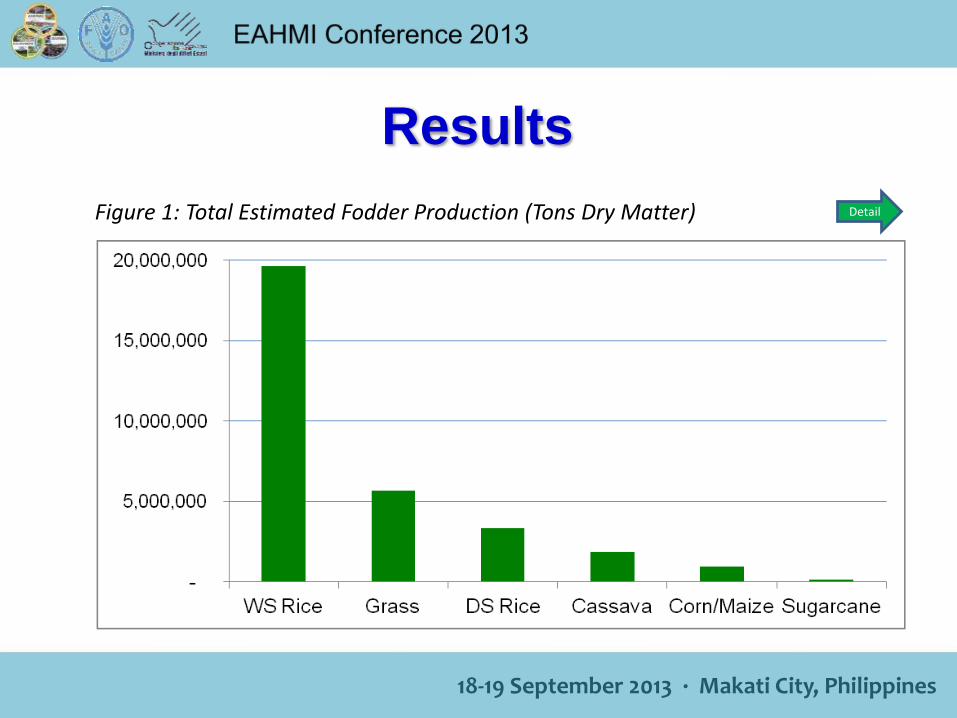
Results
Figure 1: Total Estimated Fodder Production (Tons Dry Matter) Detail
18-19 September 2013 · Makati City, Philippines
Challenges/Constraints
• There were not all types of crops as cassava and corn in some districts of selected Province, we decide to select amount of sample from other selected districts instead.
• Satellite images are not fully involved in analysis on crop yield estimation yet due to serials of times acquired are not supported to the period of the survey 2010/11.
• There were many types of crops with different time of yields production making all data collectors wait till their times for crop cut survey.

18-19 September 2013 · Makati City, Philippines
Provincial fodder production and farm animal biomass per square kilometer (based on a standard 250kg tropical animal unit) are compared in Figure 2.
Farm animal biomass densities by province are shown on the front row of the grid, with various crop and grass production densities in rows behind. and total crop and grass production density on the back row.
ConclusionsFigure 2: Fodder Production (Tons Dry Matter) and Animal Biomass (Standard Animal Units) per Square Kilometre, by Province
18-19 September 2013 · Makati City, Philippines
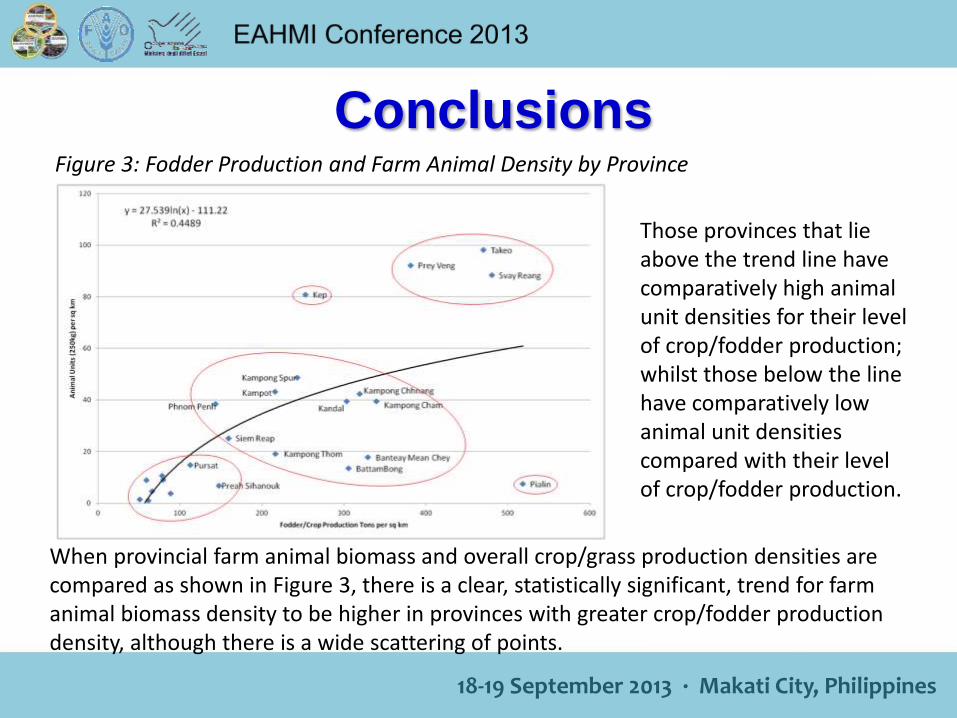
When provincial farm animal biomass and overall crop/grass production densities are compared as shown in Figure 3, there is a clear, statistically significant, trend for farm animal biomass density to be higher in provinces with greater crop/fodder production density, although there is a wide scattering of points.
Those provinces that lie above the trend line have comparatively high animal unit densities for their level of crop/fodder production; whilst those below the line have comparatively low animal unit densities compared with their level of crop/fodder production.
ConclusionsFigure 3: Fodder Production and Farm Animal Density by Province

18-19 September 2013 · Makati City, Philippines
Next Steps / Way Forward
Showcase how this will used by CelAgrid and/or DAPH
• Use as documentation for further research. • Supporting projects relevant livestock production• Support students in their research• Spatial database and reference in Department of Animal Health
and Production for using in all kind of relevant purposes . • Develop strategic on livestock production in Cambodia• Support large scale farm, and animal feed producers in their
decision making on feeds, and their location.• Support investors on decision making base on animal
population and fodder resources in Cambodia.

18-19 September 2013 · Makati City, Philippines
Thanks for your attention!


![State: Jharkhandjsac.jharkhand.gov.in/pdf/crop/JKD1-Garhwa-10.08.12[1].pdf · Cauliflower 0.520 0.520 Medicinal and Aromatic crops - Plantation crops - Fodder crops - Total fodder](https://static.fdocuments.us/doc/165x107/5e984abdba1859541f1aa068/state-1pdf-cauliflower-0520-0520-medicinal-and-aromatic-crops-plantation.jpg)


