National and State Trend Data, 1997-2007
59
Low-Income Children in the United States National and State Trend Data, 1997-2007 November 2008 REPORT
Transcript of National and State Trend Data, 1997-2007

Low-Income Children in the United StatesNational and State Trend Data, 1997-2007
November 2008
R E P O RT

Low-INCome ChILdreN IN the UNIted StateS National and State trend data, 1997-2007
After nearly a decade of decline, the number of children living in low-income families has increased significantly since 2000. This data book provides national and 50-state trend data on the characteristics of low-income children over the past decade: parental education, parental employment, marital status, family structure, race and ethnicity, age distribu-tion, parental nativity, home ownership, residential mobility, type of residential area, and region of residence.
The most current year of data can also be accessed at www.nccp.org – see NCCP’s 50-State Demographic Profiles or build custom tables using NCCP’s 50-State Demographics Wizard. For a discussion of these data and selected policy implications, see NCCP’s fact sheets on low-income children, which are updated annually.
ACkNoWleDgmeNTS
All data were calculated from the U.S. Current Population Survey, Annual Social and economic Supplements, march 1998-2008, by michelle Chau of NCCP with assistance from Ayana Douglas-Hall. This work was generously funded by the Annie e. Casey Foundation.
Copyright © 2008 by the National Center for Children in Poverty
the National Center for Children in Poverty (NCCP) is the nation’s leading
public policy center dedicated to promoting the economic security, health,
and well-being of america’s low-income families and children. Using
research to inform policy and practice, NCCP seeks to advance family-
oriented solutions and the strategic use of public resources at the state and
national levels to ensure positive outcomes for the next generation. Founded
in 1989 as a division of the mailman School of Public health at Columbia
University, NCCP is a nonpartisan, public interest research organization.

National Center for Children in Poverty Low-Income Children in the United States 3
InCome Table 1: Percent of children living in poor families, 1997-2007 ...................................................................................6Table 2: Number of children living in poor families, 1997-2007 ...................................................................................7Table 3: Percent of children living in low-income families, 1997-2007 ...................................................................8Table 4: Number of children living in low-income families, 1997-2007 ...................................................................9
ParentaL edUCatIonTable 5: Percent of children who have parents with less than a high school education, living in low-income families, 1997-2007............................................10Table 6: Number of children who have parents with less than a high school education, living in low-income families, 1997-2007............................................11Table 7: Percent of children who have parents with a high school degree but no college education, living in low-income families, 1997-2007 ...........................12Table 8: Number of children who have parents with a high school degree but no college education, living in low-income families, 1997-2007 ............................13Table 9: Percent of children who have parents with at least some college education, living in low-income families, 1997-2007............................................14Table 10: Number of children who have parents with at least some college education, living in low-income families, 1997-2007............................................15
ParentaL emPLoymentTable 11: Percent of low-income children with at least one full-time, year-round employed parent, 1997-2007 ....16Table 12: Number of low-income children with at least one full-time, year-round employed parent, 1997-2007 ....17Table 13: Percent of low-income children with part-year or part-time employed parents, 1997-2007 ........18Table 14: Number of low-income children with part-year or part-time employed parents, 1997-2007 ........19Table 15: Percent of low-income children with no employed parents, 1997-2007 ................................................20Table 16: Number of low-income children with no employed parents, 1997-2007 ................................................21
ParentaL marItaL StatUSTable 17: Percent of low-income children in married- parent families, 1997-2007 .....................................................22Table 18: Number of low-income children in married-parent families, 1997-2007 .....................................................23Table 19: Percent of low-income children in single- parent families, 1997-2007 .....................................................24Table 20: Number of low-income children in single- parent families, 1997-2007 .....................................................25
ChILd’S raCe/ethnICItyTable 21: Percent of white children living in low-income families, 1997-2007............................................26Table 22: Number of white children living in low-income families, 1997-2007............................................27Table 23: Percent of black children living in low-income families, 1997-2007............................................28Table 24: Number of black children living in low-income families, 1997-2007............................................29Table 25: Percent of Latino children living in low-income families, 1997-2007............................................30Table 26: Number of Latino children living in low-income families, 1997-2007............................................31Table 27: Percent of Asian children living in low-income families, 1997-2007............................................32Table 28: Number of Asian children living in low-income families, 1997-2007............................................33Table 29: Percent of American Indian children living in low-income families, 1997-2007 ............................34Table 30: Number of American Indian children living in low-income families, 1997-2007 ............................35
ChILd’S ageTable 31: Percent of children under age 6, living in low-income families, 1997-2007 .......................................36Table 32: Number of children under age 6, living in low-income families, 1997-2007 .......................................37Table 33: Percent of children age 6 and over, living in low-income families, 1997-2007 .......................................38Table 34: Number of children age 6 and over, living in low-income families, 1997-2007 ......................................39
ParentaL natIvItyTable 35: Percent of children with immigrant parents living in low-income families, 1997-2007 ..............40Table 36: Number of children with immigrant parents living in low-income families, 1997-2007 ..............41Table 37: Percent of children with native-born parents living in low-income families, 1997-2007 ..............42Table 38: Number of children with native-born parents living in low-income families, 1997-2007 ..............43
FamILy StrUCtUreTable 39: Percent of low-income children living in families with no parent present, 1997-2007 ....................44Table 40: Number of low-income children living in families with no parent present, 1997-2007 ....................45
home ownerShIPTable 41: Percent of low-income children living in owner-occupied housing, 1997-2007 ...............................46Table 42: Number of low-income children living in owner-occupied housing, 1997-2007 ...............................47
LisT Of TabLEs

4
Table 43: Percent of low-income children living in rented housing, 1997-2007 ................................................48Table 44: Number of low-income children living in rented housing, 1997-2007 ................................................49
reSIdentIaL moveTable 45: Percent of low-income children who have moved in the last year, 1997-2007 ................................50Table 46: Number of low-income children who have moved in the last year, 1997-2007 ................................51
tyPe oF reSIdentIaL area Table 47: Percent of children in urban areas living in low-income families, 1997-2007 .......................................52Table 48: Number of children in urban areas living in low-income families, 1997-2007 .......................................53
Table 49: Percent of children in suburban areas living in low-income families, 1997-2007 ............................54Table 50: Number of children in suburban areas living in low-income families, 1997-2007 ............................55Table 51: Percent of children in rural areas living in low-income families, 1997-2007 .......................................56Table 52: Number of children in rural areas living in low-income families, 1997-2007 .......................................57
regIon Table 53: Percent of children living in low-income families, by region, 1997-2007 ...............................................58Table 54: Number of children living in low-income families, by region, 1997-2007 ...............................................58
DaTa sOuRcEs
Estimates include children living in households with at least one parent and most children living apart from both parents (for example, children being raised by grandparents). Chil-dren living independently, living with a spouse, or in group quarters are excluded from these data. Children ages 14 and under living with only unrelated adults were not included because data on their income status were not available. Among children who do not live with at least one parent, parental characteristics are those of the householder and/or the house-holder’s spouse. Prior versions of this trend book counted children living apart from parents differently. In spring 2007, changes to weight variables in the March 2006 Current Popu-lation Survey, as well as several person, family, and household
variables related to poverty were released. Comparisons with published versions prior to 2007 are not valid.
State and national data were calculated from the U.S. Current Population Survey (CPS) Annual Social and Economic Sup-plement (the March supplement) from 1998 through 2008, representing information from calendar years 1997 through 2007. For state estimates, NCCP averaged three years of data for each year shown because of small sample sizes in less popu-lated states. For example, state data for 2007 averaged together CPS data from 2006, 2007, 2008, representing information from calendar years 2005, 2006, 2007. The national data were calculated from a single year of data.
DEfiniTiOns
American Indian: Children whose parent reported their race as American Indian or Alaskan Native and their ethnicity as non-Latino. Beginning in 2002, parents could choose more than one race for their child. Children who were American Indian and another race were not counted as American Indian.
Asian: Children whose parent reported their race as Asian, Hawaiian/Pacific Islander and their ethnicity as non-Latino. Beginning in 2002, parents could choose more than one race for their child. Children who were Asian and another race were not counted as Asian.
Black: Children whose parents reported their race as black and their ethnicity as non-Latino. Beginning in 2002, parents could choose more than one race for their child. Children who were black and another race were not counted as black.
Child: A child is defined as an individual under the age of 18. Children living independently, living with a spouse, liv-ing in group quarters, and children ages 14 and under liv-ing with only unrelated adults are excluded from these data.
Family: A family is defined as a group of two or more persons in the same household including at least one dependent child under the age of 18. At least one parent or another adult must live with the child. Households that include children living independently, married children living with a spouse, children ages 14 and under living only with unrelated adults, or children living in group quarters are excluded.
Family Structure: Family structure is defined by the presence of parents living with children in households. Children can either live in families where at least one par-ent is present or where no parent is present (for example, foster children, children being raised by grandparents).
Immigrant: Individual born outside of the United States, Puerto Rico, or an outlying United States territory.
Immigrant Parents: For a child to be considered to have immigrant parents, every parent living in the household with the child must be an immigrant. This includes single-parent families and married-parent families.

National Center for Children in Poverty Low-Income Children in the United States 5
Latino: Children whose parents reported their ethnicity as Latino, regardless of reported race.
Low Income: Families and children are defined as low income if the family income is less than twice the federal poverty threshold (see also Poor).
Midwest: Includes Illinois, Indiana, Iowa, Kansas, Michigan, Minnesota, Missouri, Nebraska, North Dakota, Ohio, South Dakota, and Wisconsin.
Move: Movement from one house or apartment to another in the last year, regardless of the distance of the move.
Native Born: Individual born in the United States, in Puerto Rico, or in an outlying United States territory.
Native-Born Parents: For a child to be considered to have native-born parents, every parent living in the household with the child must be native born. This includes single-parent families and married-parent families.
Northeast: Includes Connecticut, Maine, Massachusetts, New Hampshire, New Jersey, New York, Pennsylvania, Rhode Island, and Vermont.
Owner-Occupied Housing: A house that is owned by one of the members of the child’s family.
Parent: The person in the household identified as the child’s parent. For children who do not live with at least one par-ent, parental characteristics are those of the householder and/or the householder’s spouse.
Parental Education: Parental education is the education level of the most highly educated parent living in the house-hold. Parents can either have no high school degree; a high school degree, but no college; or some college or more.
Parental Employment: Parental employment is the em-ployment level of the parent in the household who main-tained the highest level of employment in the previous year. Parents can either have no employment in the previous year, part-year or part-time employment, or full-time, year-round employment. Part-year or part-time employment is defined as either working less than 50 weeks in the previous year or less than 35 hours per week. Full-time, year-round employment is defined as working at least 50 weeks in the previous year and 35 hours or more per week for more than half the year.
Parental Marital Status: Married-parent families include step-parent families, as well as families with two biological/adoptive parents. Single-parent families include only fami-lies with one unmarried parent in the household.
Poor: Families and children are defined as poor if family income is below the poverty threshold. The federal poverty level for a family of four with two children was $21,200 in 2008, $20,650 in 2007, and $20,000 in 2006.
Race/Ethnicity: In the most recent CPS, parents could re-port children’s race as one or more of the following: “White,” “Black,” “American Indian or Alaskan Native,” or “Asian and/or Hawaiian/Pacific Islander.” In a separate question, parents could report whether their children were of Latino ethnic-ity. For the data reported, children who were reported to be of Latino ethnicity were categorized as Latino, regardless of their reported race. Children who were reported to be of more than one race were not included in the “White,” “Black,” “Asian,” or “American Indian” categories. Changes were made to the racial categories in the March 1997 and 2003 supplements. These changes may influence the com-parability of data over time. In 2007, approximately 3% of children in the United States were reported to be of more than one race and, thus, are excluded from the data pre-sented by race.
Rented Housing: A house that is not owned by any member of the child’s family.
Rural: An area that is not in a metropolitan statistical area (MSA), as defined by the U.S. Census Bureau. MSAs were changed in the 1995 and 2005 CPS data to reflect changes in the population distribution found in the decennial Census. This may affect trends over time.
South: Includes Alabama, Arkansas, Delaware, District of Columbia, Florida, Georgia, Kentucky, Louisiana, Maryland, Mississippi, North Carolina, Oklahoma, Tennessee, Texas, South Carolina, Virginia, and West Virginia.
Suburban: Areas contained in a metropolitan statistical area (MSA), excluding central cities. An MSA is defined by the U.S. Census Bureau as a group of communities that are socially and economically integrated with an adjacent urbanized area. The urbanized area is defined as the central city, while the surrounding areas are defined as the suburbs. The MSAs were changed in the 1995 and 2005 CPS data to reflect changes in the population distribution found in the decennial Census. This may affect trends over time.
Urban: A central city, as defined by the U.S. Census Bureau. The MSAs were changed in the 1995 and 2005 CPS data to reflect changes in the population distribution found in the decennial Census. This may affect trends over time.
West: Includes Alaska, Arizona, California, Colorado, Hawaii, Idaho, Montana, Nevada, New Mexico, Oregon, Utah, Washington, and Wyoming.
White: Children whose parents reported their race as white and their ethnicity as non-Latino. Beginning in 2002, parents could choose more than one race for their child. Children who were white and another race were not counted as white.

6
Table 1: Percent of children living in poor families, 1997-2007
0
10
20
30
40
50
'07'06'05'04'03'02'01'00'99'98'97
Percent (%)
definitions:
Child: A child is defined as an individual under the age of 18. Children living independently, living with a spouse, living in group quarters, and children ages 14 and under living with only unrelated adults are excluded from these data.
Poor: Families and children are defined as poor if family income is below the poverty threshold. The federal poverty level for a family of four with two children was $21,200 in 2008, $20,650 in 2007, and $20,000 in 2006.
Numerator: Number of children living in poor families
Denominator: Number of children
national percent of children living in poor families
incOmE
1997 1998 1999 2000 2001 2002 2003 2004 2005 2006 2007naTiOnaL 20 19 17 16 16 17 18 18 18 17 18ALABAMA 25 24 25 22 22 21 22 22 24 23 22ALASKA 10 11 10 9 10 11 12 11 12 12 11ARIZONA 27 28 22 20 19 20 20 20 21 21 21ARKANSAS 24 22 21 20 23 28 29 27 23 22 21CALIFORNIA 25 25 23 21 18 18 18 19 19 18 18COLORADO 11 12 12 13 12 12 12 12 13 13 14CONNECTICUT 17 15 10 11 10 10 10 11 12 12 12DELAWARE 15 16 17 16 13 12 11 12 13 13 13DISTRICT OF COLUMBIA 38 41 36 31 27 30 32 31 33 33 33FLORIDA 23 22 20 19 18 17 18 18 17 16 16GEORGIA 21 23 23 20 19 18 18 18 20 20 21HAWAII 17 17 16 14 14 14 14 12 11 10 11IDAHO 20 20 21 20 19 16 15 14 13 13 13ILLINOIS 19 16 15 15 16 17 17 18 17 16 15INDIANA 12 11 11 10 10 11 12 14 17 17 17IOWA 14 13 12 12 9 10 10 12 13 14 14KANSAS 13 13 15 14 14 12 14 14 16 18 18KENTUCKY 23 23 20 18 17 18 19 21 21 23 22LOUISIANA 28 28 27 27 25 25 25 24 24 23 24MAINE 15 15 15 15 14 15 16 16 15 14 14MARYLAND 15 13 9 8 8 8 8 10 12 12 12MASSACHUSETTS 17 16 18 16 15 13 12 12 11 12 14MICHIGAN 17 16 15 14 14 14 14 16 17 18 17MINNESOTA 14 15 13 10 8 7 9 9 10 10 12MISSISSIPPI 30 25 22 22 22 23 24 25 27 29 31MISSOURI 14 15 17 15 14 13 14 16 17 18 19MONTANA 23 23 21 22 20 19 18 18 19 18 17NEBRASKA 13 15 13 13 12 12 12 11 11 12 13NEVADA 14 14 16 14 13 11 12 13 14 13 13NEW HAMPSHIRE 9 13 12 10 7 6 7 7 7 6 6NEW JERSEY 13 14 12 11 10 9 10 9 9 10 11NEW MEXICO 34 30 29 26 26 24 25 25 25 24 22NEW YORK 25 25 24 22 20 20 20 21 21 20 20NORTH CAROLINA 19 19 19 19 17 18 20 21 20 19 20NORTH DAKOTA 15 18 20 18 17 16 16 14 13 14 14OHIO 18 17 17 17 16 14 15 15 17 18 18OKLAHOMA 23 22 18 19 20 20 19 17 17 18 20OREGON 18 20 19 18 16 15 16 16 18 16 16PENNSYLVANIA 17 17 16 14 13 13 14 15 17 17 16RHODE ISLAND 17 19 18 16 14 14 14 17 18 17 17SOUTH CAROLINA 24 19 18 17 18 19 20 19 19 19 19SOUTH DAKOTA 17 14 12 11 10 11 12 15 16 16 15TENNESSEE 22 20 18 18 19 20 20 20 20 20 20TEXAS 24 23 22 22 22 22 22 23 23 22 23UTAH 10 12 11 10 10 11 12 13 12 12 12VERMONT 15 15 13 13 12 13 12 11 9 9 9VIRGINIA 17 15 13 10 10 11 12 13 13 12 13WASHINGTON 16 14 12 12 13 14 15 16 16 14 12WEST VIRGINIA 25 25 24 23 22 22 25 23 22 20 22WISCONSIN 13 13 12 12 11 12 13 15 16 16 15WYOMING 16 15 15 15 13 12 11 12 13 14 13

National Center for Children in Poverty Low-Income Children in the United States 7
Table 2: number of children living in poor families, 1997-2007
1997 1998 1999 2000 2001 2002 2003 2004 2005 2006 2007naTiOnaL 13,995,983 13,345,872 12,000,278 11,502,067 11,623,606 12,019,122 12,768,948 12,962,887 12,814,806 12,723,022 13,247,238ALABAMA 282,367 246,121 256,528 240,714 251,298 231,171 238,989 238,907 255,158 244,439 240,873ALASKA 22,022 23,020 20,248 18,332 18,838 20,553 22,046 21,386 21,738 21,685 19,670ARIZONA 357,525 376,133 301,480 275,252 268,911 291,349 301,404 297,915 318,656 332,403 336,139ARKANSAS 176,772 162,034 146,690 133,131 160,212 187,644 193,135 178,657 150,941 151,218 147,239CALIFORNIA 2,311,524 2,275,715 2,133,369 1,919,575 1,724,916 1,689,364 1,703,092 1,773,350 1,771,436 1,756,867 1,712,807COLORADO 113,928 120,965 122,622 140,423 136,246 139,035 132,549 136,488 146,786 155,954 161,204CONNECTICUT 149,770 131,382 87,918 89,634 80,834 87,257 84,865 94,565 96,391 95,846 98,742DELAWARE 28,485 30,604 33,674 31,773 26,439 22,740 21,313 23,312 24,461 25,657 26,539DISTRICT OF COLUMBIA 45,855 45,640 39,224 33,151 29,391 33,004 35,062 33,886 35,458 36,596 37,227FLORIDA 749,618 687,505 658,725 650,757 658,460 653,615 699,129 684,099 683,134 629,582 644,508GEORGIA 420,989 476,357 474,338 420,781 410,711 396,675 403,853 407,311 451,597 482,493 500,758HAWAII 50,593 51,824 50,503 41,750 41,769 42,440 43,474 36,936 31,662 29,655 31,480IDAHO 67,433 71,847 78,459 74,461 68,079 60,762 54,821 50,740 48,709 48,989 50,745ILLINOIS 619,196 548,825 512,850 492,144 493,977 522,335 538,451 571,162 546,961 519,698 476,272INDIANA 174,090 165,213 165,621 156,543 150,806 164,030 180,783 223,421 267,264 271,178 272,779IOWA 112,342 101,094 90,631 85,544 66,445 67,884 70,695 80,843 88,013 93,519 96,976KANSAS 92,375 93,233 101,057 93,869 93,304 80,489 91,304 97,308 109,618 121,235 126,822KENTUCKY 232,069 219,477 186,985 166,350 163,944 180,248 182,998 203,839 206,326 223,925 218,115LOUISIANA 323,379 318,460 296,583 311,565 293,569 295,752 296,573 283,109 267,417 250,682 252,243MAINE 41,466 41,504 45,847 44,930 40,894 39,917 42,457 44,613 41,775 39,354 39,778MARYLAND 199,433 157,977 111,248 95,506 99,911 106,448 116,502 134,248 162,179 162,573 163,307MASSACHUSETTS 249,125 233,903 256,857 231,956 217,222 182,664 174,919 172,407 166,179 171,632 202,322MICHIGAN 440,368 426,259 411,082 394,090 349,331 340,359 350,845 406,986 419,484 453,477 418,943MINNESOTA 185,247 207,242 183,771 133,260 93,741 89,856 103,619 107,844 117,253 123,320 143,381MISSISSIPPI 232,884 192,811 166,143 163,951 169,529 178,716 183,098 188,637 199,740 215,223 233,025MISSOURI 184,661 208,531 238,906 211,023 199,155 183,509 196,136 219,328 230,737 245,266 267,343MONTANA 55,280 58,434 52,488 52,013 44,158 40,406 39,373 38,956 39,853 37,255 36,995NEBRASKA 60,108 68,846 62,728 59,060 51,393 52,824 54,210 49,651 48,626 51,389 56,194NEVADA 59,327 64,497 82,338 78,983 72,793 62,553 67,898 78,971 84,989 83,608 85,814NEW HAMPSHIRE 27,881 40,711 41,470 31,720 22,671 19,052 20,945 20,875 20,331 18,539 17,260NEW JERSEY 242,864 263,667 242,842 209,407 187,132 185,347 203,089 202,002 199,819 207,387 222,090NEW MEXICO 201,446 176,615 159,924 139,295 131,531 118,737 124,243 121,342 121,949 118,152 108,748NEW YORK 1,194,399 1,180,598 1,123,738 1,032,739 941,795 910,114 907,384 931,985 925,807 914,243 885,935NORTH CAROLINA 318,700 340,027 345,770 363,480 346,978 368,126 407,455 430,782 425,406 417,698 437,182NORTH DAKOTA 26,413 30,642 33,375 28,556 24,377 22,679 22,473 19,717 18,004 19,475 19,879OHIO 535,992 514,679 500,546 488,255 458,989 398,130 410,120 425,747 469,451 485,650 504,288OKLAHOMA 207,053 189,715 151,670 157,242 164,372 175,300 162,236 142,837 146,373 158,524 176,679OREGON 150,516 162,665 157,939 157,630 137,161 126,789 135,641 137,115 149,820 140,879 141,165PENNSYLVANIA 503,038 497,311 465,842 405,074 354,835 360,572 400,233 434,530 463,890 471,517 445,838RHODE ISLAND 36,528 39,590 42,282 39,902 33,657 33,360 34,622 41,076 43,952 42,537 39,582SOUTH CAROLINA 237,835 185,575 175,371 161,534 176,486 189,265 195,798 193,113 194,157 188,404 191,163SOUTH DAKOTA 32,422 25,923 21,862 20,045 17,479 21,133 21,926 28,748 30,604 30,101 27,670TENNESSEE 320,012 298,025 265,609 256,676 264,739 274,572 271,283 270,407 270,062 286,187 289,926TEXAS 1,338,268 1,306,590 1,262,902 1,246,009 1,267,253 1,301,648 1,365,928 1,415,466 1,450,380 1,422,499 1,495,683UTAH 71,610 79,972 76,056 71,089 69,748 83,917 92,209 96,125 94,729 96,678 97,387VERMONT 23,810 22,333 19,555 19,160 17,098 16,573 15,660 15,219 12,659 11,681 11,636VIRGINIA 260,269 238,825 215,037 172,690 174,636 193,964 212,998 232,799 226,985 224,748 234,320WASHINGTON 241,332 213,335 178,627 177,490 189,972 211,256 229,561 241,439 246,044 206,550 187,668WEST VIRGINIA 88,762 86,546 82,561 84,233 81,029 86,549 94,949 89,806 85,190 78,074 86,013WISCONSIN 180,998 174,332 161,486 161,402 153,943 159,876 171,165 199,280 205,271 203,462 193,761WYOMING 21,827 21,004 20,668 18,588 16,496 14,375 13,714 14,368 15,457 15,868 16,242
definitions:
Child: A child is defined as an individual under the age of 18. Children living independently, living with a spouse, living in group quarters, and children ages 14 and under living with only unrelated adults are excluded from these data.
Poor: Families and children are defined as poor if family income is below the poverty threshold. The federal poverty level for a family of four with two children was $21,200 in 2008, $20,650 in 2007, and $20,000 in 2006.

8
Table 3: Percent of children living in low-income families, 1997-2007
0
10
20
30
40
50
'07'06'05'04'03'02'01'00'99'98'97
Percent (%)national percent of children living in low-income families
1997 1998 1999 2000 2001 2002 2003 2004 2005 2006 2007naTiOnaL 41 40 39 37 38 38 39 39 39 39 39ALABAMA 48 45 45 44 46 44 43 43 44 42 41ALASKA 29 29 30 30 30 30 32 34 35 34 30ARIZONA 54 54 51 49 46 43 43 43 47 47 48ARKANSAS 57 55 51 48 51 53 52 49 48 50 51CALIFORNIA 48 47 47 45 43 42 41 42 42 42 42COLORADO 31 31 29 30 30 32 32 33 33 33 32CONNECTICUT 32 30 25 27 27 28 26 25 24 25 26DELAWARE 39 38 37 34 30 28 29 32 33 33 33DISTRICT OF COLUMBIA 57 60 56 53 50 53 53 53 54 54 53FLORIDA 47 45 44 43 43 42 42 41 40 39 39GEORGIA 46 46 47 44 42 39 39 40 41 42 41HAWAII 42 42 37 36 35 35 35 33 30 29 29IDAHO 46 46 46 44 43 42 44 44 42 42 40ILLINOIS 39 36 34 33 33 35 36 37 37 35 35INDIANA 32 31 31 33 35 35 35 36 39 39 38IOWA 38 38 36 32 30 31 31 33 32 34 32KANSAS 39 36 34 35 35 33 33 34 36 38 39KENTUCKY 46 43 41 38 39 41 44 44 44 44 43LOUISIANA 53 51 51 52 51 50 49 49 48 47 44MAINE 39 38 36 33 35 37 38 36 36 35 35MARYLAND 31 27 23 22 22 22 23 26 29 28 26MASSACHUSETTS 34 34 34 34 33 30 29 28 27 27 29MICHIGAN 36 35 34 32 32 33 35 36 37 37 37MINNESOTA 33 31 28 24 23 23 24 24 24 25 27MISSISSIPPI 59 55 50 48 49 50 52 51 52 53 54MISSOURI 38 38 37 32 31 31 33 35 36 39 41MONTANA 51 50 47 46 45 44 46 47 47 43 42NEBRASKA 37 38 35 34 32 32 31 34 33 34 32NEVADA 37 36 37 37 38 39 40 40 38 38 38NEW HAMPSHIRE 28 30 29 25 24 22 22 21 21 21 19NEW JERSEY 29 31 29 28 26 26 26 24 24 24 27NEW MEXICO 59 57 56 54 54 51 53 52 53 48 45NEW YORK 46 45 43 41 40 39 41 41 41 41 41NORTH CAROLINA 42 42 42 41 41 42 44 43 43 42 43NORTH DAKOTA 36 40 44 43 41 38 38 36 35 35 36OHIO 37 37 38 37 35 33 34 35 36 37 38OKLAHOMA 48 45 41 44 46 47 47 45 46 46 47OREGON 42 44 42 41 38 37 39 39 41 40 39PENNSYLVANIA 37 37 36 35 34 34 34 35 36 36 36RHODE ISLAND 34 34 33 32 29 30 31 35 35 34 34SOUTH CAROLINA 48 43 42 40 40 40 41 42 43 44 44SOUTH DAKOTA 40 37 35 33 32 33 33 36 36 38 36TENNESSEE 49 48 44 40 40 41 42 42 42 42 44TEXAS 50 50 48 47 46 47 49 49 49 47 47UTAH 38 37 36 35 34 34 35 36 36 37 36VERMONT 39 35 35 35 35 32 31 30 29 27 29VIRGINIA 39 35 30 29 28 29 28 29 29 31 32WASHINGTON 35 33 30 31 33 35 35 36 36 34 32WEST VIRGINIA 53 52 53 52 50 49 50 48 46 46 46WISCONSIN 32 32 30 31 30 30 32 34 35 34 33WYOMING 43 44 43 41 38 37 37 36 34 33 32
definitions:
Child: A child is defined as an individual under the age of 18. Children living independently, living with a spouse, living in group quarters, and children ages 14 and under living with only unrelated adults are excluded from these data.
Low income: Families and children are defined as low income if the family income is less than twice the federal poverty threshold. The low-income level for a family of four was $42,400 in 2008, $41,300 in 2007, and $40,000 in 2006.
Numerator: Number of children in low-income families
Denominator: Number of children

National Center for Children in Poverty Low-Income Children in the United States 9
Table 4: number of children living in low-income families, 1997-2007
1997 1998 1999 2000 2001 2002 2003 2004 2005 2006 2007naTiOnaL 29,222,957 28,428,088 27,629,558 26,784,244 27,331,634 27,620,353 28,387,571 28,605,046 28,365,801 28,557,921 28,803,055ALABAMA 537,735 465,599 470,422 476,013 521,750 494,276 482,637 466,729 470,694 457,281 452,574ALASKA 61,946 61,837 60,813 60,325 58,429 57,552 60,444 63,972 65,133 62,223 55,661ARIZONA 705,961 728,717 684,988 666,728 661,105 633,371 647,204 653,764 726,207 758,507 779,426ARKANSAS 413,535 396,914 354,831 326,557 349,654 363,563 351,558 332,072 318,299 334,834 353,402CALIFORNIA 4,413,905 4,351,581 4,307,063 4,194,067 4,084,055 4,015,383 3,956,394 4,004,084 3,977,729 4,003,362 3,931,435COLORADO 312,710 309,164 304,269 326,062 346,440 360,516 372,226 377,377 381,774 387,489 381,238CONNECTICUT 284,269 255,984 218,110 228,967 228,617 233,459 215,118 210,894 201,303 206,027 213,699DELAWARE 72,551 74,921 75,506 69,828 59,609 54,495 57,428 62,069 63,951 65,308 66,450DISTRICT OF COLUMBIA 69,913 67,149 61,074 56,650 55,170 58,614 58,835 58,836 58,739 60,990 59,259FLORIDA 1,539,930 1,433,100 1,420,583 1,476,009 1,576,970 1,574,405 1,611,637 1,583,686 1,583,152 1,563,860 1,565,179GEORGIA 928,816 947,109 984,973 921,287 923,286 883,865 875,619 915,494 953,633 1,001,785 1,000,768HAWAII 127,541 125,920 115,633 111,315 107,040 106,682 108,145 99,114 88,218 84,722 85,290IDAHO 158,744 167,560 172,106 163,063 158,678 156,766 161,672 161,238 159,856 162,003 161,550ILLINOIS 1,258,800 1,224,378 1,169,948 1,089,869 1,040,680 1,099,456 1,147,471 1,195,535 1,172,240 1,135,740 1,123,090INDIANA 466,258 451,934 473,129 494,911 512,481 530,157 531,536 570,135 612,994 616,342 600,671IOWA 305,299 294,093 262,278 232,926 213,179 221,438 217,168 224,713 217,094 234,816 222,852KANSAS 276,150 255,211 238,380 240,464 229,314 221,746 222,425 236,951 249,810 261,007 271,266KENTUCKY 454,299 421,824 381,396 364,900 373,942 397,539 426,683 430,362 428,114 430,134 433,290LOUISIANA 599,701 574,147 565,105 604,821 608,304 594,406 582,913 573,155 545,237 505,783 472,658MAINE 106,221 104,682 107,742 100,786 99,252 99,361 102,139 100,569 100,650 96,405 98,417MARYLAND 403,944 339,596 281,713 279,189 294,397 301,892 321,585 358,582 400,340 386,190 361,319MASSACHUSETTS 490,784 489,481 490,245 501,414 467,938 429,768 424,949 413,360 405,560 391,059 423,340MICHIGAN 936,781 941,284 947,725 887,210 829,956 801,076 860,681 914,528 925,658 924,253 903,941MINNESOTA 447,519 427,911 388,316 314,122 286,441 275,699 293,468 292,919 289,487 306,815 339,239MISSISSIPPI 462,715 428,588 378,905 362,114 374,106 385,284 398,677 383,697 388,058 395,165 408,166MISSOURI 510,454 526,114 505,830 449,134 435,295 426,524 452,216 480,152 502,493 536,598 565,216MONTANA 122,985 127,062 115,930 110,875 101,809 96,054 98,894 99,054 98,787 90,716 89,030NEBRASKA 173,610 177,432 166,055 156,394 137,864 138,757 137,244 147,130 143,272 148,943 141,863NEVADA 155,003 168,026 192,770 206,234 216,167 219,336 227,804 234,826 234,736 240,436 244,545NEW HAMPSHIRE 82,483 94,714 96,965 83,430 73,389 65,496 67,063 63,380 62,264 61,464 57,516NEW JERSEY 547,150 601,096 581,362 562,018 508,634 510,144 530,726 517,262 519,423 515,411 557,678NEW MEXICO 355,365 332,689 313,281 284,393 269,992 249,954 260,380 256,919 259,162 240,998 225,554NEW YORK 2,161,461 2,115,811 2,044,945 1,918,707 1,822,856 1,786,013 1,841,299 1,867,532 1,854,310 1,825,587 1,808,782NORTH CAROLINA 725,698 758,972 765,895 784,506 822,633 855,389 898,404 893,484 907,375 914,586 937,193NORTH DAKOTA 61,007 70,221 74,313 68,621 57,522 52,835 53,149 52,034 50,343 50,067 50,858OHIO 1,115,303 1,113,463 1,111,550 1,049,327 988,136 919,212 937,846 980,487 988,748 1,016,541 1,029,154OKLAHOMA 432,970 395,696 340,454 358,658 384,381 406,790 398,959 388,015 385,942 399,240 416,539OREGON 344,772 365,340 355,096 349,914 322,476 316,449 324,582 327,210 346,963 345,573 335,431PENNSYLVANIA 1,090,339 1,068,869 1,050,111 993,724 939,105 931,388 953,930 979,325 997,732 1,012,237 1,006,096RHODE ISLAND 73,025 71,532 76,448 78,828 72,623 71,487 75,438 85,704 87,011 83,913 80,741SOUTH CAROLINA 481,166 420,406 404,741 387,208 385,161 394,616 410,490 425,091 436,940 445,449 450,191SOUTH DAKOTA 74,689 67,214 62,503 61,279 58,237 62,415 62,331 68,590 67,873 70,697 68,473TENNESSEE 730,469 699,348 627,758 563,385 558,916 572,266 583,844 572,158 576,930 594,362 628,404TEXAS 2,781,855 2,809,158 2,720,912 2,690,187 2,721,092 2,861,972 2,992,822 3,040,033 3,095,792 3,027,646 3,071,529UTAH 262,473 248,511 246,749 244,454 242,193 247,152 259,748 274,354 276,281 289,168 286,968VERMONT 59,650 52,630 51,763 50,434 48,037 42,124 41,135 40,160 38,274 35,723 37,550VIRGINIA 604,164 551,786 508,647 491,238 488,722 522,504 508,589 524,524 528,556 560,174 588,333WASHINGTON 514,316 507,143 446,025 458,472 482,669 521,343 526,215 529,964 536,217 513,297 491,311WEST VIRGINIA 185,547 178,343 182,099 188,747 189,788 190,535 192,007 186,347 178,919 175,613 179,482WISCONSIN 459,462 422,357 412,162 422,161 412,064 388,606 412,097 444,402 455,100 444,882 424,001WYOMING 58,706 59,070 57,248 52,038 47,921 45,280 44,028 42,350 39,437 38,168 38,974
definitions:
Child: A child is defined as an individual under the age of 18. Children living independently, living with a spouse, living in group quarters, and children ages 14 and under living with only unrelated adults are excluded from these data.
Low income: Families and children are defined as low income if the family income is less than twice the federal poverty threshold. The low-income level for a family of four was $42,400 in 2008, $41,300 in 2007, and $40,000 in 2006.

10
Table 5: Percent of children who have parents with less than a high school education, living in low-income families, 1997-2007
1997 1998 1999 2000 2001 2002 2003 2004 2005 2006 2007naTiOnaL 85 85 82 81 81 82 83 83 82 82 83ALABAMA 92 92 87 85 85 89 89 90 91 93 91ALASKA 85* 81* 76 76 75 77 78 75 72 69 73ARIZONA 91 93 92 89 86 83 85 83 86 86 89ARKANSAS 87 90 90 91 88 86 88 87 88 87 87CALIFORNIA 88 86 85 83 81 79 79 80 80 80 81COLORADO 78 80 82 83 80 77 76 80 81 85 81CONNECTICUT 86 83 72 83 81 84 83 84 86 85 87DELAWARE 79 89 86 84 75 74 74 74 79 84 85DISTRICT OF COLUMBIA 82 94 92 91 89 88 91 88 87 85 86FLORIDA 88 87 86 84 81 79 81 82 78 76 75GEORGIA 91 91 89 88 85 85 80 83 85 88 89HAWAII 80 86 73* 71 65 66 58 62 61 75 79IDAHO 89 89 91 89 86 85 85 90 91 88 86ILLINOIS 81 79 79 76 72 75 79 85 85 83 79INDIANA 67 71 64 66 66 78 80 82 81 78 82IOWA 73 76 76 79 76 85 87 87 82 76 74KANSAS 69* 82 83 83 81 80 82 81 85 88 89KENTUCKY 85 85 88 85 85 83 88 87 88 83 84LOUISIANA 90 91 87 90 89 90 87 89 88 89 84MAINE 85* ** ** 81 86 80 85 82 82 82 83MARYLAND 87 78 71 67 70 70 71 74 78 72 69MASSACHUSETTS 79 76 80 81 81 74 73 78 83 82 80MICHIGAN 83 85 85 86 88 85 86 85 86 87 84MINNESOTA 85 85 84 83 69 72 77 78 77 78 84MISSISSIPPI 92 87 87 88 90 89 91 93 93 91 88MISSOURI 76 80 87 83 77 74 78 75 76 77 86MONTANA 98 94 89 83 79 79 80 87 90 87 84NEBRASKA 84 85 80 76 71 77 78 82 79 84 82NEVADA 83 81 76 74 71 75 75 78 75 72 73NEW HAMPSHIRE ** 71* 66* 55* 49 62 76 78 77 78 74NEW JERSEY 80 80 77 80 82 84 83 79 73 71 73NEW MEXICO 90 90 88 87 85 82 82 84 86 81 77NEW YORK 90 90 89 87 86 85 85 84 82 83 83NORTH CAROLINA 84 82 87 88 86 85 84 87 87 88 87NORTH DAKOTA ** ** ** 92 97 97 98 97 93 91 92OHIO 88 88 86 83 81 82 80 82 82 86 86OKLAHOMA 88 87 89 90 92 91 89 88 86 89 85OREGON 84 86 81 82 84 87 86 84 86 88 85PENNSYLVANIA 84 79 76 73 79 83 87 84 85 85 85RHODE ISLAND 85 82 85 86 84 81 81 86 83 83 80SOUTH CAROLINA 82 83 85 86 82 86 86 88 84 79 76SOUTH DAKOTA 85 90 81 69 73 78 78 77 79 83 80TENNESSEE 82 82 84 80 81 85 89 88 89 87 86TEXAS 87 87 86 84 82 83 84 85 86 87 86UTAH 87 83 73 70 69 73 78 81 86 84 85VERMONT ** ** ** 66 61 64 70 70 68 73 83VIRGINIA 72 80 82 84 77 77 75 80 80 78 77WASHINGTON 80 79 76 85 84 78 78 78 86 87 89WEST VIRGINIA 91 89 87 87 88 89 91 91 91 87 85WISCONSIN 88 88 85 85 78 75 81 85 86 84 83WYOMING 88 85 80 80 78 80 84 88 85 79 73
PaREnTaL EDucaTiOn
definitions:
Parental education: Parental education is the education level of the most highly educated parent living in the household. Parents can either have no high school degree; a high school degree, but no college; or some college or more.
Numerator: Number of low-income children with parents who have less than a high school education
Denominator: Number of children with parents who have less than a high school education
State specific notes:
* This estimate should be used with caution. It may be unreliable due to a small sample size.
** This estimate was not shown due to an extremely small sample size.

National Center for Children in Poverty Low-Income Children in the United States 11
Table 6: number of children who have parents with less than a high school education, living in low-income families, 1997-2007
1997 1998 1999 2000 2001 2002 2003 2004 2005 2006 2007naTiOnaL 8,389,081 8,252,792 7,705,813 7,496,180 7,449,411 7,482,221 7,427,704 7,572,609 7,265,891 7,178,822 7,273,920ALABAMA 146,583 122,381 127,731 122,505 132,646 129,471 118,312 106,823 100,891 104,499 113,906ALASKA 7,129* 6,414* 7,931 7,466 7,885 8,171 9,287 8,540 7,332 6,236 6,322ARIZONA 250,218 292,838 262,340 251,467 234,108 230,413 235,931 225,503 234,536 238,164 260,133ARKANSAS 83,941 76,537 65,758 59,407 62,002 65,275 66,515 62,699 62,565 62,791 75,367CALIFORNIA 2,045,549 1,952,277 1,885,649 1,789,006 1,733,502 1,686,181 1,675,744 1,666,229 1,622,654 1,604,341 1,564,770COLORADO 68,566 75,921 87,145 105,466 106,855 104,296 101,348 105,762 111,315 108,711 103,562CONNECTICUT 97,690 68,444 37,411 43,902 40,007 44,911 41,867 46,275 54,132 54,675 53,422DELAWARE 14,705 17,985 16,288 18,023 13,422 13,541 13,018 13,150 15,558 15,993 17,693DISTRICT OF COLUMBIA 24,024 25,845 25,675 23,857 20,634 20,461 21,453 21,536 19,358 17,290 16,599FLORIDA 421,147 403,362 409,741 415,284 397,000 356,081 368,319 353,382 345,266 320,814 309,196GEORGIA 280,200 302,564 312,013 269,714 257,587 232,821 203,470 207,274 240,250 267,615 257,696HAWAII 18,850 19,434 14,939* 14,946 14,371 12,239 9,877 10,911 10,387 11,220 9,990IDAHO 34,560 39,945 47,789 43,890 37,765 32,616 32,288 32,611 32,709 27,388 24,741ILLINOIS 374,827 376,102 378,564 337,458 275,745 279,751 291,138 312,854 289,886 287,962 275,972INDIANA 67,057 78,197 65,300 69,720 75,683 107,044 113,814 119,645 126,665 130,935 138,230IOWA 49,381 44,949 39,460 40,439 33,120 38,068 34,983 41,718 42,278 42,356 36,976KANSAS 17,974* 26,716 34,663 41,353 40,168 36,397 36,147 33,406 35,617 45,903 52,821KENTUCKY 150,545 134,233 117,158 96,845 83,676 83,588 89,574 90,803 82,926 82,803 87,159LOUISIANA 196,292 169,748 138,013 148,396 149,826 153,308 151,304 150,492 135,735 133,320 113,315MAINE 12,767* ** ** 11,441 10,946 9,754 11,082 10,799 11,414 10,240 9,543MARYLAND 131,264 97,727 79,543 72,311 80,077 72,352 70,879 77,296 94,266 93,538 82,489MASSACHUSETTS 136,080 137,999 156,511 145,815 130,715 96,840 93,713 85,321 70,928 55,055 51,640MICHIGAN 210,533 211,340 200,433 188,073 170,482 159,566 167,514 170,844 179,851 162,088 151,000MINNESOTA 99,495 90,575 74,029 47,705 26,192 29,678 29,897 38,242 40,365 51,464 60,723MISSISSIPPI 125,844 100,034 79,642 76,379 78,068 74,332 79,614 98,212 103,605 98,472 89,576MISSOURI 108,391 126,691 109,603 89,851 66,990 66,867 73,515 88,975 93,820 85,790 91,337MONTANA 13,419 13,927 11,889 11,724 9,742 8,792 7,920 8,482 7,651 8,178 7,737NEBRASKA 22,985 26,813 20,747 19,649 17,727 20,497 19,335 23,535 23,554 29,268 29,314NEVADA 52,922 56,707 65,391 72,758 71,047 66,968 64,031 68,703 67,976 67,660 75,972NEW HAMPSHIRE ** 11,909* 13,291* 9,991* 7,185 6,137 7,829 7,670 6,880 7,021 6,784NEW JERSEY 135,992 133,495 126,600 118,923 115,790 122,362 120,985 123,378 113,666 105,336 104,638NEW MEXICO 109,403 93,558 82,542 82,692 74,915 65,970 55,023 57,776 62,877 62,385 50,749NEW YORK 725,961 679,217 619,770 569,802 523,342 493,840 478,682 487,025 471,139 477,879 482,601NORTH CAROLINA 191,031 182,918 202,827 213,047 215,092 202,769 208,894 204,574 204,198 201,249 217,835NORTH DAKOTA ** ** ** 5,275 4,885 5,273 4,851 3,538 3,431 4,537 5,867OHIO 235,455 247,130 249,146 227,153 194,059 188,262 179,101 174,587 173,508 177,789 184,374OKLAHOMA 69,237 61,063 51,070 57,307 66,749 82,303 80,848 78,040 68,972 71,069 77,559OREGON 79,588 95,152 87,696 82,565 70,402 80,492 85,322 86,436 81,497 72,692 69,632PENNSYLVANIA 208,304 189,542 198,973 167,560 189,720 208,987 232,615 228,735 216,680 212,608 187,237RHODE ISLAND 21,243 19,260 21,197 24,401 22,621 21,866 20,704 25,296 26,619 28,856 25,396SOUTH CAROLINA 163,841 118,524 93,181 82,106 95,444 102,491 91,950 83,119 85,775 88,180 74,179SOUTH DAKOTA 14,728 11,395 8,372 7,323 6,927 7,587 7,868 10,230 11,280 10,727 8,595TENNESSEE 151,947 149,440 145,635 133,541 137,944 135,673 133,130 120,410 120,664 127,177 133,718TEXAS 1,052,683 1,018,775 1,007,342 1,031,840 1,088,888 1,130,830 1,108,599 1,092,296 1,081,104 1,057,126 1,049,175UTAH 26,119 26,021 24,944 27,041 28,719 35,145 40,782 44,909 47,262 46,924 48,363VERMONT ** ** ** 4,326 4,240 4,279 3,644 3,239 2,927 3,416 3,749VIRGINIA 103,968 100,063 112,645 134,741 113,208 115,103 103,051 123,356 123,962 131,717 118,540WASHINGTON 75,294 67,981 66,499 83,813 100,300 106,188 115,226 114,207 117,715 112,655 106,870WEST VIRGINIA 43,273 39,005 33,874 33,974 31,111 36,060 36,191 33,340 28,520 26,216 29,072WISCONSIN 86,881 82,381 72,810 81,522 76,473 79,256 100,394 105,936 104,078 83,383 83,098WYOMING 5,047 4,223 4,522 4,468 4,470 4,787 5,536 6,057 5,823 5,396 4,309
definitions:
Parental education: Parental education is the education level of the most highly educated parent living in the household. Parents can either have no high school degree; a high school degree, but no college; or some college or more.
State specific notes:
* This estimate should be used with caution. It may be unreliable due to a small sample size.
** This estimate was not shown due to an extremely small sample size.

12
Table 7: Percent of children who have parents with a high school degree but no college education, living in low-income families, 1997-2007
1997 1998 1999 2000 2001 2002 2003 2004 2005 2006 2007naTiOnaL 54 54 53 53 54 55 55 55 56 57 58ALABAMA 64 59 55 57 63 66 68 65 64 59 59ALASKA 38 42 41 43 41 43 46 50 55 54 46ARIZONA 64 67 63 59 53 53 52 55 59 63 63ARKANSAS 70 72 65 62 64 70 69 65 58 61 63CALIFORNIA 57 58 59 58 54 54 53 55 54 55 56COLORADO 50 50 46 47 46 46 45 46 49 54 54CONNECTICUT 47 52 51 51 49 47 43 42 40 42 46DELAWARE 51 52 52 46 44 42 44 45 46 46 46DISTRICT OF COLUMBIA 74 77 73 70 67 72 71 72 70 74 72FLORIDA 59 57 59 58 59 58 59 59 57 57 59GEORGIA 59 54 52 52 55 55 56 58 60 62 62HAWAII 60 62 56 55 52 54 53 51 44 40 41IDAHO 58 57 54 51 56 57 58 56 54 56 53ILLINOIS 54 50 49 48 51 51 52 53 56 55 55INDIANA 40 40 43 48 52 51 48 48 49 49 50IOWA 49 50 47 46 42 43 43 46 44 50 51KANSAS 59 57 55 57 57 56 55 58 60 62 61KENTUCKY 56 53 50 53 56 59 59 60 57 57 58LOUISIANA 57 58 61 65 63 63 61 62 62 65 66MAINE 48 45 43 45 50 58 59 57 56 58 60MARYLAND 51 51 40 40 35 38 37 41 47 49 48MASSACHUSETTS 49 48 46 46 48 51 53 50 49 51 58MICHIGAN 45 45 48 49 50 49 52 52 56 60 63MINNESOTA 44 44 42 40 43 44 48 50 50 50 54MISSISSIPPI 68 67 66 65 68 71 69 65 64 69 75MISSOURI 49 50 54 49 52 52 53 55 55 58 57MONTANA 70 70 66 63 63 64 64 63 61 61 60NEBRASKA 57 58 55 51 46 48 48 55 54 55 51NEVADA 46 43 45 47 50 48 49 50 49 50 49NEW HAMPSHIRE 34 39 45 43 40 34 35 36 39 39 37NEW JERSEY 44 49 48 46 44 43 44 42 39 39 45NEW MEXICO 68 67 68 65 65 63 68 68 69 63 64NEW YORK 55 54 54 53 53 55 57 59 59 61 59NORTH CAROLINA 58 61 60 60 57 60 59 58 58 61 64NORTH DAKOTA 53 59 65 67 63 55 55 51 53 56 58OHIO 50 48 48 49 52 49 51 51 53 55 54OKLAHOMA 64 62 59 63 64 65 63 65 65 66 65OREGON 58 61 59 55 52 53 53 52 51 50 49PENNSYLVANIA 49 50 51 51 48 46 47 50 52 52 52RHODE ISLAND 49 53 52 45 42 44 48 51 50 47 48SOUTH CAROLINA 60 56 53 51 51 55 59 60 63 62 62SOUTH DAKOTA 61 52 48 45 45 49 50 54 58 62 58TENNESSEE 60 59 57 58 59 59 59 56 60 61 67TEXAS 63 64 62 62 61 61 64 63 64 61 62UTAH 47 45 44 45 48 49 50 51 47 49 47VERMONT 56 52 54 55 55 51 52 49 48 41 44VIRGINIA 59 59 51 44 42 44 45 46 48 46 50WASHINGTON 49 42 40 43 50 53 55 53 49 47 47WEST VIRGINIA 64 65 64 65 64 62 61 61 60 63 61WISCONSIN 43 42 43 44 41 43 45 50 52 53 50WYOMING 55 56 50 52 49 54 51 46 44 41 43
definitions:
Parental education: Parental education is the education level of the most highly educated parent living in the household. Parents can either have no high school degree; a high school degree, but no college; or some college or more.
Numerator: Number of low-income children living with parents who have a high school degree but no college education
Denominator: Number of children living with parents who have a high school degree but no college education

National Center for Children in Poverty Low-Income Children in the United States 13
Table 8: number of children who have parents with a high school degree but no college education, living in low-income families, 1997-2007
1997 1998 1999 2000 2001 2002 2003 2004 2005 2006 2007naTiOnaL 10,786,629 10,373,140 10,259,647 9,783,822 10,036,074 9,967,870 10,083,872 10,110,587 10,172,951 10,340,544 10,419,782ALABAMA 225,277 188,119 173,842 190,023 222,801 205,953 201,056 189,841 205,036 188,283 181,016ALASKA 23,916 24,014 21,323 21,911 20,834 21,377 24,456 26,599 27,399 22,813 17,936ARIZONA 194,158 196,962 191,256 181,601 163,974 168,851 175,450 197,536 227,818 258,243 258,021ARKANSAS 197,541 202,116 186,042 172,289 179,374 178,458 157,609 139,654 120,394 131,791 133,483CALIFORNIA 1,094,544 1,133,180 1,166,249 1,141,941 1,087,376 1,063,059 1,043,228 1,042,938 1,063,911 1,105,182 1,129,061COLORADO 118,372 117,350 105,487 111,489 110,942 111,811 106,365 104,060 104,320 113,714 118,398CONNECTICUT 98,858 106,089 99,572 103,591 104,828 103,643 88,422 80,261 67,311 68,992 76,050DELAWARE 31,391 35,914 35,891 28,251 24,208 22,568 25,269 27,198 26,741 27,247 25,669DISTRICT OF COLUMBIA 29,242 26,909 22,638 20,111 21,310 24,288 23,435 23,388 22,541 27,154 27,083FLORIDA 588,940 516,879 507,662 528,856 583,862 586,906 600,056 593,918 569,851 582,490 635,275GEORGIA 424,706 388,194 350,846 330,661 365,665 362,608 366,933 376,730 396,264 386,714 390,065HAWAII 63,741 58,525 52,322 50,955 49,319 49,157 47,261 39,998 30,983 29,768 30,688IDAHO 57,785 59,761 52,916 47,670 53,874 53,708 51,046 47,184 48,188 53,164 50,023ILLINOIS 443,462 423,234 399,397 400,769 422,499 427,628 434,588 440,848 428,958 394,968 374,118INDIANA 240,938 226,462 245,242 249,941 257,521 230,481 202,639 203,415 219,736 223,618 220,074IOWA 122,703 121,220 106,291 88,891 74,720 69,691 66,545 65,022 61,442 73,039 77,668KANSAS 129,426 113,611 92,201 88,171 82,251 83,339 81,519 85,462 82,558 87,717 89,682KENTUCKY 189,352 169,836 144,720 152,455 168,242 173,996 166,618 167,417 165,891 169,829 167,915LOUISIANA 220,160 249,099 253,640 265,364 244,849 245,177 238,039 246,485 237,472 221,425 212,032MAINE 44,076 40,481 40,043 42,947 45,323 49,817 48,067 45,942 45,226 44,837 47,950MARYLAND 159,689 152,627 109,325 114,503 106,531 118,994 115,912 130,705 152,856 157,098 154,262MASSACHUSETTS 181,907 170,830 150,178 154,224 156,484 173,792 181,624 162,683 152,408 140,520 161,028MICHIGAN 363,877 384,616 415,535 382,085 350,520 326,325 356,262 356,461 358,662 378,509 372,686MINNESOTA 126,334 121,627 118,234 103,455 103,731 92,764 105,732 98,502 98,983 93,772 105,858MISSISSIPPI 166,828 156,674 143,567 137,699 146,769 162,973 167,577 143,394 134,264 137,846 151,619MISSOURI 211,912 197,643 191,970 185,472 202,275 201,511 188,966 197,175 203,585 228,720 223,108MONTANA 52,699 54,800 48,893 42,908 38,836 36,941 37,169 37,215 38,341 35,634 35,618NEBRASKA 62,116 65,597 54,477 49,951 39,290 40,835 38,923 42,027 42,021 46,991 43,757NEVADA 55,767 58,744 68,240 71,319 80,825 81,073 90,143 87,824 89,238 95,951 96,424NEW HAMPSHIRE 28,160 32,686 36,843 32,634 29,693 24,320 23,340 21,953 23,804 23,372 21,206NEW JERSEY 213,726 231,593 225,085 222,057 205,347 207,770 209,660 205,556 185,621 177,400 203,698NEW MEXICO 128,150 116,662 111,494 99,803 99,075 89,912 97,806 91,007 92,595 84,135 88,039NEW YORK 718,020 699,025 695,454 670,118 655,168 665,188 682,100 702,319 697,336 699,985 656,671NORTH CAROLINA 300,654 327,618 327,548 325,691 318,044 327,539 318,485 314,550 315,218 343,686 350,152NORTH DAKOTA 18,598 19,767 20,665 18,901 16,368 14,639 16,044 14,809 15,221 15,505 15,157OHIO 481,845 453,348 449,342 439,721 445,605 385,158 405,396 412,755 443,329 455,817 445,737OKLAHOMA 193,131 179,583 163,727 166,543 179,536 177,467 162,503 153,917 156,114 158,365 151,806OREGON 133,745 126,907 116,796 109,726 103,326 102,650 97,326 94,830 94,159 95,161 94,737PENNSYLVANIA 527,607 555,109 567,552 538,119 444,024 407,464 414,534 444,506 448,049 421,730 409,767RHODE ISLAND 27,410 30,097 32,805 30,280 26,638 25,481 28,991 31,141 28,109 23,829 22,659SOUTH CAROLINA 187,818 166,445 170,736 160,692 149,523 156,967 170,280 171,560 170,213 174,400 192,411SOUTH DAKOTA 29,692 24,531 20,710 19,438 18,828 20,955 20,890 22,532 22,631 25,713 24,119TENNESSEE 328,934 324,474 279,996 246,039 238,652 239,456 245,125 235,134 246,132 256,027 293,685TEXAS 994,703 1,017,776 970,088 930,214 904,654 913,531 989,147 1,012,863 1,045,644 995,417 1,030,047UTAH 66,635 59,156 54,507 57,925 67,607 76,410 78,626 73,714 69,718 74,355 70,571VERMONT 29,423 25,917 25,140 25,438 22,509 18,899 20,169 18,922 17,872 14,144 14,402VIRGINIA 278,807 267,931 224,736 177,900 180,901 198,441 198,692 201,815 210,542 206,263 217,231WASHINGTON 173,811 149,520 151,547 132,928 151,633 162,418 170,939 165,055 151,786 151,910 144,416WEST VIRGINIA 87,271 88,280 93,934 98,827 99,849 95,248 93,758 90,819 88,068 93,566 91,894WISCONSIN 191,975 172,199 168,460 158,846 144,193 134,276 138,861 160,451 164,688 178,954 154,310WYOMING 19,900 20,662 17,975 17,525 16,309 17,345 15,690 14,020 13,225 12,264 11,808
definitions:
Parental education: Parental education is the education level of the most highly educated parent living in the household. Parents can either have no high school degree; a high school degree, but no college; or some college or more.

14
Table 9: Percent of children who have parents with at least some college education, living in low-income families, 1997-2007
1997 1998 1999 2000 2001 2002 2003 2004 2005 2006 2007naTiOnaL 25 23 23 22 22 23 24 24 24 24 24ALABAMA 27 27 29 27 27 24 24 25 26 25 24ALASKA 21 21 22 22 23 22 21 23 24 25 23ARIZONA 36 32 31 30 31 27 27 26 29 29 28ARKANSAS 37 33 30 28 33 34 34 34 35 36 37CALIFORNIA 26 26 25 24 24 23 23 24 23 24 23COLORADO 18 17 16 15 17 19 21 21 20 20 19CONNECTICUT 16 14 13 14 14 15 14 14 13 14 14DELAWARE 25 19 20 20 17 15 16 19 19 19 19DISTRICT OF COLUMBIA 31 29 26 24 24 25 26 26 31 30 28FLORIDA 29 28 26 26 27 27 27 26 27 26 25GEORGIA 23 26 30 28 25 22 22 24 23 24 23HAWAII 26 26 25 23 23 23 25 23 22 21 21IDAHO 33 32 32 31 30 29 32 33 31 31 31ILLINOIS 22 21 19 17 18 20 21 22 22 21 22INDIANA 21 18 19 20 21 21 22 25 27 27 25IOWA 27 28 26 22 21 22 23 24 23 25 22KANSAS 27 24 23 23 23 22 22 23 26 26 26KENTUCKY 24 24 23 21 22 24 29 29 30 31 29LOUISIANA 35 31 32 33 34 31 31 30 29 25 24MAINE 30 30 29 24 23 23 24 24 24 22 22MARYLAND 14 11 11 11 12 12 14 16 16 15 13MASSACHUSETTS 19 20 20 21 19 17 15 16 17 17 19MICHIGAN 23 22 20 18 18 20 21 24 23 23 23MINNESOTA 24 22 20 16 16 16 17 16 15 16 18MISSISSIPPI 42 39 35 32 32 32 35 33 35 36 37MISSOURI 25 24 23 19 18 17 21 22 23 25 28MONTANA 38 37 35 36 35 34 36 37 37 33 32NEBRASKA 27 26 27 26 25 24 24 25 24 23 22NEVADA 20 21 21 21 21 23 24 24 23 22 21NEW HAMPSHIRE 22 23 20 17 17 16 16 14 14 14 13NEW JERSEY 16 18 17 16 14 13 14 13 15 15 17NEW MEXICO 41 40 40 36 36 35 38 38 37 33 30NEW YORK 27 27 27 25 23 23 25 24 25 23 24NORTH CAROLINA 24 24 22 22 25 26 29 29 29 27 26NORTH DAKOTA 28 33 36 36 33 31 31 30 29 27 27OHIO 22 24 24 22 21 20 20 22 22 22 24OKLAHOMA 33 30 25 28 29 30 31 29 30 31 33OREGON 27 28 28 28 26 24 26 27 30 30 29PENNSYLVANIA 22 21 19 18 19 19 19 18 20 22 23RHODE ISLAND 19 17 16 16 15 16 17 19 20 20 20SOUTH CAROLINA 26 25 27 26 25 23 24 27 28 29 30SOUTH DAKOTA 25 26 26 27 25 25 24 26 25 26 26TENNESSEE 34 30 26 23 23 24 25 26 25 25 24TEXAS 26 27 25 24 24 26 27 28 28 28 27UTAH 33 32 31 30 27 26 26 28 28 29 29VERMONT 27 24 24 22 24 21 20 20 19 20 21VIRGINIA 24 18 16 16 16 18 17 17 16 19 21WASHINGTON 26 27 22 23 22 24 23 24 25 24 22WEST VIRGINIA 32 31 34 32 32 31 32 31 30 27 29WISCONSIN 20 20 19 20 21 20 20 20 21 21 21WYOMING 35 37 38 34 32 28 28 28 26 25 26
definitions:
Parental education: Parental education is the education level of the most highly educated parent living in the household. Parents can either have no high school degree; a high school degree, but no college; or some college or more.
Numerator: Number of low-income children living with parents who have at least some college education
Denominator: Number of children living with parents who have at least some college education

National Center for Children in Poverty Low-Income Children in the United States 15
Table 10: number of children who have parents with at least some college education, living in low-income families, 1997-2007
1997 1998 1999 2000 2001 2002 2003 2004 2005 2006 2007naTiOnaL 10,047,247 9,802,157 9,664,098 9,504,242 9,846,148 10,170,262 10,875,995 10,921,849 10,926,959 11,038,555 11,109,354ALABAMA 165,875 155,099 168,850 163,484 166,303 158,853 163,269 170,065 164,767 164,498 157,652ALASKA 30,900 31,409 31,558 30,948 29,710 28,004 26,700 28,832 30,402 33,173 31,403ARIZONA 261,585 238,917 231,393 233,660 263,024 234,107 235,823 230,725 263,853 262,099 261,273ARKANSAS 132,053 118,262 103,032 94,860 108,278 119,830 127,434 129,720 135,340 140,252 144,552CALIFORNIA 1,273,811 1,266,125 1,255,165 1,263,119 1,263,177 1,266,144 1,237,422 1,294,917 1,291,164 1,293,839 1,237,604COLORADO 125,772 115,892 111,637 109,107 128,643 144,410 164,513 167,555 166,138 165,065 159,278CONNECTICUT 87,721 81,451 81,127 81,474 83,783 84,906 84,830 84,358 79,859 82,360 84,228DELAWARE 26,456 21,021 23,326 23,555 21,979 18,385 19,141 21,720 21,651 22,068 23,087DISTRICT OF COLUMBIA 16,646 14,395 12,761 12,683 13,226 13,865 13,947 13,912 16,841 16,546 15,577FLORIDA 529,843 512,858 503,180 531,868 596,108 631,418 643,263 636,386 668,035 660,556 620,709GEORGIA 223,909 256,350 322,114 320,912 300,035 288,437 305,216 331,489 317,119 347,457 353,008HAWAII 44,950 47,962 48,373 45,415 43,350 45,285 51,008 48,205 46,848 43,734 44,612IDAHO 66,399 67,854 71,401 71,503 67,039 70,443 78,338 81,443 78,959 81,452 86,786ILLINOIS 440,512 425,042 391,986 351,641 342,437 392,077 421,745 441,833 453,396 452,810 473,000INDIANA 158,263 147,275 162,587 175,250 179,277 192,632 215,084 247,076 266,593 261,789 242,366IOWA 133,215 127,924 116,526 103,595 105,340 113,679 115,640 117,972 113,374 119,421 108,208KANSAS 128,749 114,884 111,516 110,940 106,895 102,010 104,758 118,083 131,635 127,387 128,764KENTUCKY 114,401 117,755 119,519 115,600 122,025 139,955 170,490 172,143 179,297 177,503 178,217LOUISIANA 183,249 155,300 173,453 191,061 213,629 195,921 193,569 176,178 172,030 151,038 147,310MAINE 49,378 52,032 55,764 46,398 42,983 39,791 42,989 43,829 44,010 41,328 40,925MARYLAND 112,991 89,243 92,845 92,375 107,790 110,546 134,794 150,581 153,219 135,554 124,568MASSACHUSETTS 172,797 180,652 183,556 201,376 180,739 159,136 149,613 165,356 182,224 195,484 210,671MICHIGAN 362,371 345,329 331,757 317,051 308,954 315,185 336,906 387,222 387,146 383,657 380,255MINNESOTA 221,690 215,709 196,053 162,963 156,518 153,257 157,839 156,175 150,138 161,580 172,657MISSISSIPPI 170,043 171,880 155,695 148,036 149,269 147,979 151,485 142,091 150,189 158,847 166,971MISSOURI 190,151 201,780 204,257 173,810 166,030 158,145 189,735 194,002 205,088 222,088 250,770MONTANA 56,867 58,335 55,147 56,244 53,230 50,321 53,805 53,357 52,795 46,904 45,675NEBRASKA 88,509 85,022 90,830 86,794 80,847 77,426 78,986 81,568 77,697 72,684 68,792NEVADA 46,314 52,574 59,139 62,157 64,296 71,295 73,630 78,299 77,522 76,825 72,149NEW HAMPSHIRE 44,460 50,119 46,831 40,804 36,512 35,039 35,894 33,756 31,580 31,071 29,525NEW JERSEY 197,432 236,008 229,677 221,038 187,498 180,012 200,081 188,329 220,136 232,675 249,342NEW MEXICO 117,812 122,470 119,245 101,898 96,002 94,073 107,550 108,137 103,690 94,478 86,766NEW YORK 717,481 737,569 729,721 678,787 644,346 626,985 680,517 678,188 685,835 647,722 669,509NORTH CAROLINA 234,013 248,436 235,520 245,768 289,498 325,081 371,025 374,360 387,958 369,651 369,206NORTH DAKOTA 36,523 44,187 47,263 44,446 36,269 32,923 32,255 33,687 31,691 30,025 29,834OHIO 398,003 412,986 413,062 382,454 348,472 345,793 353,350 393,144 371,911 382,934 399,043OKLAHOMA 170,602 155,050 125,657 134,807 138,096 147,021 155,608 156,058 160,856 169,806 187,174OREGON 131,439 143,281 150,604 157,623 148,748 133,307 141,934 145,945 171,307 177,720 171,062PENNSYLVANIA 354,428 324,218 283,586 288,045 305,360 314,938 306,781 306,083 333,003 377,899 409,092RHODE ISLAND 24,373 22,175 22,446 24,146 23,365 24,140 25,742 29,266 32,282 31,227 32,686SOUTH CAROLINA 129,507 135,437 140,824 144,410 140,194 135,158 148,260 170,412 180,951 182,869 183,601SOUTH DAKOTA 30,268 31,287 33,421 34,518 32,482 33,873 33,573 35,827 33,962 34,256 35,759TENNESSEE 249,588 225,434 202,127 183,805 182,319 197,138 205,589 216,614 210,133 211,158 201,001TEXAS 734,468 772,607 743,481 728,133 727,550 817,611 895,076 934,874 969,045 975,103 992,307UTAH 169,718 163,334 167,298 159,488 145,867 135,598 140,340 155,731 159,301 167,889 168,033VERMONT 26,347 23,262 23,341 20,670 21,288 18,946 17,323 17,999 17,475 18,163 19,399VIRGINIA 221,388 183,792 171,267 178,598 194,613 208,960 206,846 199,354 194,053 222,193 252,562WASHINGTON 265,211 289,643 227,979 241,730 230,736 252,737 240,051 250,702 266,716 248,732 240,026WEST VIRGINIA 55,002 51,058 54,291 55,946 58,829 59,227 62,059 62,188 62,331 55,830 58,515WISCONSIN 180,607 167,777 170,892 181,794 191,398 175,074 172,843 178,015 186,334 182,545 186,592WYOMING 33,758 34,186 34,751 30,045 27,142 23,148 22,802 22,274 20,389 20,508 22,857
definitions:
Parental education: Parental education is the education level of the most highly educated parent living in the household. Parents can either have no high school degree; a high school degree, but no college; or some college or more.

16
Table 11: Percent of low-income children with at least one full-time, year-round employed parent, 1997-2007
1997 1998 1999 2000 2001 2002 2003 2004 2005 2006 2007naTiOnaL 50 53 55 57 56 55 54 54 55 56 55ALABAMA 50 49 48 47 50 52 53 53 53 54 50ALASKA 46 47 46 48 49 50 50 49 50 47 47ARIZONA 56 57 62 62 60 57 56 59 64 64 63ARKANSAS 59 61 60 61 58 58 55 55 56 57 57CALIFORNIA 48 50 51 53 56 58 58 57 56 57 58COLORADO 58 56 58 61 63 61 61 60 63 64 65CONNECTICUT 40 41 53 50 54 52 48 41 39 42 44DELAWARE 57 60 60 59 57 57 57 56 57 61 62DISTRICT OF COLUMBIA 24 29 34 43 44 40 36 37 40 42 41FLORIDA 50 52 56 60 61 59 58 57 58 59 59GEORGIA 52 54 53 57 58 59 58 56 56 55 58HAWAII 50 48 51 55 53 55 57 61 58 55 53IDAHO 54 54 58 60 60 61 61 66 68 72 70ILLINOIS 46 49 50 52 53 54 54 53 51 52 54INDIANA 61 60 60 63 63 61 59 56 55 53 52IOWA 69 67 68 65 69 64 62 60 61 58 56KANSAS 62 60 59 60 61 61 61 59 56 53 53KENTUCKY 47 46 47 50 55 56 54 50 49 49 45LOUISIANA 45 47 52 50 51 47 48 50 51 52 52MAINE 48 44 44 48 51 51 46 44 47 48 47MARYLAND 44 45 53 63 62 56 51 50 52 52 52MASSACHUSETTS 42 43 42 44 45 47 47 44 42 41 39MICHIGAN 44 45 46 48 48 49 47 47 44 45 47MINNESOTA 54 57 58 63 63 58 56 54 55 56 54MISSISSIPPI 52 55 58 59 55 50 49 50 51 49 50MISSOURI 56 49 46 49 50 54 54 54 51 52 51MONTANA 51 52 53 51 51 54 58 56 61 57 57NEBRASKA 66 66 67 67 62 64 61 63 59 60 56NEVADA 62 65 66 69 68 70 67 65 61 64 65NEW HAMPSHIRE 42 41 50 51 58 54 56 54 57 57 57NEW JERSEY 44 47 50 56 57 55 54 53 55 57 56NEW MEXICO 47 53 58 62 58 52 55 55 58 55 53NEW YORK 40 41 41 44 45 50 49 50 49 51 53NORTH CAROLINA 54 53 54 56 57 53 50 48 50 52 53NORTH DAKOTA 68 66 64 63 61 59 59 63 64 62 60OHIO 42 45 45 46 47 49 48 48 47 47 47OKLAHOMA 54 52 58 62 62 59 57 58 59 59 59OREGON 45 47 47 48 48 51 50 49 51 53 55PENNSYLVANIA 45 48 52 57 58 53 48 46 48 50 52RHODE ISLAND 33 33 38 42 44 44 50 44 40 38 40SOUTH CAROLINA 52 60 62 61 54 52 50 52 54 57 57SOUTH DAKOTA 60 62 66 68 69 66 63 57 52 54 59TENNESSEE 56 59 61 57 52 49 50 53 56 56 54TEXAS 58 59 59 60 63 63 64 63 62 62 61UTAH 70 65 67 65 65 57 55 56 60 64 64VERMONT 52 51 54 54 57 53 52 49 51 51 55VIRGINIA 52 52 55 61 64 63 60 57 57 58 59WASHINGTON 40 45 46 50 46 47 45 47 45 47 47WEST VIRGINIA 41 42 46 50 50 48 43 44 46 50 48WISCONSIN 55 55 58 59 60 58 54 53 53 54 54WYOMING 64 66 67 67 65 63 62 62 59 59 59
PaREnTaL EmPLOymEnT
definitions:
Parental employment: Parental employment is the employment level of the parent in the household who maintained the highest level of employment in the previous year. Parents can either have no employment in the previous year, part-year or part-time employment, or full-time/year-round employment. Part-year or part-time employment is defined as either working less than 50 weeks in the previous year or less than 35 hours per week. Full-time, year-round employment is defined as working at least 50 weeks in the previous year and 35 hours or more per week for more than half the year.
Numerator: Number of low-income children with at least one full-time, year-round employed parent
Denominator: Number of low-income children

National Center for Children in Poverty Low-Income Children in the United States 17
Table 12: number of low-income children with at least one full-time, year-round employed parent, 1997-2007
1997 1998 1999 2000 2001 2002 2003 2004 2005 2006 2007naTiOnaL 14,723,070 15,053,698 15,223,180 15,180,039 15,209,799 15,165,022 15,246,032 15,489,768 15,555,849 16,004,449 15,703,024ALABAMA 270,538 228,796 223,797 222,844 263,284 254,583 254,694 247,971 251,683 246,432 226,684ALASKA 28,257 28,970 28,027 29,234 28,482 28,641 30,052 31,091 32,496 28,934 26,298ARIZONA 396,197 418,604 421,328 410,733 394,431 358,873 365,467 383,989 462,001 485,658 490,859ARKANSAS 244,045 243,091 212,494 200,486 203,373 209,593 193,490 183,673 178,603 189,478 200,426CALIFORNIA 2,108,906 2,165,636 2,211,336 2,241,707 2,275,908 2,335,566 2,278,755 2,293,097 2,236,994 2,297,994 2,268,584COLORADO 180,504 172,503 176,207 199,336 216,965 219,559 226,790 226,391 239,641 246,822 248,156CONNECTICUT 114,669 105,738 114,597 115,223 123,408 120,644 102,279 86,791 78,103 85,631 94,351DELAWARE 41,415 44,948 45,560 41,075 33,977 31,290 32,964 34,861 36,201 39,567 41,473DISTRICT OF COLUMBIA 16,674 19,391 20,694 24,550 24,018 23,473 21,213 22,043 23,244 25,684 24,400FLORIDA 763,179 751,122 800,573 878,256 954,129 928,208 933,161 908,386 914,357 927,335 930,348GEORGIA 483,075 510,540 526,399 521,962 537,200 520,822 509,369 511,247 532,437 555,737 576,008HAWAII 63,189 60,217 59,317 60,878 57,200 58,552 61,492 60,096 51,144 46,815 44,921IDAHO 85,125 90,112 99,329 97,594 95,591 94,984 98,646 105,715 108,461 116,232 112,607ILLINOIS 582,440 597,562 585,031 566,321 549,127 589,377 617,753 634,322 600,370 590,294 605,083INDIANA 284,032 271,612 283,060 310,663 322,034 324,764 312,467 317,903 334,974 325,813 313,011IOWA 209,540 197,395 178,580 152,264 147,963 141,721 134,644 134,351 133,034 136,328 124,507KANSAS 171,902 153,588 141,612 145,440 139,030 135,960 135,874 140,129 139,238 138,163 144,553KENTUCKY 215,162 193,711 180,770 180,898 205,113 221,590 228,621 214,103 210,134 210,873 195,593LOUISIANA 272,639 268,651 291,239 302,346 307,393 277,893 280,056 284,940 278,142 262,642 246,166MAINE 50,480 46,456 47,912 48,021 51,093 50,680 46,602 43,820 47,179 46,595 45,908MARYLAND 178,598 153,301 150,329 174,797 183,613 167,598 163,219 180,228 208,462 199,122 188,410MASSACHUSETTS 204,453 210,621 205,158 222,475 211,187 203,971 201,128 182,322 172,020 162,082 164,293MICHIGAN 410,504 425,194 437,888 422,080 400,873 389,912 405,240 428,054 411,849 419,328 421,170MINNESOTA 239,999 243,293 224,468 196,347 179,046 161,035 164,051 157,695 160,023 172,178 184,015MISSISSIPPI 242,474 237,533 221,553 213,788 206,065 191,141 197,312 192,692 197,742 194,973 204,071MISSOURI 285,367 258,186 231,182 218,349 216,985 230,408 243,641 258,609 255,162 278,739 288,267MONTANA 62,150 66,333 61,531 56,468 51,715 51,581 57,475 55,896 60,092 51,611 50,725NEBRASKA 114,191 116,623 110,880 104,665 85,923 88,791 83,338 92,643 85,078 88,681 79,775NEVADA 95,686 108,789 127,856 141,972 146,302 152,549 152,922 151,778 142,773 154,476 158,816NEW HAMPSHIRE 34,887 39,291 48,706 42,521 42,626 35,582 37,583 34,422 35,347 35,076 32,863NEW JERSEY 239,852 279,839 290,144 315,421 288,336 282,356 288,646 273,791 284,628 291,332 314,741NEW MEXICO 166,110 174,791 182,489 175,195 157,875 128,831 142,049 141,742 150,667 132,333 119,336NEW YORK 861,677 858,597 846,301 843,073 824,889 884,902 897,357 932,432 912,862 938,246 961,002NORTH CAROLINA 394,344 403,100 411,989 440,651 472,482 451,376 449,262 432,743 451,533 473,306 496,703NORTH DAKOTA 41,195 46,087 47,924 43,543 35,367 31,134 31,529 32,667 32,387 30,842 30,428OHIO 465,778 499,283 496,511 480,126 463,290 453,574 453,780 474,181 468,755 474,313 480,752OKLAHOMA 233,218 206,990 197,260 223,267 240,050 240,834 228,830 226,049 228,393 234,969 244,277OREGON 153,838 172,285 167,602 168,115 156,105 162,139 161,442 161,956 177,883 182,730 183,682PENNSYLVANIA 491,001 516,604 547,826 567,486 543,668 497,564 461,805 449,120 482,570 510,137 527,338RHODE ISLAND 24,454 23,576 29,092 33,273 32,249 31,688 37,416 37,847 34,370 31,791 32,494SOUTH CAROLINA 250,444 251,186 249,259 237,445 209,337 204,955 206,769 218,929 236,760 255,867 255,940SOUTH DAKOTA 44,817 41,863 41,513 41,609 40,444 41,354 39,173 38,958 35,390 38,270 40,485TENNESSEE 408,715 409,862 380,038 322,481 292,374 283,159 292,854 305,381 321,943 332,594 340,235TEXAS 1,621,082 1,660,057 1,607,228 1,624,688 1,702,688 1,808,060 1,907,263 1,911,058 1,922,984 1,878,026 1,878,879UTAH 184,308 161,145 165,529 158,816 156,245 141,351 143,212 153,046 165,946 185,228 183,264VERMONT 31,267 26,640 28,035 27,316 27,345 22,158 21,300 19,813 19,599 18,332 20,506VIRGINIA 312,720 285,513 277,715 301,116 311,619 328,567 304,594 297,919 298,817 322,482 344,443WASHINGTON 206,051 229,373 205,055 227,530 220,781 244,800 238,229 248,750 243,369 242,836 231,573WEST VIRGINIA 75,545 74,904 82,983 95,084 95,264 91,851 81,672 82,156 81,528 88,601 85,291WISCONSIN 252,280 231,461 239,751 248,006 248,917 226,293 222,112 236,333 239,967 239,496 227,631WYOMING 37,451 39,212 38,325 34,772 30,960 28,668 27,357 26,145 23,214 22,329 23,100
definitions:
Parental employment: Parental employment is the employment level of the parent in the household who maintained the highest level of employment in the previous year. Parents can either have no employment in the previous year, part-year or part-time employment, or full-time/year-round employment. Part-year or part-time employment is defined as either working less than 50 weeks in the previous year or less than 35 hours per week. Full-time, year-round employment is defined as working at least 50 weeks in the previous year and 35 hours or more per week for more than half the year.

18
Table 13: Percent of low-income children with part-year or part-time employed parents, 1997-2007
1997 1998 1999 2000 2001 2002 2003 2004 2005 2006 2007naTiOnaL 30 29 30 27 28 28 28 27 26 25 26ALABAMA 24 27 31 31 29 29 29 26 23 21 23ALASKA 38 37 42 41 42 39 36 38 36 39 36ARIZONA 27 26 25 24 25 26 26 24 20 17 18ARKANSAS 26 24 24 24 29 27 28 27 26 26 26CALIFORNIA 29 29 30 30 29 26 25 24 24 23 23COLORADO 30 30 30 26 25 26 26 27 25 25 25CONNECTICUT 31 35 31 31 30 31 36 38 39 35 35DELAWARE 27 25 25 25 26 26 27 26 24 22 22DISTRICT OF COLUMBIA 27 26 27 22 23 22 24 24 25 27 25FLORIDA 27 29 29 27 24 24 25 26 26 24 23GEORGIA 29 28 29 23 22 22 24 26 22 22 20HAWAII 34 35 31 27 26 26 27 26 27 30 31IDAHO 38 40 37 34 33 33 32 28 25 21 20ILLINOIS 30 31 34 33 32 28 27 27 29 28 27INDIANA 26 28 28 27 27 26 28 28 29 28 28IOWA 23 24 22 26 25 29 30 30 28 31 32KANSAS 29 29 31 29 29 27 26 28 29 32 32KENTUCKY 28 31 34 34 30 27 29 31 32 31 32LOUISIANA 29 26 23 24 24 25 25 25 29 26 25MAINE 39 41 40 41 35 33 33 35 32 34 36MARYLAND 31 34 33 26 24 26 25 24 21 23 24MASSACHUSETTS 26 26 29 31 33 31 32 33 34 32 32MICHIGAN 33 33 35 35 34 31 33 33 35 31 31MINNESOTA 29 24 26 26 30 35 35 35 32 31 32MISSISSIPPI 29 28 27 26 25 27 26 26 23 24 21MISSOURI 30 35 35 32 31 31 32 32 34 31 30MONTANA 39 37 36 37 40 38 34 33 28 29 30NEBRASKA 23 25 25 26 29 27 29 28 30 28 28NEVADA 26 24 25 21 23 21 22 23 24 21 20NEW HAMPSHIRE 43 44 33 34 31 36 32 33 32 34 34NEW JERSEY 31 32 27 24 24 29 29 27 26 25 26NEW MEXICO 32 29 26 25 26 32 28 29 26 28 28NEW YORK 25 27 27 28 29 26 26 24 25 24 24NORTH CAROLINA 32 33 32 29 27 30 31 32 30 28 27NORTH DAKOTA 24 23 24 25 27 30 28 27 25 28 29OHIO 34 33 34 35 34 32 32 34 33 34 32OKLAHOMA 30 31 28 26 27 28 27 24 23 22 21OREGON 44 42 38 36 39 37 37 35 34 32 31PENNSYLVANIA 31 31 31 30 28 29 31 33 30 29 29RHODE ISLAND 33 33 30 32 31 31 26 32 36 36 34SOUTH CAROLINA 28 24 23 22 26 26 27 27 28 25 26SOUTH DAKOTA 24 22 23 25 23 24 28 29 30 29 26TENNESSEE 29 29 29 29 29 30 31 27 24 24 28TEXAS 27 26 26 26 24 24 24 24 22 21 21UTAH 23 29 26 28 28 33 35 35 32 27 25VERMONT 39 41 35 31 29 33 33 35 33 35 32VIRGINIA 34 35 34 27 24 22 23 25 23 23 22WASHINGTON 39 33 32 32 39 37 37 37 35 35 35WEST VIRGINIA 35 37 37 33 31 28 31 28 28 24 27WISCONSIN 33 33 31 32 31 31 29 31 32 34 32WYOMING 32 28 28 28 31 30 29 26 29 30 31
definitions:
Parental employment: Parental employment is the employment level of the parent in the household who maintained the highest level of employment in the previous year. Parents can either have no employment in the previous year, part-year or part-time employment, or full-time/year-round employment. Part-year or part-time employment is defined as either working less than 50 weeks in the previous year or less than 35 hours per week. Full-time, year-round employment is defined as working at least 50 weeks in the previous year and 35 hours or more per week for more than half the year.
Numerator: Number of low-income children with part-year or part-time employed parents
Denominator: Number of low-income children
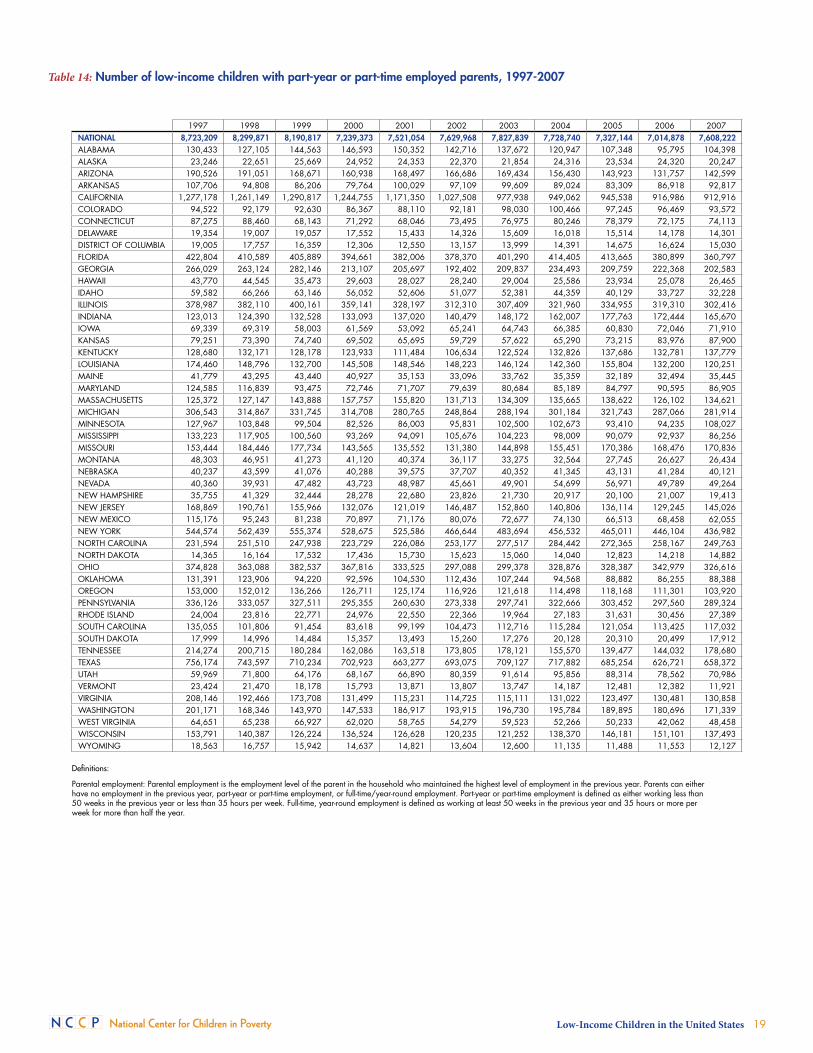
National Center for Children in Poverty Low-Income Children in the United States 19
Table 14: number of low-income children with part-year or part-time employed parents, 1997-2007
definitions:
Parental employment: Parental employment is the employment level of the parent in the household who maintained the highest level of employment in the previous year. Parents can either have no employment in the previous year, part-year or part-time employment, or full-time/year-round employment. Part-year or part-time employment is defined as either working less than 50 weeks in the previous year or less than 35 hours per week. Full-time, year-round employment is defined as working at least 50 weeks in the previous year and 35 hours or more per week for more than half the year.
1997 1998 1999 2000 2001 2002 2003 2004 2005 2006 2007naTiOnaL 8,723,209 8,299,871 8,190,817 7,239,373 7,521,054 7,629,968 7,827,839 7,728,740 7,327,144 7,014,878 7,608,222ALABAMA 130,433 127,105 144,563 146,593 150,352 142,716 137,672 120,947 107,348 95,795 104,398ALASKA 23,246 22,651 25,669 24,952 24,353 22,370 21,854 24,316 23,534 24,320 20,247ARIZONA 190,526 191,051 168,671 160,938 168,497 166,686 169,434 156,430 143,923 131,757 142,599ARKANSAS 107,706 94,808 86,206 79,764 100,029 97,109 99,609 89,024 83,309 86,918 92,817CALIFORNIA 1,277,178 1,261,149 1,290,817 1,244,755 1,171,350 1,027,508 977,938 949,062 945,538 916,986 912,916COLORADO 94,522 92,179 92,630 86,367 88,110 92,181 98,030 100,466 97,245 96,469 93,572CONNECTICUT 87,275 88,460 68,143 71,292 68,046 73,495 76,975 80,246 78,379 72,175 74,113DELAWARE 19,354 19,007 19,057 17,552 15,433 14,326 15,609 16,018 15,514 14,178 14,301DISTRICT OF COLUMBIA 19,005 17,757 16,359 12,306 12,550 13,157 13,999 14,391 14,675 16,624 15,030FLORIDA 422,804 410,589 405,889 394,661 382,006 378,370 401,290 414,405 413,665 380,899 360,797GEORGIA 266,029 263,124 282,146 213,107 205,697 192,402 209,837 234,493 209,759 222,368 202,583HAWAII 43,770 44,545 35,473 29,603 28,027 28,240 29,004 25,586 23,934 25,078 26,465IDAHO 59,582 66,266 63,146 56,052 52,606 51,077 52,381 44,359 40,129 33,727 32,228ILLINOIS 378,987 382,110 400,161 359,141 328,197 312,310 307,409 321,960 334,955 319,310 302,416INDIANA 123,013 124,390 132,528 133,093 137,020 140,479 148,172 162,007 177,763 172,444 165,670IOWA 69,339 69,319 58,003 61,569 53,092 65,241 64,743 66,385 60,830 72,046 71,910KANSAS 79,251 73,390 74,740 69,502 65,695 59,729 57,622 65,290 73,215 83,976 87,900KENTUCKY 128,680 132,171 128,178 123,933 111,484 106,634 122,524 132,826 137,686 132,781 137,779LOUISIANA 174,460 148,796 132,700 145,508 148,546 148,223 146,124 142,360 155,804 132,200 120,251MAINE 41,779 43,295 43,440 40,927 35,153 33,096 33,762 35,359 32,189 32,494 35,445MARYLAND 124,585 116,839 93,475 72,746 71,707 79,639 80,684 85,189 84,797 90,595 86,905MASSACHUSETTS 125,372 127,147 143,888 157,757 155,820 131,713 134,309 135,665 138,622 126,102 134,621MICHIGAN 306,543 314,867 331,745 314,708 280,765 248,864 288,194 301,184 321,743 287,066 281,914MINNESOTA 127,967 103,848 99,504 82,526 86,003 95,831 102,500 102,673 93,410 94,235 108,027MISSISSIPPI 133,223 117,905 100,560 93,269 94,091 105,676 104,223 98,009 90,079 92,937 86,256MISSOURI 153,444 184,446 177,734 143,565 135,552 131,380 144,898 155,451 170,386 168,476 170,836MONTANA 48,303 46,951 41,273 41,120 40,374 36,117 33,275 32,564 27,745 26,627 26,434NEBRASKA 40,237 43,599 41,076 40,288 39,575 37,707 40,352 41,345 43,131 41,284 40,121NEVADA 40,360 39,931 47,482 43,723 48,987 45,661 49,901 54,699 56,971 49,789 49,264NEW HAMPSHIRE 35,755 41,329 32,444 28,278 22,680 23,826 21,730 20,917 20,100 21,007 19,413NEW JERSEY 168,869 190,761 155,966 132,076 121,019 146,487 152,860 140,806 136,114 129,245 145,026NEW MEXICO 115,176 95,243 81,238 70,897 71,176 80,076 72,677 74,130 66,513 68,458 62,055NEW YORK 544,574 562,439 555,374 528,675 525,586 466,644 483,694 456,532 465,011 446,104 436,982NORTH CAROLINA 231,594 251,510 247,938 223,729 226,086 253,177 277,517 284,442 272,365 258,167 249,763NORTH DAKOTA 14,365 16,164 17,532 17,436 15,730 15,623 15,060 14,040 12,823 14,218 14,882OHIO 374,828 363,088 382,537 367,816 333,525 297,088 299,378 328,876 328,387 342,979 326,616OKLAHOMA 131,391 123,906 94,220 92,596 104,530 112,436 107,244 94,568 88,882 86,255 88,388OREGON 153,000 152,012 136,266 126,711 125,174 116,926 121,618 114,498 118,168 111,301 103,920PENNSYLVANIA 336,126 333,057 327,511 295,355 260,630 273,338 297,741 322,666 303,452 297,560 289,324RHODE ISLAND 24,004 23,816 22,771 24,976 22,550 22,366 19,964 27,183 31,631 30,456 27,389SOUTH CAROLINA 135,055 101,806 91,454 83,618 99,199 104,473 112,716 115,284 121,054 113,425 117,032SOUTH DAKOTA 17,999 14,996 14,484 15,357 13,493 15,260 17,276 20,128 20,310 20,499 17,912TENNESSEE 214,274 200,715 180,284 162,086 163,518 173,805 178,121 155,570 139,477 144,032 178,680TEXAS 756,174 743,597 710,234 702,923 663,277 693,075 709,127 717,882 685,254 626,721 658,372UTAH 59,969 71,800 64,176 68,167 66,890 80,359 91,614 95,856 88,314 78,562 70,986VERMONT 23,424 21,470 18,178 15,793 13,871 13,807 13,747 14,187 12,481 12,382 11,921VIRGINIA 208,146 192,466 173,708 131,499 115,231 114,725 115,111 131,022 123,497 130,481 130,858WASHINGTON 201,171 168,346 143,970 147,533 186,917 193,915 196,730 195,784 189,895 180,696 171,339WEST VIRGINIA 64,651 65,238 66,927 62,020 58,765 54,279 59,523 52,266 50,233 42,062 48,458WISCONSIN 153,791 140,387 126,224 136,524 126,628 120,235 121,252 138,370 146,181 151,101 137,493WYOMING 18,563 16,757 15,942 14,637 14,821 13,604 12,600 11,135 11,488 11,553 12,127

20
Table 15: Percent of low-income children with no employed parents, 1997-2007
1997 1998 1999 2000 2001 2002 2003 2004 2005 2006 2007naTiOnaL 20 18 15 16 17 17 19 19 19 19 19ALABAMA 25 24 22 22 21 20 19 21 24 25 27ALASKA 17 17 12 10 10 11 14 13 14 14 16ARIZONA 17 16 14 14 15 17 17 17 17 19 19ARKANSAS 15 15 16 14 13 16 17 18 18 17 17CALIFORNIA 23 21 19 17 16 16 18 19 20 20 19COLORADO 12 14 12 12 12 14 13 13 12 11 10CONNECTICUT 29 24 16 19 16 17 17 21 22 23 21DELAWARE 16 15 14 16 17 16 15 18 19 18 16DISTRICT OF COLUMBIA 49 45 39 35 34 38 40 38 35 31 33FLORIDA 23 19 15 14 15 17 17 16 16 16 18GEORGIA 19 18 18 20 20 19 18 19 22 22 22HAWAII 16 17 18 19 20 19 16 14 15 15 16IDAHO 9 7 6 6 7 7 7 7 7 7 10ILLINOIS 24 20 16 15 16 18 19 20 20 20 19INDIANA 13 12 12 10 10 12 13 16 16 19 20IOWA 9* 9* 10* 8* 6* 7 8 11 11 11 12KANSAS 9* 11 9* 11 11 12 13 13 15 15 14KENTUCKY 24 23 19 16 15 17 18 19 19 20 23LOUISIANA 25 27 25 26 25 28 27 25 20 22 22MAINE 13* 14* 15 12 13 16 21 21 21 18 17MARYLAND 25 20 13* 11* 13 18 24 26 27 25 24MASSACHUSETTS 33 31 29 24 22 22 21 23 23 26 29MICHIGAN 23 21 19 17 18 20 19 20 21 24 22MINNESOTA 18 19 17 11 7* 7 9 11 12 13 14MISSISSIPPI 19 17 15 15 20 23 24 24 26 27 29MISSOURI 14 16 19 19 19 15 14 14 15 17 19MONTANA 10 11 11 12 10 9 8 11 11 14 13NEBRASKA 11 10* 8* 7* 9 9 10 9 11 13 15NEVADA 12 11 9 10 10 10 11 12 15 15 15NEW HAMPSHIRE 14* 15* 16 15 11 9 12 13 11 9 9NEW JERSEY 25 22 23 20 20 16 17 20 19 18 18NEW MEXICO 21 19 16 13 15 16 18 16 16 17 20NEW YORK 35 33 31 29 26 24 25 26 26 24 23NORTH CAROLINA 14 14 14 15 15 18 19 20 20 20 20NORTH DAKOTA 9* 11 12 11 11 12 12 10 10 10 11OHIO 25 23 21 19 19 18 20 18 19 20 22OKLAHOMA 16 16 14 12 10 13 16 17 18 20 20OREGON 11 11 14 16 13 12 13 16 15 15 14PENNSYLVANIA 24 21 17 13 14 17 20 21 21 20 19RHODE ISLAND 34 34 32 26 25 24 24 24 24 26 26SOUTH CAROLINA 20 16 16 17 20 22 22 21 18 17 17SOUTH DAKOTA 16 15 10* 7 7 9 9 14 18 17 15TENNESSEE 15 13 11 14 18 20 19 19 20 20 17TEXAS 15 14 15 13 13 13 13 14 16 17 17UTAH 7* 6* 7 7 8 10 10 9 8 9 11VERMONT 8* 9* 11* 15 14 15 15 15 16 14 14VIRGINIA 14 13 11* 12 13 15 17 18 20 19 19WASHINGTON 21 22 22 18 16 16 17 16 19 17 18WEST VIRGINIA 24 21 18 17 19 23 26 28 26 26 25WISCONSIN 12 12 11 9 9 11 17 16 15 12 14WYOMING 5* 5* 5* 5* 4* 7 9 12 12 11 10
definitions:
Parental employment: Parental employment is the employment level of the parent in the household who maintained the highest level of employment in the previous year. Parents can either have no employment in the previous year, part-year or part-time employment, or full-time/year-round employment. Part-year or part-time employment is defined as either working less than 50 weeks in the previous year or less than 35 hours per week. Full-time, year-round employment is defined as working at least 50 weeks in the previous year and 35 hours or more per week for more than half the year.
Numerator: Number of low-income children with no employed parents
Denominator: Number of low-income children
State specific notes:
* This estimate should be used with caution. It may be unreliable due to a small sample size.

National Center for Children in Poverty Low-Income Children in the United States 21
Table 16: number of low-income children with no employed parents, 1997-2007
definitions:
Parental employment: Parental employment is the employment level of the parent in the household who maintained the highest level of employment in the previous year. Parents can either have no employment in the previous year, part-year or part-time employment, or full-time/year-round employment. Part-year or part-time employment is defined as either working less than 50 weeks in the previous year or less than 35 hours per week. Full-time, year-round employment is defined as working at least 50 weeks in the previous year and 35 hours or more per week for more than half the year.
State specific notes:
* This estimate should be used with caution. It may be unreliable due to a small sample size.
1997 1998 1999 2000 2001 2002 2003 2004 2005 2006 2007naTiOnaL 5,776,677 5,074,519 4,215,561 4,364,831 4,600,781 4,825,363 5,313,700 5,386,538 5,482,808 5,538,595 5,491,809ALABAMA 136,763 109,698 102,062 106,576 108,114 96,977 90,272 97,811 111,664 115,054 121,492ALASKA 10,442 10,216 7,116 6,139 5,594 6,541 8,538 8,564 9,104 8,969 9,116ARIZONA 119,238 119,062 94,989 95,057 98,178 107,811 112,303 113,346 120,283 141,091 145,969ARKANSAS 61,783 59,016 56,131 46,306 46,253 56,861 58,459 59,376 56,387 58,438 60,158CALIFORNIA 1,027,821 924,796 804,910 707,604 636,797 652,309 699,701 761,925 795,197 788,382 749,935COLORADO 37,683 44,482 35,432 40,359 41,365 48,776 47,406 50,521 44,888 44,198 39,510CONNECTICUT 82,325 61,786 35,369 42,451 37,164 39,320 35,864 43,857 44,821 48,221 45,236DELAWARE 11,782 10,966 10,888 11,202 10,199 8,878 8,855 11,190 12,236 11,563 10,677DISTRICT OF COLUMBIA 34,233 30,001 24,021 19,794 18,602 21,984 23,622 22,402 20,820 18,682 19,829FLORIDA 353,947 271,389 214,121 203,092 240,835 267,827 277,186 260,895 255,129 255,626 274,034GEORGIA 179,712 173,444 176,429 186,218 180,389 170,641 156,414 169,754 211,436 223,680 222,177HAWAII 20,582 21,158 20,843 20,834 21,813 19,889 17,649 13,432 13,140 12,829 13,904IDAHO 14,036 11,182 9,631 9,416 10,482 10,705 10,645 11,164 11,265 12,044 16,715ILLINOIS 297,374 244,706 184,756 164,407 163,356 197,768 222,309 239,253 236,915 226,136 215,591INDIANA 59,213 55,932 57,542 51,154 53,427 64,914 70,896 90,225 100,257 118,084 121,989IOWA 26,420* 27,380* 25,696* 19,093* 12,124* 14,477 17,781 23,976 23,230 26,442 26,434KANSAS 24,997* 28,233 22,029* 25,522 24,590 26,057 28,929 31,532 37,357 38,867 38,813KENTUCKY 110,456 95,943 72,448 60,070 57,345 69,315 75,538 83,433 80,294 86,481 99,918LOUISIANA 152,602 156,700 141,167 156,967 152,365 168,290 156,733 145,856 111,290 110,941 106,241MAINE 13,962* 14,932* 16,391 11,837 13,007 15,585 21,775 21,390 21,282 17,316 17,065MARYLAND 100,760 69,457 37,909* 31,646* 39,077 54,655 77,681 93,166 107,080 96,474 86,004MASSACHUSETTS 160,959 151,713 141,199 121,182 100,931 94,085 89,512 95,373 94,918 102,875 124,426MICHIGAN 219,734 201,224 178,092 150,422 148,319 162,300 167,248 185,290 192,067 217,860 200,857MINNESOTA 79,553 80,770 64,343 35,250 21,392* 18,834 26,918 32,552 36,053 40,402 47,197MISSISSIPPI 87,017 73,151 56,791 55,057 73,950 88,467 97,142 92,996 100,236 107,255 117,839MISSOURI 71,642 83,482 96,915 87,220 82,758 64,736 63,677 66,093 76,946 89,383 106,113MONTANA 12,532 13,778 13,126 13,288 9,720 8,356 8,144 10,595 10,949 12,477 11,871NEBRASKA 19,183 17,210* 14,098* 11,441* 12,366 12,259 13,554 13,142 15,063 18,978 21,967NEVADA 18,957 19,307 17,432 20,539 20,878 21,126 24,981 28,349 34,992 36,171 36,465NEW HAMPSHIRE 11,840* 14,094* 15,815 12,631 8,082 6,088 7,749 8,040 6,817 5,380 5,240NEW JERSEY 138,430 130,497 135,252 114,521 99,279 81,301 89,220 102,665 98,680 94,834 97,911NEW MEXICO 74,079 62,655 49,554 38,302 40,940 41,048 45,654 41,047 41,982 40,207 44,163NEW YORK 755,211 694,775 643,270 546,959 472,381 434,466 460,248 478,569 476,437 441,236 410,798NORTH CAROLINA 99,759 104,362 105,969 120,126 124,065 150,835 171,625 176,298 183,477 183,113 190,727NORTH DAKOTA 5,447* 7,969 8,856 7,642 6,425 6,077 6,560 5,327 5,133 5,008 5,548OHIO 274,697 251,093 232,502 201,385 191,320 168,550 184,688 177,429 191,606 199,248 221,786OKLAHOMA 68,361 64,800 48,974 42,794 39,801 53,520 62,885 67,398 68,666 78,016 83,874OREGON 37,934 41,043 51,228 55,089 41,197 37,384 41,522 50,756 50,912 51,542 47,829PENNSYLVANIA 263,212 219,208 174,774 130,884 134,807 160,486 194,383 207,539 211,709 204,541 189,434RHODE ISLAND 24,567 24,141 24,586 20,579 17,824 17,432 18,057 20,674 21,009 21,666 20,857SOUTH CAROLINA 95,667 67,414 64,028 66,145 76,626 85,188 91,004 90,878 79,126 76,156 77,219SOUTH DAKOTA 11,873 10,354 6,507* 4,313 4,300 5,801 5,881 9,504 12,173 11,928 10,076TENNESSEE 107,480 88,771 67,437 78,817 103,023 115,302 112,869 111,207 115,511 117,736 109,490TEXAS 404,598 405,504 403,450 362,576 355,127 360,837 376,432 411,092 487,554 522,899 534,279UTAH 18,196* 15,567* 17,044 17,471 19,059 25,442 24,922 25,452 22,020 25,379 32,717VERMONT 4,959* 4,520* 5,550* 7,326 6,821 6,159 6,089 6,161 6,195 5,009 5,124VIRGINIA 83,298 73,806 57,224* 58,623 61,871 79,212 88,885 95,584 106,243 107,211 113,032WASHINGTON 107,094 109,424 97,000 83,409 74,971 82,628 91,256 85,430 102,954 89,765 88,399WEST VIRGINIA 45,351 38,202 32,190 31,642 35,759 44,405 50,813 51,925 47,158 44,950 45,732WISCONSIN 53,392 50,510 46,186 37,631 36,518 42,078 68,733 69,698 68,952 54,285 58,877WYOMING 2,692* 3,101* 2,981* 2,628* 2,140* 3,008 4,071 5,070 4,735 4,287 3,746

22
Table 17: Percent of low-income children in married-parent families, 1997-2007
1997 1998 1999 2000 2001 2002 2003 2004 2005 2006 2007naTiOnaL 49 49 51 50 50 50 49 49 49 48 46ALABAMA 40 40 39 37 37 39 41 40 38 37 36ALASKA 61 56 54 54 55 54 54 56 57 51 47ARIZONA 58 57 59 56 56 54 55 57 57 57 54ARKANSAS 51 51 50 50 51 51 51 49 51 51 51CALIFORNIA 59 59 59 59 60 59 59 59 58 59 59COLORADO 59 57 57 59 58 58 57 57 59 58 60CONNECTICUT 38 37 39 37 39 39 38 36 37 37 36DELAWARE 39 39 37 40 44 48 47 43 43 45 46DISTRICT OF COLUMBIA 15 14 14 14 15 15 15 16 18 20 19FLORIDA 46 47 50 49 50 48 48 48 48 47 46GEORGIA 41 41 42 45 46 45 44 43 43 42 42HAWAII 60 56 51 52 51 53 56 57 53 50 45IDAHO 68 69 67 64 62 64 66 65 66 64 64ILLINOIS 44 44 46 43 43 42 42 44 44 45 45INDIANA 50 48 50 54 53 53 51 49 47 45 45IOWA 57 56 54 51 56 59 57 54 54 53 52KANSAS 51 46 46 50 53 54 53 51 52 49 48KENTUCKY 57 57 55 55 55 53 53 48 46 44 43LOUISIANA 41 39 41 38 38 35 36 36 36 37 38MAINE 52 45 46 46 50 47 47 46 48 44 46MARYLAND 40 44 41 40 37 40 41 42 39 37 36MASSACHUSETTS 41 40 38 41 41 42 39 37 35 34 33MICHIGAN 37 38 39 43 43 41 39 42 43 42 43MINNESOTA 53 55 59 61 58 51 51 51 50 50 48MISSISSIPPI 38 39 39 40 43 43 42 40 36 36 34MISSOURI 50 45 40 38 37 40 42 44 44 44 44MONTANA 57 56 57 53 48 47 51 54 56 54 52NEBRASKA 58 56 58 58 56 56 53 55 57 57 53NEVADA 52 53 54 55 54 55 56 56 53 50 50NEW HAMPSHIRE 51 49 46 46 47 45 46 45 44 46 44NEW JERSEY 50 51 47 49 47 48 47 45 46 48 43NEW MEXICO 55 60 61 59 52 50 51 52 51 49 50NEW YORK 41 40 39 41 42 43 44 45 44 43 43NORTH CAROLINA 39 41 42 47 49 48 46 43 44 42 41NORTH DAKOTA 58 58 58 56 55 56 60 61 57 48 43OHIO 47 47 46 43 42 44 45 46 43 42 38OKLAHOMA 52 53 58 60 56 54 53 53 53 50 49OREGON 48 50 46 50 49 55 52 50 52 56 57PENNSYLVANIA 52 52 52 51 50 51 49 46 42 41 41RHODE ISLAND 36 30 30 34 35 35 38 39 37 36 36SOUTH CAROLINA 42 46 50 52 46 41 37 39 40 42 39SOUTH DAKOTA 57 57 57 58 57 57 57 53 48 47 48TENNESSEE 47 45 50 49 45 43 45 47 47 46 45TEXAS 60 58 57 58 59 59 58 57 57 56 54UTAH 77 73 70 70 73 70 65 64 64 65 63VERMONT 58 48 45 47 49 49 48 49 49 49 50VIRGINIA 52 49 46 43 45 42 41 39 41 45 46WASHINGTON 48 46 42 44 47 47 47 49 48 49 47WEST VIRGINIA 57 57 57 52 51 50 52 53 52 51 50WISCONSIN 50 51 47 47 48 47 42 42 42 43 42WYOMING 61 59 60 61 60 59 59 57 54 53 56
PaREnTaL maRiTaL sTaTus
definitions:
Parental marital status: Married-parent families include step-parent families, as well as families with two biological/adoptive parents. Single-parent families include only families with one unmarried parent in the household.
Numerator: Number of low-income children in married-parent families
Denominator: Number of low-income children

National Center for Children in Poverty Low-Income Children in the United States 23
Table 18: number of low-income children in married-parent families, 1997-2007
definitions:
Parental marital status: Married-parent families include step-parent families, as well as families with two biological/adoptive parents. Single-parent families include only families with one unmarried parent in the household.
1997 1998 1999 2000 2001 2002 2003 2004 2005 2006 2007naTiOnaL 14,433,320 13,991,688 14,023,918 13,436,733 13,551,444 13,730,377 13,876,359 13,936,222 13,773,539 13,593,882 13,273,451ALABAMA 213,510 185,122 184,902 177,310 193,346 194,283 199,568 186,678 180,087 171,407 161,136ALASKA 37,994 34,516 32,725 32,316 32,130 30,829 32,701 35,656 36,892 32,018 26,197ARIZONA 408,371 415,683 402,472 375,923 367,183 340,866 354,703 375,005 415,974 433,208 418,815ARKANSAS 212,333 201,531 176,693 162,998 179,440 185,534 178,485 163,631 162,855 169,126 179,072CALIFORNIA 2,620,546 2,564,451 2,561,709 2,476,847 2,441,945 2,367,987 2,326,963 2,349,689 2,323,292 2,378,114 2,308,847COLORADO 184,439 175,896 173,759 191,713 199,570 208,214 211,655 214,428 223,598 225,452 227,032CONNECTICUT 106,629 95,336 84,571 85,684 89,928 91,628 80,986 75,974 74,035 77,159 76,692DELAWARE 28,438 29,457 27,638 28,126 26,143 26,034 26,832 26,465 27,408 29,409 30,645DISTRICT OF COLUMBIA 10,600 9,385 8,621 7,940 8,319 8,530 8,873 9,583 10,653 12,008 11,501FLORIDA 712,460 666,459 706,702 727,735 784,171 758,566 777,746 758,760 760,763 736,089 715,634GEORGIA 377,172 383,736 409,987 417,447 425,618 394,025 388,468 390,876 405,795 417,470 419,527HAWAII 76,595 70,204 59,024 57,649 54,693 56,755 60,818 56,979 46,974 42,210 38,682IDAHO 107,389 115,179 115,177 104,160 98,149 99,652 107,183 104,213 104,734 104,006 103,505ILLINOIS 552,974 544,307 533,514 470,369 448,579 456,906 482,056 521,495 518,662 509,403 510,636INDIANA 231,871 216,347 238,048 265,483 273,208 279,771 273,542 280,239 288,787 275,084 268,393IOWA 174,141 165,670 142,306 119,265 120,248 130,552 124,715 120,937 117,520 124,196 115,118KANSAS 140,510 116,496 110,583 120,425 122,674 120,439 116,994 121,390 130,812 127,134 131,056KENTUCKY 260,222 238,974 211,199 202,153 207,460 209,771 226,790 206,338 198,488 190,818 186,383LOUISIANA 242,994 222,761 232,252 228,348 231,505 207,863 212,576 204,867 194,913 184,912 177,425MAINE 55,598 46,621 49,242 46,677 49,595 46,708 48,206 46,625 48,188 42,539 45,237MARYLAND 161,798 150,738 116,462 111,958 110,158 119,802 130,415 149,556 155,930 142,430 131,203MASSACHUSETTS 199,782 195,347 185,795 203,378 190,624 182,106 166,592 151,212 143,051 133,195 138,942MICHIGAN 349,500 354,158 374,104 385,216 358,396 331,633 338,235 384,557 396,331 391,996 390,453MINNESOTA 237,192 234,403 228,705 191,614 166,983 141,306 148,393 148,348 146,146 153,147 164,078MISSISSIPPI 173,732 165,122 149,359 145,827 160,841 164,340 167,318 152,943 141,234 143,124 140,395MISSOURI 252,722 238,437 201,618 171,965 162,670 169,428 191,789 210,391 218,685 235,356 247,176MONTANA 69,622 71,495 65,763 58,951 48,952 44,838 50,293 53,522 55,539 48,670 45,926NEBRASKA 100,271 99,277 95,757 91,318 77,739 77,088 73,201 81,577 81,240 85,578 75,691NEVADA 80,398 88,820 104,045 113,221 117,360 121,298 126,863 130,799 124,802 119,926 121,919NEW HAMPSHIRE 41,931 46,512 44,912 38,559 34,421 29,281 31,162 28,795 27,267 28,028 25,411NEW JERSEY 274,541 308,345 272,406 276,256 236,822 244,406 246,867 233,372 239,602 245,299 239,344NEW MEXICO 195,927 198,601 190,064 167,630 139,956 123,919 131,571 134,307 131,902 116,956 111,714NEW YORK 879,800 842,149 805,430 782,019 760,769 771,737 803,009 834,453 823,662 789,458 784,199NORTH CAROLINA 286,423 312,539 318,809 366,693 404,240 406,930 408,991 380,741 395,473 380,208 381,689NORTH DAKOTA 35,199 40,453 42,981 38,652 31,844 29,416 31,716 31,589 28,662 24,024 22,075OHIO 524,678 519,859 509,699 453,529 419,306 403,325 418,313 451,283 425,663 423,118 392,656OKLAHOMA 223,277 209,994 198,517 214,757 216,588 221,619 212,604 206,065 203,559 200,076 204,968OREGON 163,894 183,708 164,931 173,426 159,538 174,074 169,272 165,228 181,234 192,683 192,627PENNSYLVANIA 562,946 560,940 549,939 506,093 472,979 478,058 467,263 453,205 421,547 410,645 409,566RHODE ISLAND 26,547 21,324 22,613 26,718 25,263 24,791 28,717 33,467 32,114 29,918 29,402SOUTH CAROLINA 202,208 194,769 201,092 199,636 175,292 162,704 150,837 165,326 172,717 186,634 177,344SOUTH DAKOTA 42,905 38,492 35,497 35,375 33,309 35,492 35,221 36,549 32,634 32,894 32,947TENNESSEE 342,533 318,058 310,761 278,028 250,141 244,113 260,796 269,264 272,189 274,889 280,237TEXAS 1,674,736 1,641,078 1,547,282 1,552,594 1,595,284 1,691,422 1,741,975 1,743,189 1,763,862 1,690,692 1,664,283UTAH 202,387 180,671 172,481 171,493 175,945 171,950 169,850 176,409 176,014 187,874 180,305VERMONT 34,339 25,186 23,351 23,628 23,724 20,576 19,580 19,734 18,748 17,563 18,815VIRGINIA 316,513 270,049 235,843 210,882 218,799 221,775 210,632 205,730 216,468 252,931 270,736WASHINGTON 247,553 231,242 186,940 200,254 224,482 246,339 248,307 257,748 259,579 249,399 230,578WEST VIRGINIA 106,107 101,108 103,723 98,658 96,164 95,573 100,172 98,114 92,421 90,147 90,204WISCONSIN 227,504 214,357 195,343 198,859 199,602 181,704 173,761 186,380 191,996 189,147 178,811WYOMING 36,046 34,646 34,295 31,691 28,608 26,896 25,819 23,969 21,334 20,116 21,730

24
Table 19: Percent of low-income children in single-parent families, 1997-2007
1997 1998 1999 2000 2001 2002 2003 2004 2005 2006 2007naTiOnaL 51 51 49 50 50 50 51 51 51 52 54ALABAMA 60 60 61 63 63 61 59 60 62 63 64ALASKA 39 44 46 46 45 46 46 44 43 49 53ARIZONA 42 43 41 44 44 46 45 43 43 43 46ARKANSAS 49 49 50 50 49 49 49 51 49 49 49CALIFORNIA 41 41 41 41 40 41 41 41 42 41 41COLORADO 41 43 43 41 42 42 43 43 41 42 40CONNECTICUT 62 63 61 63 61 61 62 64 63 63 64DELAWARE 61 61 63 60 56 52 53 57 57 55 54DISTRICT OF COLUMBIA 85 86 86 86 85 85 85 84 82 80 81FLORIDA 54 53 50 51 50 52 52 52 52 53 54GEORGIA 59 59 58 55 54 55 56 57 57 58 58HAWAII 40 44 49 48 49 47 44 43 47 50 55IDAHO 32 31 33 36 38 36 34 35 34 36 36ILLINOIS 56 56 54 57 57 58 58 56 56 55 55INDIANA 50 52 50 46 47 47 49 51 53 55 55IOWA 43 44 46 49 44 41 43 46 46 47 48KANSAS 49 54 54 50 47 46 47 49 48 51 52KENTUCKY 43 43 45 45 45 47 47 52 54 56 57LOUISIANA 59 61 59 62 62 65 64 64 64 63 62MAINE 48 55 54 54 50 53 53 54 52 56 54MARYLAND 60 56 59 60 63 60 59 58 61 63 64MASSACHUSETTS 59 60 62 59 59 58 61 63 65 66 67MICHIGAN 63 62 61 57 57 59 61 58 57 58 57MINNESOTA 47 45 41 39 42 49 49 49 50 50 52MISSISSIPPI 62 61 61 60 57 57 58 60 64 64 66MISSOURI 50 55 60 62 63 60 58 56 56 56 56MONTANA 43 44 43 47 52 53 49 46 44 46 48NEBRASKA 42 44 42 42 44 44 47 45 43 43 47NEVADA 48 47 46 45 46 45 44 44 47 50 50NEW HAMPSHIRE 49 51 54 54 53 55 54 55 56 54 56NEW JERSEY 50 49 53 51 53 52 53 55 54 52 57NEW MEXICO 45 40 39 41 48 50 49 48 49 51 50NEW YORK 59 60 61 59 58 57 56 55 56 57 57NORTH CAROLINA 61 59 58 53 51 52 54 57 56 58 59NORTH DAKOTA 42 42 42 44 45 44 40 39 43 52 57OHIO 53 53 54 57 58 56 55 54 57 58 62OKLAHOMA 48 47 42 40 44 46 47 47 47 50 51OREGON 52 50 54 50 51 45 48 50 48 44 43PENNSYLVANIA 48 48 48 49 50 49 51 54 58 59 59RHODE ISLAND 64 70 70 66 65 65 62 61 63 64 64SOUTH CAROLINA 58 54 50 48 54 59 63 61 60 58 61SOUTH DAKOTA 43 43 43 42 43 43 43 47 52 53 52TENNESSEE 53 55 50 51 55 57 55 53 53 54 55TEXAS 40 42 43 42 41 41 42 43 43 44 46UTAH 23 27 30 30 27 30 35 36 36 35 37VERMONT 42 52 55 53 51 51 52 51 51 51 50VIRGINIA 48 51 54 57 55 58 59 61 59 55 54WASHINGTON 52 54 58 56 53 53 53 51 52 51 53WEST VIRGINIA 43 43 43 48 49 50 48 47 48 49 50WISCONSIN 50 49 53 53 52 53 58 58 58 57 58WYOMING 39 41 40 39 40 41 41 43 46 47 44
definitions:
Parental marital status: Married-parent families include step-parent families, as well as families with two biological/adoptive parents. Single-parent families include only families with one unmarried parent in the household.
Numerator: Number of low-income children in single-parent families
Denominator: Number of low-income children

National Center for Children in Poverty Low-Income Children in the United States 25
Table 20: number of low-income children in single-parent families, 1997-2007
definitions:
Parental marital status: Married-parent families include step-parent families, as well as families with two biological/adoptive parents. Single-parent families include only families with one unmarried parent in the household.
1997 1998 1999 2000 2001 2002 2003 2004 2005 2006 2007naTiOnaL 14,789,637 14,436,400 13,605,640 13,347,511 13,780,190 13,889,976 14,511,212 14,668,823 14,592,262 14,964,039 15,529,604ALABAMA 324,225 280,477 285,520 298,702 328,404 299,993 283,070 280,050 290,607 285,874 291,438ALASKA 23,951 27,321 28,088 28,009 26,299 26,723 27,743 28,316 28,241 30,205 29,464ARIZONA 297,590 313,034 282,516 290,805 293,923 292,505 292,501 278,759 310,233 325,299 360,611ARKANSAS 201,201 195,384 178,138 163,559 170,215 178,029 173,073 168,441 155,444 165,708 174,330CALIFORNIA 1,793,359 1,787,130 1,745,354 1,717,220 1,642,110 1,647,396 1,629,432 1,654,395 1,654,437 1,625,248 1,622,587COLORADO 128,271 133,268 130,510 134,349 146,870 152,302 160,571 162,949 158,176 162,038 154,206CONNECTICUT 177,639 160,648 133,539 143,282 138,689 141,831 134,132 134,920 127,268 128,868 137,007DELAWARE 44,113 45,464 47,867 41,702 33,467 28,461 30,596 35,604 36,543 35,899 35,805DISTRICT OF COLUMBIA 59,312 57,764 52,453 48,710 46,851 50,084 49,962 49,253 48,086 48,982 47,758FLORIDA 827,470 766,641 713,881 748,274 792,799 815,839 833,891 824,925 822,389 827,771 849,545GEORGIA 551,643 563,373 574,986 503,841 497,668 489,840 487,151 524,617 547,837 584,315 581,242HAWAII 50,946 55,716 56,609 53,666 52,347 49,927 47,327 42,135 41,244 42,512 46,609IDAHO 51,355 52,381 56,930 58,902 60,530 57,114 54,490 57,025 55,122 57,997 58,045ILLINOIS 705,826 680,071 636,434 619,500 592,101 642,550 665,415 674,040 653,577 626,337 612,454INDIANA 234,387 235,586 235,081 229,428 239,273 250,386 257,994 289,896 324,207 341,258 332,278IOWA 131,158 128,423 119,971 113,661 92,931 90,886 92,453 103,775 99,574 110,621 107,734KANSAS 135,639 138,715 127,797 120,039 106,640 101,307 105,430 115,561 118,999 133,873 140,210KENTUCKY 194,077 182,850 170,198 162,747 166,483 187,768 199,892 224,024 229,626 239,317 246,907LOUISIANA 356,706 351,386 332,853 376,473 376,799 386,543 370,337 368,289 350,323 320,871 295,233MAINE 50,623 58,061 58,500 54,108 49,657 52,653 53,932 53,945 52,462 53,866 53,180MARYLAND 242,145 188,858 165,250 167,230 184,239 182,090 191,170 209,026 244,409 243,760 230,116MASSACHUSETTS 291,002 294,134 304,450 298,036 277,314 247,662 258,358 262,148 262,508 257,864 284,398MICHIGAN 587,281 587,126 573,621 501,994 471,560 469,443 522,447 529,971 529,327 532,258 513,488MINNESOTA 210,327 193,509 159,611 122,508 119,458 134,393 145,076 144,571 143,340 153,669 175,161MISSISSIPPI 288,983 263,466 229,545 216,287 213,264 220,944 231,359 230,754 246,824 252,041 267,771MISSOURI 257,732 287,676 304,213 277,169 272,625 257,096 260,427 269,761 283,808 301,242 318,040MONTANA 53,363 55,567 50,167 51,924 52,857 51,216 48,600 45,532 43,247 42,046 43,104NEBRASKA 73,339 78,155 70,298 65,076 60,125 61,669 64,044 65,553 62,032 63,365 66,172NEVADA 74,604 79,206 88,726 93,013 98,807 98,038 100,940 104,027 109,933 120,510 122,626NEW HAMPSHIRE 40,552 48,202 52,053 44,871 38,968 36,215 35,900 34,585 34,997 33,436 32,105NEW JERSEY 272,609 292,751 308,957 285,762 271,812 265,737 283,860 283,890 279,821 270,112 318,334NEW MEXICO 159,438 134,088 123,217 116,763 130,036 126,036 128,809 122,612 127,260 124,042 113,840NEW YORK 1,281,662 1,273,662 1,239,515 1,136,688 1,062,088 1,014,276 1,038,290 1,033,079 1,030,648 1,036,128 1,024,583NORTH CAROLINA 439,275 446,433 447,086 417,813 418,393 448,458 489,413 512,743 511,902 534,378 555,504NORTH DAKOTA 25,807 29,768 31,332 29,970 25,678 23,419 21,434 20,445 21,681 26,043 28,782OHIO 590,624 593,604 601,851 595,798 568,830 515,888 519,533 529,203 563,084 593,423 636,498OKLAHOMA 209,693 185,702 141,936 143,901 167,793 185,171 186,355 181,950 182,383 199,165 211,571OREGON 180,878 181,633 190,164 176,488 162,938 142,376 155,310 161,983 165,729 152,890 142,805PENNSYLVANIA 527,393 507,929 500,172 487,631 466,126 453,329 486,667 526,120 576,184 601,592 596,531RHODE ISLAND 46,478 50,208 53,836 52,109 47,360 46,696 46,720 52,237 54,897 53,995 51,339SOUTH CAROLINA 278,958 225,638 203,648 187,572 209,869 231,912 259,653 259,765 264,223 258,815 272,847SOUTH DAKOTA 31,784 28,721 27,007 25,905 24,928 26,923 27,110 32,041 35,238 37,802 35,526TENNESSEE 387,936 381,290 316,997 285,357 308,774 328,153 323,049 302,894 304,740 319,473 348,167TEXAS 1,107,119 1,168,080 1,173,630 1,137,593 1,125,807 1,170,550 1,250,847 1,296,844 1,331,930 1,336,954 1,407,246UTAH 60,086 67,840 74,267 72,961 66,248 75,202 89,898 97,945 100,267 101,294 106,663VERMONT 25,310 27,444 28,413 26,806 24,313 21,548 21,555 20,427 19,526 18,160 18,735VIRGINIA 287,651 281,737 272,804 280,356 269,923 300,730 297,957 318,794 312,089 307,243 317,597WASHINGTON 266,763 275,901 259,085 258,218 258,187 275,005 277,908 272,215 276,638 263,898 260,733WEST VIRGINIA 79,441 77,235 78,377 90,088 93,625 94,962 91,836 88,233 86,497 85,466 89,278WISCONSIN 231,959 208,000 216,818 223,302 212,461 206,902 238,336 258,022 263,105 255,735 245,190WYOMING 22,660 24,424 22,953 20,347 19,313 18,384 18,209 18,381 18,103 18,052 17,244

26
Table 21: Percent of white children living in low-income families, 1997-2007
1997 1998 1999 2000 2001 2002 2003 2004 2005 2006 2007naTiOnaL 29 28 27 25 27 26 26 27 26 26 26ALABAMA 31 30 32 29 31 29 28 27 28 28 28ALASKA 25 25 23 24 22 22 23 24 26 25 22ARIZONA 34 33 31 29 28 26 25 24 26 25 26ARKANSAS 47 45 41 38 41 45 44 43 40 41 41CALIFORNIA 25 27 27 25 24 22 22 22 21 22 21COLORADO 23 21 18 17 18 19 20 19 19 18 19CONNECTICUT 17 17 13 14 15 16 14 13 13 14 15DELAWARE 30 27 24 22 20 18 18 20 23 25 24DISTRICT OF COLUMBIA ** ** ** ** ** ** ** ** ** ** 16FLORIDA 33 31 30 28 29 27 26 25 25 25 25GEORGIA 28 27 28 26 27 27 27 27 27 27 25HAWAII 49 39 36 36 39 39 35 26 22 21 25IDAHO 41 40 38 37 36 36 38 37 35 36 35ILLINOIS 26 24 23 21 21 22 23 24 24 22 22INDIANA 32 30 29 30 30 31 30 31 33 33 31IOWA 36 35 31 27 26 26 26 27 26 29 26KANSAS 34 30 28 28 28 27 26 28 30 31 32KENTUCKY 43 42 39 37 37 40 42 42 42 41 39LOUISIANA 33 30 29 32 31 30 30 31 32 29 27MAINE 39 37 36 33 34 36 37 35 35 33 34MARYLAND 21 19 14 14 14 15 17 18 19 17 16MASSACHUSETTS 24 24 24 24 23 20 20 19 19 18 21MICHIGAN 28 27 26 24 24 25 26 29 28 29 28MINNESOTA 28 25 21 18 18 19 19 18 17 17 19MISSISSIPPI 37 35 36 33 33 31 33 31 31 32 33MISSOURI 34 31 29 26 26 25 27 29 31 32 33MONTANA 45 44 42 41 41 41 44 44 43 38 36NEBRASKA 33 32 30 29 26 27 25 26 25 26 24NEVADA 25 25 24 23 23 25 25 27 25 25 21NEW HAMPSHIRE 27 29 28 25 23 21 21 20 20 20 18NEW JERSEY 18 18 17 17 16 17 17 14 13 12 13NEW MEXICO 45 42 40 37 37 37 38 37 34 30 27NEW YORK 30 29 27 25 24 25 28 27 27 26 26NORTH CAROLINA 30 30 29 27 28 29 31 30 30 29 28NORTH DAKOTA 31 34 37 37 34 31 31 30 30 29 28OHIO 31 32 32 31 30 28 28 28 28 29 29OKLAHOMA 40 37 33 36 38 38 37 36 38 36 38OREGON 36 39 38 37 32 29 31 31 34 34 33PENNSYLVANIA 30 29 29 27 27 26 26 27 28 28 28RHODE ISLAND 26 25 23 21 18 18 19 23 24 24 21SOUTH CAROLINA 34 31 32 32 30 29 29 29 29 31 31SOUTH DAKOTA 35 33 31 30 28 29 27 29 28 30 29TENNESSEE 44 42 39 35 34 34 35 35 35 34 35TEXAS 25 25 25 24 23 23 24 24 24 24 24UTAH 35 34 33 32 30 28 29 31 31 31 29VERMONT 38 34 34 34 35 32 31 29 28 26 29VIRGINIA 33 30 26 22 20 22 21 20 19 22 23WASHINGTON 31 30 26 27 26 28 28 29 29 26 24WEST VIRGINIA 52 51 51 50 48 48 48 46 45 45 46WISCONSIN 26 25 21 22 22 23 22 24 25 26 24WYOMING 40 41 41 39 37 35 34 33 31 29 29
chiLD’s RacE/EThniciTy
definitions:
Race/ethnicity: In the most recent CPS, parents could report children’s race as one or more of the following: “White,” “Black,” “American Indian or Alaskan Native,” or “Asian and/or Hawaiian/Pacific Islander.” In a separate question, parents could report whether their children were of Latino ethnicity. For the data reported, children who were reported to be of Latino ethnicity were categorized as Latino, regardless of their reported race. Children who were reported to be of more than one race were not included in the “White,” “Black,” “Asian,” or “American Indian” categories. Changes were made to the racial categories in the March 1997 and 2003 supplements. These changes may influence the comparability of data on race and ethnicity before and after calendar year 2002. In 2007, approximately 3% of children in the U.S. were reported to be of more than one race and, thus, are excluded from these data presented by race.
White: Children whose parents reported their race as white and their ethnicity as non-Latino. Beginning in 2002, parents could choose more than one race for their child. Children who were white and another race were not counted as white.
Numerator: Number of low-income white children
Denominator: Number of white children
State specific notes:
** this estimate was not shown due to an extremely small sample size.

National Center for Children in Poverty Low-Income Children in the United States 27
Table 22: number of white children living in low-income families, 1997-2007
definitions:
Race/ethnicity: In the most recent CPS, parents could report children’s race as one or more of the following: “White,” “Black,” “American Indian or Alaskan Native,” or “Asian and/or Hawaiian/Pacific Islander.” In a separate question, parents could report whether their children were of Latino ethnicity. For the data reported, children who were reported to be of Latino ethnicity were categorized as Latino, regardless of their reported race. Children who were reported to be of more than one race were not included in the “White,” “Black,” “Asian,” or “American Indian” categories. Changes were made to the racial categories in the March 1997 and 2003 supplements. These changes may influence the comparability of data on race and ethnicity before and after calendar year 2002. In 2007, approximately 3% of children in the U.S. were reported to be of more than one race and, thus, are excluded from these data presented by race.
White: Children whose parents reported their race as white and their ethnicity as non-Latino. Beginning in 2002, parents could choose more than one race for their child. Children who were white and another race were not counted as white.
State specific notes:
** this estimate was not shown due to an extremely small sample size.
1997 1998 1999 2000 2001 2002 2003 2004 2005 2006 2007naTiOnaL 13,365,612 12,475,622 11,974,540 11,214,012 11,689,941 11,278,431 11,348,016 11,457,893 11,094,359 11,018,688 10,914,680ALABAMA 204,496 188,760 205,202 194,928 215,927 201,399 199,148 186,290 186,193 190,599 192,139ALASKA 36,711 37,513 32,394 30,970 25,803 23,940 24,170 25,129 28,392 28,588 26,254ARIZONA 224,356 224,320 213,655 214,164 212,926 193,864 191,986 174,160 183,272 181,156 195,478ARKANSAS 252,564 240,167 206,787 180,428 195,258 213,365 206,249 201,620 188,438 193,521 195,309CALIFORNIA 950,254 1,004,747 994,309 930,048 855,176 796,461 751,282 731,013 691,997 705,647 653,193COLORADO 171,629 152,697 138,180 130,494 141,864 140,709 143,437 128,699 132,371 132,464 144,418CONNECTICUT 107,803 105,804 83,450 86,140 86,824 94,211 80,743 79,004 75,413 78,435 81,239DELAWARE 35,010 32,733 29,375 28,198 25,641 23,690 22,330 24,186 27,468 28,947 27,714DISTRICT OF COLUMBIA ** ** ** ** ** ** ** ** ** ** 3,102FLORIDA 638,809 564,427 543,405 529,216 579,040 540,590 535,565 525,882 522,082 502,501 490,269GEORGIA 319,793 305,389 313,451 288,615 314,694 333,016 338,748 331,360 323,238 327,994 319,162HAWAII 29,298 21,399 20,224 20,733 21,886 17,587 12,578 7,635 8,241 8,575 10,302IDAHO 118,203 119,866 114,168 109,850 108,923 111,794 115,038 111,789 107,002 112,637 114,880ILLINOIS 536,211 515,031 487,419 421,882 414,152 415,183 439,663 451,242 458,896 415,828 393,828INDIANA 409,455 396,842 387,630 381,682 376,128 384,819 386,265 399,874 415,657 415,377 378,423IOWA 256,991 234,492 201,822 171,308 162,809 165,111 161,913 159,783 149,882 160,662 148,260KANSAS 199,103 172,624 156,028 153,559 146,400 138,894 133,454 145,340 155,101 164,486 169,355KENTUCKY 381,555 365,902 314,186 289,425 297,333 328,778 348,824 348,868 344,643 340,053 325,648LOUISIANA 208,681 179,733 170,754 190,910 191,981 200,872 190,796 196,238 198,114 177,163 168,288MAINE 104,137 102,306 105,352 97,868 95,150 93,338 93,371 90,896 90,190 86,492 87,588MARYLAND 169,605 146,386 106,542 102,742 111,094 119,578 130,287 135,229 138,443 124,209 114,735MASSACHUSETTS 274,636 273,930 263,395 262,297 242,959 220,181 221,661 216,897 214,877 197,674 222,270MICHIGAN 571,314 553,746 536,334 498,485 470,501 446,320 473,088 511,851 506,596 508,366 492,019MINNESOTA 321,073 285,660 243,602 206,147 199,162 196,161 193,773 180,789 164,715 164,789 183,701MISSISSIPPI 135,178 135,509 143,456 133,654 135,114 126,078 131,686 115,716 112,337 116,329 124,256MISSOURI 364,964 348,408 324,046 298,241 308,839 287,401 291,213 302,985 322,304 340,957 348,108MONTANA 89,353 93,182 86,873 83,242 80,749 76,020 78,166 76,961 77,354 66,986 63,784NEBRASKA 131,941 131,493 122,296 113,632 94,611 95,375 88,430 89,826 82,531 82,939 80,711NEVADA 65,404 73,735 76,718 73,085 73,590 73,447 74,467 80,400 75,828 77,188 62,350NEW HAMPSHIRE 77,106 87,987 90,676 77,822 67,908 58,939 57,721 54,752 54,298 54,085 48,786NEW JERSEY 214,210 218,003 216,789 214,628 207,001 207,620 208,891 182,178 156,633 138,292 145,318NEW MEXICO 97,323 86,949 73,572 64,175 60,493 63,679 64,456 62,833 55,622 51,814 46,474NEW YORK 805,786 776,953 735,513 663,918 657,933 657,537 708,723 678,660 654,715 620,249 611,571NORTH CAROLINA 325,345 340,551 330,211 311,527 335,085 348,745 375,458 373,208 376,465 370,265 359,532NORTH DAKOTA 46,916 51,075 54,119 49,900 40,231 36,705 36,942 37,075 35,670 33,428 32,191OHIO 769,896 779,509 769,195 718,898 661,182 611,998 610,840 626,778 612,507 606,650 595,310OKLAHOMA 256,877 233,830 203,804 214,404 221,526 216,811 205,279 195,246 203,798 193,098 202,304OREGON 237,920 259,705 266,022 254,896 213,598 185,251 186,643 182,047 205,030 209,456 205,780PENNSYLVANIA 705,789 664,359 658,283 620,500 594,357 577,791 568,501 579,559 596,914 605,676 599,292RHODE ISLAND 45,336 42,465 41,926 40,089 35,265 33,364 34,093 41,299 42,877 41,327 35,922SOUTH CAROLINA 193,244 192,207 198,167 201,321 188,708 180,641 175,315 172,590 175,632 181,337 187,344SOUTH DAKOTA 59,172 53,561 48,870 48,217 44,436 46,698 43,131 45,047 41,315 45,746 46,431TENNESSEE 467,507 448,086 407,096 368,484 341,409 333,094 346,641 345,488 346,660 350,248 356,196TEXAS 606,091 586,791 575,144 548,012 548,068 546,948 565,896 551,166 575,243 567,700 576,555UTAH 205,667 197,756 196,459 196,345 182,217 170,109 174,385 193,987 191,405 193,777 178,428VERMONT 55,683 48,580 47,375 47,489 45,699 39,942 38,385 36,808 35,005 32,775 34,769VIRGINIA 334,121 313,540 290,834 245,406 227,078 245,949 238,869 226,840 217,539 237,318 245,522WASHINGTON 382,690 391,736 331,543 325,559 303,533 321,615 304,487 307,947 298,147 275,126 252,530WEST VIRGINIA 173,530 160,406 160,013 166,172 170,242 170,831 170,100 165,632 161,278 161,041 164,167WISCONSIN 321,049 282,738 239,980 243,581 253,561 243,217 229,297 238,633 249,507 258,908 238,535WYOMING 50,212 50,345 48,508 44,228 41,249 37,361 34,885 32,290 29,621 28,744 29,503

28
Table 23: Percent of black children living in low-income families, 1997-2007
1997 1998 1999 2000 2001 2002 2003 2004 2005 2006 2007naTiOnaL 64 64 61 59 57 59 61 61 61 60 60ALABAMA 72 70 69 71 73 71 71 72 74 68 64ALASKA ** ** ** ** ** 34 ** ** ** ** **ARIZONA 73 69 ** 68 ** 57 ** ** ** ** **ARKANSAS 85 86 76 76 75 77 73 68 69 74 79CALIFORNIA 60 54 52 49 44 45 46 51 52 50 51COLORADO ** ** ** 58 56 58 59 65 63 64 61CONNECTICUT 65 56 58 62 62 61 58 53 45 44 45DELAWARE 54 54 57 53 49 45 51 55 53 47 42DISTRICT OF COLUMBIA 64 68 63 59 56 61 63 65 64 64 62FLORIDA 73 71 67 65 65 66 67 67 65 63 60GEORGIA 71 73 72 67 60 55 52 55 56 59 60HAWAII ** ** ** ** ** ** ** ** ** ** **IDAHO ** ** ** ** ** ** ** ** ** ** **ILLINOIS 65 64 61 61 59 61 64 67 66 63 60INDIANA ** ** ** 49 57 59 61 62 67 62 64IOWA ** ** ** ** 78 79 84 80 81 72 68KANSAS 56 61 52 55 54 64 72 73 72 69 64KENTUCKY 71 54 53 49 50 48 57 60 58 62 68LOUISIANA 77 78 77 76 76 76 75 74 72 72 71MAINE ** ** ** ** ** ** ** ** ** ** **MARYLAND 50 45 40 36 33 31 32 38 43 43 39MASSACHUSETTS 64 72 74 74 68 61 57 54 49 53 57MICHIGAN 75 71 67 62 60 61 64 65 67 65 63MINNESOTA 80 ** ** ** 54 63 73 70 71 66 73MISSISSIPPI 79 74 66 64 67 71 73 72 73 73 73MISSOURI 63 69 73 68 59 59 59 60 63 71 72MONTANA ** ** ** ** ** ** ** ** ** ** **NEBRASKA ** ** ** 72 73 69 67 63 65 71 69NEVADA 67 ** ** 67 62 59 59 61 61 60 65NEW HAMPSHIRE ** ** ** ** ** ** ** ** ** ** **NEW JERSEY 49 58 55 51 45 46 49 45 44 44 47NEW MEXICO ** ** ** ** ** ** ** ** ** ** **NEW YORK 69 69 67 66 64 60 57 58 61 60 58NORTH CAROLINA 66 64 62 61 58 60 62 63 62 64 67NORTH DAKOTA ** ** ** ** ** ** ** ** ** ** **OHIO 68 68 67 65 63 60 60 62 68 71 71OKLAHOMA 75 72 64 60 58 68 68 68 68 71 71OREGON ** ** ** ** ** ** ** ** ** ** **PENNSYLVANIA 73 76 71 67 62 62 63 62 62 66 68RHODE ISLAND ** ** ** ** 53 49 70 70 72 57 60SOUTH CAROLINA 68 62 61 58 59 59 61 63 64 63 62SOUTH DAKOTA ** ** ** ** ** ** ** ** ** ** **TENNESSEE 61 62 60 57 56 61 60 60 59 62 67TEXAS 61 60 58 56 53 51 54 56 59 57 57UTAH ** ** ** ** ** ** ** ** ** ** **VERMONT ** ** ** ** ** ** ** ** ** ** **VIRGINIA 55 50 46 48 47 48 49 53 51 49 52WASHINGTON ** ** ** ** 52 59 53 53 55 63 65WEST VIRGINIA ** ** 83 82 83 80 83 77 76 57 **WISCONSIN 76 73 69 68 62 67 70 75 72 65 61WYOMING ** ** ** ** ** ** ** ** ** ** **
definitions:
Race/ethnicity: In the most recent CPS, parents could report children’s race as one or more of the following: “White,” “Black,” “American Indian or Alaskan Native,” or “Asian and/or Hawaiian/Pacific Islander.” In a separate question, parents could report whether their children were of Latino ethnicity. For the data reported, children who were reported to be of Latino ethnicity were categorized as Latino, regardless of their reported race. Children who were reported to be of more than one race were not included in the “White,” “Black,” “Asian,” or “American Indian” categories. Changes were made to the racial categories in the March 1997 and 2003 supplements. These changes may influence the comparability of data on race and ethnicity before and after calendar year 2002. In 2007, approximately 3% of children in the U.S. were reported to be of more than one race and, thus, are excluded from these data presented by race.
Black: Children whose parents reported their race as black and their ethnicity as non-Latino. Beginning in 2002, parents could choose more than one race for their child. Children who were black and another race were not counted as black.
Numerator: Number of low-income black children
Denominator: Number of black children
State specific notes:
** this estimate was not shown due to an extremely small sample size.

National Center for Children in Poverty Low-Income Children in the United States 29
Table 24: number of black children living in low-income families, 1997-2007
definitions:
Race/ethnicity: In the most recent CPS, parents could report children’s race as one or more of the following: “White,” “Black,” “American Indian or Alaskan Native,” or “Asian and/or Hawaiian/Pacific Islander.” In a separate question, parents could report whether their children were of Latino ethnicity. For the data reported, children who were reported to be of Latino ethnicity were categorized as Latino, regardless of their reported race. Children who were reported to be of more than one race were not included in the “White,” “Black,” “Asian,” or “American Indian” categories. Changes were made to the racial categories in the March 1997 and 2003 supplements. These changes may influence the comparability of data on race and ethnicity before and after calendar year 2002. In 2007, approximately 3% of children in the U.S. were reported to be of more than one race and, thus, are excluded from these data presented by race.
Black: Children whose parents reported their race as black and their ethnicity as non-Latino. Beginning in 2002, parents could choose more than one race for their child. Children who were black and another race were not counted as black.
State specific notes:
** this estimate was not shown due to an extremely small sample size.
1997 1998 1999 2000 2001 2002 2003 2004 2005 2006 2007naTiOnaL 7,038,979 7,017,806 6,636,917 6,480,826 6,299,285 6,362,964 6,650,621 6,521,968 6,531,529 6,465,006 6,458,776ALABAMA 321,782 269,897 259,789 273,446 294,818 270,925 259,722 254,387 255,404 235,146 221,983ALASKA ** ** ** ** ** 2,901 ** ** ** ** **ARIZONA 59,212 53,344 ** 34,662 ** 31,762 ** ** ** ** **ARKANSAS 139,582 137,516 122,104 120,964 123,783 121,367 111,587 94,450 90,578 97,136 108,389CALIFORNIA 382,783 336,186 311,929 282,523 251,929 289,258 308,967 340,809 344,030 327,996 336,990COLORADO ** ** ** 35,727 37,750 36,214 32,595 35,965 37,691 37,542 36,330CONNECTICUT 73,398 58,718 66,000 76,641 79,518 65,074 58,512 48,656 41,049 40,326 41,913DELAWARE 26,078 30,544 36,801 32,319 25,556 20,496 23,514 25,060 23,753 21,211 20,158DISTRICT OF COLUMBIA 64,098 60,898 53,804 49,155 47,841 52,093 50,979 50,143 48,809 51,085 48,262FLORIDA 500,949 485,214 459,798 479,884 487,921 532,669 552,785 560,050 544,310 530,998 500,206GEORGIA 567,358 592,012 622,150 574,022 542,623 467,132 422,650 422,976 438,541 466,826 476,614HAWAII ** ** ** ** ** ** ** ** ** ** **IDAHO ** ** ** ** ** ** ** ** ** ** **ILLINOIS 446,357 429,189 408,123 411,105 389,158 397,396 403,665 399,644 386,788 362,191 340,519INDIANA ** ** ** 71,919 92,384 92,684 85,910 97,195 112,841 104,126 114,225IOWA ** ** ** ** 17,847 19,641 18,942 17,643 16,126 16,318 15,776KANSAS 41,025 52,010 43,002 37,318 28,926 31,899 36,773 36,516 36,985 33,747 29,750KENTUCKY 59,175 45,807 51,835 57,599 53,435 45,428 48,102 54,586 55,211 59,866 67,269LOUISIANA 353,195 367,229 375,805 397,469 390,805 361,987 356,888 344,453 322,940 307,646 286,671MAINE ** ** ** ** ** ** ** ** ** ** **MARYLAND 193,810 150,815 127,295 123,046 132,868 132,421 137,408 162,702 189,357 192,081 177,813MASSACHUSETTS 74,584 85,009 95,986 108,406 93,861 78,775 68,938 63,220 53,185 58,150 63,579MICHIGAN 304,179 317,619 333,623 304,892 270,589 261,841 285,629 290,838 297,903 282,377 270,886MINNESOTA 51,805 ** ** ** 22,170 30,117 44,593 47,824 50,706 49,815 60,372MISSISSIPPI 317,370 285,010 230,577 221,864 228,521 246,656 250,280 242,185 243,021 242,122 243,811MISSOURI 123,495 158,811 163,780 132,356 107,637 109,259 115,485 119,164 125,215 141,846 147,504MONTANA ** ** ** ** ** ** ** ** ** ** **NEBRASKA ** ** ** 17,598 17,186 15,684 18,345 16,781 15,821 15,958 15,424NEVADA 24,088 ** ** 25,472 30,129 28,345 27,950 27,038 31,898 35,684 41,876NEW HAMPSHIRE ** ** ** ** ** ** ** ** ** ** **NEW JERSEY 135,144 191,307 193,084 171,852 135,721 139,400 153,607 154,284 146,959 146,837 157,480NEW MEXICO ** ** ** ** ** ** ** ** ** ** **NEW YORK 625,502 624,472 576,821 576,635 542,072 496,066 459,878 479,126 496,187 473,873 434,389NORTH CAROLINA 321,301 328,693 322,278 327,149 322,860 339,501 343,759 333,735 337,617 347,647 367,649NORTH DAKOTA ** ** ** ** ** ** ** ** ** ** **OHIO 295,244 293,362 300,400 296,229 291,471 261,438 254,124 257,517 269,193 289,353 288,588OKLAHOMA 85,605 68,074 48,970 42,201 45,558 54,282 55,165 53,658 54,130 61,328 63,872OREGON ** ** ** ** ** ** ** ** ** ** **PENNSYLVANIA 281,786 289,044 272,418 253,927 222,188 222,217 237,071 236,307 232,485 239,545 241,342RHODE ISLAND ** ** ** ** 7,339 5,306 8,610 10,540 12,536 10,140 10,651SOUTH CAROLINA 275,523 216,006 197,368 173,514 177,077 191,767 213,826 224,422 224,489 220,754 219,627SOUTH DAKOTA ** ** ** ** ** ** ** ** ** ** **TENNESSEE 238,217 236,306 211,551 172,679 183,210 187,701 181,939 166,581 164,761 178,797 203,571TEXAS 453,218 489,321 462,711 411,571 374,606 364,081 404,182 426,989 461,071 450,859 457,439UTAH ** ** ** ** ** ** ** ** ** ** **VERMONT ** ** ** ** ** ** ** ** ** ** **VIRGINIA 242,419 208,382 187,880 203,331 214,623 216,400 211,066 215,635 205,838 194,979 209,678WASHINGTON ** ** ** ** 36,655 43,110 39,585 39,449 38,839 38,357 36,998WEST VIRGINIA ** ** 20,663 21,229 18,115 15,962 16,145 12,621 10,637 8,453 **WISCONSIN 77,712 80,754 91,243 90,446 74,019 73,831 80,098 88,280 88,736 74,389 63,851WYOMING ** ** ** ** ** ** ** ** ** ** **

30
Table 25: Percent of Latino children living in low-income families, 1997-2007
1997 1998 1999 2000 2001 2002 2003 2004 2005 2006 2007naTiOnaL 69 67 64 63 61 62 63 62 61 61 61ALABAMA ** ** ** ** ** ** ** ** ** ** 81ALASKA ** ** ** ** 49 44 43 42 44 43 41ARIZONA 77 78 77 73 70 67 66 66 67 68 69ARKANSAS ** ** 81 77 81 75 74 66 66 67 74CALIFORNIA 73 71 69 67 64 61 60 61 60 60 59COLORADO 59 63 60 63 60 60 57 58 57 60 56CONNECTICUT 81 74 68 67 64 64 59 60 60 60 60DELAWARE 73 72 69 70 60 56 54 56 53 61 67DISTRICT OF COLUMBIA ** ** 74 72 65 56 58 55 56 53 58FLORIDA 62 59 58 56 56 55 56 52 51 49 50GEORGIA ** ** 60 54 54 57 65 74 72 71 67HAWAII ** ** ** 64 78 60 52 46 41 38 38IDAHO 81 81 85 85 83 76 73 76 77 72 67ILLINOIS 66 61 55 49 46 52 52 55 55 58 58INDIANA ** ** ** 53 56 62 66 69 71 69 70IOWA ** 77 73 78 71 74 71 74 69 71 71KANSAS 61 60 68 76 73 67 59 57 58 65 67KENTUCKY ** ** ** ** ** 54 60 ** ** 71 84LOUISIANA ** ** ** ** ** ** ** 58 ** ** **MAINE ** ** ** ** ** ** ** ** ** ** **MARYLAND ** ** ** 52 43 36 41 44 43 38 37MASSACHUSETTS 83 78 75 72 71 69 70 68 68 69 72MICHIGAN 58 55 55 61 63 49 45 45 53 61 66MINNESOTA 77 81 78 72 67 62 54 52 53 57 60MISSISSIPPI ** ** ** ** ** ** ** ** ** ** 77MISSOURI ** ** ** ** ** ** 65 64 56 52 56MONTANA ** ** ** ** ** ** ** ** 51 68 78NEBRASKA 75 73 67 61 57 53 52 57 59 61 61NEVADA 67 62 62 61 60 59 60 61 59 57 58NEW HAMPSHIRE ** ** ** ** ** 55 59 56 ** ** 49NEW JERSEY 57 57 55 55 51 46 45 44 47 49 53NEW MEXICO 69 65 61 58 58 56 59 58 60 55 51NEW YORK 75 71 70 66 64 64 65 64 60 61 63NORTH CAROLINA 75 70 77 79 75 67 68 71 70 68 70NORTH DAKOTA ** ** ** ** ** ** 66 ** ** 60 71OHIO 74 63 54 43 37 38 44 52 52 55 61OKLAHOMA 67 ** ** 70 77 76 74 71 72 67 65OREGON 81 77 65 67 73 76 72 71 70 77 74PENNSYLVANIA 67 65 65 69 73 70 67 67 66 68 64RHODE ISLAND 78 78 77 80 79 77 77 73 70 69 68SOUTH CAROLINA ** ** ** ** ** ** ** ** 73 71 62SOUTH DAKOTA ** ** ** ** ** ** 60 59 66 68 61TENNESSEE ** ** ** ** ** 79 75 69 72 72 77TEXAS 74 72 68 66 65 68 69 70 69 67 65UTAH 62 61 58 57 62 65 70 67 69 65 63VERMONT ** ** ** ** ** ** ** ** ** ** **VIRGINIA ** ** ** ** 31 36 41 49 52 50 48WASHINGTON 79 74 58 57 63 71 71 67 68 64 60WEST VIRGINIA ** ** ** ** ** ** ** ** ** ** **WISCONSIN ** ** 69 66 55 54 63 68 72 70 68WYOMING 70 54 50 49 52 53 49 50 53 52 50
definitions:
Race/ethnicity: In the most recent CPS, parents could report children’s race as one or more of the following: “White,” “Black,” “American Indian or Alaskan Native,” or “Asian and/or Hawaiian/Pacific Islander.” In a separate question, parents could report whether their children were of Latino ethnicity. For the data reported, children who were reported to be of Latino ethnicity were categorized as Latino, regardless of their reported race. Children who were reported to be of more than one race were not included in the “White,” “Black,” “Asian,” or “American Indian” categories. Changes were made to the racial categories in the March 1997 and 2003 supplements. These changes may influence the comparability of data on race and ethnicity before and after calendar year 2002. In 2007, approximately 3% of children in the U.S. were reported to be of more than one race and, thus, are excluded from these data presented by race.
Latino: Children whose parents reported their ethnicity as Latino, regardless of reported race.
Numerator: Number of low-income Latino children
Denominator: Number of Latino children
State specific notes:
** this estimate was not shown due to an extremely small sample size.

National Center for Children in Poverty Low-Income Children in the United States 31
Table 26: number of Latino children living in low-income families, 1997-2007
definitions:
Race/ethnicity: In the most recent CPS, parents could report children’s race as one or more of the following: “White,” “Black,” “American Indian or Alaskan Native,” or “Asian and/or Hawaiian/Pacific Islander.” In a separate question, parents could report whether their children were of Latino ethnicity. For the data reported, children who were reported to be of Latino ethnicity were categorized as Latino, regardless of their reported race. Children who were reported to be of more than one race were not included in the “White,” “Black,” “Asian,” or “American Indian” categories. Changes were made to the racial categories in the March 1997 and 2003 supplements. These changes may influence the comparability of data on race and ethnicity before and after calendar year 2002. In 2007, approximately 3% of children in the U.S. were reported to be of more than one race and, thus, are excluded from these data presented by race.
Latino: Children whose parents reported their ethnicity as Latino, regardless of reported race.
State specific notes:
** this estimate was not shown due to an extremely small sample size.
1997 1998 1999 2000 2001 2002 2003 2004 2005 2006 2007naTiOnaL 7,431,767 7,363,753 7,379,152 7,699,630 7,794,696 8,124,878 8,536,912 8,771,472 8,843,389 9,171,071 9,444,077ALABAMA ** ** ** ** ** ** ** ** ** ** 30,014ALASKA ** ** ** ** 4,511 5,158 5,798 6,339 6,003 5,038 4,403ARIZONA 393,956 432,034 413,382 391,967 383,109 374,547 389,676 409,024 449,838 480,073 487,636ARKANSAS ** ** 17,622 18,332 22,775 20,628 21,672 19,954 25,511 32,413 40,264CALIFORNIA 2,626,175 2,586,203 2,613,096 2,596,548 2,586,970 2,530,354 2,505,910 2,566,105 2,591,744 2,649,443 2,630,562COLORADO 107,765 122,954 118,214 140,262 147,190 161,678 166,896 185,032 189,266 197,479 180,940CONNECTICUT 100,887 89,281 68,660 65,362 59,818 69,542 67,794 73,109 69,625 73,593 78,852DELAWARE 10,444 10,130 7,815 8,396 7,696 7,957 8,142 8,748 9,275 11,406 13,983DISTRICT OF COLUMBIA ** ** 7,163 6,529 5,840 4,787 6,007 5,956 5,935 5,660 6,489FLORIDA 378,358 355,976 390,322 434,757 472,064 459,685 473,668 442,896 457,400 474,302 518,358GEORGIA ** ** 41,219 49,807 62,355 74,682 100,146 130,565 156,420 165,011 164,815HAWAII ** ** ** 8,913 8,749 13,468 14,976 15,800 11,846 12,665 12,814IDAHO 34,292 43,832 54,554 49,055 43,330 36,726 37,669 40,493 43,399 40,203 37,595ILLINOIS 255,059 264,809 255,817 236,395 216,254 255,100 272,263 302,921 288,793 303,377 327,911INDIANA ** ** ** 27,746 28,954 35,190 44,497 51,407 63,364 73,587 88,023IOWA ** 28,096 30,933 34,128 27,697 29,957 28,365 33,823 34,260 40,158 45,076KANSAS 20,473 20,290 31,158 41,776 44,944 40,247 36,987 35,383 35,106 44,871 54,214KENTUCKY ** ** ** ** ** 18,339 17,459 ** ** 16,471 25,323LOUISIANA ** ** ** ** ** ** ** 21,172 ** ** **MAINE ** ** ** ** ** ** ** ** ** ** **MARYLAND ** ** ** 34,498 37,760 34,195 40,261 44,106 48,502 42,101 41,048MASSACHUSETTS 118,687 116,865 111,671 108,845 113,269 115,875 116,506 111,256 109,620 108,502 111,645MICHIGAN 48,057 50,613 54,018 63,369 64,939 55,882 53,268 57,633 68,674 82,242 93,080MINNESOTA 37,850 42,870 36,000 28,693 22,816 21,520 22,260 27,479 33,663 46,335 55,086MISSISSIPPI ** ** ** ** ** ** ** ** ** ** 19,066MISSOURI ** ** ** ** ** ** 28,702 35,489 35,594 31,769 39,492MONTANA ** ** ** ** ** ** ** ** 4,409 5,812 7,537NEBRASKA 20,348 21,616 17,782 18,219 18,042 19,145 20,154 27,145 31,271 37,270 34,836NEVADA 55,902 62,757 82,749 94,926 98,673 97,610 101,761 106,029 106,859 109,301 120,196NEW HAMPSHIRE ** ** ** ** ** 4,951 6,262 4,743 ** ** 4,173NEW JERSEY 163,909 163,245 145,763 148,293 136,240 134,213 137,809 150,868 183,795 205,485 226,751NEW MEXICO 190,952 174,453 156,871 141,653 140,517 137,032 145,896 146,256 152,439 137,507 121,753NEW YORK 651,580 634,157 634,921 567,520 503,737 505,761 533,679 565,208 546,940 575,655 595,162NORTH CAROLINA 37,584 47,093 66,763 90,953 101,562 100,679 114,257 118,088 129,522 126,499 144,388NORTH DAKOTA ** ** ** ** ** ** 2,344 ** ** 2,944 3,943OHIO 41,508 33,258 28,047 20,775 18,292 21,957 32,105 44,564 53,388 68,525 86,024OKLAHOMA 22,702 ** ** 25,899 44,450 56,763 57,467 47,825 43,948 44,681 50,564OREGON 65,493 67,713 53,290 62,390 80,633 101,829 101,794 101,084 97,784 95,090 96,699PENNSYLVANIA 67,588 72,246 76,766 92,745 99,110 102,095 112,617 125,917 128,217 123,341 116,437RHODE ISLAND 16,534 15,563 16,865 20,088 23,077 28,456 28,505 29,210 27,338 27,494 28,032SOUTH CAROLINA ** ** ** ** ** ** ** ** 22,866 27,686 24,484SOUTH DAKOTA ** ** ** ** ** ** 2,187 2,790 4,183 4,998 4,626TENNESSEE ** ** ** ** ** 37,893 38,801 43,312 47,924 47,887 46,925TEXAS 1,653,193 1,653,393 1,577,205 1,623,211 1,698,261 1,858,672 1,926,606 1,976,186 1,990,353 1,949,614 1,973,654UTAH 32,134 28,259 28,382 31,229 41,941 54,194 64,182 64,695 68,822 72,997 78,132VERMONT ** ** ** ** ** ** ** ** ** ** **VIRGINIA ** ** ** ** 30,016 35,584 39,007 55,134 72,157 81,753 79,167WASHINGTON 49,890 48,443 51,834 60,432 80,092 91,020 105,544 109,700 118,625 112,981 108,919WEST VIRGINIA ** ** ** ** ** ** ** ** ** ** **WISCONSIN ** ** 33,595 33,551 34,318 38,461 58,702 69,904 71,638 65,093 72,608WYOMING 5,707 4,411 3,745 3,783 3,816 5,089 5,266 6,465 6,896 6,708 6,412

32
Table 27: Percent of asian children living in low-income families, 1997-2007
1997 1998 1999 2000 2001 2002 2003 2004 2005 2006 2007naTiOnaL 33 36 33 29 31 32 29 29 28 27 30ALABAMA ** ** ** ** ** ** ** ** ** ** **ALASKA ** ** ** 43 45 42 49 62 58 47 38ARIZONA ** ** ** ** ** ** ** ** ** ** **ARKANSAS ** ** ** ** ** ** ** ** ** ** **CALIFORNIA 39 37 32 31 29 31 29 30 28 26 27COLORADO ** ** ** ** ** ** ** ** ** ** **CONNECTICUT ** ** ** ** ** ** ** ** ** ** **DELAWARE ** ** ** ** ** ** ** ** ** ** **DISTRICT OF COLUMBIA ** ** ** ** ** ** ** ** ** ** **FLORIDA ** ** ** ** ** ** 38 38 ** ** **GEORGIA ** ** ** ** ** ** ** ** ** ** **HAWAII 40 42 36 34 32 32 33 31 27 27 28IDAHO ** ** ** ** ** ** ** ** ** ** **ILLINOIS ** ** ** ** ** ** ** ** ** ** 18INDIANA ** ** ** ** ** ** ** ** ** ** **IOWA ** ** ** ** ** ** ** ** ** ** **KANSAS ** ** ** ** ** ** ** ** ** ** **KENTUCKY ** ** ** ** ** ** ** ** ** ** **LOUISIANA ** ** ** ** ** ** ** ** ** ** **MAINE ** ** ** ** ** ** ** ** ** ** **MARYLAND ** ** ** ** ** ** ** ** ** ** **MASSACHUSETTS ** ** ** ** ** ** ** ** ** ** **MICHIGAN ** ** ** ** ** ** ** ** ** ** **MINNESOTA ** ** ** ** ** ** ** 38 40 43 39MISSISSIPPI ** ** ** ** ** ** ** ** ** ** **MISSOURI ** ** ** ** ** ** ** ** ** ** **MONTANA ** ** ** ** ** ** ** ** ** ** **NEBRASKA ** ** ** ** ** ** ** ** ** ** **NEVADA ** ** ** ** 39 36 37 24 ** ** **NEW HAMPSHIRE ** ** ** ** ** ** ** ** ** ** **NEW JERSEY ** ** ** ** 24 18 17 ** ** ** **NEW MEXICO ** ** ** ** ** ** ** ** ** ** **NEW YORK 33 32 35 36 39 38 41 38 43 41 45NORTH CAROLINA ** ** ** ** ** ** ** ** ** ** **NORTH DAKOTA ** ** ** ** ** ** ** ** ** ** **OHIO ** ** ** ** ** ** ** ** ** ** **OKLAHOMA ** ** ** ** ** ** ** ** ** ** **OREGON ** ** ** ** ** ** ** ** ** ** **PENNSYLVANIA ** 44 46 ** ** ** ** ** ** ** **RHODE ISLAND ** ** ** ** ** ** ** ** ** ** **SOUTH CAROLINA ** ** ** ** ** ** ** ** ** ** **SOUTH DAKOTA ** ** ** ** ** ** ** ** ** ** **TENNESSEE ** ** ** ** ** ** ** ** ** ** **TEXAS 48 56 57 50 40 33 30 26 ** 23 24UTAH ** ** ** ** 44 49 ** ** ** ** 65VERMONT ** ** ** ** ** ** ** ** ** ** **VIRGINIA ** ** ** ** ** ** ** ** ** ** **WASHINGTON ** ** ** ** ** 34 33 32 ** 37 34WEST VIRGINIA ** ** ** ** ** ** ** ** ** ** **WISCONSIN ** ** ** ** ** ** 69 75 67 60 60WYOMING ** ** ** ** ** ** ** ** ** ** **
definitions:
Race/ethnicity: In the most recent CPS, parents could report children’s race as one or more of the following: “White,” “Black,” “American Indian or Alaskan Native,” or “Asian and/or Hawaiian/Pacific Islander.” In a separate question, parents could report whether their children were of Latino ethnicity. For the data reported, children who were reported to be of Latino ethnicity were categorized as Latino, regardless of their reported race. Children who were reported to be of more than one race were not included in the “White,” “Black,” “Asian,” or “American Indian” categories. Changes were made to the racial categories in the March 1997 and 2003 supplements. These changes may influence the comparability of data on race and ethnicity before and after calendar year 2002. In 2007, approximately 3% of children in the U.S. were reported to be of more than one race and, thus, are excluded from these data presented by race.
Asian: Children whose parent reported their race as Asian, Hawaiian/Pacific Islander and their ethnicity as non-Latino. Beginning in 2002, parents could choose more than one race for their child. Children who were Asian and another race were not counted as Asian.
Numerator: Number of low-income Asian children
Denominator: Number of Asian children
State specific notes:
** this estimate was not shown due to an extremely small sample size.

National Center for Children in Poverty Low-Income Children in the United States 33
Table 28: number of asian children living in low-income families, 1997-2007
definitions:
Race/ethnicity: In the most recent CPS, parents could report children’s race as one or more of the following: “White,” “Black,” “American Indian or Alaskan Native,” or “Asian and/or Hawaiian/Pacific Islander.” In a separate question, parents could report whether their children were of Latino ethnicity. For the data reported, children who were reported to be of Latino ethnicity were categorized as Latino, regardless of their reported race. Children who were reported to be of more than one race were not included in the “White,” “Black,” “Asian,” or “American Indian” categories. Changes were made to the racial categories in the March 1997 and 2003 supplements. These changes may influence the comparability of data on race and ethnicity before and after calendar year 2002. In 2007, approximately 3% of children in the U.S. were reported to be of more than one race and, thus, are excluded from these data presented by race.
Asian: Children whose parent reported their race as Asian, Hawaiian/Pacific Islander and their ethnicity as non-Latino. Beginning in 2002, parents could choose more than one race for their child. Children who were Asian and another race were not counted as Asian.
State specific notes:
** this estimate was not shown due to an extremely small sample size.
1997 1998 1999 2000 2001 2002 2003 2004 2005 2006 2007naTiOnaL 997,369 1,080,863 965,820 935,284 952,261 897,566 824,013 850,317 823,221 814,775 931,297ALABAMA ** ** ** ** ** ** ** ** ** ** **ALASKA ** ** ** 7,265 7,341 5,344 7,260 9,742 8,782 5,559 3,849ARIZONA ** ** ** ** ** ** ** ** ** ** **ARKANSAS ** ** ** ** ** ** ** ** ** ** **CALIFORNIA 432,278 398,868 349,730 341,217 323,168 320,432 290,843 274,402 262,961 245,928 253,103COLORADO ** ** ** ** ** ** ** ** ** ** **CONNECTICUT ** ** ** ** ** ** ** ** ** ** **DELAWARE ** ** ** ** ** ** ** ** ** ** **DISTRICT OF COLUMBIA ** ** ** ** ** ** ** ** ** ** **FLORIDA ** ** ** ** ** ** 31,721 29,147 ** ** **GEORGIA ** ** ** ** ** ** ** ** ** ** **HAWAII 85,691 89,986 80,924 75,795 71,652 64,209 57,702 44,033 35,174 33,798 36,031IDAHO ** ** ** ** ** ** ** ** ** ** **ILLINOIS ** ** ** ** ** ** ** ** ** ** 30,895INDIANA ** ** ** ** ** ** ** ** ** ** **IOWA ** ** ** ** ** ** ** ** ** ** **KANSAS ** ** ** ** ** ** ** ** ** ** **KENTUCKY ** ** ** ** ** ** ** ** ** ** **LOUISIANA ** ** ** ** ** ** ** ** ** ** **MAINE ** ** ** ** ** ** ** ** ** ** **MARYLAND ** ** ** ** ** ** ** ** ** ** **MASSACHUSETTS ** ** ** ** ** ** ** ** ** ** **MICHIGAN ** ** ** ** ** ** ** ** ** ** **MINNESOTA ** ** ** ** ** ** ** 23,472 25,637 28,499 21,213MISSISSIPPI ** ** ** ** ** ** ** ** ** ** **MISSOURI ** ** ** ** ** ** ** ** ** ** **MONTANA ** ** ** ** ** ** ** ** ** ** **NEBRASKA ** ** ** ** ** ** ** ** ** ** **NEVADA ** ** ** ** 12,648 12,889 13,112 8,450 ** ** **NEW HAMPSHIRE ** ** ** ** ** ** ** ** ** ** **NEW JERSEY ** ** ** ** 25,887 24,102 23,980 ** ** ** **NEW MEXICO ** ** ** ** ** ** ** ** ** ** **NEW YORK 74,055 75,856 87,830 99,638 107,206 106,149 107,769 102,018 115,136 119,241 133,477NORTH CAROLINA ** ** ** ** ** ** ** ** ** ** **NORTH DAKOTA ** ** ** ** ** ** ** ** ** ** **OHIO ** ** ** ** ** ** ** ** ** ** **OKLAHOMA ** ** ** ** ** ** ** ** ** ** **OREGON ** ** ** ** ** ** ** ** ** ** **PENNSYLVANIA ** 41,820 41,610 ** ** ** ** ** ** ** **RHODE ISLAND ** ** ** ** ** ** ** ** ** ** **SOUTH CAROLINA ** ** ** ** ** ** ** ** ** ** **SOUTH DAKOTA ** ** ** ** ** ** ** ** ** ** **TENNESSEE ** ** ** ** ** ** ** ** ** ** **TEXAS 57,524 75,277 101,657 98,350 81,504 63,728 56,697 46,130 ** 35,671 41,113UTAH ** ** ** ** 12,339 13,587 ** ** ** ** 17,229VERMONT ** ** ** ** ** ** ** ** ** ** **VIRGINIA ** ** ** ** ** ** ** ** ** ** **WASHINGTON ** ** ** ** ** 24,597 23,024 22,877 ** 36,110 35,432WEST VIRGINIA ** ** ** ** ** ** ** ** ** ** **WISCONSIN ** ** ** ** ** ** 28,359 31,158 24,821 20,323 22,915WYOMING ** ** ** ** ** ** ** ** ** ** **

34
Table 29: Percent of american indian children living in low-income families, 1997-2007
1997 1998 1999 2000 2001 2002 2003 2004 2005 2006 2007naTiOnaL 61 61 71 54 62 62 63 62 63 63 57ALABAMA ** ** ** ** ** ** ** ** ** ** **ALASKA 36 38 42 40 43 45 49 53 59 61 58ARIZONA ** ** ** ** ** ** ** ** 70 72 72ARKANSAS ** ** ** ** ** ** ** ** ** ** **CALIFORNIA ** ** ** ** 54 56 64 ** ** ** **COLORADO ** ** ** ** ** ** ** ** ** ** **CONNECTICUT ** ** ** ** ** ** ** ** ** ** **DELAWARE ** ** ** ** ** ** ** ** ** ** **DISTRICT OF COLUMBIA ** ** ** ** ** ** ** ** ** ** **FLORIDA ** ** ** ** ** ** ** ** ** ** **GEORGIA ** ** ** ** ** ** ** ** ** ** **HAWAII ** ** ** ** ** ** ** ** ** ** **IDAHO ** ** ** ** ** ** ** ** ** ** **ILLINOIS ** ** ** ** ** ** ** ** ** ** **INDIANA ** ** ** ** ** ** ** ** ** ** **IOWA ** ** ** ** ** ** ** ** ** ** **KANSAS ** ** ** ** ** ** ** ** ** ** **KENTUCKY ** ** ** ** ** ** ** ** ** ** **LOUISIANA ** ** ** ** ** ** ** ** ** ** **MAINE ** ** ** ** ** ** ** ** ** ** **MARYLAND ** ** ** ** ** ** ** ** ** ** **MASSACHUSETTS ** ** ** ** ** ** ** ** ** ** **MICHIGAN ** ** ** ** ** ** ** ** ** ** **MINNESOTA ** ** ** ** 75 ** ** ** ** ** **MISSISSIPPI ** ** ** ** ** ** ** ** ** ** **MISSOURI ** ** ** ** ** ** ** ** ** ** **MONTANA 83 82 78 78 77 73 70 79 84 90 84NEBRASKA ** ** ** ** ** ** ** ** ** ** **NEVADA ** ** ** ** ** ** ** ** ** ** **NEW HAMPSHIRE ** ** ** ** ** ** ** ** ** ** **NEW JERSEY ** ** ** ** ** ** ** ** ** ** **NEW MEXICO 72 73 76 76 76 70 79 78 79 77 77NEW YORK ** ** ** ** ** ** ** ** ** ** **NORTH CAROLINA ** ** ** 71 72 68 67 63 59 54 **NORTH DAKOTA 86 90 86 85 84 85 88 82 73 69 65OHIO ** ** ** ** ** ** ** ** ** ** **OKLAHOMA 70 69 66 66 67 68 67 66 57 56 51OREGON ** ** ** ** ** ** ** ** ** ** **PENNSYLVANIA ** ** ** ** ** ** ** ** ** ** **RHODE ISLAND ** ** ** ** ** ** ** ** ** ** **SOUTH CAROLINA ** ** ** ** ** ** ** ** ** ** **SOUTH DAKOTA 87 78 68 63 62 72 75 77 79 80 82TENNESSEE ** ** ** ** ** ** ** ** ** ** **TEXAS ** ** ** ** ** ** ** ** ** ** **UTAH ** ** ** ** ** ** ** ** ** ** **VERMONT ** ** ** ** ** ** ** ** ** ** **VIRGINIA ** ** ** ** ** ** ** ** ** ** **WASHINGTON ** ** ** ** 79 66 63 ** ** ** **WEST VIRGINIA ** ** ** ** ** ** ** ** ** ** **WISCONSIN ** ** ** ** 91 ** ** ** ** 77 **WYOMING ** ** ** ** ** ** ** ** ** ** **
definitions:
Race/ethnicity: In the most recent CPS, parents could report children’s race as one or more of the following: “White,” “Black,” “American Indian or Alaskan Native,” or “Asian and/or Hawaiian/Pacific Islander.” In a separate question, parents could report whether their children were of Latino ethnicity. For the data reported, children who were reported to be of Latino ethnicity were categorized as Latino, regardless of their reported race. Children who were reported to be of more than one race were not included in the “White,” “Black,” “Asian,” or “American Indian” categories. Changes were made to the racial categories in the March 1997 and 2003 supplements. These changes may influence the comparability of data on race and ethnicity before and after calendar year 2002. In 2007, approximately 3% of children in the U.S. were reported to be of more than one race and, thus, are excluded from these data presented by race.
American Indian: Children whose parent reported their race as American Indian or Alaskan Native and their ethnicity as non-Latino. Beginning in 2002, parents could choose more than one race for their child. Children who were American Indian or Alaskan Native and another race were not counted as American Indian.
Numerator: Number of low-income American Indian children
Denominator: Number of American Indian children
State specific notes:
** this estimate was not shown due to an extremely small sample size.

National Center for Children in Poverty Low-Income Children in the United States 35
Table 30: number of american indian children living in low-income families, 1997-2007
definitions:
Race/ethnicity: In the most recent CPS, parents could report children’s race as one or more of the following: “White,” “Black,” “American Indian or Alaskan Native,” or “Asian and/or Hawaiian/Pacific Islander.” In a separate question, parents could report whether their children were of Latino ethnicity. For the data reported, children who were reported to be of Latino ethnicity were categorized as Latino, regardless of their reported race. Children who were reported to be of more than one race were not included in the “White,” “Black,” “Asian,” or “American Indian” categories. Changes were made to the racial categories in the March 1997 and 2003 supplements. These changes may influence the comparability of data on race and ethnicity before and after calendar year 2002. In 2007, approximately 3% of children in the U.S. were reported to be of more than one race and, thus, are excluded from these data presented by race.
American Indian: Children whose parent reported their race as American Indian or Alaskan Native and their ethnicity as non-Latino. Beginning in 2002, parents could choose more than one race for their child. Children who were American Indian or Alaskan Native and another race were not counted as American Indian.
State specific notes:
** this estimate was not shown due to an extremely small sample size.
1997 1998 1999 2000 2001 2002 2003 2004 2005 2006 2007naTiOnaL 389,230 490,045 673,129 454,492 595,451 314,188 313,520 287,264 305,659 319,220 292,447ALABAMA ** ** ** ** ** ** ** ** ** ** **ALASKA 13,153 13,285 13,949 15,223 17,236 18,077 16,922 14,257 11,964 10,603 8,036ARIZONA ** ** ** ** ** ** ** ** 31,766 41,616 43,536ARKANSAS ** ** ** ** ** ** ** ** ** ** **CALIFORNIA ** ** ** ** 66,812 57,169 53,573 ** ** ** **COLORADO ** ** ** ** ** ** ** ** ** ** **CONNECTICUT ** ** ** ** ** ** ** ** ** ** **DELAWARE ** ** ** ** ** ** ** ** ** ** **DISTRICT OF COLUMBIA ** ** ** ** ** ** ** ** ** ** **FLORIDA ** ** ** ** ** ** ** ** ** ** **GEORGIA ** ** ** ** ** ** ** ** ** ** **HAWAII ** ** ** ** ** ** ** ** ** ** **IDAHO ** ** ** ** ** ** ** ** ** ** **ILLINOIS ** ** ** ** ** ** ** ** ** ** **INDIANA ** ** ** ** ** ** ** ** ** ** **IOWA ** ** ** ** ** ** ** ** ** ** **KANSAS ** ** ** ** ** ** ** ** ** ** **KENTUCKY ** ** ** ** ** ** ** ** ** ** **LOUISIANA ** ** ** ** ** ** ** ** ** ** **MAINE ** ** ** ** ** ** ** ** ** ** **MARYLAND ** ** ** ** ** ** ** ** ** ** **MASSACHUSETTS ** ** ** ** ** ** ** ** ** ** **MICHIGAN ** ** ** ** ** ** ** ** ** ** **MINNESOTA ** ** ** ** 26,247 ** ** ** ** ** **MISSISSIPPI ** ** ** ** ** ** ** ** ** ** **MISSOURI ** ** ** ** ** ** ** ** ** ** **MONTANA 28,219 27,750 23,890 23,014 16,425 12,083 10,016 10,380 10,094 12,207 12,079NEBRASKA ** ** ** ** ** ** ** ** ** ** **NEVADA ** ** ** ** ** ** ** ** ** ** **NEW HAMPSHIRE ** ** ** ** ** ** ** ** ** ** **NEW JERSEY ** ** ** ** ** ** ** ** ** ** **NEW MEXICO 58,488 67,639 80,552 73,934 62,457 40,358 42,918 42,123 44,139 41,086 44,673NEW YORK ** ** ** ** ** ** ** ** ** ** **NORTH CAROLINA ** ** ** 40,972 54,697 49,623 39,562 28,852 27,019 27,713 **NORTH DAKOTA 11,936 17,247 18,570 17,139 14,901 12,854 11,168 9,515 8,902 10,145 10,667OHIO ** ** ** ** ** ** ** ** ** ** **OKLAHOMA 61,246 72,706 66,155 68,296 63,766 52,929 45,137 37,703 30,513 34,164 29,758OREGON ** ** ** ** ** ** ** ** ** ** **PENNSYLVANIA ** ** ** ** ** ** ** ** ** ** **RHODE ISLAND ** ** ** ** ** ** ** ** ** ** **SOUTH CAROLINA ** ** ** ** ** ** ** ** ** ** **SOUTH DAKOTA 13,418 11,384 10,506 9,902 10,307 11,813 14,087 16,607 17,157 13,524 11,241TENNESSEE ** ** ** ** ** ** ** ** ** ** **TEXAS ** ** ** ** ** ** ** ** ** ** **UTAH ** ** ** ** ** ** ** ** ** ** **VERMONT ** ** ** ** ** ** ** ** ** ** **VIRGINIA ** ** ** ** ** ** ** ** ** ** **WASHINGTON ** ** ** ** 37,387 31,371 29,454 ** ** ** **WEST VIRGINIA ** ** ** ** ** ** ** ** ** ** **WISCONSIN ** ** ** ** 32,425 ** ** ** ** 16,035 **WYOMING ** ** ** ** ** ** ** ** ** ** **

36
chiLD’s agE
Table 31: Percent of children under age 6 living in low-income families, 1997-2007
1997 1998 1999 2000 2001 2002 2003 2004 2005 2006 2007naTiOnaL 45 43 41 41 42 41 42 43 42 43 43ALABAMA 55 51 49 50 52 50 47 45 47 47 45ALASKA 31 30 33 34 34 34 36 38 39 37 37ARIZONA 57 57 53 52 51 48 48 49 55 57 56ARKANSAS 63 63 59 58 59 61 56 54 49 53 55CALIFORNIA 51 51 50 48 45 43 42 43 44 45 45COLORADO 35 34 34 34 34 32 33 34 35 37 37CONNECTICUT 30 27 25 29 29 30 28 29 28 28 29DELAWARE 40 44 43 41 36 35 33 33 35 37 38DISTRICT OF COLUMBIA 63 63 56 50 46 49 48 46 48 48 46FLORIDA 52 49 47 44 44 43 43 43 43 43 43GEORGIA 48 49 49 45 44 42 41 42 43 45 47HAWAII 43 45 46 45 43 38 38 35 33 31 30IDAHO 57 55 56 51 51 49 51 50 48 47 47ILLINOIS 43 40 38 37 37 38 39 39 39 38 38INDIANA 31 30 31 35 39 41 40 41 44 45 44IOWA 43 44 41 38 36 37 38 40 38 41 38KANSAS 45 41 39 40 40 39 38 39 39 44 48KENTUCKY 47 46 46 45 45 47 48 49 49 50 46LOUISIANA 60 56 51 53 54 56 56 56 53 50 48MAINE 43 41 40 39 39 42 41 40 38 37 38MARYLAND 36 32 26 23 24 24 25 29 32 32 29MASSACHUSETTS 35 34 32 34 33 32 29 28 27 26 29MICHIGAN 40 38 36 35 36 37 39 40 40 41 41MINNESOTA 36 34 29 25 22 23 25 25 26 28 31MISSISSIPPI 63 58 54 51 51 52 53 54 55 56 56MISSOURI 43 41 37 33 34 35 38 41 43 43 44MONTANA 58 56 55 56 56 54 54 55 55 52 49NEBRASKA 42 44 42 40 35 35 35 39 40 40 40NEVADA 40 38 40 39 39 40 42 43 40 39 41NEW HAMPSHIRE 31 39 36 32 26 24 25 22 21 21 22NEW JERSEY 27 29 27 28 26 27 29 28 29 26 26NEW MEXICO 62 60 60 58 58 54 58 56 58 52 51NEW YORK 49 47 45 42 40 40 41 41 41 41 41NORTH CAROLINA 45 42 41 42 45 48 50 47 46 45 45NORTH DAKOTA 40 47 52 52 49 47 46 41 40 42 44OHIO 41 42 43 42 42 37 37 39 42 45 46OKLAHOMA 56 52 50 52 55 55 53 48 49 51 56OREGON 52 54 50 46 42 43 45 45 47 45 44PENNSYLVANIA 39 40 40 37 35 35 35 36 37 39 39RHODE ISLAND 41 41 38 34 31 32 34 37 36 34 36SOUTH CAROLINA 51 46 46 45 43 42 45 47 46 45 45SOUTH DAKOTA 49 45 41 38 35 36 37 40 40 42 42TENNESSEE 56 57 52 44 43 47 49 48 43 42 45TEXAS 53 53 52 51 50 52 53 54 53 51 52UTAH 40 40 40 42 40 39 39 40 40 41 39VERMONT 41 36 37 41 42 38 38 37 36 32 33VIRGINIA 41 36 31 30 29 32 33 34 35 36 39WASHINGTON 41 38 33 34 37 41 42 42 42 38 36WEST VIRGINIA 60 61 60 60 58 57 57 52 50 49 49WISCONSIN 35 36 34 35 33 33 34 35 36 36 36WYOMING 59 59 55 51 47 44 44 43 43 41 42
Numerator: Number of low-income children under age 6
Denominator: Number of children under age 6

National Center for Children in Poverty Low-Income Children in the United States 37
Table 32: number of children under age 6 living in low-income families, 1997-2007
1997 1998 1999 2000 2001 2002 2003 2004 2005 2006 2007naTiOnaL 10,613,815 10,095,667 9,661,937 9,441,211 9,673,142 9,711,750 9,973,408 10,195,799 10,211,991 10,482,704 10,627,694ALABAMA 198,755 164,468 158,424 167,213 186,824 180,014 170,973 163,540 174,147 177,555 172,127ALASKA 21,199 21,013 21,894 22,205 21,166 20,455 21,401 22,566 24,131 22,793 21,484ARIZONA 273,421 276,049 255,808 251,196 255,448 251,924 257,539 261,683 294,689 314,685 308,956ARKANSAS 153,031 139,531 122,388 120,283 130,235 137,074 129,975 122,598 109,406 112,745 120,750CALIFORNIA 1,717,650 1,640,215 1,601,555 1,493,839 1,409,010 1,327,138 1,289,320 1,316,722 1,342,709 1,395,055 1,374,184COLORADO 107,832 103,500 113,835 119,868 127,114 125,211 129,063 136,569 142,446 152,954 154,266CONNECTICUT 82,526 79,113 74,244 83,323 79,235 77,575 70,384 72,515 69,944 73,503 75,395DELAWARE 21,260 26,543 27,152 26,066 20,786 19,283 19,491 20,302 23,736 25,481 26,853DISTRICT OF COLUMBIA 29,280 25,252 20,864 17,896 17,756 19,667 18,386 17,103 17,296 18,525 18,470FLORIDA 594,154 532,119 495,259 490,387 514,743 515,832 521,853 519,697 536,417 550,370 555,218GEORGIA 311,957 317,588 323,844 311,426 331,187 331,715 333,722 344,072 357,394 379,859 398,885HAWAII 47,438 48,584 49,716 47,392 42,324 37,459 36,988 35,077 31,383 29,805 28,916IDAHO 61,375 65,163 66,257 60,781 59,061 58,673 62,021 60,436 59,208 60,128 65,397ILLINOIS 466,677 445,327 432,209 409,156 391,476 399,207 410,394 418,272 425,188 408,680 422,825INDIANA 141,606 141,491 152,349 162,578 177,123 184,495 193,186 213,780 237,132 235,734 229,469IOWA 110,607 111,302 102,678 93,737 86,760 84,504 82,335 87,121 86,571 95,810 91,438KANSAS 112,684 97,396 87,602 86,692 85,024 82,560 81,050 87,837 90,684 106,062 115,519KENTUCKY 152,811 135,981 129,212 135,835 143,477 151,216 149,007 145,905 150,571 158,330 153,185LOUISIANA 217,975 198,398 187,446 217,746 223,482 233,924 216,031 217,408 206,489 193,471 179,017MAINE 35,584 34,409 35,278 34,325 32,278 33,035 32,636 32,514 31,949 30,473 31,629MARYLAND 171,849 139,009 102,841 86,054 90,396 88,151 103,327 124,819 148,979 144,553 129,927MASSACHUSETTS 170,452 161,213 147,132 158,135 150,549 143,187 132,756 127,054 119,584 120,199 131,317MICHIGAN 347,189 335,259 336,545 310,934 296,386 292,102 315,895 322,662 318,127 314,793 308,038MINNESOTA 154,677 149,684 129,751 99,532 83,135 83,956 93,859 99,183 101,468 108,871 128,510MISSISSIPPI 155,223 145,197 127,312 128,002 133,626 145,713 141,837 137,706 131,973 137,491 147,229MISSOURI 186,893 198,526 188,550 163,730 157,563 156,108 166,870 172,860 178,152 188,314 199,119MONTANA 44,241 44,182 40,736 40,620 38,618 35,966 33,984 34,785 35,002 34,814 33,873NEBRASKA 64,090 69,304 65,731 60,034 50,130 50,270 51,004 55,820 56,776 58,845 58,641NEVADA 56,131 59,694 70,712 71,179 71,981 72,630 76,392 80,228 76,900 79,723 89,488NEW HAMPSHIRE 32,979 39,532 38,801 33,144 25,005 21,514 22,017 21,060 20,699 20,219 19,349NEW JERSEY 184,703 191,883 177,591 180,302 165,846 169,216 184,058 186,287 194,944 175,920 175,028NEW MEXICO 127,177 118,021 100,026 84,430 83,018 86,373 100,355 97,758 94,048 79,991 76,190NEW YORK 777,594 727,033 677,778 623,499 589,940 580,999 571,232 567,291 551,494 553,151 550,611NORTH CAROLINA 262,251 262,808 261,349 267,310 304,593 332,285 365,502 345,618 338,762 325,351 333,660NORTH DAKOTA 20,093 23,227 25,569 24,030 20,815 19,465 19,886 18,971 19,109 20,366 20,761OHIO 396,706 408,066 414,224 397,415 377,651 327,154 318,191 342,755 371,403 414,930 428,692OKLAHOMA 142,640 130,034 119,398 126,813 139,784 152,969 154,733 148,100 149,979 152,790 162,588OREGON 135,974 138,738 133,494 127,265 112,968 116,421 121,438 121,374 128,461 131,567 129,535PENNSYLVANIA 364,464 365,392 366,870 327,445 298,973 295,098 302,207 310,754 335,600 357,592 361,997RHODE ISLAND 30,940 28,297 28,336 26,629 25,692 24,879 26,410 28,322 27,177 24,793 27,286SOUTH CAROLINA 146,547 128,879 126,039 122,357 116,383 121,856 133,774 151,741 159,228 159,841 157,705SOUTH DAKOTA 27,158 25,157 24,028 22,310 19,896 19,912 21,301 24,603 25,171 27,507 28,277TENNESSEE 277,576 272,371 237,520 192,187 189,791 211,399 229,836 220,064 190,108 186,153 206,681TEXAS 1,047,475 1,074,722 1,035,017 1,015,176 1,021,796 1,072,133 1,137,598 1,171,530 1,175,220 1,169,290 1,206,024UTAH 94,703 97,265 97,811 104,125 100,606 102,159 105,527 109,573 112,585 115,720 120,141VERMONT 19,674 15,950 16,025 16,405 16,156 13,722 13,743 13,738 13,695 11,783 12,488VIRGINIA 210,563 198,327 176,565 162,754 158,000 180,383 192,649 208,652 219,411 236,969 251,414WASHINGTON 221,227 196,167 163,419 171,241 184,072 195,375 195,520 194,595 192,564 176,979 172,910WEST VIRGINIA 65,683 64,768 67,030 73,635 75,682 73,166 69,434 60,631 58,713 57,566 59,711WISCONSIN 171,235 158,291 150,713 146,600 140,596 135,608 140,942 149,308 153,876 153,136 152,880WYOMING 23,070 21,425 18,880 17,700 17,939 17,573 18,070 16,758 16,370 15,596 16,743

38
Table 33: Percent of children age 6 and over living in low-income families, 1997-2007
1997 1998 1999 2000 2001 2002 2003 2004 2005 2006 2007naTiOnaL 39 38 37 36 36 37 38 38 37 37 37ALABAMA 44 42 43 42 43 41 42 41 42 39 39ALASKA 27 28 28 29 29 29 30 32 33 32 28ARIZONA 52 52 50 47 44 41 41 40 43 43 43ARKANSAS 53 51 47 44 47 50 50 47 47 48 50CALIFORNIA 47 46 45 44 42 41 41 42 41 41 40COLORADO 29 29 27 28 29 31 32 32 32 31 29CONNECTICUT 34 31 26 26 26 27 24 23 23 24 25DELAWARE 39 35 35 31 28 25 28 32 32 31 31DISTRICT OF COLUMBIA 54 58 56 55 52 55 57 58 57 58 57FLORIDA 44 43 42 42 42 41 41 40 39 37 37GEORGIA 46 45 47 43 41 38 37 39 40 41 38HAWAII 42 40 32 31 31 34 34 31 28 28 28IDAHO 42 41 42 41 40 39 40 41 39 39 37ILLINOIS 36 34 33 31 31 33 35 36 35 34 34INDIANA 33 31 31 32 33 33 32 34 36 36 35IOWA 35 36 33 29 26 28 28 29 29 31 29KANSAS 35 33 32 33 32 31 31 32 35 35 34KENTUCKY 45 42 38 35 36 38 42 42 41 41 42LOUISIANA 49 49 50 52 50 46 46 46 46 45 43MAINE 37 36 35 31 33 34 36 35 35 34 34MARYLAND 28 25 22 22 22 21 22 25 27 26 25MASSACHUSETTS 33 33 35 34 33 30 30 28 28 27 29MICHIGAN 34 34 33 31 30 30 33 35 35 35 35MINNESOTA 32 30 28 23 23 23 24 23 22 24 26MISSISSIPPI 57 53 49 46 48 49 52 49 51 51 52MISSOURI 36 37 36 31 30 29 30 32 34 37 39MONTANA 49 48 44 42 40 40 43 43 43 39 38NEBRASKA 35 34 32 31 30 31 29 31 29 31 28NEVADA 36 35 35 36 38 38 39 39 38 37 36NEW HAMPSHIRE 26 26 25 22 23 22 22 20 20 20 19NEW JERSEY 29 32 31 28 26 25 25 22 22 24 27NEW MEXICO 58 55 55 52 52 49 51 50 50 47 43NEW YORK 44 43 42 40 39 39 41 41 41 41 41NORTH CAROLINA 41 42 42 41 40 39 40 41 41 41 42NORTH DAKOTA 34 38 41 39 37 34 35 34 33 32 32OHIO 35 35 35 34 32 32 32 33 33 33 33OKLAHOMA 45 42 37 40 42 44 43 44 44 44 43OREGON 38 40 38 38 35 35 36 36 38 38 36PENNSYLVANIA 36 35 34 34 33 33 34 34 35 35 35RHODE ISLAND 31 30 31 31 28 29 30 34 35 34 33SOUTH CAROLINA 47 41 40 39 39 39 39 40 41 43 43SOUTH DAKOTA 37 34 32 31 31 32 31 34 34 36 32TENNESSEE 46 43 40 38 39 39 39 38 41 42 43TEXAS 48 48 46 45 44 45 46 47 47 45 45UTAH 38 35 33 31 30 31 33 34 34 35 34VERMONT 38 35 34 33 32 29 29 27 26 25 27VIRGINIA 38 34 30 28 27 28 26 27 26 28 29WASHINGTON 31 31 29 30 31 32 32 33 33 32 31WEST VIRGINIA 49 48 49 48 46 46 46 46 44 44 45WISCONSIN 31 30 28 29 29 28 31 33 34 34 31WYOMING 36 38 39 37 35 34 33 33 30 28 27
Numerator: Number of low-income children age 6 and over
Denominator: Number of children age 6 and over

National Center for Children in Poverty Low-Income Children in the United States 39
Table 34: number of children age 6 and over living in low-income families, 1997-2007
1997 1998 1999 2000 2001 2002 2003 2004 2005 2006 2007naTiOnaL 18,609,142 18,332,422 17,967,621 17,343,032 17,658,492 17,908,604 18,414,163 18,409,247 18,153,810 18,075,217 18,175,361ALABAMA 338,980 301,131 311,998 308,800 334,926 314,263 311,664 303,189 296,547 279,726 280,447ALASKA 40,747 40,823 38,919 38,120 37,262 37,097 39,043 41,406 41,002 39,430 34,177ARIZONA 432,540 452,668 429,180 415,532 405,658 381,446 389,665 392,082 431,518 443,822 470,470ARKANSAS 260,504 257,383 232,443 206,273 219,420 226,488 221,583 209,474 208,893 222,089 232,652CALIFORNIA 2,696,255 2,711,367 2,705,507 2,700,228 2,675,045 2,688,246 2,667,074 2,687,362 2,635,020 2,608,307 2,557,250COLORADO 204,878 205,664 190,433 206,194 219,326 235,305 243,164 240,808 239,327 234,535 226,972CONNECTICUT 201,743 176,871 143,865 145,644 149,382 155,884 144,734 138,379 131,359 132,524 138,304DELAWARE 51,291 48,378 48,354 43,762 38,823 35,212 37,937 41,767 40,216 39,827 39,597DISTRICT OF COLUMBIA 40,633 41,897 40,210 38,755 37,414 38,947 40,449 41,733 41,443 42,465 40,789FLORIDA 945,776 900,981 925,324 985,621 1,062,227 1,058,572 1,089,784 1,063,989 1,046,735 1,013,490 1,009,961GEORGIA 616,859 629,521 661,130 609,862 592,099 552,150 541,898 571,422 596,239 621,927 601,883HAWAII 80,102 77,337 65,918 63,923 64,715 69,222 71,158 64,037 56,835 54,917 56,374IDAHO 97,369 102,397 105,849 102,282 99,617 98,093 99,651 100,801 100,647 101,875 96,153ILLINOIS 792,123 779,051 737,739 680,712 649,204 700,249 737,078 777,263 747,052 727,060 700,265INDIANA 324,651 310,443 320,780 332,332 335,358 345,662 338,350 356,355 375,862 380,608 371,201IOWA 194,693 182,792 159,600 139,189 126,419 136,934 134,833 137,591 130,523 139,007 131,414KANSAS 163,466 157,815 150,778 153,773 144,290 139,186 141,375 149,114 159,127 154,945 155,747KENTUCKY 301,488 285,843 252,185 229,065 230,465 246,323 277,676 284,457 277,542 271,804 280,105LOUISIANA 381,726 375,749 377,659 387,075 384,822 360,482 366,882 355,747 338,748 312,312 293,641MAINE 70,637 70,273 72,465 66,460 66,974 66,326 69,502 68,055 68,701 65,933 66,788MARYLAND 232,095 200,587 178,871 193,134 204,002 213,741 218,257 233,763 251,361 241,638 231,392MASSACHUSETTS 320,332 328,268 343,114 343,279 317,389 286,581 292,193 286,306 285,976 270,859 292,023MICHIGAN 589,592 606,025 611,180 576,276 533,570 508,974 544,787 591,866 607,532 609,461 595,903MINNESOTA 292,843 278,228 258,565 214,591 203,306 191,743 199,609 193,736 188,019 197,944 210,730MISSISSIPPI 307,491 283,391 251,592 234,112 240,480 239,571 256,840 245,991 256,085 257,673 260,937MISSOURI 323,561 327,588 317,281 285,404 277,731 270,416 285,347 307,293 324,341 348,284 366,097MONTANA 78,744 82,880 75,194 70,255 63,191 60,089 64,910 64,269 63,785 55,902 55,157NEBRASKA 109,520 108,128 100,324 96,360 87,733 88,487 86,240 91,310 86,495 90,098 83,222NEVADA 98,872 108,332 122,058 135,055 144,186 146,706 151,412 154,598 157,836 160,714 155,057NEW HAMPSHIRE 49,504 55,181 58,164 50,285 48,384 43,982 45,046 42,320 41,565 41,245 38,167NEW JERSEY 362,447 409,213 403,771 381,716 342,788 340,928 346,669 330,976 324,479 339,491 382,651NEW MEXICO 228,188 214,668 213,255 199,964 186,973 163,582 160,025 159,161 165,114 161,007 149,364NEW YORK 1,383,868 1,388,778 1,367,167 1,295,208 1,232,916 1,205,014 1,270,067 1,300,241 1,302,816 1,272,435 1,258,171NORTH CAROLINA 463,447 496,164 504,547 517,196 518,040 523,103 532,902 547,865 568,613 589,235 603,533NORTH DAKOTA 40,913 46,994 48,744 44,591 36,707 33,370 33,264 33,063 31,234 29,701 30,097OHIO 718,596 705,397 697,326 651,913 610,485 592,058 619,654 637,732 617,344 601,611 600,462OKLAHOMA 290,330 265,662 221,056 231,844 244,597 253,822 244,226 239,915 235,963 246,451 253,951OREGON 208,798 226,602 221,602 222,649 209,508 200,028 203,144 205,836 218,502 214,006 205,896PENNSYLVANIA 725,875 703,477 683,241 666,279 640,131 636,290 651,723 668,571 662,131 654,646 644,099RHODE ISLAND 42,085 43,235 48,112 52,198 46,931 46,608 49,028 57,382 59,835 59,119 53,455SOUTH CAROLINA 334,619 291,528 278,701 264,851 268,779 272,760 276,716 273,350 277,712 285,608 292,486SOUTH DAKOTA 47,531 42,056 38,476 38,970 38,340 42,504 41,029 43,986 42,702 43,189 40,196TENNESSEE 452,893 426,977 390,239 371,197 369,124 360,867 354,008 352,095 386,822 408,209 421,724TEXAS 1,734,380 1,734,436 1,685,895 1,675,011 1,699,296 1,789,839 1,855,224 1,868,503 1,920,573 1,858,356 1,865,505UTAH 167,770 151,246 148,938 140,329 141,588 144,994 154,221 164,781 163,697 173,448 166,827VERMONT 39,975 36,680 35,738 34,029 31,881 28,401 27,392 26,422 24,579 23,941 25,062VIRGINIA 393,600 353,459 332,083 328,484 330,722 342,121 315,940 315,872 309,145 323,205 336,919WASHINGTON 293,089 310,976 282,606 287,231 298,597 325,968 330,695 335,369 343,653 336,318 318,401WEST VIRGINIA 119,864 113,575 115,070 115,112 114,106 117,369 122,573 125,716 120,206 118,047 119,771WISCONSIN 288,228 264,065 261,449 275,561 271,468 252,998 271,155 295,094 301,224 291,746 271,120WYOMING 35,636 37,645 38,368 34,338 29,982 27,707 25,958 25,592 23,067 22,572 22,231

40
PaREnTaL naTiviTy
Table 35: Percent of children with immigrant parents living in low-income families, 1997-2007
1997 1998 1999 2000 2001 2002 2003 2004 2005 2006 2007naTiOnaL 62 63 59 56 58 57 58 58 57 57 58ALABAMA ** ** ** ** ** ** ** ** ** ** **ALASKA ** ** ** 50 55 55 55 63 65 62 51ARIZONA 85 86 84 79 73 69 70 70 75 78 78ARKANSAS ** ** ** 61 75 77 78 73 68 69 68CALIFORNIA 69 68 66 64 62 59 59 59 59 59 59COLORADO 68 72 71 74 69 66 63 63 64 71 71CONNECTICUT ** ** ** 29 31 36 37 36 39 42 43DELAWARE ** ** ** ** ** 39 43 43 46 45 53DISTRICT OF COLUMBIA 51 55 61 63 65 61 62 61 55 51 53FLORIDA 60 59 58 56 57 56 58 56 53 51 52GEORGIA ** ** 63 47 50 51 56 56 60 58 55HAWAII 36 48 37 36 32 39 44 46 41 38 37IDAHO 85 86 92 89 85 79 81 87 87 73 66ILLINOIS 56 53 49 44 42 49 50 51 49 47 46INDIANA ** ** ** ** ** 47 43 48 49 54 62IOWA ** 63 64 68 59 63 60 64 64 64 65KANSAS ** ** 71 78 81 69 64 64 65 65 67KENTUCKY ** ** ** ** ** ** ** ** 59 73 82LOUISIANA ** ** ** ** ** ** ** ** ** ** **MAINE ** ** ** ** ** ** ** ** ** ** **MARYLAND ** ** ** 37 38 38 38 42 42 38 36MASSACHUSETTS 61 61 50 47 42 45 46 45 39 39 41MICHIGAN 46 44 44 46 45 44 46 44 42 49 54MINNESOTA 79 77 72 59 46 41 52 58 61 59 62MISSISSIPPI ** ** ** ** ** ** ** ** ** ** **MISSOURI ** ** ** ** ** ** 51 52 51 ** **MONTANA ** ** ** ** ** ** ** ** ** ** **NEBRASKA ** 56 ** 59 58 57 61 64 63 67 65NEVADA 64 60 61 60 59 57 57 59 58 55 55NEW HAMPSHIRE ** ** ** ** ** ** ** ** ** ** **NEW JERSEY 38 44 46 45 42 38 39 37 40 39 40NEW MEXICO 84 85 87 87 81 76 73 72 70 63 63NEW YORK 65 63 60 55 53 51 52 53 55 54 54NORTH CAROLINA 55 58 61 67 61 58 62 69 67 64 67NORTH DAKOTA ** ** ** ** ** ** ** ** ** ** **OHIO ** ** ** 55 48 40 42 47 51 54 51OKLAHOMA ** ** ** 61 68 71 75 75 69 65 60OREGON 73 70 61 60 69 75 74 69 68 70 69PENNSYLVANIA 51 53 49 45 44 48 52 50 48 52 55RHODE ISLAND 65 57 61 64 61 61 65 66 60 55 56SOUTH CAROLINA ** ** ** ** ** 66 ** ** ** 64 71SOUTH DAKOTA ** ** ** ** ** ** ** ** 58 72 67TENNESSEE ** ** ** ** ** 65 70 66 63 61 62TEXAS 80 80 75 70 68 70 73 74 74 73 71UTAH 71 66 62 53 61 65 68 67 70 70 70VERMONT ** ** ** ** ** ** ** ** ** ** **VIRGINIA ** ** ** 30 33 35 30 31 35 42 45WASHINGTON 62 62 63 58 61 65 62 58 56 59 58WEST VIRGINIA ** ** ** ** ** ** ** ** ** ** **WISCONSIN ** ** ** 53 56 57 67 69 68 67 71WYOMING ** ** ** ** ** ** ** ** 75 66 71
definitions:
Immigrant: Individual born outside the United States, Puerto Rico, or an outlying United States territory.
Immigrant parents: For a child to be considered to have immigrant parents, every parent living in the household with the child must be an immigrant. This includes single-parent families and married-parent families.
Numerator: Number of low-income children with immigrant parents
Denominator: Number of children with immigrant parents
State specific notes:
** this estimate was not shown due to an extremely small sample size.

National Center for Children in Poverty Low-Income Children in the United States 41
Table 36: number of children with immigrant parents living in low-income families, 1997-2007
definitions:
Immigrant: Individual born outside the United States, Puerto Rico, or an outlying United States territory.
Immigrant parents: For a child to be considered to have immigrant parents, every parent living in the household with the child must be an immigrant. This includes single-parent families and married-parent families.
State specific notes:
** this estimate was not shown due to an extremely small sample size.
1997 1998 1999 2000 2001 2002 2003 2004 2005 2006 2007naTiOnaL 5,819,762 5,935,185 5,795,709 6,055,764 6,494,352 6,354,134 6,891,435 7,091,139 6,982,756 7,207,792 7,439,477ALABAMA ** ** ** ** ** ** ** ** ** ** **ALASKA ** ** ** 7,154 8,187 7,361 8,343 10,719 10,193 7,144 4,346ARIZONA 205,649 237,993 219,697 206,567 213,039 225,303 261,005 271,739 302,307 305,445 298,608ARKANSAS ** ** ** 17,828 23,383 21,602 19,026 17,613 23,239 28,356 31,302CALIFORNIA 2,523,144 2,366,320 2,312,981 2,265,579 2,275,187 2,248,105 2,255,101 2,279,398 2,271,017 2,269,418 2,237,962COLORADO 61,292 73,350 69,330 89,670 101,755 101,873 100,385 105,766 115,921 130,433 132,383CONNECTICUT ** ** ** 20,659 25,348 34,194 37,444 37,045 39,867 43,703 43,449DELAWARE ** ** ** ** ** 4,454 5,982 7,973 9,352 10,477 12,876DISTRICT OF COLUMBIA 5,985 6,745 7,721 6,968 6,964 7,006 8,519 8,981 8,312 7,788 9,035FLORIDA 374,891 368,562 393,250 432,098 472,609 449,101 470,573 459,139 459,411 455,747 474,837GEORGIA ** ** 45,254 47,197 65,471 85,810 116,319 141,029 166,808 178,697 181,158HAWAII 17,921 22,606 18,523 18,012 15,842 18,163 22,986 24,136 21,666 18,871 18,789IDAHO 21,860 31,012 39,948 34,306 30,875 25,439 25,482 24,168 22,826 19,449 18,796ILLINOIS 244,084 235,491 216,046 190,560 181,417 224,374 232,869 252,596 243,315 257,118 259,733INDIANA ** ** ** ** ** 27,725 26,515 31,546 28,108 33,753 45,997IOWA ** 20,886 22,264 25,040 23,314 27,704 25,018 27,046 25,793 28,520 32,949KANSAS ** ** 27,763 33,441 35,149 31,439 31,919 33,596 33,192 30,377 33,037KENTUCKY ** ** ** ** ** ** ** ** 17,443 24,215 34,148LOUISIANA ** ** ** ** ** ** ** ** ** ** **MAINE ** ** ** ** ** ** ** ** ** ** **MARYLAND ** ** ** 56,658 70,508 76,346 83,511 91,041 96,598 86,748 86,711MASSACHUSETTS 103,092 98,859 86,199 90,385 82,846 92,281 94,603 99,274 94,977 90,822 91,821MICHIGAN 78,452 66,083 60,277 69,706 76,992 78,522 78,968 71,441 66,738 80,015 101,135MINNESOTA 80,252 93,425 84,509 60,173 33,252 28,220 40,192 60,585 73,239 80,566 82,008MISSISSIPPI ** ** ** ** ** ** ** ** ** ** **MISSOURI ** ** ** ** ** ** 23,199 25,057 19,883 ** **MONTANA ** ** ** ** ** ** ** ** ** ** **NEBRASKA ** 10,855 ** 11,824 11,950 12,729 14,936 20,733 24,203 32,368 31,882NEVADA 52,480 54,229 66,444 74,635 78,211 78,733 83,015 85,223 87,064 88,318 97,056NEW HAMPSHIRE ** ** ** ** ** ** ** ** ** ** **NEW JERSEY 143,978 161,179 161,700 168,557 159,821 154,771 166,775 174,786 203,167 208,025 215,875NEW MEXICO 52,742 44,598 42,184 45,760 42,121 41,159 36,941 36,702 38,234 42,048 45,309NEW YORK 720,143 730,838 691,112 647,560 605,211 577,139 587,397 600,452 640,430 652,678 659,855NORTH CAROLINA 54,016 59,382 61,160 81,548 82,894 80,923 101,949 118,749 139,077 134,512 147,536NORTH DAKOTA ** ** ** ** ** ** ** ** ** ** **OHIO ** ** ** 34,426 35,011 34,001 38,077 43,330 40,673 48,114 51,811OKLAHOMA ** ** ** 19,096 27,023 30,388 38,336 38,483 35,032 28,536 24,203OREGON 63,991 66,441 52,536 53,414 69,826 88,556 90,913 84,840 88,631 90,532 91,955PENNSYLVANIA 57,054 60,547 53,210 47,188 51,582 61,383 69,643 68,042 67,676 71,550 77,189RHODE ISLAND 18,562 17,392 20,979 26,027 25,522 25,351 25,921 25,098 24,666 24,169 26,881SOUTH CAROLINA ** ** ** ** ** 25,144 ** ** ** 21,610 29,319SOUTH DAKOTA ** ** ** ** ** ** ** ** 2,979 4,648 5,207TENNESSEE ** ** ** ** ** 31,612 33,465 37,364 37,571 39,184 39,119TEXAS 713,705 735,952 719,378 759,428 825,876 919,225 976,917 1,008,756 1,026,788 1,008,794 1,002,311UTAH 32,005 25,206 25,025 25,157 39,590 48,257 51,439 45,702 48,849 57,540 62,444VERMONT ** ** ** ** ** ** ** ** ** ** **VIRGINIA ** ** ** 48,212 55,965 60,085 51,935 59,405 76,279 101,907 107,146WASHINGTON 75,469 77,357 79,665 82,020 99,075 108,180 115,062 117,853 123,288 121,787 114,695WEST VIRGINIA ** ** ** ** ** ** ** ** ** ** **WISCONSIN ** ** ** 26,129 35,408 35,821 47,024 52,640 55,671 56,767 66,768WYOMING ** ** ** ** ** ** ** ** 2,457 2,454 2,904
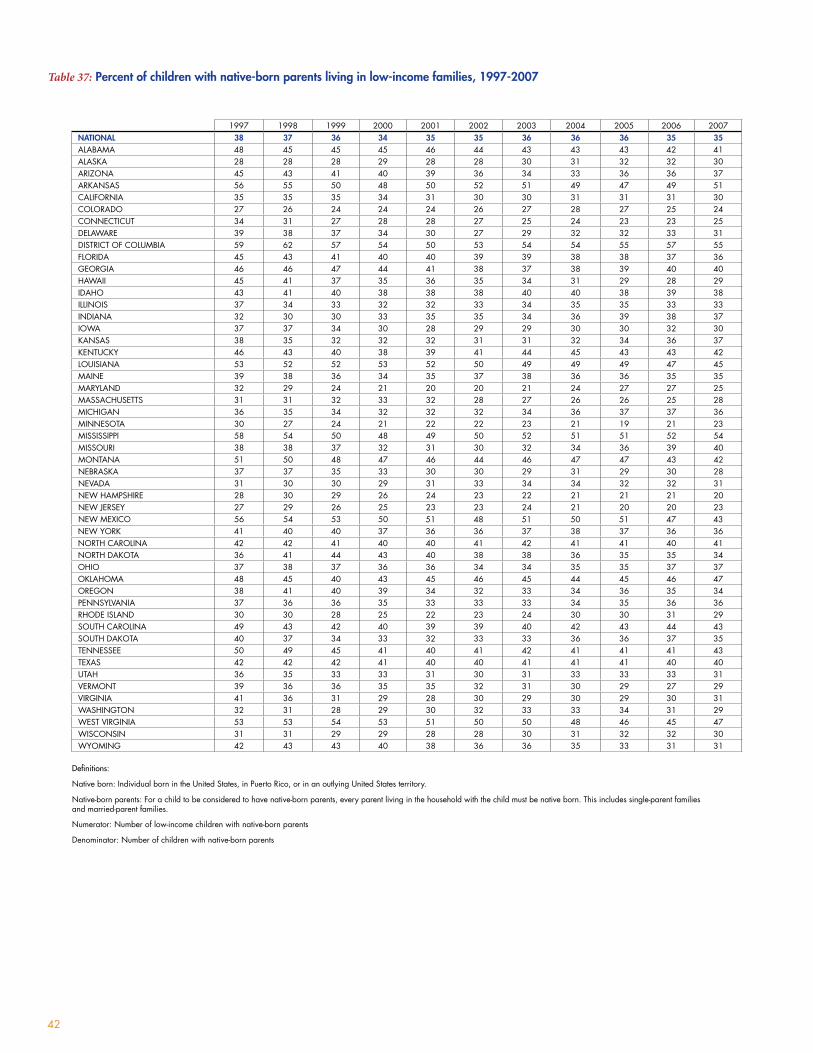
42
Table 37: Percent of children with native-born parents living in low-income families, 1997-2007
1997 1998 1999 2000 2001 2002 2003 2004 2005 2006 2007naTiOnaL 38 37 36 34 35 35 36 36 36 35 35ALABAMA 48 45 45 45 46 44 43 43 43 42 41ALASKA 28 28 28 29 28 28 30 31 32 32 30ARIZONA 45 43 41 40 39 36 34 33 36 36 37ARKANSAS 56 55 50 48 50 52 51 49 47 49 51CALIFORNIA 35 35 35 34 31 30 30 31 31 31 30COLORADO 27 26 24 24 24 26 27 28 27 25 24CONNECTICUT 34 31 27 28 28 27 25 24 23 23 25DELAWARE 39 38 37 34 30 27 29 32 32 33 31DISTRICT OF COLUMBIA 59 62 57 54 50 53 54 54 55 57 55FLORIDA 45 43 41 40 40 39 39 38 38 37 36GEORGIA 46 46 47 44 41 38 37 38 39 40 40HAWAII 45 41 37 35 36 35 34 31 29 28 29IDAHO 43 41 40 38 38 38 40 40 38 39 38ILLINOIS 37 34 33 32 32 33 34 35 35 33 33INDIANA 32 30 30 33 35 35 34 36 39 38 37IOWA 37 37 34 30 28 29 29 30 30 32 30KANSAS 38 35 32 32 32 31 31 32 34 36 37KENTUCKY 46 43 40 38 39 41 44 45 43 43 42LOUISIANA 53 52 52 53 52 50 49 49 49 47 45MAINE 39 38 36 34 35 37 38 36 36 35 35MARYLAND 32 29 24 21 20 20 21 24 27 27 25MASSACHUSETTS 31 31 32 33 32 28 27 26 26 25 28MICHIGAN 36 35 34 32 32 32 34 36 37 37 36MINNESOTA 30 27 24 21 22 22 23 21 19 21 23MISSISSIPPI 58 54 50 48 49 50 52 51 51 52 54MISSOURI 38 38 37 32 31 30 32 34 36 39 40MONTANA 51 50 48 47 46 44 46 47 47 43 42NEBRASKA 37 37 35 33 30 30 29 31 29 30 28NEVADA 31 30 30 29 31 33 34 34 32 32 31NEW HAMPSHIRE 28 30 29 26 24 23 22 21 21 21 20NEW JERSEY 27 29 26 25 23 23 24 21 20 20 23NEW MEXICO 56 54 53 50 51 48 51 50 51 47 43NEW YORK 41 40 40 37 36 36 37 38 37 36 36NORTH CAROLINA 42 42 41 40 40 41 42 41 41 40 41NORTH DAKOTA 36 41 44 43 40 38 38 36 35 35 34OHIO 37 38 37 36 36 34 34 35 35 37 37OKLAHOMA 48 45 40 43 45 46 45 44 45 46 47OREGON 38 41 40 39 34 32 33 34 36 35 34PENNSYLVANIA 37 36 36 35 33 33 33 34 35 36 36RHODE ISLAND 30 30 28 25 22 23 24 30 30 31 29SOUTH CAROLINA 49 43 42 40 39 39 40 42 43 44 43SOUTH DAKOTA 40 37 34 33 32 33 33 36 36 37 35TENNESSEE 50 49 45 41 40 41 42 41 41 41 43TEXAS 42 42 42 41 40 40 41 41 41 40 40UTAH 36 35 33 33 31 30 31 33 33 33 31VERMONT 39 36 36 35 35 32 31 30 29 27 29VIRGINIA 41 36 31 29 28 30 29 30 29 30 31WASHINGTON 32 31 28 29 30 32 33 33 34 31 29WEST VIRGINIA 53 53 54 53 51 50 50 48 46 45 47WISCONSIN 31 31 29 29 28 28 30 31 32 32 30WYOMING 42 43 43 40 38 36 36 35 33 31 31
definitions:
Native born: Individual born in the United States, in Puerto Rico, or in an outlying United States territory.
Native-born parents: For a child to be considered to have native-born parents, every parent living in the household with the child must be native born. This includes single-parent families and married-parent families.
Numerator: Number of low-income children with native-born parents
Denominator: Number of children with native-born parents

National Center for Children in Poverty Low-Income Children in the United States 43
Table 38: number of children with native-born parents living in low-income families, 1997-2007
definitions:
Native born: Individual born in the United States, in Puerto Rico, or in an outlying United States territory.
Native-born parents: For a child to be considered to have native-born parents, every parent living in the household with the child must be native born. This includes single-parent families and married-parent families.
1997 1998 1999 2000 2001 2002 2003 2004 2005 2006 2007naTiOnaL 22,332,138 21,568,211 20,887,538 19,742,468 19,805,838 20,161,367 20,435,927 20,560,720 20,358,428 20,186,285 20,214,299ALABAMA 524,035 455,012 463,057 469,216 511,241 478,451 465,630 453,723 449,193 429,393 419,091ALASKA 55,234 55,489 51,666 50,320 46,581 47,321 49,786 50,876 52,318 52,264 48,957ARIZONA 428,412 410,657 390,439 395,135 393,631 359,099 332,356 326,029 366,870 391,572 411,894ARKANSAS 403,625 389,309 339,839 305,978 320,699 333,895 324,825 308,647 292,582 303,627 318,526CALIFORNIA 1,683,611 1,752,159 1,744,602 1,673,950 1,554,748 1,533,528 1,486,837 1,527,934 1,504,676 1,508,364 1,448,961COLORADO 237,760 224,476 222,074 220,251 223,487 237,168 249,339 252,871 244,629 236,900 229,314CONNECTICUT 259,849 238,109 200,420 204,507 198,368 191,172 171,146 166,489 155,358 155,076 164,698DELAWARE 67,426 68,880 69,095 63,220 54,440 48,496 50,006 52,894 53,962 54,031 51,896DISTRICT OF COLUMBIA 63,571 60,298 53,246 49,468 47,993 51,395 50,091 49,374 49,640 52,555 49,834FLORIDA 1,117,718 1,026,587 986,256 1,001,423 1,035,378 1,051,651 1,064,160 1,061,371 1,052,998 1,033,307 1,017,597GEORGIA 882,257 899,326 930,785 858,162 829,130 769,498 730,236 753,513 762,035 796,527 791,308HAWAII 100,642 91,744 85,437 82,389 82,203 81,504 79,616 70,046 62,251 60,386 61,002IDAHO 130,069 128,701 123,447 120,625 120,333 125,493 131,286 132,446 130,756 135,874 136,035ILLINOIS 982,677 961,654 928,726 873,679 835,357 847,643 884,813 898,113 880,483 822,837 807,570INDIANA 451,280 426,749 442,695 466,815 490,535 498,756 497,207 531,021 574,157 572,188 542,176IOWA 290,576 267,391 235,115 200,947 183,845 186,712 187,354 192,729 186,675 200,461 185,777KANSAS 251,244 231,732 205,457 201,114 187,849 185,686 187,034 199,591 211,149 221,591 226,720KENTUCKY 433,756 401,901 360,319 343,994 354,420 381,636 411,046 417,361 407,160 403,509 393,312LOUISIANA 575,272 552,403 547,321 589,231 586,039 568,538 555,830 547,161 525,185 485,789 459,443MAINE 105,589 102,971 104,765 97,776 96,464 96,394 98,154 96,761 97,570 93,846 92,988MARYLAND 356,178 296,631 237,234 218,549 218,253 218,388 229,007 260,642 296,323 292,046 267,292MASSACHUSETTS 379,613 375,599 386,227 393,737 371,303 325,055 318,275 305,842 304,787 291,702 316,764MICHIGAN 846,125 858,323 873,238 803,352 742,826 706,874 763,759 818,131 835,889 821,802 782,502MINNESOTA 360,714 328,548 294,125 248,881 247,704 245,738 252,232 230,118 211,949 220,816 249,312MISSISSIPPI 450,074 418,045 376,344 359,192 370,155 380,218 390,314 368,393 368,036 374,659 390,255MISSOURI 496,089 516,077 495,041 436,960 420,219 398,448 415,008 443,950 477,844 518,437 534,161MONTANA 120,206 124,522 114,696 109,885 100,225 94,048 96,796 97,769 98,333 89,888 87,271NEBRASKA 160,906 164,123 153,503 141,184 120,960 119,877 117,381 121,745 114,344 111,661 105,121NEVADA 98,753 105,487 113,680 115,942 124,093 127,500 132,755 136,508 132,903 135,227 132,366NEW HAMPSHIRE 78,069 88,343 91,155 77,872 68,103 60,582 60,632 58,588 57,235 56,876 52,917NEW JERSEY 380,718 415,479 397,307 371,300 335,934 342,474 352,125 331,780 308,308 295,960 328,809NEW MEXICO 286,572 274,203 258,602 228,449 219,166 199,490 213,503 209,446 212,267 193,872 176,115NEW YORK 1,388,399 1,342,909 1,302,726 1,215,691 1,160,893 1,143,694 1,168,740 1,179,169 1,141,643 1,102,925 1,074,366NORTH CAROLINA 663,235 690,638 692,657 692,009 724,132 755,138 773,888 753,548 752,343 767,990 781,422NORTH DAKOTA 60,834 70,221 73,144 67,137 55,447 50,999 50,403 49,376 48,096 47,258 46,049OHIO 1,079,443 1,077,737 1,064,438 1,003,176 943,416 875,098 891,205 928,290 934,255 946,157 954,043OKLAHOMA 412,076 373,701 311,345 326,969 344,633 365,534 353,347 342,702 346,887 366,277 388,435OREGON 265,506 289,239 294,564 287,156 241,479 216,913 221,898 230,161 243,731 241,148 225,408PENNSYLVANIA 1,019,772 993,130 981,193 927,713 867,090 847,667 861,863 890,935 913,632 924,554 910,975RHODE ISLAND 51,006 50,983 51,336 48,763 42,750 42,353 45,775 56,463 58,603 56,935 51,665SOUTH CAROLINA 476,041 410,408 393,606 365,262 359,270 365,466 386,986 403,575 412,784 420,774 418,047SOUTH DAKOTA 72,925 65,124 59,960 58,574 55,254 59,663 59,894 66,013 64,195 65,634 62,740TENNESSEE 725,499 693,349 625,542 551,415 536,268 536,052 544,214 529,751 532,932 547,802 578,253TEXAS 1,799,128 1,825,387 1,782,480 1,732,903 1,681,042 1,686,904 1,743,982 1,758,193 1,816,383 1,802,205 1,843,162UTAH 214,907 207,090 207,144 209,507 193,816 189,206 199,502 219,514 218,632 218,804 210,070VERMONT 57,322 51,424 50,686 48,545 45,289 39,531 38,777 38,459 36,971 34,155 35,700VIRGINIA 563,264 506,547 455,625 434,395 427,039 457,231 451,524 460,710 445,772 446,228 461,806WASHINGTON 426,315 414,204 359,551 366,743 374,396 401,698 403,246 402,653 404,039 377,574 364,295WEST VIRGINIA 182,792 175,588 180,667 187,916 188,414 189,058 190,858 184,474 176,763 173,959 179,096WISCONSIN 420,584 394,118 377,570 385,761 367,532 346,017 358,163 380,173 389,706 379,805 351,888WYOMING 56,348 57,485 55,818 49,598 45,439 42,276 41,575 39,980 36,460 35,249 35,599
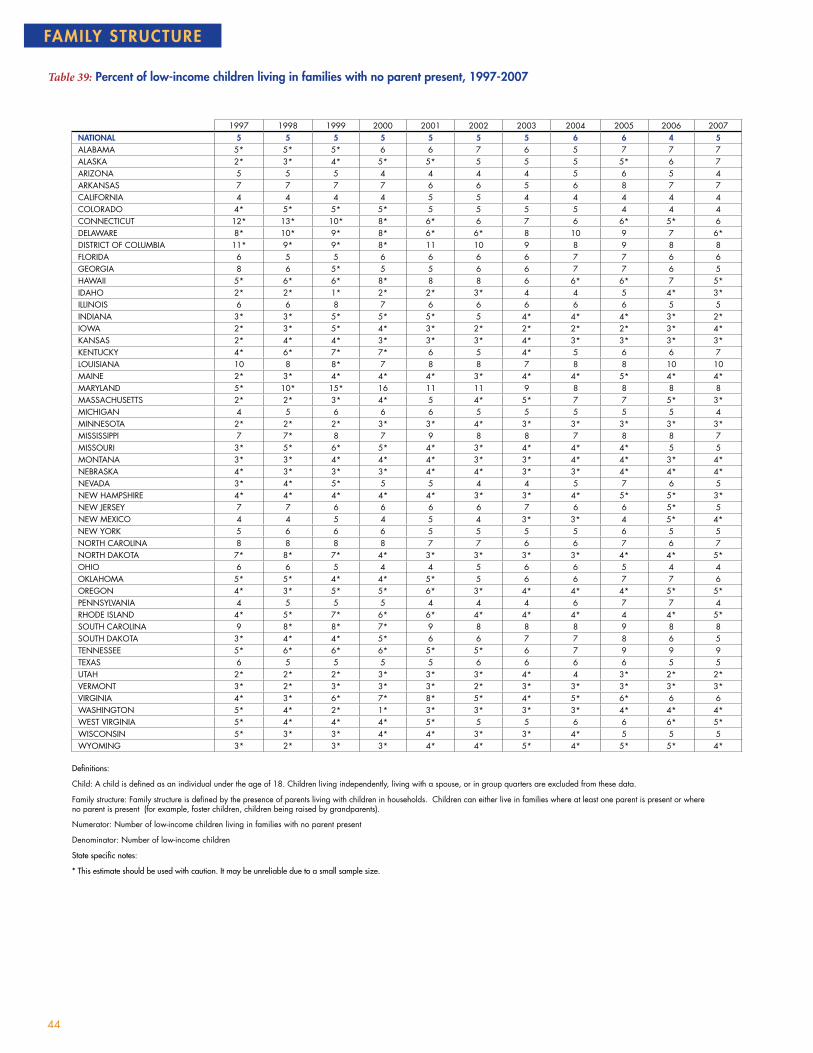
44
famiLy sTRucTuRE
Table 39: Percent of low-income children living in families with no parent present, 1997-2007
1997 1998 1999 2000 2001 2002 2003 2004 2005 2006 2007naTiOnaL 5 5 5 5 5 5 5 6 6 4 5ALABAMA 5* 5* 5* 6 6 7 6 5 7 7 7ALASKA 2* 3* 4* 5* 5* 5 5 5 5* 6 7ARIZONA 5 5 5 4 4 4 4 5 6 5 4ARKANSAS 7 7 7 7 6 6 5 6 8 7 7CALIFORNIA 4 4 4 4 5 5 4 4 4 4 4COLORADO 4* 5* 5* 5* 5 5 5 5 4 4 4CONNECTICUT 12* 13* 10* 8* 6* 6 7 6 6* 5* 6DELAWARE 8* 10* 9* 8* 6* 6* 8 10 9 7 6*DISTRICT OF COLUMBIA 11* 9* 9* 8* 11 10 9 8 9 8 8FLORIDA 6 5 5 6 6 6 6 7 7 6 6GEORGIA 8 6 5* 5 5 6 6 7 7 6 5HAWAII 5* 6* 6* 8* 8 8 6 6* 6* 7 5*IDAHO 2* 2* 1* 2* 2* 3* 4 4 5 4* 3*ILLINOIS 6 6 8 7 6 6 6 6 6 5 5INDIANA 3* 3* 5* 5* 5* 5 4* 4* 4* 3* 2*IOWA 2* 3* 5* 4* 3* 2* 2* 2* 2* 3* 4*KANSAS 2* 4* 4* 3* 3* 3* 4* 3* 3* 3* 3*KENTUCKY 4* 6* 7* 7* 6 5 4* 5 6 6 7LOUISIANA 10 8 8* 7 8 8 7 8 8 10 10MAINE 2* 3* 4* 4* 4* 3* 4* 4* 5* 4* 4*MARYLAND 5* 10* 15* 16 11 11 9 8 8 8 8MASSACHUSETTS 2* 2* 3* 4* 5 4* 5* 7 7 5* 3*MICHIGAN 4 5 6 6 6 5 5 5 5 5 4MINNESOTA 2* 2* 2* 3* 3* 4* 3* 3* 3* 3* 3*MISSISSIPPI 7 7* 8 7 9 8 8 7 8 8 7MISSOURI 3* 5* 6* 5* 4* 3* 4* 4* 4* 5 5MONTANA 3* 3* 4* 4* 4* 3* 3* 4* 4* 3* 4*NEBRASKA 4* 3* 3* 3* 4* 4* 3* 3* 4* 4* 4*NEVADA 3* 4* 5* 5 5 4 4 5 7 6 5NEW HAMPSHIRE 4* 4* 4* 4* 4* 3* 3* 4* 5* 5* 3*NEW JERSEY 7 7 6 6 6 6 7 6 6 5* 5NEW MEXICO 4 4 5 4 5 4 3* 3* 4 5* 4*NEW YORK 5 6 6 6 5 5 5 5 6 5 5NORTH CAROLINA 8 8 8 8 7 7 6 6 7 6 7NORTH DAKOTA 7* 8* 7* 4* 3* 3* 3* 3* 4* 4* 5*OHIO 6 6 5 4 4 5 6 6 5 4 4OKLAHOMA 5* 5* 4* 4* 5* 5 6 6 7 7 6OREGON 4* 3* 5* 5* 6* 3* 4* 4* 4* 5* 5*PENNSYLVANIA 4 5 5 5 4 4 4 6 7 7 4RHODE ISLAND 4* 5* 7* 6* 6* 4* 4* 4* 4 4* 5*SOUTH CAROLINA 9 8* 8* 7* 9 8 8 8 9 8 8SOUTH DAKOTA 3* 4* 4* 5* 6 6 7 7 8 6 5TENNESSEE 5* 6* 6* 6* 5* 5* 6 7 9 9 9TEXAS 6 5 5 5 5 6 6 6 6 5 5UTAH 2* 2* 2* 3* 3* 3* 4* 4 3* 2* 2*VERMONT 3* 2* 3* 3* 3* 2* 3* 3* 3* 3* 3*VIRGINIA 4* 3* 6* 7* 8* 5* 4* 5* 6* 6 6WASHINGTON 5* 4* 2* 1* 3* 3* 3* 3* 4* 4* 4*WEST VIRGINIA 5* 4* 4* 4* 5* 5 5 6 6 6* 5*WISCONSIN 5* 3* 3* 4* 4* 3* 3* 4* 5 5 5WYOMING 3* 2* 3* 3* 4* 4* 5* 4* 5* 5* 4*
definitions:
Child: A child is defined as an individual under the age of 18. Children living independently, living with a spouse, or in group quarters are excluded from these data.
Family structure: Family structure is defined by the presence of parents living with children in households. Children can either live in families where at least one parent is present or where no parent is present (for example, foster children, children being raised by grandparents).
Numerator: Number of low-income children living in families with no parent present
Denominator: Number of low-income children
State specific notes:
* this estimate should be used with caution. It may be unreliable due to a small sample size.

National Center for Children in Poverty Low-Income Children in the United States 45
Table 40: number of low-income children living in families with no parent present, 1997-2007
definitions:
Child: A child is defined as an individual under the age of 18. Children living independently, living with a spouse, or in group quarters are excluded from these data.
Family structure: Family structure is defined by the presence of parents living with children in households. Children can either live in families where at least one parent is present or where no parent is present (for example, foster children, children being raised by grandparents).
State specific notes:
* this estimate should be used with caution. It may be unreliable due to a small sample size.
1997 1998 1999 2000 2001 2002 2003 2004 2005 2006 2007naTiOnaL 1,524,175 1,414,854 1,500,890 1,436,833 1,410,814 1,442,113 1,508,017 1,663,933 1,621,442 1,238,924 1,442,955ALABAMA 24,968* 23,227* 24,269* 30,581 30,743 32,249 27,357 23,681 31,299 31,060 33,330ALASKA 1,071* 1,721* 2,386* 2,741* 2,707* 2,827 3,300 3,196 3,200* 3,678 3,730ARIZONA 36,135 37,406 31,242 26,871 29,171 25,633 28,831 32,090 45,250 41,675 34,287ARKANSAS 26,918 28,090 25,252 22,995 20,527 21,025 17,744 20,639 24,398 25,033 24,528CALIFORNIA 189,792 160,727 154,521 165,994 185,779 197,673 177,002 173,510 177,131 172,157 160,473COLORADO 13,552* 14,411* 14,932* 17,869* 16,604 18,573 17,343 19,205 16,727 17,158 16,878CONNECTICUT 33,450* 33,126* 22,889* 18,900* 14,235* 14,596 15,793 13,274 11,856* 9,308* 12,205DELAWARE 5,875* 7,416* 6,699* 5,367* 3,535* 3,526* 4,666 6,110 5,837 4,711 3,763*DISTRICT OF COLUMBIA 7,473* 5,749* 5,660* 4,636* 6,102 5,700 5,446 4,935 5,221 4,651 4,445FLORIDA 87,005 71,560 70,112 86,250 93,826 94,649 91,569 106,038 107,505 95,983 86,936GEORGIA 75,309 57,409 45,898* 48,992 46,913 53,570 48,911 60,959 65,802 56,906 52,542HAWAII 6,459* 7,147* 6,626* 8,514* 9,040 9,035 6,969 6,172* 5,027* 5,828 4,673*IDAHO 3,032* 3,481* 2,384* 3,018* 3,679* 4,654* 6,480 7,081 7,729 5,840* 4,358*ILLINOIS 72,383 79,268 87,848 71,789 63,450 65,384 68,080 67,265 73,391 61,809 60,512INDIANA 14,761* 14,392* 21,840* 26,370* 27,400* 24,540 21,874* 24,579* 21,789* 15,723* 11,682*IOWA 7,353* 9,577* 11,826* 10,152* 6,481* 4,067* 3,356* 3,912* 4,855* 6,389* 8,404*KANSAS 6,202* 9,917* 10,223* 8,369* 6,511* 7,372* 8,180* 7,481* 7,213* 6,627* 8,977*KENTUCKY 19,558* 23,617* 26,844* 26,120* 23,939 20,431 17,729* 20,868 23,958 24,213 28,809LOUISIANA 58,329 45,107 43,471* 43,853 51,473 46,839 43,029 46,828 46,204 50,584 47,116MAINE 2,489* 3,057* 4,628* 4,534* 3,829* 2,722* 3,674* 3,790* 4,706* 3,441* 3,560*MARYLAND 20,945* 32,960* 42,393* 44,185 32,855 32,379 29,221 30,393 31,782 32,546 28,393MASSACHUSETTS 11,470* 8,996* 16,860* 22,488* 24,104 16,836* 19,295* 27,268 29,044 18,272* 12,480*MICHIGAN 39,161 44,384 52,503 49,745 47,625 43,979 40,876 44,624 50,561 43,162 36,043MINNESOTA 7,517* 8,534* 9,315* 10,729* 9,619* 10,030* 8,606* 8,617* 9,345* 9,767* 9,220*MISSISSIPPI 32,918 29,332* 31,171 26,949 34,328 30,439 31,022 26,633 32,614 30,251 29,256MISSOURI 17,804* 24,101* 29,166* 21,522* 18,091* 12,101* 18,113* 17,970* 21,387* 25,174 30,354MONTANA 3,884* 4,357* 4,549* 4,209* 3,685* 2,550* 3,333* 3,986* 3,511* 3,038* 3,312*NEBRASKA 6,374* 6,104* 4,797* 5,067* 5,367* 5,011* 4,728* 5,133* 5,681* 6,032* 5,171*NEVADA 5,320* 6,648* 9,671* 10,611 10,844 9,262 10,043 12,593 16,511 14,621 11,943NEW HAMPSHIRE 3,227* 3,741* 3,738* 3,328* 2,619* 1,967* 1,992* 2,295* 2,918* 2,894* 1,733*NEW JERSEY 36,847 39,207 33,986 31,926 31,313 32,882 34,710 30,835 29,071 26,131* 25,507NEW MEXICO 14,521 14,682 14,501 12,211 12,445 9,884 8,173* 8,729* 11,031 11,673* 9,557*NEW YORK 106,524 119,283 118,838 108,307 92,655 83,972 90,947 97,832 102,139 87,429 85,336NORTH CAROLINA 60,152 64,377 60,041 60,666 54,307 56,523 58,038 56,254 61,639 52,149 61,685NORTH DAKOTA 4,561* 5,556* 5,167* 3,081* 2,013* 1,332* 1,458* 1,470* 1,922* 1,801* 2,407*OHIO 61,877 65,603 57,325 46,277 36,167 45,565 56,805 56,974 54,217 38,987 41,273OKLAHOMA 20,131* 18,957* 15,124* 14,485* 17,906* 21,542 23,923 23,720 26,922 26,838 26,086OREGON 12,267* 12,630* 18,090* 18,693* 18,852* 11,065* 11,609* 12,700* 15,441* 16,142* 15,663*PENNSYLVANIA 49,026 48,391 48,640 48,582 41,653 36,830 39,835 62,941 71,208 66,789 41,318RHODE ISLAND 2,724* 3,652* 5,030* 4,470* 4,026* 3,016* 3,166* 3,341* 3,768 3,462* 3,657*SOUTH CAROLINA 44,969 31,776* 31,195* 28,399* 34,256 30,153 32,977 35,814 37,827 36,527 34,282SOUTH DAKOTA 2,588* 2,520* 2,714* 2,819* 3,736 3,609 4,533 4,831 5,554 4,296 3,412TENNESSEE 38,709* 42,250* 40,624* 32,398* 29,289* 26,950* 36,082 40,216 53,060 53,971 53,838TEXAS 160,999 153,203 141,176 131,794 145,363 172,703 190,887 188,014 185,657 157,698 154,778UTAH 3,981* 4,197* 5,115* 6,238* 7,258* 7,969* 10,100* 10,736 9,155* 6,260* 5,207*VERMONT 1,609* 1,151* 1,512* 1,459* 1,393* 1,004* 1,332* 1,144* 1,308* 917* 1,260*VIRGINIA 23,222* 18,434* 28,585* 35,987* 38,363* 27,242* 22,871* 23,648* 30,304* 33,588 36,939WASHINGTON 23,383* 19,362* 8,330* 5,925* 14,469* 16,680* 15,926* 15,497* 19,310* 19,878* 21,312*WEST VIRGINIA 8,991* 6,839* 6,400* 7,004* 9,497* 9,830 10,301 11,725 11,313 9,839* 8,718*WISCONSIN 23,111* 12,113* 12,269* 15,904* 17,566* 9,909* 13,422* 18,725* 24,306 23,381 21,375WYOMING 1,491* 1,309* 1,603* 1,489* 1,906* 1,642* 1,989* 1,752* 1,886* 1,812* 1,717*

46
Table 41: Percent of low-income children living in owner-occupied housing, 1997-2007
1997 1998 1999 2000 2001 2002 2003 2004 2005 2006 2007naTiOnaL 42 41 42 43 43 44 43 45 43 43 43ALABAMA 53 54 51 52 48 52 54 53 50 47 46ALASKA 53 49 43 43 48 51 49 46 46 46 47ARIZONA 45 46 47 48 46 43 43 47 46 49 46ARKANSAS 48 49 49 46 45 42 45 47 52 52 51CALIFORNIA 26 26 26 28 32 34 34 33 33 35 34COLORADO 43 45 43 42 40 42 44 46 43 43 44CONNECTICUT 28 25 21 21 26 32 34 35 33 35 34DELAWARE 41 41 46 50 49 50 46 45 44 48 51DISTRICT OF COLUMBIA 17 15 14 12 16 15 19 20 22 20 16FLORIDA 42 43 45 45 45 43 43 46 48 51 48GEORGIA 48 47 44 47 47 51 52 49 43 38 36HAWAII 21 24 25 24 18 20 25 32 37 35 32IDAHO 54 50 47 45 46 51 53 58 59 58 55ILLINOIS 36 37 41 40 40 40 45 46 47 46 47INDIANA 62 58 61 59 62 59 58 55 49 47 46IOWA 59 55 55 56 57 54 52 51 51 51 53KANSAS 46 44 41 43 46 52 49 47 47 45 44KENTUCKY 48 49 52 48 46 45 46 44 42 42 45LOUISIANA 46 45 47 43 40 36 38 42 43 46 47MAINE 60 56 53 54 59 61 58 57 58 59 57MARYLAND 36 42 42 43 44 49 53 48 47 44 44MASSACHUSETTS 28 31 30 29 27 28 32 33 35 34 37MICHIGAN 46 48 51 54 57 57 54 54 53 55 57MINNESOTA 55 51 52 58 66 64 56 54 53 53 52MISSISSIPPI 59 59 62 57 57 53 58 59 59 57 52MISSOURI 53 48 45 46 47 40 37 42 45 46 44MONTANA 51 52 53 56 54 53 53 58 56 54 46NEBRASKA 51 51 50 48 48 53 49 49 48 50 47NEVADA 34 37 38 40 45 50 48 44 40 40 37NEW HAMPSHIRE 46 43 41 42 44 48 48 48 47 49 49NEW JERSEY 28 30 33 38 36 38 36 36 35 32 32NEW MEXICO 57 60 62 63 59 56 58 56 55 52 55NEW YORK 23 22 23 23 24 26 30 31 30 28 29NORTH CAROLINA 45 50 48 46 44 43 41 40 40 41 41NORTH DAKOTA 52 52 53 54 51 52 52 56 55 52 50OHIO 43 44 42 39 39 42 45 49 47 45 42OKLAHOMA 41 43 45 48 49 49 50 51 52 49 47OREGON 42 38 39 39 41 44 44 43 41 40 38PENNSYLVANIA 53 56 56 55 52 50 50 51 48 47 49RHODE ISLAND 24 23 26 27 28 28 30 32 34 34 33SOUTH CAROLINA 44 53 60 61 54 49 50 53 52 51 53SOUTH DAKOTA 47 47 53 58 64 62 58 50 46 49 51TENNESSEE 43 44 47 48 47 46 47 49 48 46 42TEXAS 44 46 46 46 47 48 47 48 48 49 48UTAH 62 61 64 62 62 59 60 61 59 58 54VERMONT 55 54 53 49 49 52 52 55 56 56 53VIRGINIA 43 49 50 50 45 44 41 41 39 43 40WASHINGTON 36 36 37 36 37 37 34 33 35 38 37WEST VIRGINIA 54 52 53 53 55 55 57 61 64 63 57WISCONSIN 44 47 50 50 50 47 43 46 47 48 48WYOMING 49 52 56 53 50 52 53 55 55 54 52
definitions:
Owner-occupied housing: A house that is owned by one of the members of the child’s family.
Numerator: Number of low-income children living in owner-occupied housing
Denominator: Number of low-income children
hOmE OwnERshiP

National Center for Children in Poverty Low-Income Children in the United States 47
Table 42: number of low-income children living in owner-occupied housing, 1997-2007
definitions:
Owner-occupied housing: A house that is owned by one of the members of the child’s family.
1997 1998 1999 2000 2001 2002 2003 2004 2005 2006 2007naTiOnaL 12,276,605 11,759,976 11,657,986 11,393,692 11,805,147 12,068,802 12,322,428 12,851,743 12,071,045 12,410,729 12,253,713ALABAMA 284,117 252,226 239,121 246,466 251,394 257,844 259,066 248,750 237,286 217,025 208,732ALASKA 32,881 30,164 26,083 25,940 27,852 29,464 29,839 29,650 30,045 28,565 25,942ARIZONA 314,371 332,429 319,804 320,299 303,783 273,468 276,294 309,091 337,439 370,434 358,482ARKANSAS 197,227 192,934 172,100 149,363 155,647 153,909 156,938 154,708 166,552 172,878 180,692CALIFORNIA 1,136,656 1,148,917 1,124,804 1,178,111 1,291,389 1,372,620 1,334,575 1,317,925 1,316,579 1,388,889 1,333,258COLORADO 134,858 139,214 130,174 137,095 137,257 152,421 164,584 174,529 165,092 167,021 166,983CONNECTICUT 78,680 64,418 45,083 49,078 60,467 74,181 74,133 74,034 66,357 72,893 73,000DELAWARE 29,411 30,811 34,495 35,073 29,505 26,986 26,644 28,003 28,431 31,646 33,727DISTRICT OF COLUMBIA 11,558 10,100 8,392 6,819 8,747 8,787 10,935 11,968 12,728 12,087 9,228FLORIDA 642,227 611,288 645,062 663,937 710,238 675,585 687,441 730,132 767,725 796,851 744,225GEORGIA 443,060 442,152 437,764 430,308 435,614 452,298 452,277 450,566 409,432 376,859 355,352HAWAII 27,264 30,460 28,415 27,134 19,081 21,711 27,126 31,635 32,411 29,390 27,294IDAHO 85,163 83,881 80,768 74,089 73,256 79,849 85,905 94,192 93,544 93,868 89,132ILLINOIS 458,802 458,067 478,017 435,806 417,618 438,497 511,411 549,052 556,692 526,707 533,097INDIANA 287,743 264,158 286,508 290,709 316,916 313,186 307,093 313,901 300,741 288,638 274,572IOWA 181,114 162,953 144,339 131,181 120,617 120,102 112,102 114,758 110,340 119,224 118,554KANSAS 127,286 112,657 98,299 103,859 105,898 114,931 110,087 112,211 117,387 117,279 118,247KENTUCKY 217,187 206,192 198,339 174,805 172,413 180,116 197,495 187,792 180,769 178,773 193,024LOUISIANA 274,916 257,610 264,493 261,250 243,362 214,089 222,833 239,889 236,742 234,018 224,396MAINE 63,653 58,700 57,602 54,179 58,927 60,946 58,885 56,986 58,502 57,109 55,819MARYLAND 146,088 144,276 116,996 119,893 128,110 146,666 169,351 173,852 188,297 170,550 157,644MASSACHUSETTS 137,339 150,121 144,825 145,466 126,506 118,501 135,648 137,349 143,610 133,870 154,900MICHIGAN 432,751 454,596 487,422 479,680 476,063 454,729 467,203 489,689 486,484 505,145 512,081MINNESOTA 244,170 217,706 202,061 181,292 190,091 175,255 165,495 157,293 153,009 162,262 177,564MISSISSIPPI 272,089 253,524 234,274 206,750 212,877 205,801 231,295 224,815 227,320 223,402 211,157MISSOURI 270,327 252,375 228,480 207,786 202,605 170,556 168,996 201,046 225,410 247,086 251,046MONTANA 63,066 65,496 61,679 62,297 55,221 50,969 52,716 57,465 55,655 48,708 41,277NEBRASKA 88,701 91,218 82,843 75,209 65,737 73,125 67,092 72,742 69,389 74,348 66,077NEVADA 52,609 61,719 72,828 82,650 96,637 109,986 110,055 103,278 93,325 95,034 90,901NEW HAMPSHIRE 38,035 40,316 39,290 34,867 31,987 31,281 31,999 30,679 29,055 30,295 28,087NEW JERSEY 154,386 183,333 191,516 210,806 184,985 191,938 193,272 185,446 182,344 166,926 176,291NEW MEXICO 201,628 200,755 194,406 178,589 158,812 140,932 149,751 144,011 141,423 126,033 123,517NEW YORK 500,566 467,555 480,346 447,501 446,151 471,837 548,131 572,304 553,208 519,726 518,435NORTH CAROLINA 323,929 375,918 371,068 359,644 363,539 367,394 366,743 353,074 362,826 374,676 386,067NORTH DAKOTA 31,944 36,186 39,299 36,971 29,389 27,241 27,508 29,302 27,773 26,051 25,554OHIO 478,913 486,937 466,610 408,981 380,543 388,694 422,676 477,209 468,853 453,424 435,076OKLAHOMA 176,683 170,004 153,830 172,640 188,266 199,968 200,071 199,247 200,069 193,871 195,512OREGON 143,831 140,403 137,728 136,807 132,336 140,437 142,114 140,293 141,208 138,833 125,960PENNSYLVANIA 579,902 602,310 589,324 542,281 490,578 468,385 477,665 495,686 482,527 472,737 491,419RHODE ISLAND 17,788 16,395 20,005 20,968 20,508 19,928 22,360 27,834 29,580 28,254 26,477SOUTH CAROLINA 209,477 223,878 242,962 234,347 208,994 194,121 206,030 225,643 225,175 228,029 236,588SOUTH DAKOTA 35,464 31,808 33,190 35,817 37,088 38,479 35,919 34,187 30,892 34,310 35,121TENNESSEE 311,851 305,827 295,313 269,397 263,260 262,284 271,799 278,916 275,520 271,198 264,332TEXAS 1,231,409 1,298,384 1,251,618 1,233,216 1,282,764 1,386,029 1,421,398 1,451,464 1,473,273 1,476,498 1,473,020UTAH 162,691 151,651 156,767 151,246 149,423 145,815 154,878 166,004 164,250 166,969 156,093VERMONT 32,515 28,178 27,375 24,946 23,343 22,108 21,566 22,253 21,437 19,931 19,832VIRGINIA 259,543 270,082 256,679 243,235 222,172 230,698 208,831 216,103 203,942 238,571 234,174WASHINGTON 184,743 181,776 167,076 165,585 177,088 190,774 177,451 175,064 186,742 195,050 182,344WEST VIRGINIA 100,551 93,078 96,735 100,501 104,822 105,455 109,943 113,632 114,069 109,864 103,146WISCONSIN 203,475 200,271 204,129 211,280 205,140 182,094 178,298 205,324 211,745 212,149 201,537WYOMING 28,769 30,850 31,851 27,733 23,923 23,407 23,540 23,350 21,868 20,550 20,175

48
Table 43: Percent of low-income children living in rented housing, 1997-2007
1997 1998 1999 2000 2001 2002 2003 2004 2005 2006 2007naTiOnaL 58 59 58 57 57 56 57 55 57 57 57ALABAMA 47 46 49 48 52 48 46 47 50 53 54ALASKA 47 51 57 57 52 49 51 54 54 54 53ARIZONA 55 54 53 52 54 57 57 53 54 51 54ARKANSAS 52 51 51 54 55 58 55 53 48 48 49CALIFORNIA 74 74 74 72 68 66 66 67 67 65 66COLORADO 57 55 57 58 60 58 56 54 57 57 56CONNECTICUT 72 75 79 79 74 68 66 65 67 65 66DELAWARE 59 59 54 50 51 50 54 55 56 52 49DISTRICT OF COLUMBIA 83 85 86 88 84 85 81 80 78 80 84FLORIDA 58 57 55 55 55 57 57 54 52 49 52GEORGIA 52 53 56 53 53 49 48 51 57 62 64HAWAII 79 76 75 76 82 80 75 68 63 65 68IDAHO 46 50 53 55 54 49 47 42 41 42 45ILLINOIS 64 63 59 60 60 60 55 54 53 54 53INDIANA 38 42 39 41 38 41 42 45 51 53 54IOWA 41 45 45 44 43 46 48 49 49 49 47KANSAS 54 56 59 57 54 48 51 53 53 55 56KENTUCKY 52 51 48 52 54 55 54 56 58 58 55LOUISIANA 54 55 53 57 60 64 62 58 57 54 53MAINE 40 44 47 46 41 39 42 43 42 41 43MARYLAND 64 58 58 57 56 51 47 52 53 56 56MASSACHUSETTS 72 69 70 71 73 72 68 67 65 66 63MICHIGAN 54 52 49 46 43 43 46 46 47 45 43MINNESOTA 45 49 48 42 34 36 44 46 47 47 48MISSISSIPPI 41 41 38 43 43 47 42 41 41 43 48MISSOURI 47 52 55 54 53 60 63 58 55 54 56MONTANA 49 48 47 44 46 47 47 42 44 46 54NEBRASKA 49 49 50 52 52 47 51 51 52 50 53NEVADA 66 63 62 60 55 50 52 56 60 60 63NEW HAMPSHIRE 54 57 59 58 56 52 52 52 53 51 51NEW JERSEY 72 70 67 62 64 62 64 64 65 68 68NEW MEXICO 43 40 38 37 41 44 42 44 45 48 45NEW YORK 77 78 77 77 76 74 70 69 70 72 71NORTH CAROLINA 55 50 52 54 56 57 59 60 60 59 59NORTH DAKOTA 48 48 47 46 49 48 48 44 45 48 50OHIO 57 56 58 61 61 58 55 51 53 55 58OKLAHOMA 59 57 55 52 51 51 50 49 48 51 53OREGON 58 62 61 61 59 56 56 57 59 60 62PENNSYLVANIA 47 44 44 45 48 50 50 49 52 53 51RHODE ISLAND 76 77 74 73 72 72 70 68 66 66 67SOUTH CAROLINA 56 47 40 39 46 51 50 47 48 49 47SOUTH DAKOTA 53 53 47 42 36 38 42 50 54 51 49TENNESSEE 57 56 53 52 53 54 53 51 52 54 58TEXAS 56 54 54 54 53 52 53 52 52 51 52UTAH 38 39 36 38 38 41 40 39 41 42 46VERMONT 45 46 47 51 51 48 48 45 44 44 47VIRGINIA 57 51 50 50 55 56 59 59 61 57 60WASHINGTON 64 64 63 64 63 63 66 67 65 62 63WEST VIRGINIA 46 48 47 47 45 45 43 39 36 37 43WISCONSIN 56 53 50 50 50 53 57 54 53 52 52WYOMING 51 48 44 47 50 48 47 45 45 46 48
definitions:
Rented housing: A house that is not owned by any member of the child’s family.
Numerator: Number of low-income children living in rented housing
Denominator: Number of low-income children
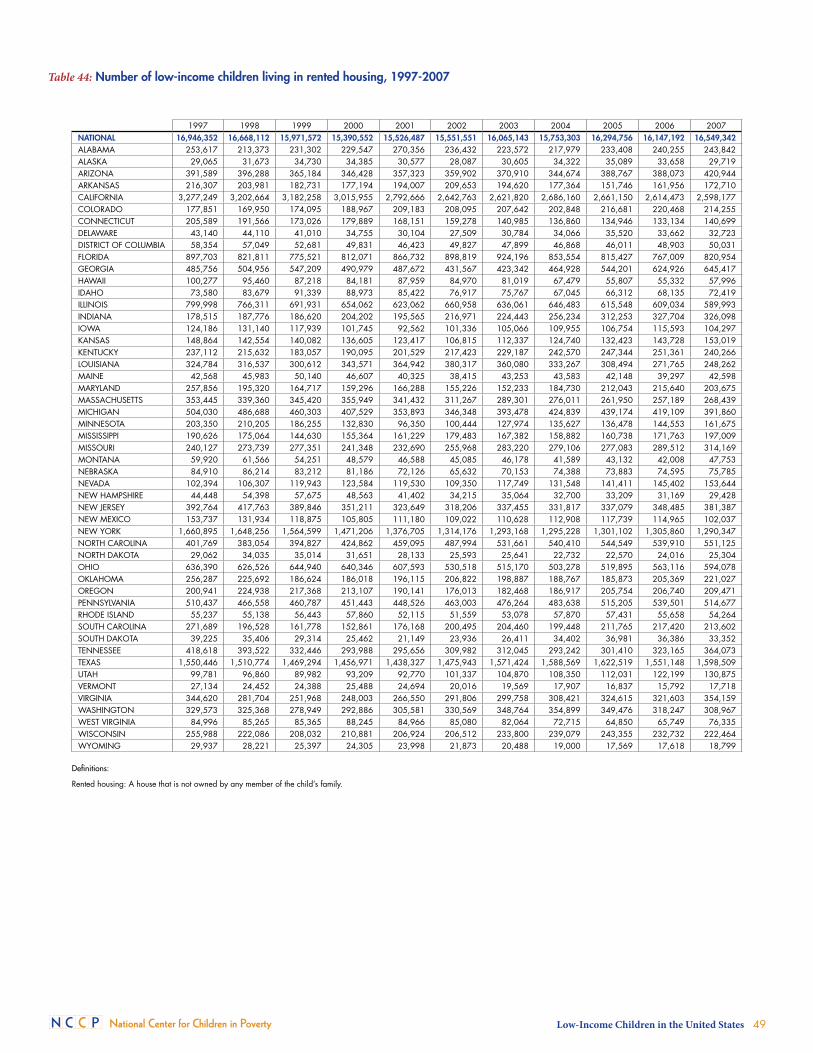
National Center for Children in Poverty Low-Income Children in the United States 49
Table 44: number of low-income children living in rented housing, 1997-2007
definitions:
Rented housing: A house that is not owned by any member of the child’s family.
1997 1998 1999 2000 2001 2002 2003 2004 2005 2006 2007naTiOnaL 16,946,352 16,668,112 15,971,572 15,390,552 15,526,487 15,551,551 16,065,143 15,753,303 16,294,756 16,147,192 16,549,342ALABAMA 253,617 213,373 231,302 229,547 270,356 236,432 223,572 217,979 233,408 240,255 243,842ALASKA 29,065 31,673 34,730 34,385 30,577 28,087 30,605 34,322 35,089 33,658 29,719ARIZONA 391,589 396,288 365,184 346,428 357,323 359,902 370,910 344,674 388,767 388,073 420,944ARKANSAS 216,307 203,981 182,731 177,194 194,007 209,653 194,620 177,364 151,746 161,956 172,710CALIFORNIA 3,277,249 3,202,664 3,182,258 3,015,955 2,792,666 2,642,763 2,621,820 2,686,160 2,661,150 2,614,473 2,598,177COLORADO 177,851 169,950 174,095 188,967 209,183 208,095 207,642 202,848 216,681 220,468 214,255CONNECTICUT 205,589 191,566 173,026 179,889 168,151 159,278 140,985 136,860 134,946 133,134 140,699DELAWARE 43,140 44,110 41,010 34,755 30,104 27,509 30,784 34,066 35,520 33,662 32,723DISTRICT OF COLUMBIA 58,354 57,049 52,681 49,831 46,423 49,827 47,899 46,868 46,011 48,903 50,031FLORIDA 897,703 821,811 775,521 812,071 866,732 898,819 924,196 853,554 815,427 767,009 820,954GEORGIA 485,756 504,956 547,209 490,979 487,672 431,567 423,342 464,928 544,201 624,926 645,417HAWAII 100,277 95,460 87,218 84,181 87,959 84,970 81,019 67,479 55,807 55,332 57,996IDAHO 73,580 83,679 91,339 88,973 85,422 76,917 75,767 67,045 66,312 68,135 72,419ILLINOIS 799,998 766,311 691,931 654,062 623,062 660,958 636,061 646,483 615,548 609,034 589,993INDIANA 178,515 187,776 186,620 204,202 195,565 216,971 224,443 256,234 312,253 327,704 326,098IOWA 124,186 131,140 117,939 101,745 92,562 101,336 105,066 109,955 106,754 115,593 104,297KANSAS 148,864 142,554 140,082 136,605 123,417 106,815 112,337 124,740 132,423 143,728 153,019KENTUCKY 237,112 215,632 183,057 190,095 201,529 217,423 229,187 242,570 247,344 251,361 240,266LOUISIANA 324,784 316,537 300,612 343,571 364,942 380,317 360,080 333,267 308,494 271,765 248,262MAINE 42,568 45,983 50,140 46,607 40,325 38,415 43,253 43,583 42,148 39,297 42,598MARYLAND 257,856 195,320 164,717 159,296 166,288 155,226 152,233 184,730 212,043 215,640 203,675MASSACHUSETTS 353,445 339,360 345,420 355,949 341,432 311,267 289,301 276,011 261,950 257,189 268,439MICHIGAN 504,030 486,688 460,303 407,529 353,893 346,348 393,478 424,839 439,174 419,109 391,860MINNESOTA 203,350 210,205 186,255 132,830 96,350 100,444 127,974 135,627 136,478 144,553 161,675MISSISSIPPI 190,626 175,064 144,630 155,364 161,229 179,483 167,382 158,882 160,738 171,763 197,009MISSOURI 240,127 273,739 277,351 241,348 232,690 255,968 283,220 279,106 277,083 289,512 314,169MONTANA 59,920 61,566 54,251 48,579 46,588 45,085 46,178 41,589 43,132 42,008 47,753NEBRASKA 84,910 86,214 83,212 81,186 72,126 65,632 70,153 74,388 73,883 74,595 75,785NEVADA 102,394 106,307 119,943 123,584 119,530 109,350 117,749 131,548 141,411 145,402 153,644NEW HAMPSHIRE 44,448 54,398 57,675 48,563 41,402 34,215 35,064 32,700 33,209 31,169 29,428NEW JERSEY 392,764 417,763 389,846 351,211 323,649 318,206 337,455 331,817 337,079 348,485 381,387NEW MEXICO 153,737 131,934 118,875 105,805 111,180 109,022 110,628 112,908 117,739 114,965 102,037NEW YORK 1,660,895 1,648,256 1,564,599 1,471,206 1,376,705 1,314,176 1,293,168 1,295,228 1,301,102 1,305,860 1,290,347NORTH CAROLINA 401,769 383,054 394,827 424,862 459,095 487,994 531,661 540,410 544,549 539,910 551,125NORTH DAKOTA 29,062 34,035 35,014 31,651 28,133 25,593 25,641 22,732 22,570 24,016 25,304OHIO 636,390 626,526 644,940 640,346 607,593 530,518 515,170 503,278 519,895 563,116 594,078OKLAHOMA 256,287 225,692 186,624 186,018 196,115 206,822 198,887 188,767 185,873 205,369 221,027OREGON 200,941 224,938 217,368 213,107 190,141 176,013 182,468 186,917 205,754 206,740 209,471PENNSYLVANIA 510,437 466,558 460,787 451,443 448,526 463,003 476,264 483,638 515,205 539,501 514,677RHODE ISLAND 55,237 55,138 56,443 57,860 52,115 51,559 53,078 57,870 57,431 55,658 54,264SOUTH CAROLINA 271,689 196,528 161,778 152,861 176,168 200,495 204,460 199,448 211,765 217,420 213,602SOUTH DAKOTA 39,225 35,406 29,314 25,462 21,149 23,936 26,411 34,402 36,981 36,386 33,352TENNESSEE 418,618 393,522 332,446 293,988 295,656 309,982 312,045 293,242 301,410 323,165 364,073TEXAS 1,550,446 1,510,774 1,469,294 1,456,971 1,438,327 1,475,943 1,571,424 1,588,569 1,622,519 1,551,148 1,598,509UTAH 99,781 96,860 89,982 93,209 92,770 101,337 104,870 108,350 112,031 122,199 130,875VERMONT 27,134 24,452 24,388 25,488 24,694 20,016 19,569 17,907 16,837 15,792 17,718VIRGINIA 344,620 281,704 251,968 248,003 266,550 291,806 299,758 308,421 324,615 321,603 354,159WASHINGTON 329,573 325,368 278,949 292,886 305,581 330,569 348,764 354,899 349,476 318,247 308,967WEST VIRGINIA 84,996 85,265 85,365 88,245 84,966 85,080 82,064 72,715 64,850 65,749 76,335WISCONSIN 255,988 222,086 208,032 210,881 206,924 206,512 233,800 239,079 243,355 232,732 222,464WYOMING 29,937 28,221 25,397 24,305 23,998 21,873 20,488 19,000 17,569 17,618 18,799

50
Table 45: Percent of low-income children who have moved in the last year, 1997-2007
1997 1998 1999 2000 2001 2002 2003 2004 2005 2006 2007naTiOnaL 23 23 22 21 21 21 20 20 21 20 18ALABAMA 24 26 26 27 28 24 22 21 24 24 24ALASKA 29 27 28 26 26 28 31 33 33 29 24ARIZONA 24 24 24 24 27 28 28 25 26 24 24ARKANSAS 27 27 26 27 25 25 26 30 26 24 19CALIFORNIA 24 22 23 21 20 18 18 19 18 18 17COLORADO 27 27 26 26 28 26 27 25 28 25 26CONNECTICUT 21 21 20 20 19 16 16 19 21 20 19DELAWARE 21 22 19 17 17 19 20 17 13 12 14DISTRICT OF COLUMBIA 22 22 22 16 15 13 12 10 10 8 9FLORIDA 29 26 24 25 23 22 21 22 21 20 19GEORGIA 23 24 22 21 21 21 20 19 20 23 24HAWAII 27 32 25 24 21 20 18 19 17 19 16IDAHO 23 22 23 23 23 22 22 23 22 25 24ILLINOIS 18 22 21 22 20 21 21 20 18 18 18INDIANA 18 19 20 20 18 20 19 20 19 21 19IOWA 22 21 21 21 20 25 22 24 22 27 24KANSAS 29 29 32 29 25 21 23 24 25 24 22KENTUCKY 30 30 30 26 24 25 27 26 25 24 23LOUISIANA 20 18 17 19 21 21 20 18 20 22 21MAINE 25 23 25 25 25 25 23 20 19 19 21MARYLAND 22 26 27 26 20 16 16 20 21 23 19MASSACHUSETTS 24 23 21 19 18 18 17 20 19 21 15MICHIGAN 20 20 18 21 20 22 22 21 21 21 21MINNESOTA 20 19 19 19 18 17 17 16 19 20 19MISSISSIPPI 16 19 19 21 21 23 21 21 20 19 17MISSOURI 29 34 31 27 21 21 20 20 21 24 26MONTANA 28 29 26 27 25 24 22 22 23 23 23NEBRASKA 21 22 21 21 21 21 24 24 23 20 20NEVADA 38 33 30 28 26 25 25 25 24 26 26NEW HAMPSHIRE 36 36 31 25 20 18 20 20 23 20 18NEW JERSEY 22 23 22 19 19 17 21 19 20 18 17NEW MEXICO 24 24 23 20 19 19 19 17 17 19 20NEW YORK 15 15 16 17 17 16 14 13 14 13 12NORTH CAROLINA 23 22 23 22 20 19 20 19 20 21 21NORTH DAKOTA 20 21 20 18 17 15 17 16 17 20 20OHIO 25 26 25 25 23 24 21 18 19 21 21OKLAHOMA 28 27 28 29 29 28 24 21 22 24 24OREGON 32 36 28 26 22 22 21 20 22 24 23PENNSYLVANIA 15 17 18 19 16 17 17 18 19 18 17RHODE ISLAND 28 35 33 26 22 23 21 22 16 16 13SOUTH CAROLINA 20 18 18 21 22 24 22 20 21 21 18SOUTH DAKOTA 17 20 21 17 16 15 18 21 23 24 20TENNESSEE 26 25 22 20 23 24 24 23 23 24 24TEXAS 27 26 26 24 24 23 22 23 22 21 20UTAH 24 24 23 20 21 23 25 26 26 25 24VERMONT 21 22 23 22 25 19 19 19 19 18 14VIRGINIA 23 20 22 19 20 20 18 20 20 20 17WASHINGTON 32 29 29 30 30 29 29 28 25 26 24WEST VIRGINIA 19 19 18 15 13 14 12 13 14 17 18WISCONSIN 22 23 21 21 22 23 26 24 24 20 20WYOMING 23 24 23 24 26 29 27 26 25 26 25
definitions:
Move: Movement from one house or apartment to another in the last year, regardless of the distance of the move.
Numerator: Number of low-income children who have moved in the last year
Denominator: Number of low-income children
REsiDEnTiaL mOvE

National Center for Children in Poverty Low-Income Children in the United States 51
Table 46: number of low-income children who have moved in the last year, 1997-2007
definitions:
Move: Movement from one house or apartment to another in the last year, regardless of the distance of the move.
1997 1998 1999 2000 2001 2002 2003 2004 2005 2006 2007naTiOnaL 6,635,125 6,511,996 6,116,745 5,698,050 5,716,018 5,695,440 5,701,417 5,800,945 5,947,961 5,652,763 5,144,429ALABAMA 128,086 121,545 122,502 129,031 143,734 118,546 108,482 98,723 113,513 108,236 108,682ALASKA 17,886 16,678 17,232 15,531 15,085 16,036 18,720 21,311 21,226 18,054 13,587ARIZONA 166,939 174,987 161,187 159,521 180,278 180,008 182,841 165,421 191,090 185,819 185,542ARKANSAS 112,035 108,544 91,653 88,750 87,377 91,367 92,455 99,516 83,480 79,756 68,781CALIFORNIA 1,069,141 974,998 973,180 872,136 801,663 710,776 714,145 753,470 730,887 702,426 648,832COLORADO 85,354 81,987 78,739 83,502 97,680 93,981 99,518 93,553 106,219 98,662 99,301CONNECTICUT 60,014 53,969 44,312 45,173 42,435 36,916 35,216 39,154 42,031 41,368 39,569DELAWARE 14,995 16,268 13,977 12,117 9,975 10,135 11,502 10,356 8,377 8,114 9,027DISTRICT OF COLUMBIA 15,674 14,909 13,567 9,177 8,335 7,886 6,767 6,066 5,793 5,123 5,088FLORIDA 439,016 375,084 334,243 367,743 370,407 343,496 343,353 340,880 338,963 311,579 304,202GEORGIA 215,973 230,507 218,483 189,572 194,364 185,604 174,179 177,353 189,139 225,452 240,741HAWAII 34,744 40,909 28,345 27,179 22,202 21,499 19,537 18,560 15,391 15,909 13,318IDAHO 35,759 37,212 39,628 37,020 36,076 34,239 36,376 37,316 34,687 40,225 39,281ILLINOIS 227,000 267,235 250,906 238,705 207,884 233,084 237,118 235,886 209,405 202,497 197,575INDIANA 84,634 86,843 93,719 99,658 94,626 105,585 98,740 115,674 116,734 129,819 114,570IOWA 66,592 61,635 55,833 48,989 42,331 54,597 48,756 52,854 48,402 62,459 54,456KANSAS 81,202 74,036 76,807 68,979 57,891 47,312 50,144 56,581 63,319 61,605 59,549KENTUCKY 138,199 126,718 112,546 95,316 91,051 99,393 113,123 111,070 107,598 102,563 99,501LOUISIANA 121,217 104,522 93,829 116,018 127,238 126,065 113,900 104,700 111,540 110,153 97,741MAINE 26,277 24,367 26,703 25,098 25,077 24,345 23,150 20,458 18,818 18,451 20,268MARYLAND 90,289 89,073 77,227 71,302 59,924 49,670 50,696 72,330 85,552 88,258 70,225MASSACHUSETTS 117,208 110,235 100,648 94,267 83,061 76,475 72,241 83,802 76,871 81,223 63,398MICHIGAN 184,864 191,864 174,985 182,927 168,842 177,981 188,830 189,567 196,508 194,108 193,955MINNESOTA 91,218 82,910 72,688 59,956 50,577 47,283 50,671 46,502 54,458 62,278 65,383MISSISSIPPI 76,116 82,192 70,617 76,105 77,783 89,094 83,958 79,572 79,272 75,886 69,289MISSOURI 149,859 179,137 158,844 121,695 90,876 89,673 91,258 95,375 107,777 128,377 147,953MONTANA 34,810 36,896 29,847 30,006 25,789 23,265 21,456 21,984 22,729 21,229 20,312NEBRASKA 36,050 39,620 34,102 32,516 28,363 28,905 32,326 34,976 33,119 30,375 28,118NEVADA 58,173 56,101 56,976 57,021 56,867 55,121 56,483 58,693 57,427 62,873 62,705NEW HAMPSHIRE 29,320 34,566 30,136 21,108 14,429 11,978 13,607 12,440 14,565 12,360 10,596NEW JERSEY 122,766 138,426 128,426 108,734 94,228 85,815 111,834 97,444 103,124 90,542 96,577NEW MEXICO 85,667 80,485 72,660 58,060 51,925 47,004 49,065 44,492 42,807 46,503 44,760NEW YORK 321,522 323,323 324,502 331,489 311,092 282,777 255,681 242,837 250,934 241,556 218,031NORTH CAROLINA 168,537 168,524 178,635 173,623 163,543 164,935 175,984 166,146 185,594 192,992 194,676NORTH DAKOTA 11,983 14,433 14,684 12,251 9,763 7,821 8,922 8,523 8,636 10,201 10,170OHIO 276,430 286,147 276,069 259,092 228,855 216,644 199,103 179,546 186,854 214,222 221,104OKLAHOMA 120,627 105,992 95,515 105,595 112,121 115,855 93,839 82,594 85,824 94,676 101,865OREGON 110,383 130,511 101,030 91,052 71,122 68,157 67,658 65,747 76,781 82,630 76,837PENNSYLVANIA 163,277 178,928 185,708 188,356 151,534 158,622 160,092 177,851 192,255 183,442 167,453RHODE ISLAND 20,129 24,889 25,116 20,800 16,221 16,666 15,754 18,549 13,782 13,078 10,113SOUTH CAROLINA 96,118 75,647 74,235 82,753 86,556 92,815 89,605 84,010 91,221 92,153 82,982SOUTH DAKOTA 12,984 13,777 13,041 10,575 9,449 9,547 11,266 14,437 15,700 16,679 13,811TENNESSEE 189,679 173,812 135,483 110,797 127,276 136,082 143,017 130,925 132,524 143,903 151,676TEXAS 740,316 725,510 701,624 658,629 660,280 656,022 672,675 689,334 686,599 639,424 624,236UTAH 64,034 59,225 56,885 48,542 50,810 57,739 65,451 72,048 71,308 72,199 69,493VERMONT 12,479 11,771 11,731 11,015 11,775 8,092 7,838 7,582 7,311 6,295 5,431VIRGINIA 139,369 112,829 112,784 92,568 99,414 105,563 93,469 105,592 103,453 112,429 99,207WASHINGTON 163,789 145,176 127,529 136,435 147,098 152,711 150,298 149,472 133,271 132,824 116,916WEST VIRGINIA 35,362 34,355 32,108 29,073 24,809 26,003 23,829 24,433 25,317 30,486 32,079WISCONSIN 101,412 96,699 86,998 90,659 90,855 90,916 107,454 105,984 108,855 89,055 83,109WYOMING 13,711 14,262 13,065 12,711 12,661 13,067 11,911 10,908 9,732 10,032 9,650

52
Table 47: Percent of children in urban areas living in low-income families, 1997-2007
1997 1998 1999 2000 2001 2002 2003 2004 2005 2006 2007naTiOnaL 53 52 50 49 50 51 52 52 49 48 49ALABAMA 61 57 55 55 64 61 68 66 61 51 45ALASKA 25 24 26 27 27 25 27 31 35 39 N/AARIZONA 52 52 51 50 48 47 49 50 53 53 53ARKANSAS 47 51 45 39 44 46 49 45 45 46 53CALIFORNIA 57 54 53 51 48 48 48 49 47 46 45COLORADO 46 48 50 48 44 44 44 47 47 48 44CONNECTICUT 62 59 54 59 57 57 55 54 50 47 45DELAWARE N/A N/A N/A N/A N/A N/A N/A N/A N/A N/A N/ADISTRICT OF COLUMBIA 57 60 56 53 50 53 53 53 54 54 53FLORIDA 55 54 51 51 49 48 48 48 47 45 42GEORGIA 80 83 82 71 61 58 55 62 57 58 57HAWAII 36 33 35 33 36 34 37 37 36 30 28IDAHO 41 40 34 29 28 32 38 40 39 38 37ILLINOIS 61 58 54 51 50 54 55 55 52 48 45INDIANA 37 33 32 40 47 51 52 54 59 57 57IOWA 49 53 56 51 47 45 49 51 51 ** N/AKANSAS 43 45 42 40 36 39 43 45 45 45 46KENTUCKY 58 48 41 40 47 49 53 51 55 63 69LOUISIANA 66 65 63 61 64 61 58 49 46 44 44MAINE N/A N/A N/A N/A N/A N/A N/A N/A N/A N/A N/AMARYLAND 56 45 40* 55 58 56 57 60 62 54 50MASSACHUSETTS 59 61 64 62 60 56 52 52 48 45 43MICHIGAN 67 63 63 61 62 58 61 60 60 56 51MINNESOTA 54 55 54 45 44 42 49 45 41 37 37MISSISSIPPI 67 61 56 50 52 55 58 62 70 73 68MISSOURI 53 57 53 47 40 37 39 40 45 47 50MONTANA N/A N/A N/A N/A N/A N/A N/A N/A N/A N/A N/ANEBRASKA 38 43 44 38 35 35 33 33 29 31 29NEVADA 48 45 42 42 41 40 40 41 41 40 38NEW HAMPSHIRE N/A N/A N/A N/A N/A N/A N/A N/A 15* 14* 16*NEW JERSEY 57 64 61 60 60 60 61 48 42 41 48NEW MEXICO 46 44 41 38 38 37 38 40 44 42 36NEW YORK 64 61 59 56 56 55 56 57 56 55 55NORTH CAROLINA 40 38 39 43 42 44 47 50 48 45 47NORTH DAKOTA N/A N/A N/A N/A N/A N/A N/A N/A N/A N/A N/AOHIO 56 55 52 51 47 47 48 52 56 61 61OKLAHOMA 48 44 39 42 49 48 48 45 50 51 55OREGON 39 40 37 33 31 33 40 46 43 40 38PENNSYLVANIA 59 60 57 54 51 55 60 60 61 61 61RHODE ISLAND 51 51 53 54 50 49 49 50 48 44 45SOUTH CAROLINA 56* 31* 17* 23* 28* 34* 29* 30* 43 45 54SOUTH DAKOTA 29 26 23 23 23 27 27 30 29 32* N/ATENNESSEE 58 55 47 43 44 50 54 57 58 58 59TEXAS 57 56 54 52 51 52 55 55 56 53 52UTAH 43 41 40 41 43 47 49 49 49 51 48VERMONT N/A N/A N/A N/A N/A N/A N/A N/A N/A N/A N/AVIRGINIA 47 39 34 39 40 42 40 41 38 38 37WASHINGTON 35 30 27 35 41 39 36 37 40 43 39WEST VIRGINIA N/A N/A N/A N/A N/A N/A N/A ** 25* 32* 31*WISCONSIN 49 46 44 41 40 46 53 57 56 52 50WYOMING N/A N/A N/A N/A N/A N/A N/A N/A N/A N/A N/A
definitions:
Urban: A central city, as defined by the U.S. Census Bureau. The MSAs were changed in the 1995 and 2005 CPS data to reflect changes in the population distribution found in the decennial Census. This may affect trends over time.
Numerator: Number of low-income children in urban areas
Denominator: Number of low-income children
State specific notes:
* This estimate should be used with caution. It may be unreliable due to a small sample size.
** This estimate was not shown due to an extremely small sample size.
N/A: Data is not available for this state. No children with these characteristics were identified as living in this area or this type of residential area does not exist in this state.
TyPE Of REsiDEnTiaL aREa

National Center for Children in Poverty Low-Income Children in the United States 53
Table 48: number of children in urban areas living in low-income families, 1997-2007
definitions:
Urban: A central city, as defined by the U.S. Census Bureau. The MSAs were changed in the 1995 and 2005 CPS data to reflect changes in the population distribution found in the decennial Census. This may affect trends over time.
State specific notes:
* This estimate should be used with caution. It may be unreliable due to a small sample size.
** This estimate was not shown due to an extremely small sample size.
N/A: Data is not available for this state. No children with these characteristics were identified as living in this area or this type of residential area does not exist in this state.
1997 1998 1999 2000 2001 2002 2003 2004 2005 2006 2007naTiOnaL 9,332,881 9,162,778 8,578,450 8,239,819 8,481,177 8,578,448 8,994,879 9,664,583 9,642,313 9,368,907 9,713,783ALABAMA 117,426 97,838 89,766 86,481 103,171 92,144 99,003 99,277 109,290 104,437 99,853ALASKA 25,007 23,745 24,161 22,217 20,638 18,552 19,802 18,946 12,612 4,465 N/AARIZONA 366,557 379,048 358,582 337,200 334,566 338,667 362,966 381,759 412,919 426,756 431,403ARKANSAS 31,580 43,913 41,256 33,256 30,759 27,246 36,320 44,082 55,241 64,336 75,861CALIFORNIA 1,843,474 1,753,476 1,729,402 1,661,445 1,612,821 1,585,545 1,582,545 1,657,178 1,748,565 1,862,290 1,911,229COLORADO 108,111 107,993 115,041 112,285 107,236 106,678 102,819 110,466 114,579 123,520 122,804CONNECTICUT 141,137 134,100 113,551 129,000 121,297 116,510 105,902 105,016 95,516 94,707 90,303DELAWARE N/A N/A N/A N/A N/A N/A N/A N/A N/A N/A N/ADISTRICT OF COLUMBIA 69,913 67,149 61,074 56,650 55,170 58,614 58,835 58,836 58,739 60,990 59,259FLORIDA 355,425 336,987 302,601 303,677 300,403 333,242 341,113 367,619 376,455 392,984 391,439GEORGIA 116,209 129,507 134,896 105,042 84,006 75,024 73,556 95,954 103,903 120,437 114,267HAWAII 20,601 21,595 26,018 24,728 27,251 24,828 27,581 27,096 26,953 23,834 23,700IDAHO 17,428 18,675 15,417 15,219 15,672 18,263 23,675 25,962 27,892 23,721 22,510ILLINOIS 596,189 557,025 507,925 480,118 471,433 519,227 526,119 521,912 473,507 406,918 369,817INDIANA 102,389 83,388 82,609 113,614 139,455 152,308 142,657 162,658 196,060 205,032 208,575IOWA 28,728 36,212 37,258 29,858 25,453 26,358 30,695 29,656 18,104 ** N/AKANSAS 98,183 98,073 79,131 70,229 62,962 74,039 85,302 85,233 84,988 84,413 91,364KENTUCKY 68,505 58,931 49,079 49,387 55,000 58,162 61,079 54,941 52,450 56,118 57,256LOUISIANA 163,611 161,081 156,090 169,792 174,028 149,983 142,896 126,771 129,049 131,687 132,658MAINE N/A N/A N/A N/A N/A N/A N/A N/A N/A N/A N/AMARYLAND 101,168 65,124 40,957* 51,050 55,225 58,602 54,745 65,046 96,866 108,876 108,941MASSACHUSETTS 215,899 221,193 233,792 226,946 204,222 169,803 165,437 167,539 149,481 122,904 107,810MICHIGAN 438,888 423,053 428,930 400,178 375,505 333,225 343,364 330,836 335,071 300,632 273,818MINNESOTA 76,585 82,878 84,358 58,685 43,919 40,969 51,846 56,705 61,655 66,414 73,375MISSISSIPPI 53,611 59,955 55,482 49,898 51,241 53,689 53,844 56,270 64,251 66,237 57,649MISSOURI 129,915 150,955 141,548 115,061 89,181 79,560 88,998 96,870 108,584 112,603 117,107MONTANA N/A N/A N/A N/A N/A N/A N/A N/A N/A N/A N/ANEBRASKA 37,738 41,776 37,556 30,096 25,396 28,096 27,067 28,764 26,814 29,144 29,574NEVADA 59,154 64,054 69,281 72,411 71,969 66,022 65,656 72,187 83,065 92,454 90,819NEW HAMPSHIRE N/A N/A N/A N/A N/A N/A N/A N/A 987* ** 2,313*NEW JERSEY 86,556 79,258 74,048 79,702 81,251 79,992 74,083 66,724 62,774 68,630 89,271NEW MEXICO 57,168 56,388 52,276 46,468 45,874 42,884 45,177 47,150 53,938 53,731 45,875NEW YORK 1,379,131 1,346,381 1,274,153 1,208,501 1,168,687 1,157,655 1,188,391 1,218,583 1,211,406 1,174,708 1,181,668NORTH CAROLINA 145,002 142,232 137,040 157,508 153,987 160,456 177,359 204,910 229,423 237,620 265,662NORTH DAKOTA N/A N/A N/A N/A N/A N/A N/A N/A N/A N/A N/AOHIO 431,849 424,481 408,607 373,781 336,804 311,226 321,240 353,526 359,829 375,007 359,203OKLAHOMA 115,831 98,941 79,282 82,252 108,105 117,672 122,234 107,759 111,091 111,582 124,470OREGON 53,681 59,755 66,611 59,950 55,094 48,255 56,091 73,654 82,679 86,200 81,488PENNSYLVANIA 339,881 340,246 318,630 277,512 231,847 241,259 265,702 263,435 242,826 227,108 224,664RHODE ISLAND 40,042 39,774 44,868 52,184 46,876 42,587 43,136 43,536 40,611 34,039 35,037SOUTH CAROLINA 41,998* 19,474* 10,506* 17,113* 22,764* 25,119* 14,391* 15,186* 24,587 27,289 26,175SOUTH DAKOTA 7,926 7,959 8,079 8,578 7,891 9,785 10,989 10,509 6,227 ** N/ATENNESSEE 279,715 256,772 218,420 179,691 183,587 198,593 201,640 209,248 219,038 236,117 243,200TEXAS 918,672 956,852 941,486 909,758 915,470 965,462 1,079,781 1,181,768 1,311,303 1,359,332 1,374,739UTAH 63,044 63,243 61,342 56,797 53,180 57,326 61,918 63,855 61,347 63,339 61,710VERMONT N/A N/A N/A N/A N/A N/A N/A N/A N/A N/A N/AVIRGINIA 158,801 130,616 124,096 157,204 167,010 162,540 127,381 124,882 123,248 142,027 145,780WASHINGTON 92,241 82,231 70,312 81,493 96,174 96,015 92,924 98,210 108,539 115,157 110,573WEST VIRGINIA N/A N/A N/A N/A N/A N/A N/A ** 3,082* ** 7,032*WISCONSIN 153,671 129,187 119,188 107,337 100,569 110,964 128,576 148,626 158,381 144,964 134,749WYOMING N/A N/A N/A N/A N/A N/A N/A N/A N/A N/A N/A

54
Table 49: Percent of children in suburban areas living in low-income families, 1997-2007
1997 1998 1999 2000 2001 2002 2003 2004 2005 2006 2007naTiOnaL 31 30 29 28 28 28 30 29 30 31 31ALABAMA 26 23 29 31 34 31 27 23 23 26 26ALASKA N/A N/A N/A N/A N/A N/A N/A N/A N/A N/A N/AARIZONA 39 40 39 38 35 30 30 30 34 34 36ARKANSAS 34 36 38* 31* 32 27 31 23 30 38 44CALIFORNIA 42 43 42 40 38 37 37 38 39 40 40COLORADO 16 18 18 22 22 23 25 24 24 23 22CONNECTICUT 21 19 15 13 14 17 16 15 14 14 16DELAWARE N/A N/A N/A N/A N/A N/A N/A N/A N/A N/A N/ADISTRICT OF COLUMBIA N/A N/A N/A N/A N/A N/A N/A N/A N/A N/A N/AFLORIDA 43 42 40 39 38 37 38 37 37 36 36GEORGIA 31 31 34 35 34 33 32 32 32 32 32HAWAII 41 39 31 32 32 33 32 29 27 28 28IDAHO 40 45 51 47 39 33 35 36 35 38 39ILLINOIS 22 21 22 21 21 22 24 25 27 28 30INDIANA 24 23 26 26 25 21 21 24 27 28 24IOWA 27* 24* 18* 14* 15* 19 19 21 20 25 26KANSAS 23 21 21 21 22 20 19 19 22 23 24KENTUCKY 22 23 24 25 23 25 27 31 30 32 32LOUISIANA 39 39 40 41 41 43 43 45 44 43 38MAINE N/A N/A N/A N/A N/A N/A N/A N/A N/A N/A N/AMARYLAND 25 23 20 19 19 18 20 21 23 21 20MASSACHUSETTS 20 20 21 22 22 18 17 16 20 23 25MICHIGAN 20 21 21 20 19 20 23 26 27 27 27MINNESOTA 20 17 14 12 13 15 17 17 17 18 19MISSISSIPPI 43 45 46 47 45 40 40 32 29 29 36MISSOURI 30 26 26 21 22 22 24 26 26 27 30MONTANA N/A N/A N/A N/A N/A N/A N/A N/A N/A N/A N/ANEBRASKA 27 22 17 15 15 16 19 25 25 23 18NEVADA 36 36 37 37 38 39 40 40 39 37 40NEW HAMPSHIRE 14* 15* 14* 16* 12* 12 12 12 12 12 11NEW JERSEY 23 26 25 24 22 22 24 23 23 22 23NEW MEXICO 42 47 47 43 41 39 42 44 46 41 36NEW YORK 28 27 27 24 22 21 22 22 23 24 23NORTH CAROLINA 37 37 32 29 28 31 31 31 31 31 32NORTH DAKOTA N/A N/A N/A N/A N/A N/A N/A N/A N/A N/A N/AOHIO 27 28 29 29 28 27 27 27 27 27 29OKLAHOMA 34 36 33 33 29 32 34 35 32 31 31OREGON 35 38 35 36 34 33 34 34 37 37 35PENNSYLVANIA 27 25 26 25 25 24 24 25 26 28 29RHODE ISLAND 25 25 23 18 17 18 20 26 29 30 28SOUTH CAROLINA 40 38 42 43 41 39 39 38 38 36 36SOUTH DAKOTA N/A N/A N/A N/A N/A N/A N/A N/A N/A N/A N/ATENNESSEE 33 31 31 29 29 27 27 26 25 23 23TEXAS 34 35 34 33 32 33 34 35 36 36 38UTAH 31 29 28 27 26 25 26 28 30 31 31VERMONT N/A N/A N/A N/A N/A N/A N/A N/A N/A N/A N/AVIRGINIA 32 27 22 17 16 17 16 17 17 21 22WASHINGTON 22 20 17 18 20 24 25 27 27 25 23WEST VIRGINIA N/A N/A N/A N/A N/A N/A N/A 36* 36 34 35WISCONSIN 16 18 15* 16 15 16 17 18 19 19 19WYOMING N/A N/A N/A N/A N/A N/A N/A N/A N/A N/A N/A
definitions:
Suburban: Areas contained in a metropolitan statistical area (MSA), excluding central cities. An MSA is defined by the U.S. Census Bureau as a group of communities that are socially and economically integrated with an adjacent urbanized area. The urbanized area is defined as the central city, while the surrounding areas are defined as the suburbs. The MSAs were changed in the 1995 and 2005 CPS data to reflect changes in the population distribution found in the decennial Census. This may affect trends over time.
Numerator: Number of low-income children in suburban areas
Denominator: Number of low-income children
State specific notes:
* This estimate should be used with caution. It may be unreliable due to a small sample size.
N/A: Data is not available for this state. No children with these characteristics were identified as living in this area or this type of residential area does not exist in this state.
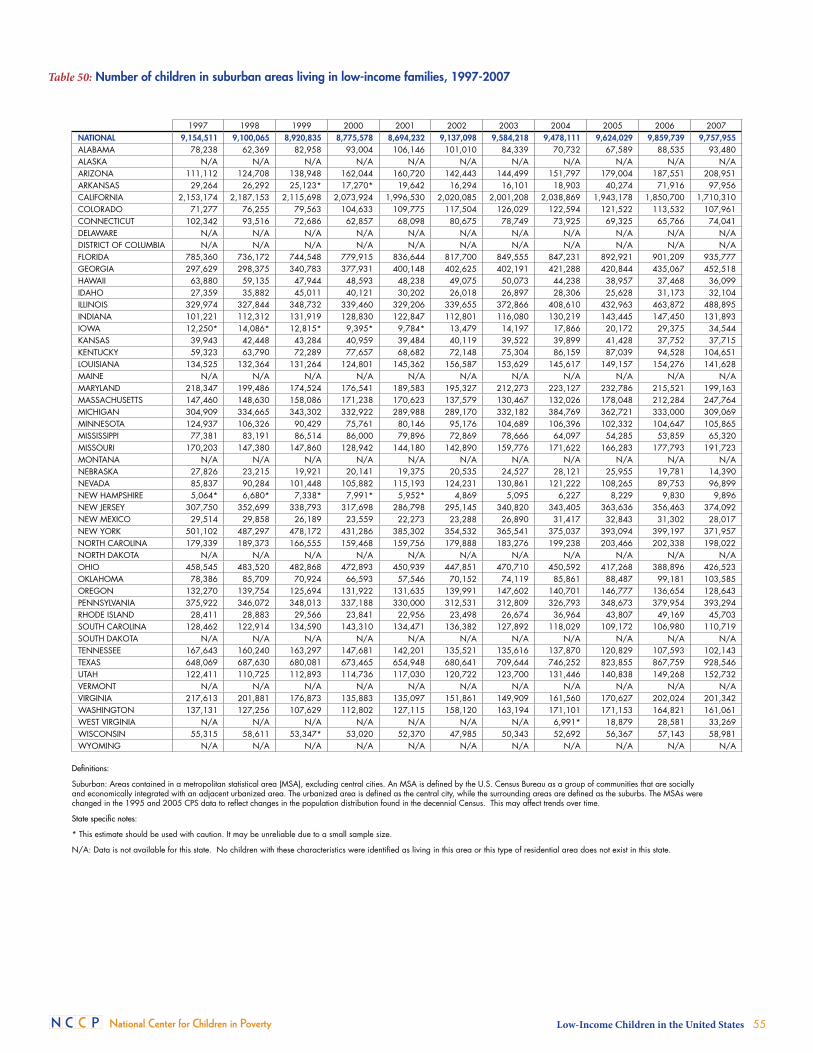
National Center for Children in Poverty Low-Income Children in the United States 55
Table 50: number of children in suburban areas living in low-income families, 1997-2007
definitions:
Suburban: Areas contained in a metropolitan statistical area (MSA), excluding central cities. An MSA is defined by the U.S. Census Bureau as a group of communities that are socially and economically integrated with an adjacent urbanized area. The urbanized area is defined as the central city, while the surrounding areas are defined as the suburbs. The MSAs were changed in the 1995 and 2005 CPS data to reflect changes in the population distribution found in the decennial Census. This may affect trends over time.
State specific notes:
* This estimate should be used with caution. It may be unreliable due to a small sample size.
N/A: Data is not available for this state. No children with these characteristics were identified as living in this area or this type of residential area does not exist in this state.
1997 1998 1999 2000 2001 2002 2003 2004 2005 2006 2007naTiOnaL 9,154,511 9,100,065 8,920,835 8,775,578 8,694,232 9,137,098 9,584,218 9,478,111 9,624,029 9,859,739 9,757,955ALABAMA 78,238 62,369 82,958 93,004 106,146 101,010 84,339 70,732 67,589 88,535 93,480ALASKA N/A N/A N/A N/A N/A N/A N/A N/A N/A N/A N/AARIZONA 111,112 124,708 138,948 162,044 160,720 142,443 144,499 151,797 179,004 187,551 208,951ARKANSAS 29,264 26,292 25,123* 17,270* 19,642 16,294 16,101 18,903 40,274 71,916 97,956CALIFORNIA 2,153,174 2,187,153 2,115,698 2,073,924 1,996,530 2,020,085 2,001,208 2,038,869 1,943,178 1,850,700 1,710,310COLORADO 71,277 76,255 79,563 104,633 109,775 117,504 126,029 122,594 121,522 113,532 107,961CONNECTICUT 102,342 93,516 72,686 62,857 68,098 80,675 78,749 73,925 69,325 65,766 74,041DELAWARE N/A N/A N/A N/A N/A N/A N/A N/A N/A N/A N/ADISTRICT OF COLUMBIA N/A N/A N/A N/A N/A N/A N/A N/A N/A N/A N/AFLORIDA 785,360 736,172 744,548 779,915 836,644 817,700 849,555 847,231 892,921 901,209 935,777GEORGIA 297,629 298,375 340,783 377,931 400,148 402,625 402,191 421,288 420,844 435,067 452,518HAWAII 63,880 59,135 47,944 48,593 48,238 49,075 50,073 44,238 38,957 37,468 36,099IDAHO 27,359 35,882 45,011 40,121 30,202 26,018 26,897 28,306 25,628 31,173 32,104ILLINOIS 329,974 327,844 348,732 339,460 329,206 339,655 372,866 408,610 432,963 463,872 488,895INDIANA 101,221 112,312 131,919 128,830 122,847 112,801 116,080 130,219 143,445 147,450 131,893IOWA 12,250* 14,086* 12,815* 9,395* 9,784* 13,479 14,197 17,866 20,172 29,375 34,544KANSAS 39,943 42,448 43,284 40,959 39,484 40,119 39,522 39,899 41,428 37,752 37,715KENTUCKY 59,323 63,790 72,289 77,657 68,682 72,148 75,304 86,159 87,039 94,528 104,651LOUISIANA 134,525 132,364 131,264 124,801 145,362 156,587 153,629 145,617 149,157 154,276 141,628MAINE N/A N/A N/A N/A N/A N/A N/A N/A N/A N/A N/AMARYLAND 218,347 199,486 174,524 176,541 189,583 195,327 212,273 223,127 232,786 215,521 199,163MASSACHUSETTS 147,460 148,630 158,086 171,238 170,623 137,579 130,467 132,026 178,048 212,284 247,764MICHIGAN 304,909 334,665 343,302 332,922 289,988 289,170 332,182 384,769 362,721 333,000 309,069MINNESOTA 124,937 106,326 90,429 75,761 80,146 95,176 104,689 106,396 102,332 104,647 105,865MISSISSIPPI 77,381 83,191 86,514 86,000 79,896 72,869 78,666 64,097 54,285 53,859 65,320MISSOURI 170,203 147,380 147,860 128,942 144,180 142,890 159,776 171,622 166,283 177,793 191,723MONTANA N/A N/A N/A N/A N/A N/A N/A N/A N/A N/A N/ANEBRASKA 27,826 23,215 19,921 20,141 19,375 20,535 24,527 28,121 25,955 19,781 14,390NEVADA 85,837 90,284 101,448 105,882 115,193 124,231 130,861 121,222 108,265 89,753 96,899NEW HAMPSHIRE 5,064* 6,680* 7,338* 7,991* 5,952* 4,869 5,095 6,227 8,229 9,830 9,896NEW JERSEY 307,750 352,699 338,793 317,698 286,798 295,145 340,820 343,405 363,636 356,463 374,092NEW MEXICO 29,514 29,858 26,189 23,559 22,273 23,288 26,890 31,417 32,843 31,302 28,017NEW YORK 501,102 487,297 478,172 431,286 385,302 354,532 365,541 375,037 393,094 399,197 371,957NORTH CAROLINA 179,339 189,373 166,555 159,468 159,756 179,888 183,276 199,238 203,466 202,338 198,022NORTH DAKOTA N/A N/A N/A N/A N/A N/A N/A N/A N/A N/A N/AOHIO 458,545 483,520 482,868 472,893 450,939 447,851 470,710 450,592 417,268 388,896 426,523OKLAHOMA 78,386 85,709 70,924 66,593 57,546 70,152 74,119 85,861 88,487 99,181 103,585OREGON 132,270 139,754 125,694 131,922 131,635 139,991 147,602 140,701 146,777 136,654 128,643PENNSYLVANIA 375,922 346,072 348,013 337,188 330,000 312,531 312,809 326,793 348,673 379,954 393,294RHODE ISLAND 28,411 28,883 29,566 23,841 22,956 23,498 26,674 36,964 43,807 49,169 45,703SOUTH CAROLINA 128,462 122,914 134,590 143,310 134,471 136,382 127,892 118,029 109,172 106,980 110,719SOUTH DAKOTA N/A N/A N/A N/A N/A N/A N/A N/A N/A N/A N/ATENNESSEE 167,643 160,240 163,297 147,681 142,201 135,521 135,616 137,870 120,829 107,593 102,143TEXAS 648,069 687,630 680,081 673,465 654,948 680,641 709,644 746,252 823,855 867,759 928,546UTAH 122,411 110,725 112,893 114,736 117,030 120,722 123,700 131,446 140,838 149,268 152,732VERMONT N/A N/A N/A N/A N/A N/A N/A N/A N/A N/A N/AVIRGINIA 217,613 201,881 176,873 135,883 135,097 151,861 149,909 161,560 170,627 202,024 201,342WASHINGTON 137,131 127,256 107,629 112,802 127,115 158,120 163,194 171,101 171,153 164,821 161,061WEST VIRGINIA N/A N/A N/A N/A N/A N/A N/A 6,991* 18,879 28,581 33,269WISCONSIN 55,315 58,611 53,347* 53,020 52,370 47,985 50,343 52,692 56,367 57,143 58,981WYOMING N/A N/A N/A N/A N/A N/A N/A N/A N/A N/A N/A

56
Table 51: Percent of children in rural areas living in low-income families, 1997-2007
1997 1998 1999 2000 2001 2002 2003 2004 2005 2006 2007naTiOnaL 50 47 47 45 47 47 46 47 47 47 46ALABAMA 58 57 54 54 53 52 51 48 52 52 56ALASKA 32 34 33 33 33 34 35 35 37 38 38ARIZONA 72 67 62 55 55 49 47 46 54 58 57ARKANSAS 65 63 58 55 56 60 61 61 60 61 60CALIFORNIA 40* 40* 56* 61* 62 48 45 35 39 42 43COLORADO 60 57 51 43 45 45 46 46 44 54 N/ACONNECTICUT N/A N/A N/A N/A N/A N/A N/A ** 25* 18* 18*DELAWARE 51 45 41 37 34 32 34 37 41 39 42DISTRICT OF COLUMBIA N/A N/A N/A N/A N/A N/A N/A N/A N/A N/A N/AFLORIDA 65 60 60 59 62 55 50 48 46 48 51GEORGIA 65 64 63 57 56 51 51 53 56 59 55HAWAII 49 55 50 46 39 40 37 36 29 30 31IDAHO 49 47 47 46 48 48 48 47 47 44 42ILLINOIS 44 41 38 37 36 39 38 41 40 41 40INDIANA 36 35 35 35 38 40 39 37 37 38 41IOWA 39 40 36 32 30 32 32 32 30 34 34KANSAS 45 40 41 45 45 40 38 40 43 44 44KENTUCKY 53 52 49 45 45 46 49 49 48 48 47LOUISIANA 64 63 63 62 55 48 49 51 55 50* N/AMAINE 43 40 41 38 40 42 44 43 42 41 41MARYLAND N/A N/A N/A N/A N/A N/A N/A ** 54* 50 43MASSACHUSETTS 35* 30* 27* 34* 34* 37 38 31* 23* 26* 44*MICHIGAN 45 43 40 40 42 45 44 42 39 42 44MINNESOTA 53 53 46 41 39 34 34 33 32 33 36MISSISSIPPI 63 57 50 47 50 53 56 57 58 60 62MISSOURI 42 39 38 37 39 42 44 51 52 55 56MONTANA 55 52 48 47 47 49 51 52 50 47 45NEBRASKA 42 44 43 45 41 43 40 41 40 43 42NEVADA 18* 20* 26 31 32 36 36 39 32 ** N/ANEW HAMPSHIRE 34 40 39 35 32 28 30 28 27 26 25NEW JERSEY N/A N/A N/A N/A N/A N/A N/A N/A N/A N/A N/ANEW MEXICO 66 64 65 64 65 59 63 59 57 52 54NEW YORK 37 37 38 40 43 46 50 46 43 43 43NORTH CAROLINA 46 47 50 50 49 48 50 52 54 55 53NORTH DAKOTA 42 47 52 51 48 46 46 44 44 44 44OHIO 43 43 43 40 42 38 37 37 35 37 35OKLAHOMA 59 52 48 52 55 56 54 54 55 57 56OREGON 48 52 50 50 47 46 48 45 46 46 45PENNSYLVANIA 50 46 43 42 46 48 47 43 41 42 41RHODE ISLAND N/A N/A N/A N/A N/A N/A N/A N/A N/A N/A N/ASOUTH CAROLINA 65 55 50 48 52 54 53 54 53 54 54SOUTH DAKOTA 46 41 36 35 35 38 38 41 41 43 43TENNESSEE 60 58 53 49 49 51 50 47 47 52 55TEXAS 60 59 59 59 57 56 56 58 58 55 53UTAH 54 59 56 54 52 51 51 48 48 50 N/AVERMONT 46 41 38 38 39 36 37 35 33 30 32VIRGINIA 41 40 38 40 36 39 41 46 49 51 53WASHINGTON 61 62 60 58 58 56 56 51 50 44 44WEST VIRGINIA 60 58 57 57 56 57 58 57 55 55 57WISCONSIN 46 42 35 34 33 34 33 36 37 38 36WYOMING 42 42 40 39 37 37 36 36 34 31 28
definitions:
Rural: An area that is not in a metropolitan statistical area (MSA), as defined by the U.S. Census Bureau. MSAs were changed in the 1995 and 2005 CPS data to reflect changes in the population distribution found in the decennial Census. This may affect trends over time.
Numerator: Number of low-income children in rural areas
Denominator: Number of children in rural areas
State specific notes:
* This estimate should be used with caution. It may be unreliable due to a small sample size.
N/A: Data is not available for this state. No children with these characteristics were identified as living in this area or this type of residential area does not exist in this state.

National Center for Children in Poverty Low-Income Children in the United States 57
Table 52: number of children in rural areas living in low-income families, 1997-2007
definitions:
Rural: An area that is not in a metropolitan statistical area (MSA), as defined by the U.S. Census Bureau. MSAs were changed in the 1995 and 2005 CPS data to reflect changes in the population distribution found in the decennial Census. This may affect trends over time.
State specific notes:
* This estimate should be used with caution. It may be unreliable due to a small sample size.
N/A: Data is not available for this state. No children with these characteristics were identified as living in this area or this type of residential area does not exist in this state.
1997 1998 1999 2000 2001 2002 2003 2004 2005 2006 2007naTiOnaL 6,870,924 6,246,438 6,211,608 5,804,000 6,115,594 6,031,814 5,905,888 5,445,653 5,052,018 5,174,682 5,167,306ALABAMA 211,610 174,736 150,478 156,161 165,008 161,181 147,196 147,923 156,915 150,566 160,687ALASKA 36,939 38,092 36,651 38,107 37,791 39,000 40,642 36,892 31,700 25,083 20,181ARIZONA 163,785 152,885 122,294 98,519 100,928 97,214 90,439 90,587 108,266 128,000 119,620ARKANSAS 246,825 236,145 208,504 192,095 196,646 215,850 216,997 204,771 175,207 163,341 154,198CALIFORNIA 39,645* 32,001* 40,483* 50,280* 57,099 43,936 46,402 37,114 46,329 50,912 57,215COLORADO 77,078 75,544 67,562 57,608 69,887 71,182 76,151 59,925 36,399 14,950 N/ACONNECTICUT N/A N/A N/A N/A N/A N/A N/A ** 4,482* 5,458* 5,992*DELAWARE 14,069 13,924 14,312 12,403 10,322 8,668 9,645 11,684 13,198 11,961 12,269DISTRICT OF COLUMBIA N/A N/A N/A N/A N/A N/A N/A N/A N/A N/A N/AFLORIDA 117,409 96,790 105,734 110,268 113,366 86,199 70,061 76,945 80,262 77,942 74,059GEORGIA 452,733 457,681 446,885 371,000 354,114 314,722 308,245 281,716 258,937 237,352 206,730HAWAII 43,060 45,190 41,672 37,994 31,552 32,779 30,492 27,780 22,308 23,421 25,491IDAHO 113,957 113,004 111,679 107,723 112,804 112,485 111,100 99,070 87,207 70,921 64,350ILLINOIS 244,080 260,787 239,437 199,401 171,865 186,213 197,194 195,281 161,741 133,652 131,245INDIANA 236,118 229,727 223,229 210,044 218,350 231,520 237,709 209,270 195,011 174,387 186,138IOWA 182,364 162,581 128,565 114,091 113,451 122,708 115,347 107,861 93,987 101,348 100,373KANSAS 115,470 96,953 102,332 116,822 113,916 96,266 84,956 95,126 100,370 102,040 98,432KENTUCKY 304,175 280,046 241,095 217,925 226,274 242,918 263,849 261,397 255,072 249,191 237,682LOUISIANA 156,139 158,122 155,208 156,384 131,767 125,584 125,046 111,656 69,035 22,509* N/AMAINE 77,078 70,796 74,634 68,448 71,777 72,621 77,061 72,940 67,665 61,393 57,782MARYLAND N/A N/A N/A N/A N/A N/A N/A ** 11,978* 18,462 20,221MASSACHUSETTS 26,054* 19,019* 12,464* 17,984* 19,943* 25,966 25,870 19,458* 10,289* 10,031* 13,792*MICHIGAN 143,140 136,505 122,104 115,721 123,212 144,533 141,170 135,946 127,192 154,235 159,248MINNESOTA 200,785 200,357 181,670 159,504 142,641 113,029 108,587 103,013 96,258 103,105 120,307MISSISSIPPI 331,723 285,442 236,909 226,216 242,969 258,725 266,167 260,905 254,847 251,933 257,529MISSOURI 152,657 145,063 127,624 125,941 139,334 148,262 141,597 150,594 157,207 171,483 169,190MONTANA 103,754 104,327 91,929 84,937 77,673 77,135 79,850 78,667 73,215 65,595 63,934NEBRASKA 86,787 91,645 88,817 85,550 73,244 73,808 68,984 69,648 63,526 71,090 68,077NEVADA 10,012* 13,687* 22,042 27,941 29,006 29,083 31,286 28,089 14,273 ** N/ANEW HAMPSHIRE 38,297 44,189 46,016 39,621 33,152 26,614 28,836 27,182 28,203 28,110 26,930NEW JERSEY N/A N/A N/A N/A N/A N/A N/A N/A N/A N/A N/ANEW MEXICO 192,672 179,399 178,169 159,512 147,374 130,282 136,740 125,581 113,326 100,506 98,979NEW YORK 163,101 158,569 158,808 162,413 177,365 186,603 198,156 180,401 163,241 156,176 152,655NORTH CAROLINA 203,727 221,083 255,155 265,289 293,454 297,945 300,199 300,234 332,763 380,128 384,706NORTH DAKOTA 43,307 49,593 52,051 47,243 40,039 37,872 37,721 36,390 35,896 34,572 34,382OHIO 224,908 205,462 220,075 202,653 200,392 160,136 145,896 169,904 188,276 216,503 204,403OKLAHOMA 184,773 162,411 153,671 163,445 172,866 172,114 165,544 163,436 154,712 151,499 149,462OREGON 121,790 135,491 134,545 128,614 109,027 100,754 100,179 91,554 90,743 84,808 82,965PENNSYLVANIA 203,085 198,277 193,607 182,535 192,563 204,624 200,808 198,970 202,969 220,827 212,857RHODE ISLAND N/A N/A N/A N/A N/A N/A N/A N/A N/A N/A N/ASOUTH CAROLINA 197,327 177,152 157,061 124,574 119,512 125,803 143,557 163,481 178,552 191,349 193,119SOUTH DAKOTA 52,917 45,759 39,721 39,667 38,146 42,492 42,288 45,995 44,000 40,541 38,668TENNESSEE 244,293 231,460 195,809 189,068 195,901 207,876 215,621 191,451 176,515 167,590 182,141TEXAS 597,021 556,642 540,842 518,742 504,494 492,874 508,040 493,514 452,564 365,315 351,794UTAH 77,018 74,542 72,513 72,921 71,984 69,104 74,130 56,011 32,501 7,011 N/AVERMONT 53,574 45,277 42,046 39,892 37,485 31,934 32,383 31,630 30,199 28,432 29,861VIRGINIA 142,544 133,390 125,563 125,919 109,281 121,515 133,644 137,385 129,757 115,639 130,209WASHINGTON 232,297 233,629 215,092 197,594 190,593 176,078 173,782 132,864 96,043 52,230 50,317WEST VIRGINIA 101,348 94,606 90,856 90,132 93,215 103,737 109,036 105,954 95,651 89,105 91,058WISCONSIN 180,272 155,259 143,280 145,560 141,139 133,118 129,184 131,334 121,391 114,631 109,217WYOMING 38,419 36,528 33,794 32,886 30,814 30,741 29,976 29,566 27,674 24,902 22,873

58
Table 53: Percent of children living in low-income families by region, 1997-2007
definitions:
Midwest: Includes Illinois, Indiana, Iowa, Kansas, Michigan, Minnesota, Missouri, Nebraska, North Dakota, Ohio, South Dakota, and Wisconsin.
Northeast: Includes Connecticut, Maine, Massachusetts, New Hampshire, New Jersey, New York, Pennsylvania, Rhode Island, and Vermont.
South: Includes Alabama, Arkansas, Delaware, District of Columbia, Florida, Georgia, Kentucky, Louisiana, Maryland, Mississippi, North Carolina, Oklahoma, Tennessee, Texas, South Carolina, Virginia, and West Virginia.
West: Includes Alaska, Arizona, California, Colorado, Hawaii, Idaho, Montana, Nevada, New Mexico, Oregon, Utah, Washington, and Wyoming.
REgiOn
Percent (%)
0
10
20
30
40
50
South
West
Midwest
Northeast
'07'06'05'04'03'02'01'00'99'98'97
0
10
20
30
40
50South
West
Midwest
Northeast
'07'06'05'04'03'02'01'00'99'98'97
Table 54: number of children living in low-income families by region, 1997-2007
1997 1998 1999 2000 2001 2002 2003 2004 2005 2006 2007SOUTH 11,087,808 10,296,729 10,190,509 10,716,652 11,156,486 10,864,092 11,437,484 11,281,427 11,243,096 11,430,678 11,660,436WEST 7,418,338 7,474,320 7,223,252 6,986,248 7,087,424 7,003,844 7,051,938 7,316,897 7,202,663 7,130,426 6,986,153MIDWEST 5,991,554 5,805,735 5,639,278 4,954,244 5,009,985 5,449,536 5,523,381 5,849,812 5,652,141 5,738,149 5,831,579NORTHEAST 4,725,257 4,851,304 4,576,519 4,127,099 4,077,739 4,302,881 4,374,769 4,156,909 4,267,901 4,258,667 4,324,887
1997 1998 1999 2000 2001 2002 2003 2004 2005 2006 2007SOUTH 45 43 42 42 42 42 43 43 42 42 43WEST 44 44 42 40 40 40 40 42 40 40 39MIDWEST 35 34 32 31 32 33 34 36 35 36 36NORTHEAST 37 37 35 33 34 34 34 32 34 34 35

215 West 125th Street, New York, NY 10027 tel 646-284-9600 n fax 646-284-9623
www.nccp.org