National Air Pollution Control Programme Report
101
1 National Air Pollution Control Programme Report Update of the 2019 NAPCP Ireland February 2021
Transcript of National Air Pollution Control Programme Report

1
National Air Pollution Control Programme Report Update of the 2019 NAPCP
Ireland February 2021

Report Details
This document is an update of the National Air Pollution Control Programme report for Ireland, which
is provided for under Article 6(10) of Directive (EU) 2016/2284.
Contact Identification
Competent Authority Name Department of the Environment, Climate and Communications
Date 22/02/2021
Telephone number of responsible service +353 (0)1 6782570
Email address of responsible service [email protected]
Link to website where the programme is published
https://www.gov.ie/en/publications/
Link(s) to website(s) on the consultation(s) on the programme
https://www.gov.ie/en/consultation/cf380-public- consultation-on-the-national-air-pollution- control-programme-napcp/
Version Control
Version Reference
Reference Date
Status at the time of the reference date
Brief explanation of changes
NAPCP V4 2021 26.02.21 Submitted to Commission Additional update following consultation and finalisation of document
NAPCP V3 2020 09.12.20 Subject to public consultation Significant update to reflect changes in policy and updated inventories and projections
NAPCP V2 2020 13.02.20 Submitted to Commission Minor changes following consultation
NAPCP V1 2019 15.04.19 Subject to public consultation and draft submitted to Commission
n/a

IRL NAPCP Report 2021 Update
3
Table of Contents
Report Details ...................................................................................................................................... 2
Table of Contents................................................................................................................................. 3
List of Acronyms .................................................................................................................................. 8
1 Executive Summary .................................................................................................................... 11
2 Overview of the Report ............................................................................................................... 12
2.1 Programmes and Measures File .......................................................................................... 14
2.2 Public and Stakeholder Consultations .................................................................................. 14
2.2.1 Consultation on the NAPCP .......................................................................................... 14
3 The Policy Framework ................................................................................................................ 16
3.1 Policy priorities and their relationship to priorities set in other relevant policy areas ............. 16
3.2 National Policy Priorities Relevant to Air Quality .................................................................. 17
3.2.1 Clean Air Strategy (CAS) .............................................................................................. 17
3.2.2 Climate Action Plan (CAP) ............................................................................................ 18
3.2.3 Urban Transport-Related Air Pollution Working Group (UTRAP) ................................... 19
3.2.4 Ag-Climatise ................................................................................................................. 20
3.2.5 Food Wise 2025 ............................................................................................................ 20
3.2.6 National Energy and Climate Plan (NECP) ................................................................... 21
3.2.7 National Planning Framework/Project Ireland 2040 ...................................................... 21
3.2.8 The National Development Plan (NDP) 2018-2027 ....................................................... 22

IRL NAPCP Report 2021 Update
4
3.2.9 Energy White Paper ...................................................................................................... 22
3.2.10 National Renewable Energy Action Plan (NREAP) ....................................................... 22
3.2.11 National Energy Efficiency Action Plan (NEEAP) .......................................................... 23
3.2.12 Rural Development Programme (RDP) ......................................................................... 23
3.2.13 Regional Transport Strategies ...................................................................................... 24
3.2.14 National Adaptation Framework (NAF) ......................................................................... 25
3.2.15 COVID-19 Response .................................................................................................... 25
3.3 EU and International Policies and Programmes Relevant to Air Quality ............................... 26
3.3.1 EU Clean Air Policy ...................................................................................................... 26
3.3.2 European Green Deal ................................................................................................... 27
3.3.3 The Common Agriculture Policy (CAgP) ....................................................................... 27
3.3.4 EU Environment Action Programme (EAP) ................................................................... 28
3.3.5 Industrial Emissions Directive ....................................................................................... 28
3.3.6 Medium Combustion Plant Directive ............................................................................. 28
3.3.7 Climate and Clean Air Coalition (CCAC) ....................................................................... 28
3.3.8 Sustainable Development Goals (SDGs) ...................................................................... 29
3.4 Responsibilities attributed to national, regional and local authorities .................................... 29
4 Progress to date - Current Policies and Measures ...................................................................... 31
4.1 Progress to date in relation to NECD obligations .................................................................. 31
4.1.1 Nitrogen Oxides (NOX) .................................................................................................. 32
4.1.2 Sulphur Dioxide (SO2) ................................................................................................... 33
IRL NAPCP Report 2021 Update
5
4.1.3 Non-Methane Volatile Organic Compounds (NMVOC) .................................................. 34
4.1.4 Ammonia (NH3) ............................................................................................................. 35
4.1.5 Particulate Matter (PM2.5) .............................................................................................. 36
4.2 Main existing Policies and Measures delivering progress .................................................... 37
4.2.1 Transport ...................................................................................................................... 37
4.2.2 Residential and Commercial Built Environment............................................................. 39
4.2.3 Electricity Generation .................................................................................................... 43
4.2.4 Agricultural Package ..................................................................................................... 44
4.3 Progress in relation to improving ambient air quality ............................................................ 44
4.3.1 Modelled Concentrations for Ambient Air ...................................................................... 45
4.4 Current transboundary impact of national emissions sources .............................................. 49
5 Projected Progress (‘With Existing Measures’) ............................................................................ 50
5.1.1 NOx ............................................................................................................................... 52
5.1.2 SO2 ............................................................................................................................... 53
5.1.3 NMVOC ........................................................................................................................ 54
5.1.4 NH3 ............................................................................................................................... 55
5.1.5 PM2.5 ............................................................................................................................. 56
6 With Additional Measures Selected for Adoption by Sector ......................................................... 58
6.1.1 Built Environment Sector .............................................................................................. 58
6.1.2 Transport Sector ........................................................................................................... 61
6.1.3 Agricultural Sector ........................................................................................................ 61

IRL NAPCP Report 2021 Update
6
6.1.4 Power Generation and Renewables .............................................................................. 62
6.1.5 Other Industry and Enterprise ....................................................................................... 64
6.1.6 Cross-Sectoral measures ............................................................................................. 64
6.1.7 PaMs for Consideration and Adoption ........................................................................... 66
7 Projected ‘With Additional Measures’ Scenarios ......................................................................... 67
7.1 Projected emission reductions (WAM) ................................................................................. 67
7.1.1 NOx .............................................................................................................................. 68
7.1.2 SO2 ............................................................................................................................... 70
7.1.3 NMVOC ........................................................................................................................ 70
7.1.4 NH3 ............................................................................................................................... 72
7.1.5 PM2.5 ............................................................................................................................. 73
7.2 Non-linear emission reduction trajectory .............................................................................. 74
7.3 Flexibilities ........................................................................................................................... 74
7.4 Projected impacts on ambient air quality and the environment ............................................. 76
8 Additional Policy Options under Consideration ............................................................................ 77
8.1 Agriculture ........................................................................................................................... 78
8.1.1 Teagasc MACC 2020 .................................................................................................... 78
8.1.2 Teagasc National Farm Survey ..................................................................................... 80
8.1.3 Beef Data and Genomics Programme .......................................................................... 80
8.1.4 Knowledge Transfer Programme .................................................................................. 80
8.1.5 Origin Green ................................................................................................................. 81

IRL NAPCP Report 2021 Update
7
8.2 Other Measures ................................................................................................................... 81
8.2.1 Renewable Electricity Support Scheme (RESS) ........................................................... 81
8.2.2 Changes to timeline of Peat Phase Out ........................................................................ 81
9 Appendix 1: WAM Emission Reduction Measures ....................................................................... 83
10 Appendix 2: Programmes and Measures (WAM) by Sector ..................................................... 86
12 Appendix 3: Compliance with emission reduction commitments in the Agriculture sector ........ 90

IRL NAPCP Report 2021 Update
8
List of Acronyms
AAQD Ambient Air Quality and Cleaner Air for Europe Directive
ASHP Air Source Heat Pump
BAT Best Available Techniques
BER Building Energy Rating
BEV Battery Electric Vehicle
CAFÉ Clean Air for Europe
CAP Climate Action Plan
CAgP Common Agricultural Policy
CAS Clean Air Strategy
CCAC Climate and Clean Air Coalition
CoPA The Code of Good Agricultural Practice for the Control of Ammonia Emissions
DAFM Department of Agriculture, Food and the Marine
DECC Department of the Environment, Climate and Communications
DoT Department of Transport
EAP Environment Action Programme
EEA European Environment Agency
EMEP European Monitoring and Evaluation Programme
EPA Environmental Protection Agency
EU European Union
EV Electric Vehicle
FADN Farm Accountancy Data Network
GDA Greater Dublin Area
GHG Greenhouse Gas
GLAS Green Low Carbon Agri-Environment Scheme
HNV High Nature Value
ICE Internal Combustion Engine
IED Industrial Emissions Directive
IPPC Integrated Pollution, Prevention and Control
IIR Informative Inventory Report
LESS Low Emission Slurry Spreading
LIEN Large Industry Energy Network
IRL NAPCP Report 2021 Update
9
LSZ Low Smoke Zone
MACC Marginal Abatement Cost Curve
NAF National Adaptation Framework
NAP Nitrates Action Programme
NCT National Car Testing
NDP National Development Plan
NEEAP National Energy Efficiency Action Plan
NECP National Energy and Climate Plan
NECD National Emissions Ceilings Directive
NFRV Nitrogen Fertiliser Replacement Value
NFS National Farm Survey
NH3 Ammonia
NMP Nutrient Management Planning
NMVOC Non-Methane Volatile Organic Compound
NOx Nitrogen Oxides
NPF National Planning Framework
NREAP National Renewable Energy Action Plan
NSAI National Standards Authority of Ireland
OECD Organisation for Economic Co-operation and Development
O3 Ozone
PfG Programme for Government
PaM Policies and Measures
PM2.5 Particulate Matter with a diameter less than 2.5 microns
PM10 Particulate Matter with a diameter less than 10 microns
RDP Rural Development Programme
SDG Sustainable Development Goals
SE South East
SEAI Sustainable Energy Authority of Ireland
SOX Sulphur Oxides
SR Source Receptor
TAMS Targeted Agricultural Modernisation Schemes
UNECE United Nations Economic Commission for Europe
UTRAP Urban Transport Related Air Pollution
IRL NAPCP Report 2021 Update
10
VRT Vehicle Registration Tax
WAM With Additional Measures
WM/WEM With Existing Measures
WHO World Health Organisation
IRL NAPCP Report 2021 Update
11
1 Executive Summary
Reporting of national air pollutants and air quality is an obligation for all European member states.
Annual emissions of atmospheric pollutants and limits for ambient air quality are primarily regulated in
European member states under the National Emissions Ceilings Directive [2016/2284/EU] (NECD)
and the Ambient Air Quality and Cleaner Air for Europe Directive [2008/50/EC] (AAQD), respectively.
Where a member state anticipates a breach of these directives at the time of the National Air Pollution
Control Programme (NAPCP) drafting, the NAPCP requires that the member state sets out specific
actions to address the potential breach and thereby avoid non-compliance with emission reduction
targets.
The first NAPCP was undertaken before the finalisation of a number of other relevant national policy
frameworks in Ireland in 2019. Their ongoing evolution at that time presented significant challenges in
terms of the sequencing and integration of new official information. The major plans and strategies
under development and refinement at that time included:
• The National Energy and Climate Plan (NECP)
• The National Development Plan (NDP)
• The Climate Action Plan (CAP)
As a result, Ireland’s 2019 NAPCP was not able to set out the agreed programmes and measures that
would bring Ireland into compliance in relation to its commitments to reduced emissions and improved
air quality.
This report has been updated to include the programmes and measures that were finalised after the
previous NAPCP was submitted and have now been included in the most recent national air pollutant
emission inventory and projection data, which was prepared and reported by the Environmental
Protection Agency (EPA)1 in 2020.The report also includes additional information in relation to
proposed measures for ammonia, setting out a pathway to compliance.
1 EPA Informed Inventory Report http://www.epa.ie/pubs/reports/air/airemissions/airpollutantemissions/iir2020/

IRL NAPCP Report 2021 Update
12
2 Overview of the Report
The layout of this document has been guided by the Commission Implementing Decision (EU)
2018/1522 of 11 October 2018 which sets out a common format for the National Air Pollution Control
Programmes under Directive 2016/2284. Further support was drawn from the guidance on the
elaboration and implementation of the NAPCP under the National Emissions Ceiling Directive
(Ricardo, 20182).
The first NAPCP was reviewed by Ricardo Energy and Environment in a report to DG Environment
dated the 8th of June 2020. The review process considered the completeness of the review and
offered a list of identified gaps. In this update of the report we have endeavored to address all the
issues raised as part of the review process.
In relation to the Policies and Measures (PaMs), efforts have been made to properly align them with
the NAPCP. We have added details on policy measure types, clarified timelines and flagged the
responsible authority. The PaM overviews in Appendix 1 and 2 have been updated with assistance
from the EPA which is the relevant competent authority with responsibility for reporting on emission
inventories and projections and PaMs under the NECD and the Convention on Long Range
Transboundary Air Pollution (CLRTAP).
With regard to non-linear progress on NMVOC and NH3 some further detail and discussion of this is
included now in Section 7.3.
As outlined in the previous NAPCP, the timing and sequencing of national emissions inventory and
projections reporting, at a time of substantial policy change, presents a challenge in respect of
aligning the NAPCP with the publication of relevant national plans and the associated updating of the
national emissions inventory and projections for official reporting.
The major changes in this document are associated with updated national emissions inventory and
projections data, updated ambient air metrics, inclusion of further analysis on impacts from key
2 Circulated from the Commission – Ricardo reference - Ricardo/ED61728/Issue Number 6
IRL NAPCP Report 2021 Update
13
defined national policies and a discussion of the role of adjustments3 in the context of NOX and
NMVOC. There is also a particular focus on the NH3 compliance challenge and national progress on
defining a clear compliance pathway on foot of a recently published marginal abatement cost curve
(MACC) analysis.
Section 3 will outline the most recent national, European and international policy developments which
are relevant to air quality in Ireland.
Section 4 will demonstrate the progress made to date and outlines the key policies as included in the
2020 Informative Inventory Report (IIR) prepared by the EPA under the ‘with measures scenario’
detailing those which have already been adopted to deliver improvements; the impact of these
policies on future emission projections of air pollutants and air quality in Ireland is set out in Section 5.
Section 6 outlines the key additional measures that are described in the relevant national policy
documents which will have additional effects on future emissions of air pollutants and air quality. The
impacts of these policy measures as set out in the most recent national emission projections under
the ‘with additional measures’ scenario are outlined in Section 7.
There is a recognition that the PaMs which were included in the most recent national emission
projections prepared by the EPA are not sufficient to bring Ireland into compliance for certain air
pollutants. Section 8 will set out some of the policies and measures that have been adopted but are
not yet been included in the official national emission projections. These measures set out some of
the additional actions that will be taken to achieve compliance with the Directive in the coming years.
3 As per Annex IV, Part 4 NEC Directive

IRL NAPCP Report 2021 Update
14
2.1 Programmes and Measures File
For this NAPCP update, the PaMs file has been updated to quantify and detail the key measures
adopted by Ireland and their contribution to abatement in the context of the latest April 2020 WAM
projection scenario, consistent with the updated national submission under the NECD (2020 EPA IIR).
The PaMs file will be submitted via the webtool following the submission of the main NAPCP
document. Details that had previously only been provided in the PaMs file are now incorporated into
the main body of this report.
Outlooks have been updated and these are clearly reported. However, whilst the 2020 WAM
projection scenario for NH3 reports progress from the last NAPCP, it does not yet show compliance.
As signalled above, the constraint arises in so far as Ireland cannot alter the officially submitted WAM
projection at this point due to the projections modelling cycle and more recently published information.
As an interim alternative, a projection for NH3 that goes above and beyond the national WAM
projection scenario has been provided to incorporate the measures identified in new policy documents
which are expected to deliver compliance. These updated measures should feature in the forthcoming
official projections in March 2021 and are included in Section 8.
2.2 Public and Stakeholder Consultations
This NAPCP reporting format incorporates elements from a number of connected National strategies
and plans such as the programmes listed below which have all undergone individual consultation
processes.
• Clean Air Strategy
• National Energy Climate Plan
• National Planning Framework
• Ireland’s Long-term Strategy on Greenhouse Gas Emissions Reduction
• Ag-Climatise
• The National Climate Action Plan
2.2.1 Consultation on the NAPCP
A draft of the first NAPCP was subject to public consultation over the period 15 April 2019 to 5 July
2019. Over this period, 10 submissions were received, and these are available online at the following
link:
IRL NAPCP Report 2021 Update
15
https://www.gov.ie/en/consultation/b8d3e-public-consultation-on-the-national-air-pollution-control-
programme/
This update to the NAPCP was subject to public consultation over the period 9 December 2020 to 22
January 2021. Over this period, 72 unique submissions were received. A summary of the submissions
and additional details will be available shortly at https://www.gov.ie/en/consultation/cf380-public-
consultation-on-the-national-air-pollution-control-programme-napcp/.
Consideration was given to the submissions in the finalisation of this NAPCP update. Where it was
not possible or appropriate to include them, they have been considered in the finalisation of the Clean
Air Strategy and in the ongoing work of the Department.
IRL NAPCP Report 2021 Update
16
3 The Policy Framework
EU Decision 2018/1522 reference Section 2.2.1
3.1 Policy priorities and their relationship to priorities set in
other relevant policy areas
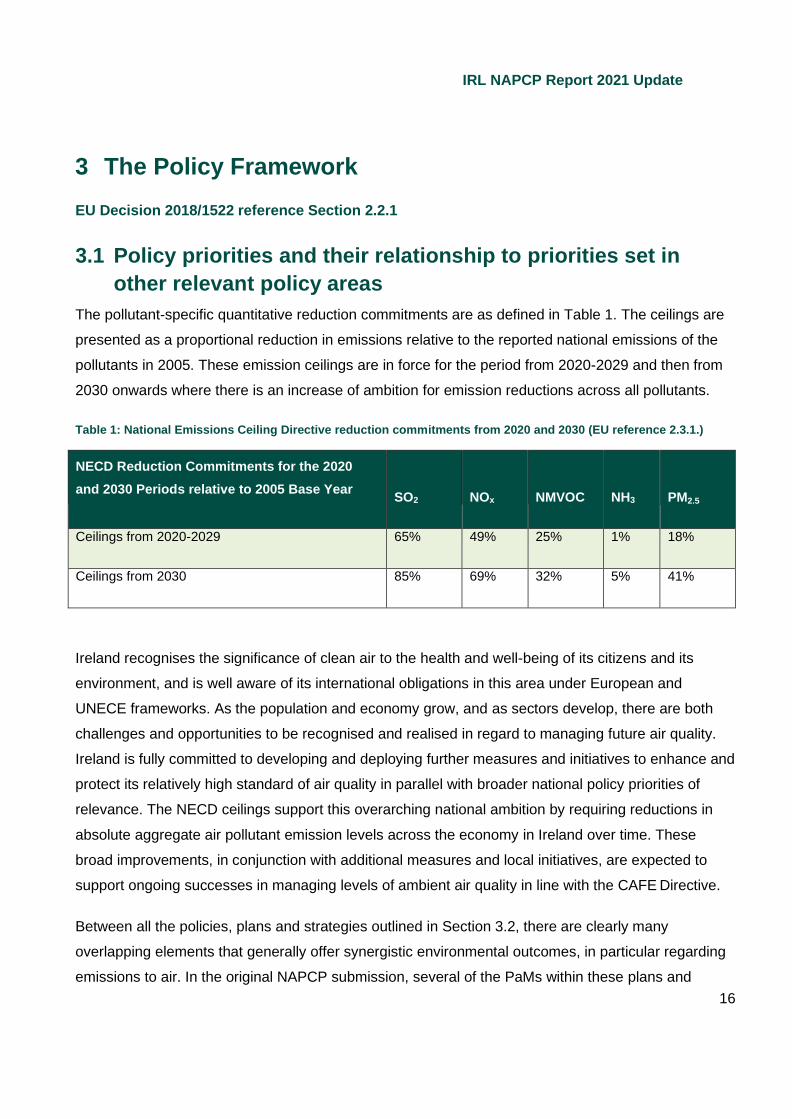
The pollutant-specific quantitative reduction commitments are as defined in Table 1. The ceilings are
presented as a proportional reduction in emissions relative to the reported national emissions of the
pollutants in 2005. These emission ceilings are in force for the period from 2020-2029 and then from
2030 onwards where there is an increase of ambition for emission reductions across all pollutants.
Table 1: National Emissions Ceiling Directive reduction commitments from 2020 and 2030 (EU reference 2.3.1.)
NECD Reduction Commitments for the 2020
and 2030 Periods relative to 2005 Base Year
SO2
NOx
NMVOC
NH3
PM2.5
Ceilings from 2020-2029 65% 49% 25% 1% 18%
Ceilings from 2030 85% 69% 32% 5% 41%
Ireland recognises the significance of clean air to the health and well-being of its citizens and its
environment, and is well aware of its international obligations in this area under European and
UNECE frameworks. As the population and economy grow, and as sectors develop, there are both
challenges and opportunities to be recognised and realised in regard to managing future air quality.
Ireland is fully committed to developing and deploying further measures and initiatives to enhance and
protect its relatively high standard of air quality in parallel with broader national policy priorities of
relevance. The NECD ceilings support this overarching national ambition by requiring reductions in
absolute aggregate air pollutant emission levels across the economy in Ireland over time. These
broad improvements, in conjunction with additional measures and local initiatives, are expected to
support ongoing successes in managing levels of ambient air quality in line with the CAFE Directive.
Between all the policies, plans and strategies outlined in Section 3.2, there are clearly many
overlapping elements that generally offer synergistic environmental outcomes, in particular regarding
emissions to air. In the original NAPCP submission, several of the PaMs within these plans and

IRL NAPCP Report 2021 Update
17
strategies were captured, in summary form, to convey the level of activity in this context within Ireland.
There was also a more detailed focus on those PaMs that were identified to help address the
anticipated exceedance for NH3 in the 2020 and 2030 NECD phases, as well as the NOX and NMVOC
exceedances for the 2030 NECD phase. However, there remained a shortfall in regard to the requisite
level of NH3 abatement under the WAM scenario projection, and this has necessitated the
development of this updated NAPCP.
Under the policy priorities section below, a number of national and international policy priorities are
identified and discussed briefly. However, this is not intended to be a comprehensive overview of all
policy developments; instead, these are included so as to highlight other complementing policy
priorities in the system. In many cases there is a direct relationship between these policies and their
impact on air pollution control in Ireland which is reflected in the programmes and measures outlined
in sections 4 and 6. Conversely, while many may lead to improvements in air quality, their specific
contributions are not easily quantified.
Finally, Ireland had a general election in February 2020 with coalition Government formation talks
having concluded in June 2020. There is now a new Programme for Government4 (PfG) which will
guide new policy formation over the next five years. At the present moment it is too early to
incorporate new elements from this programme; however, it is credible to assume that it will introduce
further additional policy change in the system in the coming years.
3.2 National Policy Priorities Relevant to Air Quality
3.2.1 Clean Air Strategy (CAS)
The Clean Air Strategy will provide the strategic policy framework necessary to identify and promote
integrated measures across government sectors and policy arenas that are required to reduce air
pollution and promote cleaner air, whilst delivering on wider national policy objectives. Having this
national framework strategy will also assist Ireland in developing the necessary policies and
4 Programme for Government 2020
IRL NAPCP Report 2021 Update
18
measures to support compliance with evolving EU and international air quality ambitions and will
facilitate integration with ambitious climate policies.
The CAS is the strategic complement to the more technical NAPCP and will ensure the delivery of
increased ambition in the transport, energy, home heating and agriculture sectors. It should be noted
that finalising the CAS has not impacted upon the ongoing work of the Department in ensuring
improvements in air quality.
The key priorities for the Clean Air Strategy are to:
• Increase ambition in addressing all sources of air pollution; • Ensure the integration of clean air considerations into policy development across
Government; • Increase the evidence base that will help us to continue to evolve our understanding of the
sources of pollution in order to address them more effectively; • Enhance regulation and improve the effectiveness of our enforcement systems; • Promote and increase awareness of the importance of clean air; and, • Ensure effective oversight and cross-sectoral action to reduce emissions
3.2.2 Climate Action Plan (CAP)
The Climate Action and Low Carbon Development Act 2015 set a plan to shift Ireland onto a pathway
of rapid decarbonisation. It initiated the development of the National Mitigation Plan for de-
carbonisation, reflecting in particular the central roles of the key Ministers responsible for sectors such
as electricity generation, the built environment, transport and agriculture. The initial plan has now
been superseded by the Climate Action Plan 2019 – which is a new all-of-Government strategy that
defines clearer timelines and responsibilities for more ambitious climate actions. The current CAP
includes a number of highly relevant actions to realise the synergies between coherent air and climate
policy. Two major examples include the ambition for road transport fleet electrification, as well as an
ambitious strategy to support the retrofitting of 400,000 homes with heat pump technology. Whilst the
focus for the heat pump target is on the large number of oil fired heating systems in Ireland, there is
also scope for substantial residential sector air emission reductions where a partial focus is placed on
the solid fuel burning heat market in Ireland. The synergistic potential of these measures for climate
policy, and both NECD and AAQ emission outcomes, are the subject of ongoing research that will be
shared once available, and incorporated into future updates.

IRL NAPCP Report 2021 Update
19
Since the completion of the first NAPCP, the Climate Action Plan 2019 has also been completed and
this serves as the main document in regard to defining the actions and measures to be taken as part
of efforts to meet national climate policy goals in Ireland, as well as recognising areas of co-benefits
for national air pollution outcomes. Many measures from the CAP are included in the most recent
official projections (June 2020) With Additional Measures (WAM) scenario. The CAP is an all-of-
Government ‘living’ document that identifies a range of specific actions and timelines for progress on
climate action within Ireland. There is of course overlap and alignment with other national and
regional plans and strategies. The plan was first released in 2019 and will be updated over time, with
the first such update planned for mid-2021. The Programme for Government (PfG) adopted by the
new Government in June 2020 is also expected to further influence the plan as part of the next
update, with an expectation for further environmental action and ambition.
The Climate Action and Low Carbon Development (Amendment) Bill is an ambitious piece of
legislation which is currently being finalised. It commits Ireland, in law, to move to a climate resilient
and climate neutral economy by 2050, thereby aligning with broader EU wide ambitions for 2050.
3.2.3 Urban Transport-Related Air Pollution Working Group (UTRAP)
While air pollutant emissions levels in Ireland were generally below EU limits in 2018, the ‘Urban
Environmental Indicators’ report published by the EPA in July 2019 suggested that on certain heavily
trafficked streets in Dublin, nitrogen dioxide (NO2) levels were higher than previously indicated and
may even exceed the ambient air quality limits.
In response to this report, the Urban Transport-Related Air Pollution Working Group (UTRAP)5 was
jointly convened by the Department of the Environment, Climate and Communications (DECC) and
the Department of Transport (DoT) in autumn 2019.
The primary aim of the group is to examine transport-related air pollution and to develop an evidence-
based national policy framework within which local authorities can address the current observed
exceedance and any future exceedances.
5 https://www.gov.ie/en/publication/3f634-urban-transport-related-air-pollution-utrap-working-group/
IRL NAPCP Report 2021 Update
20
An interim progress report will be published in Q1 2021, which will provide detailed background
information in relation to urban transport issues, ongoing work in the area and initial recommendations
for action.
In addition, following the completion of a demand management study focused on five cities (Dublin,
Cork, Limerick, Galway and Waterford), a final report will be published later in 2021 which will detail a
suite of recommendations designed to support a decrease in NO2 levels in the urban environment.
3.2.4 Ag-Climatise
Ag-Climatise6 is a new national roadmap dealing specifically with air and climate emissions from the
agri-food sector in Ireland to 2030 and beyond. Given the considerable challenge posed in respect of
ammonia emissions abatement in Ireland, this strategy for the agriculture sector is pivotal in terms of
setting the new trajectory for compliance with ammonia emission reduction commitments into the
future. The document underwent a public consultation that concluded at the start of 2020. The report
was published in December 2020.
The document draws upon an updated marginal abatement cost curves developed for the agriculture
sector for both ammonia and greenhouse gases, and inter alia defines the policy roadmap for
compliance in regard to both air and climate goals on the time horizon to 2030 and beyond. As noted,
the programmes and measures outlined in Ag-Climatise are not yet fully represented in the official
emission projections, however it is anticipated that this will be addressed as part of the official 2021
projections.
3.2.5 Food Wise 2025
Food Wise 2025 set out a ten-year plan for the agri-food sector and was part of a series of rolling ten-
year strategies for the sector. Food Wise 2025 identified global growth opportunities which the sector
could benefit from, including: the ending of milk quotas; a reputation for food safety and controls; a
natural competitive advantage in grass-based production; and a world class agri-food industry backed
by strong State support services.
6 https://www.gov.ie/en/publication/07fbe-ag-climatise-a-roadmap-towards-climate-neutrality/

IRL NAPCP Report 2021 Update
21
Food Wise 2025 included more than 400 detailed recommendations, spread across the cross-cutting
themes of innovation, human capital, market development, competitiveness, and sustainability. It
projected ambitious growth in exports (an increase of 85% to €19 billion) and employment (an
increase of 23,000 in direct and indirect jobs) by 2025. Its successor, an agri-food strategy for 2030, is
currently being developed.
While such strategies in the agriculture sector could introduce pressure on absolute emissions
through the higher levels of activity and herd sizes, this is also an important national and regional
sector. As such, managing the balance of policy priorities is important in this context and any increase
in activity should be balanced by a concurrent increase in efficiency and the use of appropriate
abatement measures to ensure compliance with Ireland’s air quality commitments.
3.2.6 National Energy and Climate Plan (NECP)
The NECP addresses national ambitions and actions in relation to renewable energy, energy
efficiency and climate actions in Ireland. Under Regulation (EU) 2018/1999 (‘the Governance
Regulation’) Ireland is required to submit the NECP to the European Commission, in a similar vein to
the NAPCP.
The NECP7 was submitted to the European Commission in the latter part of 2020. It considers the
energy and climate developments to date, and levels of demographic and economic growth, and it
includes all the climate and energy measures set out in the National Development Plan 2018-2027.
Further iterations of the plan will take account of additional measures and policies such as may be
included in the evolving Climate Action Plan.
3.2.7 National Planning Framework/Project Ireland 2040
The National Planning Framework has been developed under Project Ireland 2040 by the Department
of Housing and Local Government. The framework operates as the overarching policy and planning
strategy for the social, economic and cultural development of Ireland. The focus of the NPF is to
manage and support population growth so that the growth is sustainable in economic, social and
environmental terms.
7
https://www.gov.ie/en/consultation/105804-irelands-draft-national-energy-and-climate-plan-necp-2021-2030/

IRL NAPCP Report 2021 Update
22
3.2.8 The National Development Plan (NDP) 2018-2027
The NDP is a public capital investment programme which presents a sustainable economic
development plan for Ireland to guide development patterns and related investments while
underpinning the National Planning Framework (NPF)/Project Ireland 2040. Action 8 of the NDP
outlines investment priorities to support the transition to a low-carbon and climate resilient society.
3.2.9 Energy White Paper
The White Paper 'Ireland's Transition to a Low Carbon Energy Future 2015-2030' is an energy policy
document. It sets out a framework for the energy sector on a time horizon to 2030 to address three
core energy policy objectives – sustainability, security of supply and competitiveness. The paper
takes into account European and international climate change objectives and agreements, as well as
Irish social, economic and employment priorities. This plan is focused on guiding the provision of a
stable and secure supply of affordable clean energy in Ireland.
3.2.10 National Renewable Energy Action Plan (NREAP)
Article 4 of Directive 2009/28/EC (‘the Renewable Energy Directive’) requires that each Member State
adopts and submits to the European Commission an NREAP. The NREAP sets out individual national
targets for the renewable share of energy in 2020. There is a requirement that a report on progress be
submitted to the European Commission every two years with the final report to be submitted in
December 2021. To date, Ireland has submitted four reports, in 2012, 2014, 2016 and 2018. A 2020
update report8 by the Sustainable Energy Authority of Ireland (SEAI) reports that for 2018, the
renewable share of electricity (RES-E) was 33.2%, renewable share of heating (RES-H) was 6.5%,
renewable share of transport (RES-T) was 7.2%, and the overall RES share was 11%. The targets for
2020 are RES-E 40%, RES-H 12%, RES-T 10% and an overall energy Renewable Directive target of
16%. Thus, Ireland is currently not on track to comply with the 2020 renewable energy targets9.
However, the direction of change is positive, and transitions in regard to renewable energy can have
positive impacts on national air pollution emissions, albeit that transition to certain fuels (e.g. biomass)
can present challenges for air quality.
8 https://www.seai.ie/publications/2020-Renewable-Energy-in-Ireland-Report.pdf
9 https://www.seai.ie/data-and-insights/seai-statistics/key-publications/renewable-energy-in-ireland/
IRL NAPCP Report 2021 Update
23
3.2.11 National Energy Efficiency Action Plan (NEEAP)
In 2009 Ireland set a target to improve energy efficiency by 20% by 2020, which would equate to
31,925GWh energy savings. The public sector committed itself to an even greater challenge of
improving energy efficiency by 33% by 2020. Article 24 of the Energy Efficiency Directive required
Member States to submit a NEEAP every three years. Ireland has submitted four NEEAPs to date
with the 4th iteration10 having been submitted in 2017. This most recent version provides a
comprehensive overview on progress towards targets, measures in place to ensure targets are met
and strategies and policies in place across residential, commercial, transport and public sectors.
Energy efficiency actions are often categorised as win-wins in the context of air pollution and climate
emissions abatement, and thus progress on this plan is relevant in the overall context of the NAPCP.
Following the publication of legislation under the EU’s Clean Energy Package in 2018 Member States
no longer have to submit NEEAPs. Reporting requirements in relation to energy efficiency have
transferred into the National Energy and Climate Plan.
Whilst progress has been delivered, final determinations for 2020 have yet to be made. Based on
latest available data, Ireland had achieved 60% of the energy efficiency 2020 target (i.e. 12.1 of the
20%) at end of 2018. The SEAI’s latest projection for 2020 is to achieve 16% improvement of the 20%
target.
3.2.12 Rural Development Programme (RDP)
The RDP is part of the EU’s Common Agricultural Policy (CAgP) and co-ordinates support for
Member States’ agricultural sectors. Ireland submitted the eighth amendment of its RDP11 in July
2020. Broadly, the RDP sets out information regarding direct payments to farmers and market
measures, and rural development measures relevant to environment and climate change. Some
measures of note in the Irish RDP are training delivered in support of the Green Low-Carbon Agri-
10
https://www.gov.ie/en/publication/93ee2-national-energy-efficiency-action-plan-neeap/
11 RDP Summary Booklet - https://www.agriculture.gov.ie/ruralenvironmentsustainability/ruraldevelopmentprogrammerdp2014-2020/

IRL NAPCP Report 2021 Update
24
Environment Scheme (GLAS)12 and the Organic Farming Scheme. The former measure encourages
farmers to engage in environmentally neutral actions by offering a (maximum) payment of €5,000 per
annum based on adopted actions. The latter scheme supports conversion of traditional farmland into
organic farms. In broad terms the RDP is an important programme with regard to delivering support
and change across the agricultural sector through, amongst other measures, the various knowledge
transfer programs. The RDP is also relevant as a conduit by which the increased implementation of
emission abatement actions in the agriculture sector might be delivered.
3.2.13 Regional Transport Strategies
The Greater Dublin Area (GDA) strategy13 provides a transport planning policy and urban logistical
plan for Dublin city and the many surrounding commuter towns. The level of transport activity in the
GDA means that actions in this region are particularly relevant in regard to road transport emissions
for Ireland. This regional program includes delivery of better public transport systems, land use
planning, and environmental protection for Ireland’s most densely populated region. It is a multi-
sectoral framework, and incorporates initiatives from regional planning authorities, housing
authorities, public transport authorities and citizens.
The GDA strategy also works to deliver objectives set out under “Smarter Travel – A Sustainable
Transport Future”, which aims to decrease private car use, and includes localised measures to
enhance land use integration and to introduce behavioural change programmes to promote multi-
modality, thereby reducing the dependence on private cars. Ultimately, this strategy aims to manage
transport and travel in the GDA in an efficient and sustainable manner. It has particularly strong
relevance to national air quality ambitions, given the efforts to enable and encourage travel by non-
motorised modes and to support the increased penetration of cleaner transport technology throughout
the national fleet. It is also an area that will be affected by the realities of the COVID-19 response, at
12 Farmer Schemes Payment - https://www.agriculture.gov.ie/farmerschemespayments/glas/ 13 Transport strategy for Greater Dublin Area - https://www.nationaltransport.ie/wp- content/uploads/2016/08/Transport_Strategy_for_the_Greater_Dublin_Area_2016-2035.pdf
IRL NAPCP Report 2021 Update
25
least in the short term. There are comparable plans for Galway14 and Cork15, as well as draft
strategies for other major regions in Ireland such as Limerick/Shannon.
3.2.14 National Adaptation Framework (NAF)
Developed under the Climate Action and Low Carbon Development Act of 2015, Ireland’s first
National Adaptation Framework (NAF) was published on the 19th of January 2018. The NAF outlines
a whole of government and society strategy to reduce the country’s vulnerability to the negative
effects of climate change and to capitalise on positive potential. The NAF includes a summary of
projected global climate change, European and international policy drivers for adaptation, a summary
of climate change impact estimates for Ireland, progress to date on adaptation planning in Ireland,
proposals for local authority or regional level adaptation strategies, and implementation and
governance arrangements.
3.2.15 COVID-19 Response
The responses to the COVID-19 outbreak and the associated lockdowns have had an impact on
activities across many sectors, and this will certainly impact on emission levels in 2020. Early
indications confirm net reductions in emissions from energy industries and the transport sector,
alongside an increase in residential sector emissions16, as might be expected. Agricultural emissions
do not appear to have been affected. Into the future, various COVID-19 responses may continue to
have an impact on air quality. There may be a shift to cycling/walking as people avoid mass transit
modes, however, there may similarly be an increase in low-occupancy private car trips due to fears
around public transport and the reduced operating capacities that are now in place.
The extent to which these shifts in behaviour occur and the question as to whether they will lead to
sustained shifts in behaviour over the longer term is highly uncertain. Furthermore, whilst increased
remote working may have a tangible and sustained impact on travel demand and associated
14 Galway transport strategy - https://www.nationaltransport.ie/planning-and-investment/strategic-planning/regional- transport-strategies/galway-transport-strategy/ 15 Cork metropolitan area transport strategy - https://www.nationaltransport.ie/planning-and-investment/strategic- planning/regional-transport-strategies/cork-metropolitan-area-transport-strategy/ 16
Impact of pandemic on GHG Emissions| SEAI

IRL NAPCP Report 2021 Update
26
emissions, the scale of effects will vary by location and over time. There is considerable uncertainty
as to how much of this COVID-19 triggered change will remain into the future.
These impacts of COVID-19 and the expected responses over the longer term are not captured in the
emission projections included in this updated NAPCP report. However, the expectation is that there
will be recognition of COVID-19 related actions and outcomes in the 2021 national emission
projections submission, and of course in the 2022 national emission inventory submission for the year
2020. On balance the expectation is that the net aggregate outcome in respect of air pollutant
emissions will be favourable overall for air quality in Ireland.
3.3 EU and International Policies and Programmes Relevant to
Air Quality
3.3.1 EU Clean Air Policy
In a broader context, Ireland is implementing the EU Clean Air Package, which contains a suite of
policies and legislative proposals. The main components include the Clean Air Programme for
Europe, the National Emission Ceilings Directive (NECD), and the Directive to reduce pollution from
medium-sized combustion installations. These are all directly relevant to the NAPCP and national
efforts to address air pollution emissions and to deliver and defend higher standards of ambient air
quality for all citizens and the broader environment.
In late 2019, the European Commission carried out a fitness check of the Ambient Air Quality
Directives17. This entailed a retrospective analysis of whether EU actions are fit for purpose and to
identify regulatory burdens, overlaps, gaps and inconsistencies. The analysis indicated that while the
Directives are broadly fit for purpose, there was scope for improvement in several areas such as the
level of investment in monitoring networks and modelling capacity.
17 https://ec.europa.eu/environment/air/quality/aqd_fitness_check_en.htm
IRL NAPCP Report 2021 Update
27
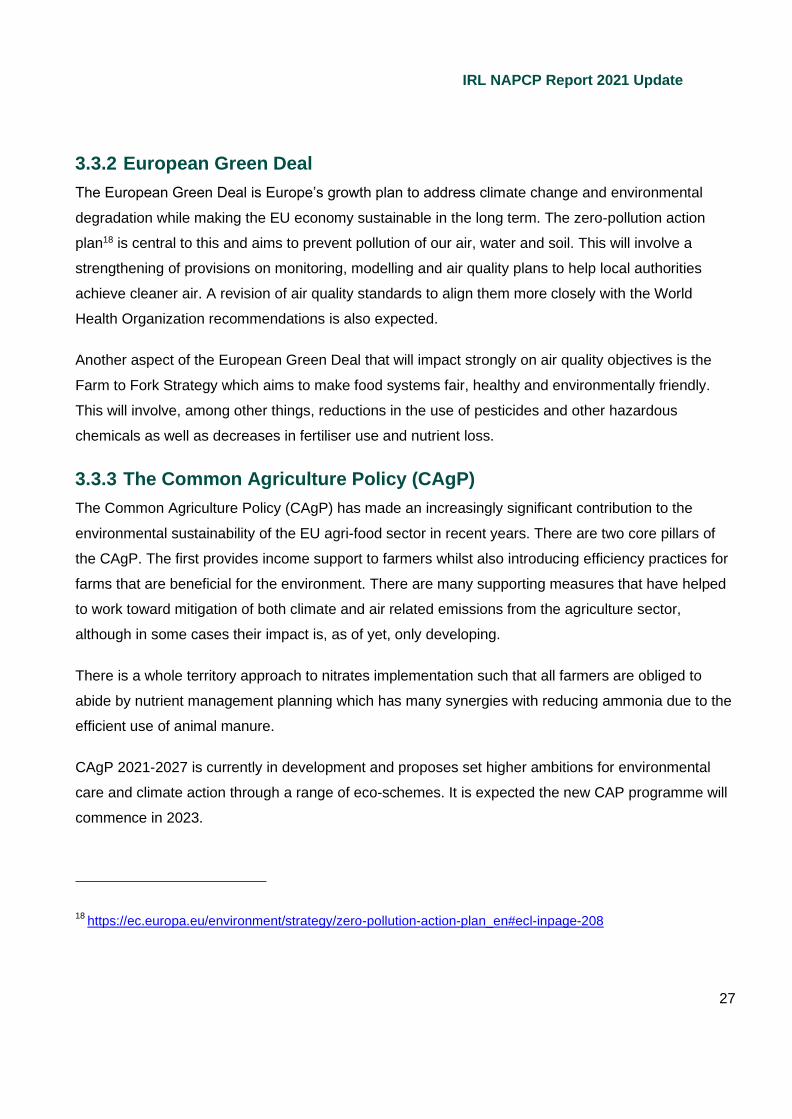
3.3.2 European Green Deal
The European Green Deal is Europe’s growth plan to address climate change and environmental
degradation while making the EU economy sustainable in the long term. The zero-pollution action
plan18 is central to this and aims to prevent pollution of our air, water and soil. This will involve a
strengthening of provisions on monitoring, modelling and air quality plans to help local authorities
achieve cleaner air. A revision of air quality standards to align them more closely with the World
Health Organization recommendations is also expected.
Another aspect of the European Green Deal that will impact strongly on air quality objectives is the
Farm to Fork Strategy which aims to make food systems fair, healthy and environmentally friendly.
This will involve, among other things, reductions in the use of pesticides and other hazardous
chemicals as well as decreases in fertiliser use and nutrient loss.
3.3.3 The Common Agriculture Policy (CAgP)
The Common Agriculture Policy (CAgP) has made an increasingly significant contribution to the
environmental sustainability of the EU agri-food sector in recent years. There are two core pillars of
the CAgP. The first provides income support to farmers whilst also introducing efficiency practices for
farms that are beneficial for the environment. There are many supporting measures that have helped
to work toward mitigation of both climate and air related emissions from the agriculture sector,
although in some cases their impact is, as of yet, only developing.
There is a whole territory approach to nitrates implementation such that all farmers are obliged to
abide by nutrient management planning which has many synergies with reducing ammonia due to the
efficient use of animal manure.
CAgP 2021-2027 is currently in development and proposes set higher ambitions for environmental
care and climate action through a range of eco-schemes. It is expected the new CAP programme will
commence in 2023.
18
https://ec.europa.eu/environment/strategy/zero-pollution-action-plan_en#ecl-inpage-208

IRL NAPCP Report 2021 Update
28
3.3.4 EU Environment Action Programme (EAP)
The 7th EU Environment Action Programme, which ran until 2020, set down certain policy and
legislative statements to be followed by the Member States. The programme sought reductions in air
pollution and its impacts on ecosystems and biodiversity by 2020 so as not to exceed critical loads
and levels. The 8th EU Environment Action Programme19 is currently under development.
3.3.5 Industrial Emissions Directive
The Industrial Emissions Directive has been developed by the EU to regulate pollution arising from
industrial activities. It involves licensing of all such activities that fall under this Directive. The
Directive, whose implementation in Ireland is overseen by the EPA, lays down rules on the integrated
prevention and control of pollution arising from industrial activities. Specific regulations contained
within the Directive provide for the application for licenses or revised licenses and consideration by
the EPA of objections. This can include the holding of hearings and public participation procedures
associated with the industrial emissions licensing system administered by the EPA. The IED plays an
important role in addressing emissions and driving progress across Irish industry.
3.3.6 Medium Combustion Plant Directive
The EU Medium Combustion Plant Directive (EU 2015/2193) was transposed into Irish regulations in
2017. Their purpose is to limit emissions to the atmosphere from boilers and other stationary
combustion plants in the 1-50 MWTH (thermal input) range. It covers all fuel types.
New MCPs are required need to meet specified Emission Limit Values (ELVs), while operators of
existing MCPs will not be required to meet specified ELVs until 2025 at the earliest. This will assist in
limiting the impact on human health, vegetation and biodiversity which can be caused by air pollution.
3.3.7 Climate and Clean Air Coalition (CCAC)
The Climate and Clean Air Coalition is an initiative under the auspices of the United Nations
Environment Programme focused on addressing short-lived climate pollutants on a global scale.
Importantly, the CCAC approach integrates clean air and climate action efforts in an integrated way to
19
https://ec.europa.eu/environment/strategy/environment-action-programme-2030_en
IRL NAPCP Report 2021 Update
29
deliver improved outcomes across both themes. The CCAC was formed in 2012, with Ireland joining
in 2013.
3.3.8 Sustainable Development Goals (SDGs)
The 17 Sustainable Development Goals developed by the United Nations have led to Ireland’s
formulation of the 2030 Agenda for Sustainable Development, known as the National Implementation
Plan 2018 - 202020, which lays out Ireland’s path to implement the Sustainable Development Goals
from 2018 through to the end of 2020. It identifies awareness, participation, supports and policy
alignment as strategic priorities to guide implementation. The Plan also sets out 19 specific actions to
implement over the duration of the first National Implementation Plan following the above-mentioned
strategic priorities. A total of 169 targets have been identified, and through an ‘SDG matrix’, have
been assigned to the responsible Government Departments. It is aligned with the policy documents
produced for education, agriculture, climate policy, and rural development, amongst others.
3.4 Responsibilities attributed to national, regional and local
authorities
This section provides details of the various bodies with responsibilities relevant to the NAPCP. The
table below (Table 2) includes a list of the principal relevant authorities. In each case the type of
authority is indicated (e.g. government, inspectorate, agency), along with their responsibilities in the
context of national air quality and air pollution management.
DECC also continues to engage with a much broader set of stakeholders across government and in
the private and NGO sector.
20 National Implementation Plan - https://assets.gov.ie/19344/32f9bdd2aae2464caae37760edd1da04.pdf

IRL NAPCP Report 2021 Update
30
Table 2: Responsibilities attributed to national, regional and local authorities (EU reference 2.3.2.)
Name of Authority Attributed responsibilities in the areas of air quality and air pollution
Source sector under the responsibility of the authority
National Authorities (M)
Department of Agriculture, Food and the Marine (DAFM)
- Policy making role - Coordinating role - Implementation role - Enforcing role; both direct and
indirect. - Reporting and monitoring role
Agriculture
Department of the Environment Climate Action and Communications, (DECC)
- Policy making role - Coordination role - Implementation role - Reporting and monitoring role
Energy, Communications, Natural Resources, Climate Action, Environment
Department of Transport - Policy making role - Implementation role
Transport
Department of Housing, Local Government and Heritage
- Policy making role - Implementation role - Enforcement role
Built and Natural Environment
Department of Finance - Policy making role Fiscal Policy
Office of the Revenue Commissioners - Implementation role - Enforcement role
Taxation measures
Environmental Protection Agency - Coordination role - Enforcement role - Reporting and monitoring role - Other (research)
Energy Generation, Industry, Local Authorities
Sustainable Energy Authority of Ireland - Implementation role - Reporting and monitoring role - Other (research)
Energy, Residential Public Industry
Teagasc - Reporting and monitoring role (National Farm Survey)
- Other (knowledge transfer) - Other (research)
Agriculture
Regional authorities (M)
Agriculture Knowledge Transfer (KT) Agents
- The KT agents work closely with farmers to support the uptake of modern technologies and practices across Irish farms.
Agriculture
County and City Authorities - Implementation role - Enforcement role - Reporting and monitoring role
Built Environment e.g. solid fuels, Agriculture, Industry

IRL NAPCP Report 2021 Update
31
4 Progress to date - Current Policies and Measures
EU Decision 2018/1522 reference section 2.4
In this section we detail the progress made by current PaMs in reducing national annual emissions of
air pollutants and improving ambient air quality. Progress in relation to the NECD ceilings are dealt
with in Section 4.1 and ambient air quality is discussed in Section 4.3. In these sections we also
broadly identify the major PaMs introduced in Ireland to drive progress in reducing emissions across
the NECD pollutants.
4.1 Progress to date in relation to NECD obligations
EU Decision 2018/1522 reference section 2.4.1
The following datasets relating to annual emissions of NECD pollutants are derived directly from
official national emission inventory and projections submissions which were published in June 2020
by the EPA. Commentary is further informed by the latest Informative Inventory Report (IIR), which
offers the most comprehensive detail in regard to how and why historical emissions have changed
over time. Further information and commentary on the latest emission projections are also included in
the IIR and the latest greenhouse gas emissions projections methodology report21. The relevant
datasets and reports can be directly sourced at the following links:
• Ireland’s latest inventory and projected emissions of air pollutants (2020 release)
• Ireland’s latest informative inventory report (2020 release)
• Ireland’s latest NECD projected emissions (2020 release)
• Ireland’s GHG projections methodology report (2020 release)
21 The projections methodology report is focused on the GHG projections, but many of the measures and detail are also relevant in an air pollution context also.

IRL NAPCP Report 2021 Update
32
4.1.1 Nitrogen Oxides (NOX)
In terms of compliance with NECD ceilings, Ireland has been in compliance for NOx since 2011. Road
transport is the principal source of NOx emissions in Ireland at present, accounting for 33% of total
national NOx emissions in 2018. Within that sector, passenger cars and heavy duty vehicles are the
most significant emitters. Increased shares of diesel vehicles in the fleet, along with a recovering
economy, have been two of the more important developments seen in the transport sector to 2018 in
regard to NOX emissions. The ongoing recovery of activity levels in the construction industry up to
2018 has also seen manufacturing and construction accounting for almost 9% of total national
emission of NOx in 2018. This is largely due to increased cement production. Adjustments22 have
been made in relation to NOx emissions in compliance with EU Directive 2016/2284. These
adjustments have been applied to emissions for all years from 2010-2018.
Figure 1: Emission Trend for Nitrogen Oxides 1990-2018 (EPA, 2020)
22 As per Annex IV, Part 4 NEC Directive
200
180
160
140
120
100
80
60
40
20
0
Power Stations
Agriculture/Forestry/Fishing
Other
Industrial
Transport
Residential & Commercial
Agriculture
Kt
NO
x
1990
1991
1992
1993
1994
1995
1996
1997
1998
1999
2000
2001
2002
2003
2004
2005
2006
2007
2008
2009
2010
2011
2012
2013
2014
2015
2016
2017
2018

IRL NAPCP Report 2021 Update
33
4.1.2 Sulphur Dioxide (SO2)
Ireland has been in compliance with the NECD ceilings for SO2 since 2010 and emissions of SO2
have been steadily reduced over a long period of time, with a 93% reduction in emissions in 2018 as
compared to 1990 levels. Emissions of SO2 peaked in 1998 due largely to high consumption rates of
coal, oil and peat mainly for pubic electricity and heat generation. The subsequent reduction in
emissions has occurred across all source sectors, most notably from public electricity and heat
generation, which has decreased by over 96% in 2018 from 1990 levels. The use of cleaner fuels
supported by enhanced sulphur controls in power generation, residential combustion and transport,
as well as effective licensing and enforcement by the EPA, have all contributed to these steady and
sustained reductions in this important acidifying precursor. As of 2018 the residential and commercial
sectors account for half of total national SO2 emissions. Public electricity and heat generation and
industry make up much of the balance. Into the future, controls related to residential fuel use will grow
in relative importance where there are ambitions for even more aggressive reductions in SO2
emissions.
Figure 2: Emission Trend for Sulphur Dioxide, 1990 – 2018 (EPA, 2020)
Industrial
Other
Power Stations Residential & Commercial
Agriculture/Forestry/Fishing Transport
200
180
160
140
120
100
80
60
40
20
0
kt
SO
2
19
90
19
91
19
92
19
93
19
94
19
95
19
96
19
97
19
98
19
99
20
00
20
01
20
02
20
03
20
04
20
05
20
06
20
07
20
08
20
09
20
10
20
11
20
12
20
13
20
14
20
15
20
16
20
17
20
18
IRL NAPCP Report 2021 Update
34
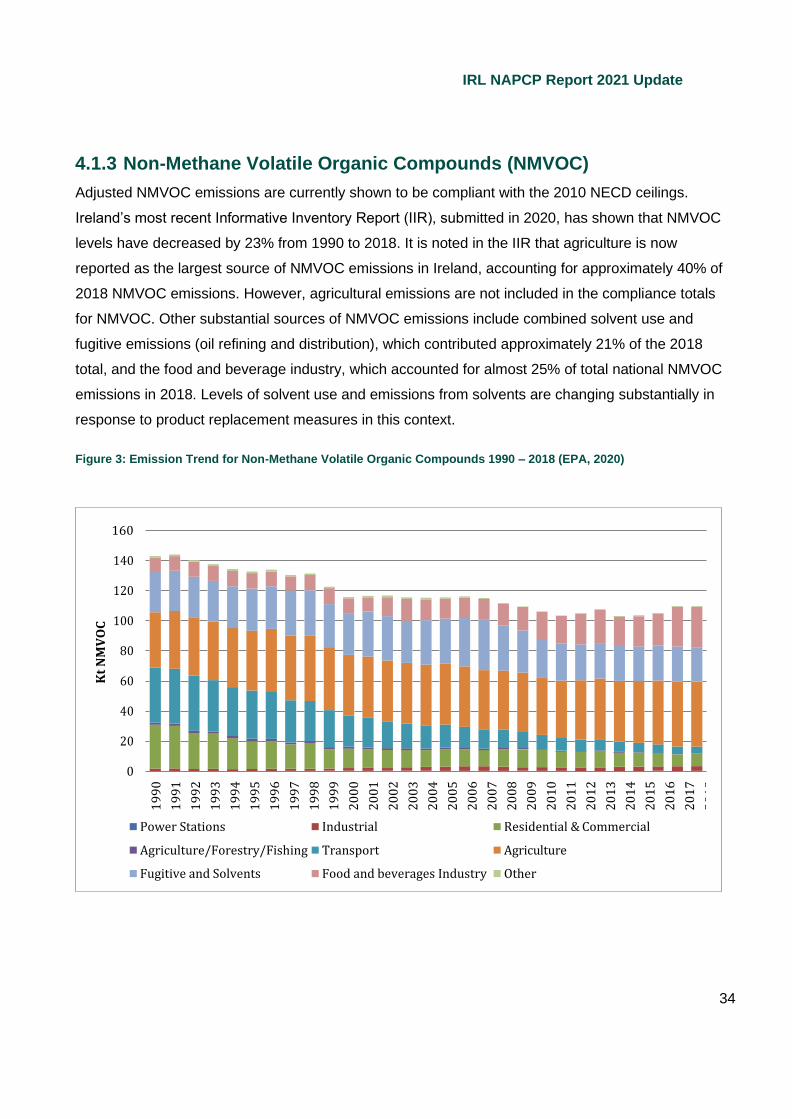
4.1.3 Non-Methane Volatile Organic Compounds (NMVOC)
Adjusted NMVOC emissions are currently shown to be compliant with the 2010 NECD ceilings.
Ireland’s most recent Informative Inventory Report (IIR), submitted in 2020, has shown that NMVOC
levels have decreased by 23% from 1990 to 2018. It is noted in the IIR that agriculture is now
reported as the largest source of NMVOC emissions in Ireland, accounting for approximately 40% of
2018 NMVOC emissions. However, agricultural emissions are not included in the compliance totals
for NMVOC. Other substantial sources of NMVOC emissions include combined solvent use and
fugitive emissions (oil refining and distribution), which contributed approximately 21% of the 2018
total, and the food and beverage industry, which accounted for almost 25% of total national NMVOC
emissions in 2018. Levels of solvent use and emissions from solvents are changing substantially in
response to product replacement measures in this context.
Figure 3: Emission Trend for Non-Methane Volatile Organic Compounds 1990 – 2018 (EPA, 2020)
160
140
120
100
80
60
40
20
0
Power Stations Industrial Residential & Commercial
Agriculture/Forestry/Fishing Transport Agriculture
Fugitive and Solvents Food and beverages Industry Other
Kt
NM
VO
C
19
90
19
91
19
92
19
93
19
94
19
95
19
96
19
97
19
98
19
99
20
00
20
01
20
02
20
03
20
04
20
05
20
06
20
07
20
08
20
09
20
10
20
11
20
12
20
13
20
14
20
15
20
16
20
17
20
18
IRL NAPCP Report 2021 Update
35
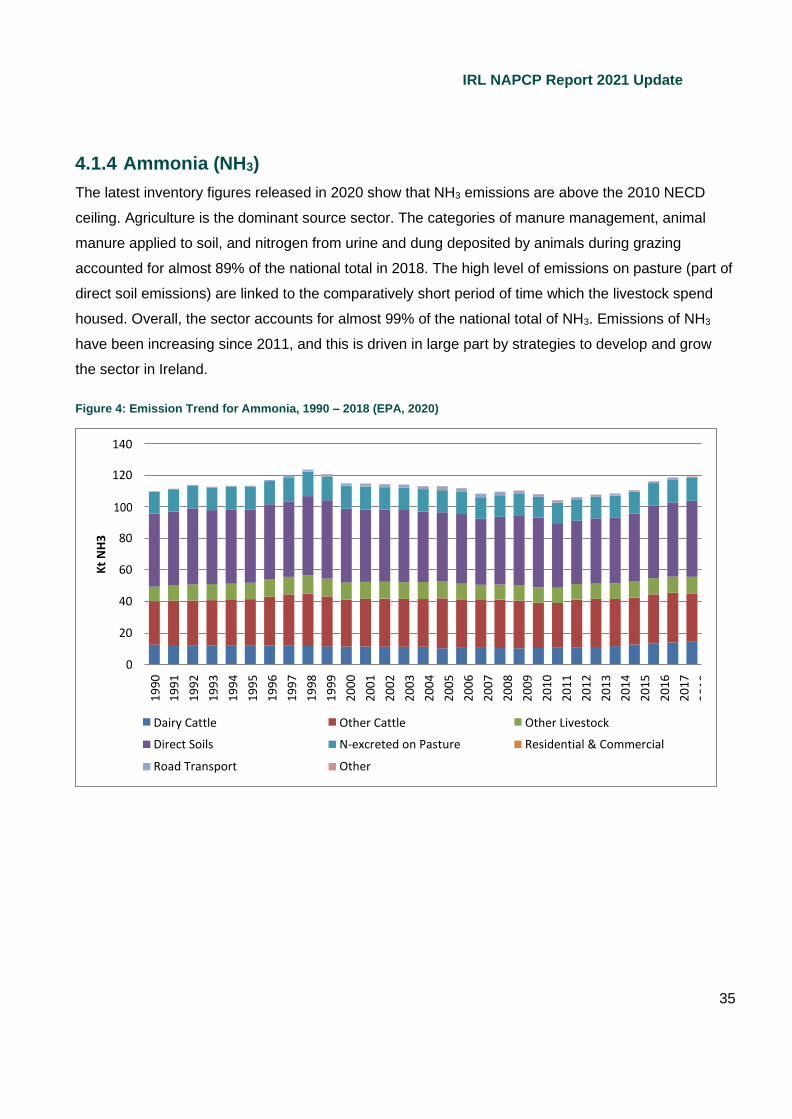
4.1.4 Ammonia (NH3)
The latest inventory figures released in 2020 show that NH3 emissions are above the 2010 NECD
ceiling. Agriculture is the dominant source sector. The categories of manure management, animal
manure applied to soil, and nitrogen from urine and dung deposited by animals during grazing
accounted for almost 89% of the national total in 2018. The high level of emissions on pasture (part of
direct soil emissions) are linked to the comparatively short period of time which the livestock spend
housed. Overall, the sector accounts for almost 99% of the national total of NH3. Emissions of NH3
have been increasing since 2011, and this is driven in large part by strategies to develop and grow
the sector in Ireland.
Figure 4: Emission Trend for Ammonia, 1990 – 2018 (EPA, 2020)
140
120
100
80
60
40
20
0
Dairy Cattle
Direct Soils
Road Transport
Other Cattle
N-excreted on Pasture
Other
Other Livestock
Residential & Commercial
Kt
NH
3
19
90
19
91
19
92
19
93
19
94
19
95
19
96
19
97
19
98
19
99
20
00
20
01
20
02
20
03
20
04
20
05
20
06
20
07
20
08
20
09
20
10
20
11
20
12
20
13
20
14
20
15
20
16
20
17
20
18

IRL NAPCP Report 2021 Update
36
4.1.5 Particulate Matter (PM2.5)
The first NECD ceiling for PM2.5 covers the 2020-2029 period, and this is followed by a more
ambitious ceiling then for the 2030 onwards period. Levels of PM2.5 emissions have been on a steady
downward trajectory since 2010. The 2020 IIR reports national PM2.5 emissions of 12.04kt in 2018.
This is well below the 2020 ceiling of 15.6kt, which is positive given that PM2.5 is an air pollutant of
particular relevance to the scale and incidence of human health impacts. Combustion from the
residential and commercial sector remains the largest source of emissions, accounting for almost
55% of the national total of PM2.5 emissions in 2018. There has however been a 73% reduction in
emissions from residential and commercial sources in 2018 relative to 1990 levels. This has been
heavily influenced by shifts away from coal and peat use toward cleaner fuels and heating choices.
Figure 5: Emission Trend for PM2.5, 1990 – 2018 (EPA, 2020)
35
30
25
20
15
10
5
0
Power Stations
Agriculture/Forestry/Fishing
Other
Residential & Commercial
Transport
Industrial
Agriculture
kt P
M 2
.5
19
90
19
91
19
92
19
93
19
94
19
95
19
96
19
97
19
98
19
99
20
00
20
01
20
02
20
03
20
04
20
05
20
06
20
07
20
08
20
09
20
10
20
11
20
12
20
13
20
14
20
15
20
16
20
17
20
18

IRL NAPCP Report 2021 Update
37
4.2 Main existing Policies and Measures delivering progress
EU Decision 2018/1522 reference section 2.4.1
In this section we provide an overview of selected major PaMs that are currently in place and have
delivered progress in terms of controlling and reducing air pollutant emissions in Ireland up to this
point in time. In short, this section deals with historical progress as captured within the official national
emission inventory to date. Disaggregating historical emissions and assigning reductions to individual
actions is of course challenging and problematic in the absence of detailed data and counterfactual
cases. As such, where the influence on an individual measure or action is easily identified, it is
recognised, but generally the focus in this section is on categorising those major interventions that are
believed to have altered national emission trajectories substantively up to this point in the official
national emission inventory.
4.2.1 Transport
The transport sector is a significant source of emissions to air generally, and specifically NOx,
NMVOC and PM2.5. Between 1990 and 2018 the sector has achieved a 34% reduction in NOX (fuel
used basis), an 88% reduction in NMVOC, and a 41% reduction in PM2.5. There are several key
measures supported and implemented in Ireland that have aimed to reduce emissions from road
transport. These measures have been designed to control overall transport emissions, reduce
congestion, promote fuel efficiency, and in doing so promote health and well-being. The key
measures are outlined below.
4.2.1.1 Increased support for higher emission standards and increasingly fuel-efficient
vehicles
Ireland has sought to encourage accelerated penetration of vehicles on higher Euro standards
through early scrappage schemes. Ireland has also introduced carbon weighted vehicle taxation in a
bid to encourage increasingly fuel-efficient vehicle penetration in the market. This had the less than
desired outcome of encouraging more diesel vehicles into the fleet, and these effects have been

IRL NAPCP Report 2021 Update
38
studied in some detail via counterfactual analysis as part of an OECD research paper23. The
introduction of the NOX charge from 2020 will serve to somewhat counter this. However,
notwithstanding the increased share of diesel vehicles, and the particular impacts of issues linked to
the ‘Dieselgate’ scandal, the expected performance of the latest Euro 6 standard, now and into the
future, combined with greater fuel efficiency, should yield sustained improvements in transport
emission reduction outcomes. Despite growth in activity levels, Ireland’s NOX emissions from
transport have remained steady from 2010 through to 2018.
4.2.1.2 EV Grants and Tax Scheme
The Sustainable Energy Authority of Ireland (SEAI) has been offering grants of up to €5,000 to
consumers of Battery Electric Vehicles (BEVs) or Plug-In Hybrid Electric Vehicles (PHEVs) since
2011. As of the end of 2018, SEAI grants aided the purchase of over 4,600 EVs. Additionally, EVs
can qualify for VRT relief of between €2,500 and €5,000 depending on the type of technology being
used. It has previously been announced that VRT relief would continue until the end of 2021 for
BEVs. The ambitions for EV penetration outlined in the CAP24 should see ongoing support in this
context to accelerate the fleet transition towards electrification. It is also expected that the extended
scope of market offerings at more competitive prices towards the middle of the decade will be key
factors in accelerating the transition of the fleet at that time. However, to this point, the impact of EVs
in terms of reduced air pollutant emissions remains modest.
4.2.1.3 Fuel Standards
The technical environmental specifications for gas oils, petrol and diesel fuels have been set at an EU
level and transposed into Irish legislation. These regulations have specific implications for gas oils,
reducing sulphur limits and sulphur content in heavy oil and marine fuels, biofuels, petrol and diesel
fuels. Fuel standards have been a particularly effective upstream control in this context.
23 Report available at https://www.oecd-ilibrary.org/environment/an-sssessment-of-the-social-costs-and-benefits-of-vehicle-
tax-reform-in-ireland_952e7bff-en
24 840,000 electric passenger cars, 95,000 electric vans and trucks, and 1,200 electric buses by 2030.
IRL NAPCP Report 2021 Update
39
4.2.1.4 Encouraging Modal Shift
The 2019 Canal Cordon Count for Dublin25 reports that since 2010 there has been an increasing
modal share for the sustainable transport modes (walking, cycling and public transport). The overall
mode share for sustainable modes was 70% - representing the highest levels since canal cordon
counts commenced in 2006. This represents important progress for Ireland’s capital city.
On a broader national scale, the most recent national census results indicate that cycling to work has
shown the largest percentage increase of all means of transport, rising by 42.8% from 2011 to 2016.
Walking to work also increased in that timeframe. However, the 2016 census indicated that walking
and cycling account for only 12% of commuting activity. Nonetheless, the next census (2022) should
report progress in response to subsequent cycling and walking infrastructure investments. However, it
is also to be expected that COVID-19 will dramatically influence updated figures in this context.
The new PfG includes statements of intent regarding substantial investment in cycling infrastructure
that are expected to support further growth in active travel modes in Dublin and beyond.
In relation to public transport, in 2018 there were 266 million PSO public transport journeys provided
by the transport companies Dublin Bus, Bus Éireann, Iarnród Éireann, Luas and Go-Ahead Ireland.
This reflects a per annum growth rate of 6.28% compared to 2017. The Department of Social
Protection provides €80 million annually for the free travel scheme, for which approximately 800,000
citizens are eligible. Bus Éireann received €149 million for school transport services in 2015 from the
Department of Education.
4.2.2 Residential and Commercial Built Environment
The built environment sector is an important source of emissions of SO2, NMVOC and PM2.5. Between
1990 and 2018 the sector has achieved an 84% reduction in SO2, a 72% reduction in NMVOC, and a
73% reduction in PM2.5. The strategic approach to the built environment sector focuses upon energy
management (understanding existing energy needs and usage), energy efficiency (reducing usage
and making demand more flexible), and fuel switching (meeting the energy demand with less
emissions-intensive heating solutions). There are specific packages of measures under each
25 https://www.nationaltransport.ie/wp-content/uploads/2019/04/Canal_Cordon_Report_2018.pdf

IRL NAPCP Report 2021 Update
40
category, each with a range of actions that have been implemented to date. Measures implemented
include:
4.2.2.1 Residential Energy Efficiency
Since 2002, Ireland’s building regulations26 have been steadily improved (in 2002, 2011, 2019) to
ensure increased energy efficiency through Part L Conservation of Fuel and Energy. Ireland also
operates a Building Energy Rating (BER) system and the associated energy labelling encourages and
enables consumers to make more informed decisions about the energy efficiency of their homes. As
of September 2020, Ireland is approaching one million homes with BER certificates.
In parallel with the BER system, Ireland provides a range of grant schemes focused on improving
residential energy efficiency. The Better Energy Programme comprises a number of schemes,
including Better Energy Homes, Community Energy Grants Community Energy Grant schemes and
Better Energy Warmer Homes Schemes. Since 2009, the SEAI has provided over €600 million in
grant support towards energy upgrades in over 400,000 homes, supporting around 2,300 jobs per
annum in the construction sector. The Warmth and Wellbeing pilot scheme is an example of another
measure that provides deep retrofits to the homes of people living with chronic respiratory conditions.
Research on the outcomes and impacts include consideration of the health impacts of improving the
thermal comfort of the homes.
4.2.2.2 Commercial & Public Sector Energy Efficiency
There have been several important policies implemented in the commercial and public sector to
improve energy efficiency. The Energy Efficiency Obligation Scheme is a regulatory based measure
requiring larger energy suppliers to achieve energy savings among customers and across all sectors.
Carbon tax and Energy Audits for (non-SME) businesses were introduced in 2015. The public sector
has a mandated 33% energy efficiency target that aims to deliver circa 3,240GWh in energy savings
through energy efficiency improvements by the end of 2020. The Climate Action Plan (2019) and the
Programme for Government (2020) have set new and more ambitious targets for 2030: a 50% energy
efficiency improvement; a new 50% absolute emissions reduction target, and a requirement for all
26
https://www.gov.ie/en/publication/1d2af-building-regulations/
IRL NAPCP Report 2021 Update
41
public buildings to achieve a minimum ‘B’ BER rating. The SEAI Public Sector Energy Efficiency
Programme,27 an energy management and advisory programme, supports the sector in achieving its
targets. The Public Sector Energy Efficiency Action Plan, published in 2017, is aimed at intensifying
efforts to ensure the public sector target (which encompasses a range of measures relating to the
built environment) can be met by the end of 2020. The Public Sector Partnership Pathfinder Retrofit
(2017) provides capital funding for pathfinder retrofit projects aimed at testing building retrofit
approaches and developing a retrofit model that can be replicated across the wider public sector,
including schools.
The Large Industry Energy Network (LIEN) programme is an Energy Efficiency Network for large
businesses with an annual energy bill of over €1 million. Launched in 2000, it is estimated it will
achieve 642kt of CO2 mitigation by 202028. Funding is also provided to businesses and public sector
organisations that undertake design, construction and commissioning of projects that use the
Excellence in Energy Efficient Design (EXEED) certification29 process. The SEAI SME Programme30
was launched in 2008 and is also ongoing with estimated CO2 mitigation potential of 114kt by 2020.
Whilst many efficiency measures focus on the CO2 impact, the broader impact of energy efficiency
can also deliver on air quality outcomes.
4.2.2.3 Solid Fuel Regulation
Residential solid fuel combustion for heating purposes generates emissions of both air pollutants and
GHGs, with corresponding impacts on human health, the environment and global climate change.
Combustion of bituminous coal, other coal products (such as manufactured ovoids and anthracite),
wood and peat in the residential sector is a significant source of harmful toxic emissions to air,
including PM2.5, PAH, and NOx. Smoky Coal has been regulated in specific Low Smoke Zones (LSZ),
with the first zone having come into effect in Dublin in 1990. This policy has been recognised
internationally as an effective air policy intervention and has served as a precursor to considerable
27 https://www.seai.ie/business-and-public-sector/public-sector/public-sector-energy-programme/
28 https://www.seai.ie/business-and-public-sector/large-business/lien/
29 https://www.seai.ie/business-and-public-sector/business-grants-and-supports/exeed-certified-grant/
30 https://www.seai.ie/business-and-public-sector/small-and-medium-business/
IRL NAPCP Report 2021 Update
42
improvements in urban air quality and observed health impacts in Dublin. These changes were
attributed to consumers switching away not just from smoky coal, but from all solid fuels more
generally, towards fuels which produce less air pollution.
A ban on the burning of smoky coal and other prohibited fuels, as well as their marketing, sale and
distribution, now applies in all Low Smoke Zones (LSZs) in Ireland. Since the last NAPCP, an
additional 13 towns have been included under the ban as of September 2020, such that it now covers
all towns in the country with populations of more than 10,000 people31.
The intention is to develop new regulations which will go beyond the scale and scope of the current
legislation, to ensure a significant increase in Ireland’s air quality which will in turn help to improve
public health.
A public consultation document32 has been published in relation to the development of new legislation
to regulate to a broader extent the use of solid fuels in the residential sector in Ireland.
The consultation will focus particularly on the issue of air pollution caused by the burning of solid fuels
for residential heating, and the contribution of various solid fuels to air pollution. This process is
intended to provide an opportunity for all stakeholders, such as householders, consumers, retailers,
producers and industry to provide input in the development of new and more comprehensive
regulation in this area.
4.2.2.4 Sulphur in Coal
Coal sold in Ireland for home heating must meet certain minimum requirements regarding sulphur
content. Limiting the sulphur content of smoky coal helps to protect human health and the
environment by reducing air pollution, especially in winter. A traceable audit system has been
established by the National Standards Authority of Ireland (NSAI) called the SWiFT7 certificate.
Those placing smoky coal on the market must have the SWiFT7 certificate to show compliance with
the 0.7% sulphur limit and must also be registered with the EPA.
31 https://www.gov.ie/en/collection/77db4-low-smoke-zone-maps/
32
https://www.gov.ie/cleanair

IRL NAPCP Report 2021 Update
43
4.2.3 Electricity Generation
The electricity generation sector is a key source of emissions of SO2 and NOX. Between 1990 and
2018 the sector has achieved a 97% reduction in SO2, and an 86% reduction in NOX. Change in the
sector has been driven by licensing controls, a focus on increased renewable generation, specific
retrofit schemes, and reduced dependence on solid fuels such as coal and peat.
4.2.3.1 Renewable Energy Feed-in Tariff (REFIT)
The REFIT schemes support renewable electricity development in Ireland. The schemes were
designed to provide certainty to renewable electricity generators by providing them with a minimum
price for each unit of electricity exported to the grid over a 15-year period. The REFIT schemes have
been designed to incentivise the development of renewable electricity generation in order to support
Ireland in meeting its renewable energy targets. It is funded by a Public Service Obligation (PSO) levy
which is paid for by all electricity consumers. Non-combustion renewables such as wind and solar
power contribute to both climate and clean air goals. These schemes and supporting actions are
supporting a gradual shift away from more polluting forms of power generation (i.e. coal and peat
generation), to enable higher shares of renewables alongside gas-fired generation.
4.2.3.2 Peat Phase Out
In line with the sustainability strategy outlined by Bord na Móna, there is a plan in place to phase out
the use of peat in electricity generation. The Public Service Obligation support for the Edenderry peat-
fired plant expired in 2015 and is now receiving support via the REFIT 3 fiscal incentive to encourage
the use of biomass in co-firing. The WM scenario reflects the commitment by Bord na Móna to end
peat harvesting for electricity generation by 2030. Similar to Edenderry, PSO support for two ESB
peat stations West Offaly and Lough Ree expired in 2019. Ultimately the wind-down of peat-fired
generation in Ireland has had a positive impact on air quality outcomes from this sector.
4.2.3.3 Moneypoint Retrofit
Moneypoint power station is Ireland’s only coal-fired power plant. Over a period of time, starting in
2008, the plant underwent a €355m retrofit to cut emissions of both SO2 and NOx at the plant. This
played a major part in national SO2 emissions from the power sector dropping from circa 31kt in 2007
to just under 10kt in 2010. Similarly, national NOX emissions from the power sector reduced from 27kt
in 2007 to just under 12kt in 2010.
IRL NAPCP Report 2021 Update
44
4.2.4 Agricultural Package
The WM scenario in the April 2020 ammonia projections does not include estimates for the impact of
any agricultural measures which are already in place; it is instead a continuation of the current
inventory with updated projections of animal numbers (as set out in the EPA IIR 202033).
4.3 Progress in relation to improving ambient air quality
EU Decision 2018/1522 reference section 2.4.2
The EPA is the competent authority for assessing Irish ambient air quality. The assessment of the air
we breathe is achieved through the implementation of two pieces of environmental legislation – S.I.
No. 180 of 2011 and S.I. No. 58 of 2009. Practically, this is assessed through a national network of air
monitoring stations. At the end of 2020 there were 88 monitoring stations across Ireland, including 24
stations added in 2019, and another 14 added in 2020. A range of air pollutants are annually
assessed and reported both nationally through the EPA’s National Air Quality Indicators report34 and
internationally through the European Environment Agency35. Information is also available to the public
through the EPA website using Ireland’s Air Quality Index for Health36.
The EPA is continuing to upgrade and expand the Ambient Air Quality network through a five-year
programme funded by the Department of the Environment, Climate and Communications. This has
already led to a trebling of real-time monitoring across Ireland and is now on track to deliver a 107-
station network. This will allow for the provision of more real-time information on air quality throughout
the country.
Given this recent and ongoing expansion of the network, it is difficult to provide a longer assessment
of the changes in monitored air quality over time.
In 2019, a measured exceedance of the EU legislative limits was observed for NOx. This was at an
urban traffic station in Dublin. There were no other exceedances observed of the EU limit values.
33Ireland’s latest inventory and projected emissions of air pollutants(2020 release) 34 EPA (2020). Air Quality in Ireland 2019 Available at: https://www.epa.ie/pubs/reports/air/quality/epaairqualityreport2019.html 35 Ireland’s latest inventory emissions of air pollutants (2020 release) and Ireland’s latest NECD projected emissions (2020 release). 36 Air Quality Index for Health available at https://airquality.ie/

IRL NAPCP Report 2021 Update
45
However, when assessed against the more stringent World Health Organisation (WHO) levels,
emissions limits for particulate matter were breached at a number of monitoring sites across the
country in 2019. There were also four stations where the European Environment Agency reference
level for PAH was exceeded. These issues are predominantly as a result of the burning of solid fuel in
residential properties.
The programmes and measures set out in section 4.2 contribute towards reductions in overall
emissions levels and also localised ambient emissions. Although quantification and attribution of their
impact is not currently carried out, this is being considered in the context of the Clean Air Strategy for
inclusion in the next NAPCP.
4.3.1 Modelled Concentrations for Ambient Air
Figures 6 to 11 below are modelled concentrations of the 2015 inventory for ambient air pollutant
emissions. The results included in the figures show the results of the EMEP37 model with national
reference simulation in 2015 for European indicators AOT40 (O3)38, PM10, PM2.5, NO2, and NOx.
These maps have been produced as part of the EPA-funded research project ConAir39, which was led
by EnvEcon Decision Support40 . The modelled maps are included as being of relevance to the
broader context of the NAPCP. An update of this modelling is currently being developed by the EPA
and should be completed before the next iteration of the NAPCP.
In addition, the EPA has developed a number of pollutant maps of modelled pollutant levels for NOx,
PM2.5 and PM10 for Dublin which are also included below.
37 EMEP (2018) Transboundary particulate matter, photo-oxidants, acidifying and eutrophying components, EMEP Status Report 1/2018, ISSN 1504-6192 (online) 38 The AOT40 (= Accumulated Ozone exposure over a Threshold of 40 ppb (=80 µg/m³)) for vegetation is the accumulated excess of hourly ozone concentrations above 80 μg/m³ between 8:00 and 20:00 CET (Central European Time) in the months of May, June, July, i.e. the growth season. This indicator is designed for the protection of crops and natural vegetation. The European long-term AOT40 objective is 3000 ppb·h.
39 https://www.epa.ie/researchandeducation/research/researchpublications/researchreports/research286.html
40 http://conair.envecon.eu/

IRL NAPCP Report 2021 Update
46
Figure 7: Modelled surface annual mean PM2.5
concentrations in 2015
As seen in Figure 6, AOT40 values are in general highest in the southern part of Ireland. The highest
model grid value was 2394 pbb.·h. As such no region was estimated to exceed the European long-
term AOT40 objective level of 3000 ppb.·h in 2015.
Figure 7 presents the concentrations of PM2.5 and shows that the highest PM2.5 concentrations are
found in urban areas and close to the main roads. The annual average PM2.5 concentration for the
entire Irish domain was estimated at 3.7μg/m3, whereas the maximum grid value was 10.3μg/m3. The
WHO guidelines for PM2.5 are 10μg/m3 annual mean and 25μg/m3 daily mean. The urban
concentrations are further demonstrated for the Dublin region in Figure 8 below.
Figure 6: Modelled (May-July) Ozone Levels, EURATO
(ppb.h) in 2015

IRL NAPCP Report 2021 Update
47
Figure 8: Modelled annual average PM2.5 concentration
Additional research is underway by EnvEcon Decision Support and Nilu, relating to the potential
impact of targeting ASHP retrofit installations into areas of higher residential PM concentrations as a
means of countering specific relative hot spots from residential combustion. This will be released in
due course.
Figure 9 below shows the concentrations of NO2 where the highest concentrations were found in
urban areas, but the main roads were also noted as high concentration areas. The NO2 average value
for the entire domain was 1.2μg/m3 while for Dublin the annual average concentrations (for a single 2
km grid) were 22.2μg/m3 as further outlined in Figure 11. Figure 10 shows the concentration for NOx.
The WHO Guidelines for NOx are 40μg/m3 annual mean and 200μg/m3 in a 1hour period.
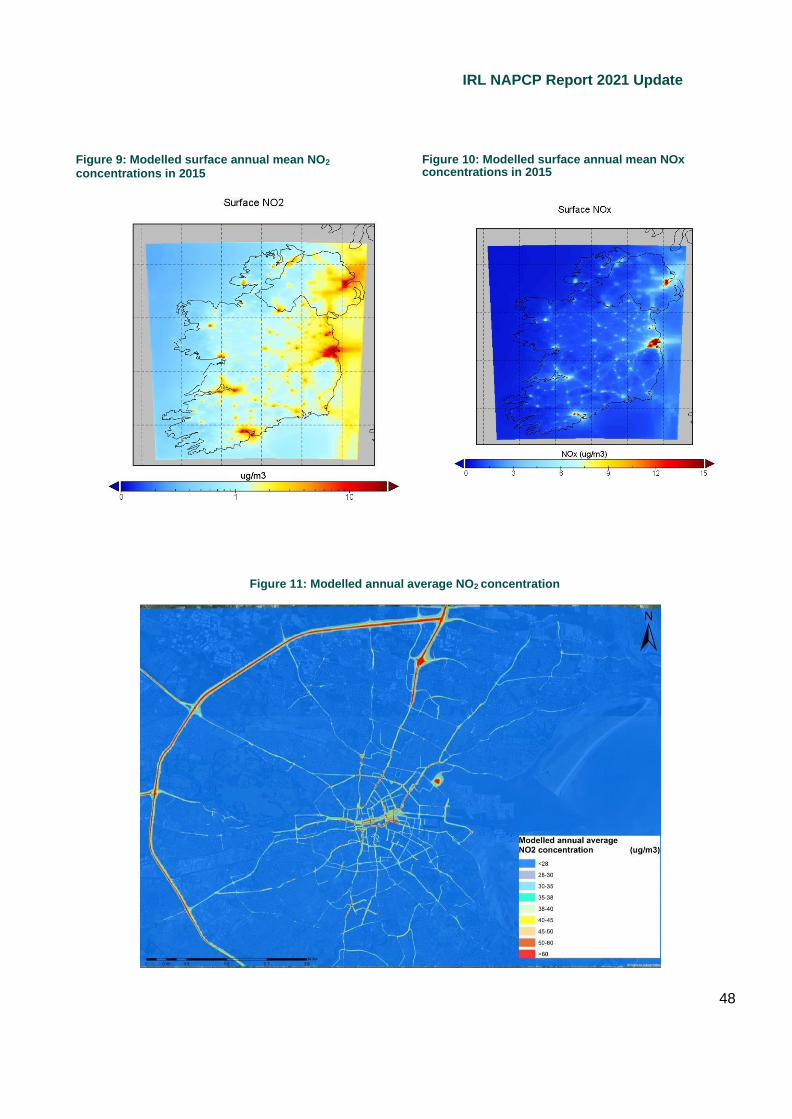
IRL NAPCP Report 2021 Update
48
Figure 9: Modelled surface annual mean NO2
concentrations in 2015
Figure 10: Modelled surface annual mean NOx concentrations in 2015
Figure 11: Modelled annual average NO2 concentration
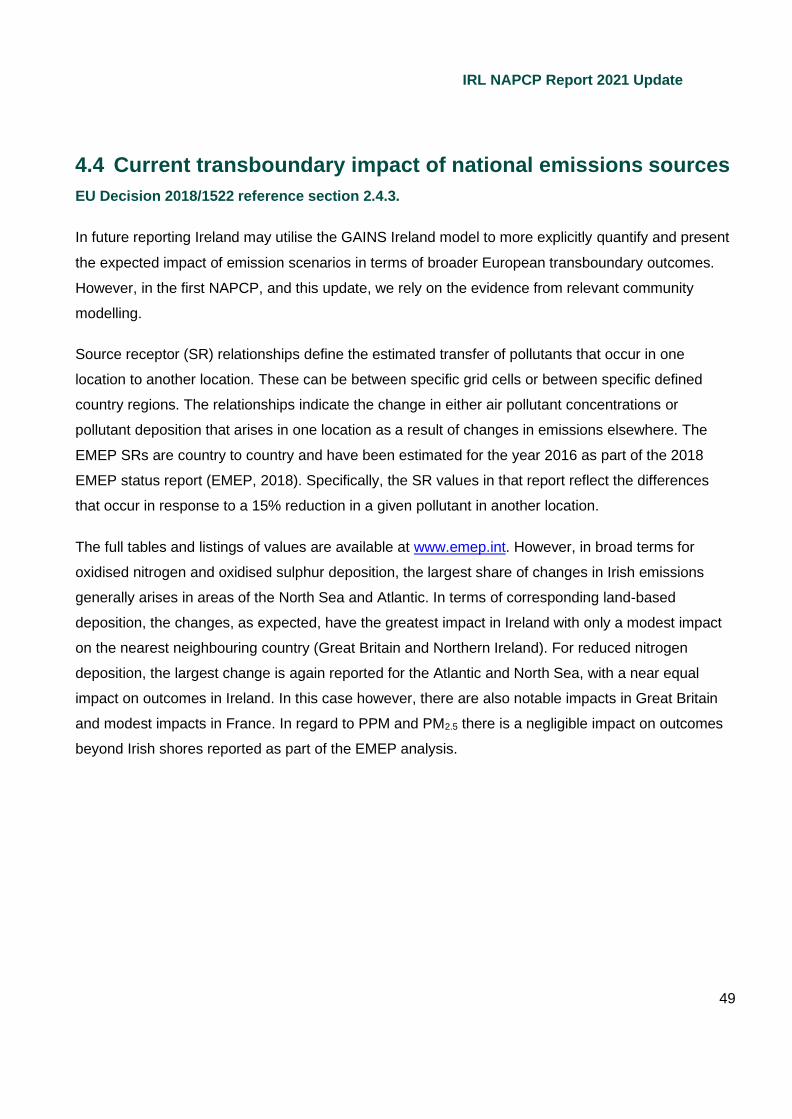
IRL NAPCP Report 2021 Update
49
4.4 Current transboundary impact of national emissions sources
EU Decision 2018/1522 reference section 2.4.3.
In future reporting Ireland may utilise the GAINS Ireland model to more explicitly quantify and present
the expected impact of emission scenarios in terms of broader European transboundary outcomes.
However, in the first NAPCP, and this update, we rely on the evidence from relevant community
modelling.
Source receptor (SR) relationships define the estimated transfer of pollutants that occur in one
location to another location. These can be between specific grid cells or between specific defined
country regions. The relationships indicate the change in either air pollutant concentrations or
pollutant deposition that arises in one location as a result of changes in emissions elsewhere. The
EMEP SRs are country to country and have been estimated for the year 2016 as part of the 2018
EMEP status report (EMEP, 2018). Specifically, the SR values in that report reflect the differences
that occur in response to a 15% reduction in a given pollutant in another location.
The full tables and listings of values are available at www.emep.int. However, in broad terms for
oxidised nitrogen and oxidised sulphur deposition, the largest share of changes in Irish emissions
generally arises in areas of the North Sea and Atlantic. In terms of corresponding land-based
deposition, the changes, as expected, have the greatest impact in Ireland with only a modest impact
on the nearest neighbouring country (Great Britain and Northern Ireland). For reduced nitrogen
deposition, the largest change is again reported for the Atlantic and North Sea, with a near equal
impact on outcomes in Ireland. In this case however, there are also notable impacts in Great Britain
and modest impacts in France. In regard to PPM and PM2.5 there is a negligible impact on outcomes
beyond Irish shores reported as part of the EMEP analysis.
IRL NAPCP Report 2021 Update
50
5 Projected Progress (‘With Existing Measures’)
EU Decision 2018/1522 reference section 2.5.
The purpose of this section is to present the officially submitted emission projections outlook to 2030
under the national WM scenario and to assess compliance with the NECD in the 2020 and 2030
periods. The focus is therefore on how those existing measures are expected to impact on projected
emissions and associated compliance.
NH3 exceeds the emission ceilings in both the 2020 and 2030 phases under the WM outlook and
presents a particular challenge. SO2 and PM2.5 remain in compliance for both 2020 and 2030.
As noted in section 3, all emissions data for all pollutants up to 2018 are based on the official national
inventory submission from 2020. Projected emissions in this section are then based on the latest WM
projections as provided by the Environmental Protection Agency (EPA) for all years from 2019 to
2030. The air pollutant projections provided by the EPA for this updated NAPCP take into account
projected activity data from a number of responsible authorities, including updated energy projections
provided by the SEAI, and updated agriculture activity data provided by Teagasc for the official 2020
projections.
Uncertainties
Changes have been made to the projected emissions of NOx and NMVOC to reflect permitted
changes under Article 4 and 5 of the NECD. Article 4 allows for the removal of agricultural emissions
from the accounting of emissions from both pollutants for compliance purposes. The NMVOC
projections also present a scenario with adjustments that further exclude a portion of the food and
beverage industry emissions (from spirit production) from the accounting of the NMVOC emissions for
compliance purposes41.
41 On the basis that NMVOCs from category 2.H (Spirits) were included in the 1990-2015 inventory for the February 2017 Inventory submission (after the 2016 NEC Directive came into effect).

IRL NAPCP Report 2021 Update
51
The 2005 inventory values for NOx and NMVOC presented in this NAPCP update are the adjusted
totals used for NECD compliance values. These are drawn from the “Annex 1 Ireland 1990 – 2018 v1”
file released in February 2020. The NECD compliance totals include the following explanatory note:
The 'National Total for Compliance (NECD)' includes the ‘National Total (based on fuel sold)’
corrected for i) approved adjustments and flexibilities to national totals and, if applicable, ii) national
totals based on transport fuel used, as well as iii) the subtraction of sectors 3B + 3D (Livestock and
Agri Other) for NOx and NMVOC (only from 2020 onwards and for the year 2005 as a basis for
emission reduction commitment calculations), according to the NEC Directive, Article 4/3(d).
Table 3: Projected emissions and emission reductions (WM) scenario (EU reference 2.5.1)
Total emissions (kt), consistent with
inventories for year x-2 or x-3 (year to be specified) (M)
Projected % emission change achieved compared with 2005 (M)
National emission reduction commitment for 2020- 2029 (% reduction compared with 2005 levels) (M)
National emission reduction commitment from 2030 (%
reduction compared with 2005 levels ) (M)
Pollutants (M)
2005 base year
2020
2025
2030
2020
2025
2030
SO2 73.07 13.61 11.13 9.04 - 81% - 85% - 88% 65% 85%
NOx 131.05 76.24 59.9 49.08 - 42% - 54% - 63% 49% 69%
Total* NMVOC
75.11 69.21 70.28 70.28 - 8% - 6% - 6% 25% 32%
Adjusted** NMVOC
66.58 49.61 49.89 49.06 - 25% - 25% - 26% 25% 32%
NH3 113.2 118.45 122.25 123.22 + 5% + 8% + 9% 1% 5%
PM2.5 19.03 13.14 12.2 10.85 - 31% - 36% - 43% 18% 41%
Date of emission projections (M) April 2020
Table 3 includes no adjustments or special notes regarding SO2, NH3 or PM2.5. In the case of NOX,
agricultural source categories 3B and 3D are removed from the 2005 inventory base and projections
to assess compliance (Article 4 of 2016 NECD). In the case of NMVOC, the same exclusions for
agricultural sources 3B and 3D are made, as well as a further adjustment to remove category 2.h.2
(NMVOC from spirits) that is again applied to both the 2005 inventory base and projections for the
IRL NAPCP Report 2021 Update
52
purpose of the compliance assessment42. The broader outlook then, when using the adjusted
perspective for NMVOC, suggests that the WM scenario will deliver compliance across all but NOX
and NH3 in the 2020 phase. However, NOX and NMVOC are both expected to exceed the ceilings in
2030. NOX is expected to be in compliance if the inventory adjustment is accepted for 2020.
The impact of inventory adjustments on a longer time horizon to 2030 are more difficult to assess as
their effect will change. Nonetheless Ireland does note the proximity of both NOX and NMVOC to the
ceiling thresholds under the WM outlook and will therefore consider adoption of the additional
measures that need to be deployed to achieve compliance as necessary.
Overall, NH3 is recognised as remaining the major challenge for compliance in both compliance
phases of the NECD when using the WM projections of 2020.
5.1.1 NOx
NOx emissions in Ireland are projected to be in non-compliance in 2020 until the end of 2022 under
the WM scenario. From 2023, NOx emissions are projected to be in compliance until the end of 2029.
However, with the further tightening of the ceiling for NOx from 2030, and with emissions somewhat
plateauing from 2029 under the most recent emission projections, Ireland is currently projected to be
non-compliant in 2030.
It is also noted that adjustments have been made to NOx emissions in compliance with EU Directive
2016/2284. These adjustments have been applied to emissions for all years from 2010-2018 and from
2020 all agriculture emissions will be removed for the accounting of compliance totals for NOx.
42 On the basis that NMVOCs from category 2.H (Spirits) were included in the 1990-2015 inventory for the
February 2017 Inventory submission (after the 2016 NEC Directive came into effect).

IRL NAPCP Report 2021 Update
53
Figure 12: 2020 Inventory, Projections (WM) and NECD Obligation – NOx in kt (based on EPA, 2020)
5.1.2 SO2
Ireland is projected to remain in compliance for the ceiling periods from 2020 and 2030. This
compliance status is projected to remain beyond 2030. In addition to controls on sulphur content of
fuels, this is largely due to further progress being made in the energy efficiency of homes and
buildings and the effective implementation of a range of policies and measures to support that effort.
Figure 13: 2020 Inventory, Projections (WM) and NECD Obligation – SO2 in kt (based on EPA, 2020)
90
80
70
60
50
40
30
20
10
0
NOx 2010 Ceiling (65kt) 2020 Ceiling (66.84kt) 2030 Ceiling (40.63kt)
2030 Ceiling (10.96kt) 2020 Ceiling (25.57kt) 2010Ceiling (42kt) SO2 Emissions
45
40
35
30
25
20
15
10
5
0
SO
2 k
t N
Ox
Kt
20
10
20
10
20
11
20
11
20
12
20
12
20
13
20
13
20
14
20
14
20
15
20
15
20
16
20
16
20
17
20
17
20
18
20
18
20
19
20
19
20
20
20
20
20
21
20
21
20
22
20
22
20
23
20
23
20
24
20
24
20
25
20
25
20
26
20
26
20
27
20
27
20
28
20
28
20
29
20
29
20
30
20
30

IRL NAPCP Report 2021 Update
54
5.1.3 NMVOC
NMVOC emissions are in compliance with the 2010 ceiling for the inventory period from 2010-2018.
Approved adjustments have been made to the inventory NMVOC emissions from 2010-2018 in
accordance with EU Directive 2016/2284. Specifically, NMVOC emissions are adjusted following the
recognition of ‘new’ sources in the inventory. These include removal of categories 3B and 3D relating
to manure management and inorganic N fertilisers, as well as adjustments to emissions from category
2H2 relating to the food and beverages industry. The former category has accounted for
approximately a 40kt adjustment each year between 2010 and 2018, whilst the latter category has
accounted for between 12kt and 20kt in a given year over the same period. These adjustments are
detailed in the informative inventory report (see section 3.1) and have been approved up to the 2018
inventory.
In the period from 2019-2030 in Figure 14, total NMVOC emissions with the removal of agricultural
categories 3B and 3D only are presented. Ceilings are unadjusted and show exceedances for both
the 2020 and 2030 periods under the WEM. However, under Figure 15, adjustments relating to
category 2H2 are applied to both forecast emissions and the ceilings (through a revised base year
adjustment), and this outlook shows compliance with the 2020 ceilings and non-compliance for the
2030 period. This WM outlook for 2030 onwards therefore suggests additional measures will be
required to achieve compliance with the adjusted 2030 ceiling.
Figure 14: 2020 Inventory, Projections (WM) and NECD Obligation – Total NMVOC in kt (based on EPA, 2020)
80
70
60
50
40
30
20
10
-
NMVOC 2010 Ceiling (55kt) 2020 Ceiling (56.34kt) 2030 Ceiling (51.08kt)
NM
VO
C k
t
20
10
20
11
20
12
20
13
20
14
20
15
20
16
20
17
20
18
20
19
20
20
20
21
20
22
20
23
20
24
20
25
20
26
20
27
20
28
20
29
20
30
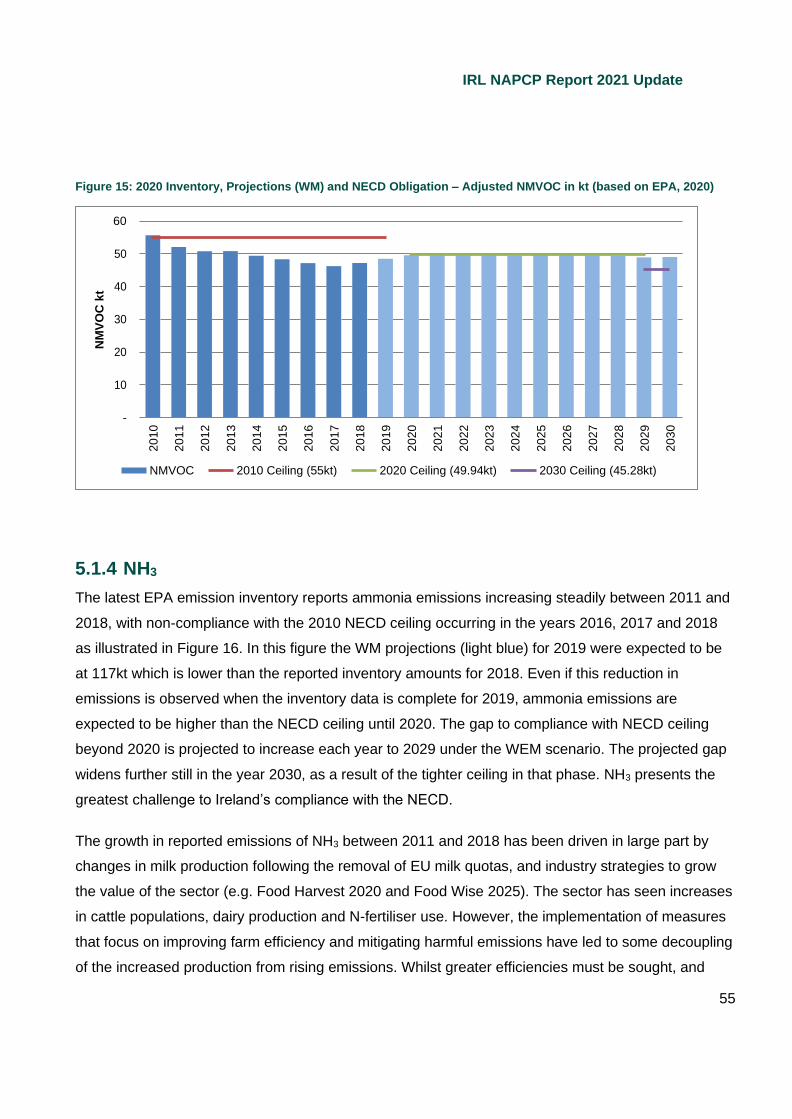
IRL NAPCP Report 2021 Update
55
Figure 15: 2020 Inventory, Projections (WM) and NECD Obligation – Adjusted NMVOC in kt (based on EPA, 2020)
5.1.4 NH3
The latest EPA emission inventory reports ammonia emissions increasing steadily between 2011 and
2018, with non-compliance with the 2010 NECD ceiling occurring in the years 2016, 2017 and 2018
as illustrated in Figure 16. In this figure the WM projections (light blue) for 2019 were expected to be
at 117kt which is lower than the reported inventory amounts for 2018. Even if this reduction in
emissions is observed when the inventory data is complete for 2019, ammonia emissions are
expected to be higher than the NECD ceiling until 2020. The gap to compliance with NECD ceiling
beyond 2020 is projected to increase each year to 2029 under the WEM scenario. The projected gap
widens further still in the year 2030, as a result of the tighter ceiling in that phase. NH3 presents the
greatest challenge to Ireland’s compliance with the NECD.
The growth in reported emissions of NH3 between 2011 and 2018 has been driven in large part by
changes in milk production following the removal of EU milk quotas, and industry strategies to grow
the value of the sector (e.g. Food Harvest 2020 and Food Wise 2025). The sector has seen increases
in cattle populations, dairy production and N-fertiliser use. However, the implementation of measures
that focus on improving farm efficiency and mitigating harmful emissions have led to some decoupling
of the increased production from rising emissions. Whilst greater efficiencies must be sought, and
2030 Ceiling (45.28kt) 2020 Ceiling (49.94kt) 2010 Ceiling (55kt) NMVOC
60
50
40
30
20
10
-
NM
VO
C k
t
20
10
20
11
20
12
20
13
20
14
20
15
20
16
20
17
20
18
20
19
20
20
20
21
20
22
20
23
20
24
20
25
20
26
20
27
20
28
20
29
20
30
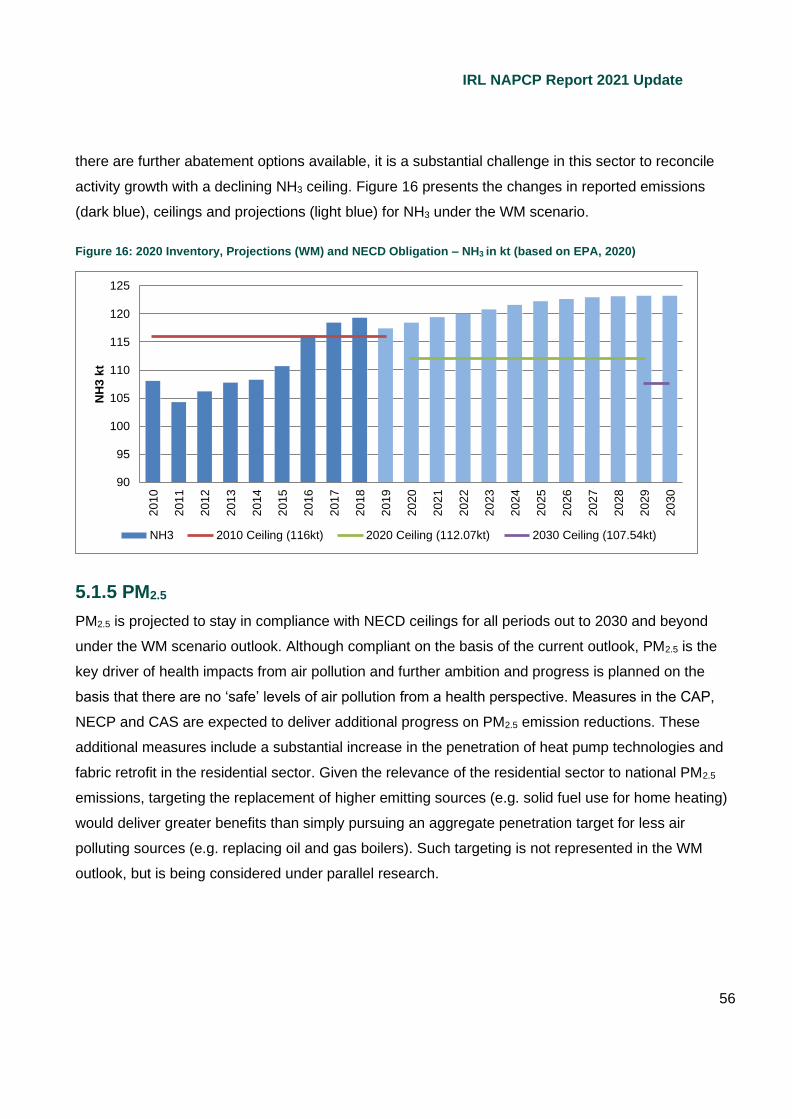
IRL NAPCP Report 2021 Update
56
there are further abatement options available, it is a substantial challenge in this sector to reconcile
activity growth with a declining NH3 ceiling. Figure 16 presents the changes in reported emissions
(dark blue), ceilings and projections (light blue) for NH3 under the WM scenario.
Figure 16: 2020 Inventory, Projections (WM) and NECD Obligation – NH3 in kt (based on EPA, 2020)
5.1.5 PM2.5
PM2.5 is projected to stay in compliance with NECD ceilings for all periods out to 2030 and beyond
under the WM scenario outlook. Although compliant on the basis of the current outlook, PM2.5 is the
key driver of health impacts from air pollution and further ambition and progress is planned on the
basis that there are no ‘safe’ levels of air pollution from a health perspective. Measures in the CAP,
NECP and CAS are expected to deliver additional progress on PM2.5 emission reductions. These
additional measures include a substantial increase in the penetration of heat pump technologies and
fabric retrofit in the residential sector. Given the relevance of the residential sector to national PM2.5
emissions, targeting the replacement of higher emitting sources (e.g. solid fuel use for home heating)
would deliver greater benefits than simply pursuing an aggregate penetration target for less air
polluting sources (e.g. replacing oil and gas boilers). Such targeting is not represented in the WM
outlook, but is being considered under parallel research.
2030 Ceiling (107.54kt) 2020 Ceiling (112.07kt) 2010 Ceiling (116kt) NH3
125
120
115
110
105
100
95
90
NH
3 k
t
20
10
20
11
20
12
20
13
20
14
20
15
20
16
20
17
20
18
20
19
20
20
20
21
20
22
20
23
20
24
20
25
20
26
20
27
20
28
20
29
20
30
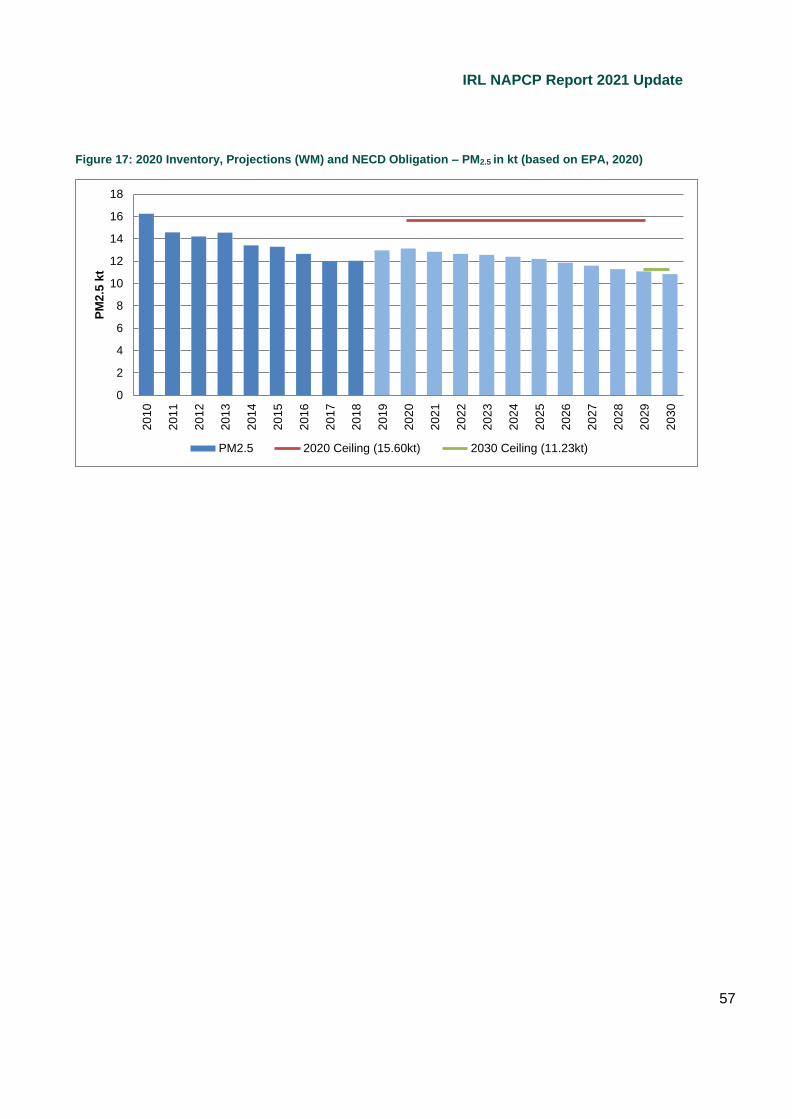
IRL NAPCP Report 2021 Update
57
Figure 17: 2020 Inventory, Projections (WM) and NECD Obligation – PM2.5 in kt (based on EPA, 2020)
18
16
14
12
10
8
6
4
2
0
PM2.5 2020 Ceiling (15.60kt) 2030 Ceiling (11.23kt)
PM
2.5
kt
20
10
20
11
20
12
20
13
20
14
20
15
20
16
20
17
20
18
20
19
20
20
20
21
20
22
20
23
20
24
20
25
20
26
20
27
20
28
20
29
20
30
IRL NAPCP Report 2021 Update
58
6 With Additional Measures Selected for Adoption by
Sector
EU Decision 2018/1522 reference section 2.7
The measures detailed in this section represent the major measures that are accounted for in the
officially submitted WAM scenario, that deliver progress over and above the emission projection
outlook for the WM projections in Section 5. The results of the potential emissions reductions from
these additional measures on the overall WAM scenario emission outlook is captured in section 7,
and greater detail is included in the PaM update. It is stressed again that all the measures are already
adopted and were accepted for inclusion in the WAM at the time of the official EPA projections
submission in April 2020.
6.1.1 Built Environment Sector
The Climate Action Plan sets a goal of achieving 600,000 heat pump installations by 2030. This
includes 400,000 to be retrofitted into existing homes. The plan also sets a goal of achieving 500,000
‘B2’ building energy retrofits by 2030 in Ireland. These two measures combined will deliver a greater
reduction in energy demand from the built environment, and can serve to both decarbonise and clean
emissions from the sector.
As of the most recent 2016 census, over 10% of households still relied on coal and peat for home
heating, with over 40% still reliant on oil. Whilst the CAP has a carbon focus on displacing oil users, it
is also recognised that a targeting of homes using solid fuel for both retrofit and heat pump installation
can offer a valuable dividend in terms of air, climate and just transition outcomes. Research is
forthcoming to quantify the potential of such targeting.
There are twelve key measures in place to support these targets which are included in the WAM
scenario and the PaMs file and their impact is outlined in more detail in Appendices 1 and 2.

IRL NAPCP Report 2021 Update
59
Table 4: Built Environment Sector PaM’s and Descriptions
Measure
(PaM file ref)
Description
Better Energy Communities (44107)
The Better Energy Communities scheme, introduced in 2012, supports sustainable energy upgrades to existing buildings, services, facilities and processes in the community sector. It promotes projects with an aggregation of upgrades across sectors within a single project and
favours projects where deeper retrofit can be demonstrated.
Better Energy Homes (73085)
Stimulating energy-efficiency actions to reduce energy usage by homeowners and the general public. Sustainable Energy Authority of Ireland grant-aids householders who want to make their homes more energy-efficient by providing incentives towards the implementation of energy efficiency measures including attic and wall insulation and heating controls with efficient boilers
and/or solar thermal.
Deep Retrofit Pilot (32691)
Deep retrofit is the significant upgrade of a building toward nearly zero energy requirements where the whole home is viewed as a system with respect to its energy performance. The core principle of the Deep Retrofit Pilot Programme is fabric first, i.e. maximising insulation to minimise energy demand. A highly efficient heating system will further reduce the energy consumed to meet the reduced energy demand. Mechanical ventilation is also required in order to ensure good indoor air quality. Deep Retrofit Pilot Programme requires that all homes funded through the Deep Retrofit Pilot Programme must achieve a minimum Building Energy Rating (BER) of A3 with an uplift in the BER of a minimum of 150 kWh/m2/yr. Airtightness of no more than 5 m3/hr/m2 must be achieved, hence the requirement for mechanical ventilation. Data monitoring – to monitor whole house performance and heating system performance – must also be provided for a period of three years. SEAI provides funding of up to 50% of the total energy-capital costs, project management and BER design/consultancy costs combined. There is a higher rate of subvention, up to 95%, for voluntary housing association homes and the private homes of those that are in energy poverty. However, this is only available as part of a wider project that includes non-energy poor homes and the energy poor component must make up no more than 25% of the total number of homes in each project. The 95% funding is not applicable for local authority housing. The With Additional Measures Scenario assumes a higher
level of activity as a result of the 2019 CAP.
Heat Pump Supports
– Domestic (84728)
A grant of up to €3,500 towards the capital cost of an electric heat pump is available to homeowners through an SEAI scheme. Homes must achieve a minimum heat loss requirement in order to be eligible. Under the With Additional Measures scenario it is assumed that 385,000
existing residential oil boilers, gas boilers and electric heaters are replaced with heat pumps.
Other Domestic Retrofit
(44077)
Additional housing retrofits, over and above existing SEAI programmes. The combined level of retrofits is determined by policy ambition in the CAP (500,000 homes to BER B2 or above by
2030). Ramp-up rate as per MACC trajectory for CAP.
Public Sector Capital Exemplars
(72411)
The programme is intended to create scalable investment in energy efficiency across key segments of the public sector. This includes the demonstration of best practice retrofit approaches, project procurement and delivery approaches, and testing pilot measures. The overall intent of this programme is to create and stimulate a long term renovation strategy in these key segments, grow capacity, and delivery savings. The With Additional Measures Scenario
assumes that delivery of savings continues until 2040.
Public Sector Programme (21408)
The programme aims to increase energy efficiency by providing a range of funded services including advice, mentoring and training to participating Public Sector bodies. Implementation of measures to enable the public sector contribute to its requirement to improve its energy efficiency by 50% by 2030 and for all public buildings to achieve a "B" BER rating by 2030 as per the CAP.

IRL NAPCP Report 2021 Update
60
Smart Meter Roll- Out – Household (62855)
The smart meter upgrade introduces smart meters across all Irish homes and business over a six- year period (2019 - 2024). It will be delivered in a phased approach, commencing with an initial delivery of 250,000 meters over 2019 - 2020. The First phase will predominantly be a meter replacement programme for customers whose current meter have reached maturity and require replacement. From 2020 the delivery of smart meters will significantly increase as approximately 500,000 smart meters will be installed in each of the four subsequent years, which cover both Phase 2 and Phase 3. The allocation of smart meters during all three phases will be across all customers through ESBN’s installation plan. Customers will have the opportunity to request a smart meter and those customers who do will be prioritised in the smart meter installation plan. The programme will involve the nation-wide replacement of over two million electricity meters, affecting all customers over a six-year period. Smart meters will make it possible for customers to have better information on their actual energy usage, end estimated bills and introduce new smart services and products such as Time of Use tariffs and smart Pay-As-You-Go. This will empower customers to take control of their energy usage and make more informed decisions
about their energy usage.
Warmer Homes Scheme (80880)
This measure targets vulnerable and fuel poor homes and provides funding for the installation of domestic energy efficiency upgrades via regional not-for-profit organisations and private contractors.
The With Additional Measures Scenario assumes a higher level of activity as a result of the 2019
CAP.
Warmth and Wellbeing Pilot (90141)
The Warmth & Wellbeing scheme is an initiative led by the Department of Communications, Climate Action and Environment (DCCAE) in conjunction with the Department of Health (DoH), the Health Service Executive (HSE) and Sustainable Energy Authority of Ireland (SEAI). It aims to make homes warmer and healthier to live in by providing extensive, deeper energy efficiency upgrades to those in energy poverty that are living with chronic respiratory conditions. The scheme is currently available in Dublin 8, 10, 12, 22 and 24; however, if the pilot is deemed successful, based on findings from research being carried out in parallel, the scheme may be rolled out nationwide in the future. Most homes are receiving external wall insulation, attic insulation and new efficient heating systems. A smaller percentage is also receiving new windows and doors (where current are single glazed or no longer performing thermally). To date, SEAI have not installed any renewable technologies on these homes, however are looking to carry out some such works in the future.
90-95% of heating systems installed are high efficiency gas boilers. The With Additional Measures
Scenario assumes a higher level of activity as a result of the 2019 CAP.
2019 Building Regulations – Dwellings (53532)
NZEB (Nearly Zero Energy Buildings) will be introduced to all new domestic buildings, it sees a reduction in the energy performance of approximately 25% compared to the previous 2011 regulations. Also required is a Renewable Energy Ratio of 20%, meaning that 20% of the primary energy use must be from renewables onsite or nearby. The regulations also introduced Major Renovation. For Domestic projects this has been defined in the regulations as applying where external walls are cladded or drylined or structure replaced and requires the heating system and ceiling insulation is upgraded to meet minimum standards or alternatively the building achieves a
B2 Building Energy Rating
Heat Pump Non Domestic (77422)
Through the Support Scheme for Renewable Heat consumers in industrial, services and public sectors can avail of a grant towards the cost of an electric heat pump. The grant, administered by
SEAI, can cover up to 30% of eligible costs.

IRL NAPCP Report 2021 Update
61
6.1.2 Transport Sector
The Climate Action Plan sets a goal of achieving almost one million EVs on the road in Ireland by
2030. This is to be comprised of 840,000 passenger EVs, 95,000 electric light goods vehicles, and
1,200 low-emission buses. The accelerated transition is to be supported by the provision of
corresponding charging infrastructure, as well as packages of supports including subsidies, tax
advantages, and other policies to encourage a transition away from internal combustion engines
(ICEs) building on the measures and supports outlined in section 4.2.1. Additional renewables targets
have also be set as part of the 2019 CAP, and while the impact of these on air pollution have not
been estimated yet, they are adopted and will feature in future inventory and projections. As such we
have included for completeness.
Measure
(PaM file ref)
Description
Electric Vehicle Deployment (49420)
Grant support for new electric vehicles. Electric vehicles were identified as an important element in efforts to achieve both energy efficiency and renewable energy targets as part of the EU Climate Change-Energy Package. The With Additional Measures scenario assumes 935,000 Electric Vehicles on the road by 2030. This includes approximately 550,000 battery electric
vehicles and 288,000 plug in hybrid electric vehicles.
Renewables – With Additional Measures scenario – Transport component (61444)
This measure encompasses the development of renewable energy in transport. For example, it is assumed that the Biofuel Obligations Scheme is developed further. Incremental increases are assumed to occur with 10% blend for petrol (E10) and a 12% blend for diesel (B12) in place in 2030. Under the With Additional Measures scenario assumes Ireland will have achieved 33.5%
renewable (RES-T) share in 2030.
6.1.3 Agricultural Sector
The agriculture sector is the major source of NH3 emissions in Ireland, accounting for over 99% of the
national total. It is also a source of NMVOC and NOX. Between 1990 and 2018 the sector has seen
growth in total NH3 emissions from approximately 109kt to 118kt.
In 2018, Teagasc produced a Marginal Abatement Cost Curve for greenhouse gas mitigation
identifying potential measures focused in the areas of agricultural mitigation, land use mitigation
(mainly carbon sequestration) and energy mitigation (Lanigan et al., 2018). Measures in the 2018
MACC included options that had been implemented to various degrees, albeit that the focus was on
identifying thresholds of future abatement potential. Whilst the emissions trajectory has been upward
for much of the last decade, there have been initiatives and actions working to counter or supress
emissions growth from the sector.
IRL NAPCP Report 2021 Update
62
For the agricultural sector, the WAM scenario includes the physical management measures which
were also included in the GHG projections and Climate Action Plan. The specific measures that are
included in the WAM package are listed below along with the expected level of implementation by
2030. The implementation is assumed to increase linearly to 2030 with the exception of the reduction
of crude protein in pigs which is assumed to occur from 2020.
A number of other measures which have been adopted are not included in the WAM scenario yet.
This includes the effects of Economic Breeding Index or Beef genomics (more details in Chapter 8),
as data was not available on the impact of these and it is currently difficult to include genomic related
measures in emission savings calculations. It is envisaged that these programmes will be
incorporated in future projections should the data and approaches to do so become available.
Measure
(PaM file ref)
Description
Reduction in the crude protein content of pig feed
(12851)
Reduction in the crude protein content of pig feed by 1%
Low emission spreading (LESS) of pig slurry (32288)
Low emission spreading of pig slurry: 94% of slurry spread by LESS by 2030 with a 50:50 split between trailing hose and trailing shoe application
Low emission spreading (LESS) of cattle slurry (96259)
50% of dairy cow slurry applied through LESS with a 50:50 split between trailing hose and trailing shoe; 50% of other cattle slurry applied through LESS with a 50:50 split between trailing hose and trailing shoe
Introduction of clover into grass swards (62603)
Introduction of clover into grass swards equivalent to a saving of 17,400 tonnes of fertiliser nitrogen in 2030
Inhibited urea
(13374)
Replacement of 50% of the calcium ammonium nitrate fertiliser applied to grassland with
inhibited urea products
6.1.4 Power Generation and Renewables
Moneypoint is Ireland’s sole coal-burning electricity generation plant. As of 2020 Ireland also has peat
fired power generation. As part of the With Additional Measures scenario two peat stations are
assumed to run on 100% peat to the end of 2020 and PSO support finishes at the end of 2019. For
2020 the operation of the peat plants is determined by the electricity market. The third peat station
operates to the end of 2023 with 30% co-firing. In this scenario the Moneypoint power station is

IRL NAPCP Report 2021 Update
63
assumed to operate in the market up to end 2024 at which point it no longer generates electricity from
coal as set out in the Climate Action Plan.
Additional renewables targets have also be set as part of the 2019 CAP, while the impact of these on
air pollution have not been estimated yet, they are adopted and will feature in future inventory and
projections. As such we have included for completeness.
Measure
(PaM file ref)
Description
Replacement of coal fired electricity generation with natural gas
(63495)
This measure concerns the replacement of coal fired electricity generation with natural gas fired electricity generation. Under the With Additional Measures scenario, the coal fired electricity generation plant is assumed to operate in the market up to end 2024 at which point it no longer generates electricity from coal.
Renewables – With Additional Measures scenario – Electricity component (62667)
This measure encompasses the development of renewable energy in electricity generation (RES- E). This is mainly a result of further expansion in wind energy (comprising 3.5 GW offshore and approximately 8.2 GW onshore). Expansion of other renewables (e.g. solar photovoltaics) also occurs under this scenario. The With Additional Measures scenario assumes Ireland will have
achieved 70% renewable (RES-E) share in 2030.
Renewables – With Additional Measures
scenario – Heat
component (87100)
This measure encompasses the development of renewable energy for heat. The With Additional Measures scenario assumes Ireland will have achieved 24% renewable heat (RES-H) share in 2030.

IRL NAPCP Report 2021 Update
64
6.1.5 Other Industry and Enterprise
A number of other measures have also been introduced which are not specifically built environment
related, as instead they support industry, enterprise and the public sector to take other measures to
improve energy efficiency and enhance awareness, skills and education within their organisations.
Measure
(PaM file ref)
Description
Accelerated Capital Allowance for Energy Efficient Equipment (43352)
The Accelerated Capital Allowance for Energy Efficiency Equipment (ACA), introduced in 2008, aims to improve the energy efficiency of Irish companies by encouraging them to purchase energy saving technologies. The ACA is a tax incentive for companies paying corporation tax and aims to encourage investment in energy efficient equipment. The ACA offers an attractive incentive whereby it allows companies to write off 100% of the purchase value of qualifying energy efficient equipment against their profit in the year of purchase.
The With Additional Measures Scenario assumes that delivery of savings continues until 2040.
CHP Deployment – Public and Business sectors (88008)
The CHP Deployment programme provided grants for selected renewable and alternative heat sources and was designed to prime the market and to establish a supply chain. The CHP Deployment programme provided grant aid towards the installation of small scale CHP, up to 1 MWe at sites with a suitable heat load.
The With Additional Measures Scenario assumes that delivery of savings continues until 2040.
EXEED Certified Grant (88101)
EXEED Certified (Excellence in Energy Efficiency Design) is an energy efficiency design management process. The process sets out steps for designing in energy efficiency and energy management into design projects, for both new investments and upgrades to existing assets. The EXEED Grant Scheme was launched in 2016 with an incentive of up to €500,000 for industrial and commercial businesses to use the EXEED process to design in energy efficiency and energy management into their new or existing assets. One of the purposes of the EXEED process is to move away from looking at energy efficiency measures in isolation. Instead EXEED’s scope treats an asset as an energy system and converges on a solution that ranks the priority of different energy efficiency investments relative to that system.
The With Additional Measures Scenario assumes that delivery of savings continues until 2040.
Sustainable Energy Authority of Ireland Large Industry
Programme (49049)
The Large Industry Energy Network (LIEN) is a voluntary network, facilitated by the Sustainable Energy Authority of Ireland, of companies working to maintain strong energy management and environmental protection practices. The With Additional Measures Scenario assumes that
delivery of savings continues until 2040.
Small and Medium Enterprises (SME)
Programme (69529)
The programme aims to increase energy efficiency in SMEs through providing advice, mentoring, training and grant-funding to participating SMEs.
The With Additional Measures Scenario assumes that delivery of savings continues until 2040.
6.1.6 Cross-Sectoral measures
There are two cross sectoral measures included in the WAM scenarios which target improvements
across a range of sectors. These are (i) the national carbon tax which aims to reduce energy
consumption in the residential and transport sectors and (ii) the Supplier Obligation Scheme which
aims to increase the uptake of energy efficiency measures across a number of sectors.
IRL NAPCP Report 2021 Update
65
Measure
(PaM file ref)
Description
Carbon Tax (38579) Incorporates a price signal for carbon on the non-ETS sector, specifically fuels used for heating and transport. The tax applies to petrol, diesel, kerosene, marked gas oil (for agricultural use), Liquid Petroleum Gas (LPG), fuel oil, natural gas, coal and commercial peat. Under the With
Additional Measures scenario the carbon tax increases to €80 per tonne of CO2 by 2030.
Supplier Obligation Scheme (67648)
The Energy Efficiency Obligation Scheme (EEOS) is being implemented pursuant to the Energy Efficiency Directive 2012, Article 7. The Directive imposes a legal obligation on Member States to achieve new savings each year from 1 January 2014 to 31 December 2020 of 1.5% of the annual energy sales to final customers of all energy distributors and all retail energy sales companies by volume, averaged over the most recent three-year period prior to 1 January 2013. The target is cumulative, which means that it is based on incremental annual savings that deliver a total volume of savings at the end of the obligation period in 2020. Ireland has chosen to effect the provisions of Article 7(9) of the Directive, opting to combine alternative policy measures and an energy efficiency obligation scheme to meet the national target. Obligated parties under the EEOS are energy distributors and retail energy sales companies that have market sales in Ireland of greater than 600 GWh final sales in any relevant year, regardless of the sector they supply. Obligated parties’ targets are allocated according to their proportion of energy market sales volume in Ireland. Member States are obliged to put in place measurement, control and verification systems to verify savings by obligated parties. The positions against targets for each year are to be achieved, audited and finalised by 31 March of the following year. The target allocated to obligated parties is 550 GWh PPE for the period 2014 to 2016, 625GWh PPE for 2017 and 700GWh PPE from 2018 to 2020. This is sub-sectoralised as 75% non-residential, 20% residential and 5% energy poverty residential. The minimum achievement for the period 2014-2016 is Year 1 60%, Year 2 75% cumulative and Year 3 90% cumulative. From Year 4 onwards, the minimum cumulative achievement will be 95% cumulative. Obligated parties can choose to achieve energy savings independently or through partnerships with service providers in the market. The scheme permits the exchange of validated savings between obligated parties in certain circumstances. Obligated parties can buyout up to a maximum of 30% of their total cumulative target, whether or not they have achieved their minimum cumulative target. For any portion of the minimum annual target not achieved, exchanged or bought out, a penalty will be imposed. The price of buyout and penalty will be set and published by the Minister and reviewed as appropriate. In the Residential and Energy Poverty sectors energy savings from energy conservation measures are calculated using deemed credits per measure based on Building Ratings under EPBD. In the Non-Residential sector scaled or measured savings based on ISO 50015, IPMVP or equivalent are used to calculate savings. Project
data is uploaded to SEAI bespoke systems and is subject to Evaluation and Audit.

IRL NAPCP Report 2021 Update
66
6.1.7 PaMs for Consideration and Adoption
In the previous NAPCP there were 34 PaMs presented for consideration. In this update there are 29
which have been selected for adoption as outlined in the sections above and included in the PaM’s
tool.
To ensure coherence, these measures build upon the existing cross-Government measures that are
already delivering results but have been intensified to reflect our increased ambition for greenhouse
gas and air pollutant reductions. The measures currently adopted and included in the IIR put Ireland
back on a pathway to compliance for all the main pollutants with the exception of ammonia.
New policies and measures are currently being developed across Government as part of the update
to the Climate Action Plan for 2021, and these will also have an impact on air quality emissions.
Currently there is no data available on the impact of these measures so it was not possible to include
them for consideration in this update.
IRL NAPCP Report 2021 Update
67
7 Projected ‘With Additional Measures’ Scenarios
EU Decision 2018/1522 reference section 2.8
This section provides details the official WAM emission projections for Ireland. These are the latest
officially submitted emission projections available at the time of compiling this updated NAPCP.
7.1 Projected emission reductions (WAM)
In Table 5 the data shows that under the WAM scenario outlook, SO2 and PM2.5 are both in
compliance for both the 2020 and 2030 ceilings. In the case of NMVOC, emissions under the WAM
scenario (excluding emissions from agricultural categories 3B and 3D) are projected to exceed the
2020 and 2030 targets. In the scenario with adjustments, that also exclude emissions from spirit
production43, the emission projections predict compliance with the 2020 target. Under this scenario
emissions in 2030 are projected to be 45.3kt which is approximately 0.08kt above the emission
reduction target for 2030. In the case of NOX compliance is achieved on the outlook for 2025 to 2030
period, with an exceedance in the early part of the 2020 to 2025 period only. However, as noted in
Section 4, it is expected that the inventory adjusted compliance total for NOX will see compliance
achieved in the 2020 phase also. Nonetheless it is noted that NOX and NMVOC are close to their
compliance limits in 2030 and therefore will be carefully monitored over time. Table 5 also shows that
under the WAM scenario NH3 remains in non-compliance in the 2020 and 2030 phases. However, for
the first time, the WAM scenario outlook for NH3, includes additional measures specific to agriculture
that deliver notable improvements over the performance anticipated in Table 3 for the WM scenario
NH3 outlook. Discussions for individual air pollutants are presented in this section and greater detail
on specific measures and their contributions (where available) are included in the PaM update
attached with this submission.
43 On the basis that NMVOCs from category 2.H (Spirits) were included in the 1990-2015 inventory for the February 2017
inventory submission (after the 2016 NEC Directive came into effect).

IRL NAPCP Report 2021 Update
68
Table 5: Projected emissions reductions WAM (EU reference 2.8.1.)
Total emissions (kt), consistent with
inventories for year x-2 or x-3 (year to be specified) (M)
Projected % emission
change achieved compared with 2005 (M)
National emission reduction commitment for 2020-2029 (% reduction compared with 2005 levels) (M)
National emission reduction commitment from 2030 (% reduction compared with 2005 levels ) (M)
Pollutants (M)
2005
base year
2020
2025
2030
2020
2025
2030
SO2 73.07 13.41 8.25 5.74 - 82% - 89% - 92% 65% 85%
NOx 131.05 74.41 52.65 39.64 - 43% - 60% - 70% 49% 69%
Total NMVOC
75.11 68.8 68.5 66.6 - 8% - 9% - 11% 25% 32%
Adjusted NMVOC
66.58 49.23 48.15 45.36 - 26% - 28% - 32% 25% 32%
NH3 113.2 118.45 114.73 111.85 + 5% + 1% - 1% 1% 5%
PM2.5 19.03 12.9 10.85 8.27 32% 43% 57% 18% 41%
Date of emission projections (M) - April 2020
As with Table 3, Table 5 includes no adjustments or special notes regarding SO2, NH3 or PM2.5. Again
for NOX, agricultural categories 3B and 3D are removed from the 2005 inventory base and projections
to assess compliance (as per Article 4 of 2016 NECD). For NMVOC, the same adjustments for
agricultural categories 3B and 3D are included, as well as the further adjustment to remove 2.h.2
(NMVOC from spirits) that is again applied to both the 2005 inventory base and emission projections
for the purpose of compliance assessment.
7.1.1 NOx
The WAM outlook for NOX shows compliance from 2022 onwards with the 2020 ceiling, and from the
outset for the 2030 ceiling. The emission reductions are driven largely by reductions in the transport
sector, which are associated with electrification and the gradual penetration of cleaner Euro standard
vehicles across both passenger cars and commercial fleets. Whilst the official emission projections for
2019 to 2021 show an exceedance, revisions to the projections in line with COVID-19 impacts and
post COVID-19 actions (e.g. remote working, less motorised travel) may also contribute to lower
emissions than in those years prior to 2020. This will be captured in the 2021 official national emission
projections. However, on review of the compliance figure for 2018 and the outlook where adjustments
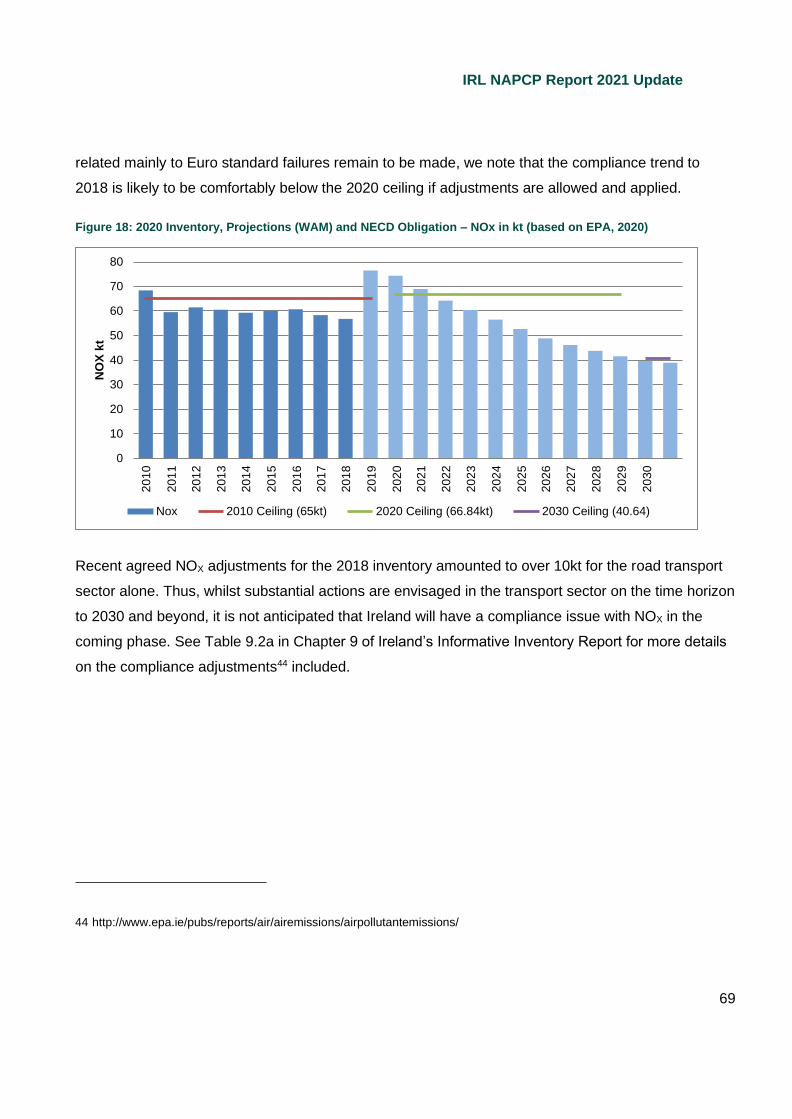
IRL NAPCP Report 2021 Update
69
related mainly to Euro standard failures remain to be made, we note that the compliance trend to
2018 is likely to be comfortably below the 2020 ceiling if adjustments are allowed and applied.
Figure 18: 2020 Inventory, Projections (WAM) and NECD Obligation – NOx in kt (based on EPA, 2020)
Recent agreed NOX adjustments for the 2018 inventory amounted to over 10kt for the road transport
sector alone. Thus, whilst substantial actions are envisaged in the transport sector on the time horizon
to 2030 and beyond, it is not anticipated that Ireland will have a compliance issue with NOX in the
coming phase. See Table 9.2a in Chapter 9 of Ireland’s Informative Inventory Report for more details
on the compliance adjustments44 included.
44 http://www.epa.ie/pubs/reports/air/airemissions/airpollutantemissions/
80
70
60
50
40
30
20
10
0
Nox 2010 Ceiling (65kt) 2020 Ceiling (66.84kt) 2030 Ceiling (40.64)
NO
X k
t
20
10
20
11
20
12
20
13
20
14
20
15
20
16
20
17
20
18
20
19
20
20
20
21
20
22
20
23
20
24
20
25
20
26
20
27
20
28
20
29
20
30

IRL NAPCP Report 2021 Update
70
7.1.2 SO2
The WAM scenario outlook for SOX extends the gap between estimated future emissions and the
defined ceilings further again than in the WM scenario with emissions reducing to a 2030 level some
92% below the emissions reported in 2005 in Ireland.
Figure 19: 2020 Inventory, Projections (WAM) and NECD Obligation – SO2 in kt (based on EPA, 2020)
7.1.3 NMVOC
The WAM outlook for NMVOC is presented in the same manner as the WM outlook for NMVOC in
section 4.1.3. Specifically, Figure 20 presents total NMVOC emissions with the removal of agricultural
categories 3B and 3D only. Ceilings are unadjusted and exceedances persist for both the 2020 and
2030 periods under the WAM. However, under Figure 21, adjustments relating to category 2H2 are
applied to both projected emissions and the ceilings (through a revised base year adjustment), The
outlook under the adjusted WAM of Figure 21 shows compliance with the ceiling from 2020-2029, and
a marginal compliance with the ceiling from 2030 onwards.
Performance in regard to this latter ceiling will be kept under review and will be considered as part of
the implementation of the CAS to consider what further additional measures will be required into the
future.
45
40
35
30
25
20
15
10
5
0
SO2 Emissions 2010Ceiling (42kt) 2020 Ceiling (25.57kt) 2030 Ceiling (10.96kt)
SO
2 k
t
20
10
20
11
20
12
20
13
20
14
20
15
20
16
20
17
20
18
20
19
20
20
20
21
20
22
20
23
20
24
20
25
20
26
20
27
20
28
20
29
20
30

IRL NAPCP Report 2021 Update
71
Figure 20: 2020 Inventory, Projections (WAM) and NECD Obligation – Total NMVOC in kt (based on EPA, 2020)
Figure 21: 2020 Inventory, Projections (WAM) and NECD Obligation – Adjusted NMVOC in kt (based on EPA, 2020)
2030 Ceiling (51.08kt) 2020 Ceiling (56.34kt) 2010 Ceiling (55kt) NMVOC
80
70
60
50
40
30
20
10
-
2030 Ceiling (45.28kt) 2020 Ceiling (49.94kt) 2010 Ceiling (55kt) NMVOC
60
50
40
30
20
10
-
NM
VO
C k
t N
MV
OC
kt
20
10
20
10
20
11
20
11
20
12
20
12
20
13
20
13
20
14
20
14
20
15
20
15
20
16
20
16
20
17
20
17
20
18
20
18
20
19
20
19
20
20
20
20
20
21
20
21
20
22
20
22
20
23
20
23
20
24
20
24
20
25
20
25
20
26
20
26
20
27
20
27
20
28
20
28
20
29
20
29
20
30
20
30

IRL NAPCP Report 2021 Update
72
7.1.4 NH3
Previous agriculture projections have included a small difference between the WEM and WAM
scenarios (related to the one nitrogen use efficiency measure under the WAM scenario). The April
2020 projections now incorporate the Teagasc GHG MACC as it was included in the 2019 Climate
Action Plan, and the impacts of these measures have been incorporated into the WAM scenario
projections where possible. In the past the distinction between the scenarios has been focused on
energy sectors, and so this development marks progress regarding the refinement of forecast
activities and actions relating to the agriculture sector. Nonetheless, whilst some measures have been
incorporated into the NH3 outlook, which breaks somewhat from the rise and plateau that have been
in evidence in the past, it is apparent from Figure 22 that further action is required. Future proposed
measures are outlined in more detail in Section 8.
Figure 22: 2020 Inventory, Projections (WAM) and NECD Obligation – NH3 in kt (based on EPA, 2020)
2030 Ceiling (107.54kt) 2020 Ceiling (112.07kt) 2010 Ceiling (116kt) NH3
120
115
110
105
100
95
90
85
80
NH
3 k
t
20
10
20
11
20
12
20
13
20
14
20
15
20
16
20
17
20
18
20
19
20
20
20
21
20
22
20
23
20
24
20
25
20
26
20
27
20
28
20
29
20
30
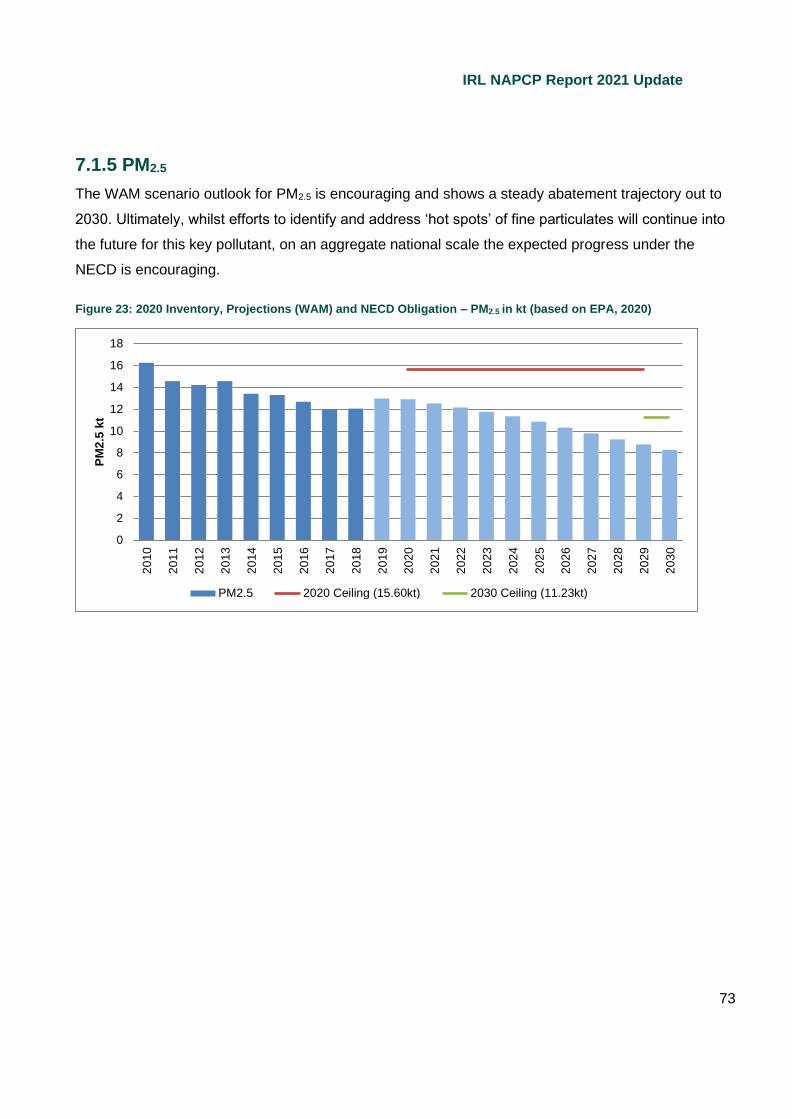
IRL NAPCP Report 2021 Update
73
7.1.5 PM2.5
The WAM scenario outlook for PM2.5 is encouraging and shows a steady abatement trajectory out to
2030. Ultimately, whilst efforts to identify and address ‘hot spots’ of fine particulates will continue into
the future for this key pollutant, on an aggregate national scale the expected progress under the
NECD is encouraging.
Figure 23: 2020 Inventory, Projections (WAM) and NECD Obligation – PM2.5 in kt (based on EPA, 2020)
18
16
14
12
10
8
6
4
2
0
PM2.5 2020 Ceiling (15.60kt) 2030 Ceiling (11.23kt)
PM
2.5
kt
20
10
20
11
20
12
20
13
20
14
20
15
20
16
20
17
20
18
20
19
20
20
20
21
20
22
20
23
20
24
20
25
20
26
20
27
20
28
20
29
20
30

IRL NAPCP Report 2021 Update
74
7.2 Non-linear emission reduction trajectory
EU Decision reference section 2.8.2
The graphs included in this section show that under the current WAM scenario outlook from the
official submitted projections, Ireland will follow a progressive reduction pathway between 2020 and
2030 for SO2, NOX, PM2.5 and adjusted NMVOC emissions. The exception is NH3 where the graphs
show a non-linear emissions reduction trajectory up to 2030.
In general the outlook for the agriculture sector in terms of activity and emissions remains somewhat
unsettled at this point in time. The ultimate impact of Brexit on Irish agriculture is unquestionably
relevant to the outlook, in particular for the beef herd, but it remains unknown as to how exactly these
matters and final trade agreements will develop.
Similarly, the latest marginal abatement cost curve for NH3 has yet to be applied in the context of the
future WAM, and therefore the implications of the selected measures from that menu will not impact
on the emissions outlook until updated national emission projections are submitted in 2021. As such,
whilst agriculture still retains a non-linear emission reduction trajectory, this is expected to change in
the next official emission projections submission.
7.3 Flexibilities
EU Decision 2018/1522 reference section 2.8.3
The new NEC Directive allows Member States some flexibilities in achieving compliance for air
pollution and they must report doing so, after which the rationale for their use is considered by the
European Commission for approval. Flexibilities granted to the Member States include45:
1. Adjustments in inventory estimates: Member States may establish, in accordance with Part 4
of Annex IV, adjusted annual national emission inventories for sulphur dioxide, nitrogen
oxides, non-methane volatile organic compounds, ammonia and fine particulate matter where
non-compliance with their national emission reduction commitments would result from
applying improved emission inventory methods updated in accordance with scientific
knowledge.
45 From report on “A Critical Guide to The New National Emission Ceilings Directive”
IRL NAPCP Report 2021 Update
75
Adjustments to inventory estimates have been made, approved by the EU Commission, and
are expected to continue. Details of the adjustments are set out in the Informative Inventory
Report which has been referenced earlier in this updated NAPCP.
2. Rolling three-year average: The new Directive allows Member States to calculate their
emissions based on a three-year average in the event of an exceptionally cold winter or an
exceptionally dry summer.
This flexibility is not currently being applied.
3. Exceptional events related to the energy sector: This flexibility allows the Member State to
breach the NERC limit in the case of unforeseeable adverse events, and when all reasonable
efforts have been put in place to meet the NERC and additional measures would lead to
disproportionate costs, substantially jeopardise national energy security or pose a substantial
risk of energy poverty to a significant part of the population. The State must keep the period of
non-compliance as short as possible.
This flexibility is not currently being applied.

IRL NAPCP Report 2021 Update
76
7.4 Projected impacts on ambient air quality and the
environment
EU Decision 2018/1522 reference section 2.5.2.1 and 2.6.2
Ireland does not currently have the ability to provide detailed projections in relation to future ambient
air quality for either the WM or WAM scenarios. This functionality is being considered as part of the
Clean Air Strategy. For now, pollutant levels across the monitoring network are being closely
monitored.
Overall, given the general trajectory of national emissions as well as the sustained record of a high
level of AAQD compliance in Ireland, Ireland is not anticipating any sustained exceedances of EU
ambient air pollution limits into the future.
Using the more stringent WHO guidelines for air quality, four air pollutants warrant closer observation.
These pollutants are PM10 / PM2.5, which are mainly associated with residential solid fuel burning and
transport emissions from diesel; NO2, which is typically found in higher concentrations in urban
centers and is associated with fossil fuel powered transport and congestion; O3 at a regional scale, in
part due to the impacts of transboundary ozone; and PAH, associated with the burning of fossil fuels.
Measures outlined in both the WM and WAM scenarios which encourage active travel, increased use
of public transport and increase the number of electric vehicles on the road can also contribute to a
reduction in localised emissions from the road transport sector. Similarly, measures to retrofit the built
environment will cut energy demand and emissions from the residential sector, whilst initiatives to
replace fossil fuel heating systems with heat pumps can similarly have a positive impact on ambient
air quality, specifically where solid fuel sources are targeted.
There is a credible expectation that the measures and policies described in both scenarios will
continue to have a further positive impact on aggregate national emissions, and thereby ambient air
quality to 2030 and beyond.
The expansion of the network of monitoring stations through the National Ambient Air Quality
Monitoring programme has been of value in regard to monitoring and managing national air quality. It
is acknowledged that this increased monitoring activity may help to identify new ‘hotspot’ areas where
further action and initiatives are required into the future to tackle more localised impacts that can be
missed on the broader scale assessments. In addition the EPA has secure EU LIFE funding for
further development modelling and forecasting, which will feed into the next NAPCP.

IRL NAPCP Report 2021 Update
77
8 Additional Policy Options under Consideration
The updated PaM submission attached to this NAPCP update includes the details that were available
in the earlier part of 2020 when the most recent (April 2020) national emission projections were
developed. As indicated from the outset however, it is expected that further measures will be included
in the next national emission projections in 2021 that will account for some of more recent policy
developments that are not yet recognised in the WAM scenario described in Section 6.
It should also be noted many of the measures highlighted in this report and prioritised by Government
are policies and measures that work to align the challenges of both air and climate. The objective of
more recent national strategies and plans has been to develop and implement packages of measures
that effectively support an integrated approach to dealing with climate, air and broader environmental
challenges.
Ireland is projected to be on track to achieve compliance with the emissions ceilings for SO2 and PM2.5
by 2030 with a reasonable margin of compliance. However in relation to NOX and NMVOCs, while
compliance is indicated to be achieved by 2030, the compliance margin is smaller. These issues are
being considered in the finalisation of the Clean Air Strategy which will establish a framework for the
development of additional measures to be developed to increase the margin of compliance.
Additionally, using the most recent projections, Ireland is still expected to exceed all NH3 emissions
limits. However significant advancements have been made in this regard since the last NAPCP
submission and the last projections were produced.
The priority of this section of the document is to focus on the options that are available to help Ireland
reduce emissions of pollutants that are expected to be close to their ceiling values, or indeed exceed
the NECD ceiling limits for 2030.

IRL NAPCP Report 2021 Update
78
8.1 Agriculture
8.1.1 Teagasc MACC 2020
Teagasc have developed an updated marginal abatement cost curve (MACC) for NH3 which indicates
a menu of options that can deliver the necessary compliance in the 2020 and 2030 periods. As of
September 2020, a new ammonia MACC has been produced and released by Teagasc46. Table 6
presents an excerpt from the 2020 MACC which suggests up to 15.26kt of NH3 abatement potential.
Figure 24 details some of the main options.
Table 6: Excerpt from the NH3 MACC of abatement potential and net marginal costs associated with individual measures (Teagasc, 2020)
However, the latest WAM projections from April 2020 were prepared prior to the latest ammonia
MACC being available and thus the official national emission projections cannot at present indicate
the path to compliance. However, it is expected that subject to availability of the necessary
information, the 2021 official projections will adopt additional measures and higher penetration rate
46 https://www.teagasc.ie/media/website/publications/2020/NH3-Ammonia-MACC.pdf

IRL NAPCP Report 2021 Update
79
targets for key NH3 measures that will deliver the additional cumulative abatement required to achieve
compliance.
Figure 24 is not an official projection but provides a scenario of what a possible pathway could look
like. This scenario illustrates the mitigation potential identified in the latest agricultural MACC for
ammonia, which is expected to inform the basis upon which subsequent official national emission
projections for NH3 are prepared. Note that the projected period in the draft MACC documentation
does not extend beyond 2030, and as such the outlook remains static from 2030 onwards.
Figure 24: 2020 Inventory, a Projections scenario with full MACC mitigation applied and NECD Obligation – NH3 in kt (Envecon Decision Support, 2020)
The impact of the new NH3 MACC is illustrated in Figure 24. It brings a 50% replacement of CAN with
inhibited urea forward to 2025 compared to 2030 in the national emission projections. With respect to
clover, the savings in the reported WAM scenario equate to 15% of dairy farmers (in the Teagasc
national farm survey) adopting, whereas the new NH3 MACC suggests 25%. For cattle slurry, the new
NH3 MACC adopts a target of 75% spread using LESS by 2025 and 90% by 2030. The new MACC
suggests that the crude protein content in the weaner, finisher stage 1 and stage 2, feed could be
reduced by 1%, 2% and 2% points respectively without adversely affecting output in 2021 and in all
subsequent years. For pig slurry, the NH3 MACC assumes that a total of 60% of all pig slurry spread
is to be applied using low emissions slurry spreading by 2022. This increases to 75% by 2025 and
90% by 2030. It is assumed that half of the slurry is applied by trailing shoe and half by trailing hose.

IRL NAPCP Report 2021 Update
80
All the other measures in the new MACC are therefore additional to what has been included in the
reported WAM scenario.
8.1.2 Teagasc National Farm Survey
Ireland’s capacity in Farm Accountancy Data Network (FADN) data collection under the Teagasc
National Farm Survey47 substantially exceeds the data requirements set out by the EU.
Developments in recent years mean that the National Farm Survey now incorporates environmental
as well as economic variables, making it possible to track developments in environmental efficiency.
Through the FADN, Teagasc has championed the future development of the FADN as an
environmental monitoring tool. Manure management practice data from the NFS48 will be incorporated
in the 2021 national emission inventory submission estimates for the agriculture sector and it is
expected that as new data becomes available it will also be incorporated into future inventory and
projection scenarios where appropriate.
8.1.3 Beef Data and Genomics Programme
This measure collects data and collates it into a breeding index. This index helps farmers to select
robust and resource efficient suckler cow replacements thus lowering the intensity of emissions of
both ammonia and greenhouse gases by improving the quality and efficiency of the national beef
herd. By 2017 there were over 24,000 applicants to the programme and approximately one million
animals genotyped. It is estimated that there will be a 4.5% improvement in carbon efficiency per
animal by 2020.
8.1.4 Knowledge Transfer Programme
This programme facilitates the transfer of knowledge of information from research and advisory
services to farmer discussion group networks that cover a wide range of topics including sustainability
and farm efficiency practices that lead to mitigation of harmful emissions. To date, knowledge transfer
groups on sustainability such as nutrient management planning have over 20,000 participants. This is
a critical program with regard to delivering practice change into the future in the sector.
47 https://www.teagasc.ie/rural-economy/rural-economy/national-farm-survey/
48 https://www.teagasc.ie/rural-economy/rural-economy/national-farm-survey/national-farm-survey-reports/
IRL NAPCP Report 2021 Update
81
8.1.5 Origin Green
The Origin Green49 sustainability programme operates on a national scale to unite government, the
private sector and food producers in a common vision to improve the environmental performance of
individual farms and food production. The Origin Green programme has conducted over 137,000
carbon footprint audits across Ireland. These audits focus on measuring key production efficiencies at
farm level. Improving efficiencies in these areas contributes to reducing greenhouse gas and
ammonia emissions
8.2 Other Measures
8.2.1 Renewable Electricity Support Scheme (RESS)
RESS is a competitive auction-based scheme which invites renewable electricity generation projects
to bid for capacity and receive a guaranteed price for the electricity they generate.
The primary policy objective of RESS is delivery of renewable electricity in a sustainable, cost
effective and secure framework. However, there are broader policy objectives delivered under RESS,
namely technology diversification and support for community ownership and participation.
The Terms and Conditions for the first RESS auction (RESS-1) competition were published in
February 2020. The RESS auction qualification window closed at the end of April and qualification
results were accepted in July 2020. Formal State Aid notification of the scheme was received from
the EU Commission in July 2020. The final RESS-1 results were approved by Government in
September 2020.
All successful RESS-1 projects are in receipt of a notice of award. These projects are required to
commence operation before 2023 at the latest.
Key learnings from RESS-1 are currently being reviewed. The development of the second RESS
auction (RESS-2) has commenced along with preparation of a timetable for future auctions.
8.2.2 Changes to timeline of Peat Phase Out
Both peat fired electricity generation plants, Edenderry and Moneypoint were awarded REFIT 3 letters
of offer for 30% of capacity co-firing. However this was subject to the granting of relevant planning
permissions to co-fire, with the original planning for both sites expiring on 31 December 2020. ESB
49 https://www.origingreen.ie/

IRL NAPCP Report 2021 Update
82
has announced West Offaly and Lough Ree ceased producing electricity at the end of 2020 and will
be decommissioned in the coming years.
Additionally all Bord Na Móna peat harvesting has formally ceased in 2020 with the last harvest
having been completed in 2019. Bord na Móna will continue to supply customers with peat briquettes
up to 2024 from stocks of peat which have already been harvested.
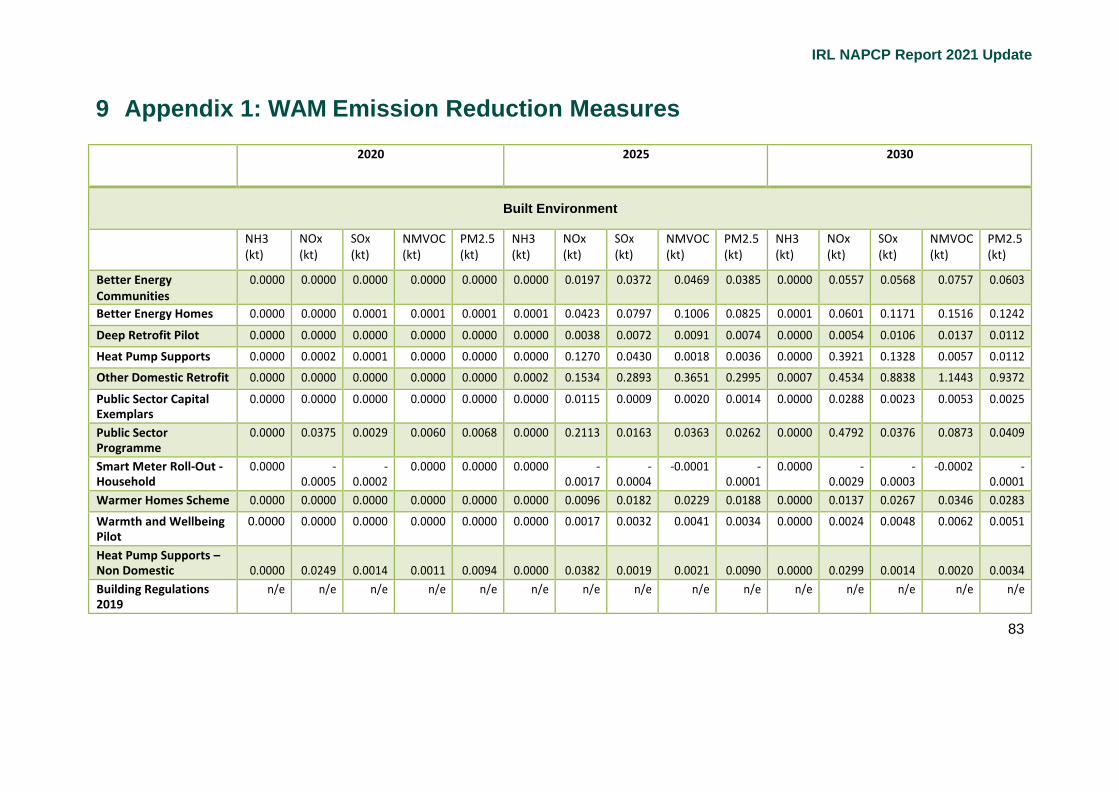
IRL NAPCP Report 2021 Update
83
9 Appendix 1: WAM Emission Reduction Measures
2020 2025 2030
Built Environment
NH3 (kt)
NOx (kt)
SOx (kt)
NMVOC (kt)
PM2.5 (kt)
NH3 (kt)
NOx (kt)
SOx (kt)
NMVOC (kt)
PM2.5 (kt)
NH3 (kt)
NOx (kt)
SOx (kt)
NMVOC (kt)
PM2.5 (kt)
Better Energy Communities
0.0000 0.0000 0.0000 0.0000 0.0000 0.0000 0.0197 0.0372 0.0469 0.0385 0.0000 0.0557 0.0568 0.0757 0.0603
Better Energy Homes 0.0000 0.0000 0.0001 0.0001 0.0001 0.0001 0.0423 0.0797 0.1006 0.0825 0.0001 0.0601 0.1171 0.1516 0.1242
Deep Retrofit Pilot 0.0000 0.0000 0.0000 0.0000 0.0000 0.0000 0.0038 0.0072 0.0091 0.0074 0.0000 0.0054 0.0106 0.0137 0.0112
Heat Pump Supports 0.0000 0.0002 0.0001 0.0000 0.0000 0.0000 0.1270 0.0430 0.0018 0.0036 0.0000 0.3921 0.1328 0.0057 0.0112
Other Domestic Retrofit 0.0000 0.0000 0.0000 0.0000 0.0000 0.0002 0.1534 0.2893 0.3651 0.2995 0.0007 0.4534 0.8838 1.1443 0.9372
Public Sector Capital Exemplars
0.0000 0.0000 0.0000 0.0000 0.0000 0.0000 0.0115 0.0009 0.0020 0.0014 0.0000 0.0288 0.0023 0.0053 0.0025
Public Sector Programme
0.0000 0.0375 0.0029 0.0060 0.0068 0.0000 0.2113 0.0163 0.0363 0.0262 0.0000 0.4792 0.0376 0.0873 0.0409
Smart Meter Roll-Out - Household
0.0000 - 0.0005
- 0.0002
0.0000 0.0000 0.0000 - 0.0017
- 0.0004
-0.0001 - 0.0001
0.0000 - 0.0029
- 0.0003
-0.0002 - 0.0001
Warmer Homes Scheme 0.0000 0.0000 0.0000 0.0000 0.0000 0.0000 0.0096 0.0182 0.0229 0.0188 0.0000 0.0137 0.0267 0.0346 0.0283
Warmth and Wellbeing Pilot
0.0000 0.0000 0.0000 0.0000 0.0000 0.0000 0.0017 0.0032 0.0041 0.0034 0.0000 0.0024 0.0048 0.0062 0.0051
Heat Pump Supports – Non Domestic
0.0000
0.0249
0.0014
0.0011
0.0094
0.0000
0.0382
0.0019
0.0021
0.0090
0.0000
0.0299
0.0014
0.0020
0.0034
Building Regulations 2019
n/e n/e n/e n/e n/e n/e n/e n/e n/e n/e n/e n/e n/e n/e n/e

IRL NAPCP Report 2021 Update
84
2020 2025 2030
NH3 (kt)
NOx (kt)
SOx (kt)
NMVOC (kt)
PM2.5 (kt)
NH3 (kt)
NOx (kt)
SOx (kt)
NMVOC (kt)
PM2.5 (kt)
NH3 (kt)
NOx (kt)
SOx (kt)
NMVOC (kt)
PM2.5 (kt)
Transport Electric Vehicle Deployment
0.0033 0.1522 0.0002 0.0186 0.0067 0.0071 0.3230 0.0004 0.0403 0.0143 0.0439 2.0951 0.0027 0.2490 0.0923
Renewables (Transport) N/e N/e N/e N/e N/e N/e N/e N/e N/e N/e N/e N/e N/e N/e N/e
Agriculture
Reduction in the crude protein content of pig feed
0.8573 # # # # 0.8697 # # # # 0.8936 # # # #
Low emission spreading (LESS) of pig slurry
0.0703 # # # # 0.2498 # # # # 0.4399 # # # #
Introduction of clover into grass swards
IE* # # # # IE* # # # # IE* # # # #
Low emission spreading (LESS) of cattle slurry
1.0287 # # # # 3.7862 # # # # 6.5419 # # # #
Inhibited urea 1.7748 # # # # 2.5917 # # # # 3.3792 # # # #
IE* - Reduction of fertiliser N requirements as a result of N fixation/fertiliser replacement value from the inclusion of clover in grass swards. Savings are combined with Inhibited urea PAM due to the interdependence of both measures.

IRL NAPCP Report 2021 Update
85
2020 2025 2030
NH3 (kt)
NOx (kt)
SOx (kt)
NMVOC (kt)
PM2.5 (kt)
NH3 (kt)
NOx (kt)
SOx (kt)
NMVOC (kt)
PM2.5 (kt)
NH3 (kt)
NOx (kt)
SOx (kt)
NMVOC (kt)
PM2.5 (kt)
Power Generation and Renewables
Replacement of coal fired electricity generation with natural gas
0.0000
0.0000
0.0000
0.0000
0.0000
0.0000
0.4870
0.6926
-0.0250
0.6400
0.0000
0.0000
0.0000
0.0000
0.0000
Renewables N/E N/E N/E N/E N/E N/E N/E N/E N/E N/E N/E N/E N/E N/E N/E
Other Industry and Enterprise
Accelerated Capital Allowance
0.0000
0.0000
0.0000
0.0000
0.0000
0.0000
0.0094
0.0005
0.0006
0.0022
0.0000
0.0197
0.0010
0.0014
0.0020
CHP Deployment - Public and Business sectors
0.0000
0.0000
0.0000
0.0000
0.0000
0.0000
0.0222
0.0052
0.0027
0.0013
0.0000
0.0592
0.0140
0.0073
0.0034
EXEED Certified Grant 0.0000 0.0043 0.0006 0.0004 0.0009 0.0000 0.0462 0.0066 0.0049 0.0061 0.0000 0.0939 0.0142 0.0108 0.0068
Sustainable Energy Authority of Ireland Large Industry Programmes
0.0000
0.0000
0.0000
0.0000
0.0000
0.0000
0.3065
0.1066
0.0398
0.0411
0.0000
0.7950
0.2830
0.1058
0.0944
Small and Medium Enterprises (SME) Programme
0.0000
0.0000
0.0000
0.0000
0.0000
0.0000
0.0166
0.0013
0.0029
0.0021
0.0000
0.0415
0.0033
0.0076
0.0035
Cross Sectoral Measures
Carbon Tax 0.0022 0.2889 0.0419 0.0324 0.0184 0.0068 0.8923 0.1304 0.1003 0.0572 0.0082 1.1548 0.1644 0.1316 0.0725
Supplier Obligation Non-Grant
0.0005
0.1007
0.006
0.0152
0.015
0.0011
0.2082
0.0123
0.0333
0.0218
0.0012
0.226
0.0132
0.0375
0.0169

IRL NAPCP Report 2021 Update
86
10 Appendix 2: Programmes and Measures (WAM) by Sector
Name of individual PaM or
package of PaMs (M):
PaM File No. Currently planned
year of adoption
(M):
Currently planned timetable
for implementation (M)
Currently
planned
timetable for
review (M):
Competent
authorities (M)
Start year End year
Built Environment Sector (Section 6.1.1 NAPCP)
Better Energy Communities 44107 2012 2012 2040 2021-2022 SEAI
Better Energy Homes 73085 2011 2011 2040 2021-2022 DECC/SEAI
Deep Retrofit Pilot 32691 2017 2017 2040 2021-2022 SEAI
Heat Pump Supports –
Domestic
84728 2018 2018 2030 2021-2022 SEAI
Heat Pump Supports – non
Domestic
77422 2019 2019 2027 2021-2022 SEAI
Other Domestic Retrofit 44077 2019 2019 2030 2021-2022 SEAI/DECC
Public Sector Capital Exemplars 72411 2017 2017 2040 2021-2022 DECC
Public Sector Programme 21408 2019 2019 Beyond 2030 2021-2022 DECC
Smart Meter Roll-Out –
Household
62855 2019 2019 Beyond 2030 2021-2022 DECC
Warmer Homes Scheme 80880 2019 2019 Beyond 2030 2021-2022 DECC
Warmth and Wellbeing Pilot 90141 2019 2019 Beyond 2030 2021-2022 DECC
2019 Building Regulations 53532 2019 2040 2040 2023 DHLGH
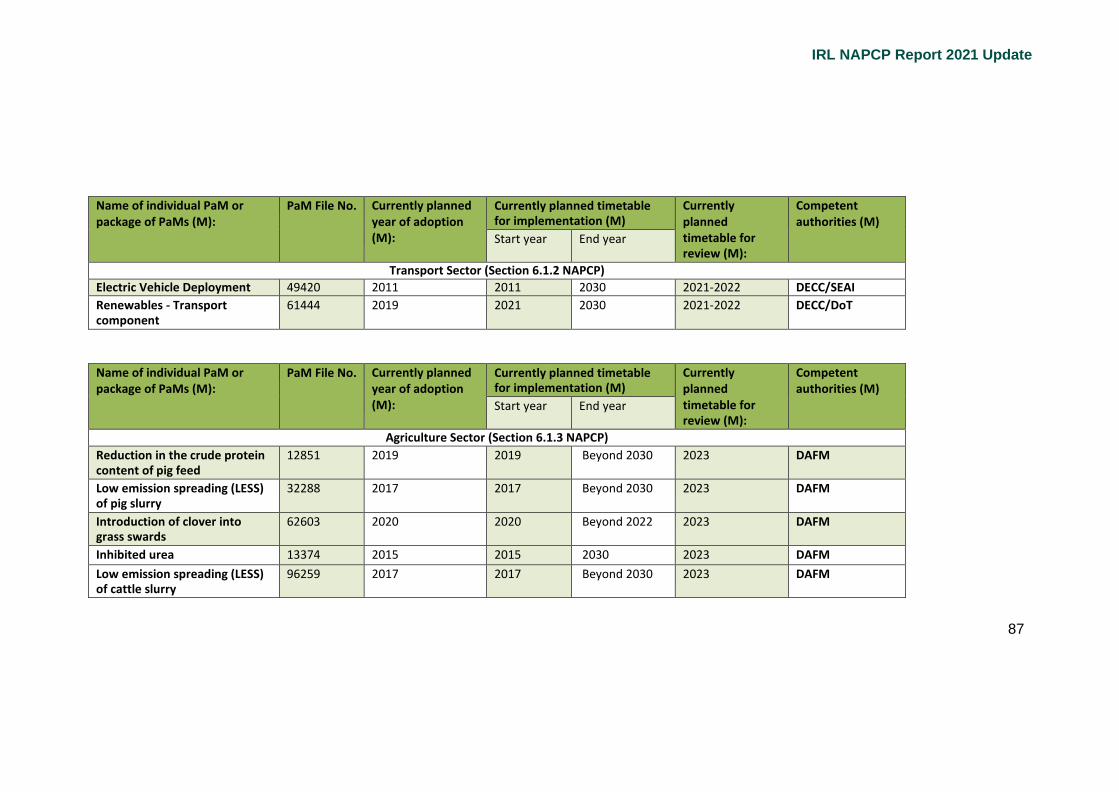
IRL NAPCP Report 2021 Update
87
Name of individual PaM or package of PaMs (M):
PaM File No. Currently planned year of adoption (M):
Currently planned timetable for implementation (M)
Currently planned timetable for review (M):
Competent authorities (M)
Start year End year
Transport Sector (Section 6.1.2 NAPCP)
Electric Vehicle Deployment 49420 2011 2011 2030 2021-2022 DECC/SEAI
Renewables - Transport component
61444 2019 2021 2030 2021-2022 DECC/DoT
Name of individual PaM or package of PaMs (M):
PaM File No. Currently planned year of adoption (M):
Currently planned timetable for implementation (M)
Currently planned timetable for review (M):
Competent authorities (M)
Start year End year
Agriculture Sector (Section 6.1.3 NAPCP)
Reduction in the crude protein content of pig feed
12851 2019 2019 Beyond 2030 2023 DAFM
Low emission spreading (LESS) of pig slurry
32288 2017 2017 Beyond 2030 2023 DAFM
Introduction of clover into grass swards
62603 2020 2020 Beyond 2022 2023 DAFM
Inhibited urea 13374 2015 2015 2030 2023 DAFM
Low emission spreading (LESS) of cattle slurry
96259 2017 2017 Beyond 2030 2023 DAFM

IRL NAPCP Report 2021 Update
88
Name of individual PaM or package of PaMs (M):
PaM File No. Currently planned year of adoption (M):
Currently planned timetable for implementation (M)
Currently planned timetable for review (M):
Competent authorities (M)
Start year End year
Power Generation Sector (Section 6.1.4 NAPCP)
Replacement of coal fired electricity generation with natural gas
63495 2019 2024 2025 n/a DECC
Renewables – Electricity component
62667 2019 2019 2030 2021-2022 DECC/CRU
Renewables – Heat component 87100 2019 2019 2030 2021-2022 DECC/SEAI
Name of individual PaM or package of PaMs (M):
PaM File No. Currently planned year of adoption (M):
Currently planned timetable for implementation (M)
Currently planned timetable for review (M):
Competent authorities (M)
Start year End year
Other Industry and Enterprise (Section 6.1.5 NAPCP)
Accelerated Capital Allowance for energy efficient equipment
43352 2008 2008 2040 2021-2022 DoF
CHP Deployment – Public and Business sectors
88008 2011 2011 2040 2021-2022 SEAI
EXEED Certified Grant (EXEED Grant Scheme)
88101 2016 2016 2040 2021-2022 SEAI
Sustainable Energy Authority of Ireland Large Industry Programme
49049 1995 1995 2040 2021-2022 SEAI
Small and Medium Enterprises (SME) Programme
69529 2007 2007 2040 2021-2022 SEAI
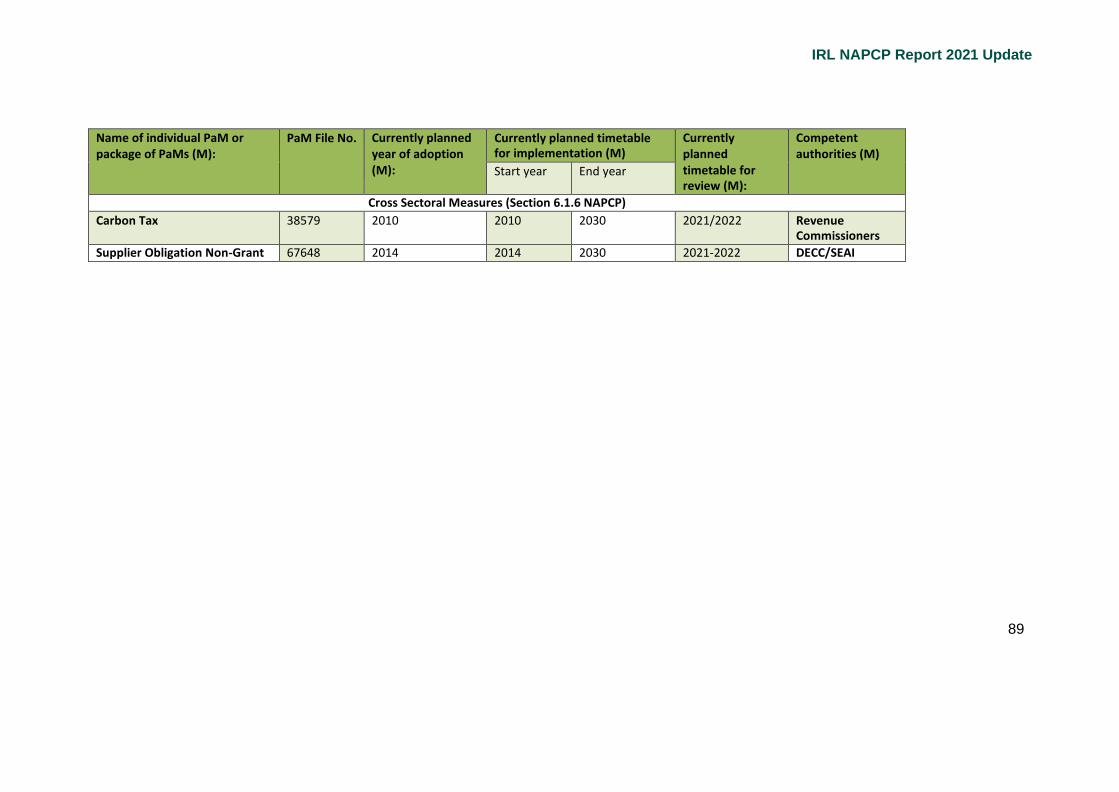
IRL NAPCP Report 2021 Update
89
Name of individual PaM or package of PaMs (M):
PaM File No. Currently planned year of adoption (M):
Currently planned timetable for implementation (M)
Currently planned timetable for review (M):
Competent authorities (M)
Start year End year
Cross Sectoral Measures (Section 6.1.6 NAPCP)
Carbon Tax 38579 2010 2010 2030 2021/2022 Revenue Commissioners
Supplier Obligation Non-Grant 67648 2014 2014 2030 2021-2022 DECC/SEAI

IRL NAPCP Report 2021 Update
90
12 Appendix 3: Compliance with emission reduction commitments in the Agriculture sector
Compliance in the Agriculture sector (EU reference 2.6.4)
Is the PaM
included in the
national air
pollution control
programme?
Yes/No.
If yes, indicate
section/page
number in
programme.
Has the PaM been
applied exactly?
Yes/No (M) If no,
describe the
modifications that
have been made.
A. Measures to control ammonia emissions (M)
1. Member States shall establish a national advisory code of good Yes Section 5.1.3 Yes: See Note 1
agricultural practice to control ammonia emissions, taking into account the
UNECE Framework Code for Good Agricultural Practice for Reducing
Ammonia Emissions of 2014, covering at least the following items:
(a) nitrogen management, taking into account the whole nitrogen cycle; (b) livestock feeding strategies; (c) low-emission manure spreading techniques; (d) low-emission manure storage systems; (e) low-emission animal housing systems; (f) Possibilities for limiting ammonia emissions from the use of
Yes
Yes
Yes
Yes
Yes
Yes
Yes
Yes
Yes (See 12.1.1.1)
Yes
Yes
Yes
mineral fertilisers.
2. Member States may establish a national nitrogen budget to monitor the
changes in overall losses of reactive nitrogen from agriculture, including
ammonia, nitrous oxide, ammonium, nitrates and nitrites, based on the
principles set out in the UNECE Guidance Document on Nitrogen Budgets
No No: See Note 2

IRL NAPCP Report 2021 Update
91
3. Member States shall prohibit the use of ammonium carbonate fertilisers
and may reduce ammonia emissions from inorganic fertilisers by using the
following approaches:
(a) replacing urea-based fertilisers by ammonium nitrate-based fertilisers;
(b) where urea-based fertilisers continue to be applied, using methods that have
been shown to reduce ammonia emissions by at least 30 % compared with the
use of the reference method, as specified in the Ammonia Guidance Document;
(c) promoting the replacement of inorganic fertilisers by organic fertilisers and,
where inorganic fertilisers continue to be applied, spreading them in line with the
foreseeable requirements of the receiving crop or grassland with respect to
nitrogen and phosphorus, also taking into account the existing nutrient content in
the soil and nutrients from other fertilisers.
No
No
No
No
Section 5.1.3 No: See Note
1,2 & 3
No
No
No
4. Member States may reduce ammonia emissions from livestock
manure by using the following approaches:
(a) reducing emissions from slurry and solid manure application to arable land
and grassland, by using methods that reduce emissions by at least 30 %
compared with the reference method described in the Ammonia Guidance
Document and on the following conditions:
(i) only spreading manures and slurries in line with the foreseeable
nutrient requirement of the receiving crop or grassland with respect to
nitrogen and phosphorous, also taking into account the existing
nutrient content in the soil and the nutrients from other fertilisers;
Yes
Yes
Yes
Section 5.1.3 Yes
See Note 1 & 4
Yes
Yes
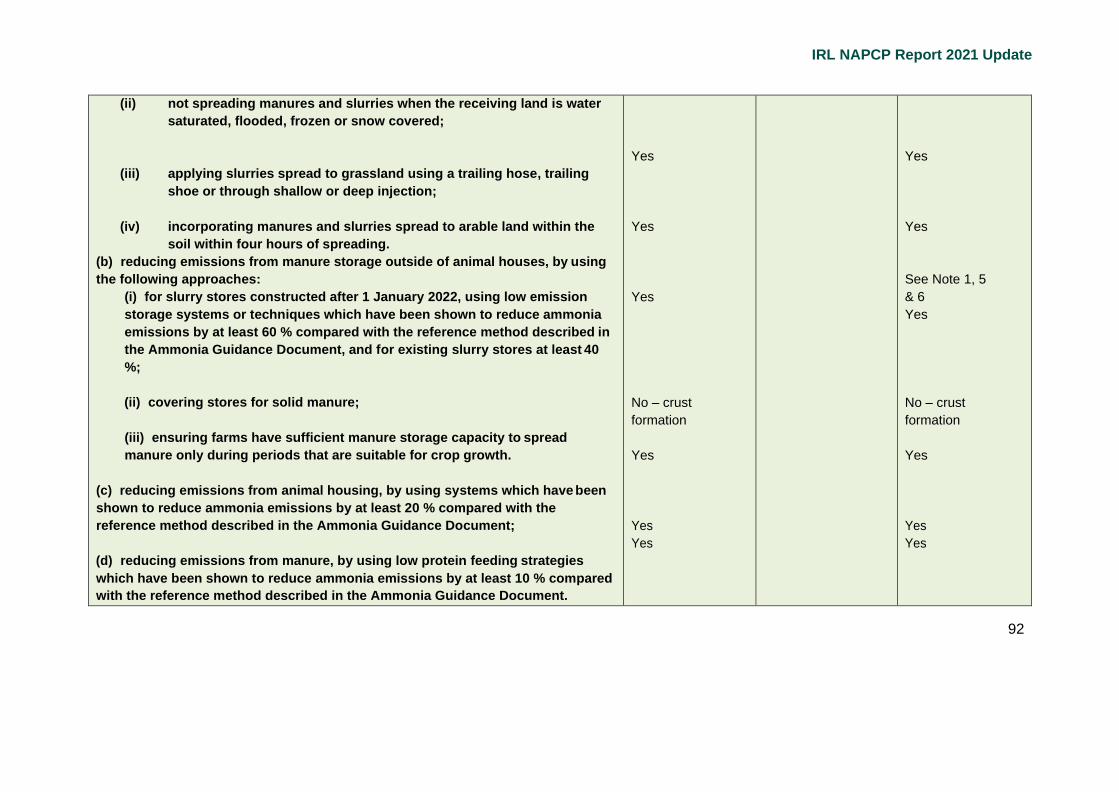
IRL NAPCP Report 2021 Update
92
(ii) not spreading manures and slurries when the receiving land is water
saturated, flooded, frozen or snow covered;
(iii) applying slurries spread to grassland using a trailing hose, trailing
shoe or through shallow or deep injection;
(iv) incorporating manures and slurries spread to arable land within the
soil within four hours of spreading.
(b) reducing emissions from manure storage outside of animal houses, by using
the following approaches:
(i) for slurry stores constructed after 1 January 2022, using low emission
storage systems or techniques which have been shown to reduce ammonia
emissions by at least 60 % compared with the reference method described in
the Ammonia Guidance Document, and for existing slurry stores at least 40
%;
(ii) covering stores for solid manure;
(iii) ensuring farms have sufficient manure storage capacity to spread
manure only during periods that are suitable for crop growth.
(c) reducing emissions from animal housing, by using systems which have been
shown to reduce ammonia emissions by at least 20 % compared with the
reference method described in the Ammonia Guidance Document;
(d) reducing emissions from manure, by using low protein feeding strategies
which have been shown to reduce ammonia emissions by at least 10 % compared
with the reference method described in the Ammonia Guidance Document.
Yes
Yes
Yes
No – crust
formation
Yes
Yes
Yes
Yes
Yes
See Note 1, 5
& 6
Yes
No – crust
formation
Yes
Yes
Yes
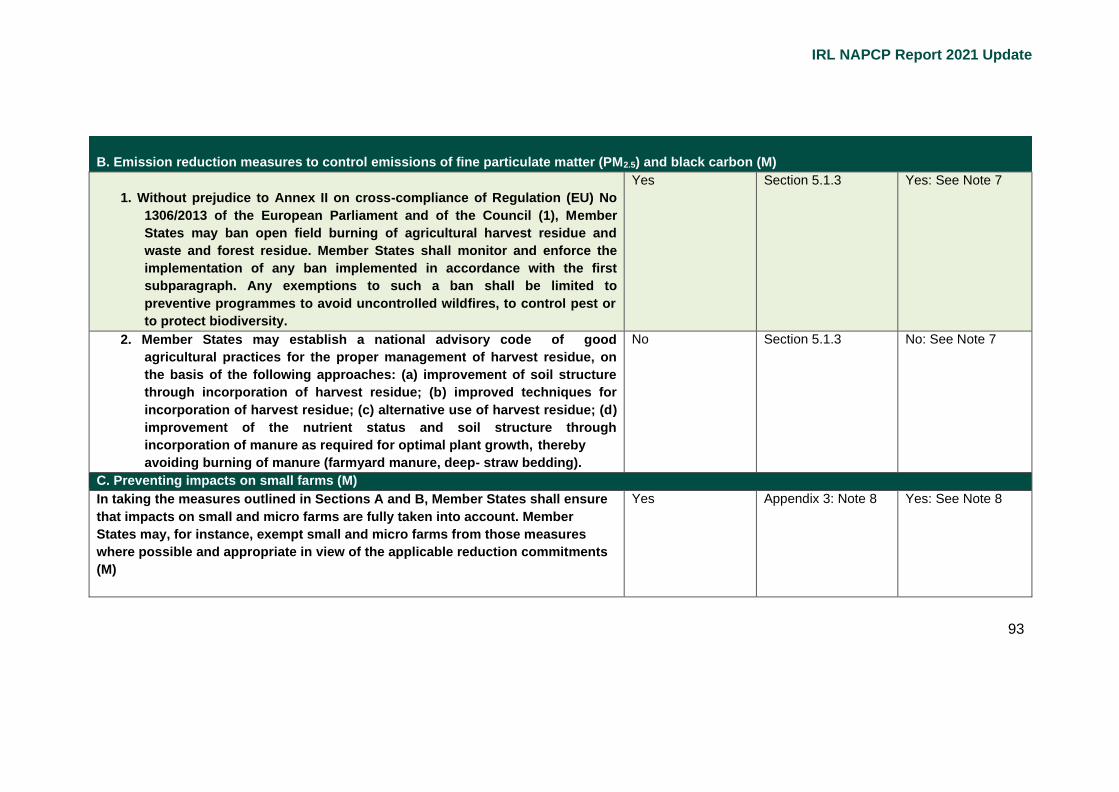
IRL NAPCP Report 2021 Update
93
B. Emission reduction measures to control emissions of fine particulate matter (PM2.5) and black carbon (M)
1. Without prejudice to Annex II on cross-compliance of Regulation (EU) No
1306/2013 of the European Parliament and of the Council (1), Member
States may ban open field burning of agricultural harvest residue and
waste and forest residue. Member States shall monitor and enforce the
implementation of any ban implemented in accordance with the first
subparagraph. Any exemptions to such a ban shall be limited to
preventive programmes to avoid uncontrolled wildfires, to control pest or
to protect biodiversity.
Yes Section 5.1.3 Yes: See Note 7
2. Member States may establish a national advisory code of good
agricultural practices for the proper management of harvest residue, on
the basis of the following approaches: (a) improvement of soil structure
through incorporation of harvest residue; (b) improved techniques for
incorporation of harvest residue; (c) alternative use of harvest residue; (d)
improvement of the nutrient status and soil structure through
incorporation of manure as required for optimal plant growth, thereby
avoiding burning of manure (farmyard manure, deep- straw bedding).
No Section 5.1.3 No: See Note 7
C. Preventing impacts on small farms (M)
In taking the measures outlined in Sections A and B, Member States shall ensure
that impacts on small and micro farms are fully taken into account. Member
States may, for instance, exempt small and micro farms from those measures
where possible and appropriate in view of the applicable reduction commitments
(M)
Yes Appendix 3: Note 8 Yes: See Note 8
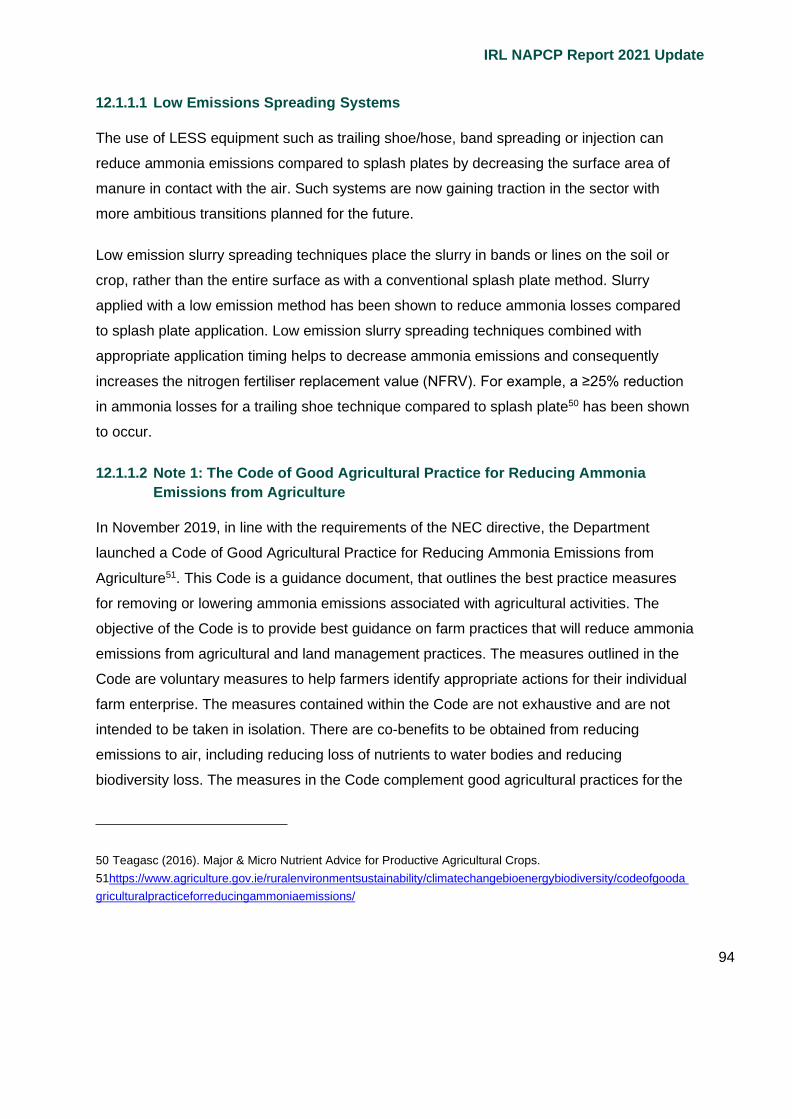
IRL NAPCP Report 2021 Update
94
12.1.1.1 Low Emissions Spreading Systems
The use of LESS equipment such as trailing shoe/hose, band spreading or injection can
reduce ammonia emissions compared to splash plates by decreasing the surface area of
manure in contact with the air. Such systems are now gaining traction in the sector with
more ambitious transitions planned for the future.
Low emission slurry spreading techniques place the slurry in bands or lines on the soil or
crop, rather than the entire surface as with a conventional splash plate method. Slurry
applied with a low emission method has been shown to reduce ammonia losses compared
to splash plate application. Low emission slurry spreading techniques combined with
appropriate application timing helps to decrease ammonia emissions and consequently
increases the nitrogen fertiliser replacement value (NFRV). For example, a ≥25% reduction
in ammonia losses for a trailing shoe technique compared to splash plate50 has been shown
to occur.
12.1.1.2 Note 1: The Code of Good Agricultural Practice for Reducing Ammonia
Emissions from Agriculture
In November 2019, in line with the requirements of the NEC directive, the Department
launched a Code of Good Agricultural Practice for Reducing Ammonia Emissions from
Agriculture51. This Code is a guidance document, that outlines the best practice measures
for removing or lowering ammonia emissions associated with agricultural activities. The
objective of the Code is to provide best guidance on farm practices that will reduce ammonia
emissions from agricultural and land management practices. The measures outlined in the
Code are voluntary measures to help farmers identify appropriate actions for their individual
farm enterprise. The measures contained within the Code are not exhaustive and are not
intended to be taken in isolation. There are co-benefits to be obtained from reducing
emissions to air, including reducing loss of nutrients to water bodies and reducing
biodiversity loss. The measures in the Code complement good agricultural practices for the
50 Teagasc (2016). Major & Micro Nutrient Advice for Productive Agricultural Crops.
51https://www.agriculture.gov.ie/ruralenvironmentsustainability/climatechangebioenergybiodiversity/codeofgooda
griculturalpracticeforreducingammoniaemissions/

IRL NAPCP Report 2021 Update
95
protection of waterbodies. The good practice measures give guidance on reducing
emissions from these key areas:
− Limiting ammonia emissions from the use of mineral fertilisers;
− Manure application and low-emission manure spreading techniques;
− Animal feeding strategies;
− Animal housing systems;
− Manure storage systems.
12.1.1.3 Note 2: Nitrates Action Programme (NAP)
There is a whole territory approach to nitrates implementation so all farmers are obliged to
abide by nutrient management planning which has many synergies with reducing ammonia
due to the efficient use of animal manure. The Nitrates Action Programme gives effect to the
Nitrates Directive. In late 2017, Ireland agreed with the European Commission on its fourth
NAP for the period 2018-2021. The Nitrates Action Programme includes a balanced
programme of measures supporting the objectives of achieving good water quality while at
the same time encouraging sustainable and efficient agricultural practices. The
implementation and enforcement of the requirements of the Nitrates Directive is to a very
high standard. The Nitrates Directive permits only spreading manures and slurries in line
with the foreseeable nutrient requirement of the receiving crop or grassland with respect to
nitrogen and phosphorous, also taking into account the existing nutrient content in the soil
and the nutrients from other fertilisers. In addition, it does not allow spreading manures and
slurries when the receiving land is water saturated, flooded, frozen or snow covered.
The measures in Ireland’s nitrates derogation take account of the growing numbers of
derogation farmers who are farming at intensive stocking rates, and also environmental
objectives for water, climate change and ammonia which Ireland must achieve. In 2019 a
review of Ireland’s nitrates derogation was conducted to examine further opportunities for
derogation farmers to improve efficiencies and continue to reduce their environmental
footprint with regard to water, climate and air quality. The review was conducted against the
background of derogation farms being a very significant intensive cohort and the increasing
area being farmed under the derogation. Public consultation was an important element of
the review process and provided an opportunity for stakeholders to submit their views as
regard the derogation and related issues. The purpose of the public consultation was to seek

IRL NAPCP Report 2021 Update
96
views on the potential revisions to the terms and conditions of the previous nitrates
derogation.
Following this consultation, a Nitrates Expert Group examined all submissions and provided
the recommendations in relation to how derogation farmers can improve their nutrient use
efficiency and environmental footprint52. The proposed new measures were aimed at further
strengthening the protection of water and attaining optimum soil fertility that is consistent
with both efficient agricultural production and effective water quality protection as well as
focusing on building greater awareness of how agriculture and our natural resources must
co-exist and achieve equilibrium in balancing production with environmental sustainability.
For example, with reference to Low Emission Slurry Spreading (LESS) the Group
recommended that all slurry on the holding must be spread by LESS from the 12/1/2021.
These recommendations were included for the 2020 Nitrates Derogations Terms and
Conditions53.
12.1.1.4 Note 3: Fertiliser Types
In Ireland all our nitrogen fertiliser is imported. Nitrogen is not manufactured or produced at
all and therefore ammonium carbonate fertilisers are not imported.
In Ireland, CAN (calcium ammonium nitrate fertiliser <28% N) is used over ammonium
nitrate-based fertilisers. In 2019, approximately half of nitrogen sold was straight N and other
compound N. Approximately 67% of straight nitrogen sold in Ireland was CAN.
Urea fertiliser coated/incorporated with a urease inhibitor is available on the market and is
used to protect against ammonia loss.
Since 2016 an online Nutrient Management Planning (NMP) tool (similar to proposed FaST
under CAP reform 2020) has been available to Irish farmers with the aim of improving the
52https://www.agriculture.gov.ie/media/migration/ruralenvironment/environment/nitrates/2019/derogationforms/Ni
tratesExpertGroupDerogationReviewReportMLU240719.pdf
53https://www.agriculture.gov.ie/media/migration/ruralenvironment/environment/nitrates/2020/NitratesDerogation
2020TermsConditions260320.pdf

IRL NAPCP Report 2021 Update
97
nutrient status of soils and thereby reducing the level of chemical fertiliser usage on Irish
farms. Improving nutrient management has been identified as a key target of both Food
Harvest 2020 and Food Wise 2025. These documents set out a strategy for the future of the
agri-food sector which targets economic progress while also addressing the environmental
impact of future growth targets.
Studies by Teagasc show that soil fertility has fallen in Ireland over the past decade, with
only one in ten soils tested as being in good overall fertility. NMP online focuses on
providing improved baseline information to farmers so they are better able to understand the
issues and challenges relating to soil fertility on their own farms.
To date adaption rates of NMP has been high on Irish farms with 49,400 NMP plans created
and submitted to the Department of Agriculture, Food & the Marine under the Green, Low
Carbon Agri-Environment Scheme, with a further 7,200 NMP plans being updated and
reviewed by agricultural advisors for their Nitrates Derogation clients. NMP tools are used by
the majority of Irish farmers to minimise the use of inorganic fertilisers and optimise the use
of organic fertilisers. For example, the Teagasc Nutrient Management Planning (NMP) online
tool54 was produced to allow agricultural consultants and advisers formulate nutrient
management plans for farmers, taking into account enterprise type, land-use, soil type and
as well as other agronomic and farm management criteria. It ensures that soil fertility is
optimised and also compliance with the limits set under the Nitrates Regulations55.
Also, the Code of Good Agricultural Practices for Reducing Ammonia Emissions encourages
use and adoption of NMP promoting the replacement of inorganic fertilisers by organic
fertilisers. The Nitrates Directive permits only spreading manures and slurries in line with the
foreseeable nutrient requirement of the receiving crop or grassland with respect to nitrogen
and phosphorous, also taking into account the existing nutrient content in the soil and the
nutrients from other fertilisers.
54 https://www.teagasc.ie/environment/soil/nmp/
55 https://www.teagasc.ie/about/our-organisation/connected/online-tools/teagasc-nmp-online/

IRL NAPCP Report 2021 Update
98
12.1.1.5 Note 4: Targeted Agricultural Modernisation Schemes (TAMS)
The Department of Agriculture, Food and the Marine (DAFM) oversees and administers the
Targeted Agricultural Modernisation Schemes (TAMS). Spring application is promoted and
LESS is incentivised under this scheme. This scheme also supports capital investment in a
number of target areas which will promote, among other things, sustainability, e.g. the
purchase of low emissions slurry spreading equipment, and also provides for grants towards
farm nutrient storage.
12.1.1.6 Note 5: Grass-based system of livestock production
Ireland’s maritime climate favours a grass-based system of livestock production. Typically,
livestock in Ireland are fed a grass-based diet (grazed grass and grass silage) and spend
about 60% of their time on pasture. Indeed, grazing has been classified as a cost-effective
Category 1 abatement technique in the Guidance Document for Preventing and Abating
Ammonia Emissions from Agricultural Sources, associated with lower emissions than
confined housing systems. It is also important to realise that our grass-based system of
farming for cattle and sheep is recognised as having a low level of ammonia emissions.
Grazing systems have been shown to provide a 50% reduction in ammonia emissions in
comparison to confined systems of production56.
12.1.1.7 Note 6: Best available technique (BAT) guidelines
As stated above, there is a whole territory approach to nitrates implementation so all farmers
are obliged to abide by nutrient management planning which has many synergies with
reducing ammonia due to the efficient use of animal manure. Additionally, the best available
technique (BAT) guidelines published in February 2017 used under Integrated Pollution,
Prevention and Control (IPPC) licensing for pig and poultry enterprises above thresholds will
result in changes which reduce ammonia emissions.
56 Economic Commission for Europe, Executive Body for the Convention on Long-range Transboundary Air
Pollution (2014). Guidance document on preventing and abating ammonia emissions from agricultural sources.
ECE/ EB.AIR/ 120. https://www.unece.org/fileadmin/DAM/env/documents/2012/EB/ECE_EB.AIR_120_ENG.pdf

IRL NAPCP Report 2021 Update
99
12.1.1.8 Note 7: Agricultural Burning
The Department of Agriculture, Food and the Marine (DAFM) does not encourage burning
agricultural residues. The burning of green waste is currently permitted as an exempted
activity under the waste management act regulations and requires contact with the local
authority. The burning of growing vegetation is dealt under the Wildlife Act 1976 and is illegal
between 1st March and 31st August in any year. Legislation pertaining to burning is referred
to in other policies also, for example, policy relating to air quality, waste management and
biodiversity legislation.
In certain instances farmers use burning as a management tool to maintain the productivity
of agricultural land, burning scrub and clearing green material. In the case of burning as a
land management tool, the introduction of targeted vegetation management and follow up
prescribed grazing by livestock will help reinvigorate upland conservation landscapes and
the farming activity and husbandry that support healthy upland habitats and the services
they provide. The act of burning can only go ahead with a Burning Plan after consultation
with the local authorities, agencies and neighbours.
When considering the disposal of green waste for example from reclamation or hedgerow
trimmings, this is governed under the Waste Management (Prohibition of Waste Disposal by
Burning) Regulations 2009. These regulations came into force on the 31st of July 2009 and
were amended in 2013 S.I. No. 504 of 2013. (the Waste Management (Prohibition of Waste
Disposal by Burning) (Amended) Regulations 2013).The regulations require that all other
more environmentally friendly methods of treatment of their green waste such as reduction,
reuse, and recycling by shredding, composting or wood chipping before disposal by burning.
Properly managed, small scale cooperative burning actions, should be conducted during the
permitted burning period in line with DAFM Prescribed Burning Code of Practice guidelines.
DAFM has produced guidelines for land managers considering the use of fire on their land57
and has also supported and encouraged the development of a number of local level fire
57
https://www.agriculture.gov.ie/media/migration/forestry/firemanagement/CofPPrescribedBurningFinal90212.pdf

IRL NAPCP Report 2021 Update
100
management groups and partnerships aimed improving awareness and understanding of the
responsible use of fire as a land management tool.
DAFM also provides specialist guidance to the forestry sector on forest fire management
related issues, most notably the issuance of Fire Danger Notices to the sector prior to
periods of high fire risk weather, and the monitoring and analysis of fire activity and fire
behaviour during these periods.
DAFM is not promoting burning as a management method. There are a number of EIP
projects58 focusing on upland management which include the promotion of high nature value
(HNV) farming to prevent land abandonment by managing scrub through grazing and
making it economically viable for upland farmers.
12.1.1.9 Note 8: Impacts on small and micro-farms
The impacts on small and micro-farms are fully taken into account in measures outlined in
Section A (measures to control ammonia emissions) and Section B (emission reduction
measures to control emissions of fine particulate matter and black carbon). In recent years
small farms have received increased attention in policy circles; especially in the context of
the role they play in rural areas, in protecting the landscape and environment and in terms of
the need to improve the economic and social conditions on small-scale farms59.
Family-run farms in Ireland make up the fabric of Irish agriculture with the more intensive
specialist dairy farms being located in the south and south-east of the country and more
extensive beef and sheep farms in the midlands and western regions. Average farm size of
32.5 ha is quite small compared to other Member States. Larger scale farms are located in
the southern and eastern regions; farm output is much higher in these regions also. Over
58https://www.agriculture.gov.ie/media/migration/farmingschemesandpayments/europeaninnovationpartnership/
EIP-AGRI%20Operational%20Group%20Booklet%202019%20proof%202.pdf
59https://www.teagasc.ie/media/website/publications/2017/Small-Farms-Survey.pdf
IRL NAPCP Report 2021 Update
101
60% of farms have an extensive stocking rate of under 85 kg livestock manure nitrogen per
ha. The western regions have the most extensive farming systems.
With regards to farming enterprises, over two thirds of sheep farms were in the border,
midlands and western regions, while the south-east (SE) region contained almost 80% of
tillage farms and 77.2% of dairying farms. Beef production was more common in the border,
midlands and western region, where it accounted for almost six in ten of all farms (59.7%). In
contrast under half (44.9%) of farms in the SE region were engaged in specialist beef
production. There are in excess of 16,000 specialist milk producers concentrated mainly in
the southern and eastern regions.
The purpose of the Nitrates Directive (SI No. 605 of 2017) is to give effect to Ireland’s NAP
for the protection of waters from agricultural sources60. Measures within the Regulations take
account of small and micro-farms.
60https://www.agriculture.gov.ie/media/migration/ruralenvironment/environment/nitrates/2017/SINo605271217.pd
f