Natick Public Schools - Boston College Home Page · Natick Public Schools ... It is important to...
49
Natick Public Schools 21 st Century Teaching and Learning Study Baseline Evaluation Report February 2013 James Burraston, M.Ed. and Damian Bebell, Ph.D. Center for the Study of Testing, Evaluation, and Educational Policy Lynch School of Education Boston College
Transcript of Natick Public Schools - Boston College Home Page · Natick Public Schools ... It is important to...

Natick Public Schools
21st Century Teaching and Learning Study
Baseline Evaluation Report
February 2013
James Burraston, M.Ed. and Damian Bebell, Ph.D.
Center for the Study of Testing, Evaluation,
and Educational Policy
Lynch School of Education
Boston College

2
Background and Introduction
“The transition to pervasive computing has profound implications for education and may
represent as great a paradigm shift as the invention of writing itself.”
Bull, Bull, Garofolo, & Harris, 2002, p. 1
Few modern educational initiatives have been as far-reaching as placing computer-based technologies
into American classrooms. Believing that increased use of computers will lead to improved teaching and
learning, greater efficiency, and the development of important student skills, educational leaders and
policy makers have made major investments in educational technologies. Since 1996, state and district
level agencies alone have invested over ten billion dollars to acquire and integrate computer-based
technologies into American classrooms. These investments have led to a dramatic impact on the presence
of computers in schools. For example, the number of Internet connecting computers in American
classrooms has risen from 1 for every 6.6 students in 2000 to 1 for every 3.1 students in 2008 (Snyder &
Dillow, 2012).
As increased access and more powerful technologies have permeated the American classroom, the variety
of ways in which teachers and students use computer-based technologies has also expanded. Research
exploring the role and effects of computers on teaching and learning suggests a wide variety of potential
benefits including increased student engagement, increased efficiency, and the potential to increase
student learning. However, for any effect to be realized from educational technology, the technology
must be actively and frequently used. Understanding this, research has focused on exploring what factors
and conditions are necessary to allow different technology uses to occur (Becker, 1999, Bebell, Russell,
& O’Dwyer, 2004). A study of over 4,000 Massachusetts teachers revealed that students’ and teachers’
use of technology varied widely across classrooms with some teachers and students incorporating
technology into their daily routines and other classes ignoring technology completely (Russell, O’Dwyer,
Bebell & Miranda; 2003). An exploration of what factors related to teachers’ adoption and use of
technology revealed that technology access, training and professional development, school leadership,
and teacher’s pedagogical approach all played major roles in how teachers’ used educational technology.
A national study found that for technology programs to have positive educational impacts, the
implementation should include the integration of technology in ELL and special education classes,
monthly technology oriented professional development, students collaborating online, and the integration
of technology in the core subject areas (Greaves, Hayes, Wilson, Gielniak, & Peterson, 2010).
Given the ways in which technology resources have been traditionally distributed within schools (e.g., in
labs, libraries, or on shared carts), many observers have theorized that the scarcity of major student
achievement outcomes is due to shared computer and technology access, which typically results in such
limited use and impact (Bebell & O’Dywer, 2010; Papert, 1996). In fact, both proponents and opponents
of educational technology agree that the full effects of any digital resource in school cannot be fully
realized until the technology is no longer a shared resource (Oppenheimer, 2003; Papert, 1992, 1996).
Recognizing the limitations of traditional educational technology shared across students and classrooms,
there has been a steady and growing interest in 1:1 technology scenarios, whereby all teachers and
students have full access to technology.
An increasingly common approach for equipping schools and classrooms with digital technologies is
through school renovation and construction projects. Rather than retrofit 21st century tools and resources
into pre-computing settings, communities here have elected to entirely restructure their classrooms and

3
campuses to better accommodate digital teaching and learning resources. Over the last three years, the
suburban community of Natick, Massachusetts has undertaken such an approach with the design and
construction of their new state of the art Natick High School. Beginning years earlier, however, Natick
Public School began building capacity and providing additional digital teaching and learning resources
into many upper middle school (7th and 8
th grade) classrooms. Upper middle school students were
provided with 1:1 computing access, which is now ultimately provided to all students in grades 8-12.
Teacher access to digital resources has also expanded greatly in the newly opened Natick High School
with state-of-the-art robotics labs, music and arts studios, digital projection systems, district-wide Wi-Fi,
in addition to teacher laptop computers.
Emerging research and evaluation studies suggest several positive outcomes resulting from 1:1 laptop
initiatives including: increased student engagement (Cromwell, 1999; Rockman, 1998; MEPRI, 2003;
Bebell & Kay, 2008; Bebell & Kay, 2009), decreased disciplinary problems (Baldwin, 1999; MEPRI,
2003), increased use of computers for writing, analysis and research (Cromwell, 1999; Baldwin, 1999;
Guignon, 1998; Russell, Bebell, & Higgins, 2004, Bebell, 2006; Bebell & Kay, 2009), and a movement
towards student-centered classrooms (Rockman, 1998; Russell, Bebell & Higgins, 2004). Baldwin (1999)
documented students spending less time watching television and more time on homework. In addition, an
early evaluation of the Maine Learning Technology Initiative (Silvernail & Lane, 2004) and another study
of an upper elementary laptop program in Andover, Massachusetts (Russell, Bebell, & Higgins, 2004)
provide evidence of substantially more technology use occurring in science and mathematics classes than
had been found in studies that focus on non-1:1 laptop settings (Ravitz, Wong, & Becker, 1999; Russell,
O’Brien, Bebell, & O’Dwyer, 2003). It is important to also consider that the educational technology and
its uses are evolving so quickly that much of the literature from even five years ago fails to address the
dynamic digital learning tools now accessible in the classrooms of Natick High School. Like all areas of
computer technology, digital learning tools are evolving rapidly and continuously expanding the notion of
what is even possible.
Although many political leaders suggest that providing students access to powerful and widespread
technology will result in long-term economic prosperity, the impacts on student learning (as measured by
empirical quantitative research) remains a focus for many. Despite growing interest in and excitement
about 1:1 computing, there remains a lack of sufficient, sustained, large-scale research and evaluation that
focuses on teaching and learning in these intensive computing environments. Specifically, there
continues to be a lack of empirical evidence that relates use of technology in these 1:1 settings with
measures of student achievement. This is a particularly salient issue in light of the high cost of
implementing and maintaining 1:1 laptop initiatives and the current climate of educational policy
whereby student achievement is held as the benchmark of successful school reforms and initiatives under
state and federal mandates such as NCLB. As recently documented in a series of NY Times articles
(Richtel, 2011), many policy makers and educational observers feel that research and evaluation of
educational technology has failed to keep pace with the investments and expectations of the public. “In a
nutshell: schools are spending billions on technology, even as they cut budgets and lay off teachers, with
little proof that this approach is improving basic learning.” (Richtel, 2011)
Natick Public Schools Evaluation Study Design and Background
“For want of records, much useful knowledge is continually lost. Though many individuals have
derived advantages to themselves from experiments, but few have recorded them. Even those
who make experiments [are] liable to forget them, so as to give incorrect representations of them
when they try to relate them.”

4
Lathrop, Leonard E. (1826). Remarks On the General Condition of Agriculture: The
Farmer’s Library, Second Edition. Windsor, VT: Wyman Spooner.
Empirical research and systematic reflection are critical components of Natick Public Schools sustainable
long-term implementation of 1:1 student computing and use of varied digital teaching and learning tools.
During the inaugural school year of Natick High School (2012-2013), Boston College partnered with
Natick Public Schools to develop and implement an evaluation study to collect and analyze data
concerning students’ and teachers’ use of technology to support teaching and learning.
At the request of the Natick schools, the current investigation focuses on documenting the most
immediate impacts and changes as students and teachers transition to new 1:1 computing environments
over the 2012/2013 school year. As such, the current evaluation will follow teachers and students through
their first year at the new school facility from September 2012 to June 2013. However, many of Natick
Public Schools more far-reaching program goals will require additional resources and time for more
comprehensive evaluation. Although the current proposal recognizes such long term goals and empirical
outcomes, the focus here is primarily on documenting the evolving teaching and learning practices
afforded by the rich learning settings over the 2012/2013 school year. Although valuable for reflection
and formative assessment, this data collected throughout Year 1 will provide the nucleus for all future
inquiries and investigations.
This report describes the initial (November-December 2012) results summarizing how Natick teachers
and students, now participating in 1:1 computing, access, use, and relate to technology in support of
teaching and learning. Two years before the launch of the 1:1 computing program (September 2010), this
year’s current ninth grade class participated in a survey of teaching, learning and computing practices for
Boston College when they were beginning seventh grade (September 2010). This data, collected from
over 92% of the NPS seventh grade student population, provides a valuable snapshot of students learning
practices as well as their attitudes and beliefs towards school and computing technologies before 1:1
computing. This report examines and compares results from current NHS student cohorts to past (pre-1:1)
practices and beliefs. So, in addition to examining practices and attitudes across teachers and students
during the 2012/2013 school year, this study examined students’ prior survey data to address potential
differences in pre and post-1:1 practices and attitudes.
Data Collection Procedure/Response Rates
Online teacher and student surveys were completed by nearly all members of the grade 7 through 12
community during the last week of November and the first week of December 2012. Building on past
research and evaluation instruments, both the teacher and student surveys were customized for the
specific needs of the NPS community.
Student Survey
The student surveys provide the district with a summary of how students in grades 7-12 engage and
employ a variety of digital resources to further their education. The online student survey provided
measures of students’ access to technology in school, use of technology in school across subject areas,
personal comfort level with technology, access to technology at home, and various uses of technology at
home. Students are scheduled to complete a more detailed student survey in May 2013.
Administering the student survey online decreases the time needed by students to complete each survey.
In this case the median time students spent responding was about 10 minutes and 20 seconds. An online
survey also makes it easier to work with school administration to ensure a high response rate through the
real-time monitoring of survey data via daily email updates. It should be noted that student names and

5
school information were only used for internal tracking of survey completion and all survey responses are
strictly anonymous and confidential.
Teacher Survey
Like the student survey, an online teacher survey was administered in Fall 2012. The teacher survey
included item sets dedicated to capturing the variety and extent of teachers’ technology use, teachers’
attitudes toward technology, teaching, and learning, as well as teachers’ beliefs on student motivation and
engagement. The teacher survey also included brief item sets that measured more general pedagogical
practices and classroom practices. Collectively, these items serve to demonstrate the extent to which
digital technology resources are utilized in the approach and delivery of the curriculum (as well as various
components of teacher/student interactions).
Response Rates
Before the survey period, school administrators provided the research team a roster of eligible students
and teachers. While the current focus is on overall technology use across the Natick schools, students
enrolled in certain special education programs, and teachers in those programs, and other auxiliary
teaching staff were exempted from the baseline survey. The eligible student and teacher rosters were then
used to monitor survey response rates and provide daily reports detailing which individuals had not yet
completed surveys. Such practices, in conjunction with highly effective on-site leadership, resulted in
excellent student and teacher survey response rates. Table 1, below, shows the student survey response
rates.
Table 1 – Fall 2012 student survey response rates across participating grades and schools
As shown in Figure 1, the overall student survey response rate was excellent with 92% of the targeted
Natick student population completing the Fall 2012 survey. Response rates varied slightly more by grade
level, than by school. For example, 11th and 12
th grade response rates were about 10 percentage points
lower than in other settings, but still represented over 80% of each grade’s student population. The 8th
grade response rates were strongest with over 99% of students completing the survey. Based on these
response rates, we can be quite assured the vast majority of students’ practices, opinions, and voices were
captured in the Fall 2012 survey.
As can be seen in Table 2, teacher survey response rates were similarly strong for the Fall 2012 teacher
survey, with 95% of the eligible teacher population completing the survey.

6
Table 2 – Baseline teacher response rates
Student Survey Results Frequency and location of student computer use in school
Figure 1 – Average Frequency of NPS students’ computer use in the classroom (Fall 2012).
Overall, Natick students reported very high levels of access and technology use, both inside and outside
of school. In the Fall 2012 survey, students across the Natick 7th-12
th grades (n=1920) reported
overwhelmingly frequent use of computers in school. Specifically, 72% of all student respondents
reported using computers in their classroom every day. The high frequency of classroom computer use
by students was consistent across the three schools and across grades 8 through 12. Less than 1% of
surveyed students claim to never use a computer in school. Although the frequency of student computer
use is similar across grade levels, Fall 2012 results consistently showed 7th grade students using
computers much less frequently than students in other grades. Because 7th grade students were surveyed
in Fall 2010, it is possible to examine the degree to which conditions and practices changed by comparing
the Fall 2012 results with those from the 7th graders two years before.

7
Figure 2 – Frequency of students’ Fall 2010 and Fall 2012 use of computers in school by 7th graders in 2010, the same cohort as 9th graders in 2012, and the current 7th grade cohort (Fall 2012)
Comparing the Fall 2010 and Fall 2012 survey results, we observe a robust increase in the frequency of
students’ computer use. In the two years between survey administrations, classroom use of technology
increased by more than ten fold for the current 9th grade students, while lab and library use levels
remained about the same. Originally in the 2010 survey, students reported more frequent use of
computers in labs than in classrooms, but by 2012 7th graders reported using computers in both locations
with similar frequency. These dramatic changes can be clearly seen in Figure 2, where almost 50% of the
2012 student responses report never using computers in labs while over 90% of that group reported using
computers in their classrooms every day in the 9th grade.

8
Figure 2 also allows comparison of 7th grade practices in 2010 compared to the 7
th grade practices two
years later in 2012. Although the increases in classroom use were less robust as 7th grade students
matriculated into the 9th grade 1:1 program, current 7
th grade use patterns have also shifted from 2010
practices. For example, 50% of the 7th grade 2010 students reported using a computer in the classroom
only “a couple times a year”, which increased for 7th graders in 2012 to “once every couple of weeks”.
From these results, it is clear that students are experiencing a major increase in their access and frequency
of technology use of the classroom.
Figure 3 – Average number of days in a school year that students reported computer use in different settings across grade levels (Fall 2012)
When examining the Fall 2012 student survey results, classroom use was very frequent, almost every day,
(measured against 180 school days per year) in nearly every grade level surveyed. Seventh grade
students, lacking access to 1:1 student computers, reported substantially less frequent use of computers in
class than any other grade level, as shown above in Figure 3. Students reported computer use in labs and
libraries similarly across grades (generally a couple times a month), except in the 11th and 12
th grades
where students used computers in the library twice as often as the younger high school students.

9
Student computer use in school by subject area
Figure 4 – Average number of days (in a school year) students reported using a computer across subject areas and grade levels (Fall 2012)
As shown above in Figure 4, Natick students across grade levels reported very frequent use of technology
across the curriculum in many subject areas in the Fall 2012 survey. It is clear that Natick students are
using computers to support a wide variety of curricula. Trends across subject area were similar across the
grade levels with 1:1 access, with the most frequent use in English, social studies, science, and technology
classes. In technology classes 7th graders were as likely to use technology as students in the other grades,
but the lack of 1:1 student computing access limited 7th grade in most subject areas. For most subject
areas the 8th through 10
th grades tended to use computers on more days than that reported by the 11
th and
12th graders. While use in math class typically lags behind use in other core subject areas, 8
th graders are
reporting very frequent use of computers in math class.

10
Figure 5 – Average number of days in each subject area were computers were reported to be used by 7th graders in 2010, the same cohort as 9th graders in 2012, and the current 7th grade cohort (Fall 2012)
Figure 5 shows a massive increase in the frequency that Fall 2012 9th grade students reported using
computers across their classes over the past two years. Even in classes with relatively infrequent computer
use, students’ use of computers was many times greater in Fall 2012 than it had been in the same subjects
just two years prior (Fall 2010). Such a substantial increase in one cohort of students’ computer use in
class over this two-year period is noteworthy. Looking exclusively at 7th grade students results in 2010
and 2012, rates of use were generally much more similar. For example, in 2012 7th grade students
reported using computers more than twice as often in math and science than the 7th graders from two
years before in 2010, on average.

11
Figure 6 – Average number of days when students reported using school computers by subject area across grades and middle schools (Fall 2012)
Figure 6, above, further examines the extent to which the Natick middle school students used computers
in class in the fall of 2012. Averages for each middle school and subject area were calculated to represent
the estimated number of days in the school year that a student would expect to use a computer in each of
their classes. Seventh grade use occurred with similar frequency in both schools across subject areas. In
the 8th grade where 1:1 student computing has been established for the past two years, computer use was
very frequent in both schools, although Kennedy Middle School students reporting somewhat frequent
use in all subject areas (except technology). Figure 8, below, shows a similar pattern in how students use
computers in class by examining the percentage of actual class time students where students reported
using computers across core subject areas.

12
Figure 7 – Average percentage of class time when computers were used by grade level (Fall 2012)
Examining the Fall 2012 averages across grade levels, Figure 12 shows 1:1 students estimated spending
between 30% and 80% of their class time in core subject areas using computers. Students generally
reported spending the highest percentage of class time using computers in Social Studies, English, and
Science. Overall, students reported the least frequent use of computers in math classes, except for 8th
graders who report spending an average of 60% of math class using a computer. As previously observed,
7th grade students typically reported lower percentages of class time using a computer.
Student reported use of computers by teachers

13
Figure 8 – Average percentage of class time when students reported using computers across each grade level and middle school (Fall 2012)
In both the 2010 and 2012 surveys, students were asked to consider how frequently they observed their
teachers using computers in school. Figure 9, below, shows the average frequency of teacher use of
computers over the school year as reported by students, in each grade level and across subject areas.
The student estimates on how frequently their teachers used computers in class formed a similar pattern to
the student use pattern with the most frequent technology use in English, social studies, and science
classes. Although 7th graders reported that their teachers use computers less often than teachers in the
other grades, they still indicate that their teachers were using computers on about every other day in core
subject areas. Looking at the Fall 2012 results, teachers’ frequency of computer use was substantially
greater than the students’ estimated use by anywhere from 10 to 75 days depending on subject and grade
level. The smallest difference between student and teacher use was reported by 8th graders for social
studies, with teachers using computers an average of 1 day more per year than students. Further patterns
of student- reported teacher computer use are depicted across subject areas and grade levels in Figure 9,
below.

14
Figure 9 –Average number of days in the school year that students reported teachers using computers across grade level and subject area (Fall 2012)
It is clear from these results that the vast majority of Natick’s middle and high school teachers were
consistently and frequently using computers in class. The most frequent use reported for teachers (by
their students) was observed in the core curricular subjects of ELA, Math, Science, and Social Studies
were teachers used computers in class during the majority of school days. Teacher use was reported less
frequent in other subject areas such as performing arts, visual arts, and Health/PE. An interesting trend in
teacher use was also observed across grade levels in technology classes where teacher use was less
frequent in the high school.

15
Figure 10 – Average number of days students reported teachers’ using of computers by subject area as reported by 7th graders’ in 2010, the same student cohort as 9th graders in 2012, and the 2012 7th grade cohort
Similar to the increase in students’ frequency of computer use over the two-year study period, teacher use
of computers also increased dramatically across the 2010 and 2012 surveys, as shown in Figure 10.
Seventh grade teachers’ use of computers in class increased substantially in the two-year period from
2010 to 2012, as reported by each cohort of 7th grade students. Following the 2010 7
th grade cohort into
9th grade in 2012, students witnessed an even larger increase in the frequency of their teachers’ use of
computers in class.
Students’ classroom computer use activities
As shown below in Figure 11, when asked how often they engage in a number of classroom learning
activities using computers, students across all settings reported widespread and frequent use of a large
number of computer-based learning activities in the Fall 2012 survey.

16
Figure 11 – Average number of days per school year that students reported various computer-using activities by grade level

17
As shown in Figure 11, the most common classroom computing activities tended to be the relatively
passive forms of learning on the list (e.g. searching for information and accessing a video) or procedural
tasks (e.g. looking up grades and keeping track of assignments). The more constructive and learner-
centered activities occurred only about half as often. When looking across grade level averages, 7th grade
students reported less frequent specific uses of technology than students in other grade levels.
When the frequency of all computer-related activities is compared with the same students two years
earlier, as shown below in Figure 12, even relatively infrequent tasks such as playing educational
computer games, and making presentations increased substantially by Fall 2012. The new cohort of 7th
graders also reported increased technology use in most categories, sometimes doubling the previous
frequencies. But change within the 7th grade wasn’t nearly as dramatic as the one that occurred as
students moved into Natick High School.
Figure 12 - Average frequency of student classroom activities as reported by 7th graders’ in 2010, the same student cohort as 9th graders in 2012, and the 2012 7th grade cohort
Again, in the two years between 2010 and 2012, 9th grade students reported major increases in the
frequency with which they used computers and technology in school for a wide variety of purposes. Some
of the largest proportional increases occurred nearly daily in 2012 on average, such as taking notes in
class and keeping track of schedules, which 9th graders in 2012 reported doing about 30 times as often as
they did as 7th graders in 2010.
18
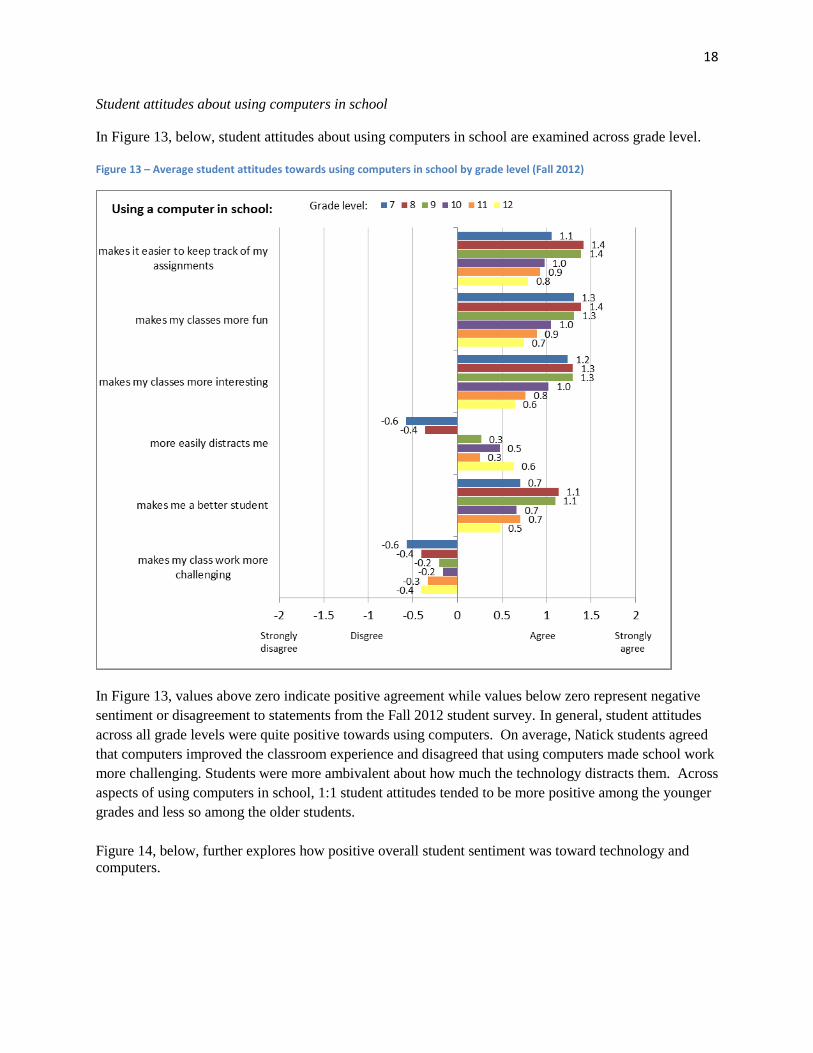
Student attitudes about using computers in school
In Figure 13, below, student attitudes about using computers in school are examined across grade level.
Figure 13 – Average student attitudes towards using computers in school by grade level (Fall 2012)
In Figure 13, values above zero indicate positive agreement while values below zero represent negative
sentiment or disagreement to statements from the Fall 2012 student survey. In general, student attitudes
across all grade levels were quite positive towards using computers. On average, Natick students agreed
that computers improved the classroom experience and disagreed that using computers made school work
more challenging. Students were more ambivalent about how much the technology distracts them. Across
aspects of using computers in school, 1:1 student attitudes tended to be more positive among the younger
grades and less so among the older students.
Figure 14, below, further explores how positive overall student sentiment was toward technology and
computers.

19
Figure 14 – Average distribution of student sentiment towards computers in school (Fall 2012)
As shown above in Figure 14, the Natick students who completed the Fall 2012 survey (n=1920)
overwhelmingly agreed that using computers helped them to keep track of their assignments, but were
less sure if using computers distracted them in school.

20
Figure 15 - Average student ratings for aspects of the technology-based learning environment and experience (Fall 2012)
Figure 15 shows the average student sentiment towards their school and different aspects of the
technology program for each participating school. Overall, Natick students in each setting consistently
found the resources and tools used by their school to function effectively. On average, students were more
ambivalent in their beliefs about peers’ ability to circumvent the school’s Internet filtering.
In order to explore in greater detail how students experience these aspects of using technology in school,
it can be helpful to examine the distribution of student ratings. Figure 16, below, details the fact that most
Natick students rated the quality of school laptops and network speed highly, with some variation.

21
Figure 16 - Distribution of student ratings for aspects of the technology-based learning environment and experience (Fall 2012)
22
Nearly a third of all surveyed Natick students reported that their school pride and their Internet security
were excellent at the highest level possible, while the remaining students represented a diverse range of
opinions, including a small minority of students who rated both of these elements as ‘poor’ at the lowest
level. Student beliefs about their peers’ ability to access Internet resources despite filtering systems were
more diverse than other beliefs, with a notable group of students who believed that their peers’ skills were
excellent, and a larger group who claim they were poor.
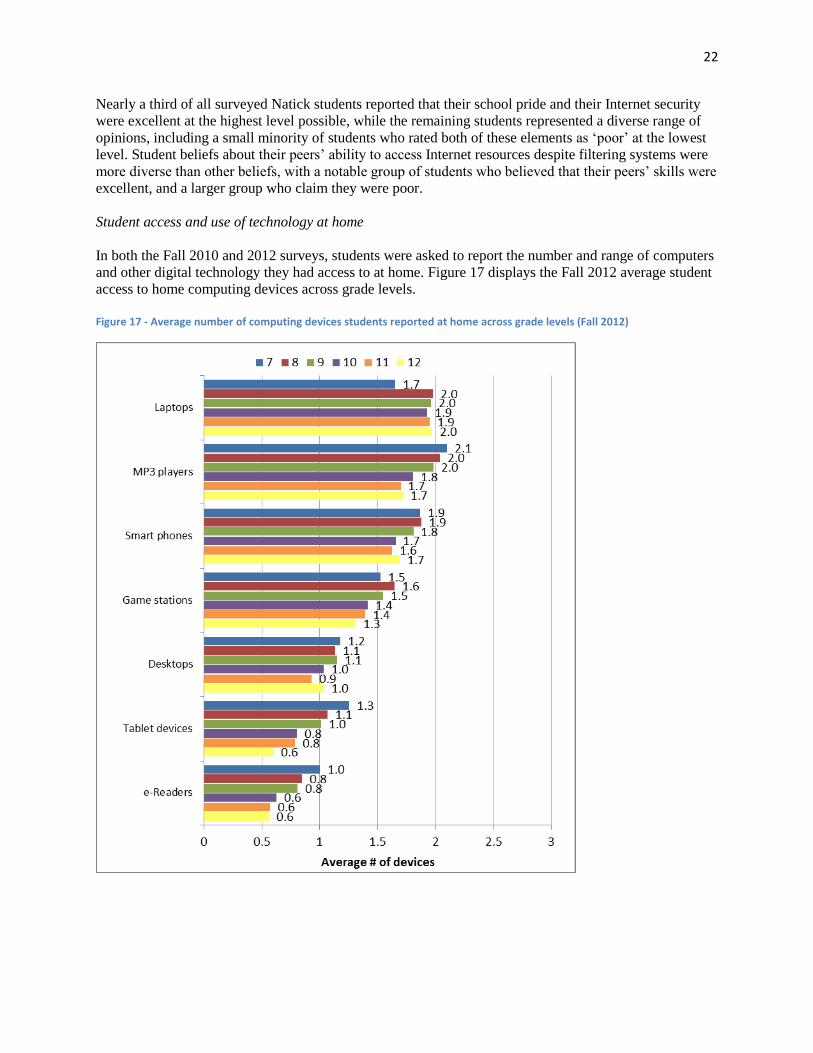
Student access and use of technology at home
In both the Fall 2010 and 2012 surveys, students were asked to report the number and range of computers
and other digital technology they had access to at home. Figure 17 displays the Fall 2012 average student
access to home computing devices across grade levels.
Figure 17 - Average number of computing devices students reported at home across grade levels (Fall 2012)

23
In the Fall 2012 survey, the vast majority of students reported widespread access to a large range of
computing devices. For example, students reported the most access to laptops, MP3 players, and smart
phones. It may also be worth noting that students have the least access to devices that have been more
recently developed, such as tablets and eReaders. Even so, about half of students reported having access
to at least one for each of these devices, and the younger students are reporting having more of them, on
average.
In addition to reporting the average number of devices, it is also possible to look at what proportion of the
Natick student respondents (n=1920) reported access to at least one of each type of device at home, as
shown in Figure 18, below.
Figure 18 - Proportions of all students who have access to at least one of each computing device at home (Fall 2012)
As shown in Figure 18, when examined proportionally, the most common device across all of the Natick
students was a laptop computer (93% of all respondents). MP3 players and game-stations were also
common, as well as smart phones. These results may represent the difference between devices that are
shared in the home as opposed to devices where family members might each have their own. It may also
represent upgrade and replacement dynamics, where frequently upgraded devices accumulate in the
household. Figure 19, below, further examines school differences in students’ home access to technology
across each of the surveyed schools.

24
Figure 19 - Proportions of students across schools who have access to at least one of each computing device at home (Fall 2012)
When the percentage of students with access to each type of device is examined for each school, as shown
in Figure 19, middle school students may be less likely to have laptops than high school students, and
more likely to have tablets and eReaders. Fall 2012 survey results also show that students in Wilson
Middle School have slightly lower access to technology than their Kennedy Middle School peers.
However, these differences between schools are too slight to represent meaningful differences in students’
home access to technology. Figure 20, below, further details Natick students’ access to each type of
computing device.

25
Figure 20 - Distribution of students by number of computing devices they access at home (Fall 2012)
Again it is clear from the survey results that students were more likely to indicate that they have access to
three, four, or more MP3 players and smart phones than they are the other devices. More than half of
students reported having access to at least 2 laptop computers, while a total of only 22 Natick students
(1.2%) reported they did not have access to either a laptop or desktop computer at home.

26
Figure 21 – Average number of minutes Natick students reported using a computer at home (Fall 2012)
Because having access to a computer at home is not the same thing as using one, students were
additionally asked to reflect how frequently they used computers at home on school days and on
weekends. On average, students reported using computers for roughly two hours a day in their homes.
While middle school students reported slightly more use on weekends, Natick High School students
reported spending, on average, 17 more minutes using computers on weekdays than on non-school days.
Figure 22, below, shows how students are distributed by the amount of time they use computers at home.

27
Figure 22 - Average number of minutes Natick students reported spending using a computer at home (Fall 2012)
As shown in Figure 22, the difference between average weekday and weekend use is apparent as students
are more likely to use computers in the 90 to 210 minute range on weekdays rather than weekends. On
weekends and school holidays students seem to be divided into a large group who use computers for less
time than when they have school, and a smaller group of students who use computers for very large
amounts of time when they don’t have school.

28
Figure 23 - Comparison of home computer use on school days as reported by 7th graders’ in 2010, the same student cohort as 9th graders in 2012, and the 2012 7th grade cohort
Looking at student home computer trends over the past two years, there was an increase in students’ home
computer use in the Fall 2012 survey. As shown in Figure 23, 65% of 7th grade students in 2010 reported
using computers at home for 30 minutes or less on school days, while only 8% of the same cohort
reported 30 minutes or less in Fall 2012. Although the students have increased the amount of time they
spend using computers at home overall, the shift has not been uniform as students are reporting a wider
range of use patterns than in 2010. Reflecting previous data, the 2012 survey permitted students to report
up to 6 hours of home computer use. However, the shape of the 2012 cumulative percent curve for the
9th graders at 330 minutes suggests that a small number of students might have reported on the order of 10
hours (or more) of computer use per day, had the survey allowed it.
Although this change is more dramatic for the 9th grade group, the current 7
th graders were reporting more
time using computers as well. This can be seen as fewer of them indicated spending 30 minutes or less
and more of them claim to use computers for 60 or 90 minutes per school day.

29
Figure 24 - Average number of minutes when students completed homework and the percentage of that time when students used a computer
In order to see how much of students’ computer use time was for homework, students were asked to
report how much time they spent doing homework, and what percentage of that time they used a
computer. The averages for each grade level are shown in Figure 24. On average, Natick students
reported spending about 109 minutes per day on homework in Fall 2012, and further reported using a
computer for nearly 74 of those minutes. Students’ average number of minutes doing homework differed
little by grade level in high school; however, 8th graders reported the highest overall percentages of
homework completion using computers.

30
Figure 25 – Average percent of Natick students who report various home computer accounts (Fall 2012)
When students were asked to identify which web-based services they subscribed in Fall 2012, Natick
High School students reported having about twice as many Facebook accounts as the middle school
students, and almost three times as many Twitter accounts. The most popular service, of those included
on the survey, was the media distribution site iTunes. As depicted in Figure 25, more than half of students
reported using Skype as well. Although media consuming and social networking were more popular, the
roughly 10% who blog and/or have their own website is a sizable group of students who use technology
for production as well as consumption of information.

31
Figure 26 – Average percent of students with web-based accounts as reported by 7th graders in 2010, the same student cohort as 9th graders in 2012, and the 2012 7th grade cohort
As shown in Figure 26, students reported many changes in what they did with technology at home
between 2010 and 2012. Over the two-year period the current 9th graders’ blogging has nearly doubled
while their use of Facebook has nearly tripled, and their Twitter use has increased to about nine-times its
2010 levels. However, the current 7th grade subscription to these services isn’t very different from the
earlier group except in Twitter use, which has increased by nearly three times.

32
Figure 27 – Average number of minutes where students reported home computer use by specific activities and across schools (Fall 2012)
In order to get a more thorough look at student’s home computing activity, students were asked to report
how much time they spent in a typical day engaged in a number of specific tasks. As shown in Figure 27,
students regularly used their home computer or technology devices for a wide variety of personal and
school-related activities. The home activity where students reported the most time (an average of 54
minutes per day) was chatting or texting with friends. Students also reported spending approximately 39
minutes per day searching the Internet for fun and 36 minutes searching the Internet for school. With
students spending so much time searching the Internet for information, it may be educationally relevant e
to take a closer look at what types of information students are accessing and how they use what they find.
Students reported spending relatively little time creating content for the web or shopping online.

33
Teacher Survey Results Like their students, teachers reported spending a great deal of time using computers for a range of
activities, both inside and outside of school. In addition, teachers express positive attitudes towards using
computers for teaching and describe employing it in a number of ways to improve their instruction. For
some of the questions on the survey only small differences were found between the teachers of different
schools. Within and across the schools, interesting patterns were observed based on the teachers’ content
areas. For purposes of grouping by subject area, teachers of more than one subject were included in each
subject they teach in. Therefore, the sums of columns in Table 3 are greater than the totals indicated at
the bottom of the table. Teachers who identified their subject as “other” indicated that they taught either
technology or special education classes.
Table 3 – Natick secondary teachers who responded to the teacher survey by subject area
Figure T28 - Teachers' ratings of personal preparedness for using technology in their teaching (Fall 2012)
When asked to rate their preparedness to use technology for instruction, Natick teachers reported
overwhelmingly that they felt at least somewhat well prepared to teach. Teachers tended to rate
themselves a little over 3, where 1 = “Not at all prepared”, 2 = “Somewhat well prepared, 3 =

34
“Moderately well prepared, and 4 = “Very well prepared.” The largest group of teachers (42%) indicated
they were very well prepared to use technology.
Classroom technology use and instructional practice
In the Fall 2012 survey, teachers were asked to describe a typical day in their classes by indicating how
much class time was spent in a number of activities. These activities were reported in percentages across
each participating school in Figure T29.
Figure T29 - Proportion of class time that a series of activities occur in a typical day by school (Fall 2012)
Teachers typically reported that students were engaged and on-task during class. On average, Natick
teachers reported spending about half of class time using a computer to present information to their
students across schools. While teacher activities were similar between schools, there were some notable
differences between schools in teachers’ reports about student activities. In Natick High School, teachers
reported that students used computers for a greater portion of class time than in the other schools.
Kennedy Middle School teachers reported students being more likely to work in groups, while Wilson
Middle School teachers reported students spending a greater part of class time working individually.

35
Figure T30 - Proportion of class time that a series of activities occur in a typical day by subject area (Fall 2012)
When these activities were examined across teachers’ subject areas, other patterns were observed.
Foreign language and social studies teachers reported themselves as spending the greatest portion of class
time using computers to present information, at more than 60%. Conversely, health and PE teachers
reported the lowest relative levels of computer use by teachers or students. Another subject area
difference can be seen at the bottom of Figure T30, where art teachers reported their students spent about
50% of class time working on their own interests, more than double most of the other subject areas.
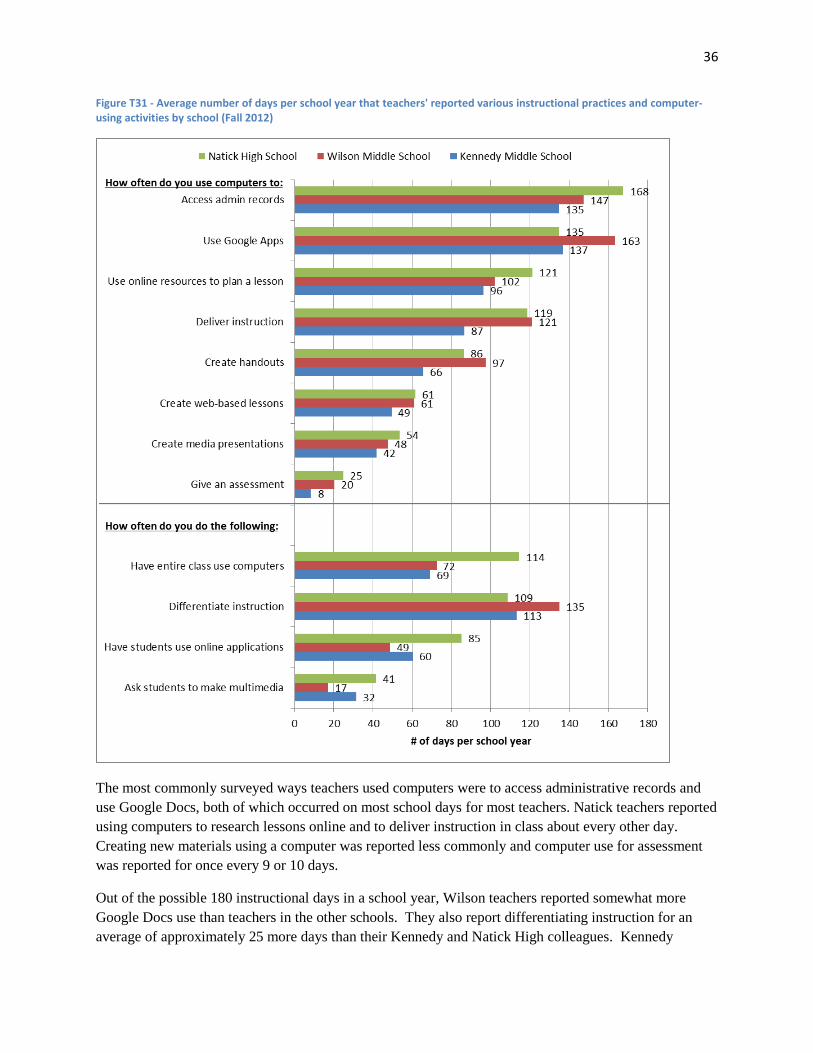
Teacher and classroom practices are further explored in Figure T31, where teachers reported how often
they used technology for a number of instructional and professional purposes.
36
Figure T31 - Average number of days per school year that teachers' reported various instructional practices and computer-using activities by school (Fall 2012)
The most commonly surveyed ways teachers used computers were to access administrative records and
use Google Docs, both of which occurred on most school days for most teachers. Natick teachers reported
using computers to research lessons online and to deliver instruction in class about every other day.
Creating new materials using a computer was reported less commonly and computer use for assessment
was reported for once every 9 or 10 days.
Out of the possible 180 instructional days in a school year, Wilson teachers reported somewhat more
Google Docs use than teachers in the other schools. They also report differentiating instruction for an
average of approximately 25 more days than their Kennedy and Natick High colleagues. Kennedy

37
Middle School teachers also reported using computers to assess students less than half as often as teachers
in the other Natick schools. Natick High School teachers again indicated requiring their students to use
computers more frequently than teachers in the other schools, so the high school students were using
computers both more often and for a greater proportion of class time. This included more student use of
online applications.
Figure T32 - Average number of days per school year that teachers' reported various instructional practices and computer-using activities by subject (Fall 2012)

38
When examined across all subject areas, health and PE teachers reported lower frequencies of use with
similar conditions in arts classrooms, as shown in Figure T32. Social studies teachers reported creating
new lesson content in media and for the web more frequently than teachers in other subject areas, with an
average just under 90 days per school year (about every other day). In terms of practices that are not
technology dependent, most subject area teachers indicated that they differentiated instruction on more
than 2/3 of school days, while foreign language teachers reported differentiating on fewer than half.
Teacher attitudes towards using technology in school
In general, teachers reported positive attitudes towards using computers for teaching and learning, as
shown below in Figure T33
Figure T33 - Average teacher attitudes towards teaching practices and using computers in class by school (Fall 2012)
Overall, 60% of teachers agreed that computers contributed to their enthusiasm and 73% to their
effectiveness. Looking across Natick schools, teachers at Kennedy demonstrated a greater preference for

39
technology across survey items. Compared to other schools, Natick High teachers were more likely to
“agree” that computers served as a distraction for students
Figure T34 - Average teacher attitudes towards teaching practices and using computers in school by subject (Fall 2012)
Overall, teachers largely disagreed with the suggestion that student computer use made teaching harder,
or weakened students’ research skills. However, 56% of Natick teachers reported that students can be
distracted when using computers. When examined across different subject areas, Fall 2012 results show
that this belief was strongest among foreign language teachers. As shown in Figure T34, this group is

40
also the only one that, on average, believes computers contribute to student laziness. Otherwise, teacher
beliefs about using computers in class are similar across subject specialty.
Looking across the Fall 2012 teacher sentiments, larger differences were observed in teacher attitudes by
subject area, irrespective of technology. For example English and arts teachers were the more likely to
assign long-term projects to their classes while math and foreign language teachers were more likely to
assign simple, accessible problems. Additionally, social studies and health/PE teachers were substantially
less likely to report that “too many students needed their help”.
Figure T35 - Average teacher attitudes towards using computers in their work by school (Fall 2012)

41
Teachers were also asked to reflect on how they personally experience using computers in their work.
Again, the overall attitude of Natick Public School teaching staff was quite positive, indicating positive
impacts of technology. Rather than between school differences, more variation was again observed
between teachers of different subject areas. Figure T35 shows that arts teachers were the least likely to
believe that computers brought additional interest or fun to their classes. Meanwhile, foreign language
and social studies teachers were most likely to indicate that computers made their teaching more
challenging.
Figure T36 - Average teacher ratings for aspects of the technology-based learning environment and experience (Fall 2012)
When asked about the technological aspects of the new school environment (quality of the laptops,
Internet speeds) teachers tended to be more positive than their very positive students, giving average
ratings about 10 points higher on the 100-point scale. This pattern was consistent across all of the
surveyed Natick schools, while teachers also reported high levels of school pride. There was little
difference between teachers across the different subject areas in these beliefs.
Interestingly, teachers’ average ratings on both the Internet filter effectiveness and students’ skill in
circumventing the filters were also about 10 points higher than the students’ ratings. However, while
there was no difference observed among students between schools on this issue, Kennedy teachers’

42
confidence in the overall Internet security tended to be higher than that of the Natick High School and
Wilson Middle School teachers.
Teacher access and use of technology at home
As with their students, teachers reported high levels of access to portable computing devices at home. On
average, they claimed to have more than one laptop, mp3 player, and smart phone each. But across all
items except eReaders, Natick students actually reported higher levels of home access. While eBook
readers were the least frequently reported devices by students, they were ranked similarly to tablet devices
and desktop computers among teachers’ technology access.
Figure T37 - Average number of computing devices teachers reported at home across subject areas (Fall 2012)

43
While there was little difference between schools among teachers’ home access, Figure T37 shows some
differences between teachers by subject area. For example, social studies and science teachers had fewer
smart phones on average than other teachers. English teachers were more likely to have eReaders by
about the same amount as art teachers counted more desktop computers. The most pronounced difference
was found for gaming stations where art teachers claimed to similar numbers as their students, while most
teachers reported only half as many.
In addition to the number and type of devices they can access, teachers were asked to report on how much
time they typically spend using computers at home on a school day or on the weekend. They were also
asked how much time they spent each day using these devices for a varied list of activities. On average,
teachers reported 95 minutes of home computer use per school day, about 30 minutes less than the
average student. Middle school teachers reported spending a little more time than their students, while
the high school teachers spent less. Teachers across schools, as seen in Figure T38, spend upwards of 30
minutes more per day on the weekend than they do on school days. Compared to their students in the
Kennedy and Wilson Middle Schools, this difference is only about 10 minutes, while at Natick High
School the trend is reversed.
Figure T38 - Number of minutes Natick teachers reported spending using a computer at home (Fall 2012)
As shown above in Figure T38, Natick teachers reported spending, on average, at least several minutes a
day engaged in a number of home computing activities. Of the survey’s listed activities, teachers spent
the largest amount of their time searching the Internet for school, which ranked third for students. Both
students and teachers reported spending about 40 minutes per day on this activity. Students’ most time-
consuming activity of chatting and texting for over 50 minutes a day falls to a mid-level activity among
teachers at fewer than 15 minutes per day. Searching the Internet for fun remained relatively popular
activities among both groups, though the students spent considerably more time than teachers reported for
themselves.

44
Figure T39 - Average number of minutes where teachers reported home computer use by specific activities and across schools (Fall 2012)
As displayed in Figure T39, there was very little variation between Natick schools in terms of teachers’
home computer use activities. One notable exception was that Kennedy teachers reported substantially
more time creating media to post online than did the other teachers.
Some of the differences between teachers’ home technology use can be seen by subject area in Figure
T40. One of the most obvious results is that foreign language teachers reported searching the Internet for
class an average of 10 minutes more than other teachers. The same teacher cohort also reported spending
more time searching the Internet for fun. Meanwhile art teachers report unusually high amounts of time
using social networking sites, chatting or texting, playing computer games, and creating media to post
online. Video and audio conferencing were reported as uncommon activities by teachers generally, but
no English teachers reported spending any time at this activity.

45
Figure T40 - Average number of minutes where teachers reported home computer use by specific activities and across schools (Fall 2012)

46
Figure T41 – Average percent of Natick teachers who report various home computer accounts by school (Fall 2012)
In the Fall 2102 teacher survey, Natick teachers reported subscribing to several online services. The most
popular online services were iTunes, Amazon, and Facebook, respectively. One of the conspicuous
differences between teachers’ and students’ website accounts is that teachers are about three times as
likely to have an Amazon account. In fact nearly all of the Wilson Middle School teachers report having
Amazon accounts. Another school-level difference between teachers was found in the high school
teachers having their own websites at nearly twice the rate of middle school teachers.
When teachers’ Internet accounts were compared across subject areas art teachers were more likely than
others to have their own blog or website. This would be consistent with the increased time spent creating
media for posting online. However, health/PE and science teachers also reported high rates of possessing
their own websites.

47
Figure T42 - Average percent of Natick teachers who report various home computer accounts by subject (Fall 2012)

48
References
Baldwin, F. (1999). Taking the classroom home. Appalachia, 32(1), 10-15.
Bebell, D., O’Dwyer, L. M., Russell, M., & Hoffman, T. (2010). Concerns, considerations and new ideas
for data collection and research in educational technology studies. Journal of Research on Technology in
Education, 43 (1),
Bebell, D. & O’Dwyer, L. M. (2010). Educational Outcomes and Research from 1:1 Computing Settings.
Journal of Technology, Learning, and Assessment, 9 (1).,
Bebell, D. & Kay, R. (2010). One to one computing: A summary of the quantitative results from the
Berkshire Wireless Learning Initiative. Journal of Technology, Learning, and Assessment, 9 (2).
Bebell, D., Russell, M., & O’Dywer, L. (2004). Measuring teachers’ technology uses: why multiple
measures are revealing. Journal of Research on Technology in Education. Fall 2004.
Becker, H. (1999). Internet use by teachers: Conditions of professional use and teacher directed student
use. Irvine, CA: Center for Research on Information Technology and Organizations.
Bull, G., Bull, G., Garofolo, J., & Harris, J. (2002). Grand Challenges: Preparing for the Technological
Tipping Point. The International Society for Technology in Education (ISTE). Retrieved from
http://www.iste.org/L&L/29/8/featured-article/bull/index.htm
Cromwell, S. (1999). Laptops change curriculum -- and students. Education World. Retrieved from
http://www.education-world.com/a_curr/curr178.shtml
Greaves, T., Hayes, J., Wilson, L., Gielniak, M., & Peterson, E. (2010). Project RED key findings.
Shelton, CT: MDR. Retrieved from the One-to-One Institute at www.one-to-
oneinstitute.org/NewsDetail.aspx?id=85
Guignon, A. (1998). Laptop computers for every student. Education World. Retrieved from
http://www.education-world.com/a_curr/curr048.shtml
Lathrop, Leonard E. (1826). Remarks On the General Condition of Agriculture: The Farmer’s Library,
Second Edition. Windsor, VT: Wyman Spooner.
Maine Education Policy Research Institute (MEPRI). (2003). The Maine Learning Technology Initiative:
Teacher, Student, and School Perspectives Mid-Year Evaluation Report. Retrieved from
http://www.usm.maine.edu/cepare/pdf/ts/mlti.pdf.
Oppenheimer, T. (2003). The Flickering Mind: The False Promise of Technology in the Classroom and
How Learning Can Be Saved. New York, NY: Random House.
Papert, S. (1996). The connected family: Building the digital general gap. Atlanta, GA: Long Street Press.
Papert, S (1992). The children’s machine. New York, NY: Harper Collins.
Ravitz, J., Wong, Y., & Becker, H. (1999). Teacher and teacher-directed student use of computers and
software. Irvine, CA: Center for research on information technology and organizations.
49
Richtel, M. (2011, September 04). Grading the digital school: In classroom of future, stagnant scores. The
New York Times. Retrieved from http://www.nytimes.com/2011/09/04/technology/technology-in-schools-
faces-questions-on-value.html?_r=4
Rockman, S. (1998). Powerful tools for schooling: Second year study of the laptop program. San
Francisco, CA: Author.
Russell, M., Bebell, D., & O’Dwyer, L.M. (2005). Tracking the arc of new teachers technology use. In :
Charalambos Vrasidas, Gene V. Glass (Eds.) Preparing Teachers to Teach With Technology: Current
Perspectives on Applied Information Technologies. Greenwich, CT: Information Age Publishing, Inc.
Russell, M., Bebell, D., O’Dwyer, L.M., & O’Connor, K.M. (2003). Examining teacher technology use:
implications for pre-service and in-service teacher preparation. Journal of Teacher Education, 54 (4),
297-310.
Russell, M., Bebell, D., Cowan, J. & Corbelli, M. (2003)..An AlphaSmart for each student: Does teaching
and learning change with full access to word processors? Computers and Composition, 20, 51-76.
Silvernail, D.L. & Lane, D.M. (2004). The Impact of Maine’s One-to-One Laptop Program on Middle
School Teachers and Students. Maine Education Policy Research Institute (MEPRI), University of
Southern Maine.
Snyder, T.D., and Dillow, S.A. (2012). Digest of Education Statistics 2011 (NCES 2012-001). National
Center for Education Statistics, Institute of Education Sciences, U.S. Department of Education.
Washington, DC: U.S. Government Printing Office.