Nathan VanRheenen Richard N. Palmer Civil and Environmental Engineering University of Washington ...
29
Nathan VanRheenen Richard N. Palmer Civil and Environmental Engineering University of Washington www.tag.washington.edu Recasting the Future Developing Adaptive Policies Using Optimization and Decision Analysis -A Case for the Snake River Basin-
-
date post
22-Dec-2015 -
Category
Documents
-
view
213 -
download
0
Transcript of Nathan VanRheenen Richard N. Palmer Civil and Environmental Engineering University of Washington ...

Nathan VanRheenenRichard N. Palmer
Civil and Environmental EngineeringUniversity of Washington
www.tag.washington.edu
Recasting the Future Developing Adaptive Policies Using Optimization and Decision Analysis
-A Case for the Snake River Basin-

Goals of Research
What are the long-range impacts of climate change on the managed Snake River system? Goal: Develop a model that incorporates
current and future operating rules and management strategies
Simulation Model of Snake River Basin (SnakeSim)
How can the potential impacts of climate change be mitigated? Goal: Develop a model that provides the
“best” management strategy for SRB usersNew starting point for policy-makers Optimization Model of SRB (SnakeOpt)

Political Landscape
Many users Many opinions Scientific controversy Established positions Political activism

Political Landscape
No More Ignoring the Obvious – Idaho Sucks Itself Dry – High Country News, 2/95
“The department has handed out water rights and groundwater permits as if there’s no tomorrow."
"The fish were there first, but they didn’t fill out the (water rights) forms." Ongoing Issues
Basin Adjudication Biological Opinions Groundwater supply uncertainty Changing water supply needs Relationship to the Columbia River and the PNW Uncertainty of future climate and impacts on water resources

Snake River Models

SnakeSimOperations Model
VICHydrology Model
Changes in Mean Temperature and
Precipitation or Bias Corrected Output
from GCMs
SnakeSimOptimization Model

SnakeOpt
Purpose: Develop a model that provides the “best” management strategy for SRB users
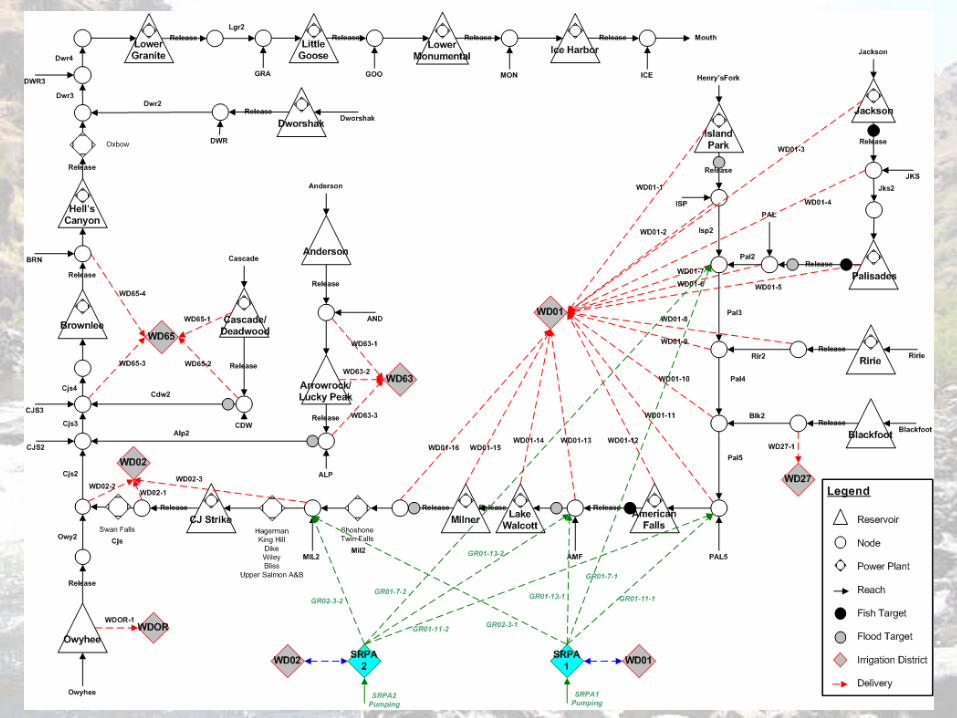
Considers Major surface water features System uses
e.g., flood control, irrigation, fish, hydropower Groundwater impacts 8 major irrigation districts
Economic Objective Function

Snake River Basin WR Network

SnakeOpt - Approach
Objective Function Weekly timestep Maximize
Z = Agriculture Revenue ($) + Hydropower Revenue ($) - Flood damages ($) - Environmental Target Penalties
Subject to Inflows, PET Water rights Groundwater availability Farmland availability, crop values and costs,
irrigation efficiency Energy demand and rates Infrastructure limitations (reservoir and powerplant
capacity, etc.) Network flow constraints

SnakeOpt – Approach
Run model from 1950-1992 LP/SLP Decomposition Rolling 5-year window Step 1
Maximize over 5 years (260 mo.)
Extract conditions at week 52 Redefine constraints Rerun first 52 weeks to
determine first year model optimum
Step 2 Move to 2nd 5-year window Redefine constraints with Step
1 end conditions Proceed with 2nd window as
per Step 1

Comparison to Historical Operation
Snake River Storage, 1975-1985Historic Mean vs Optimized Single Years
5000
6000
7000
8000
9000
10000
11000
12000
13000
Oct Nov Dec Jan Feb Mar Apr May Jun Jul Aug Sep
tho
us
an
d a
cre
-fe
et

Comparison to Historical Operation
Snake River Storage, 1975-1985Historic vs Optimized Historic
6000
7000
8000
9000
10000
11000
12000
Oct Nov Dec Jan Feb Mar Apr May Jun Jul Aug Sep
tho
us
an
d a
cre
-fe
et
Historic
Optimized
Drafted for ROR Energy
Elev Raised for EnergyLower SW Irrigation
Increase GW pumping

Comparison to Historical Operation
Dworshak Storage, 1975-1985Historic Mean vs Optimized Single Years
1400
1900
2400
2900
3400
Oct Nov Dec Jan Feb Mar Apr May Jun Jul Aug Sep
tho
us
an
d a
cre
-fe
et

Comparison to Historical Operation
Dworshak Storage, 1975-1985Historic vs Optimized Historic
1500
1700
1900
2100
2300
2500
2700
2900
3100
3300
3500
Oct Nov Dec Jan Feb Mar Apr May Jun Jul Aug Sep
tho
us
an
d a
cre
-fe
et
Historic
Optimized
Drafted for Fish
Drafted for Fish
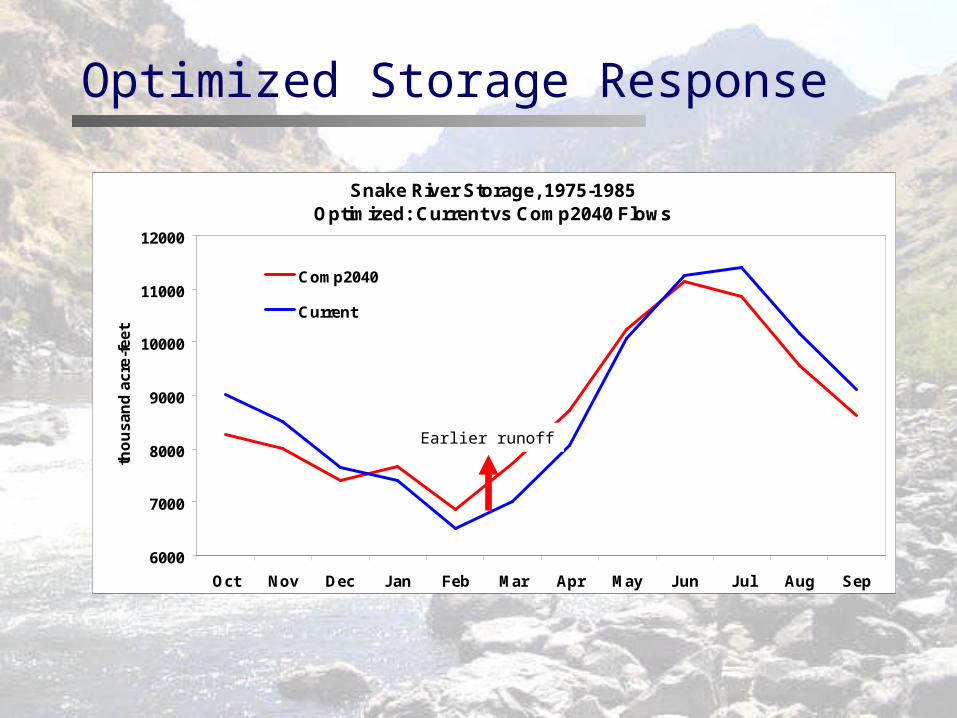
Optimized Storage Response
Snake River Storage, 1975-1985Optimized: Current vs Comp2040 Flows
6000
7000
8000
9000
10000
11000
12000
Oct Nov Dec Jan Feb Mar Apr May Jun Jul Aug Sep
tho
us
an
d a
cre
-fe
et
Comp2040
Current
Earlier runoff

Optimized Storage Response
Dworshak Storage, 1975-1985Optimized: Current vs Comp2040 Flows
1500
1700
1900
2100
2300
2500
2700
2900
3100
3300
3500
Oct Nov Dec Jan Feb Mar Apr May Jun Jul Aug Sep
tho
us
an
d a
cre
-fe
et
Comp2040
Current
Earlier runoffReturn to near historic sto

Optimized SW Diversion Response
Snake River Surface Diversions, 1975-1985Optimized: Current vs Comp2040 Flows
0
100
200
300
400
500
600
700
800
Oct Nov Dec Jan Feb Mar Apr May Jun Jul Aug Sep
tho
us
an
d a
cre
-fe
et
Current
Comp2040
Seasonal water availability
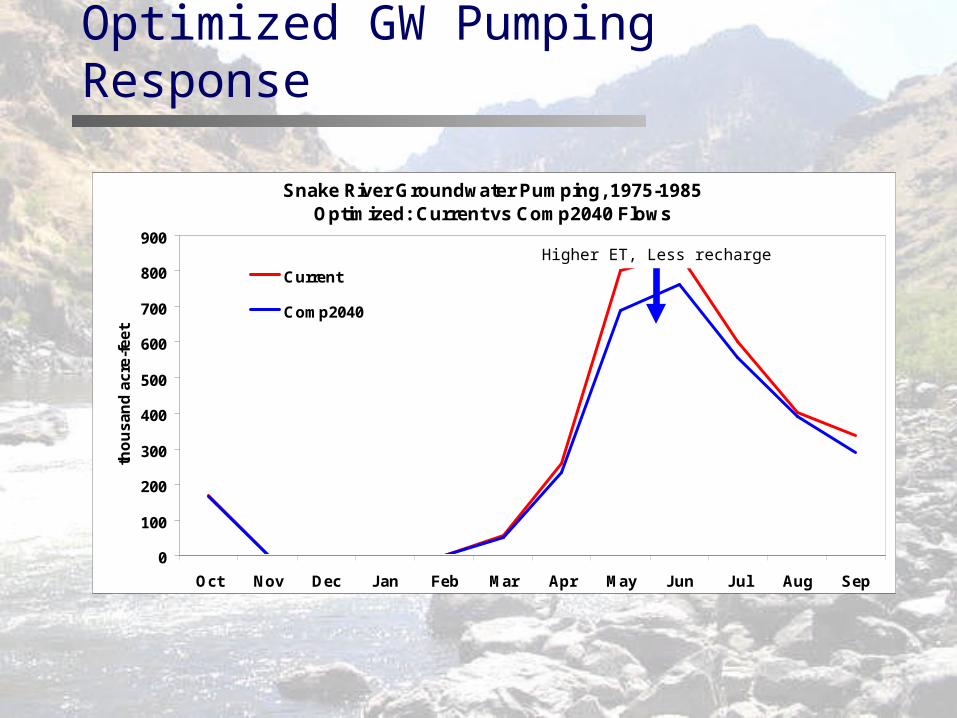
Optimized GW Pumping Response
Snake River Groundwater Pumping, 1975-1985Optimized: Current vs Comp2040 Flows
0
100
200
300
400
500
600
700
800
900
Oct Nov Dec Jan Feb Mar Apr May Jun Jul Aug Sep
tho
us
an
d a
cre
-fe
et
Current
Comp2040
Higher ET, Less recharge

Optimized Hydropower Response
Minidoka Project Energy Production, 1975-1985Optimized: Current vs Comp2040 Flows
140000
160000
180000
200000
220000
240000
260000
280000
300000
Oct Nov Dec Jan Feb Mar Apr May Jun Jul Aug Sep
MW
h
Current
Comp2040
10% Overall Decrease, Loss of $10 M/yr

Optimized Hydropower Response
Snake River Energy Production, 1975-1985Optimized: Current vs Comp2040 Flows
1506000
1706000
1906000
2106000
2306000
2506000
2706000
Oct Nov Dec Jan Feb Mar Apr May Jun Jul Aug Sep
MW
h
Current
Comp2040
10% Overall Decrease, Loss of $82 M/yr

Snake River Energy Production, 1975-1985Optimized: Current vs Comp2040 Flows
900000
1100000
1300000
1500000
1700000
1900000
2100000
2300000
2500000
2700000
Oct Nov Dec Jan Feb Mar Apr May Jun Jul Aug Sep
MW
h
Current
Comp2040
Historic
Optimized Hydropower Response
10% Overall Decrease, Loss of $82 M/yr
Also Optimized
Surface vs. groundwater use Cropping area Crops planted Environmental flow targets, as desired
427 rule Flows at Milner, etc.
Real value is in generating tradeoff curves for testing in simulation tools

Example Management Options
Unconstrained system (capacities only) Flood space preserved 427 rule (or others) met every year All reservoirs operated conjunctively BOR, IP, COE operate own reservoirs
optimally Groundwater not used or used
selectively What areas are you interested in? Identify locations to optimize
sustainable managed recharge

Implications
Climate change will negatively impact agriculture productivity, fish flow satisfaction, and energy production
But… If the system is operated in a “more
optimal” way, the improvement over historical management far outpaces predicted climate change impacts

Implications
Why isn’t the system operated like this now? Historical precedent
Snake River managed as 2 distinct rivers Irrigators get the “first fruits” Belief that extensive groundwater pumping in the
upper river is necessary to ensure high flows (vis-à-vis gw discharge) in the lower river
However, users in the Basin may now be receptive to new ideas…

SnakeOpt – Potential Future Work
Annual Planning Approach
52-week forecast and 4 years climate change prediction
How much water can irrigators, utilities, and fish get in the next year to ensure a sustainable future?
Where are the tradeoffs?


SnakeOpt – The Value of Optimization
What can be learned from an optimization? Can management alternatives be tested in an
optimization? Why must it be in economic terms? What
about “values”? Can an optimization model “stand alone” or
must it be used with a simulation model?