Naslovnica - Microsoft · financial stability review, expert papers iii contents the use of market...
37
MAY 2008
Transcript of Naslovnica - Microsoft · financial stability review, expert papers iii contents the use of market...

MAY 2008

.
ii FINANCIAL STABILITY REVIEW, EXPERT PAPERS
Published by: Bank of Slovenia
Slovenska 35
1505 Ljubljana
Tel: 01 47 19 000 Fax: 01 25 15 516
This publication is also available in Slovene.
The opinions and conclusions in the articles in this publication do not necessarily reflect the official position of the Bank of Slovenia, Faculty of Economics, University of Ljubljana or their bodies.
ISSN 1581-9752 (print version) ISSN 1581-9760 (internet version)

. .
FINANCIAL STABILITY REVIEW, EXPERT PAPERS iii
CONTENTS
THE USE OF MARKET INFORMATION IN THE ANALYSIS OF THE FINANCIAL STABILITY OF BANKS Vida Bukatarević, Božo Jašovič MA, Tomaž Košak MA, Tatjana Šuler MA 1 RETAIL CERTIFICATES – INVESTMENT PRODUCTS Ana Gorišek, Miha Leber 13 TAXATION OF PERSONAL INCOME FROM CAPITAL Mitja Čok, Ph.D. 26

.
iv FINANCIAL STABILITY REVIEW, EXPERT PAPERS

. .
FINANCIAL STABILITY REVIEW, EXPERT PAPERS 1
THE USE OF MARKET INFORMATION IN THE ANALYSIS OF THE FINANCIAL STABILITY OF BANKS
Vida Bukatarević, Božo Jašovič, Tomaž Košak and Tatjana Šuler1
SUMMARY
Supervisory institutions rely on market information in the early detection of financial difficulties in the banking system. In developed financial systems this information is relatively good at identifying the expectations of investors regarding the future performance of an individual bank. Distance-to-default is one of the indicators based on this type of information. The challenge in environments that are less financially developed lies in the method for indirectly calculating distance-to-default for individual banks and in the formation of a systemic stability indicator for the banking system. In the indirect calculation of distance-to-default, it is assumed that the variation of this indicator for companies (as sector representatives), to which banks are exposed, provides a substitute for missing market information, i.e. variation in the prices of banks' shares. Confirmation of the hypothesis that distance-to-default is indicative of changes in the risks of the banking system, since it precedes accounting data, is dependent on empirical testing
1 Vida Bukatarević, Božo Jašovič, Tomaž Košak, Tatjana Šuler, Bank of Slovenia

.
2 FINANCIAL STABILITY REVIEW, EXPERT PAPERS
1 Introduction
Banks are specific institutions, subject to a considerably higher level of supervision than other corporate entities. The primary reason for the special regulation and supervision of banks lies in the fact that difficulties at banks can jeopardise the functioning of the entire financial system, and thus financial stability. The need for the supervision of banking operations is based on the assumption that market discipline is insufficient to ensure the stability of banking operations, as it does at non-financial corporations, due to non-transparent bank portfolios. Pressures to reduce the costs of supervision, globalisation, financial deepening and complexity have resulted in the increased ability of financial markets to supervise financial institutions. A reduction in information asymmetry has been accompanied by the increased ability of market participants to build all relevant information into prices, with their estimates characteristically future-oriented. Consequently, the financial market "supervises" financial institutions by granting institutions with good prospects access to financial resources, while providing financial resources to high-risk institutions at higher prices or even by blocking their access thereto. As a rule, market information is available at all times and to a great extent reflects the expectations of market participants. In contrast to the official information of supervisors, which is based on accounting reports for past periods, market information possesses an additional quality. Since market prices (information) are current and forward looking, they may perceive changes in the risks of banking institutions before information based on reports. This fact may be confirmed on the basis of available literature and a number of previous studies. We also used data for Slovenian banks in our search for empirical confirmation (or rejection). Given that the shares of most banks are not listed on the stock exchange, we will attempt to determine whether we can enhance the data from bank reports by using direct and indirect market information (such as changes in the stock market index and the share prices of companies traded on the stock exchange), and thus arrive at indicators that point to change in the risks of banks before indicators based on official reports and financial statements. 2 Market discipline and official (regulatory) supervision
State institutions are heavily involved in the supervision of financial (banking)2 institutions, on account of their obligation to maintain financial stability. The need for regulation and supervision of compliance with regulatory requirements by banking institutions is based on two assumptions (Flannery, 1998; Gunther et al., 2001; Krainer and Lopez, 2003): first, savers (depositors) are not well-versed in distinguishing between high-risk and low-risk institutions due to incomplete information, atomisation, poor coordination, lack of knowledge and lack of interest. Therefore the state has "corrected" this market deficiency through supervision. Second, bank investments are characterised by a lack of transparency in terms of information (bank opacity: a bank has all necessary information to make a credit assessment of a debtor or the promise of an investment project), and are thus less attractive to the wider circle of uninformed investors. Consequently, banks are specific institutions that are sensitive to environmental influences and are thus exposed to instabilities due to predominantly short-term liabilities held by a number of depositors who have difficulty recognising risks, and due to non-transparent investments, about which only banks have all necessary information. Regulatory supervision thus corrects a market that is functioning poorly due to the incomplete information of participants, in order to determine the proper value of bank portfolios that are based on the private information of banks. Such supervision supplements or even replaces the external supervisory function of financial investors (depositors, creditors, owners). On the one hand, there is regulatory supervision that deals with the entry of financial institutions to the sector and the implementation of rules of prudent operation, as well as liquidation and withdrawal from the sector. On the other hand, we have investors (owners, creditors, savers), who attempt to ensure that they will receive the expected return on their investment through various mechanisms of (market) supervision. Here, the interests of owners (shareholders), creditors (creditors and depositors) and management may intersect. Both perspectives of supervision – market and regulatory – influence how financial activities (legal form, type of activity, internal organisation, etc.) are carried out, and ultimately affect the risks of individual institutions. These two perspectives of supervision coexist and influence the operational behaviour of financial entities. This raises the question as to what extent these two perspectives can compliment each other. The extent and effectiveness of regulatory supervision act to encourage market participants to supervise the operations of financial institutions. For example, the mergers and acquisition market is weak in the banking sector, since in most countries the regulator issues a licence for the acquisition of a qualifying holding. Likewise, savers do not spend an excessive amount of time debating the issue of how healthy a deposit institution is if their deposits are insured by a guarantee scheme. This all leads to another question: is it not the case that official supervision also "provides" the justification of its own existence by overseeing banking institutions instead of financial investors (depositors), and by assessing and monitoring the risks of supervisory institutions with preferential access to banking information? To a great extent, when the need for official supervision arises, financial investors are less motivated to carry out external market supervision. On the other hand, the pressures of market participants, due to the rising costs of financial supervision, result in a reduction in regulatory repression. The latter increased in the period following the Second World War until the early 1970s, and provided for the relative stability of financial systems. However, the cost of maintaining stability is a constant target of critical market participants who argue for the increased role of market discipline. 2 Below we will focus primarily on banking institutions, which are the subject of the research, although certain findings in this paper
will be relevant to financial institutions in general and not only to banks.

. .
FINANCIAL STABILITY REVIEW, EXPERT PAPERS 3
With the development of the financial system – deepening, complexity and globalisation – the ability of financial markets to effectively supervise financial institutions has also improved. At the end of the 20th century, the transformation from a government-led financial system to a market-led financial system was largely complete in developed financial environments (Crockett, 2001). In the search for highest-yielding alternative investments, financial participants applied pressure to reduce the costs of financial supervision and demanded increased transparency and uniformity in the disclosure of banking institutions' financial data. The aim of this pressure was to eliminate information asymmetry (to reduce the non-transparent nature of banking investments), with which the need for official regulation and supervision of banks is justified. An important step in realising the aforementioned requirements was made with the adoption of the International Financial Reporting Standards and the new Basel Accord which, in the third pillar, introduces requirements for increased information transparency on the part of credit institutions. The aforementioned regulatory frameworks represent an important contribution to greater enforcement of market supervision in the operations of credit institutions and the possible reallocation of responsibilities between market supervision and official supervision, in favour of the former. Finally, it is possible to base increased enforcement of market supervision on the fact that market valuations and associated risks are an endogenous variable in the collective behaviour of market participants (Crockett, 2001). In other words, it is important what the majority of market participants think and how they act, or make decisions. Based on this, market prices and risk levels, which ultimately impact banks' balance sheets and income statements, are determined. It is from this fact that we recognise that the market's role in the supervision of bank should not be glorified. Market participants immediately build each new piece of information into their prices, and make their decisions on this basis. It is through their own responses that the need to restructure portfolios arises, thus further contributing to changes in market parameters. Due to the quick response of market participants, adjustments were greater than would have been necessary had their decisions been characterised by a gradual approach, and thus could be contrary to financial stability (Flannery, 1998, Crockett, 2001). A number of empirical analyses indicate that market participants build each new piece of information into valuations, which is ultimately reflected in their responses and market prices. This does not prove that their valuations are correct, but that they respond reasonably to each new piece of information on the market (Flannery, 1998; Gunther et al., 2001; Krainer and Lopez, 2020; Curry et al., 2003). In addition, market participants build their expectation into valuations, and thus market prices are forward-looking and have an important advantage over an auditor's or supervisor's assessment, which is primarily based on past information and events. We can also add the continuity of market valuations to this advantage. The result is prices that reflect the latest information available to participants. In this regard, market parameters also have an advantage over the information of an auditor or supervisor, which assesses banks in detail on an annual (or in the best-case scenario half-yearly or quarterly) basis. Furthermore, it is well known that an auditor's assessments, which are based on past information, become quickly outdated, if they are not already outdated when they are published. An important advantage supervisory institutions have over the market is the fact that they have preferential access to all the business information and documentation of institutions subject to supervision, a large portion of which does not reach market participants. The latter actually means that official supervisors use different data sources for their assessments than market participants. It could be concluded that official supervisors and market participants are interested in collecting information regarding the operations of banks and the risks they assume. In this respect, each side uses information that it obtains from different sources and with a different timeframe. The logical continuation of such a conclusion is that the information of both sides could be complementary, and contribute to the improved understanding of banks' operations, if they were available to both sides. It is critical to the quality of market assessments that market participants receive as much information as possible regarding the institutions in which they invest. The rules regarding disclosures and the transparency of operations foreseen in the third pillar of the new Basel Accord represent a significant contribution to the increased enforcement of market discipline. Partial disclosure of official supervisors' assessments could contribute even further to the quality of market information. 3 Balance between official and market discipline in the supervision of
banking institutions
The market and market participants are capable of identifying changes at banks that affect their assessments, and as a result, decisions and prices. Market discipline is thus applied to banks: if investors assess that a bank has become high-risk, they expect higher interest rates or returns, or they reallocate their capital if the risk is too great. Market discipline is typically rapid and may sometimes be contrary to financial stability, if market participants cause the increased need for the revaluation of portfolios through their own responses. Official supervision can be more effective when eliminating problems at banking institutions, as a new financial equilibrium can be achieved with minor revaluations or the reallocation of capital through appropriate, gradual intervention. This also means reduced costs for market participants and taxpayers, who bear the cost for the exercise of any guarantee schemes. In any event, market information is useful for the early detection of changes at banks that could lead to financial difficulties. In contrast to supervisors' assessments, market assessments can forecast changes to the risk profile of banks, as they are based on current information, while the same investors' views are future-oriented. For this reason, it would be appropriate to supplement the assessments of official supervisors with those generated by the market. An additional advantage of market information would primarily be in the earlier identification of changes at banks that could lead to financial difficulties. In this way, the time required to identify problems at banks would be shortened, as financial investors would perceive these difficulties before they would

.
4 FINANCIAL STABILITY REVIEW, EXPERT PAPERS
be seen in financial statements or supervisory reports (Flannery, 1998). Response time (from the moment when problems are identified until measures are implemented to rectify the problems) would also be shortened, as official supervisors would base the need for supervision on market information and the responses of market participants. There is no need to emphasise that shorter recognition and response time would contribute significantly to lowering the costs of eliminating financial imbalances that could ultimately result in instability. With the described knowledge, supervisors are gradually beginning to use market methods to a much greater extent in their analytical tools. Analysis based on the use of market information is of particular interest to researchers, while supervisors were initially reserved regarding its use. A significant breakthrough in the disclosure of market information in the analysis of prudential operation was made with the new Basel Accord, which envisages that banks themselves must assess exposure to risk and the necessary capital derived from these assessments. Thus the door was open to improving official supervisory assessments of financial risks with market assessments, which are the result of market participants' own assessments. Market information is already used in early warning statistical models by countries with developed financial markets and a large number of banking institutions, which are attempting in this way to develop leading indicators of financial instability for individual institutions (Sahajwala and Bergh, 2000). Several empirical studies have gone significantly farther with regard to possibilities for the use of market information and market discipline to ensure prudential operation, with a number of them indicating that official supervisors could use market discipline leverage to a greater extent in the performance of their function.3 Market information is not a substitute for the assessments of supervisory authorities, but represents complementary information, whose usefulness lies in the early detection of changes at banks that could lead to financial problems. According to a number of authors, the valuations of market participants reflect currently available information and are future-oriented, and are thus complementary to the assessments of supervisors, which are based on past data. Based on this assertion, we can ask ourselves whether it is possible, based on market information, to develop leading indicators of financial stability that would impartially explain changes in the risks of credit institutions. Another question arises with regard to the previous question: does it make sense to use market information in financial environments where information from the market is relatively scarce or where we are dealing with poorly functioning markets? Based on a review of numerous articles, it is possible to indirectly answer the first question with the following findings:
1. In contrast to accounting data, market information is available at all times and also reflects the expectations of market participants and not just past facts.
2. A review of empirical studies indicates that market participants build every piece of relevant information into
prices, and make prudent (informed) decisions on that basis.
3. Stability indicators based on market information better reflect current changes in the risks of credit institutions compared with indicators derived solely on the basis of accounting data.
4. It is impossible to assert that market discipline (or market supervision) is more effective in rectifying the
financial problems of banks in difficulty. It is however possible to conclude that official supervisors could identify financial problems more rapidly and better substantiate the need for measures by using market information.
We may be able to shed some light on the answer to the second question with an empirical analysis based on data for domestic banks. We will attempt to determine, through the calculation of a selected indicator based on a combination of market and accounting data, whether the analysis gives an up-to-date reflection of changes in the risk profile of banks, and may therefore be used as a leading indicator in the analysis of financial stability. A distance-to-default indicator is used below, which indicates the distance, measured in standard deviations, of the current market value of assets from the point of default, where liabilities exceed assets. On the one hand, at the level of the individual bank this indicator encompasses the most important determinants of the default risk of the institution in question. On the other hand, we can speak of a financial stability indicator when it is applied at the aggregate level on account of the aforementioned properties. The Black-Scholes model for pricing options and corporate equity and debt (Black and Scholes, 1973) will be applied as a theoretical basis for assessing the selected indicator. The direct use of the calculated distance-to-default indicator from a time series of market prices of banks' shares is limited in the case of Slovenian banks, as only a small number of banks are (were) listed on the stock exchange. We can make use of share prices from the unregulated market or adjust the calculation of the indicator by using indirect market information. Indirect market information (e.g. changes in the stock market index, specialised indices or an individual share prices representative of a specific sector) supplements static accounting data and brings a market dynamic (volatility), which has a significant impact on banks' portfolios and thus their operating results. The increased volatility of banks' assets
3 Chan-Lau et al., 2004, Chan-Lau et al., 2006, Chan-Lau and Amadou, 2006a, Crosbie and Bohn, 2003, Gapen et al., 2004, Gropp et
al., 2002, Vassalou and Xing, 2004.

. .
FINANCIAL STABILITY REVIEW, EXPERT PAPERS 5
represents increased risk and, given outstanding liabilities to creditors, could result in changes in the amount of capital required to cover their exposure to risk. The changes described are also reflected in financial statements and regular reports sent to supervisory authorities, with a time delay. It is due to this time delay, however, that the measures taken by a supervisory authority could be too late. The nature of market information is that it is available at all times and future-oriented. By using market information, it is possible to build on accounting data for a past period, and thus arrive at higher quality information that is appropriate for analysing the risks of banking institutions. It should also be added that not all market information is of a high enough "quality" to bring added value to the official information reported to a bank supervisor. It is therefore necessary to (1) determine which market data is of a high enough quality and sufficiently up-to-date to be used in the risk assessment of banking institutions, and (2) determine whether it is possible to use the information in financial environments where market information is relatively scarce and/or where we are dealing with poorly functioning markets. 4 Theoretical background for the use of a model for the pricing of options in
the valuation of corporate equity and debt
The methodology for calculating the indicator derives from the Black-Scholes model for the pricing of options, which may also be used in the valuation of corporate equity and debt. The assumption when using this model to value equity is that the owners of a company possess a call option, the right to purchase all of the company's assets (in our case the investments of the bank), by repaying all liabilities to creditors. Following the repayment of all liabilities, holders of equity are the only parties entitled to the company's assets. The exercise price of such an option is equal to the value of all liabilities. The value of the equity is thus given by:
[ ]0,max OSK −= (1) where: K = equity S = the assets of the company or the investments of the bank, and O = liabilities Equity has a positive value only if the value of the assets exceeds the value of the liabilities. Otherwise, the owners would not exercise the option to purchase the assets, as they would have to pay more than the assets are worth. In such a case, the company's creditors would have a put option, as they would sell their claims on the company in exchange for the acquisition of all assets, thus minimising their loss. The value of the equity may be estimated in the same manner as the value of a call option, while the value of the company's debt is estimated in the same manner as the value of a put option. We will use a model for estimating the value of an option (Chan-Lau et al., 2004, Crosbie and Bohn, 2003, Gapen et al., 2004, Hull, 2006) to calculate the distance-to-default indicator. The basic assumption is that changes in a company's asset value follow the basic Wiener process, taking into account a long-term growth rate that is equal to the expected rate of return on the assets and the volatility of the rate of return or the asset value:
dzSdtSdS aaaa σμ += (2) where: Sa, dSa = asset value and change in asset value, μ, σa = expected rate of return and the volatility of the rate of return, dz = Wiener process (change). The above equation describes the change in the bank's asset (investment) value. From it, we may thus derive an equation that determines the asset value over time (t), if the current asset value, the expected rate of return and the volatility of the rate of return are known:4
εσσ
μ ttSS aa
ata +−+= )
2(lnln
2
(3)
ε represents the random component of rate of return which is assumed to be normally distributed with a mean of 0 and a standard deviation of 1, ε ≈ N(0,1). In the given circumstances, we may assume that the bank (or company) is insolvent, and thus in default, when the value of its assets is equal to or less than the value of its liabilities. It is thus possible to measure the creditworthiness of a bank 4 The equation may be developed with the help of Ito's auxiliary theorem from an equation that describes the change in asset value with
the help of the Wiener process (Hull, 2006, p 273).

.
6 FINANCIAL STABILITY REVIEW, EXPERT PAPERS
(or company) by the difference between the value of its assets and the value of its liabilities (the distance-to-default). The smaller the difference, the greater the probability of default is, and vice versa. The distance between the asset value over time "t" and the value of liabilities may be given as follows:
ta
aa
tta OttSOSd ln)
2(lnlnln
2
−+−+=−= εσσ
μ (4)
It is useful if we normalise the above expression by asset volatility, σa, where we arrive at a distance-to-default indicator, dd, or the vulnerability of the bank, that measures the number of standard deviations the bank is from insolvency or default (Crosbie and Bohn, 2003):
t
tOS
dda
at
ta
σ
σμ )
2()ln(
2
−+= (5)
According to several authors (e.g. Gropp et al., 2002, Chan-Lau et al., 2004, Gray et al., 2006), the distance-to-default indicator illustrated by the above formula is a complete and unbiased indicator of a bank's vulnerability or changes to its risk profile. This conclusion is based on the finding that this indicator captures the most important determinants of default risk: expectations regarding earnings or profitability, financial leverage and asset or investment risk. Expectations regarding an increase in profitability lower default risk and increase the value of the dd indicator. Similarly, a decline in financial leverage (a bank's indebtedness) increases the value of the indicator, as does a decrease in investment volatility. These processes work in the opposite direction to decrease the indicator's value, thus bringing the bank (company) closer to the point of default. Calculating the dd indicator requires data for the bank's asset (investment) value and asset volatility. Since this data is not available or is only available in longer time intervals, a direct calculation with the help of equation (5) is less appropriate for practical reasons. For this reason, the majority of previous studies have used an indirect approach, calculating the implicit value of assets and their volatility using a model developed by Black and Scholes (Black and Scholes, 1973). For this calculation, a series of market share prices and their volatility (standard deviation of the rate of return), market capitalisation, debt and a risk-free rate of return are required. Following the Black-Scholes model, we can estimate the value of equity as the value of the company's call option, where the exercise price is equal to the value of the debt, by using the following formula (Hull, 2006)5:
( ) ( )21 dNOedSNK rt−−= (6) where: N(d..) = cumulative normal distribution probability function,
t
trOS
da
a
σ
σ )2
()ln(2
1
++= (7)
tdd aσ−= 12 (8) r = risk-free rate of return, t = time to maturity. The link between equity volatility and asset volatility is given by the following formula:
( )1dNKS
ak σσ = (9)
5 The Black-Scholes-Merton model is derived under the assumption that changes in share prices follow the Wiener process (a stochastic
process of changes in share prices). For more information, see Hull, 2006, p 291.

. .
FINANCIAL STABILITY REVIEW, EXPERT PAPERS 7
Given that the market prices of banks' shares traded on regulated markets are continuously available, and that we also calculate volatility or the standard deviation of the rate of return on their basis, it is possible, through the use of the aforementioned variables, to solve the system of simultaneous equations (6) and (9) with an iterative method to arrive at an implicit value of assets and their standard deviation. The variables calculated in this manner are then used in equation (5) to calculate the dd indicator. As mentioned, the approach described above has been used in a number of previous studies. The same approach for calculating the distance-to-default indicator for an individual bank (ddb) will also be used in our example, where the calculation will be based solely on data for those five banks for which stock market share prices or a series of share prices from the unregulated market are available. Furthermore, we calculate the distance-to-default for three sectors (ddp) in the same manner using the share prices of several companies as sector representatives and through the use of sector accounting data and certain ratios derived from market parameters (e.g. the book value to market value of equity ratio). Those three sectors are trade, other services and manufacturing. Since the distance-to-default indicator estimated at the aggregate level may be interpreted as an indicator of financial stability, we will first estimate the aggregate dda for the group of five banks, based on the data for banks for which market share prices (from the stock market or unregulated market) are available. The drawback to this approach is that we only have data for a limited number of banks. Therefore an alternative approach, using indirect market information, will be used to calculate the dda indicator. To assess the suitability of the distance-to-default indicator as an indicator of financial stability, analysis must be carried out at the aggregate level based on the data for all banks. For the purpose of this paper, we will only present an illustrative calculation based on the first method. An alternative approach will be the subject of further studies and papers that will follow. 1. In the first method of calculating the distance-to-default time series at the aggregate level for the banking system, dda,
we calculate the indicator by taking into account a standard deviation of the weighted return of the share prices of the five banks, where the weights are determined based on an individual bank's proportion of the total equity of all five banks. Market capitalisation and debt are calculated as the sum of market capitalisations and debt of the individual banks in the group. However, since we are primarily interested in variability and we assume that the variability of market share prices calculated from available time series are representative of the assumed variability of share prices for the banking sector as a whole, we have selected an approach outlined below where the standard deviation is calculated as the root of the unweighted average variances of the return of individual banks' shares.
The indicator is calculated from time series of the market prices of the five banks. Market prices mean prices from the unregulated market provided by several brokerage houses and prices from the stock market for those banks whose share are listed. The market share of the banks included in the calculation is 52% in terms of the banking system's total assets, according to figures from the end of 2007. The volatility of prices, expressed as sigma, is calculated based on daily data, taking into account a moving period of one year. For periods when banks' shares were not traded on the unregulated market, prices are defined (generated) using the adjusted Wiener process (Hull, 2006). For each date where a price is not given, the calculated price is adjusted using the Wiener process by a specific portion of the deviation to the next known price. The distance-to-default indicator is calculated with a frequency of one month.
At first glance, the described approach may seem questionable, as it does not take into account covariance (interdependence) between individual banks. However, it should be emphasised that this is intentional, as we do not view the variability of prices in terms of the portfolio (parts that comprise the whole), but in terms of the independence of an individual bank under observation where prices may vary independently. In this way, we may "retain" variability at the aggregate level to the greatest extent, thereby explaining changes in the risks of banks at the aggregate level.
2. In the second method, we can calculate the distance-to-default time series for the group of five banks through the use
of price variability, which we calculate by using indirect market information and with the help of a variance-covariance matrix. To calculate the distance-to-default indicator we use a measure of volatility (sigma), which we calculate from the market price variability for three sectors with the help of representative companies whose shares are listed on the stock exchange, the variability of bond and share indices for the securities portfolio, and the variability of selected interest rates for other balance sheet categories. When calculating the financial stability indicator ddat at the aggregate level, σat is taken into account, and is calculated as follows:
∑ ∑∑=
≠==
+=n
i
n
jij
ijtjtit
n
iititat www
1 ;11
2 covvarσ
where: w..t, = proportions of individual sectors, and debt and non-debt securities, and other investments in the banking system's portfolio in a specific quarter,

.
8 FINANCIAL STABILITY REVIEW, EXPERT PAPERS
varit = variance of the return of the sectors (weighted variance of the return on the shares of companies from the sectors), bond and share indices, and selected interest rates, covijt = covariance of return. Similar to the first case, we also use daily data and calculate a time series of volatility (sigma σat), taking into account a moving period of one year. A time series calculated in this manner is then used to calculate the distance-to-default indicator at the aggregate level with a frequency of one month. The method described will be critical in determining whether the distance-to-default indicator (using indirect market information and the structure of banks' investments) is indicative of changes in the risks of credit institutions, given that direct share prices of individual banks are not available. 5 Results
Below, we present series of the distance-to-default indicator dda, calculated from data for the five banks for which we were able to obtain share prices from the stock market or unregulated market. For the group of five banks for which the aggregate dda is calculated, the return is calculated as the weighted return of individual banks' share prices, where the weights are determined based on each bank's proportion of the five banks' total equity. Market capitalisation is calculated as the sum of the market capitalisation of individual banks, while the standard deviation is calculated from daily data of the weighted return of the group of banks over a moving period of one year. We also performed a calculation using a fixed standard deviation of the weighted return of individual banks' share prices, based on data for the entire observation period. Alternatively, we also calculated the dda indicator by calculating the standard deviation of share price return as the unweighted average variance of share prices over a moving period of one year. Figure 1 illustrates the time series of the dda indicator calculated using weighted returns of share prices over a moving period of one year and a fixed standard deviation calculated from the weighted returns over the entire observation period.
Figure 1: Distance-to-default for Slovenian banks
2
3
4
5
6
7
8
9
10
1994
1995
1996
1997
1998
1999
2000
2001
2002
2003
2004
2005
2006
2007
3.80
3.85
3.90
3.95
4.00
4.05
4.10
4.15
4.20dda of 5 banks (moving sigma)dda of 5 banks (fixed sigma, right scale)
Source: Bank of Slovenia The dda, indicator of the group of five banks ranged from 2 to 7 throughout most of the observation period and was lower than the values calculated for large euro area banks, which ranged between 6 and 8.6 The aforementioned difference could be the result of differences between the average size of Slovenian banks and large euro area banks that are listed on stock exchanges. Smaller banks are typically less diversified geographically and in terms of products, and are thus more vulnerable. The dda, indicator rose well above the reference value in the period from 2003 to 2005 (shaded area in Figure 1) due to the fact that there is almost no data regarding the share prices of banks on the unregulated market for this period. As previously mentioned, we generated market prices for this period using parameters from the previous period with the assistance of the adjusted Wiener process in order to ensure continuous time series. As a result, the volatility of returns on prices is low, while banks achieve a high dda indicator value. The use of this indicator for analytical purposes during the shaded period is therefore questionable. The indicator reached its lowest (highest risk) value in 1997, when Slovenian banks' lending growth also reached its lowest level. In that year, year-on-year growth in lending uniquely fell below 10%. Other periods when a very low value for the indicator was recorded were at the end of 1994, in the second half of 2000 and the first half of 2001, and in the second half of 2006 and the beginning of 2007. Assuming that the shareholders of banks make informed decisions, the information content of market prices, which is reflected in changes to the dda indicator, should be confirmed by the
6 ECB Financial Stability Review, June 2005, p 91.

. .
FINANCIAL STABILITY REVIEW, EXPERT PAPERS 9
characteristics of banking operations or other (macroeconomic) factors that affect market sentiment. Future studies will be aimed at determining what the information content of the indicator studied is, and whether it may be used as an indicator of changes in the risks of credit institutions. This paper is limited to some basic characteristics of the dda series presented. Figure 1 also illustrates the estimated long-term trend of the indicator, which we arrive at by using the entire observation period to calculate the standard deviation, and not a moving period of one year. In this calculation, volatility or uncertainty is constant, and reflects the long-term average assessment of risks at banks by market participants. The long-term estimate of the indicator fluctuates at around 4, while marginal changes to the latter were primarily the result of a change in the overall debt of banks and a change in the risk-free rate of return. The only difference between the two calculations of dda in Figure 1 is the calculation of sigma, which in the first series is calculated for a moving period of one year, but is the same for the entire observation period in the second series (trend). A comparison indicates the period when the market assessed banks as higher-risk than the long-term average (dda fluctuates below the trend line) and conversely, periods when market participants assessed banks as lower-risk (dda fluctuates above the trend line). Excluding the period of high indicator value (shaded area) when there was insufficient data from the unregulated market regarding share prices, we can conclude that market participants assessed banks as higher-risk in the second half of 1996 and in1997. Somewhat surprising and counterintuitive is the low value of the indicator in the second half of 2006 and at the beginning of 2007. Since we are primarily interested in variability, we focus on a dda indicator below where the standard deviation is calculated as the root of the unweighted variances of return of individual banks' share prices. Figure 2 presents a comparison of the previously calculated dda indicator where the standard deviation for the group of five banks is calculated from the weighted return of individual banks' share prices, and an alternative approach where the standard deviation is calculated as the root of the unweighted average of variances of individual banks, using a moving period of one year in both cases. The upward deviation of the indicator in the shaded area, resulting from a lower standard deviation, is smaller in the alternative scenario, as we used the unweighted average of variances of individual banks' share prices to limit the impact of larger banks for which market share prices are not available. Nevertheless, we may assume that the estimated indicator in the shaded are is still overvalued.
Figure 2: Distance-to-default for Slovenian banks – comparison for different calculations of the aggregate standard deviation
0
2
4
6
8
10
12
14
16
18
20
22
1994
1995
1996
1997
1998
1999
2000
2001
2002
2003
2004
2005
2006
2007
dda of 5 banks (standard deviation of the weighted return)
dda of 5 banks (root of the unweighted average of the variances of banks)
Source: Bank of Slovenia More interesting than changes in the indicator's value over time is a comparison with changes in another banking performance indicator. The performance of banks may be closely correlated with lending growth rates. We wish to determine whether changes in the two indicators are correlated. Figure 3 illustrates the dynamics of the two indicators – lending growth rates and distance-to-default – during the observation period. If we once again exclude the shaded area when the dda indicator values are unreliable, we can conclude that the degree of correlation between the two indicators is positive and relatively high in the period from 1997 to 2002, while the correlation is considerably lower in other periods, and even negative for short intervals, which is counterintuitive. The shallowness and lack of transparency of the market in bank shares could be an important reason for questioning the reliability of prices and their use in assessing changes in the risks of banks from the market point of view. In other words, we may legitimately ask whether the market prices of bank shares, given low liquidity and irregular trading, provide any additional information content to the information that supervisory authorities have on the basis of reports and examinations of credit institutions. In order to answer that question, an appropriate statistical analysis, which will be the subject of a future study, must be carried out.

.
10 FINANCIAL STABILITY REVIEW, EXPERT PAPERS
Figure 3: Distance-to-default for Slovenian banks and lending growth
0
5
10
15
20
25
30
35
40
45
50
1994
1995
1996
1997
1998
1999
2000
2001
2002
2003
2004
2005
2006
2007
0
2
4
6
8
10
12Loans to non-banking sectorsdda of 5 banks (root of the unweighted average of the variances of banks, right scale)
Source: Bank of Slovenia Should it be proven that the market prices of bank shares are an unreliable basis for the calculation of a distance-to-default indicator, other available market information could be used for this purpose. In contrast to banks, considerably more companies are listed on the stock exchange. Trading is continuous, and we could assert that the market is more liquid than the fragmented and non-transparent unregulated market in bank shares. We assume that we could identify market sentiment, which reflects the quality of banks' portfolios and thus changes in the risks of banks, by using indirect market information that is closely linked to the structure of banks' portfolios. To that end, we selected 12 companies from three sectors, namely manufacturing, trade and other services. The ddp indicator for an individual sector was calculated via the weighted standard deviations of the return on shares of companies within the sector. Figure 4 illustrates the changes in the calculated indicators over the observation period. The correlation between the ddp indicators of individual sectors is remarkably high, although there are differences amongst them. The highest value of the indicator, with the largest distance to default, is recorded by manufacturing, while the indicators for trade and other services are at the same level. The lowest values of the ddp indicator were also recorded in 1997. More significant drops in the value of the indicator were recorded by individual sectors in 2002, 2003 and 2007. The drop in 2002 and 2003 may be explained by weak economic growth, which was above average in 2006 and 2007, and therefore in contrast to changes in the indicator in the same period. Confirmation of the link between changes in the indicators for banks and the indicators for sectors, taking into account the proportions of individual sectors in the structure of an individual bank's credit portfolio, would greatly encourage the further use of the dd indicator. The confirmation of this type of link (at least in periods for which prices are available) would mean the dd indicator for individual banks and the entire banking sector could be assessed via changes in the ddp for sectors, despite the shortage of bank listings and prices from the unregulated market. The ultimate aim is to test the hypothesis that distance-to-default is indicative of changes in the risks of credit institutions and the banking system, as it precedes accounting data and indicators that reflect the risks of banks such as capital adequacy, net interest margin, profitability, impairments and provisions of financial assets, and the z-score index (an alternative to the calculation of dd, based on accounting data). However it is important to be aware of the limitations in using such an approach, in particular due to external and other random effects on the increased volatility of share prices on a small, less liquid capital market.
Figure 4: Distance-to-default for three sectors
0123456789
101112131415
1997
1998
1999
2000
2001
2002
2003
2004
2005
2006
2007
Other servicesManufacturingTrade
Source: Bank of Slovenia

. .
FINANCIAL STABILITY REVIEW, EXPERT PAPERS 11
6 Conclusion
Confirmation (or rejection) of the hypothesis that distance-to-default (dda) is indicative of changes in the risks of the banking system, since it precedes accounting data that indicate similar changes with a delay, depends on the results of empirical testing. If the above hypothesis were proven, it would be possible to conclude that a supervisor has an effective indicator to help shorten the delay in recognising changes in the risks of credit institutions. On the other hand, market information could also limit supervisors' discretion and force them to take immediate measures. The opportunity for supervisory discretion is greater when using static information of a confidential nature received with a delay than when using market information that supervisors "share" with other market participants. The basic drawback of the method used is in the availability of market information, which is scarce in less developed financial systems. Findings indicate that prices from the unregulated market are less suitable, as they are not available continuously and with a high (daily) frequency. Furthermore, the results obtained in periods when primarily unregulated market prices were used are considerably poorer than in a period when data from the stock market is used. The results are either useless due to an insufficient amount of data (from 2003 to 2005), or the substantive conclusions drawn are counterintuitive (2006 to 2007). This serves as additional motivation to attempt to focus on the use of indirect market information (the prices of corporate shares listed on the stock exchange, the use of stock market indices and other market parameters) in future studies, and in this way include market sentiment, which should reflect the risks of credit institutions and thus the stability of banks, in the calculation of the indicator. Based on previous analyses, we can only intuitively conclude that calculated indicators only partly meet original expectations. With further empirical testing, we will attempt to determine whether by using indirect market information in an environment void of direct market information (market prices of bank shares) we can arrive at an indicator that is a more up-to-date reflection of changes in the risks of credit institutions than static accounting indicators, in order to prove our hypothesis. It should also be emphasised that our analysis focuses on the aggregate point of view. In contrast to a number of previous empirical studies that dealt with individual credit institutions and attempted to determine whether it is possible to make inferences regarding a possible change in the credit assessment of a bank under observation or even regarding the probability of default (bankruptcy), the approach described above is macro prudential approach. Here, the subject of interest is the entire banking sector, where the emphasis is not on studying the probability of events occurring (change in the credit rating of an institution or the onset of bankruptcy), but on perceiving changes in the risk indicator. The aforementioned approach derives from the balance sheet approach to analysing financial stability, which primarily uses late-arriving statistical data in its analysis. It is reasonable to expect that the use of market information, on account of its current relevance, would contribute to the higher-quality analysis of changes in the risks of credit institutions or the sector as whole. 7 General references
F. Black and M. Scholes: The Pricing of Options and Corporate Liabilities. Journal of Political Economy, Chicago, vol. 81 (1973), 3, pp 637 – 654.
J. Chan-Lau, A. Jobert and J. Kong: An Option-Based Approach to Bank Vulnerabilities in Emerging Markets. IMF
Working Paper, WP/04/33. Washington, D.C.: International Monetary Fund, 2004, 21 pages, 1 appendix J. Chan-Lau: Market-Based Estimation of Default Probabilities and Its Application to Financial Market Surveillance.
IMF Working Paper, WP/04/104. Washington, D.C.: International Monetary Fund, 2006, 17 pages J. Chan-Lau and A. Sy: Distance-to-Default in Banking: A Bridge Too Far? IMF Working Paper, WP/06/215.
Washington, D.C.: International Monetary Fund, 2006a, 17 pages A. Crockett: Market Discipline and Financial Stability. Financial Stability Review, London, June 2001, Bank of England,
2001, pp 166 – 173. P. Crosbie and J. Bohn: Modeling Default Risk. Moody's KMV Research, White Papers. [URL:
http://www.moodyskmv.com/research/files/wp/ModelingDefaultRisk.pdf], 18 December 2003. T. Curry, P. Elmer and G. Fissel: Using Market Information to Help Identify Distressed Institutions. A Regulatory
Perspective. FDIC Banking Review, Washington, D.C., Vol. 15 (2003), No. 3, 16 pages M. Flannery: Using Market Information in Prudential Bank Supervision: A Review of the U.S. Empirical Evidence.
Journal of Money, Credit and Banking, Vol. 30 (1998), 3, pp 273 – 305.

.
12 FINANCIAL STABILITY REVIEW, EXPERT PAPERS
M. Gapen et al.: The Contingent Claims Approach to Corporate Vulnerability Analysis: Estimating Default Risk and Economy-Wide Risk Transfer. IMF Working Paper, WP/04/121. Washington, D.C.: International Monetary Fund, 2004, 44 pages, 10 tables
D. Gray, R. Merton and Z. Bodie: A New Framework for Analyzing and Managing Macrofinancial Risks of An Economy.
NBER Working Paper Series No. 12637. Cambridge: National Bureau of Economic Research, 2006, 44 pages, 3 appendices
J. Gunther, M. Levonian and R. Moore: Can the Stock Market Tell Bank Supervisors Anything They Don't Already
Know? Economic and Financial Review. Dallas: Federal Reserve Bank of Dallas, Second Quarter 2001, pp 2- 9. J. Hull: Options, Futures, and Other Derivatives. Sixth Edition. New Jersey: Prentice Hall, 2005. 789 pages Financial Stability Review. Frankfurt: European Central Bank, June 2005. J. Krainer and J. Lopez: How Might Financial Market Information Be Used for Supervisory Purposes? FRBSF
Economic Review. San Francisco: Federal Reserve Bank of San Francisco, 2003a, pp 29 – 45. R. Sahajwala and P. Van den Bergh: Supervisory Risk Assessment and Early Warning Systems. Basel Committee on
Banking Supervision Working Papers, No. 4., December 2000. Basel: Bank for International Settlements, 53 pages, 5 appendices
M. Vassalou and Y. Xing: Default Risk and Equity Returns. The Journal of Finance, Vol. 59 (2004), 2, pp 831 – 868.

. .
FINANCIAL STABILITY REVIEW, EXPERT PAPERS 13
RETAIL CERTIFICATES – INVESTMENT PRODUCTS
Ana Gorišek and Miha Leber1
SUMMARY
Retail certificates are an increasingly important form of investment, and already constitute competition for saving in mutual funds. In the last two years they have established themselves also among Slovenian investors. There has been great interest in retail certificates tied to Slovenian shares, which Austrian banks began to issue, followed by Dutch, French and German banks. The issuing banks do not enter into any new risky positions by issuing retail certificates and can have a significant impact on the movement of prices and the volatility of individual local, low-liquidity capital markets. This has also proved to be the case on the Slovenian market at certain times. There are several types of retail certificate, which can be less or significantly more risky than direct investments in the instruments on which they are issued.
1 Miha Leber and Ana Gorišek are employees of the Bank of Slovenia.
.
14 FINANCIAL STABILITY REVIEW, EXPERT PAPERS
1 Introduction
Retail certificates are structured financial products, and are classed as derivatives. The amount of the claim that the investor holds against the issuer depends on the movement of the value of the underlying instrument on which the certificate is issued: individual shares, baskets of shares, indices, currencies, commodities. German banks were the first to start issuing them, but now they are also issued by other foreign banks with high credit ratings. In legal terms they are a debt instrument in which the investor holds a claim against the issuer. Coming in numerous forms, they offer both conservative and speculative investors a chance to invest money, and allow returns to be generated in various phases of the stock market cycle. However, retail certificates are complex financial instruments, whose prices do not necessarily depend solely on the movement of the price of the underlying instrument, and price formation can therefore be difficult for investors to understand (Deutsche Bank, 2007). Austrian, German and Dutch banks mostly began issuing certificates on Slovenian shares in 2006, but particularly intensified their activities in 2007. In addition to retail certificates on individual shares, they also issue certificates on the SBITOP index, a basket of shares from south-eastern and eastern Europe that includes Slovenian shares, and on indices including shares from stock markets in central, south-eastern and eastern Europe (SETX, CECE Banking, CECExt, CECE Healthcare, CECE Mid Cap, CECE Oil&gas, CECE Telecom, NTX). When issuing retail certificates the issuing banks do not enter into new risky positions, but hedge their positions by purchasing or selling the underlying instruments on which the certificates are issued. The issue of retail certificates can have a significant impact on individual local, low-liquidity capital markets, such as Slovenia’s. By issuing retail certificates on indices of markets in central, south-eastern and eastern Europe, issuers are also increasing the co-dependence of these capital markets. The impact of retail certificates on the Slovenian capital market, particularly prime market shares, increased notably in 2007. In the first eight months of the year foreign banks gave additional impetus to the rise in prices on the Ljubljana Stock Exchange by issuing long certificates and making net purchases of shares to hedge their positions. In the remainder of 2007 and early 2008, knock-outs and sales of shares held by banks to hedge their positions exacerbated the fall in prices, and brought increased volatility to the Slovenian capital market. Slovenian investors can invest in retail certificates via Slovenian brokerage houses and banks offering this service, or via internet trading platforms. The increased interest in retail certificates in Slovenia was also the result of the non-taxation of capital gains on derivatives.2 2 Basic features of the retail certificate market
Issuers usually structure retail certificates from a variety of financial instruments for the purpose of adjusting to the different risk profiles of investors, in terms of both return and risk attitudes. Here they are innovative, and when issuing new products respond rapidly to the conditions on global financial markets and commodities markets. In general issuers do not enter into new risky positions when issuing retail certificates, as they neutralise them by means of appropriate hedging via the purchase/sale of shares or purchase/sale of the relevant derivatives. Investors can subscribe to retail certificates during the subscription period when they are issued on the primary market, or purchase them later via the secondary market (on or outside the stock market). According to some estimates, only a small proportion of retail certificates (less than 10%) are subscribed at issue, while approximately half of the transactions are made via a regulated market. The rule is that in the case of subscription to retail certificates (purchase at issue), the issuer’s price includes the commission, which the issuer passes on (in full or in part) to its distribution partners. On the secondary market retail certificates are traded via market makers. It is generally the issuers that are also the market makers maintaining the bid/ask prices for retail certificates on the secondary market. The market makers thus provide for retail certificates to be traded at any time, simultaneously increasing liquidity. The spread between the bid and ask prices, which differs from trading platform to trading platform, and for different types of certificate, represents the cost to the investor paid to the market maker for the latter’s services (Deutsche Bank, 2007).3 The price of a particular retail certificate is determined on the basis of generally accepted financial pricing models, which determine the “correct” value of the certificate with regard to pricing important factors. Because it is customary for each issuer to use its own pricing models, the quoted prices for comparable products can vary from issuer to issuer. Competition between issuers (there are approximately 40 issuers with more than 30 issued retail certificates) should ensure the efficient use of pricing models, at least for the standardised certificates. The issuer’s price can include a premium over the “correct” value of the retail certificate for structuring costs, distribution costs and other administrative costs. 2 Capital gains on derivatives became taxable at 15. June 2008, when Law on tax on profit from disposal of derivatives came into force. 3 If trading is not executed at fair market conditions, the client can demand the cancellation of the transaction. Any deviation from fair
market prices is expected to occur primarily as a result of technical faults, or data entry errors by intermediaries. A website where an application to cancel a transaction can be completed if the trade was executed on a regulated market is http://www.euwax-ag.de/

. .
FINANCIAL STABILITY REVIEW, EXPERT PAPERS 15
Before marketing retail certificates the issuer releases a prospectus, subject to approval by the supervisory authority, which sets out the essential features and terms of the product. The prospectus gives details including the way in which the price of the certificate is calculated, the issuer’s costs, the terms of premature expiry or redemption and the method of repayment in such an event, and the way in which the purchase or sale of the certificate is settled. It should be noted that in the event of a hedging disruption event, the issuer retains the possibility of an issuer call, which in certain circumstances allows the premature cancellation of the security and the repayment of investors. Under ABN Amro’s general terms, a hedging disruption event is any event when on practical grounds it is no longer reasonable, or for any reason it has become ineffective, for issuers to establish, replace or maintain the relevant transactions for hedging their own positions. In defining such events issuers are left considerable room to manoeuvre (ABN Amro Launch Pad Programme, No. 3978, 2007).
Comparison with mutual funds
From a legal point of view, retail certificates are debt instruments that entail a risk to the issuer, while investment funds are an asset separate from the manager. By choosing the right retail certificates investors can pursue their own investment strategies, while in mutual fund investments the fund manager chooses the investments in keeping with the mutual fund’s investment policy and available assets. There are significant differences in the calculation of the price of a particular instrument. The valuation of retail certificates is significantly more complicated, and is based on option valuation models. Retail certificate issuers do not charge management fees, as is the case for mutual funds. Under current Slovenian legislation, capital gains on investments in mutual funds are taxed (initially at a rate of 20%, diminishing by 5 percentage points every five years), while gains on investments in retail certificates became taxable at 15.June 2008 (if the holding period is shorter than 1 year the tax rate is 40% and after 1 year the tax treatment of capital gains on derivatives equalizes with investments in mutual funds). .
Legislation affecting retail certificates
For the moment, in Europe there is no special legislative framework (directive) to standardise the regulation of the functioning of retail certificates, as there is for mutual funds (the UCITS Directive). To a certain extent, retail certificates (issue, trading, other operations) are regulated indirectly, via a variety of other legislative frameworks (Deutsche Bank, 2007): (1) Directive (2003/71/EC) on the prospectus to be published when securities are offered to the public or admitted to trading: this was transposed into Slovenian law by the Market in Financial Instruments Act (the ZTFI; Official Gazette of the Republic of Slovenia, Nos. 67/2007 and 100/2007 [correction]). Prospectus legislation provides for a single European passport for issuers. A security prospectus approved by a competent supervisory authority in one of the member-states is recognised in all other member-states. (2) Legislation setting out rules for the trading and distribution of securities (MiFID, Directive 2004/39/EC): this was also transposed into Slovenian law by the ZTFI. (3) Trading on the regulated securities market is also partly regulated by the MiFID, or the ZTFI in Slovenia. The rules applying to organised trading should also mostly be applied to the trading of retail certificates outside the regulated market, as issuers cannot afford to offer worse trading terms via other platforms than those applying on the regulated market. (4) In December 2006 members of the Derivate Forum in Germany adopted minimum standards for the issue of retail certificates aimed at building investors’ trust in the certificates market (German: Derivate Kodex). This is a voluntary commitment by forum members, who account for 60% of all issued retail certificates in value terms according to some estimates. In May 2007 the European Commission published a green paper on retail financial services in the single market, which also touched on retail certificates. The basic purpose of the green paper was to examine the difficulties faced by consumers in the financial services market. In May 2007 the ECOFIN Council proposed to the European Commission that it reviews the consistency of EU legislation relating to the different types of retail investment product (such as life insurance with investment risk, investment funds, certain structured products and retail certificates) to provide for a coherent approach to the protection of investors, and to avoid ambiguities in connection with the selling possibilities for these products. 3 Types of retail certificate
Retail certificates are divided into two groups with regard to the use of leverage and knock-out barrier:4 investment certificates and knock-out certificates.
4 A knock-out certificate expires prematurely if the value of the underlying instrument reaches the knock-out barrier.

.
16 FINANCIAL STABILITY REVIEW, EXPERT PAPERS
3.1 Investment certificates
Investment certificates do not generally contain a knock-out barrier or leverage, and consequently are less risky and more suited to long-term investments than knock-out certificates.5 There are numerous forms and variants of investment certificate, which are suited to different investor profiles and expectations, and can be more or less risky than investments in the underlying instrument. We will merely limit ourselves to the four forms of investment certificate issued on Slovenian shares or indices including Slovenian shares. Index certificates are the simplest form of investment certificate, their value proportionately following the movement of the value of the underlying instrument. They are issued on individual financial instruments, indices or baskets of financial instruments. Guaranteed certificates are the safest form of investment certificate, and guarantee investors a minimum payment at maturity, usually 100% of the value at issue; some forms also guarantee a portion of interest. The participation in the increasing value of the underlying instrument is usually below-proportional, because of the guarantee. Discount certificates allow investors to purchase the underlying instrument at a discount, i.e. at a price lower than the current price of the underlying instrument. Investors are limited in the maximum return that they can generate. The loss that the investor can suffer is thus less than with direct investment in the underlying instrument. Alongside uncapped returns for investors, bonus certificates also guarantee a certain payment at maturity, if the value of the underlying instrument does not reach a lower safety limit (German: Sicherheitsschwelle) by maturity. In this event bonus certificates de facto become index certificates (Scoach, 2007).
3.2 Knock-out certificates
For investors in knock-out certificates, the action of leverage allows above-proportional returns to be achieved, but also above-proportional losses, which can lead to the loss of all the money invested. These retail certificates can expire prematurely, if the value of the underlying instrument reaches the knock-out barrier (knock-out of a certificate). They can gain in value in the event of both rising prices (long certificates) and falling prices (short certificates) for the underlying instruments. Investors usually use them to generate gains on the basis of short-to-medium-term movements in the prices of the underlying instruments, and only rarely hold them to maturity. Knock-out certificates differ with regard to whether they contain protection against the loss of the entire asset (a stop-loss barrier), and with regard to maturity (defined maturity, open-end). 1. Knock-out certificates without stop-loss barrier: The knock-out barrier is equal to the basis price of the underlying instrument, which means that all the money invested can be lost.
• With defined maturity: the financing costs are reflected in the price of the instrument (a premium on long certificates, a discount on short certificates).
• Open-end: the issuer adjusts the basis price and the knock-out barrier in line with the financing costs at predetermined intervals.
2. Knock-out certificates with a stop-loss barrier: The knock-out barrier differs from the basis price of the underlying instrument, which means that the loss of all money invested cannot occur.
• With defined maturity: the financing costs are reflected in the price of the instrument as premiums (long certificates) or discounts (short certificates).
• Open-end: the issuer adjusts the basis price and the knock-out barrier in line with the financing costs at predetermined intervals (Zertifikate Forum Austria, 2007; Scoach, 2007).
The issuer sets the certificate’s basis price and knock-out barrier at issue; these remain unchanged on certificates with defined maturity, but are changed in line with the financing costs on open-end certificates. In the sale of long knock-out certificates the issuer buys the corresponding underlying instrument to which the certificate is tied. The purchase of the underlying instrument up to the amount of the basis price is financed by the issuer, as a result of which this type of certificate involves leverage. The investor only pays the difference between the current price of the underlying instrument and the basis price, which is the same as the intrinsic value of the certificate. The issuer charges the investor the financing costs for the invested capital. The leverage effect means that the issuer must invest significantly more capital than it obtains from the investor to hedge its position. The size of the leverage depends on the difference
5 Certain special forms of investment certificates, e.g. outperformance certificates, also contain leverage.
. .
FINANCIAL STABILITY REVIEW, EXPERT PAPERS 17
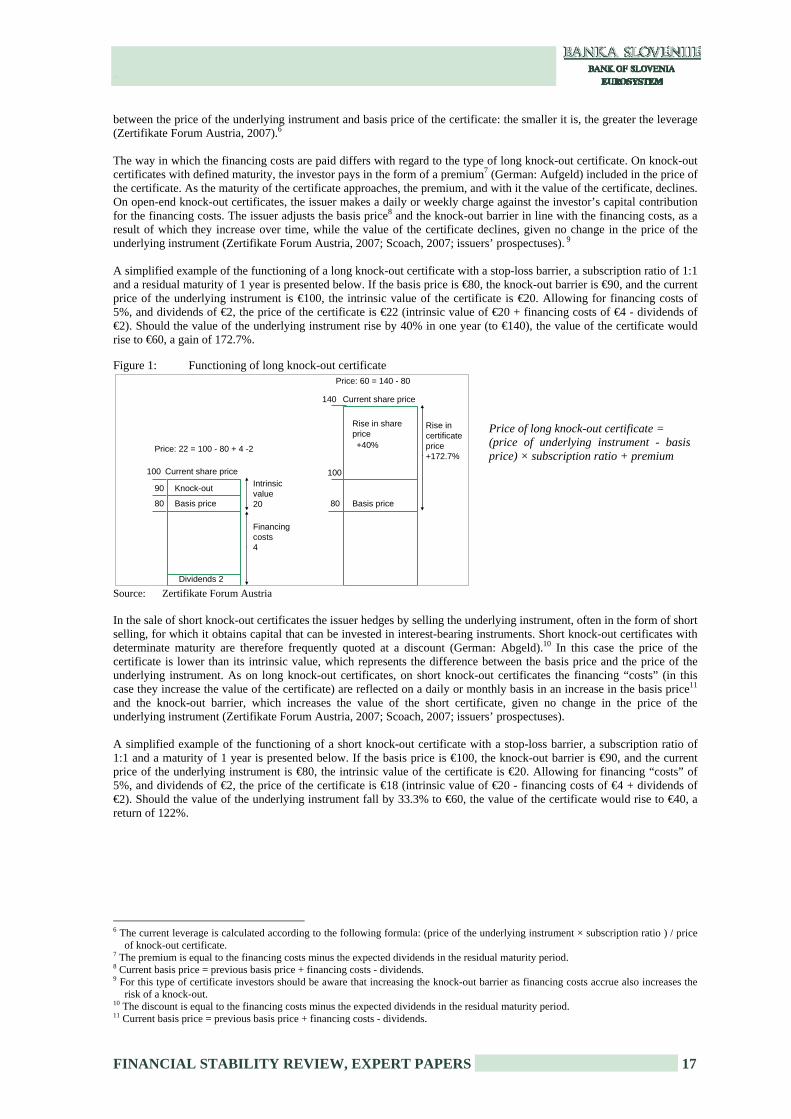
between the price of the underlying instrument and basis price of the certificate: the smaller it is, the greater the leverage (Zertifikate Forum Austria, 2007).6 The way in which the financing costs are paid differs with regard to the type of long knock-out certificate. On knock-out certificates with defined maturity, the investor pays in the form of a premium7 (German: Aufgeld) included in the price of the certificate. As the maturity of the certificate approaches, the premium, and with it the value of the certificate, declines. On open-end knock-out certificates, the issuer makes a daily or weekly charge against the investor’s capital contribution for the financing costs. The issuer adjusts the basis price8 and the knock-out barrier in line with the financing costs, as a result of which they increase over time, while the value of the certificate declines, given no change in the price of the underlying instrument (Zertifikate Forum Austria, 2007; Scoach, 2007; issuers’ prospectuses). 9 A simplified example of the functioning of a long knock-out certificate with a stop-loss barrier, a subscription ratio of 1:1 and a residual maturity of 1 year is presented below. If the basis price is €80, the knock-out barrier is €90, and the current price of the underlying instrument is €100, the intrinsic value of the certificate is €20. Allowing for financing costs of 5%, and dividends of €2, the price of the certificate is €22 (intrinsic value of €20 + financing costs of €4 - dividends of €2). Should the value of the underlying instrument rise by 40% in one year (to €140), the value of the certificate would rise to €60, a gain of 172.7%.
Figure 1: Functioning of long knock-out certificate
Current share price
Rise in share price+40%
Basis price Basis price
Knock-out 90
80
Dividends 2
80
140
Price: 22 = 100 - 80 + 4 -2
Intrinsic value20
Financing costs4
Rise in certificate price+172.7%
Current share price
Price: 60 = 140 - 80
100 100
Source: Zertifikate Forum Austria In the sale of short knock-out certificates the issuer hedges by selling the underlying instrument, often in the form of short selling, for which it obtains capital that can be invested in interest-bearing instruments. Short knock-out certificates with determinate maturity are therefore frequently quoted at a discount (German: Abgeld).10 In this case the price of the certificate is lower than its intrinsic value, which represents the difference between the basis price and the price of the underlying instrument. As on long knock-out certificates, on short knock-out certificates the financing “costs” (in this case they increase the value of the certificate) are reflected on a daily or monthly basis in an increase in the basis price11 and the knock-out barrier, which increases the value of the short certificate, given no change in the price of the underlying instrument (Zertifikate Forum Austria, 2007; Scoach, 2007; issuers’ prospectuses). A simplified example of the functioning of a short knock-out certificate with a stop-loss barrier, a subscription ratio of 1:1 and a maturity of 1 year is presented below. If the basis price is €100, the knock-out barrier is €90, and the current price of the underlying instrument is €80, the intrinsic value of the certificate is €20. Allowing for financing “costs” of 5%, and dividends of €2, the price of the certificate is €18 (intrinsic value of €20 - financing costs of €4 + dividends of €2). Should the value of the underlying instrument fall by 33.3% to €60, the value of the certificate would rise to €40, a return of 122%.
6 The current leverage is calculated according to the following formula: (price of the underlying instrument × subscription ratio ) / price
of knock-out certificate. 7 The premium is equal to the financing costs minus the expected dividends in the residual maturity period. 8 Current basis price = previous basis price + financing costs - dividends. 9 For this type of certificate investors should be aware that increasing the knock-out barrier as financing costs accrue also increases the
risk of a knock-out. 10 The discount is equal to the financing costs minus the expected dividends in the residual maturity period. 11 Current basis price = previous basis price + financing costs - dividends.
Price of long knock-out certificate = (price of underlying instrument - basis price) × subscription ratio + premium

.
18 FINANCIAL STABILITY REVIEW, EXPERT PAPERS
Figure 2: Functioning of short knock-out certificate
Current share priceFall in share price -25%
Basis price Basis price
Knock-out 90
80
60
100
Price: 18 = 100 - 80 - 4 + 2
Intrinsic value20
Rise in certificate price+122%
Current share price
Price: 40 = 100 - 60
100
Financing "costs"4
Dividends -2 Source: own illustrations In the event of the knock-out of a knock-out certificate with a stop-loss barrier, the investor is paid the current value of the certificate, which is calculated on the basis of the average stop-loss price12 of the underlying instrument. The issuer’s costs are deducted from the payout. Certificates without a stop-loss barrier are worthless at knock-out. The issuer redeems them at 0.1 cents for reason of tax optimisation on capital gains (Deutsche Bank, 2007). 4 Advantages and risks of retail certificates
Retail certificates offer a number of advantages compared with other investment opportunities, but also expose investors to numerous new risks. Just a few of these are examined below (Deutsche Bank, 2007).
The advantages of investing in retail certificates are:
(1) They allow small investors a wide spectrum of investment strategies. (2) They grant investors access at relatively low cost to more exotic capital markets that would otherwise be inaccessible, and more complex financial products, and make it simple to invest in commodities. (3) They allow the risk/return trade-off in the portfolio to be optimised. Lower risk exposure can be achieved by investing in certain types of retail certificate than by making direct investments. (4) At subscription ratios of less than one (usually 0.01 to 0.1), they allow small investors to invest indirectly in shares quoted at high prices. (5) Extended trading hours are possible, including hours when exchanges are closed, as trading can proceed via special electronic trading platforms. (6) Market makers ensure higher liquidity in retail certificates trading. (7) The use of leverage allows high returns to be generated.
The risks of investing in retail certificates are:
(1) By investing in retail certificates investors are exposed to risk in the form of the issuer’s creditworthiness. In legal terms retail certificates are debt instruments, and the investors therefore assume the issuer’s credit risk. Given the high credit ratings of the issuing banks, the actual risk of an issuer default is low. (2) When investing in retail certificates investors must be mindful of the bid/ask spread, which can be high for knock-out certificates and certificates on low-liquidity shares.13 The issuer has the possibility of altering the bid/ask spread in the price of the certificate, although this should not happen without reason, because of competition on the market.14 (3) The pricing of some retail certificates is relatively complex, as it is based on understanding the functioning of the option market. Retail certificates are aimed primarily at small investors, who do not necessarily have any experience of derivatives. Retail certificates can end up being purchased by investors who do not understand their functioning or are not aware of all the risks. 12 The average stop-loss price is the average value at which the issuer sells the underlying instrument on which the certificate is issued at
knock-out. The issuer must sell securities that it holds for the purpose of hedging its positions within a reasonable period of the knock-out occurring. How long is deemed reasonable is at the issuer’s discretion, and also depends on the liquidity of the underlying instrument, but it should be no longer than 3 hours. Should a knock-out occur less than 3 hours before the close of trading on the market in the underlying instrument, this period is extended into the following trading day (ABN Amro prospectus: LaunchPAD Programme, Offering Supplement No. 3978, 16 August 2007).
13 For retail certificates on Slovenian shares, the spreads are lowest on discount and index certificates (usually less than 1%, or up to 2%), but are higher on knock-out certificates, even exceeding 10% in extreme cases.
14 The minimum and maximum spread is stated in ABN Amro’s retail certificate prospectuses.
Price of short knock-out certificate = (basis price - price of underlying instrument) × subscription ratio - discount
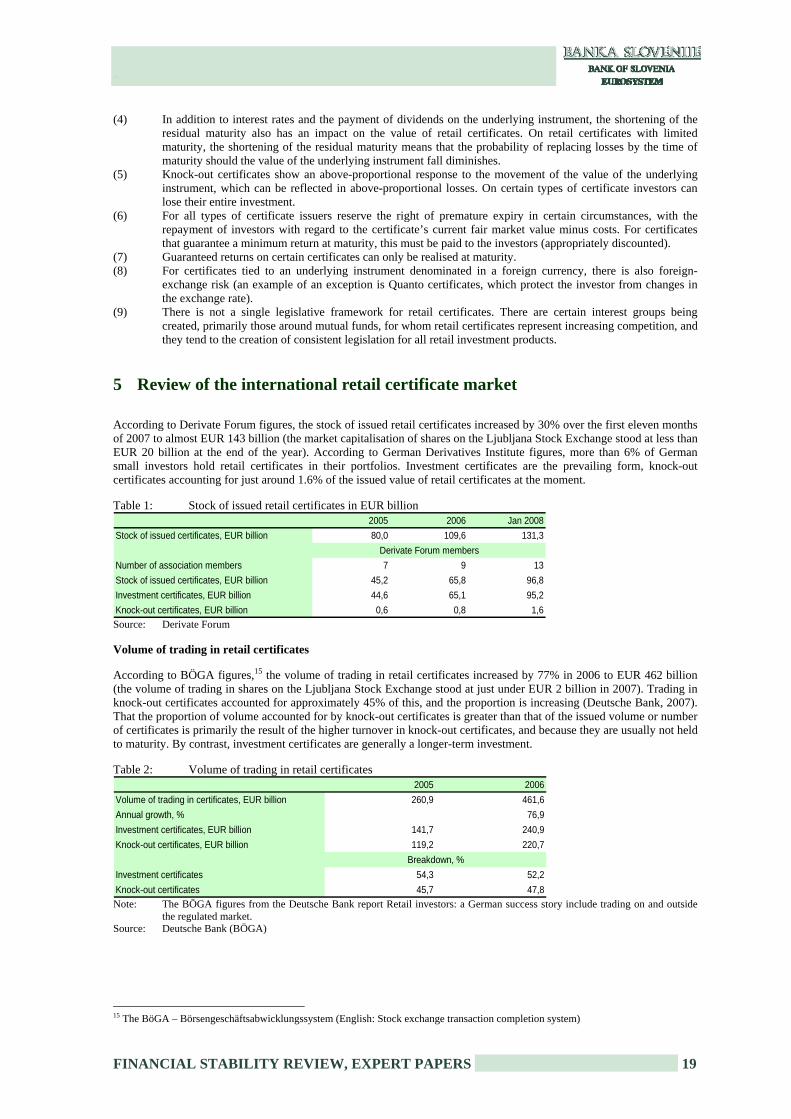
. .
FINANCIAL STABILITY REVIEW, EXPERT PAPERS 19
(4) In addition to interest rates and the payment of dividends on the underlying instrument, the shortening of the residual maturity also has an impact on the value of retail certificates. On retail certificates with limited maturity, the shortening of the residual maturity means that the probability of replacing losses by the time of maturity should the value of the underlying instrument fall diminishes. (5) Knock-out certificates show an above-proportional response to the movement of the value of the underlying instrument, which can be reflected in above-proportional losses. On certain types of certificate investors can lose their entire investment. (6) For all types of certificate issuers reserve the right of premature expiry in certain circumstances, with the repayment of investors with regard to the certificate’s current fair market value minus costs. For certificates that guarantee a minimum return at maturity, this must be paid to the investors (appropriately discounted). (7) Guaranteed returns on certain certificates can only be realised at maturity. (8) For certificates tied to an underlying instrument denominated in a foreign currency, there is also foreign- exchange risk (an example of an exception is Quanto certificates, which protect the investor from changes in the exchange rate). (9) There is not a single legislative framework for retail certificates. There are certain interest groups being created, primarily those around mutual funds, for whom retail certificates represent increasing competition, and they tend to the creation of consistent legislation for all retail investment products. 5 Review of the international retail certificate market
According to Derivate Forum figures, the stock of issued retail certificates increased by 30% over the first eleven months of 2007 to almost EUR 143 billion (the market capitalisation of shares on the Ljubljana Stock Exchange stood at less than EUR 20 billion at the end of the year). According to German Derivatives Institute figures, more than 6% of German small investors hold retail certificates in their portfolios. Investment certificates are the prevailing form, knock-out certificates accounting for just around 1.6% of the issued value of retail certificates at the moment.
Table 1: Stock of issued retail certificates in EUR billion 2005 2006 Jan 2008
Stock of issued certificates, EUR billion 80,0 109,6 131,3
Number of association members 7 9 13Stock of issued certificates, EUR billion 45,2 65,8 96,8Investment certificates, EUR billion 44,6 65,1 95,2Knock-out certificates, EUR billion 0,6 0,8 1,6
Derivate Forum members
Source: Derivate Forum
Volume of trading in retail certificates
According to BÖGA figures,15 the volume of trading in retail certificates increased by 77% in 2006 to EUR 462 billion (the volume of trading in shares on the Ljubljana Stock Exchange stood at just under EUR 2 billion in 2007). Trading in knock-out certificates accounted for approximately 45% of this, and the proportion is increasing (Deutsche Bank, 2007). That the proportion of volume accounted for by knock-out certificates is greater than that of the issued volume or number of certificates is primarily the result of the higher turnover in knock-out certificates, and because they are usually not held to maturity. By contrast, investment certificates are generally a longer-term investment.
Table 2: Volume of trading in retail certificates 2005 2006
Volume of trading in certificates, EUR billion 260,9 461,6Annual growth, % 76,9Investment certificates, EUR billion 141,7 240,9Knock-out certificates, EUR billion 119,2 220,7
Investment certificates 54,3 52,2Knock-out certificates 45,7 47,8
Breakdown, %
Note: The BÖGA figures from the Deutsche Bank report Retail investors: a German success story include trading on and outside
the regulated market. Source: Deutsche Bank (BÖGA)
15 The BöGA – Börsengeschäftsabwicklungssystem (English: Stock exchange transaction completion system)

.
20 FINANCIAL STABILITY REVIEW, EXPERT PAPERS
Number of retail certificates issued
More than 150,000 retail certificates have been issued (as at September 2007), on approximately 20,500 different underlying instruments. Index certificates (almost 40% of the total number) and bonus certificates (27%) are the prevalent forms, followed by knock-out certificates (approximately 22%).
Table 3: Number of retail certificates issued by the top five issuers, mid-January 2008 Market share, %
Issuer Investment Knock-out Total (total)1 Commerzbank AG 24.530 4.223 28.985 15,92 BNP Paribas 17.011 6.729 23.746 13,03 Sal. Oppenheim jr. & Cie. 16.916 1.834 18.785 10,34 Deutsche Bank 11.915 3.978 16.065 8,85 UBS Investment Bank 12.599 99 12.899 7,1
Others 57.507 22.030 81.491 44,8Total (72 issuers) 140.478 38.893 181.971 100,0
Type of certificate
Note: ABN Amro, Erste Bank, Raiffeisen Centrobank, Societe Generale and Hypovereinsbank have more retail certificates issued
on Slovenian shares. Source: http://www.zertifikateweb.de/emittent/ 6 Investments in retail certificates by Slovenian households
At approximately EUR 45 million, derivatives accounted for barely 0.1% of Slovenian households’ financial assets at the end of 2007, but the value has increased sharply in recent years. Foreign issuers account for more than 90% of derivatives. Derivatives already account for approximately 4.7% of household investments in foreign currency securities (compared with just 2.3% at the end of 2006).16 The increased interest in derivatives was also the result of the non-taxation of capital gains on derivatives in the past. Slovenian investors can invest in retail certificates via Slovenian brokerage houses and banks providing this service, or via internet trading platforms.
Table 4: Household investments in foreign derivatives: rights (warrants) and options 2004 2005 2006 2007
Total investments in the rest of the world, EUR million 125,3 340,8 654,7 950,2shares 104,3 321,5 626,1 886,8bonds 20,5 11,6 8,8 16,3other 0,5 7,8 19,7 47,0
Selected derivatives, EUR million1 0,1 2,9 15,2 44,9Breakdown by country, % 0,1 2,6 14,9 41,8
Austria 4,9 44,2 52,4Germany 88,0 59,3 33,5 38,1Netherlands 12,0 35,7 22,4 9,5
Breakdown by issuer, % 0,1 2,6 14,9 41,8Erste Bank 0,9 20,2 21,7Raiffeisen Centrobank 4,7 24,7 38,2ABN Amro 14,4 61,4 41,1 16,9others 85,6 32,9 13,9 23,2
Note: 1 Securities selected by CFI code: RW (rights, warrants), OC (call options), OP (put options) Source: Bank of Slovenia Austrian (Erste Bank, Raiffeisen Centrobank), Dutch (ABN Amro), German (Deutsche Bank, Commerzbank) and French (Societe Generale) banks prevail among the issuers of derivatives held by Slovenian households in their portfolios. Almost 40% of the derivatives are retail certificates tied to Slovenian shares and indices, with higher-risk knock-out certificates prevalent among them.17 This is further evidence that Slovenian households opting to invest in capital markets are extremely risk-inclined. Prevalent among the retail certificates tied to Slovenian shares in 2007 were those tracking Krka shares (64% of the total), while those tracking various indices and baskets including Slovenian shares (8%), the SBITOP index (7%) and shares in Pivovarna Laško (6%) also accounted for significant proportions of the total.
16 Includes only foreign investments of households made via investment brokers (brokerage houses and banks). Household investments
in retail certificates bypassing domestic investment brokers and made directly through various trading platforms are not included. 17 It should be noted here that not all retail certificates on Slovenian shares are included, since no official list of certificates issued on
Slovenian shares is available. The list was created based on different websites, primarily the Stuttgart Stock Exchange. It is anticipated that other derivatives held by Slovenian households primarily include other retail certificates not tied to Slovenian shares, CFDs and warrants.

. .
FINANCIAL STABILITY REVIEW, EXPERT PAPERS 21
Table 5: Residents’ investments in retail certificates issued on Slovenian shares and on indices and baskets including Slovenian shares
2005 2006 2007Value, EUR million 0,1 5,6 17,6Breakdown by issuer, %1 100,0 100,0 99,9
Raiffeisen Centrobank (AUT) 97,0 93,7 37,1Erste Bank (AUT) 3,0 6,3 30,3ABN Amro (NLD) 17,6Societe Generale (FRA) 14,9
Breakdown by underlying instrument, %2 100,0 58,0 84,5Krka 21,1 63,6Central European indices/baskets 100,0 22,6 8,2SBITOP 13,8 6,7Pivovarna Laško 0,4 5,9
Proportion held by households, %3 100,0 80,8 89,7Proportion of knock-out certificates, %4 0,0 63,9 86,4 Notes: 1 The issuers of retail certificates tied to Slovenian shares also include Hypovereinsbank. 2 Retail certificates tied to shares in Gorenje, Petrol, Luka Koper, Telekom Slovenije, Mercator, Merkur and Intereuropa are
also significant. 3 Corporates and financial institutions own a minor proportion. 4 Index certificates and guaranteed certificates are prominent among the other types of retail certificate. Sources: Bank of Slovenia, Stuttgart Stock Exchange, other retail certificate websites Residents’ volume of trading in retail certificates As the value of investments increases, the volume of trading by Slovenian households in derivatives is also increasing, and reached almost EUR 200 million in 2007, more than three times the figure in 2006. Retail certificates tied to Slovenian shares accounted for just under one-third of this. Knock-out certificates accounted for more than 95% of residents’ volume of trading in retail certificates on Slovenian shares, primarily those tied to Krka shares.
Table 6: Households’ volume of trading in foreign derivatives EUR million Sales Purchases Net purchases Volume2003 1,0 1,0 -0,1 2,02004 1,1 1,4 0,3 2,52005 3,7 6,1 2,4 9,82006 24,1 36,8 12,8 60,92007 85,8 110,5 24,7 196,3 Note: Securities selected by CFI code: RW (rights, warrants), OC (call options), OP (put options) Source: Bank of Slovenia Given the high gains realised by investors in retail certificates (including those issued on Slovenian shares), which were before 15.7.2008 not subject to taxation under Slovenian legislation, investment in derivatives were expected to increase further. However, the recent introduction of 40% tax rate on capital gains from derivatives, if holding period is shorter than 1 year, decreased the retail investors' incentive for buying derivatives.To date two banks (Volksbank and Reiffeisen bank) are directly marketing retail certificates in Slovenia, but additional direct marketing in Slovenia can be expected, particularly from banks whose parent banks are retail certificate issuers. To date four guaranteed certificates have been offered to investors in Slovenia, Volksbank Garant TOP, Volksbank Garant TOP 20 II, Agrar Garant and CECxt Winner, along with one index certificate tied to the SBITOP.
Table 7: Residents’ volume of trading in retail certificates issued on Slovenian shares % unless stated Sales Purchases Net purchases Volume2005, EUR million 0,02 0,14 0,12 0,162006, EUR million 0,60 5,97 5,37 6,57
Krka 25,6 22,4 22,0 22,7Central European indices/baskets 2,9 20,0 21,9 18,5Gorenje 24,5 11,9 10,5 13,1SBITOP 0,6 12,8 14,1 11,7
2007, EUR million 28,41 31,67 3,26 60,08Krka 45,3 52,2 111,7 48,9Telekom Slovenije 8,7 10,8 28,9 9,8Pivovarna Laško 10,4 7,8 -14,5 9,0Mercator 7,8 6,1 -9,2 6,9
Note: Other important retail certificate underlying instruments include shares in Petrol, Gorenje, Luka Koper, Merkur, Istrabenz and Intereuropa.
Sources: Bank of Slovenia, Stuttgart Stock Exchange, other retail certificate websites

.
22 FINANCIAL STABILITY REVIEW, EXPERT PAPERS
7 Impact of the issue of retail certificates on the Slovenian capital market
The issue of retail certificates can have a significant impact on the movement of prices and the volatility of individual local capital markets, particularly shallow, low-liquidity markets such as Slovenia’s. The issuing banks primarily hedge by purchasing or selling the underlying instruments on which the retail certificates are issued, and can thus have an impact on the movement of their prices. In the case of retail certificates issued on Slovenian shares, this impact is clear from the volume of trading in these shares made by the issuing banks, and the proportion of the total market capitalisation of the individual shares that they account for. Banks issuing retail certificates on Slovenian shares accounted for 14.8% of the volume in prime market shares in 2006, and for 24.6% in 2007.18 In the first eight months of 2007, their net purchases of shares further increased the rise in prices on the Ljubljana Stock Exchange. In the remainder of 2007, October and November in particular, and in early 2008, the issue of short knock-out certificates, the ordinary maturity and, above all, the knock-outs of retail certificates, and the consequent sale of the shares held by the issuing banks to hedge their positions, brought increased volatility to the Slovenian capital market, and added momentum to the fall in prices. Net purchases by retail certificate issuing banks were negative in the final three months of 2007 and in early 2008. According to available figures, there were 5 retail certificates issued on Slovenian shares or indices including Slovenian shares reached knock-out barierr in September 2007, 7 in October, and 25 in November. The number of certificates issued on Slovenian shares and indices including Slovenian shares that reached knock-out barrier increased further in 2008. There were 23 knock-out certificates reaching knock-out barrier in January, 10 in February, 26 in March and 29 in the first half of April.19 The premature expiries of knock-out certificates during the period studied added significant momentum to the short-term falls in share prices on the Ljubljana Stock Exchange.
Figure 3: Net purchases and volume of trading in prime market shares by banks issuing retail certificates on Slovenian shares and indices20
-25%
-15%
-5%
5%
15%
25%
35%
45%
-25
-15
-5
5
15
25
35
45
2006 2007
Net purchases of prime market shares by certificate issuers, EUR million (right scale)Proportion of total volume excluding block trades (left scale)Monthly growth in SBITOP (left scale)
Sources: Bank of Slovenia, Ljubljana Stock Exchange The impact of retail certificate issuing banks is also clear from the proportion of total market capitalisation in individual shares that they account for. These proportions rose over the first three quarters of 2007, before beginning to fall over the end of the third quarter, in the final quarter of 2007 and in 2008 as a result of knock-outs of retail certificates, the ordinary maturity of retail certificates, and issue of short knock-out certificates. Although the proportions accounted for by retail certificate issuing banks are relatively low, given the low turnover ratios of prime market shares, these foreign banks can have a significant impact on the short-term movement of prices, particularly in the sense of reinforcing price falls.
18 Proportion of total volume in the shares, excluding block trades, accounted for by issuing banks. 19 Source: Stuttgart Stock Exchange. 20 Includes shares in Gorenje, Intereuropa, Krka, Mercator, Merkur, Petrol and Telekom Slovenije. Does not include Droga Kolinska
shares, on which banks have not issued retail certificates.

. .
FINANCIAL STABILITY REVIEW, EXPERT PAPERS 23
Figure 4: Proportion of market capitalisation of individual shares accounted for by retail certificate issuing banks (left) and monthly turnover ratios of shares on the prime market21 (right)
0%
1%
2%
3%
4%
5%
6%
7%
2006 2007
GorenjeIntereuropaKrkaLuka KoperMercatorPetrolTelekom SlovenijePivovarna Laško
0,0%
0,5%
1,0%
1,5%
2,0%
2,5%
3,0%
2006 2007
TR (prime market)
Sources: CSCC, Bank of Slovenia conversions The largest volume and net purchases recorded by retail certificate issuers between January 2006 and the end of February 2008 involved Krka shares, on which the most certificates were issued. The issuing banks also showed great interest in shares of Gorenje, Telekom Slovenije and Mercator, and, in 2007, Petrol. The largest proportion of total volume, excluding block trades, accounted for by retail certificate issuers in 2006 was recorded by shares of Mercator (37.5%), followed by shares of Pivovarna Laško, Krka and Gorenje. These proportions increased on average in 2007, with shares of Gorenje (36.9%), Mercator (34.1%) and Krka (33.5%) recording the largest figures, followed by shares of Telekom Slovenije, Pivovarna Laško, Petrol and Sava. The proportions declined in the first two months of 2008, with shares of Mercator (29.6%), Krka (21.1%), Luka Koper (14%) and Gorenje (12.4%) recording the highest figures.
Table 8: Volume of trading and net purchases of individual shares made by banks issuing retail certificates on Slovenian shares22
2006 2007 2008 2006 2007 2008 2006 2007 2008EUR million 21,2 63,8 -20,3 91,4 357,5 36,0
Gorenje 13,5 36,2 2,8 5,5 12,7 5,1 17,0 36,9 12,4Krka 58,6 27,6 51,4 58,7 47,7 52,6 18,1 33,5 21,1Telekom Slovenije 0,8 14,4 10,6 0,2 11,3 7,3 0,4 17,7 11,2Mercator 3,5 6,1 9,4 26,0 9,3 18,6 37,5 34,1 29,6Intereuropa 0,1 5,5 1,6 0,1 1,3 0,9 0,7 7,1 4,1Luka Koper 1,4 5,2 5,3 0,6 2,1 4,5 2,2 6,1 14,0Petrol 6,9 3,9 8,6 2,5 8,4 3,1 1,7 11,6 6,3Sava 1,8 1,9 5,3 0,9 1,4 2,1 8,0 10,1 10,9Istrabenz 0,0 0,7 0,6 0,0 0,6 0,4 0,0 3,8 7,8NKBM 0,0 0,1 -0,7 0,0 0,0 1,0 0,3 2,1Merkur 0,0 -0,6 0,0 0,0 0,7 0,1 0,0 5,2 3,9Pivovarna Laško 13,4 -0,9 5,0 5,4 4,6 4,3 19,6 15,8 6,5
Breakdown by shares, %
Net purchases Volume Volume1/total volumein individual share2
Note: 1 Volume of trading in individual shares made by foreign banks issuing retail certificates on Slovenian shares 2 Volume
excluding block trades Sources: Bank of Slovenia, Ljubljana Stock Exchange As at the beginning of May 2008 there were 85 retail certificates issued directly on Slovenian shares (of which 73 were knock-out certificates), and 186 issued on indices or baskets including Slovenian shares (of which 68 were knock-out certificates) quoted on the Stuttgart Stock Exchange, where the majority of retail certificates on Slovenian shares are listed. By issuing retail certificates on indices of markets in central, south-eastern and eastern Europe, issuers are also increasing the co-dependence of these capital markets. The majority of the knock-out certificates were long certificates, which gain in value as the prices of the underlying instruments rise, while there were 31 short certificates (14 issued directly on Slovenian shares, and 17 issued on indices including Slovenian shares), which gain in value as the prices of the underlying instruments fall. Investment certificates are prevalent among the retail certificates issued on indices or baskets including Slovenian shares, namely index certificates, discount certificates, bonus certificates and some guaranteed certificates.
21 Block trades are excluded from the calculation of the monthly turnover ratios of prime market shares. 22 The figures for 2008 relate to the first two months of the year.

.
24 FINANCIAL STABILITY REVIEW, EXPERT PAPERS
Table 9: Retail certificates issued on Slovenian shares and indices including Slovenian shares quoted on the Stuttgart Stock Exchange as at 7 May 2008
Underlying instrument (share)Number of certificates
Underlying instrument (index including Slovenian shares)
Number of certificates
Krka 19 SETX 44Telekom Slovenije 15 NTX 41Gorenje 11 CECExt 24Mercator 7 CECE Healthcare 14Pivovarna laško 9 CECE Telecom 16Petrol 7 SBI20 8Intereuropa 5 CECE Oil&gas 16Istrabenz 2 CECE Mid Cap 3NKBM 6 CECE Banking 16Luka Koper 2 S-BOX Balkan 1
SBI TOP 3Total 83 Total 186
Total shares + indices 269 Source: Stuttgart Stock Exchange
Table 10: Slovenian shares in individual derived indices on which retail certificates are issued Index Shares included sharesSETX Gorenje, Krka, Mercator, Petrol, Sava, Pivovarna Laško 40,4%NTX Krka, Petrol, Telekom Slovenije 5,0%CECExt Gorenje, Krka, Mrecator, Petrol, Pivovarna Laško, Sava, Telekom Slovenije 9,0%CECE MID Luka Koper, Intereuropa, Aerodrom Ljubljana, Žito 12,0%CECE Oil&gas Petrol 9,5%CECE Healthcare Krka 25,5%CECE Telecom Telekom 19,0%CECE Banking NKBM 0,8%SLOWENIEN BASKET Krka, Petrol, Telekom, Luka, Mercator, Gorenje, Pivovarna Laško 100,0% Source: http://www.indices.cc/cms The effect of issues of retail certificates, particularly on low-liquidity capital markets, is to intensify the movement of share prices. During a time of rising prices, retail certificate issuing banks additionally contribute to the rise in prices by issuing long certificates and purchasing underlying instruments to hedge their positions. Conversely, the premature expiry of long knock-out certificates reinforces falls in prices during a time of negative trends on the stock market. A retail certificate expires prematurely when the value of the underlying instrument reaches the knock-out barrier. The issuing bank then sells the shares that it has held to hedge its positions, which is reflected in increased supply and an exaggerated fall in prices.23 This is particularly the case for the large number of prematurely expired certificates. Increased supply on the market (not necessarily from the certificate issuers) triggers the lower knock-out barriers on other retail certificates on an particular share, which further reinforces the downward pressure on its price. Price falls are particularly pronounced if there are several such shares. On the Ljubljana Stock Exchange this happened for example on 21 and 22 January, when 14 retail certificates issued directly on Slovenian shares and 29 certificates issued on indices or baskets including Slovenian shares expired. The SBI20 lost 4.14% on Monday, 21 January, and 6.15% on Tuesday, 22 January. The index rebounded strongly by 5.7% on Wednesday, 23 January. Without the premature expiry of the knock-out certificates, the price falls on the stock exchange would probably have been smaller. A similar pattern of events was seen between 17 and 20 March, and 14 and 15 April 2008. In the issue of knock-out certificates it should be remembered that publicly announced knock-out barriers reveal the issuing banks’ investment policies (it is known at what price level the issuer will begin to sell shares). Speculative investors can exploit this to buy shares at a lower price when the issuing bank reduces its position by triggering a knock-out. 8 Conclusion
The interesting possibilities of indirectly investing in various financial instruments and commodities offered by retail certificates and the rapid response of issuers make this form of investment very attractive. Foreign banks whose parent banks issue retail certificates will also contribute to their recognition, via the direct marketing of new certificates in Slovenia. However, the recently introduced tax on capital gains from derivatives will reduce investors' incentive to invest in derivatives. 23 The deadline by which the bank sells the shares is stipulated in the general prospectus. It is usually a few hours after the knock-out.

. .
FINANCIAL STABILITY REVIEW, EXPERT PAPERS 25
The majority of retail certificates issued on Slovenian shares and indices or baskets including Slovenian shares are quoted on the Stuttgart Stock Exchange. There were almost 270 such certificates listed as at the beginning of May 2008. The issue of retail certificates tied to Slovenian shares is intensifying the movement of prices on the Slovenian capital market. In the first eight months of 2007, foreign banks reinforced the rise in prices by issuing certificates and making positive net purchases of Slovenian shares. In October and November 2007 and in 2008, they contributed to the fall in prices and increased volatility by making net sales of Slovenian shares closely related to the premature expiry of long knock-out certificates. Issues of retail certificates on Slovenian shares are also increasing interdependency with foreign capital markets, particularly with those on which shares included in indices from central, south-eastern and eastern Europe on which certificates are issued are listed. 9 References:
• ABN Amro: LaunchPAD Programme, Base Prospectus Relating to Turbos, 1 July 2007 • ABN Amro: LaunchPAD Programme, Offering Supplement No. 3978, 16 August 2007 • ABN Amro: LaunchPAD Programme, Offering Supplement No. 3976, 16 August 2007 • ABN Amro: Optionsscheine und MINI Future Zertifikate (Kleiner Einsatz – grosse Wirkung) March 2007, 32 p • Deutsche Bank: Retail investors: A German success story, March 2007, 16 p • IMA: Green paper on retail financial services in the single market, July 2007 • Raiffeisen Centrobank: Asset Allocation – Zertifikate 1x1, October 2006, 40 p • Scoach: Anlageprodukte – Investieren mit Zertifikaten, September 2007, 24 p • Scoach: Hebelprodukte – Optionsscheine und Knock-outs, September 2007, 24 p • Zertifikate Forum Austria: Z wie Zertifikat (Basiswissen für Anleger), July 2007, 36 p • Market in Financial Instruments Act (Official Gazette of the Republic of Slovenia, No. 67/2007 of 27 July 2007) Websites • Zertifikateweb: http://www.zertifikateweb.de/ • Scoach: http://www.scoach.de/DE/Showpage.aspx?pageID=19 • Deutsche Bank: http://www.db.com/index.htm?ghpmeta=ENG_deutsch • Deutscher Derivate Verband – German Derivatives Association: http://www.derivate-forum.de/ • German Derivatives Institute: http://www.ddi.de/./ddi/ • Ecofin: http://www.consilium.europa.eu/ueDocs/cms_Data/docs/pressData/en/ecofin/94033.pdf • Volksbank: http://www.volksbank.si/prebivalstvo/strukturirani_produkti/; • Raiffeisen Bank: http://www.raiffeisen.si/nalozbe/certifikati. • http://www.indices.cc/cms • Finanztreff: www.finanztreff.de • Stuttgart Stock Exchange: http://www.boerse-stuttgart.de/isgndex.phtml?

.
26 FINANCIAL STABILITY REVIEW, EXPERT PAPERS
TAXATION OF PERSONAL INCOME FROM CAPITAL
Mitja Čok1
SUMMARY
The paper presents the essential features and characteristics of the taxation of personal income from capital in Slovenia. For all forms of taxation of capital income (interest, dividends and capital gains) it then examines the solutions at EU level, where the principle applied is that all taxation of personal income remains the competence of the individual member-states, the solutions in bilateral double taxation avoidance agreements being taken into consideration. The minimum level of coordination in the form of the exchange of information about the amount of taxable income has been established for the taxation of interest income. On the basis of the material presented, it can be concluded that the latest Slovenian legislation has to a great extent eliminated the differences in the taxation of individual types of personal income from capital, and has applied solutions recognised in other EU member-states.
1 Faculty of Economics, University of Ljubljana

. .
FINANCIAL STABILITY REVIEW, EXPERT PAPERS 27
1 Introduction
The purpose of the paper is to present the essential features of the taxation of personal income from capital in Slovenia, to reveal any inconsistencies, and to illustrate the solutions in Slovenian tax legislation in the context of the tax arrangements at EU level and at the level of the individual member-states. In its 2001 communication Tax policy in the European Union – priorities for the years ahead, the European Commission stated that the taxation of personal income remains the competence of the individual member-states, even if the EU achieves a higher level of integration in the future than had been established at the time of the communication. At the same time the Commission explicitly highlighted the urgency of coordination at the EU level with the aim of protecting the exercise of Treaty freedoms and eliminating tax barriers to cross-border activities. The Commission specifically called for the coordination of taxation of personal income with the aim of preventing double taxation, unintentional non-taxation in cross-border transactions, and cross-border tax evasion. The decisions of the European Court of Justice also clearly show that in the area of personal taxation the emphasis is on the importance of the competences of the individual member-states, and the upholding of Treaty principles relating to the free movement of labour, services and capital, and freedom of economic initiative, where it is particularly emphasised that any discrimination, direct or indirect, on the grounds of nationality is unacceptable. This practice, when there is no attempt to coordinate taxation itself at EU level, but rather the principle of non-discriminatory treatment of taxpayers from different member-states is upheld, is also seen in cases such as the taxations of pensions (communication on the taxation of pensions of April 2001), dividends (Communication on the taxation of dividends of December 2003), and the taxation of interest. The structure of the analysis is as follows. The introduction is followed by a section dealing with capital income as defined in Slovenia’s personal income tax act, and then a discussion of individual types of capital income in the EU. The third section examines the taxation of interest in the EU, the fourth the taxation of dividends and capital gains in the EU, and the fifth other taxes paid by financial institutions in Slovenia. The analysis is completed by a conclusion. 2 Treatment of capital income in the personal income tax act (ZPOD)2
The following terms are precisely defined and used in the Personal Income Tax Act (ZDOH-2): 1) “Income from renting a property and the transfer of property rights”, which includes rents and income from the
transfer of property rights 2) “Capital income”, which includes interest, dividends and capital gains
First let us briefly examine how the law covers the taxation of individual types of capital income: 1. Income from renting a property (rents): The law stipulates that the taxable base for personal income includes rents from renting of movable property and real estate, minus proven actual maintenance costs to preserve the useful value of the property, or standardised costs of 40%. 2. Income from the transfer of property rights: The law stipulates that the taxable base for personal income includes income from the transfer of property rights, minus standardised costs of 10%. 3. Interest: The law defines the following types of interest subject to taxation: interest from loans, interest from debt securities, interest from deposits at banks and savings banks and other similar financial claims against debtors, income from financial leasing, income from life insurance, and income generated by taxpayers on the basis of sharing the mutual fund's revenues in the form of interest. The taxable base consists of the interest generated. In financial leasing, the taxable base is the portion of the payment to the lessor that does not constitute the repayment of the principal. The taxable base for income from life insurance is the difference between outward payments received and inward payments made. For interest, personal income tax is not paid on:
- interest from taxes and contributions paid erroneously or in excess - interest on transaction accounts (up to the amount applying to sight deposits) - income from whole life insurance where the income is paid out owing to the death of the insured
2 Slovenian Institute of Accountants, Financial Analysts and Auditors: Collection of Tax Regulations, Ljubljana, 2008

.
28 FINANCIAL STABILITY REVIEW, EXPERT PAPERS
- income from life insurance, if the insured sum is paid out after ten years have passed since the life insurance contract was concluded
- interest on a savings agreement under the national housing saving scheme concluded for at least five years - 50% of the interest on denationalisation bonds - interest on payments by co-divided owners into a reserve fund established in accordance with the Housing Act
Interest is subject to cedular personal income tax at a rate of 20% (15% in 2007). The law stipulates that interest on private individuals’ cash deposits at banks and savings banks established in accordance with Slovenian regulations or regulations of other EU member-states is taxed above an allowance of €1,000. 4. Dividends The law stipulates that dividends and other income determined on the basis of ownership of equity are classed as dividends. The taxable base consists of the dividends generated. A tax rate of 20% applies. 5. Capital gains: Real estate, securities, participating interests in companies and investment coupons are classed as capital. The taxable base is the gain, calculated as the difference between the value of the capital at disposal, and the value at acquisition, with allowance for the costs of acquisition/disposal, which are defined precisely by the law. A capital loss incurred by the taxpayer through the disposal of capital in a particular year may be deducted from capital gains realised. Significant exemptions, i.e. when the capital gain is not taxed, apply in the case of the first disposal of shares or capital acquired in the voucher privatisation process, and in the disposal of housing where the taxpayer has permanent residence and has actually resided for the three years prior to disposal, the housing being disposed of after being owned for three years. In all other cases the basic 20% cedular rate is reduced by 5 percentage points every five years that the capital is owned, so that after 20 years a gain realised on the basis of the capital is not taxed. The law therefore prescribes unequal treatment for individual types of capital income, and this unequal treatment can reasonably be classed as follows: 1. Inequality in terms of inclusion in the integrated taxable base and cedular taxation
- income from renting a property and income from transfer of property rights are included in the integrated taxable base, which is taxed progressively at marginal rates of 16%, 27% and 41%,
- interest, dividends and capital gains are taxed at a cedular rate of 20%. 2. Inequality in terms of the period in which realised capital gains are subject to tax treatment
- a capital gain on housing where the taxpayer has permanent residence is no longer subject to taxation after three years,
- a capital gain on other forms of capital is taxed equally (the initial 20% cedular rate is reduced by 5 percentage points every five years),
- a 20% cedular rate applies to interest, irrespective of the term of the investments generating the interest, which represents a significantly higher tax burden on interest income, particularly on long-term investments.
3. Inequality in terms of the amount of capital income subject to taxation
- income from transfer of property rights is included in the integrated taxable base after standardised costs of 10% have been deducted,
- rents are included in the integrated taxable base after proven actual maintenance costs or standardised costs of 40% have been deducted,
- capital gains are subject to cedular taxation in full (after allowance for the costs of disposal/acquisition and the offsetting of any taxable loss), whereby the initial 20% rate is being gradually reduced,
- interest is subject to cedular taxation in full, exemptions applying to 50% of the interest on denationalisation bonds, and to interest on private individuals’ cash deposits at banks and savings banks established in accordance with Slovenian regulations or regulations of other EU member-states, which is taxed above an allowance of €1,000.
On capital income other than interest on private individuals’ cash deposits at banks and savings banks, the absolute amount is irrelevant from the point of view of inclusion in the taxable base. It is included in the taxable base in full, or after any allowable deduction (actual costs or standardised costs of 40% for rents, standardised costs of 10% for the transfer of property rights, 50% for interest on denationalisation bonds). The sole exception is interest on private individuals’ cash deposits at banks and savings banks, which is taxed above an allowance of €1,000. In other words, this is the only form of capital income that is discriminated against with regard to the absolute amount. To summarise: the law as adopted prescribes very heterogeneous treatment to individual types of capital income, introducing concealed cedularity to the concept of integrated personal income tax, alongside explicit cedularity.
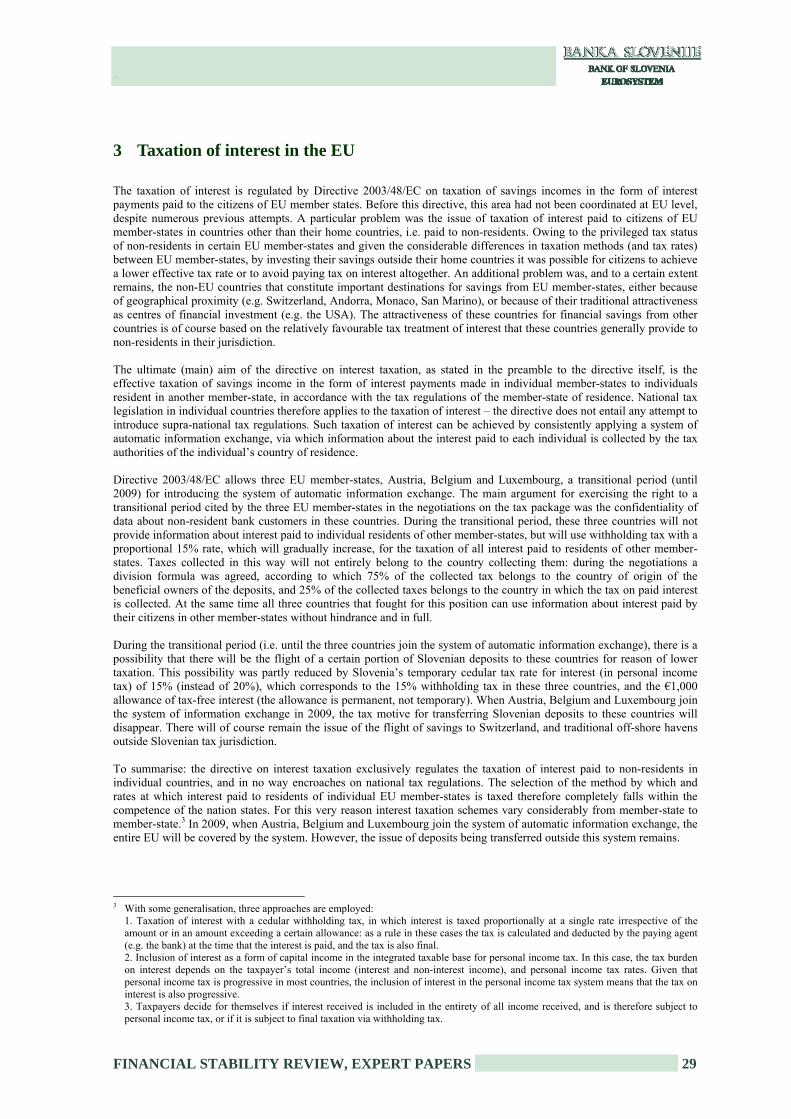
. .
FINANCIAL STABILITY REVIEW, EXPERT PAPERS 29
3 Taxation of interest in the EU
The taxation of interest is regulated by Directive 2003/48/EC on taxation of savings incomes in the form of interest payments paid to the citizens of EU member states. Before this directive, this area had not been coordinated at EU level, despite numerous previous attempts. A particular problem was the issue of taxation of interest paid to citizens of EU member-states in countries other than their home countries, i.e. paid to non-residents. Owing to the privileged tax status of non-residents in certain EU member-states and given the considerable differences in taxation methods (and tax rates) between EU member-states, by investing their savings outside their home countries it was possible for citizens to achieve a lower effective tax rate or to avoid paying tax on interest altogether. An additional problem was, and to a certain extent remains, the non-EU countries that constitute important destinations for savings from EU member-states, either because of geographical proximity (e.g. Switzerland, Andorra, Monaco, San Marino), or because of their traditional attractiveness as centres of financial investment (e.g. the USA). The attractiveness of these countries for financial savings from other countries is of course based on the relatively favourable tax treatment of interest that these countries generally provide to non-residents in their jurisdiction. The ultimate (main) aim of the directive on interest taxation, as stated in the preamble to the directive itself, is the effective taxation of savings income in the form of interest payments made in individual member-states to individuals resident in another member-state, in accordance with the tax regulations of the member-state of residence. National tax legislation in individual countries therefore applies to the taxation of interest – the directive does not entail any attempt to introduce supra-national tax regulations. Such taxation of interest can be achieved by consistently applying a system of automatic information exchange, via which information about the interest paid to each individual is collected by the tax authorities of the individual’s country of residence. Directive 2003/48/EC allows three EU member-states, Austria, Belgium and Luxembourg, a transitional period (until 2009) for introducing the system of automatic information exchange. The main argument for exercising the right to a transitional period cited by the three EU member-states in the negotiations on the tax package was the confidentiality of data about non-resident bank customers in these countries. During the transitional period, these three countries will not provide information about interest paid to individual residents of other member-states, but will use withholding tax with a proportional 15% rate, which will gradually increase, for the taxation of all interest paid to residents of other member-states. Taxes collected in this way will not entirely belong to the country collecting them: during the negotiations a division formula was agreed, according to which 75% of the collected tax belongs to the country of origin of the beneficial owners of the deposits, and 25% of the collected taxes belongs to the country in which the tax on paid interest is collected. At the same time all three countries that fought for this position can use information about interest paid by their citizens in other member-states without hindrance and in full. During the transitional period (i.e. until the three countries join the system of automatic information exchange), there is a possibility that there will be the flight of a certain portion of Slovenian deposits to these countries for reason of lower taxation. This possibility was partly reduced by Slovenia’s temporary cedular tax rate for interest (in personal income tax) of 15% (instead of 20%), which corresponds to the 15% withholding tax in these three countries, and the €1,000 allowance of tax-free interest (the allowance is permanent, not temporary). When Austria, Belgium and Luxembourg join the system of information exchange in 2009, the tax motive for transferring Slovenian deposits to these countries will disappear. There will of course remain the issue of the flight of savings to Switzerland, and traditional off-shore havens outside Slovenian tax jurisdiction. To summarise: the directive on interest taxation exclusively regulates the taxation of interest paid to non-residents in individual countries, and in no way encroaches on national tax regulations. The selection of the method by which and rates at which interest paid to residents of individual EU member-states is taxed therefore completely falls within the competence of the nation states. For this very reason interest taxation schemes vary considerably from member-state to member-state.3 In 2009, when Austria, Belgium and Luxembourg join the system of automatic information exchange, the entire EU will be covered by the system. However, the issue of deposits being transferred outside this system remains.
3 With some generalisation, three approaches are employed: 1. Taxation of interest with a cedular withholding tax, in which interest is taxed proportionally at a single rate irrespective of the
amount or in an amount exceeding a certain allowance: as a rule in these cases the tax is calculated and deducted by the paying agent (e.g. the bank) at the time that the interest is paid, and the tax is also final.
2. Inclusion of interest as a form of capital income in the integrated taxable base for personal income tax. In this case, the tax burden on interest depends on the taxpayer’s total income (interest and non-interest income), and personal income tax rates. Given that personal income tax is progressive in most countries, the inclusion of interest in the personal income tax system means that the tax on interest is also progressive.
3. Taxpayers decide for themselves if interest received is included in the entirety of all income received, and is therefore subject to personal income tax, or if it is subject to final taxation via withholding tax.

.
30 FINANCIAL STABILITY REVIEW, EXPERT PAPERS
4 Taxation of dividends and capital gains in the EU
4.1 Taxation of dividends in EU member-states
The taxation of dividends paid to private individuals in the EU has not been harmonised, and there are no plans for the European Commission to set up a standard taxation system. However, in 2003 the European Commission issued a communication entitled "Dividend taxation of individuals in the internal market"4 calling on member-states to regulate the taxation of dividends so as not to contravene the principles of the development of the internal market and to prevent any form of double taxation of dividends. Given that member-states have established a system to prevent double taxation of dividends for their residents, two problems arise in the non-discriminatory treatment of dividends:
- the possibility that dividends paid in other member-states would, from the point of view of an individual resident, be taxed more than dividends paid in the country of residence
- the possibility that dividends paid to residents of other member-states would be taxed more than dividends paid to residents
Attention was drawn to these problems in the taxation of dividends in the Ruding Report of 1992, where it was explicitly pointed out that discriminatory taxation of dividends could hinder the free movement of capital between member-states, and lead to the fragmentation of the capital market in the EU. The prevention of discriminatory practice in the taxation of dividends could thus ensure increased competition on EU financial markets, contribute to greater market liquidity, to more efficient allocation of capital and to more options for investors, which are all objectives in the Financial Services Action Plan. In practice problems do not arise because of the double taxation of dividends, which the majority of countries prevent or at least limit via the use of an imputation system or cedular system, but a serious problem can be posed by different tax treatment for domestic dividends compared with dividends paid to the rest of the world (outbound dividends) and dividends received by residents from paying agents in the rest of the world (inbound dividends). According to the European Commission’s instructions, member-states should therefore opt for the appropriate coordination of the taxation of dividends. Here it is important that each member-state does not tax inbound dividends more than domestic dividends. Similarly, outbound dividends should not be taxed more than domestic dividends. Applying these two rules should ensure the mobility of capital between member-states, the unhindered development of the capital market, and the optimal allocation of capital in the internal EU market.
4.2 Taxation of capital gains in EU member-states
The taxation of capital gains in the EU member-states is also not standardised or harmonised, which means that there are no regulations at EU level to regulate either tax rates or the taxable base in the taxation of capital gains realised in EU member-states. This means that the taxation of capital gains is regulated by the national tax legislation of the individual member-states, and the problem of double taxation is addressed by the international agreements on the avoidance of double taxation of income and assets that the member-states conclude on a bilateral basis. As a result of these arrangements, the differences between member-states in the taxation of capital gains are relatively large, as there can be variations in the definition of the taxable base, the method of determining the tax, and the actual tax rate. Capital gains are taxed in the majority of member-states. A direct comparison of the capital gains taxation systems in different member-states reveals two features when via their taxation methods countries aim for certain macroeconomic effects and the mean is not simply the collection of taxes for fiscal reasons. The first of these features is that the taxation of short-term capital gains is frequently distinguished from that of long-term capital gains, the purpose of which is to encourage long-term investment and/or restrict short-term speculation. The second feature is the favouring of investments in securities of domestic issuers, or securities listed on domestic exchanges. To a great extent these features are evident in the table below. A major difference between EU member-states is also seen in the method in which capital gains are taxed, two different approaches being employed:
- Taxation of capital gains as part of integrated personal income tax. In this case a direct comparison of the tax burden on capital gains can merely be approximate, as the actual rates applying to taxpayers can vary greatly, particularly in progressive income tax systems, and the taxpayers can also reduce their taxable burdens by claiming various forms of tax relief.
4 Commission of the European Communities: Communication from the Commission to the Council, the European Parliament and the
European Economic and Social Committee: Dividend Taxation of Individuals in the Internal Market, COM(2003) 810, Brussels, 19 December 2003.

. .
FINANCIAL STABILITY REVIEW, EXPERT PAPERS 31
- Cedular taxation of capital gains. This method of taxation provides for greater transparency and comparability in the taxation of capital gains, and is generally significantly simpler than taxation as part of personal income tax.
Table 1: Taxation of capital gains in EU member-states Country
Period (years) Rate (%)Austria 1 50 0Belgium 5 331 0Bulgaria --- 24 24Cyprus --- 0 0Czech Republic 0.5 32 0Denmark 3 282 03
Estonia --- 24 24Finland --- 28 28France --- 04 0Germany 1 428 0Greece --- 55 5Hungary --- 25 25Ireland --- 20 20Italy 1 12,5 12,5Latvia --- 0 0Lithuania 1 15 06
Luxembourg --- 38 38Malta --- 357 35Netherlands --- 0 0Poland --- 19 19Portugal 1 10 0Romania --- 16 16Slovakia --- 19 19Slovenia 5 20 0Spain 1 45 15Sweden --- 30 30UK --- 409 4010
Tax on short-term capital gains Tax on long-term capital gains
Sources: European Tax Handbook, 2006; Income Tax Rates Worldwide, 2006; Golob, 2006 Notes: 1 A 0% rate applies to capital gains realised by selling securities listed on the national stock exchange. 2 A 28% rate applies to capital gains up to €5,700; a rate of 43% applies to capital gains above this sum. 3 When the market value of sold shares exceeds €18,200, the same rates apply as for short-term capital gains. 4 A rate of 16% applies to all capital gains above €15,000, whether short-term or long-term. 5 A rate of 0% applies to capital gains realised by selling securities listed on the national stock exchange, while a rate of 5% applies to capital gains realised by selling other securities. 6 A 0% rate applies in cases when the taxpayer has held securities for more than one year, and simultaneously owns less than 10% of the company’s capital. 7 A 0% rate applies to capital gains realised by selling securities listed on the national stock exchange. 8 In the taxation of short term capital gains and capital gains from dominant equity holdings, only half of the capital gain is taxed. 9 The proportion of the capital gain included in the taxable base is gradually reduced: 100% of the capital gain realised is included in the taxable base in the first two years, 95% in the third year, 90% in the fourth year, 85% in the fifth year and 80% in the sixth and subsequent years. 10 A 10% rate applies when the taxpayer has held corporate securities designated by the government for at least three years. To summarise: the taxation of dividends and capital gains, like the taxation of interest, is not harmonised at EU level, which means that the national tax legislations of individual member-states apply to the taxation of these two forms of capital income realised in the EU. In contrast to the taxation of interest, where a system of automatic information exchange has been established, no such system has been introduced for the taxation of dividends and capital gains. Taxation is performed in accordance with the national legislation of each country separately, the provisions of bilateral double taxation avoidance agreements also applying.

.
32 FINANCIAL STABILITY REVIEW, EXPERT PAPERS
5 Other taxes paid by financial institutions (ZPOD)5
VAT
VAT in Slovenia is fully compliant with the EU’s sixth guideline, and the taxation of financial matters is therefore comparable with other EU member-states. Transactions exempted from VAT include:
- Insurance and reinsurance transactions, including related services provided by insurance brokers and agents - Financial services (loan approval and management, services related to deposit management, savings deposits,
bank accounts, payment transactions, transactions in shares and other securities, investment fund management, etc.)
- Supply of gold to the Bank of Slovenia A standard 20% rate applies to other services provided by banks, such as the leasing of safe deposit boxes.
Insurance premium tax
Tax is paid on insurance transactions provided in property and personal insurance; the base is the insurance premium paid on the basis of the insurance contract. The tax is not paid on:
- compulsory pension, disability and health insurance, - personal insurance (health, casualty and life insurance), in which the insurance term is no shorter than 10 years, - insurance against risks outside the territory of Slovenia, - reinsurance.
The tax rate is 6.5%. The liable taxpayers are insurers and other legal entities providing insurance in Slovenia. From the point of view of financial institutions, it is particularly important that long-term life insurance, which is a major financial product, is not subject to this tax.
Corporate income tax
The liable taxpayers are all legal entities of domestic law (tax residents), which are taxed on all income whose source is inside or outside Slovenia. This tax is also paid by legal entities of foreign law (tax non-residents), which are taxed on income whose source is in Slovenia. The tax rate is gradually being reduced from an initial 25% to a final rate of 20% in 2010 (23% in 2007, 22% in 2008, and 21% in 2009), and will be among the lowest in the EU. There are also exemptions: investment funds that distribute at least 90% of their operating profit in the previous tax period by 30 November each year are taxed at a rate of 0%. A zero rate also applies to pension funds, and to insurers in the portion of their operations relating to pension plan implementation. In the determination of the taxable base, 50% of provisioning (for guarantees given, pensions, loyalty bonuses and retirement severance pay) is recognised as an expense, while banks, brokerage houses and insurers can claim the full amount up to the ceilings prescribed by the banking act, the securities market act and the insurance act. From the point of view of financial institutions, one issue in the current corporate income tax system is the 15% withholding tax on interest payments to the rest of the world. The law stipulates that withholding tax be paid at a rate of 15% on payments of dividends and similar income, interest (other than interest paid or guaranteed by the Slovenian state, and interest paid by banks to other banks and financial institutions), payments for the use of property rights, rents, etc. Withholding tax is not paid on payments to the state, municipalities, the Bank of Slovenia, resident taxpayers that report their tax identification numbers, and non-resident taxpayers receiving payments at a business unit in Slovenia that report their tax identification numbers. Should a rate lower than 15% be stipulated by international agreement, this lower rate applies. The tax is not withheld in the case of dividend payments, interest payments and payments for the use of property rights made to companies subject to a joint taxation system applying to subsidiaries from different EU member-states. A prerequisite is that the recipient has held, for at least 24 months, at least 10% of the capital or voting rights of the paying agent in the case of dividends, and at least 25% in the case of interest or property rights. This has transposed the content of Directive 90/435/EEC and Directive 2003/49/EC into Slovenian law, the purpose of which is the elimination of double taxation on payments between related parties. A problem or ambiguity is payments of interest on bonds issued in the rest of the world, for which the bank usually does not know the ultimate beneficial owner of the interest. For this reason banks may avoid bond issues as far as possible, but
5 Slovenian Institute of Accountants, Financial Analysts and Auditors: Collection of Tax Regulations, Ljubljana, 2008.

. .
FINANCIAL STABILITY REVIEW, EXPERT PAPERS 33
can nevertheless find themselves in a situation when the possibilities of additional borrowing have been exhausted, and they are compelled to issue bonds under unfavourable tax terms. To summarise: with regard to the three taxes briefly discussed here, from the point of view of neutrality to financial institutions, the main issue is the implementation of the 15% withholding tax.
Conclusion
In its most recent reform of personal income tax, i.e. the new law effective as of 1 January 2007, Slovenia greatly reduced the unequal tax treatment of individual types of capital income, with interest, dividends and capital gains now being taxed at a cedular rate of 20%. Rents are still included in integrated personal income tax. The other features applying to individual types of capital income (periods, standardised costs, etc.) being taken into consideration, it is evident that the personal income tax system is not completely tax neutral to all types of capital income. Although there are differences within the EU in the personal income tax treatment of interest, the system of automatic information exchange, which all EU member-states will have joined by 2009, will eliminate international tax discrimination within the EU. There remains the issue of the transfer of money outside the EU to environments outside the reach of domestic tax legislation. By contrast, there is no similar solution for dividends or capital gains, as the international aspect of capital gains taxation is primarly covered via double taxation avoidance agreements, and investments that yield dividends and capital gains for domestic financial institutions are therefore more “evasive” than investments that yield interest. Nevertheless, it can be concluded that Slovenia’s personal income tax system is not unfavourable to domestic financial institutions, as it provides for internationally comparable tax treatment of capital income within personal income tax. Neither do the other major taxes paid by Slovenian financial institutions (VAT, corporate income tax and insurance tax) deviate from international practice. Here attention should be drawn to the implementation of the 15% withholding tax within corporate income tax, where the legislation needs to be adjusted to grant Slovenian banks an equal position in international terms.
References
Commission of European Communities: Communication from the Commission to the Council, the European Parliament and the European Economic and Social Committee. Dividend taxation of individuals in the Internal Market, COM(2003) 810, Brussels, 19 December 2003
Commission of European Communities: Communication from the Commission to the Council, the European Parliament and the European Economic and Social Committee. Tax policy in the European Union - Priorities for the years ahead, COM(2001) 260, Brussels, 23 May 2001
Commission of European Communities: Communication from the Commission to the Council, the European Parliament and the European Economic and Social Committee. The elimination of tax obstacles to the cross-border provision of occupational pensions, COM(2001) 214, Brussels, 19 April 2001
Council Directive 2003/48/EC of June 3 2003 on taxation of savings income in the form of interest payments. Official Journal of the European Union, 26 June 2003
Council Directive 2003/49/EC of 3 June 2003 on a common system of taxation applicable to interest and royalty payments made between associated companies of different Member States. Official Journal of the European Union, 26 June 2003
Council Directive 90/435/EEC of 23 July 1990 on the common system of taxation applicable in the case of parent companies and subsidiaries of different Member States.
European Commission, Taxation and Customs Union, http://ec.europa.eu/taxation_customs/ European Financial Services Forum (2002): Taxation of financial services in the European Union, www.epfst.org European Tax Handbook, International Bureau of Fiscal Documentation (IBFD), Amsterdam, 2006 Golob N (2006): Taxation of capital gains and agency costs, Dissertation, Faculty of Economics, University of Ljubljana Slovenian Institute of Accountants, Financial Analysts and Auditors: Collection of Tax Regulations, Ljubljana, 2008