NASDAQ: Common Stock – FDUS
32
Investor Presentation NASDAQ: Common Stock – FDUS
Transcript of NASDAQ: Common Stock – FDUS

Investor Presentation
NASDAQ:Common Stock – FDUS
Capital. Partnership. Expertise.www.fdus.com
2
Disclosure
Fidus Investment Corporation (“Fidus”) cautions that statements in this presentation that are forward-looking, and provide other than historical information, involve risks and uncertainties that may impact ourfuture results of operations. The forward-looking statements in this presentation are based on currentconditions and include statements regarding our goals, beliefs, strategies and future operating results andcash flows, including but not limited to the equivalent annual yield represented by our dividends declared,the tax attributes of dividends and the amount of leverage available to us. Although our managementbelieves that the expectations reflected in any forward-looking statements are reasonable, we can give noassurance that those expectations will prove to have been correct. Those statements are made based onvarious underlying assumptions and are subject to numerous uncertainties and risks, including, withoutlimitation: our continued effectiveness in raising, investing and managing capital; adverse changes in theeconomy generally or in the industries in which our portfolio companies operate; changes in laws andregulations that may adversely impact our operations or the operations of one or more of our portfoliocompanies; the operating and financial performance of our portfolio companies; retention of key investmentpersonnel; competitive factors; and such other factors described under the caption “Risk Factors” anddescribed in the sections regarding forward looking statements included in our filings with the Securities andExchange Commission (www.sec.gov). We undertake no obligation to update the information containedherein to reflect subsequently occurring events or circumstances, except as required by applicable securitieslaws and regulations.
This presentation is neither an offer to sell nor a solicitation of an offer to buy Fidus securities. An offering ismade only by an applicable prospectus. This presentation must be read in conjunction with a prospectus inorder to fully understand all of the implications and risks of the offering of securities to which the prospectusrelates. A copy of such a prospectus must be made available to you in connection with any offering.

Capital. Partnership. Expertise.www.fdus.com
3
Table of Contents
I. OverviewII. Investment Strategy & PerformanceIII. Portfolio & Financial ReviewIV. ConclusionV. Appendices
i. Investment Portfolio as of December 31, 2021
ii. Balance Sheet
iii. Income Statement
iv. Reconciliation of Adjustment Net Investment Income
v. Corporate Information
Capital. Partnership. Expertise.www.fdus.com
4
I. Overview
Capital. Partnership. Expertise.www.fdus.com
5
Fidus Investment Corporation
History• May 2007 – Closed initial fund and licensed as
Small Business Investment Company (“SBIC”)• June 2011 – Launched Initial Public Offering as
externally managed Business Development Company (“BDC”)
• Today - Diversified investment portfolio totaling $719.1 million in 70 companies (December 31, 2021)
Long term focus on delivering stable dividends, preserving capital and growing net asset value for our shareholders
Strategy• Provide customized debt and equity financing
solutions primarily to lower middle market companies based in the U.S.
• Well-established direct origination network• Deep industry sector experience• Disciplined investment and asset management
process
Key Investment Highlights• Lower middle market offers significant opportunity
for attractive risk-adjusted returns• SBIC licenses provide access to low cost, fixed
rate unsecured debt financing• Seasoned management team with a proven track
record of preserving capital, growing NAV and generating cumulative adjusted NII in excess of cumulative dividends
• Consistently deliver higher ROE vs. BDC peers
Target Company Characteristics• Niche market leaders with defensible market
positions• Diversified customer and supplier bases• Strong free cash flows or asset support• Significant enterprise value / equity cushions• Strong management teams with meaningful equity
ownership or incentives
Capital. Partnership. Expertise.www.fdus.com
6
II. Investment Strategy & Performance

Capital. Partnership. Expertise.www.fdus.com
7
Proven Investment Strategy
• Provide custom-tailored debt and equity financing solutions for lower middle market companies– Finance event-driven transactions such as leveraged buyouts, refinancings, recapitalizations,
acquisitions and growth capital– Opportunistic investments in special situations with high downside protection or asset support– Partnership approach with long-term investment perspective
• Disciplined investment and asset management process– Highly selective, “PE style” underwriting methodology– Focus on industries and sponsors we know well– Manage the credit documentation process to ensure structural protections– Proactive risk management
• Target investments between $5 - $35 million per portfolio company– First lien / unitranche debt– Second lien and subordinated debt– Equity, including preferred, common and/or warrants
Emphasis on Capital Preservation with Upside Potential

Capital. Partnership. Expertise.www.fdus.com
8
Lower Middle Market Focus• Large, fragmented market
– More than 100,000 companies in the lower middle market– Target firms with annual revenues between $10 and $150 million
• Consistent long-term need for investment capital– Lower middle market predominantly comprised of private companies– Limited access to the broader capital markets
• Underserved by traditional capital providers– Great Recession led to the exit of many traditional financing sources– Recent COVID-19 crisis has exacerbated the problem
• Opportunity for attractive risk-adjusted returns– Lower leverage and higher pricing– Structural protections and covenants that allow for proactive risk management
• Ability to co-invest in equity securities alongside deal partners or management teams
• Fidus professionals have been active in the lower middle market for > two decades
Fidus Is Well Positioned in the attractive Lower Middle Market
Capital. Partnership. Expertise.www.fdus.com
9
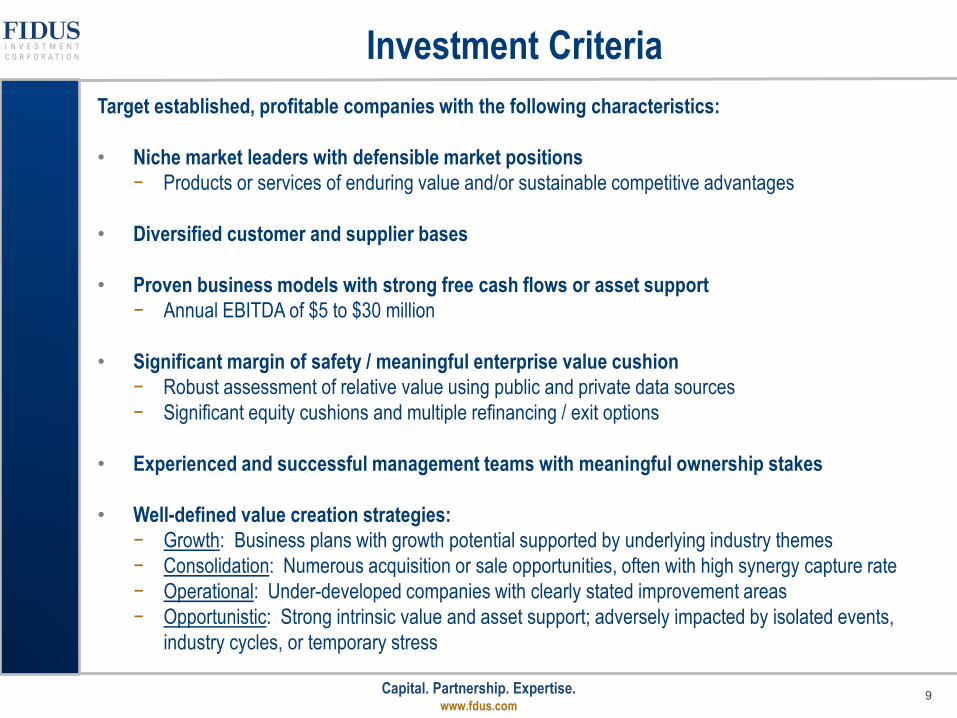
Investment CriteriaTarget established, profitable companies with the following characteristics:
• Niche market leaders with defensible market positions− Products or services of enduring value and/or sustainable competitive advantages
• Diversified customer and supplier bases
• Proven business models with strong free cash flows or asset support− Annual EBITDA of $5 to $30 million
• Significant margin of safety / meaningful enterprise value cushion − Robust assessment of relative value using public and private data sources− Significant equity cushions and multiple refinancing / exit options
• Experienced and successful management teams with meaningful ownership stakes
• Well-defined value creation strategies:− Growth: Business plans with growth potential supported by underlying industry themes− Consolidation: Numerous acquisition or sale opportunities, often with high synergy capture rate− Operational: Under-developed companies with clearly stated improvement areas− Opportunistic: Strong intrinsic value and asset support; adversely impacted by isolated events,
industry cycles, or temporary stress

Capital. Partnership. Expertise.www.fdus.com
10
Platform Overview• Unique platform with direct origination capabilities
across multiple channels Leading private equity firms Independent deal sponsors “The Lower Middle Market Ecosystem”
• Emphasis on repeat clients and high qualitypartners building real relationships 2+ transactions completed with 22 firms
• Three regional offices allow for nationwide deal sourcing and strong local presence Evanston New York Charlotte
Proprietary Direct Origination PlatformExtensive, diverse relationships across the lower middle market drive attractive deal flow
and present significant growth opportunities
Deals Closed: 116
Number of Middle Market Companies: 200,000 (1)
Number of Deals Reviewed:4,734
Deals Screened by Investment Committee:
170
Committed PrivateEquity Funds
Independent Sponsors
Other Lower MiddleMarket Participants
Intermediariesand Advisors
Broad Origination Network
Sponsor76%
Non-Sponsored /
Fundless24%
Source of Originations (LTM Dec-21)
Capital. Partnership. Expertise.www.fdus.com
11
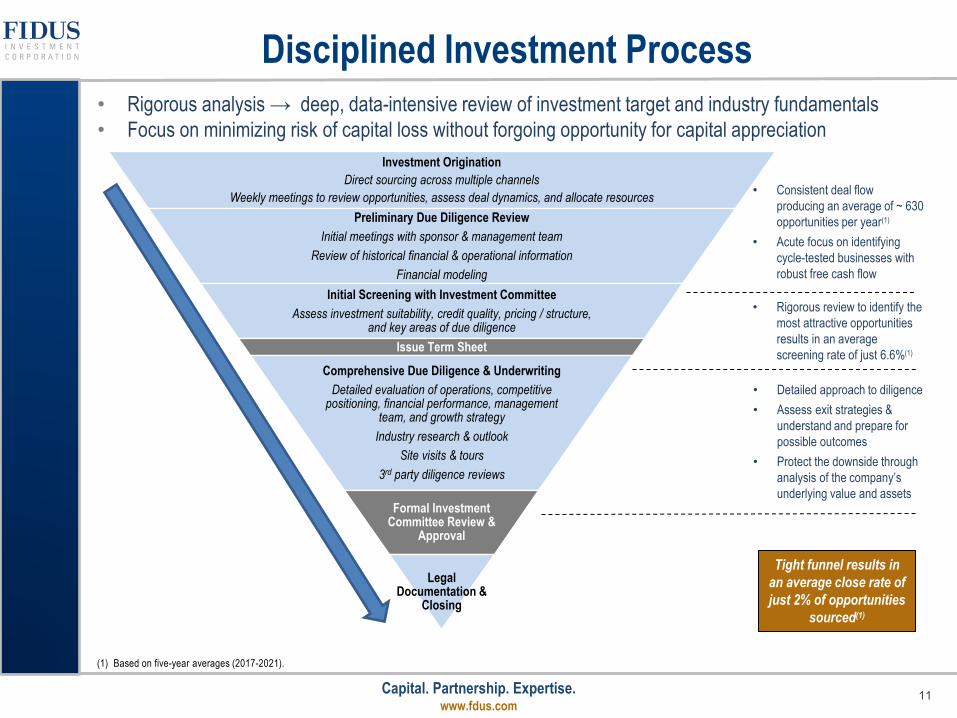
• Rigorous analysis → deep, data-intensive review of investment target and industry fundamentals• Focus on minimizing risk of capital loss without forgoing opportunity for capital appreciation
Investment OriginationDirect sourcing across multiple channels
Weekly meetings to review opportunities, assess deal dynamics, and allocate resourcesPreliminary Due Diligence Review
Initial meetings with sponsor & management teamReview of historical financial & operational information
Financial modelingInitial Screening with Investment Committee
Assess investment suitability, credit quality, pricing / structure, and key areas of due diligence
Issue Term Sheet
Comprehensive Due Diligence & UnderwritingDetailed evaluation of operations, competitive
positioning, financial performance, management team, and growth strategy
Industry research & outlookSite visits & tours
3rd party diligence reviews
Formal Investment Committee Review &
Approval
Legal Documentation &
Closing
Disciplined Investment Process
• Consistent deal flow producing an average of ~ 630 opportunities per year(1)
• Acute focus on identifying cycle-tested businesses with robust free cash flow
• Rigorous review to identify the most attractive opportunities results in an average screening rate of just 6.6%(1)
Tight funnel results in an average close rate of just 2% of opportunities
sourced(1)
• Detailed approach to diligence• Assess exit strategies &
understand and prepare for possible outcomes
• Protect the downside through analysis of the company’s underlying value and assets
(1) Based on five-year averages (2017-2021).

Capital. Partnership. Expertise.www.fdus.com
12
• Proactive portfolio monitoring‒ Monthly financial review and quarterly covenant compliance‒ Active dialogue with management teams and sponsors‒ Board observation rights in large majority of investments ‒ Quarterly portfolio reviews with Investment Committee‒ Objective risk rating system‒ Structural protections provide the ability to impact outcomes
• Culture of capital preservation‒ Regular / ad hoc reporting to the Investment Committee‒ Anticipation of negative credit events‒ Multiple layers of review (internal & external)‒ Robust internal compliance controls
• Independent oversight of fair value process‒ Multiple 3rd party valuation firms
Proactive Risk Management

Capital. Partnership. Expertise.www.fdus.com
13
• Fidus’ senior investment professionals have an average of >25 years of relevant experience• Founding members have worked together for the majority of the last 20+ years• 29 professionals across three offices (Charlotte, Evanston, and New York)
Investment and Origination Team
• Chief Financial Officer – Shelby E. Sherard• 4 other financial team members• 1 office manager
Corporate / Finance
• Robinson, Bradshaw & Hinson, P.A.• Eversheds Sutherland LLP (BDC) • Winston & Strawn LLP (SBA)
Legal
• Investor Relations• Information Technology
3rd Party
* Denotes a team member that is also employed by Fidus Partners, LLC, an M&A advisory services firm and an affiliate of Fidus Investment Advisors, LLC, the external manager of FDUS.
Executive Management
Experienced Team
Relevant ExperienceProfessional Title Industry Expertise Fidus IndustryEdward H. Ross CEO & IC Member A&D, Transp. & Logistics 15 years 30 yearsThomas C. Lauer MD & IC Member Healthcare, IT & Software 12 years 28 yearsRobert G. Lesley, Jr. MD & IC Member Business Services, Distribution 8 years 26 yearsThomas J. Steiglehner MD & IC Member IT & Software, Consumer 4 years 29 yearsW. Andrew Worth MD & IC Member A&D, Manufacturing 13 years 24 yearsMichael J. Miller* MD & Head of BD Generalist 11 years 32 yearsJohn H. Grigg * MD & IC Member Food, Industrial 16 years 31 yearsJohn J. Ross II * MD & IC Member Business Services 17 years 26 yearsMatthew R. Culbertson Managing Director Consumer, IT & Software 14 years 14 yearsCraig J. Petrusha Managing Director Business Services, Logistics 8 years 21 yearsMatthew G. Shehorn Managing Director Healthcare 12 years 17 yearsWilliam S. Brown Managing Director Business Services, Industrial 13 years 15 yearsJ. Connor Hoesley Managing Director Industrial, Distribution 13 years 13 years
13 junior investment professionals
Capital. Partnership. Expertise.www.fdus.com
14
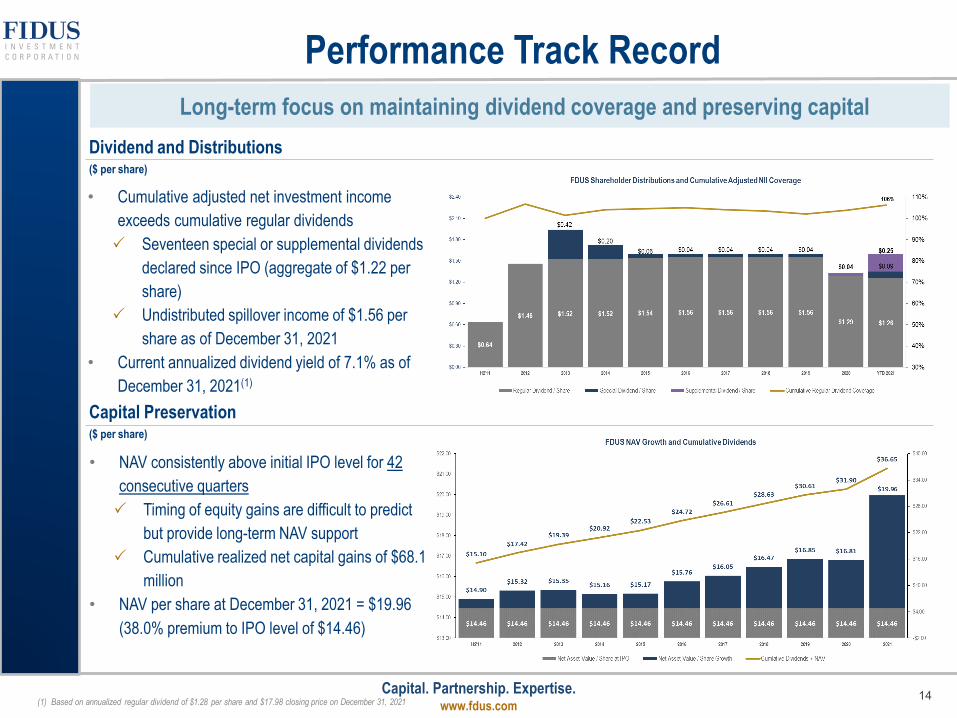
Long-term focus on maintaining dividend coverage and preserving capital
• Cumulative adjusted net investment income exceeds cumulative regular dividends Seventeen special or supplemental dividends
declared since IPO (aggregate of $1.22 per share)
Undistributed spillover income of $1.56 per share as of December 31, 2021
• Current annualized dividend yield of 7.1% as of December 31, 2021(1)
Dividend and Distributions($ per share)
(1) Based on annualized regular dividend of $1.28 per share and $17.98 closing price on December 31, 2021
Performance Track Record
Capital Preservation($ per share)
• NAV consistently above initial IPO level for 42 consecutive quarters Timing of equity gains are difficult to predict
but provide long-term NAV support Cumulative realized net capital gains of $68.1
million • NAV per share at December 31, 2021 = $19.96
(38.0% premium to IPO level of $14.46)
Capital. Partnership. Expertise.www.fdus.com
15
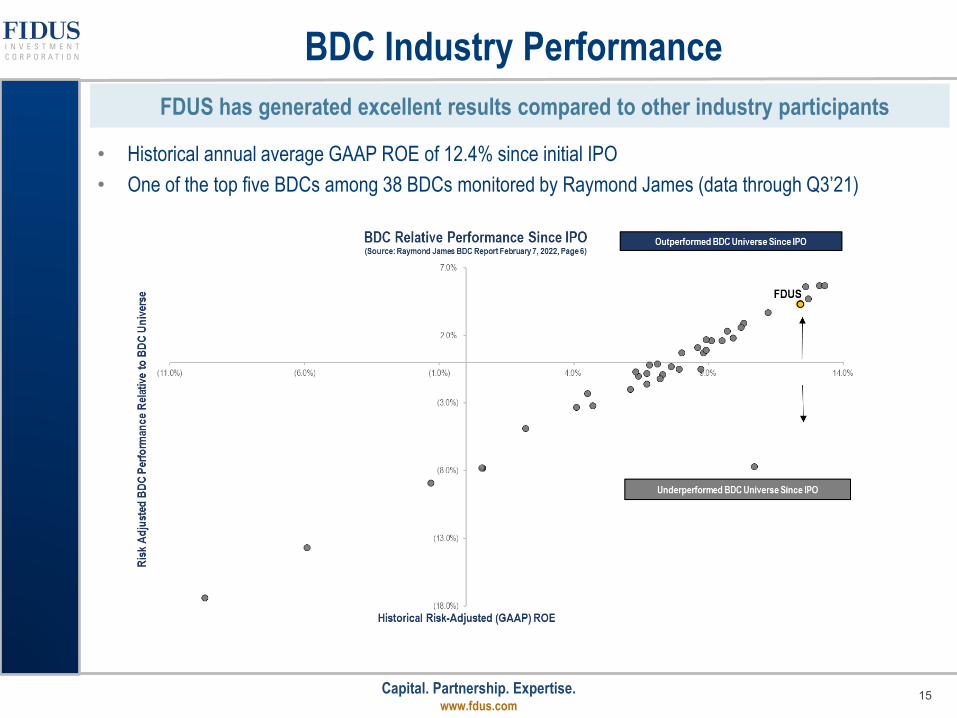
BDC Industry Performance
• Historical annual average GAAP ROE of 12.4% since initial IPO• One of the top five BDCs among 38 BDCs monitored by Raymond James (data through Q3’21)
FDUS has generated excellent results compared to other industry participants

Capital. Partnership. Expertise.www.fdus.com
16
III. Portfolio & Financial Review

Capital. Partnership. Expertise.www.fdus.com
17
Measured Annual Portfolio Growth
(1) Portfolio count excludes residual investments in portfolio companies that have sold their underlying operations
Capital. Partnership. Expertise.www.fdus.com
18
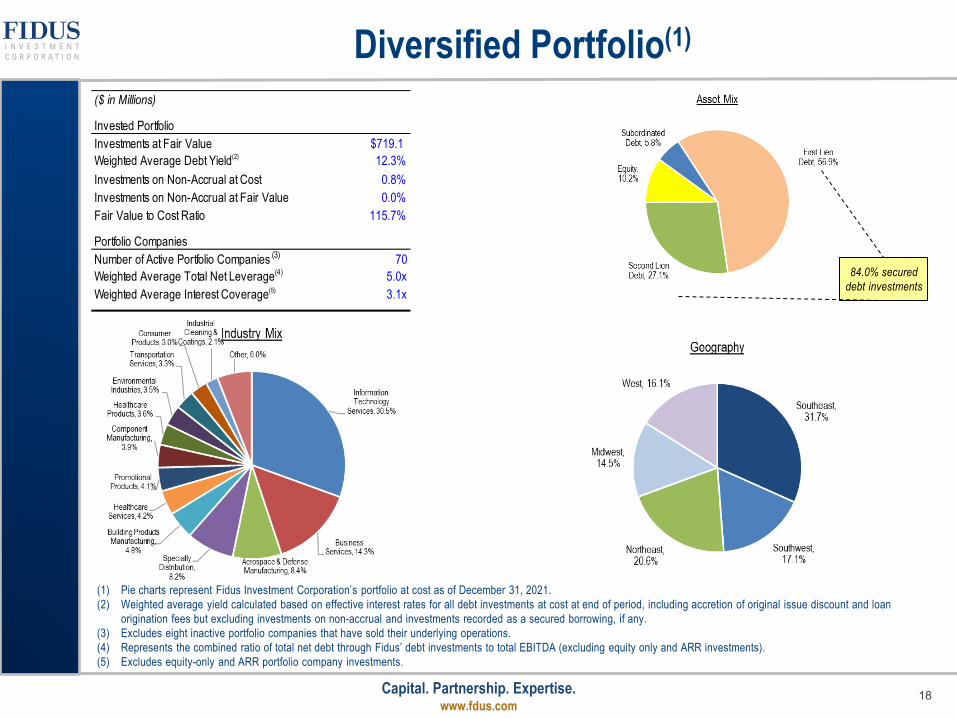
Diversified Portfolio(1)
(1) Pie charts represent Fidus Investment Corporation’s portfolio at cost as of December 31, 2021. (2) Weighted average yield calculated based on effective interest rates for all debt investments at cost at end of period, including accretion of original issue discount and loan
origination fees but excluding investments on non-accrual and investments recorded as a secured borrowing, if any. (3) Excludes eight inactive portfolio companies that have sold their underlying operations.(4) Represents the combined ratio of total net debt through Fidus’ debt investments to total EBITDA (excluding equity only and ARR investments).(5) Excludes equity-only and ARR portfolio company investments.
84.0% secured debt investments
($ in Millions)
Invested PortfolioInvestments at Fair Value $719.1Weighted Average Debt Yield(2) 12.3%Investments on Non-Accrual at Cost 0.8%Investments on Non-Accrual at Fair Value 0.0%Fair Value to Cost Ratio 115.7%
Portfolio CompaniesNumber of Active Portfolio Companies (3) 70Weighted Average Total Net Leverage(4) 5.0xWeighted Average Interest Coverage(5) 3.1x
Capital. Partnership. Expertise.www.fdus.com
19
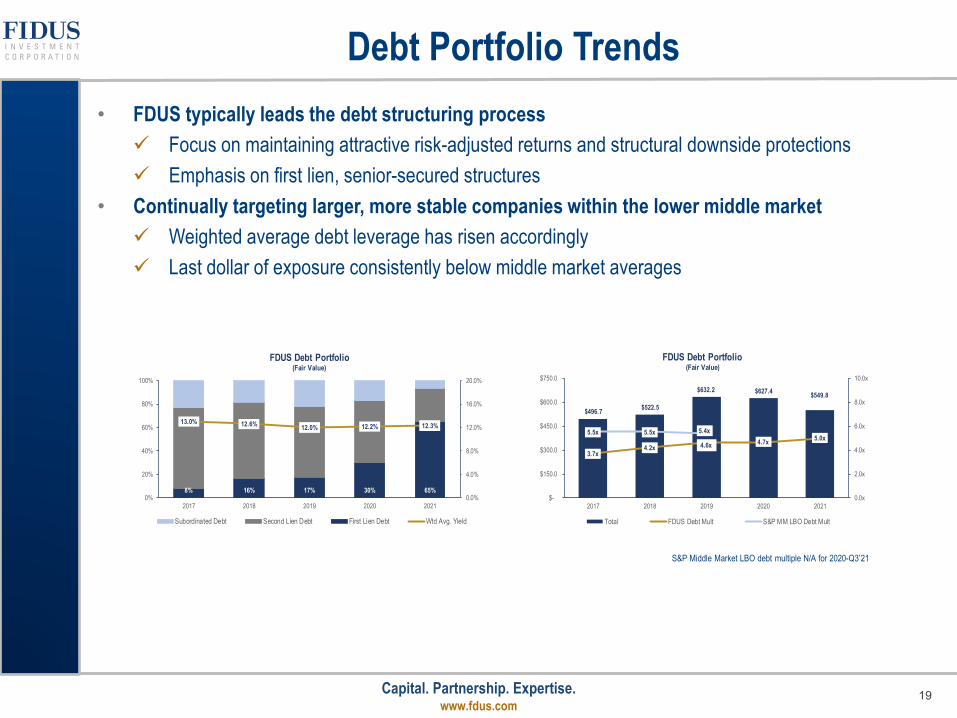
Debt Portfolio Trends• FDUS typically leads the debt structuring process Focus on maintaining attractive risk-adjusted returns and structural downside protections Emphasis on first lien, senior-secured structures
• Continually targeting larger, more stable companies within the lower middle market Weighted average debt leverage has risen accordingly Last dollar of exposure consistently below middle market averages
S&P Middle Market LBO debt multiple N/A for 2020-Q3’21
8% 16% 17% 30% 65%
13.0% 12.6% 12.0% 12.2% 12.3%
0.0%
4.0%
8.0%
12.0%
16.0%
20.0%
0%
20%
40%
60%
80%
100%
2017 2018 2019 2020 2021
FDUS Debt Portfolio(Fair Value)
Subordinated Debt Second Lien Debt First Lien Debt Wtd Avg. Yield
$496.7 $522.5
$632.2 $627.4 $549.8
3.7x4.2x 4.6x 4.7x 5.0x
5.5x 5.5x 5.4x
0.0x
2.0x
4.0x
6.0x
8.0x
10.0x
$-
$150.0
$300.0
$450.0
$600.0
$750.0
2017 2018 2019 2020 2021
FDUS Debt Portfolio(Fair Value)
Total FDUS Debt Mult S&P MM LBO Debt Mult
Capital. Partnership. Expertise.www.fdus.com
20
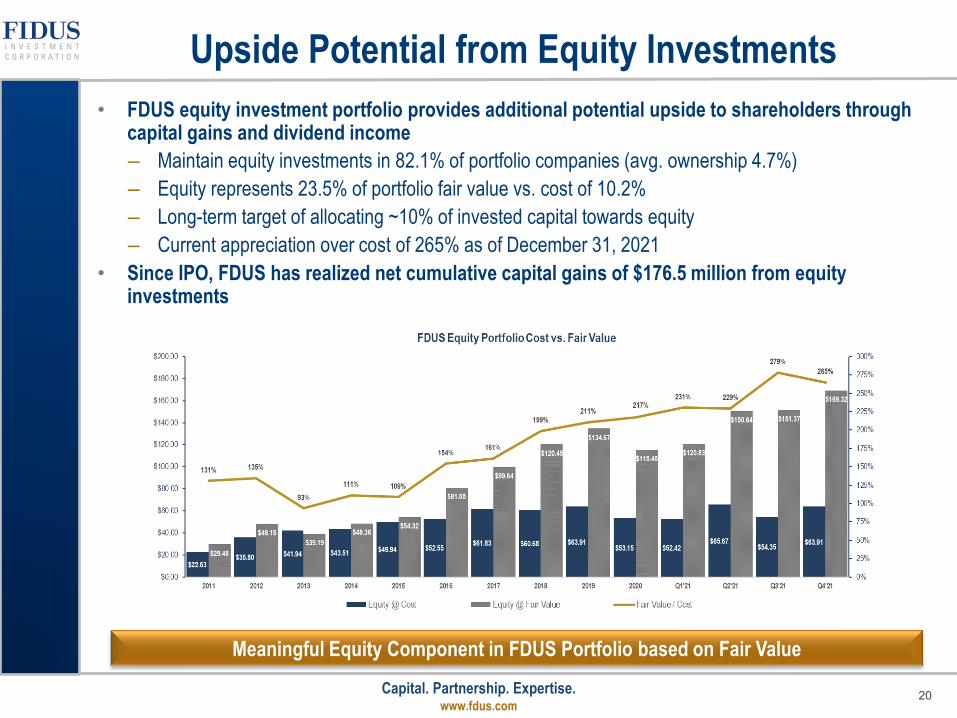
Upside Potential from Equity Investments• FDUS equity investment portfolio provides additional potential upside to shareholders through
capital gains and dividend income– Maintain equity investments in 82.1% of portfolio companies (avg. ownership 4.7%)– Equity represents 23.5% of portfolio fair value vs. cost of 10.2%– Long-term target of allocating ~10% of invested capital towards equity– Current appreciation over cost of 265% as of December 31, 2021
• Since IPO, FDUS has realized net cumulative capital gains of $176.5 million from equity investments
Meaningful Equity Component in FDUS Portfolio based on Fair Value
Capital. Partnership. Expertise.www.fdus.com
21
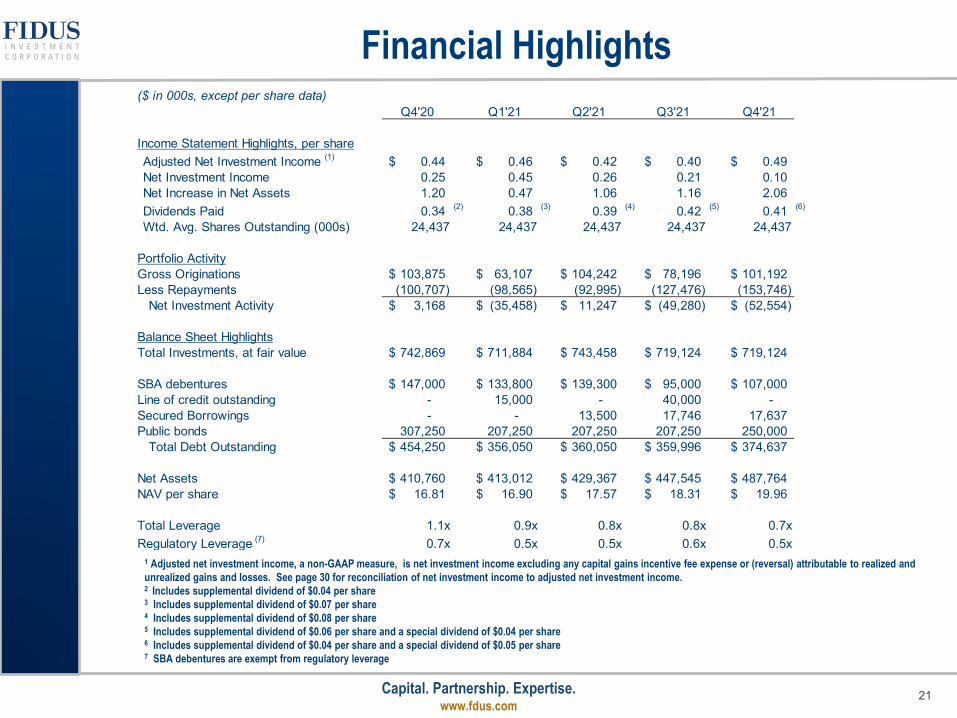
Financial Highlights
1 Adjusted net investment income, a non-GAAP measure, is net investment income excluding any capital gains incentive fee expense or (reversal) attributable to realized and unrealized gains and losses. See page 30 for reconciliation of net investment income to adjusted net investment income.2 Includes supplemental dividend of $0.04 per share3 Includes supplemental dividend of $0.07 per share4 Includes supplemental dividend of $0.08 per share5 Includes supplemental dividend of $0.06 per share and a special dividend of $0.04 per share6 Includes supplemental dividend of $0.04 per share and a special dividend of $0.05 per share7 SBA debentures are exempt from regulatory leverage
($ in 000s, except per share data)Q4'20 Q1'21 Q2'21 Q3'21 Q4'21
Income Statement Highlights, per shareAdjusted Net Investment Income (1) 0.44$ 0.46$ 0.42$ 0.40$ 0.49$ Net Investment Income 0.25 0.45 0.26 0.21 0.10 Net Increase in Net Assets 1.20 0.47 1.06 1.16 2.06 Dividends Paid 0.34 (2) 0.38 (3) 0.39 (4) 0.42 (5) 0.41 (6)
Wtd. Avg. Shares Outstanding (000s) 24,437 24,437 24,437 24,437 24,437
Portfolio ActivityGross Originations 103,875$ 63,107$ 104,242$ 78,196$ 101,192$ Less Repayments (100,707) (98,565) (92,995) (127,476) (153,746)
Net Investment Activity 3,168$ (35,458)$ 11,247$ (49,280)$ (52,554)$
Balance Sheet HighlightsTotal Investments, at fair value 742,869$ 711,884$ 743,458$ 719,124$ 719,124$
SBA debentures 147,000$ 133,800$ 139,300$ 95,000$ 107,000$ Line of credit outstanding - 15,000 - 40,000 - Secured Borrowings - - 13,500 17,746 17,637 Public bonds 307,250 207,250 207,250 207,250 250,000
Total Debt Outstanding 454,250$ 356,050$ 360,050$ 359,996$ 374,637$
Net Assets 410,760$ 413,012$ 429,367$ 447,545$ 487,764$ NAV per share 16.81$ 16.90$ 17.57$ 18.31$ 19.96$
Total Leverage 1.1x 0.9x 0.8x 0.8x 0.7xRegulatory Leverage (7) 0.7x 0.5x 0.5x 0.6x 0.5x
Capital. Partnership. Expertise.www.fdus.com
22
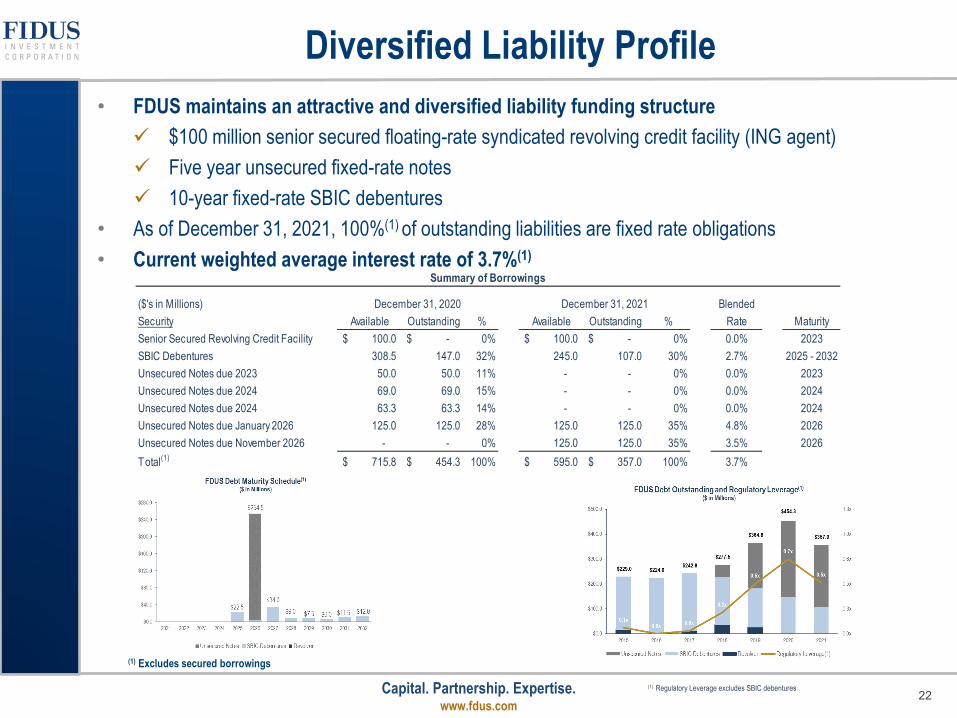
Diversified Liability Profile• FDUS maintains an attractive and diversified liability funding structure $100 million senior secured floating-rate syndicated revolving credit facility (ING agent) Five year unsecured fixed-rate notes 10-year fixed-rate SBIC debentures
• As of December 31, 2021, 100%(1) of outstanding liabilities are fixed rate obligations• Current weighted average interest rate of 3.7%(1)
(1) Regulatory Leverage excludes SBIC debentures
(1) Excludes secured borrowings
($'s in Millions) December 31, 2020 December 31, 2021 BlendedSecurity Available Outstanding % Available Outstanding % Rate MaturitySenior Secured Revolving Credit Facility 100.0$ -$ 0% 100.0$ -$ 0% 0.0% 2023SBIC Debentures 308.5 147.0 32% 245.0 107.0 30% 2.7% 2025 - 2032Unsecured Notes due 2023 50.0 50.0 11% - - 0% 0.0% 2023Unsecured Notes due 2024 69.0 69.0 15% - - 0% 0.0% 2024Unsecured Notes due 2024 63.3 63.3 14% - - 0% 0.0% 2024Unsecured Notes due January 2026 125.0 125.0 28% 125.0 125.0 35% 4.8% 2026Unsecured Notes due November 2026 - - 0% 125.0 125.0 35% 3.5% 2026Total(1) 715.8$ 454.3$ 100% 595.0$ 357.0$ 100% 3.7%
Summary of Borrowings

Capital. Partnership. Expertise.www.fdus.com
23
IV. Conclusion

Capital. Partnership. Expertise.www.fdus.com
24
Why Invest in FDUS?
Highly Experienced Team:
Disciplined Investment Strategy & Process:
• Fidus’ principals average more than 25 years of professional experience. The core investment team has worked together for over 20 years.
• Focus on seasoned, smaller and lower middle market companies in underserved capital markets / industries with a history of generating revenue and positive cash flow.
• Differentiated investment strategy focused on preservation of capital while generating attractive risk-adjusted returns.
• Highly disciplined and comprehensive investment and risk management process.
Deal Origination Network in Attractive Lower Middle-Market:
• Focused on the lower middle market since its founding over twelve years ago.• Lower middle market offers significant opportunity for attractive risk-adjusted returns.• Well established direct origination network with private equity (“PE”) firms, independent sponsors,
intermediaries, and lending partners drives repeat business.• Highly selective deal screening process (5-year average of ~ 630 transactions reviewed annually with an
investment close rate less than 2%).• Three regional offices (Charlotte, Evanston, and New York) allow for nation-wide deal sourcing, supported by
strong regional relationships.
Proven Investment Track Record:
• Attractive 7.1% dividend yield1 based on annualized regular dividend of $1.28 per share. Spillover income of $1.56 per share as of December 31, 2021.
• Average annual GAAP ROE of 12.4%, consistently exceeding average BDC performance (Raymond James2).
• Strong balance sheet and liquidity position support portfolio growth.• SBIC debt provides lower cost of debt capital.
Dividends & NAV Upside• Primarily current cash income with additional return from origination and structuring fees.• Monetization of mature equity investments a key driver of net investment income growth.• Potential upside through equity distributions and appreciation.
(1) Closing price of $17.98 on December 31, 2021(2) Raymond James Weekly BDC Report, February 6, 2021, page 6
Capital. Partnership. Expertise.www.fdus.com
25
Appendices
Capital. Partnership. Expertise.www.fdus.com
26
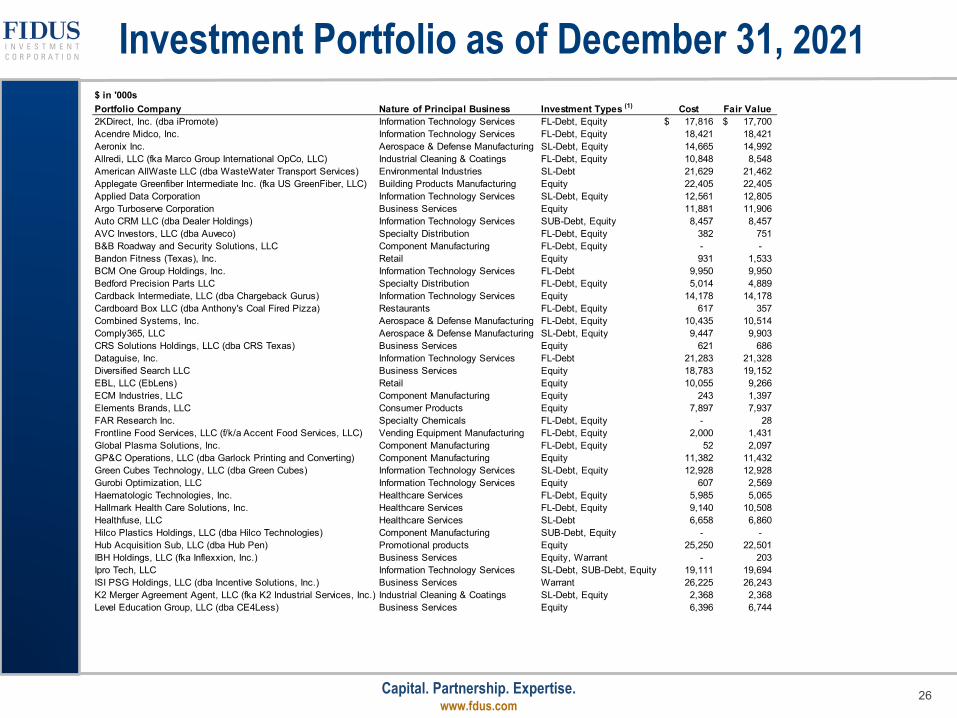
Investment Portfolio as of December 31, 2021$ in '000sPortfolio Company Nature of Principal Business Investment Types (1) Cost Fair Value2KDirect, Inc. (dba iPromote) Information Technology Services FL-Debt, Equity 17,816$ 17,700$ Acendre Midco, Inc. Information Technology Services FL-Debt, Equity 18,421 18,421 Aeronix Inc. Aerospace & Defense Manufacturing SL-Debt, Equity 14,665 14,992 Allredi, LLC (fka Marco Group International OpCo, LLC) Industrial Cleaning & Coatings FL-Debt, Equity 10,848 8,548 American AllWaste LLC (dba WasteWater Transport Services) Environmental Industries SL-Debt 21,629 21,462 Applegate Greenfiber Intermediate Inc. (fka US GreenFiber, LLC) Building Products Manufacturing Equity 22,405 22,405 Applied Data Corporation Information Technology Services SL-Debt, Equity 12,561 12,805 Argo Turboserve Corporation Business Services Equity 11,881 11,906 Auto CRM LLC (dba Dealer Holdings) Information Technology Services SUB-Debt, Equity 8,457 8,457 AVC Investors, LLC (dba Auveco) Specialty Distribution FL-Debt, Equity 382 751 B&B Roadway and Security Solutions, LLC Component Manufacturing FL-Debt, Equity - - Bandon Fitness (Texas), Inc. Retail Equity 931 1,533 BCM One Group Holdings, Inc. Information Technology Services FL-Debt 9,950 9,950 Bedford Precision Parts LLC Specialty Distribution FL-Debt, Equity 5,014 4,889 Cardback Intermediate, LLC (dba Chargeback Gurus) Information Technology Services Equity 14,178 14,178 Cardboard Box LLC (dba Anthony's Coal Fired Pizza) Restaurants FL-Debt, Equity 617 357 Combined Systems, Inc. Aerospace & Defense Manufacturing FL-Debt, Equity 10,435 10,514 Comply365, LLC Aerospace & Defense Manufacturing SL-Debt, Equity 9,447 9,903 CRS Solutions Holdings, LLC (dba CRS Texas) Business Services Equity 621 686 Dataguise, Inc. Information Technology Services FL-Debt 21,283 21,328 Diversified Search LLC Business Services Equity 18,783 19,152 EBL, LLC (EbLens) Retail Equity 10,055 9,266 ECM Industries, LLC Component Manufacturing Equity 243 1,397 Elements Brands, LLC Consumer Products Equity 7,897 7,937 FAR Research Inc. Specialty Chemicals FL-Debt, Equity - 28 Frontline Food Services, LLC (f/k/a Accent Food Services, LLC) Vending Equipment Manufacturing FL-Debt, Equity 2,000 1,431 Global Plasma Solutions, Inc. Component Manufacturing FL-Debt, Equity 52 2,097 GP&C Operations, LLC (dba Garlock Printing and Converting) Component Manufacturing Equity 11,382 11,432 Green Cubes Technology, LLC (dba Green Cubes) Information Technology Services SL-Debt, Equity 12,928 12,928 Gurobi Optimization, LLC Information Technology Services Equity 607 2,569 Haematologic Technologies, Inc. Healthcare Services FL-Debt, Equity 5,985 5,065 Hallmark Health Care Solutions, Inc. Healthcare Services FL-Debt, Equity 9,140 10,508 Healthfuse, LLC Healthcare Services SL-Debt 6,658 6,860 Hilco Plastics Holdings, LLC (dba Hilco Technologies) Component Manufacturing SUB-Debt, Equity - - Hub Acquisition Sub, LLC (dba Hub Pen) Promotional products Equity 25,250 22,501 IBH Holdings, LLC (fka Inflexxion, Inc.) Business Services Equity, Warrant - 203 Ipro Tech, LLC Information Technology Services SL-Debt, SUB-Debt, Equity 19,111 19,694 ISI PSG Holdings, LLC (dba Incentive Solutions, Inc.) Business Services Warrant 26,225 26,243 K2 Merger Agreement Agent, LLC (fka K2 Industrial Services, Inc.) Industrial Cleaning & Coatings SL-Debt, Equity 2,368 2,368 Level Education Group, LLC (dba CE4Less) Business Services Equity 6,396 6,744
Capital. Partnership. Expertise.www.fdus.com
27
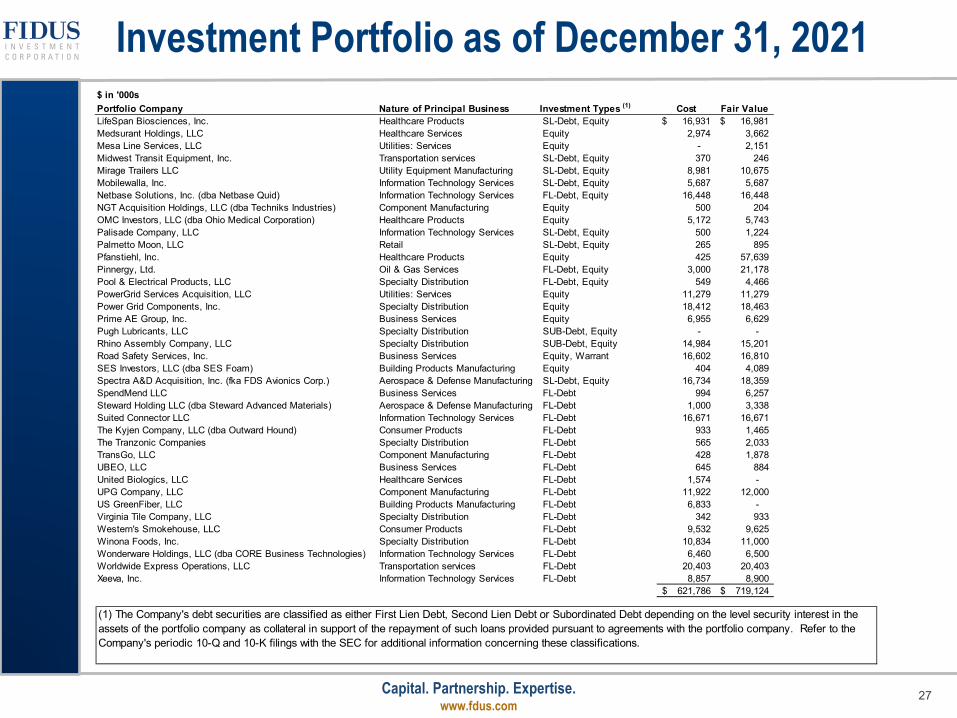
Investment Portfolio as of December 31, 2021
(1) The Company's debt securities are classified as either First Lien Debt, Second Lien Debt or Subordinated Debt depending on the level security interest in the assets of the portfolio company as collateral in support of the repayment of such loans provided pursuant to agreements with the portfolio company. Refer to the Company's periodic 10-Q and 10-K filings with the SEC for additional information concerning these classifications.
$ in '000sPortfolio Company Nature of Principal Business Investment Types (1) Cost Fair ValueLifeSpan Biosciences, Inc. Healthcare Products SL-Debt, Equity 16,931$ 16,981$ Medsurant Holdings, LLC Healthcare Services Equity 2,974 3,662 Mesa Line Services, LLC Utilities: Services Equity - 2,151 Midwest Transit Equipment, Inc. Transportation services SL-Debt, Equity 370 246 Mirage Trailers LLC Utility Equipment Manufacturing SL-Debt, Equity 8,981 10,675 Mobilewalla, Inc. Information Technology Services SL-Debt, Equity 5,687 5,687 Netbase Solutions, Inc. (dba Netbase Quid) Information Technology Services FL-Debt, Equity 16,448 16,448 NGT Acquisition Holdings, LLC (dba Techniks Industries) Component Manufacturing Equity 500 204 OMC Investors, LLC (dba Ohio Medical Corporation) Healthcare Products Equity 5,172 5,743 Palisade Company, LLC Information Technology Services SL-Debt, Equity 500 1,224 Palmetto Moon, LLC Retail SL-Debt, Equity 265 895 Pfanstiehl, Inc. Healthcare Products Equity 425 57,639 Pinnergy, Ltd. Oil & Gas Services FL-Debt, Equity 3,000 21,178 Pool & Electrical Products, LLC Specialty Distribution FL-Debt, Equity 549 4,466 PowerGrid Services Acquisition, LLC Utilities: Services Equity 11,279 11,279 Power Grid Components, Inc. Specialty Distribution Equity 18,412 18,463 Prime AE Group, Inc. Business Services Equity 6,955 6,629 Pugh Lubricants, LLC Specialty Distribution SUB-Debt, Equity - - Rhino Assembly Company, LLC Specialty Distribution SUB-Debt, Equity 14,984 15,201 Road Safety Services, Inc. Business Services Equity, Warrant 16,602 16,810 SES Investors, LLC (dba SES Foam) Building Products Manufacturing Equity 404 4,089 Spectra A&D Acquisition, Inc. (fka FDS Avionics Corp.) Aerospace & Defense Manufacturing SL-Debt, Equity 16,734 18,359 SpendMend LLC Business Services FL-Debt 994 6,257 Steward Holding LLC (dba Steward Advanced Materials) Aerospace & Defense Manufacturing FL-Debt 1,000 3,338 Suited Connector LLC Information Technology Services FL-Debt 16,671 16,671 The Kyjen Company, LLC (dba Outward Hound) Consumer Products FL-Debt 933 1,465 The Tranzonic Companies Specialty Distribution FL-Debt 565 2,033 TransGo, LLC Component Manufacturing FL-Debt 428 1,878 UBEO, LLC Business Services FL-Debt 645 884 United Biologics, LLC Healthcare Services FL-Debt 1,574 - UPG Company, LLC Component Manufacturing FL-Debt 11,922 12,000 US GreenFiber, LLC Building Products Manufacturing FL-Debt 6,833 - Virginia Tile Company, LLC Specialty Distribution FL-Debt 342 933 Western's Smokehouse, LLC Consumer Products FL-Debt 9,532 9,625 Winona Foods, Inc. Specialty Distribution FL-Debt 10,834 11,000 Wonderware Holdings, LLC (dba CORE Business Technologies) Information Technology Services FL-Debt 6,460 6,500 Worldwide Express Operations, LLC Transportation services FL-Debt 20,403 20,403 Xeeva, Inc. Information Technology Services FL-Debt 8,857 8,900
621,786$ 719,124$

Capital. Partnership. Expertise.www.fdus.com
28
Statements of Assets & Liabilities($ in 000s, except per share data)
Q4'20 Q1'21 Q2'21 Q3'21 Q4'21
Investments, at fair valueControl Investments 28,253$ 22,566$ 61,168$ 43,284$ 2,151$ Affiliate Investments 81,394 96,014 92,639 107,053 137,284Non-control/Non-affiliate Investments 633,222 593,304 589,651 568,787 579,689 Total Investments $742,869 $711,884 $743,458 $719,124 $719,124
Cash & Cash Equivalents 124,308 60,175 54,211 98,812 169,417Other Assets 8,563 8,824 10,011 9,830 8,644 Total Assets $875,740 $780,883 $807,680 $827,766 $897,185
Long-Term Debt 454,250$ 356,050$ 346,550$ 342,250$ 357,000$ Less: Deferred Financing Costs (11,000) (8,319) (8,669) (7,671) (8,601) Other Liabilities 21,730 20,140 40,432 45,642 61,022 Total Liabilities 464,980 367,871 378,313 380,221 409,421
Net Assets $410,760 $413,012 $429,367 $447,545 $487,764
NAV Per Common Share $16.81 $16.90 $17.57 $18.31 $19.96
Capital. Partnership. Expertise.www.fdus.com
29
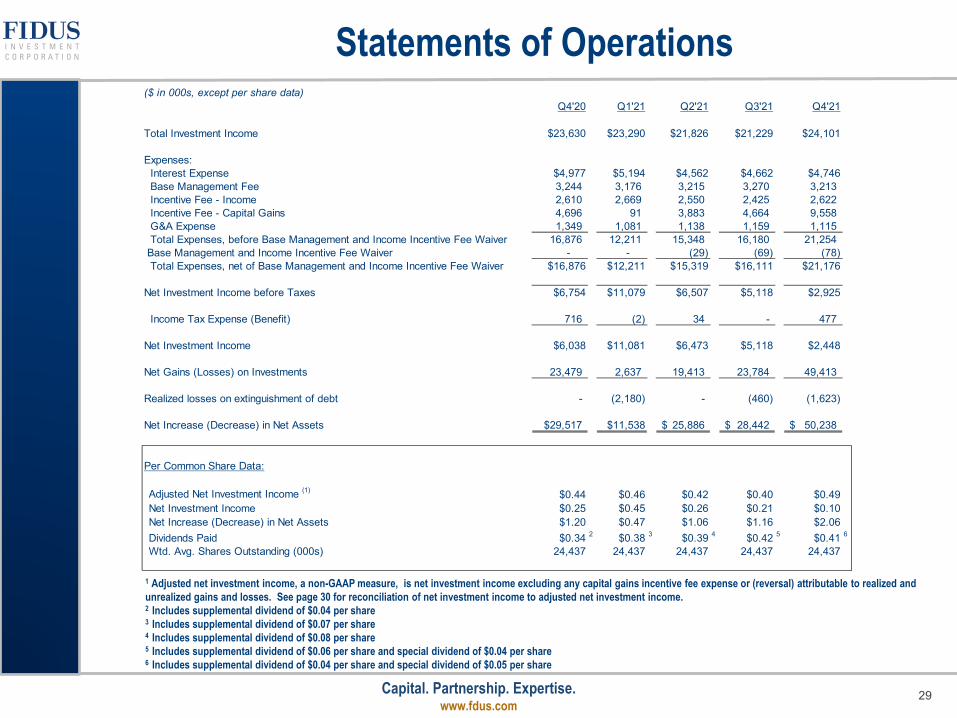
Statements of Operations
1 Adjusted net investment income, a non-GAAP measure, is net investment income excluding any capital gains incentive fee expense or (reversal) attributable to realized and unrealized gains and losses. See page 30 for reconciliation of net investment income to adjusted net investment income.2 Includes supplemental dividend of $0.04 per share3 Includes supplemental dividend of $0.07 per share4 Includes supplemental dividend of $0.08 per share5 Includes supplemental dividend of $0.06 per share and special dividend of $0.04 per share6 Includes supplemental dividend of $0.04 per share and special dividend of $0.05 per share
($ in 000s, except per share data)Q4'20 Q1'21 Q2'21 Q3'21 Q4'21
Total Investment Income $23,630 $23,290 $21,826 $21,229 $24,101
Expenses: Interest Expense $4,977 $5,194 $4,562 $4,662 $4,746 Base Management Fee 3,244 3,176 3,215 3,270 3,213 Incentive Fee - Income 2,610 2,669 2,550 2,425 2,622 Incentive Fee - Capital Gains 4,696 91 3,883 4,664 9,558 G&A Expense 1,349 1,081 1,138 1,159 1,115 Total Expenses, before Base Management and Income Incentive Fee Waiver 16,876 12,211 15,348 16,180 21,254 Base Management and Income Incentive Fee Waiver - - (29) (69) (78) Total Expenses, net of Base Management and Income Incentive Fee Waiver $16,876 $12,211 $15,319 $16,111 $21,176
Net Investment Income before Taxes $6,754 $11,079 $6,507 $5,118 $2,925
Income Tax Expense (Benefit) 716 (2) 34 - 477
Net Investment Income $6,038 $11,081 $6,473 $5,118 $2,448
Net Gains (Losses) on Investments 23,479 2,637 19,413 23,784 49,413
Realized losses on extinguishment of debt - (2,180) - (460) (1,623)
Net Increase (Decrease) in Net Assets $29,517 $11,538 25,886$ 28,442$ 50,238$
Per Common Share Data:
Adjusted Net Investment Income (1) $0.44 $0.46 $0.42 $0.40 $0.49Net Investment Income $0.25 $0.45 $0.26 $0.21 $0.10Net Increase (Decrease) in Net Assets $1.20 $0.47 $1.06 $1.16 $2.06Dividends Paid $0.34 2 $0.38 3 $0.39 4 $0.42 5 $0.41 6
Wtd. Avg. Shares Outstanding (000s) 24,437 24,437 24,437 24,437 24,437
Capital. Partnership. Expertise.www.fdus.com
30
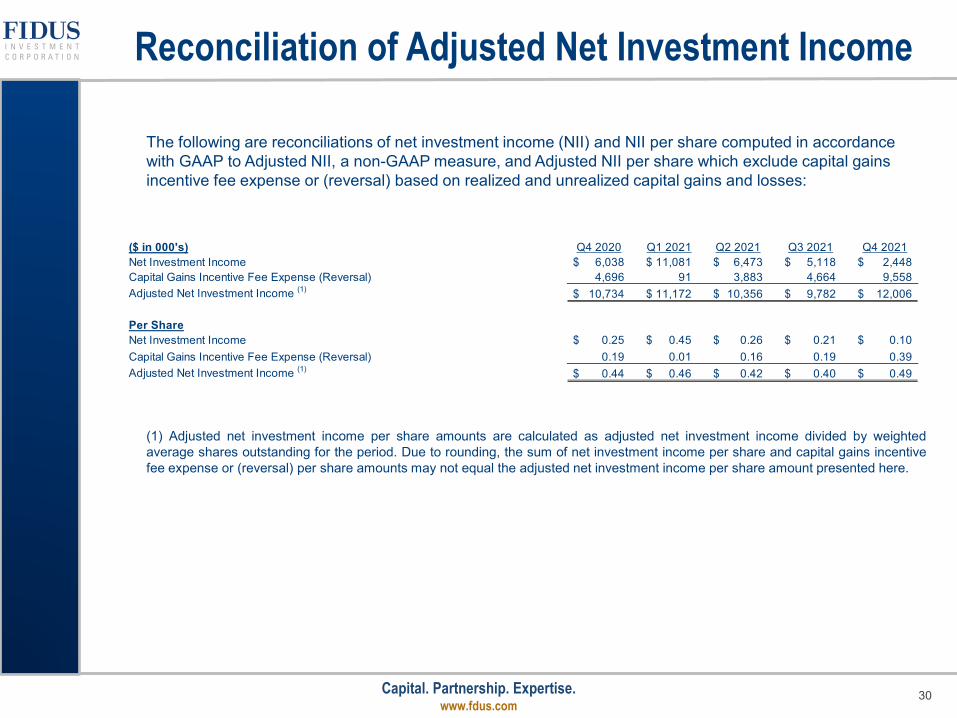
Reconciliation of Adjusted Net Investment Income
The following are reconciliations of net investment income (NII) and NII per share computed in accordance with GAAP to Adjusted NII, a non-GAAP measure, and Adjusted NII per share which exclude capital gains incentive fee expense or (reversal) based on realized and unrealized capital gains and losses:
(1) Adjusted net investment income per share amounts are calculated as adjusted net investment income divided by weightedaverage shares outstanding for the period. Due to rounding, the sum of net investment income per share and capital gains incentivefee expense or (reversal) per share amounts may not equal the adjusted net investment income per share amount presented here.
($ in 000's) Q4 2020 Q1 2021 Q2 2021 Q3 2021 Q4 2021Net Investment Income 6,038$ 11,081$ 6,473$ 5,118$ 2,448$ Capital Gains Incentive Fee Expense (Reversal) 4,696 91 3,883 4,664 9,558 Adjusted Net Investment Income (1) 10,734$ 11,172$ 10,356$ 9,782$ 12,006$
Per ShareNet Investment Income 0.25$ 0.45$ 0.26$ 0.21$ 0.10$ Capital Gains Incentive Fee Expense (Reversal) 0.19 0.01 0.16 0.19 0.39 Adjusted Net Investment Income (1) 0.44$ 0.46$ 0.42$ 0.40$ 0.49$
Capital. Partnership. Expertise.www.fdus.com
31
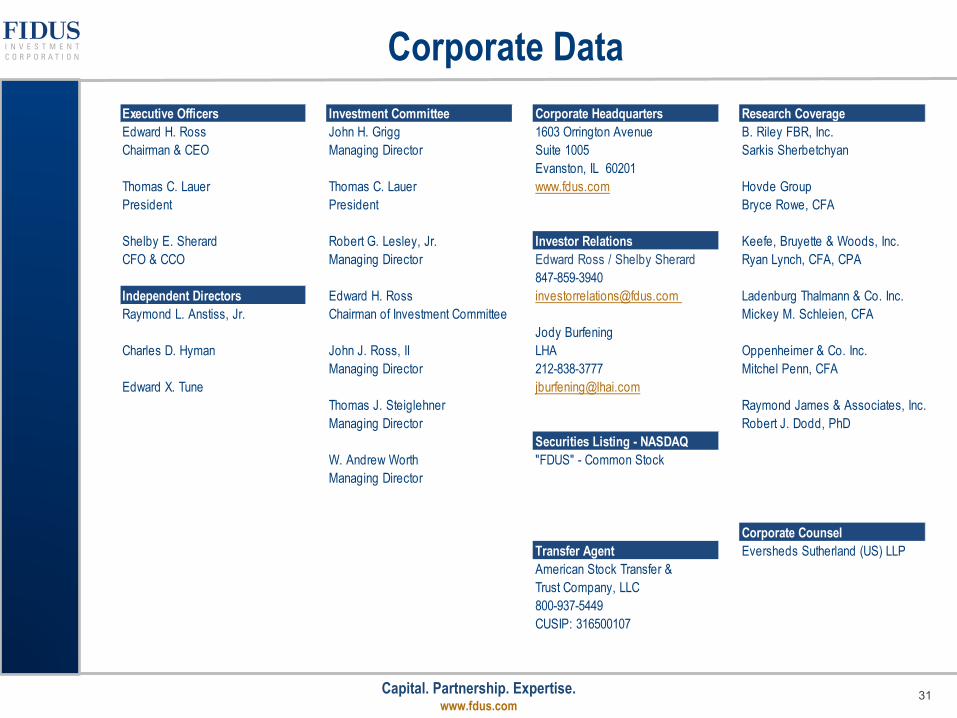
Corporate Data Executive Officers Investment Committee Corporate Headquarters Research CoverageEdward H. Ross John H. Grigg 1603 Orrington Avenue B. Riley FBR, Inc.Chairman & CEO Managing Director Suite 1005 Sarkis Sherbetchyan
Evanston, IL 60201Thomas C. Lauer Thomas C. Lauer www.fdus.com Hovde GroupPresident President Bryce Rowe, CFA
Shelby E. Sherard Robert G. Lesley, Jr. Investor Relations Keefe, Bruyette & Woods, Inc.CFO & CCO Managing Director Edward Ross / Shelby Sherard Ryan Lynch, CFA, CPA
847-859-3940Independent Directors Edward H. Ross [email protected] Ladenburg Thalmann & Co. Inc.Raymond L. Anstiss, Jr. Chairman of Investment Committee Mickey M. Schleien, CFA
Jody BurfeningCharles D. Hyman John J. Ross, II LHA Oppenheimer & Co. Inc.
Managing Director 212-838-3777 Mitchel Penn, CFAEdward X. Tune [email protected]
Thomas J. Steiglehner Raymond James & Associates, Inc.Managing Director Robert J. Dodd, PhD
Securities Listing - NASDAQW. Andrew Worth "FDUS" - Common StockManaging Director
Corporate CounselTransfer Agent Eversheds Sutherland (US) LLPAmerican Stock Transfer &Trust Company, LLC800-937-5449CUSIP: 316500107
Capital. Partnership. Expertise.www.fdus.com