NASA TECHNICAL NOTE NASA TN 0-6987 · PDF file · 2013-08-31NASA TECHNICAL NOTE...
42
I NASA TECHNICAL NOTE NASA TN 0-6987 1 h 00 o* *o m C LOCAL FLOW MEASUREMENTS AT THE INLET SPIKE TIP OF A MACH 3 SUPERSONIC CRUISE AIRPLANE by Harold J. Y lohnson and Earl J. Montoya Flight Research Center Edwards, Cali$ 93523 NATIONAL AERONAUTICS AND SPACE ADMINISTRATION 0 WASHINGTON, D. C. 0 MAY 1973 https://ntrs.nasa.gov/search.jsp?R=19730015310 2018-05-22T10:42:12+00:00Z
Transcript of NASA TECHNICAL NOTE NASA TN 0-6987 · PDF file · 2013-08-31NASA TECHNICAL NOTE...

I
N A S A TECHNICAL NOTE N A S A T N 0-6987
1
h 00 o* *o
m
C
LOCAL FLOW MEASUREMENTS AT THE INLET SPIKE TIP OF A MACH 3 SUPERSONIC CRUISE AIRPLANE
by Harold J. Y lohnson and Earl J. Montoya
Flight Research Center Edwards, Cali$ 93523
NATIONAL AERONAUTICS AND SPACE ADMINISTRATION 0 WASHINGTON, D. C. 0 MAY 1973
https://ntrs.nasa.gov/search.jsp?R=19730015310 2018-05-22T10:42:12+00:00Z
1. Report No.
NASA TN D-6987 2. Government Accession No. 3. Recipient's Catalog No.
2. Sponsoring Agency Name and Address
National Aeronautics and Space Administration Washington, D. C. 20546
4. Title and Subtitle
SUPERSONIC CRUISE AIRPLANE LOCAL FLOW MEASUREMENTS AT THE INLET SPIKE TIP OF A MACH 3
14. Sponsoring Agency Code
5. Report Date
6. Performing Organization Code
May 1973
I 5. Supplementary Notes
7. Author(s)
Harold J. Johnson and Earl J. Montoya
9. Performing Organization Name and Address NASA Flight Research Center P. 0. Box273 Edwards, California 93523
6. Abstract
8. Performing Organization Report No.
H-722 10. Work Unit No.
761-74-01-00-24 11. Contract or Grant No.
13. Type of Report and Period Covered
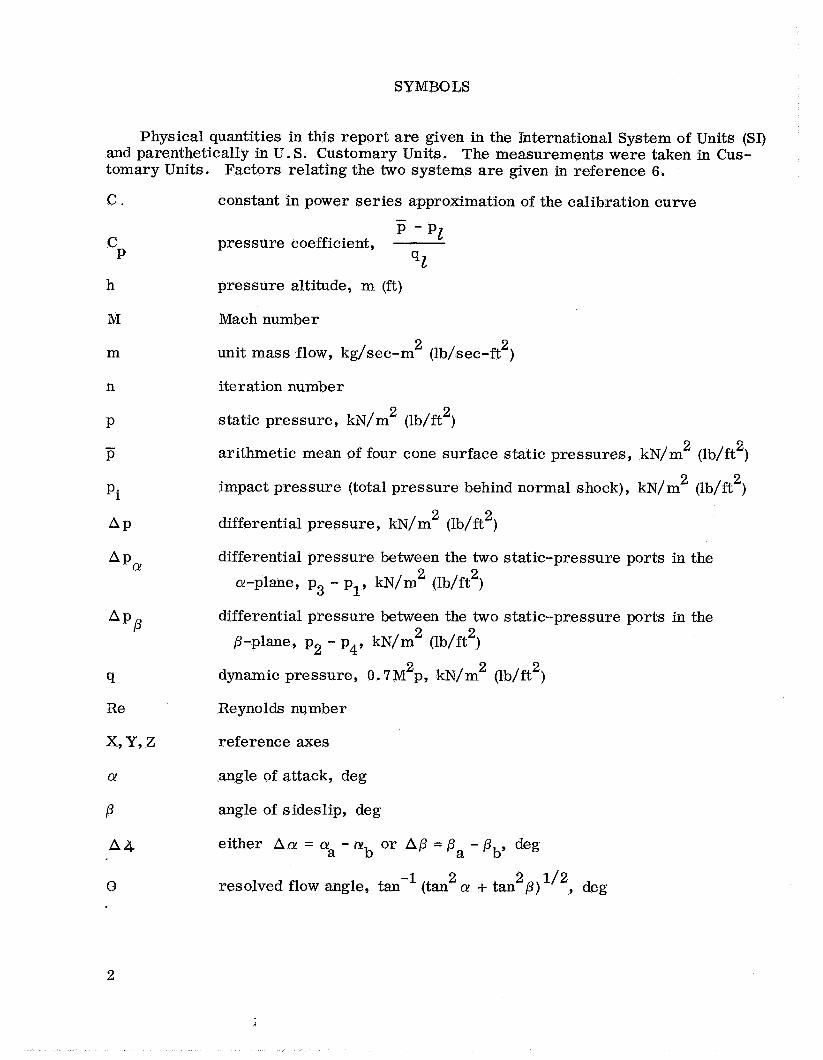
The flow field at the left inlet spike tip of a YF-12A airplane was examined using a 26' included angle conical flow sensor to obtain measurements at free- stream Mach numbers from 1.6 to 3.0. Local flow angularity, Mach number, impact pressure, and mass flow were determined and compared with free- stream values.
' this page)
Local flow changes occurred at the same time as free-stream changes. The local flow usually approached the spike centerline from the upper outboard side because of spike cant and toe-in. Free-stream Mach number influenced the local flow angularity; as Mach number increased above 2.2, local angle of attack increased and local sideslip angle decreased.
Local Mach number was generally 3 percent less than free-stream Mach number. Impact-pressure ratio and mass flow ratio increased as free-stream Mach number increased above 2.2, indicating a beneficial forebody compression effect.
No degradation of the spike tip instrumentation was observed after more than 40 flights in the high-speed thermal environment encountered by the airplm-e. The sensor is rugged, simple, and sensitive to small flow changes. It can pro- vide accurate inputs necessary to control an inlet.
21. NO. of Pages 22. Price"
40 $3.00
17. Key Words (Suggested by Author(s))
Local flow YF-12A airplane High-temperature instrumentation
19. Security Classif. (of this report)
Unclassified
20. Security Classif.
Unclassified
18. Distribution Statement
unclassified - Unlimited
* For sale by the National Technical Information Service, Springfield, Virginia 22151
d

LOCAL FLOW MEASUREMENTS AT THE INLET SPIKE TIP OF A
MACH 3 SUPERSONIC CRUISE AIRPLANE
Harold J. Johnson and Earl J. Montoya Flight Research Center
INTRODUCTION
Local flow conditions at the inlet of a supersonic jet aircraft are often considerably different from free-stream conditions because of forebody effects. In wind-tunnel inlet-engine testing, test section size limitations often make it impossible to mount the forebody ahead of the inlet for a model of any significant scale. The forebody often generates flow gradients which the inlet encounters. Therefore, to compare data from flight tests with data from wind-tunnel tests conducted without forebodies, local flow conditions at the inlet during flight tests must be determined as accurately as possible. Equivalent flight and wind-tunnel test conditions can be obtained by correlating local and free-stream Mach numbers, angle of attack, and angle of sideslip.
The current joint NASA-U. S. Air Force YF-12A aircraft propulsion system invesli- gation at Edwards Ai r Force Base, Calif. ance data with data from wind-tunnel tests of an isolated inlet model without the air- plane' s forebody. To assure that test conditions for the airplane and the wind-tunnel model were equivalent, a 26O included angle conical pressure probe for obtaining local flow data was designed and fabricated to replace the YF-12 inlet spike tip.
requires correlation of flight inlet perform-
The feasibility of using conical pressure probes to survey flow fields was demonstra- ted in references 1 to 5. References 1 to 3 describe small cones which were used to avoid disturbing the flow field being surveyed in a wind tunnel. These cones had large orifices relative to the size of the cone, which caused deviations from a theoretical inviscid sharp cone calibration. The calibration of a larger cone, which was flight-tested on the X-15 aircraft and is described in reference 5, agreed well with the sharp cone theory.
U s e of the tip of the YF-12 inlet centerbody cone as a local flow sensor made a special calibration necessary. A full-scale cone, geometrically similar to the flight- tested cone, was instrumented and tested in the Unitary Plan Wind Tunnel at the NASA Langley Research Center. These tests covered a range of supersonic Mach numbers at various incidence angles and at two Reynolds numbers. Details of these calibration tests are presented in the appendix.
This report presents the characteristics of the local flow at the inlet spike tip of a YF-12A airplane over a free-stream Mach number range of 1.6 to 3 . 0 and at Reynolds .
numbers from 3.94 x 1 0 to 10.18 x 10 per meter (1.2 x l o 6 to 3.1 x l o 6 per foot) for steady-state and quasi-steady-state flight conditions.
6 6
d
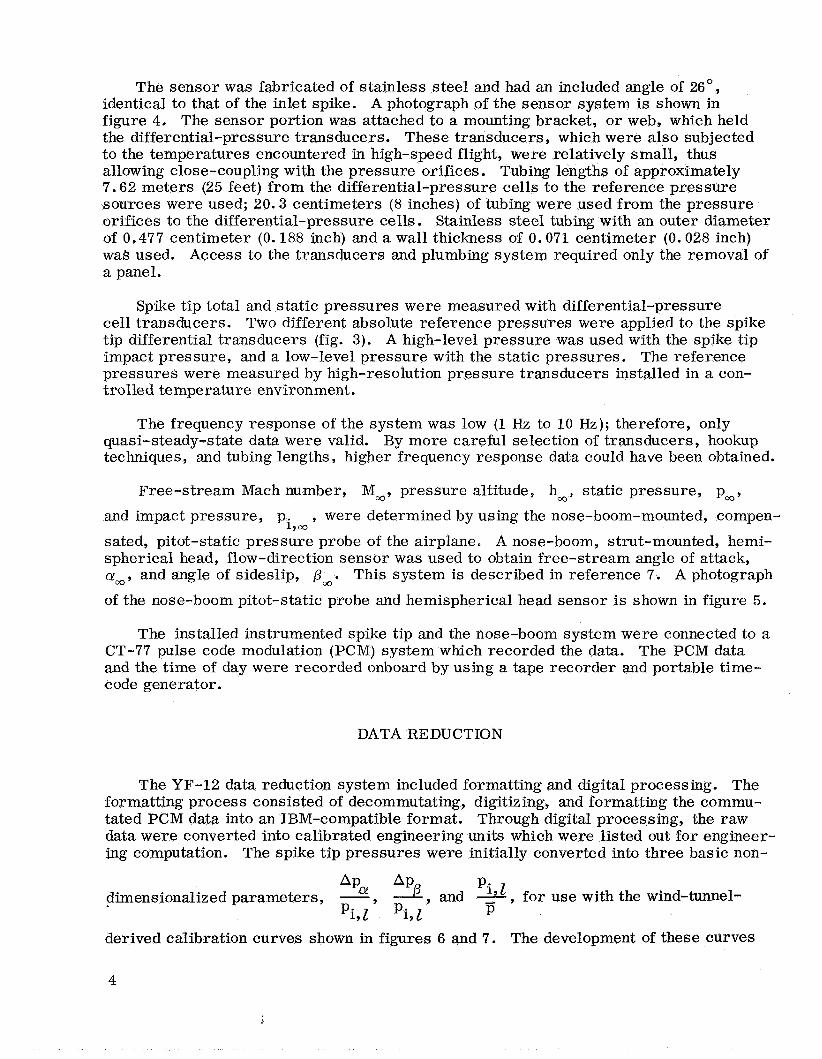
SYMBOLS
Physical quantities in this report are given in the International System of Units (SI) and parenthetically in U. S. Customary Units. The measurements were taken in Cus- tomary Units. Factors relating the two systems are given in reference 6.
C .
C
h
M
m
n
P
P
P
Pi
A P
A p P
q
Re
X, Y, Z
a
P
A 4
e
2
constant in power series approximation of the calibration curve
pressure coefficient,
pressure altitude, m (ft)
- P - PI
qI
Mach number
unit mass flow, kg/sec-m (lb/sec-ft ) 2 2
iteration number 2 2 static pressure, kN/m (lb/ft )
2 2 arithmetic mean of four cone surface static pressures, kN/m (lb/ft )
2 2 impact pressure (total pressure behind normal shock), kN/m (lb/ft )
2 2 differential pressure, kN/m (lb/ft )
differential pressure between the two static-pressure a-plane, p3 - ply kN/m 2 (lb/ft 2 )
differential pressure between the two static-pressure 2 2
P-plane, p2 - p4, kN/m (Wft ) 2 2 dynamic pressure, 0 . 7 M p, kN/m
Reynolds number
reference axes
angle of attack, deg
angle of sideslip, deg
(lb/ft2)
either A a = a 0' AP = Pa - Pb9 deg a - O b 2 2 1/2 resolved flow angle, tan-l(tan a + t a n P ) , deg
ports in the
ports in the

Subscripts:
a,b points on a line (see appendix)
relative to airplane centerline (2 hr high reference
i impact (behind normal shock)
lr low reference
2 local condition (fig. 9)
WP relative to wing reference plane
1 , 2 , 3 , 4 position of surface static-pressure orifice on cone
CY condition in the vertical plane
P condition in the horizontal plane
ca f re e-s tre am condition
AIRPLANE
The YF-12A airplane, shown in figure 1, is a prototype interceptor aircraft capable of cruising at speeds in excess of Mach 3 and at altitudes greater than 24,400 meters (80,000 feet). The axisymmetric, mixed-compression inlet has a movable spike as part of the inlet control system. The spike is canted down 5.63' from the wing reference plane and toed in 3.25' from the airplane and nacelle centerline. A three-view drawing of the airplane showing the location of the conical flow sensor at the left inlet spike tip is presented in figure 2.
INSTRUMENTATION
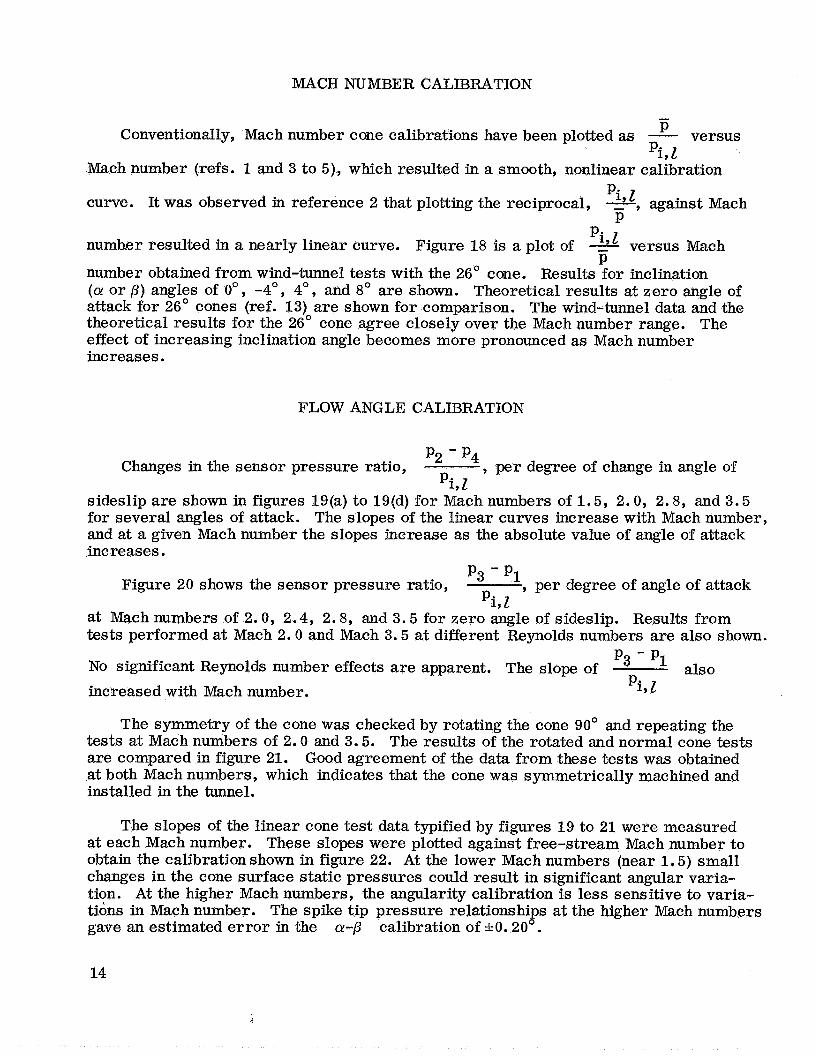
A drawing of the spike tip conical flow sensor and pressure measurement hookup is shown in figure 3. The cone had a nose impact-pressure orifice and four surface static- pressure orifices positioned 90' apart. The hookup technique permitted direct measure- ment of the differential pressures between the two static-pressure ports in the @- and p-planes. Absolute-pressure levels were obtained by adding the local static and impact differential pressures to the appropriate reference pressures.
The sensor was designed to meet several requirements. Because it was to replace a spike tip on a YF-12 airplane, the disturbance it caused in the inlet flow field and . shock wave system had to be minimal so that inlet performance would not be degraded. It had to be able to withstand high local vibratory g-loads and soak temperatures well in excess of 316' C (600' F).
3
d
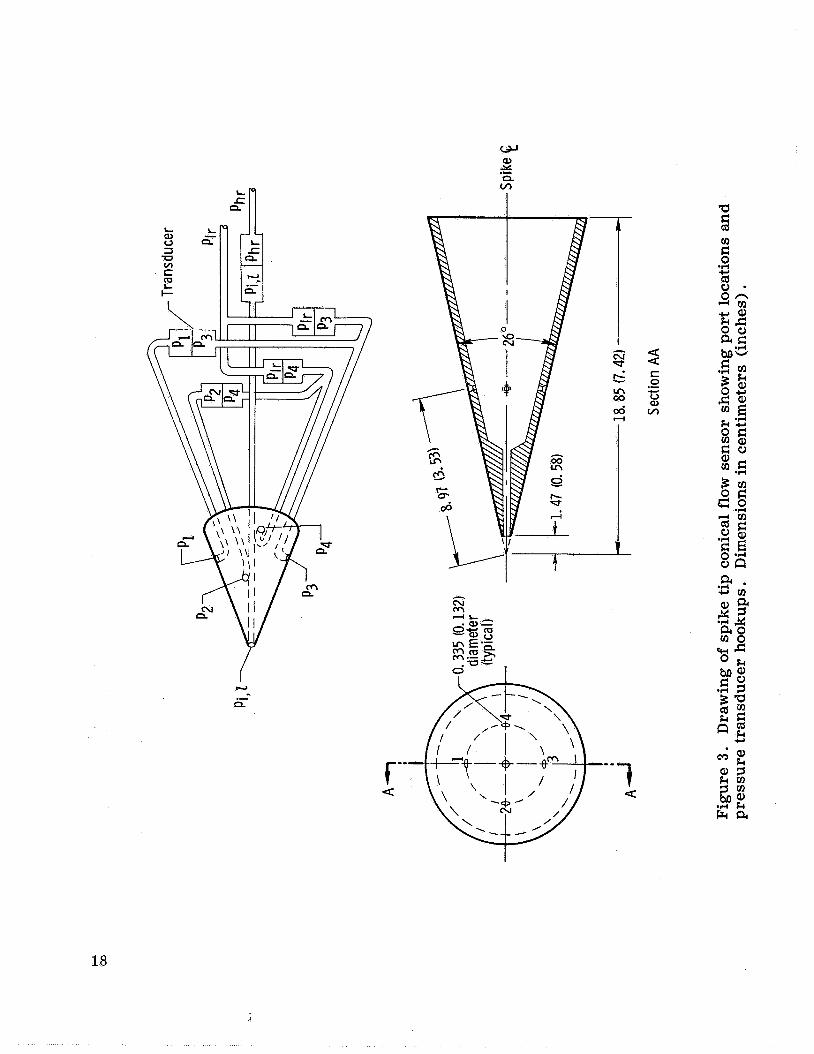
The sensor was fabricated of stainless steel and had an included angle of 26O, identical to that of the inlet spike. A photograph of the sensor system is shown in figure 4. The sensor portion was attached to a mounting bracket, o r web, which held the differential-pressure transducers. These transducers , which were also subjected to the temperatures encountered in high-speed flight, were relatively small, thus allowing close-coupling with the pressure orifices. Tubing lengths of approximately 7.62 meters (25 feet) from the differential-pressure cells to the reference pressure sources were used; 20.3 centimeters (8 inches) of tubing were used from the pressure orifices to the differential-pressure cells. Stainless steel tubing with an outer diameter of 0.477 centimeter (0.188 inch) and a wall thickness of 0.071 centimeter (0.028 inch) was used. Access to the transducers and plumbing system required only the removal of a panel.
Spike tip total and static pressures were measured with differential-pressure cell transducers. Two different absolute reference pressures were applied to the spike tip differential transducers (fig. 3). A high-level pressure was used with the spike tip impact pressure, and a low-level pressure with the static pressures. The reference pressures were measured by high-resolution pressure transducers installed in a con- trolled temperature environment.
The frequency response of the system was low (1 Hz to 10 Hz); therefore, only quasi-steady-state data were valid. By more careful selection of transducers, hookup techniques, and tubing lengths , higher frequency response data could have been obtained.
Free-stream Mach number, Moo, pressure altitude, h,, static pressure, p,,
and impact pressure, p. 19,
sated, Pitot-static pressure probe of the airplane. A nose-boom, strut-mounted, hemi- spherical head, flow-direction sensor was used to obtain free-stream angle of attack, a,, and angle of sideslip, p,. This system is described in reference 7. A photograph
of the nose-boom Pitot-static probe and hemispherical head sensor is shown in figure 5.
, were determined by using the nose-boom-mounted, compen-
The installed instrumented spike tip and the nose-boom system were connected to a CT-77 pulse code modulation (PCM) system which recorded the data. The PCM data and the time of day were recorded onboard by using a tape recorder and portable time- code generator.
DATA REDUCTION
The YF-12 data reduction system included formatting and digital processing. The formatting process consisted of decommutating, digitizing, and formatting the commu- tated PCM data into an IBM-compatible format. Through digital processing, the raw data were converted into calibrated engineering units which were listed out for engineer- ing computation. The spike tip pressures were initially converted into three basic non-
APa AP
Pi,l’ Pi,l J , m d - pi’z , for use with the wind-tunnel-
P dimensionalized parameters, -
derived calibration curves shown in figures 6 and 7 . The development of these curves
4
d

is discussed in the appendix.
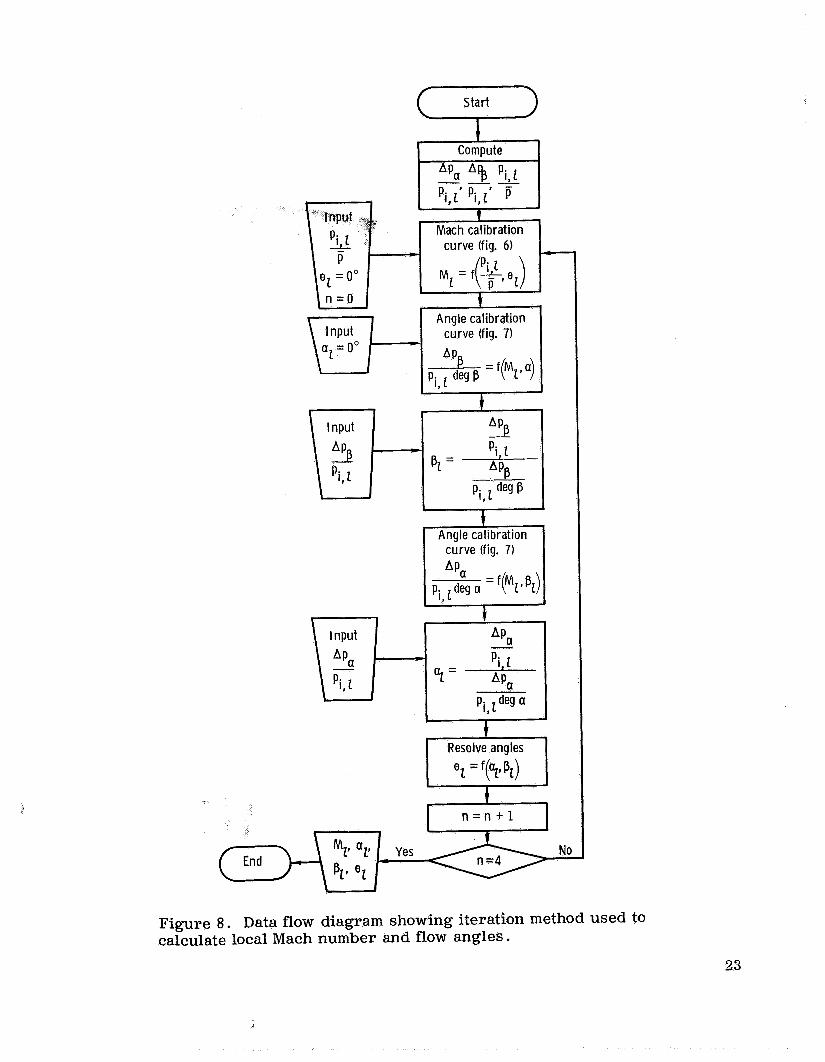
The calibration curves were used to obtain local angle of attack, local angle of sideslip, and local Mach number as shown in the flow diagram in figure 8. The proce- dure was as follows: A first approximation of local Mach number was made by apply-
ing the measured value of
flow angle of 0'. Using the determined
of
to the curves of figure 6 and assuming a resolved - P
pi, I
M2 and figure 7 (Oo absolute angle), the value
3 tvas (actually ) was obtained. Then the measured APp A P
Pi,l deg Pi,l deg P pi, I
I value to give a first approximation of p Next this p t ' divided by the P: 7 deg
Ap 1 , L (absolute angle) was used with
was divided to obtain Ap,! (actually ), by which the measured value of - Pi,l deg @ 'i, 1
the first approximation of The approximated values of and p , were then combined to determine an updated value of 9. The value of 9 and figure 6 were used to obtain a new
acceptably small deviation was obtained, usually after three o r four iterations, and the final values of local angle of attack, angle of sideslip, flow angle, and Mach number were then determined.
M and figure 7 to obtain a new value of I Pi,l del?
MI. The iteration process was continued (fig. 8) until an
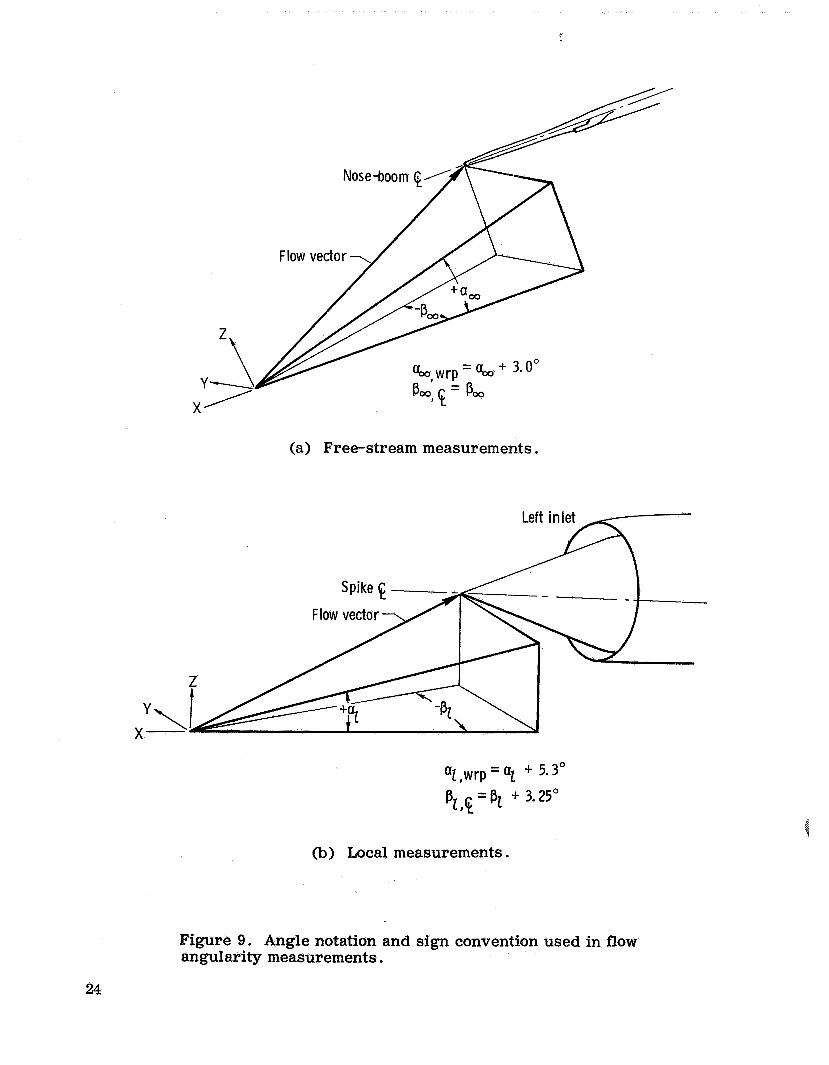
It was decided to compare the nose-boom and inlet spike 01 results relative to the wing reference plane and P Because of nose-boom droop and spike cant, corrections had to be applied as shown in
(fig. 9(b)). The figure 9 to obtain a sign convention used is also shown in figure 9.
results relative to the centerline vertical plane.
2,WrP' %,$ (fig. 9(a)) and Q m,wrp, Pm, E
A simplified method of data reduction was used to expedite the data analysis. It was found that the calibration curves in figures 6 and 7 could be approximated by the power series techniques of reference 8 as follows:
2 M 1 = 0.488 + 0.392 ( ~ ) - 0 . 0 0 0 3 ( ~ ) + ~ 1 4 . 4 8 - 4.99(%) + o . g o ( ~ , ' ]
1 ~g=i-&j[-0.411+8.898M-1.282M 2 + ( 0 . 2 + C ) ( d e g P o r c u )
'i, I
C = 0.25(2.4 - M) when M < 2.4
C = 0 when M 2 2.4
The e r ro r associated with this approximation was well within the e r ro r band of the overall system. This technique could have been applied to an onboard system for in-flight reduction and direct readout.
5

ACCURACY
The er ror of the differential-pressure transducers used to record the spike tip pressures was 1 percent of full scale. The e r ro r of the reference pressure transducers was i o . 05 percent of full scale. The following table shows the resulting transducer errors :
Measurement Transducer range,
kN/m2(lb/in 2 )
120.68 (h3.0)
h20.68 (h3.0)
141.37 (h6.0)
*41.37 (G. 0)
+103.4 (-k15.0)
0 to 110.3 (0 to 16)
0 to 206.8 (0 to 30)
Error, kN/ m2 (lb/ in 2 )
&O. 41 (f0.06)
4. 41 (:I: . 06)
*.83 (k.12)
ik.83 (1.12)
12.07 (*. 30)
f. 055 (%. 008)
f. 103 (.t. 015)
Errors in the calculated flow parameters were determined by using pressure measurement errors and cone calibration uncertainties (appendix) and the methods of reference 9.
6
The following estimates of e r ro r were obtained:
Estimated e r ror in - I I

The er rors in the free-stream parameters for the range of conditions tested were (ref. 7):
f .5 percent
FLIGHT-TEST PROCEDURES
Data were obtained during stabilized and maneuvering flight. Mach numbers varied from 1.6 to 3.0 , and altitudes were as high as 22,850 meters (75,000 feet). Principal test Mach numbers were 2.6, 2.8, and 3.0 .
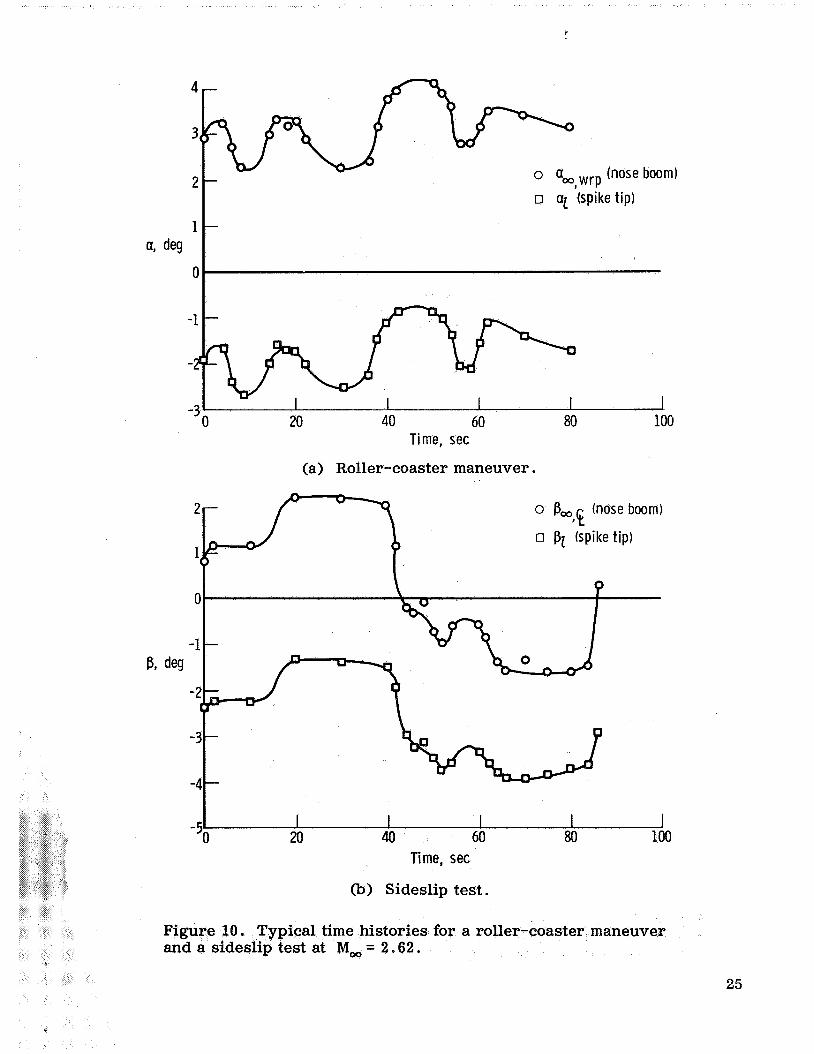
During stabilized runs, the airplane was stabilized for a minimum of 20 seconds at a specified Mach number and altitude. The maneuvering flight conditions consisted of acceleration-climb maneuvers ; roller-coaster maneuvers, in which airplane angle of attack was varied in an oscillatory manner; and sideslip tests, which were accom- plished by varying the airplane sideslip angle between 2" nose left @, = 2") and 2" nose right @, = -2") and stabilizing briefly at intermediate points. Mach number was held constant during the roller-coaster maneuvers and sideslip tests.
RESULTS AND DISCUSSION
The various flight tests served a dual purpose: They made it possible to examine the inlet flow field and to evaluate the performance of various sensors in a high-speed flight environment. By changing the free-stream angle of attack, angle of sideslip, and Mach number, the corresponding changes in local angle of attack, angle of sideslip, and Mach number were obtained and compared with the corresponding free-stream values.
Local Flow Angularity
Figure 1 0 is a typical time history of a roller-coaster maneuver and a sideslip test. The local conditions are in phase with the free-stream conditions. This indicates similar response characteristics for both the nose-boom and spike tip systems.
7

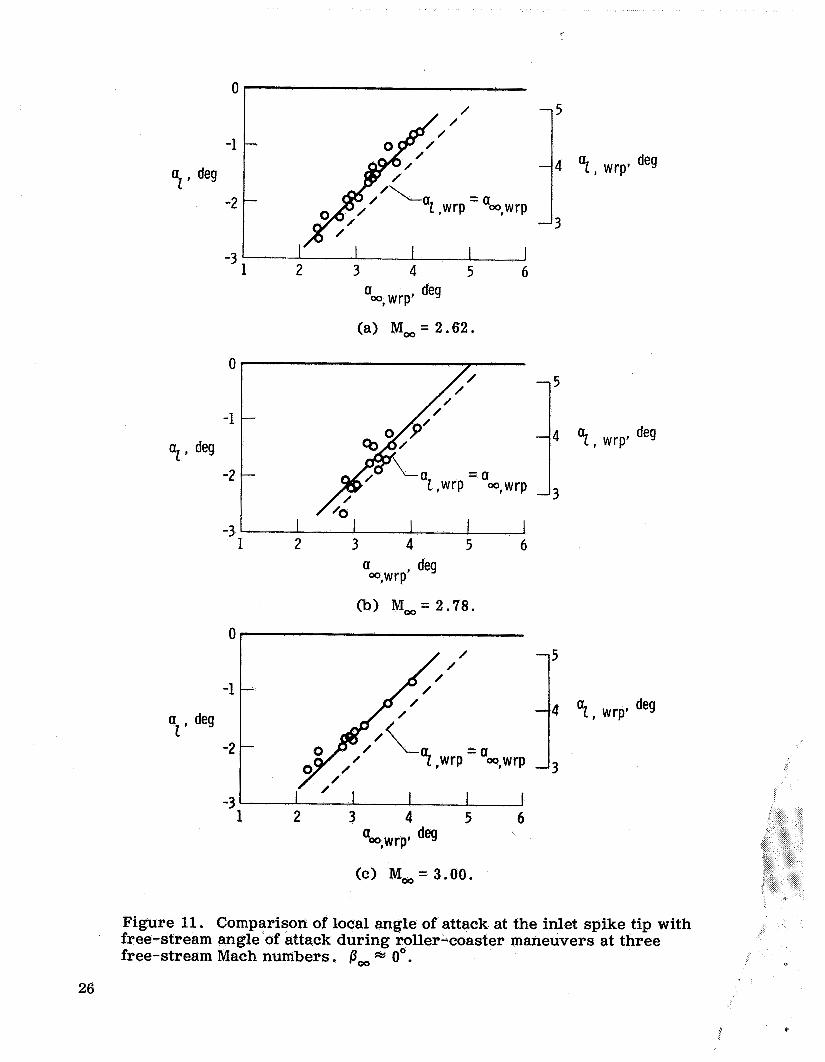
Local angles of attack at the inlet spike tip are plotted against free-stream angles of attack for three test Mach numbers in figure 11. It should be noted that free-stream angle of attack is given with respect to the wing reference plane, and local angle of attack is given with respect to both the wing reference plane and the spike centerline. Therefore, it is possible to examine the flow both in terms of change from the free- stream value and in terms of its alinement with the spike centerline. A change in air- plane angle of attack caused an essentially equivalent change in local angle of attack, as indicated by the close agreement of the data with the 1 to 1 fairings in the figure.
For each test Mach number, there was a slight upwash at the inlet and the local value of angle of attack was about 0.5' greater than the free-stream value, with respect to the wing reference plane. For a free-stream angle of attack of 4' , a normal condition for Mach numbers from 2 . 6 to 3 .0 , the local angle of attack was -0. 9', -1. 2', and -0.8O at free-stream Mach numbers of 2.62, 2 .78, and 3.00, respectively. This indicates that the spike was never oriented directly into the local flow in the vertical plane for trimmed flight at these Mach numbers.
The local angles of sideslip at the inlet are plotted against airplane angles of side- slip for approximately the same three test Mach numbers in figure 12. Local angle of sideslip is given with respect to both the airplane centerline and the spike centerline for correlation of local conditions and free-stream conditions. The slope of the fairings at all three Mach numbers is nearly identical and indicates that a change in local angle of sideslip is only about 70 percent as large as the corresponding change in free-stream angle of sideslip.
When the airplane was at a sideslip angle of O', the local angle of sideslip with was 0.3', 0.5' , and 1. 2' for free-stream respect to the airplane centerline,
Mach numbers of 2.62, 2.77, and 3.00, respectively. The inlet spikes were turned 3.25' toward the fuselage centerline (fig. 2). As expected, the flow approached the left inlet spike from the outboard side (negative local sideslip). However, an average local sideslip angle of approximately -2.5' was measured for the flight conditions examined. This indicates that the forebody caused an outboard flow, relative to the fuselage verti- cal centerline.
%%,
In addition to the correlation between local and free-stream flow angularity changes, a relationship was observed between local changes in angle of attack and angle of sideslip. During the roller-coaster maneuvers, a 1' increase in local angle of attack was associ- ated with a 0.3' increase in local angle of sideslip. During the sideslip tests, a 1' increase in local angle of sideslip was associated with a 0.37' increase in local angle of attack.
The effect on local flow angularity of increasing free-stream Mach number from 1 . 6 to 3 . 0 during an acceleration-climb maneuver is shown in figure 13. Local flow angu- larity changed little up to a free-stream Mach number of 2.2. Above this Mach number, several significant changes occurred. Local angle of attack decreased from -0.7' at Mach 2 . 2 to -1. go at Mach 2 .6 , after which it remained essentially constant up to Mach 3.0 . Local angle of sideslip increased almost linearly from -3.9' at Mach 2 . 2 to - 1 . 7 O at Mach 3.0 , indicating that the spike centerline was becoming alined with the local flow fie.ld in the horizontal plane as Mach number increased. The steady-state data in the figure agree with the acceleration-climb data.
8

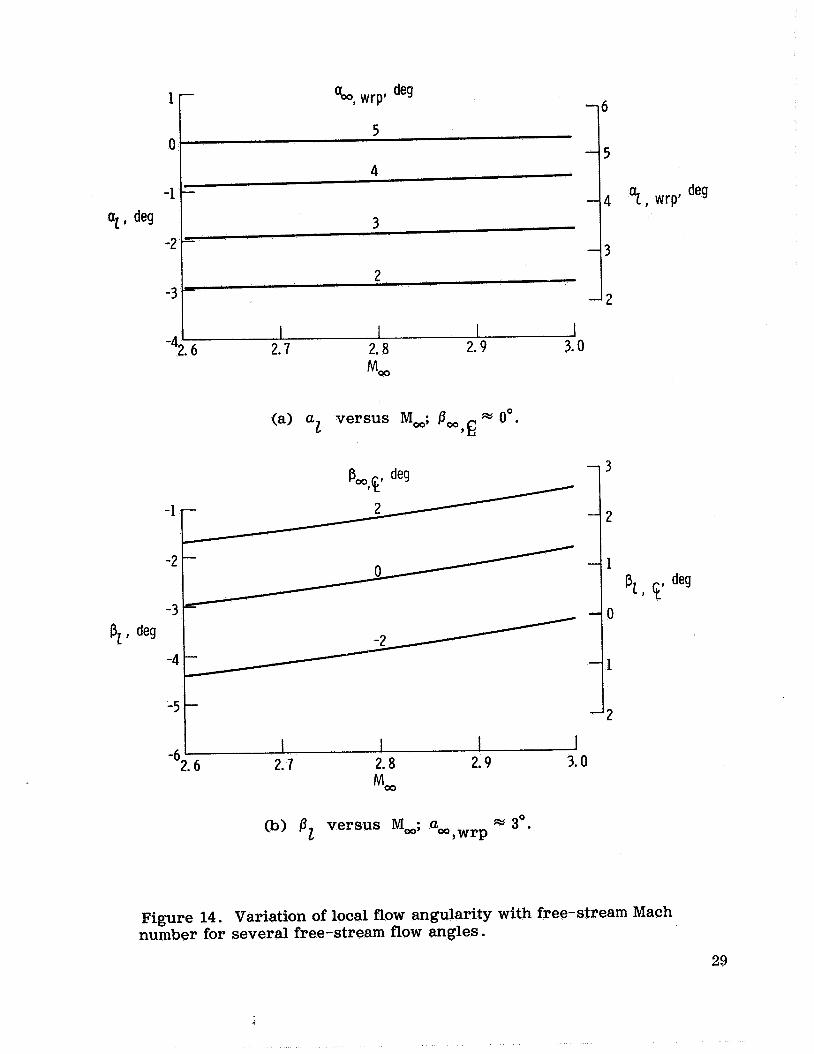
The results shown in figures 11 to 13 are summarized in figure 14 for Mach numbers from 2.6 to 3 . 0 . These fairings were obtained by plotting local flow angularity as a function of Mach number at several free-stream flow angularity conditions. The curves show a constant value of local angle of attack and a gradually increasing value of local angle of sideslip with increasing Mach number. This type of presentation makes it possible to apply the flight-test results to intermediate Mach numbers, angles of attack, and angles of sideslip for use in future wind-tunnel programs.
Mass Flow, Impact-Pressure, and Mach Number Ratios
On supersonic aircraft, locating inlets in the vehicle's flow field can be advantageous. For example, if beneficial compression effects are measured, a smaller inlet can be used for the required airflow. This smaller inlet may have less drag and weight. The
m,
are generally used to describe this flow field. These parameters, as measured in flight on the YF-1ZA airplane, are shown in figure 15. A sketch of the airplane and apparent shock system is included in the figure to show the approximatelocation of the measurements discus sed.
The mass flow ratios were determined by using the local Mach number and impact- pressure ratios
to 1.05 at Mach
Mach 2.6 which
shown in figure 15.
3 . 0 . A beneficial compression effect (m mz > 1.0) is indicated above
increases at the higher Mach numbers.
Mass flow ratio increases from 0.96 at Mach 2.2
cl!
Variations in impact-pressure ratio provide an estimate of the strength and proximity of nearby shock waves. increase from 0.96 at Mach 2.2 to 1.07 at Mach 3 .0 , indicating the possibility that a forebody shock wave approaches the spike tip as free-stream Mach number increases above Mach 2.2. Below Mach 2.2 the ratio did not change significantly.
The impact-pressure ratios shown in figure 15
The scatter in the local Mach number data of figure 15 was caused by sensor transducer inaccuracy and the sensitivity of the local Mach number to small pressure variations when the calibration curve was applied. In general, local Mach number was 3 percent less than free-stream Mach number, ranging from approximately 1.55 to approximately 2.91 for free-stream Mach numbers from 1.60 to 3 . 0 0 .
To evaluate the accuracy of the sensor pressure measurements, the pressure coefficient, C
test data and compared in figure 16 with the values obtained with the cone theory of reference 10. The theoretical data are for zero angle of attack, whereas the flight
of the cone surface static pressures was calculated from the flight- P'
9
d

data a re for local angles of attack of less than 2" absolute. The pressure coefficient was calculated by using the following equation:
L
P - PI
qz P - Pz c =-- -
2 0.78 M 1 2
Agreement between the flight data and the theoretical curve was good for local Mach numbers greater than 2.0. Because of the bluntness of the cone (due to the pitot orifice), true conical flow over the spike did not exist at the low Mach numbers as it did for the sharp cone used in the theoretical calculations. This may explain the difference between the data at the lower Mach numbers.
Sensor Evaluation
The conical sensor was used on 40 flights. The system required essentially no maintenance. The transducers performed well in the high temperature and vibration environment of the spike tip.
The YF-12A variable-geometry inlet involves controlled movements of the forward and aft bypass doors and the inlet spike. These movements are scheduled as a function of several parameters, including Mach number, angle of attack, and angle of sideslip, all measured at the nose boom. This type of system cannot be optimized for all flight conditions because of flow differences at the nose boom and at the inlet. These differ- ences make it difficult to calibrate the inlet control system for the greatest efficiency. The efficiency and sensitivity of the system could be enhanced throughout its operating range if a sensor like the conical spike-tip flow sensor used in these tests were installed to obtain the local flow measurements necessary for system operation.
CONCLUDING RE MARKS
A 26" included angle conical flow sensor was used to obtain flow measurements at the left inlet spike tip of a YF-12A airplane at Mach numbers from 1.6 to 3.0. Local flow angularity, Mach number, impact pressure, and mass flow were determined from the flight-test data and compared with free-stream values.
Local angle-of-attack and angle-of-sideslip changes occurred at the same time as changes in the free-stream values. A change in free-stream angle of attack caused an equivalent change in local angle of attack, but a change in free-stream angle of sideslip caused a change only approximately 70 percent as large in the local value.
As free-stream Mach number increased above 2.2, the local angle of attack decreased and local angle of sideslip increased. At Mach 3 .0 , with the airplane in a.normal attitude, local angle of attack with respect to the wing reference plane was about 0.5' greater than the free-stream value, and local sideslip angle with respect to the airplane centerline was 1.2" For the flight conditions examined, the local flow ubually approached the spike centerline from the upper outboard side because of spike toe-in and cant.
10

Local Mach number was generally 3 percent less than free-stream Mach number. No significant change occurred in the impact-pressure ratio or the mass flow ratio as the free-stream Mach number increased from 1 . 6 to 2.2. As Mach number increased from 2.2 to 3.0, the impact-pressure ratio increased from 0.96 to 1.07 and the mass flow ratio increased from 0.96 to 1.05, indicating the beneficial effect of vehicle com- pression.
For local Mach numbers greater than 2.0, pressure coefficients determined from flight data agreed well with those calculated using cone theory.
The high speed thermal environment did not adversely affect the sensor system. Use of the instrumented spike tip, which is a rugged, simple system, together with minor improvements in the transducers and frequency response would provide an efficient and accurate sensor for inlet control inputs.
Flight Research Center, National Aeronautics and Space Administration,
Edwards, Calif., November 28,1972
11

APPENDIX
CONE WIND-TUNNEL CALIBRATION
TEST APPARATUS
A full-scale instrumented cone, geometrically similar to the cone used in this study (figs. 3 and 4), was calibrated in the Langley Research Center' s Unitary Plan Wind Tunnel. The wind tunnel is of the continuous-flow, asymmetric, sliding-block type (ref. 11) and has two test sections. The Mach number range of test section 1 is from 1.47 to 2.86; that of test section 2 is from 2.29 to 4.63.
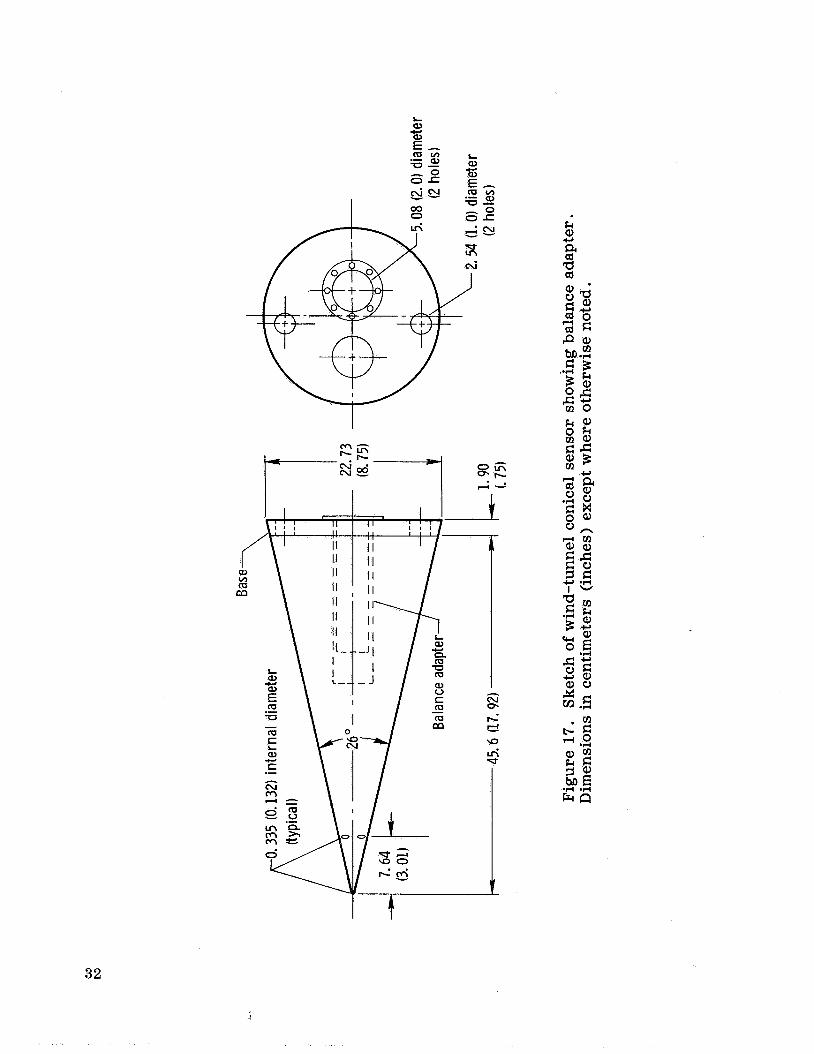
The cone was mounted to the wind-tunnel sting by means of an adapter section, as shown in figure 17. Pressure lines were run from the cone through the adapter and along the sting to pressure transducers outside the test section. This kept the pressure transducers at room temperature and in a vibration-free environment. The resulting pressure line length was approximately 4.57 meters (15 feet).
Each of the five cone pressures @,, p2, p3, p4, and pi,l) was measured.
TEST CONDITIONS
Cone pressure data surveys were made at a fixed stagnation temperature of 65.6' C (150' F) for six Mach numbers as follows:
M - 1.5
2.0
2.0
2.4
2.8
3.2
3.5
3.5 -
T e s t . section
1
1
1
2
2
2
2
2
Stagnatio
kN/m"
5.32 x l o 4 4.10
6.35
7.72
9.53
1.80
13.80
10.35
p res su re ,
(lb/ft2)
(1111~ l o 4 )
(833)
(1327)
(1612)
(1991)
(2464)
(2882)
(2161)
Nominal Re, I p e r m
6 6.50 x 10
4.88
6.50
6.50
6.50
6.50
6.50
4.88
The angle-of-attack range was from -4' to 12', and angle of sideslip was varied from -4' to 6 O at each Mach number. To check for cone symmetry, the cone was rolled 90' and retested at Mach numbers of 1.5, 2.0, and 3.5.
12

ACCURACY
Assuming the cone to be correctly fabricated, the accuracy of an instrumented cone is a function of wind-tunnel calibration e r ror and errors associated with the flight instrumentation.
The cone Mach number and angularity calibrations were based on the slopes of versus angle. This type of wind-tunnel calibration was used because curves of -
it minimized zero-shift and bias errors caused by the misalinement of the probe ahd sting deflections due to air loads during the tests. The probe was alined as carefully as possible in the tunnel using a transit and inclinometer. The estimated average sting angle positioning errors are 1t0.15' for angle of attack and rt0.10' for angle of sideslip.
AP
pi, I
The estimated accuracy of the Mach number cone calibration was based upon the repeatability of pressure data using the calibration in figure 18 and the test section Mach number variation of rt0. 015 for these tests. Over the angular test range the accuracy was estimated to be:
M - Estimated e r ro r in
Mach number calibration
1.5 * O . 017
2 . 0 f. 020
2 . 4 f. 023
2.8 f. 028
3 .2 f. 031
3 .5 f. 034
The accuracy of flow angle measurement is dependent upon the combined effect of sting-angle-positioning and pressure errors for a given Mach number. The repeat- ability of the data and the positioning e r ro r were used to make the following estimate of the accuracy of the angle - of -attack-angle -of - s ides 1 ip calibration :
Estimated e r ror in - M a-P calibration, deg
1 . 5 f 0 . 3 0
2 . 0 f. 23
2 . 4 f. 20
2 . 8
3 . 2
f. 20
f. 20
3 . 5 f. 20
13
MACH NUMBER CALIBRATION
Convent ionally,
Mach number (refs.
versus Mach number cone calibrations have been plotted as P - 'i, z
1 and 3 to 5), which resulted in a smooth, nonlinear calibration Pi z curve. It was observed in reference 2 that plotting the reciprocal, +, against Mach
Pi z number resulted in a nearly linear curve. Figure 18 is a plot of + versus Mach P
number obtained from wind-tunnel tests with the 26' cone. Results for inclination (a or p) angles of O " , -4O, 4O, and 8" are shown. Theoretical results at zero angle of attack for 2 6 O cones (ref. 13) are shown for comparison. The wind-tunnel data and the theoretical results for the 26" cone agree closely over the Mach number range. The effect of increasing inclination angle becomes more pronounced as Mach number increases.
P
FLOW ANGLE CALIBRATION
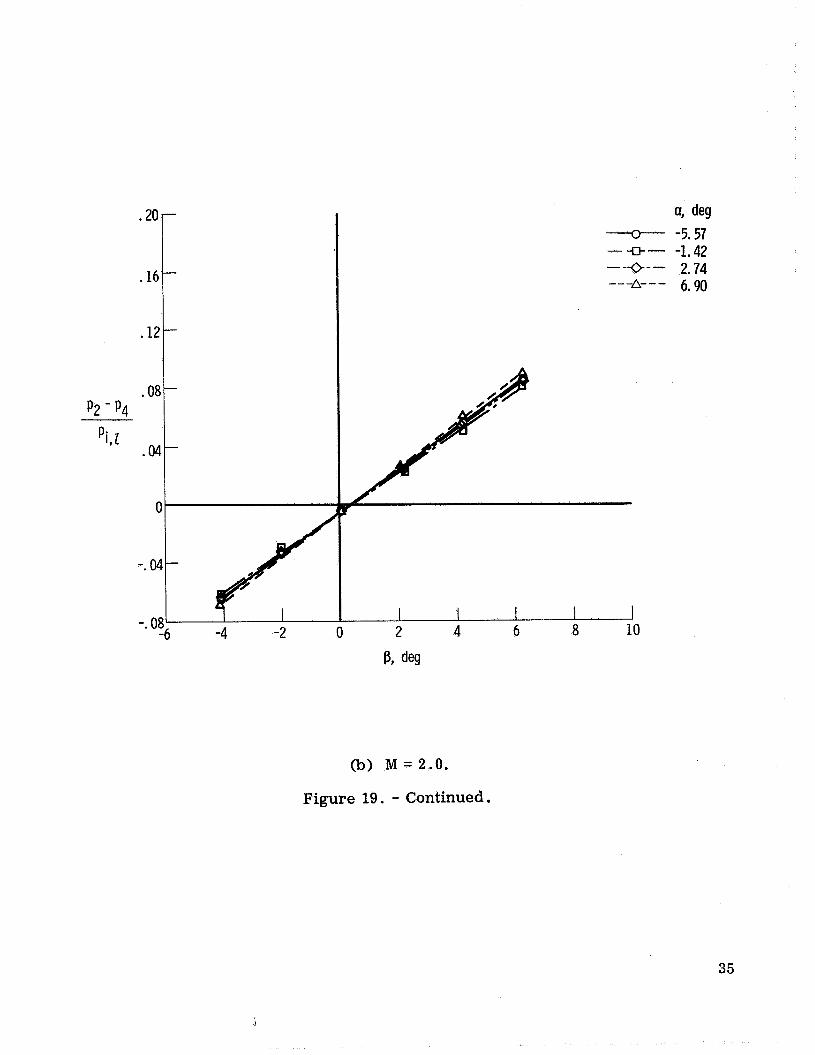
, per degree of change in angle of p2 - p4 Changes in the sensor pressure ratio, n
"i, z sideslip are shown in figures 19(a) to 19(d) for Mach numbers of 1.5, 2.0 , 2.8, and 3.5 for several angles of attack. The slopes of the linear curves increase with Mach number, and at a given Mach number the slopes increase as the absolute value of angle of attack increases.
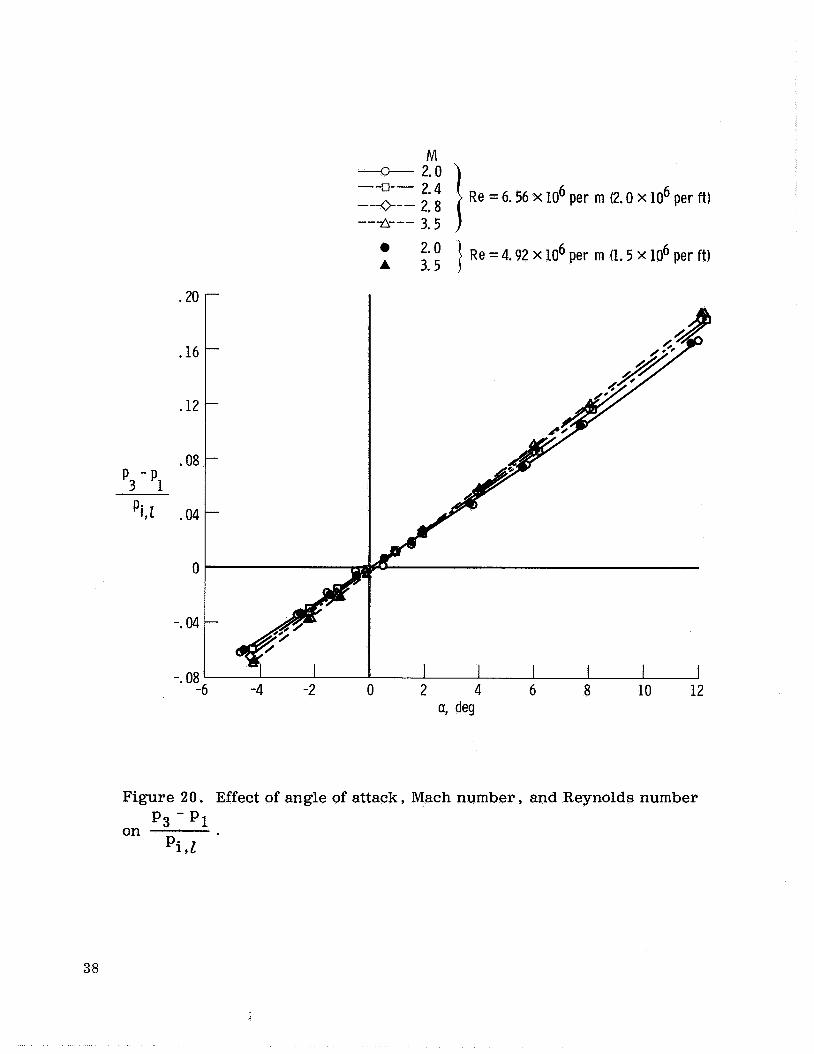
, per degree of angle of attack p3 - p1
pi, 1 Figure 20 shows the sensor pressure ratio,
at Mach numbers of 2.0 , 2.4, 2.8, and 3.5 for zero angle of sideslip. Results from tests performed at Mach 2 . 0 and Mach 3.5 at different Reynolds numbers are also shown.
also No significant Reynolds number effects are apparent. The slope of p3 - p1
increased with Mach number. pi, 2
The symmetry of the cone was checked by rotating the cone 90° and repeating the tests at Mach numbers of 2.0 and 3.5. The results of the rotated and normal cone tests are compared in figure 21. Good agreement of the data from these tests was obtained at both Mach numbers, which indicates that the cone was symmetrically machined and installed in the tunnel.
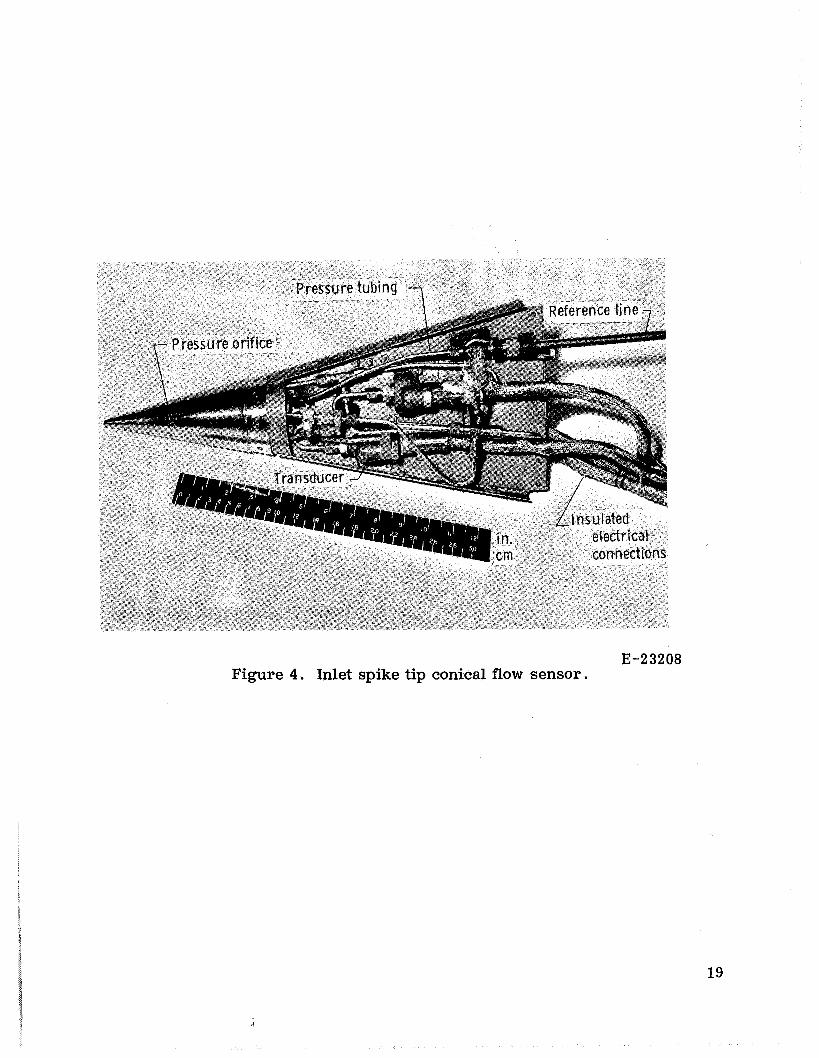
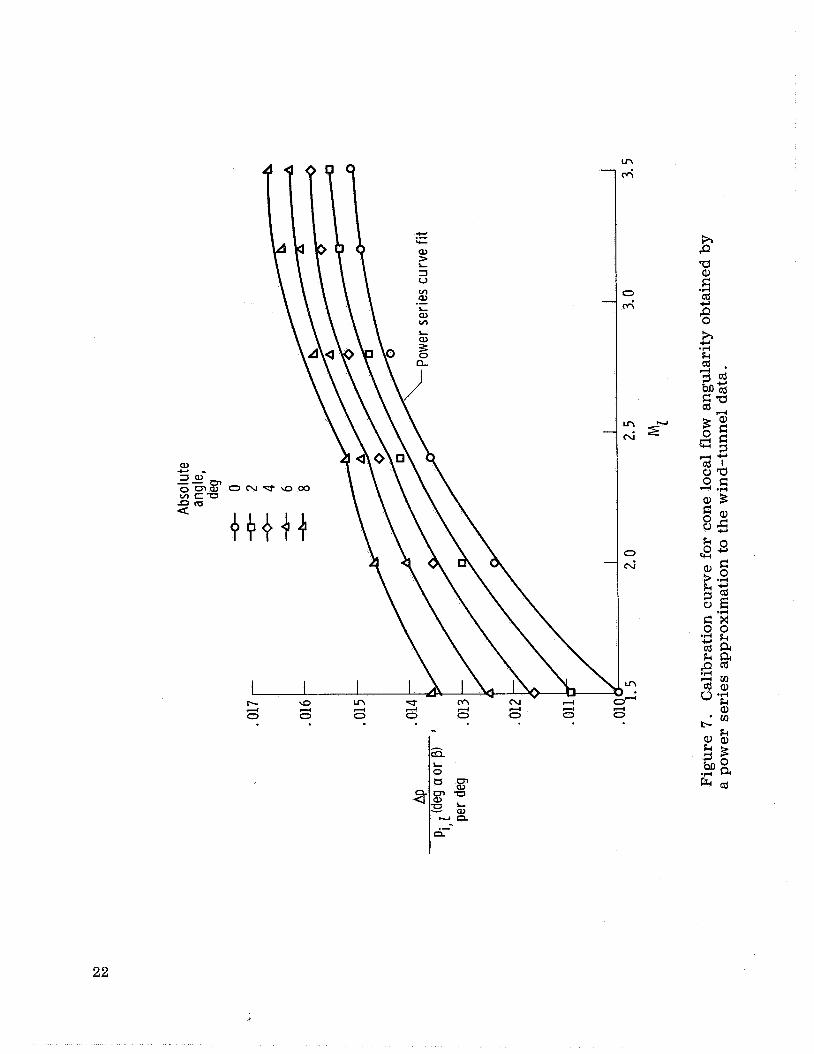
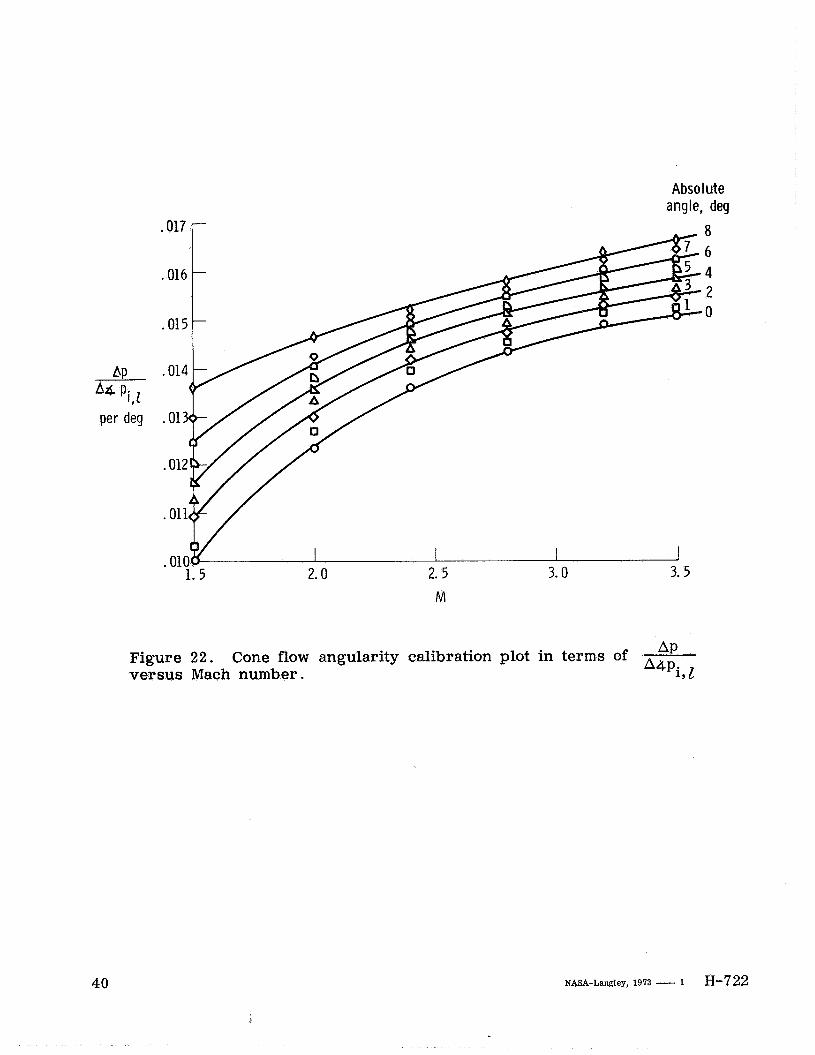
The slopes of the linear cone test data typified by figures 19 to 21 were measured at each Mach number. These slopes were plotted against free-stream Mach number to obtain the calibration shown in figure 22. At the lower Mach numbers (near 1.5) small changes in the cone surface static pressures could result in significant angular varia- tion. At the higher Mach numbers, the angularity calibration is less sensitive to varia- tions in Mach number. The spike tip pressure relationships at the higher Mach numbers gave an estimated e r ror in the or-p calibration of * O . 20".
14
4

RE FERE NC ES
1.
2.
3.
4.
5.
6.
7.
8.
9.
10.
11.
12.
13.
Centolanzi, Frank J. : Characteristics of a 40" Cone for Measuring Mach Number, Total Pressure, and Flow Angles at Supersonic Speeds. NACA TN 3967, 1957.
Cooper, Morton; and Webster, Robert A. : The U s e of an Uncalibrated Cone for Determination of Flow Angles and Mach Numbers at Supersonic Speeds. NACA TN 2190, 1951.
Norris, John D. : Calibration of Conical Pressure Probes for Determination of .1
Local Flow Conditions at Mach Numbers From 3 to 6. NASA TN -3076, 1965.
Montoya, Earl J. ; and Palitz, Murray: Wind-Tunnel Investigation of the Flow Field Beneath the Fuselage of the X-15 Airplane at Mach Numbers From 4 to 8. NASA ; TM X-1469, 1967.
Burcham, Frank W. , Jr. ; and Nugent, Jack: Local Flow Field Around a Pylon- Mounted Dummy Ramjet Engine on the X-15-2 Airplane for Mach Numbers From 2.0 to 6.7. NASA TN D-5638, 1970.
Mechtly, E. A. : The International System of Units - Physical Constants and Con- version Factors. NASA SP-7012, 1969.
Montoya, Earl J. : Wind-Tunnel Calibration and Requirements For In-Flight Use of NASA Fixed Hemispherical Head Angle-of-Attack and Angle-of-Sideslip Sensors,
TN D-6986, 1973.
Mood, A. M. ; and Graybill, F. A. : Introduction to the Theory of Statistics. Second ed. , McGraw-Hill Book Co. , Inc. , 1963.
Barry, B. Austin: Engineering Measurements.
Ames Research Staff: Equations, Tables, and Charts for Compressible Flow.
John Wiley & Sons, Inc., 1964.
NACA Rept. 1135, 1953. (Supersedes NACA TN 1428. )
Schaefer, William T., Jr. : Characteristics of Major Active Wind TunneIs at the Langley Research Center. NASA TM X-1130, 1965.
Sims, Joseph L. : Tables for Supersonic Flow Around Right Circular Cones at Zero Angle of Attack. NASA SP-3004, 1964.
Babenko, K. I. ; Voskresenskiy, G. P. ; Lyubimov, A. N. ; and Rusanov, V. V. : Three-Dimensional Flow of Ideal Gas Past Smooth Bodies. NASA TT F-380, 1964.
15

16

4 00
I I
I
m
17
18
a a
5 d cd
id
E-23208 Figure 4 . Inlet spike tip conical flow sensor.
19

20
CD 0 oa c3 cil
I w
4

8
7
6
Pi,Z P 5
4
3
! Wind-tunnel data
1.6 2.0 2.4 2.8 3.2 3.6 4.0 2 1.2
MZ
Figure 6. Calibration curve for cone local Mach number derived from wind-tunnel data, including the power series approximation.
21
W
22
(-)
1 nput
Pi, z
curve (fig. 7)
5
Pi, z az =
Pi, deg a
t
= f(”z.4) Resolve angles
l - - - l n = n + l
Figure 8. Data flow diagram showing iteration method used to calculate local Mach number and flow angles.
23
d
Y- z \ X'
(a) Free-stream measurements.
cb) Local measurements.
Figure 9 . Angle notation and sign convention used in flow angularity measurements.
24
Ti me, sec
(a) Roller-coaster maneuver.
I I I I J 20 40 60 80 100
Time, sec
(b) Sideslip test.
histories for a roller = 2.62.
25
26
-2
azldeg -3 -I -
y ’ /\
I- I I I 1 1 2 3 4 5 6
a wrp’ de9
(a) M,= 2 . 6 2 .
5
4 1 3
9 wrpl deg
(b) M,= 2 . 7 8 .
01
‘Z , wrp, deg -1
az I deg
-2
-3 1 2 3 4 5 6
U wlwrpV deg
Figure 11. Comparison of local angle of attack at the inlet spike tip with free-stream angle of attack during roller-coaster maneuvers at three free-stream Mach numbers. p, Oo.
c?

-3
-4 1 2 3 -2 -1 0
PW,,, deg
(a) M,= 2.62.
0
-1 2
1
0
1
P2,E' deg
-2
-3
-4
-5
Pz t deg
- 2 - 1 0 1 2 3 Pwtp deg
(b) M,= 2.77.
2 3 -4
-2 -1 0 1 Pi,$ deg
(c) M, = 3.00 .
Figure 12. Comparison of local angle of sideslip at the inlet spike tip with free-stream angle of sideslip during sideslip tests at three free-stream Mach numbers. sv 4".
27

4 r
3 -6- Acceleration-climb maneuver -a- Steady-state f l ight
0 -1
-2 0
0
-1 t -Q- Acceleration-climb maneuver -c+ Steady-state f l ight
-51 I I I I I I I 1.6 1.8 2.0 2.2 2.4 2.6 2.8 3.0
Ma3 @) Angle-of-sideslip results.
Figure 13. Variation of free-stream and local flow angularity with free- stream Mach number during an acceleration-climb maneuver.
28
1 r
-1 -
-2 -
-3 I$ # de9
-4 -
-5 t
3
2
3
2
1 P, * E‘ deg
0
i I I I 2.7 2.8 2.9 3.0 -6 2.6
Moo
= 3 O . wrp (b) p versus M,; 1
Figure 14. Variation of local flow angularity with free-stream Mach number for several free-stream flow angles.
29
d

30
1.00%
.95-
Pi,[ P i co
0
I 1 1 I 1 I I
MZ 2. 2
~~ 2. 0
Spike t ip shock
-0- Acceleration-climb maneuver
-11- Steady-state f l ight
1.4 1.6 1 . 8 2.0 2.2 2.4 2.6 2.8 3.0
M,
Figure 15. Variation of unit mass flow ratio, impact-pressure ratio, and local Mach number with free-stream Mach number.

.18
.16
CP .1/
.1:
.1
\ \ \ \ \
O O \
0 0 O'\
0 +\ 0
B P O ' 0 \ '
- . 4
o Flight data
_ _ - - Theory (ref. 10)
0 \ .
0
\\ 1.8 2. 2 2.6 3.0
Figure 16. Comparison of pressure coefficients derived from flight data and conical theory.
31
d
L a,
32
d

a, 5 k 0 eH k a, P E 3 G
.2 I a a -I ccr 0
0 a c,
d
33

p2 - p4 Pi,Z
.20
a, de9 .16 U -3.60
-0- 0.54 4.67 --e-- 8.82 --*-- .12
.08
.04
0
-. 04
-6 -4 -2 0 2 4 6 8 10
P, deg
-. 08
Figure 19 Effect of angle of sideslip, angle of attack, and Mach number
34
d
.20
.16
.12
. OE p2 - p4
.01 Pi, I
-. 01
-. 01 -4 -2
a, deg * -5.57 -e- -1.42 --e--- 2.74
6.90 ---Ad - -
I 1 I I 1 0 2 4 6 8 10
P, deg
(b) M = 2 . 0 .
Figure 19. - Continued.
35

.20
.16
4 6 8
a, deg - -4.20 -*I)-- -0.09 --+-- 4.02 ---A--- 8-14
10
( e ) M = 2.8.
Figure 19. - Continued.
36

U -3.78 -* - 0.33 --U-- 4.42 --*-- 8.53
(d) M = 3 . 5 .
Figure 19. - Concluded.
37
d
.20
.16
.12
.08 p3 - p1
pi,z .04
0
-. 04
-*- " Re = 6.56 x lo6 per m (2.0 x lo6 per ft) --Q-- 2.8 --A--- 3.5
1 Re = 4.92 x lo6 per m (1.5 x lo6 per ft) A 3. 5
-. 08 -6 -4 -2 0 2 4 6 8 10 12
4 deg
Figure 20. Effect of angle of attack, Mach number, and Reynolds number
on p3 - p1
P i , l
38
J

M Position -2- 2.0 Normal --o-- 3.5 Normal
0 2.0 Rotated 90" A 3.5 Rotated 90"
Angle, deg
Figure 2 1 . Comparison of rotated (goo) and normal cone results for two Mach numbers. Re = 6 -50 X 10 per meter ( 2 . 0 X 10 per foot).
6 6
39
Absolute angle, deg
,017
01 6
.015
Qp .014
‘6 Pi,[ per deg .01?
.012
.011
.01( 1 5 2.0 2. 5 3.0 3. 5
M
AP Figure 2 2 . Cone flow angularity calibration plot in terms of versus Mach number. ‘‘pi, z
40
I
NASA-Langley, 1973 - 1 H-722