Circular Orbits and Weightlessness 2015 Pearson Education, Inc.
Upload
truongkhuongCategory
view
214download
0
N A S A TECHNICAL NOTE
N m g == - c
n nI-3 z 0-g
Z P
N A S A r_N D-5462 d , 1
--I - 0"
I !+=a w-b
c W m n
S Z 4
-E w 4 z
d L n
I+=
LOAN COPY: RETURN TI
AFWL (WLOL-21 KIRTLAND AFB, N MEX
MOTION OF SINGLE BUBBLES UNDER LOW GRAVITATIONAL CONDITIONS
by John B. Huggurd, Jr., and William J. Musics
Lewis Research Center CZeveZand, Ohio
N A T I O N A L AERONAUTICS A N D SPACE A D M I N I S T R A T I O N W A S H I N G T O N , D . C . 'OCTOBER 1 9 6 9
https://ntrs.nasa.gov/search.jsp?R=19690028650 2018-08-18T16:07:46+00:00Z

TECH LIBRARY KAFB, NM
17. K e y Words ( S u g g e s t e d b y A u t h o r ( s ) )
Bubbles Low gravi ty Weight lessness Two-phase flow
1. Report No.
NASA TN D-5462 4. T i t l e and Subt i t le
18. D is t r ibu t ion Stotement
Unclassified - unlimited
2. Government Access ion No.
19. Secur i ty C lass i f . (of t h i s repart)
Unclassified
MOTION O F SINGLE BUBBLES UNDER LOW GRAVITATIONAL CONDITIONS
20. Secur i ty C lass i f . (of t h i s page) 21. No. o f Pages 22. P r i c e '
Unclassified I 31 I $3.;
7. Authads) John B. Haggard, J r . , and William J. Masica
Lewis Resea rch Center National Aeronaut ics and Space Administration Cleveland, Ohio 44135
National Aeronaut ics and Space Adminis t ra t ion Washington, D. C . 20546
9. Performing Organizat ion Name and Address
2. Sponsoring Agency Name and Address
5. Supplementary Notes
6. Abs t rac t
An exper imenta l study w a s under taken to examine s ingle ,
~
3. Rec ip ien t ' s Coto log No.
5. Report Date
October 1969 6. Performing Organizat ion Code
8. Performing Organizat ion Repor!
E-5128 10. Work U n i t No.
124-09 1 1 . Contract or Grant No.
~
13. T y p e o f Report and P e r i o d Cov
Technical Note
noncondensable bubble mot under low-gravity conditions. These data were compared with normal -gravi ty theor: empi r i ca l r e s u l t s . The M number (a cha rac t e r i s t i c d imens ionless p a r a m e t e r contz gravi ty and the liquid p r o p e r t i e s ) was found to b e a significant p a r a m e t e r in c o r r e l a t - no rma l - and low-gravity data . Th i s r epor t , together with normal -gravi ty theory, pr d i c t s bubble shape and t e r m i n a l velocity when the liquid p rope r t i e s , the bubble voluir and the applied gravi ty field are known. The r e s u l t s are applicable to a range of sph ca l and ell ipsoidal bubbles with Reynolds numbers above 50.

MOTION OF SINGLE BUBBLES UNDER LOW GRAVITATIONAL CONDITIONS
by J o h n B. Haggard, Jr., and Wi l l iam J. Masica
Lewis Research Center
SUMMARY
An experimental study was undertaken to examine single, noncondensable bubble motion under low-gravity conditions. theory and empirical results. The M number (a characteristic dimensionless param- e te r containing gravity and the liquid properties) was found to be a significant parameter in correlating normal- and low-gravity data. This report, together with normal-gravity theory, predicts bubble shape and terminal velocity when the liquid properties, the bubble volume, and the applied gravity field a r e known. The results a r e applicable to a range of spherical and ellipsoidal bubbles with Reynolds numbers above 50.
These data were compared with normal-gravity
INTROD UCTl ON
Small gas bubbles may form in the liquid systems of space vehicles. The dynamics of these bubbles can be an important consideration in vehicle design. formed, for example, by liquid boiling at sources of large heat input or by vehicle ma- neuvers that result in turbulent liquid motion such as sloshing and reorientation. ensuing bubble dynamics must be known and accounted for, as the performance of liquid space vehicle systems can be affected by the presence of entrained gas bubbles.
In general, the terminal velocities of gas bubbles are gravity-dependent. The gen- eral problem involving clusters of bubbles in a nonequilibrium thermal environment is complicated by the processes of condensation, breakup, and coalescence. Some of these processes have been studied with regard to space vehicle liquid systems under low- gravity conditions; for example, by Welch and Funk (ref. l), Holister, Satterlee, and Cohan (ref. 2), and Blackmon (refs. 3 and 4). Understanding the distribution and dy- namics of clusters of bubbles presumes a knowledge of the dynamics of a single bubble. Some low-gravity experimental data on the velocity of nucleate bubbles after they are detached from a heated surface were obtained by Siege1 (ref. 5). However, no other
Bubbles may be
The

low-gravity experimental data on single-bubble motion are available.
extensive, no attempt will be made to summarize the numerous papers applicable to the subject. An excellent summary and comprehensive reference list are given in a recent book by Brodkey (ref. 6). The papers of the experimentalists Haberman and Morton (ref. 7) and Peebles and Garber (ref. 8), and the theoretical work of Chao (ref. 9) and Moore (refs. 10 to 12) are frequently cited for their studies on the dynamics of single, noncondensable gas bubbles.
This report presents the results of an experimental study of some basic aspects of the motion of single, noncondensable gas bubbles under low-gravity conditions, and compares these results with published theory and experimental results. It is presently only surmised that the theory and empirical resul ts based on normal-gravity theory can be scaled to low-gravity environments. The study was conducted in the Lewis Research Center's 2. 2-Second Zero-Gravity Facility. 0.005 to 0 .05 g. Bubble radii ranged from 0.07 to 0.43 centimeter. on the terminal velocity and shape of these bubbles for Reynolds numbers from 12 to 1030.
Because the literature on bubble dynamics under normal-gravity conditions is so
The Facility provided gravity levels from Data were acquired
SYMBOLS
a
Re
eq r
'h
rV
T
t
V
V
2 acceleration, cm/sec
drag coefficient, 8 r a/3v eq dimensionless function of distortion parameter obtained by Moore (ref . 6)
acceleration due to gravity, 980 cm/sec
dimensionless function of distortion parameter
dimensionless parameter, 7 a/po
Reynolds number, 2reqv/v
equivalent radius of spherical bubble of same volume as an observed bubble, cm
semimajor axis perpendicular to direction of motion of bubble, cm
semiminor axis parallel to direction of motion of bubble, cm
temperature, OC
time, s ec
volume of bubble, cm
terminal velocity, cm/sec
2
2
4 3
3
2
w4X.l 77 V
P
(3
x
Weber number defined in te rms of distortion parameter
liquid viscosity, CP
kinematic viscosity, q/p, cm /sec
liquid density, g/cm
surface tension, dynes/cm
distortion parameter, rh/rv
2
3
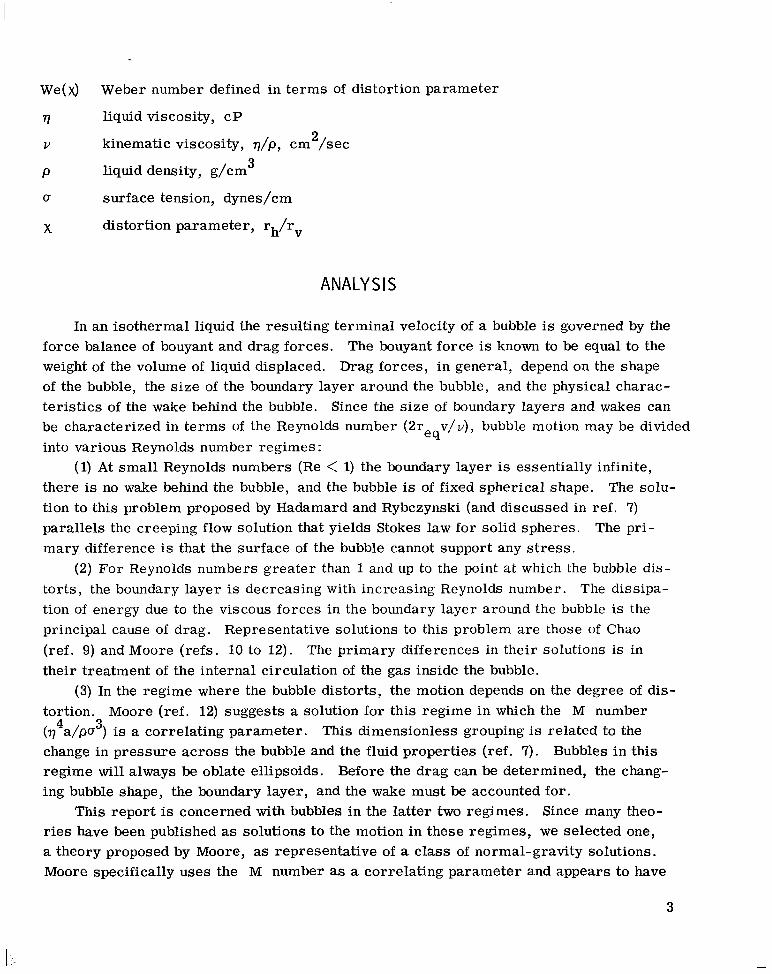
ANALYSIS
In an isothermal liquid the resulting terminal velocity of a bubble is governed by the force balance of bouyant and drag forces. The bouyant force is known to be equal to the weight of the volume of liquid displaced. Drag forces, in general, depend on the shape of the bubble, the s ize of the boundary layer around the bubble, and the physical charac- terist ics of the wake behind the bubble. Since the s ize of boundary layers and wakes can be characterized in te rms of the Reynolds number (2r into various Reynolds number regimes :
there is no wake behind the bubble, and the bubble is of fixed spherical shape. tion to this problem proposed by Hadamard and Rybczynski (and discussed in ref. 7) parallels the creeping flow solution that yields Stokes law for solid spheres. mary difference is that the surface of the bubble cannot support any s t r e s s .
tor ts , the boundary layer is decreasing with increasing Reynolds number. tion of energy due to the viscous forces in the boundary layer around the bubble is the principal cause of drag. Representative solutions to this problem a re those of Chao (ref. 9) and Moore (refs. 10 to 12). The primary differences in their solutions is in their treatment of the internal circulation of the gas inside the bubble.
tortion. Moore (ref. 12) suggests a solution for this regime in which the M number (q4a/po ) is a correlating parameter. change in pressure across the bubble and the fluid properties (ref. 7). regime will always be oblate ellipsoids. ing bubble shape, the boundary layer, and the wake must be accounted for.
ries have been published as solutions to the motion in these regimes, we selected one, a theory proposed by Moore, as representative of a class of normal-gravity solutions. Moore specifically uses the M number as a correlating parameter and appears to have
v/ u) , bubble motion may be divided eq
(1) At small Reynolds numbers (Re < 1) the boundary layer is essentially infinite, The solu-
The pri-
(2) For Reynolds numbers greater than 1 and up to the point at which the bubble dis- The dissipa-
(3) In the regime where the bubble distorts, the motion depends on the degree of dis-
3 This dimensionless grouping is related to the Bubbles in this
Before the drag can be determined, the chang-
This report is concerned with bubbles in the latter two regimes. Since many theo-
3

the most complete theory in the distorted gas bubble regime. His theory, which is ap- plicable to liquids and test conditions where the M number is less than lom8, extends from Reynolds numbers greater than 50 to the point where the bubble is distorted such that the ratio of the major axis to minor axis of the bubble equals 4. This ratio is the distortion parameter x, where
'h x = - V
r
This distortion parameter for a spherical bubble equals 1; for oblate ellipsoidal bubbles, it is greater than 1.
energy loss in the wake. The drag on the bubble is calculated as a result of these energy losses. The drag force may be expressed in the form
Moore's solution considers the dissipation of energy in the boundary layer and the
1 2 2 D r a g = - p m C v 2 eq D
where r has the physical meaning of the radius of an imagined spherical bubble con- taining the same volume as the observed bubble. This form of the drag differs from the standard, aerodynamic usage, where the frontal a r ea perpendicular to the flow, not rr2 would be used. As a result the drag coefficient in equation (2) is dependent on the
eq' shape of the bubble. For ellipsoids the equivalent radii r can be calculated from the equation
eq
eq
The drag coefficient is the term which takes into account all of the various mechanisms for dissipating energy. The drag coefficient is, in general, a function of the Reynolds number. Moore's solution defines the drag coefficient in te rms of the Reynolds number and various functions of x, a parameter which takes into account the shape of the bubble. The solution is
c = 4 8 W Re . 1 +""I Re 1/2
(4)
where
4

Y
and H(X) is a dimensionless parameter found by Moore (ref. 12) who obtained it by nu- merical integration, and for convenience is listed in table I . By equating the drag and buoyant forces , a solution for CD may be determined in dimensionless form as
(5) 4 4 3
C,, = - Re W ~ ( X ) - ~ M
where We($ has the numerical value of the Weber number and is given by
When a value of x and an M number a r e chosen, equations (4) and (5) can be solved simultaneously for CD and Re. equations.
ber . alent radius r by means of the transformation equations
The APPENDIX presents techniques for solving these
The result of this effort is to generate a curve of CD as a function of Reynolds num- These results can be shown in te rms of terminal velocity v as a function of equiv-
eq
The transformation equations (6) and (7) were found from both the definition of the Reynolds number and an equation for the drag coefficient found by equating the drag and buoyant forces.
These results indicate that the CD-Re curve is a universal one for a given M number, and not merely a curve for one test liquid. given M-number curve in the CD-Re plane may have many possible curves in the v-r plane. This is due to different test liquid properties and gravity fields, all of which go
By the transformation equations, a
eq
5
I?

into making up a fixed M number. Changing the M number will of course, change the CD-Re curve.
The M number, for a series of test liquids, can be varied by changing the gravity level on the experiment and studying the drag characteristics (with Reynolds number) of the motion of bubbles. This procedure should show whether the M number is the proper parameter for scaling normal-gravity resul ts to low-gravity environments. The experi- ment should include a study of the motion of bubbles in the ellipsoidal region since it is here that the M number is predicted to play an important role in determining bubble motion.
APPARATUS AND PROCEDURE
Test Liquids
The liquids used in this study were 1-butanol, anhydrous ethanol, and methanol. All were analytic reagent-grade liquids. Handbook values for the three pertinent liquid properties (density, viscosity, and surface tension) at specific temperatures for each of the three test liquids are given in table 11. These properties were used in the calcula-
4 3 tions of the Reynolds number (21- v/v) and the M number ( q a/po ). Kinematic vis- cosity and the liquid property ratio q /po3 a r e plotted in figure 1 as functions of tem- perature. Both the Reynolds number and the M number for each test was temperature- corrected. The investigation was limited to low-viscosity (0. 5 to 3 . 0 cP) liquids, be- cause bubbles in these liquids exhibit larger, more easily observable, terminal veloc- ities.
eq 4
Low-Gravity Tests
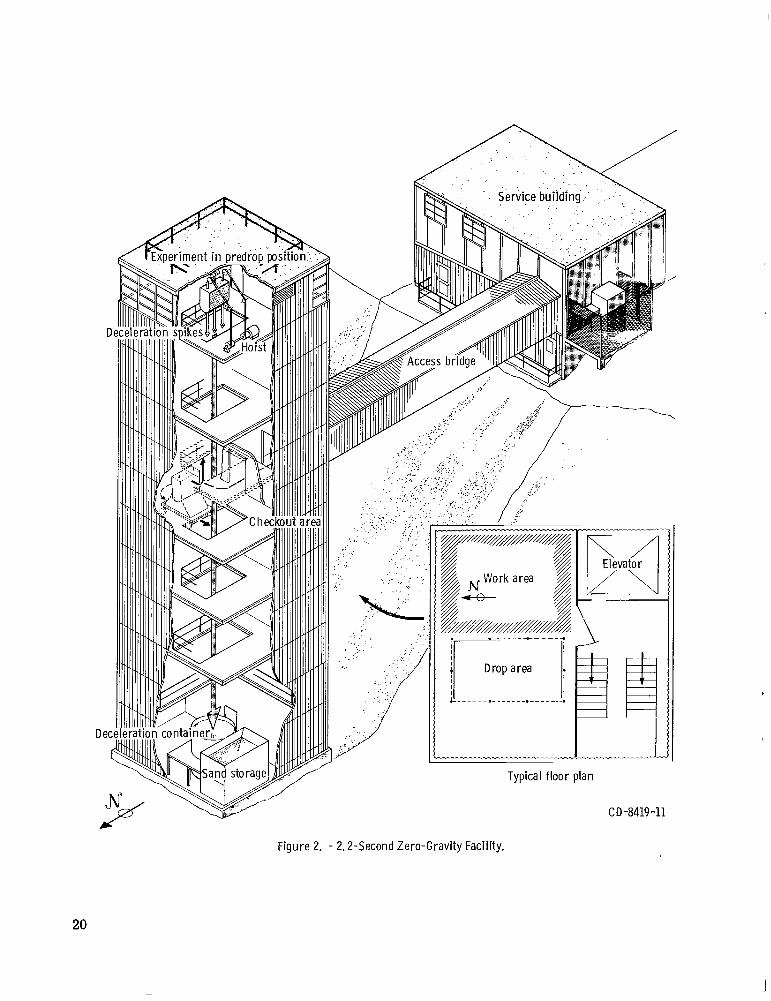
Test facility. - The experimental tes ts were conducted in the zero-gravity facility shown in figure 2. The free-fall distance of 24 meters allowed a 2. 2-second period of weightless test time. Effects of air drag on the experiment were maintained below by allowing the experiment package to fall inside a drag shield. During the drop, the package and drag shield fell simultaneously but were independent of each other. Low gravity was achieved on the experiment package by means of a gas thruster. A t the con- clusion of the drop, the package was decelerated by the penetration of the drag shield spikes in the sand of the deceleration container.
Experiment package. - The experiment tank was mounted in the experiment package shown in figure 3. The experiment package contained a high-speed, l6-mi1limeter7 motion-picture camera and backlighting, which was used to provide uniform illumination. A digital clock, accurate to 0.01 second, was in the field of view of the camera.
g
Both
6
I

the calibration of the magnitude of the thruster, used to apply a low-gravity acceleration, and alinement of the package's center of mass through the thrust axis, was performed according to the procedure outlined in reference 13.
~~ Experiment tank. - The acrylic plastic tank (fig. 4) used in low-gravity tests was made square in c ross section to provide flat faces to make refraction negligible. The tank dimensions are 17.8 by 9 . 3 by 9 . 3 centimeters. The inser t at the top of the tank was designed with an apex in it to provide an initial position for the vapor bubbles and contained a reservoir filled with the test liquid, with fill-vent lines extending down into the tank. The reservoir provided an expansion volume to prevent either bubble collapse o r unwanted vapor being pulled into the fill-vent lines whenever the tank heated or cooled slightly. The cross section of the tank used in this study was large enough so that wall effects were negligible. Wall effects are treated in reference 14, where it was found that they were negligible whenever the ratio of tank diameter to bubble diameter is greater than 10. A scale with 0.2-centimeter divisions was mounted vertically a t the same distance from the camera as the path of the bubble.
mild detergent solution, rinsed in distilled water, rinsed again in pure methanol, and dried in warm filtered air. taminating the tes t liquid. The tank was filled with liquid and a measured amount of air was injected into the tank, with a microliter syringe, through the fill-vent lines. The resulting bubble was located at the apex of the tank. Two seconds before the drop, the camera and lights were turned on; when the supporting music wire was cut, the clock started. After the package fell for about 0. 2 second, the thruster started and remained on for the balance of the drop. The sequential position of the experiment package in the drag shield during the test drop is shown in figure 5. The temperature of the liquid was recorded within 5 minutes after the drop. An isothermal condition was assumed for the system during the drop.
That ratio f o r the test runs ranged from 10 to 60.
For some of the tes ts , two tanks were studied side by side. Operating procedure. - Pr io r to all tes ts , the tank was ultrasonically cleaned in a
This procedure was followed to prevent the tank from con-
NormaI-Gravity Tests
The tank used in normal-gravity tests is shown in figure 6. It had a square c ross section 5.6 by 5.6 centimeters and is 17.8 centimeters high. The ratio of tank diameter to bubble diameter ranged from 17 to 83, hence, wall effects were negligible. each test , the tank was also ultrasonically cleaned and filled with liquid. With a microli ter syringe, a measured amount of air was injected into the tube that extended from the bottom of the tank. The bubble moved along the length of the tube and eventually into the tank.
Prior to
7
I I

A s the bubble rose in the tank it was photographed with a high-speed camera. The tem- perature was recorded just prior to the test.
RESULTS AND DISCUSSION
Representative Data
Bubble velocity and bubble shape measurements were obtained from the motion- picture film of each test. A typical low-gravity test is shown in figure 7. The double tanks used in the particular run shown were both filled with ethanol. The acceleration was 9 .8 centimeters per second squared. The left-hand tank has a 0.23-centimeter- radius bubble traveling at 6 .3 centimeters per second, the right-hand tank has a 0. 18- centimeter-radius bubble at a terminal velocity of 4. 8 centimeters per second. At the time of application of the thrust , each bubble had detached from the apex of the tank, was located on the centerline of the tank, and had a near-zero velocity. Radial oscillations of the bubble, which commonly occur as the bubble detaches from the top of the tank, damped out rapidly. After the thrust w a s applied, the bubble began moving. About midway into the tes t , the bubble had reached terminal velocity and remained at this velocity until the end of the test . Its terminal velocity was measured over an average distance of 5 to 10 bubble diameters. Typically, terminal velocity measurements took place within 1 sec- ond.
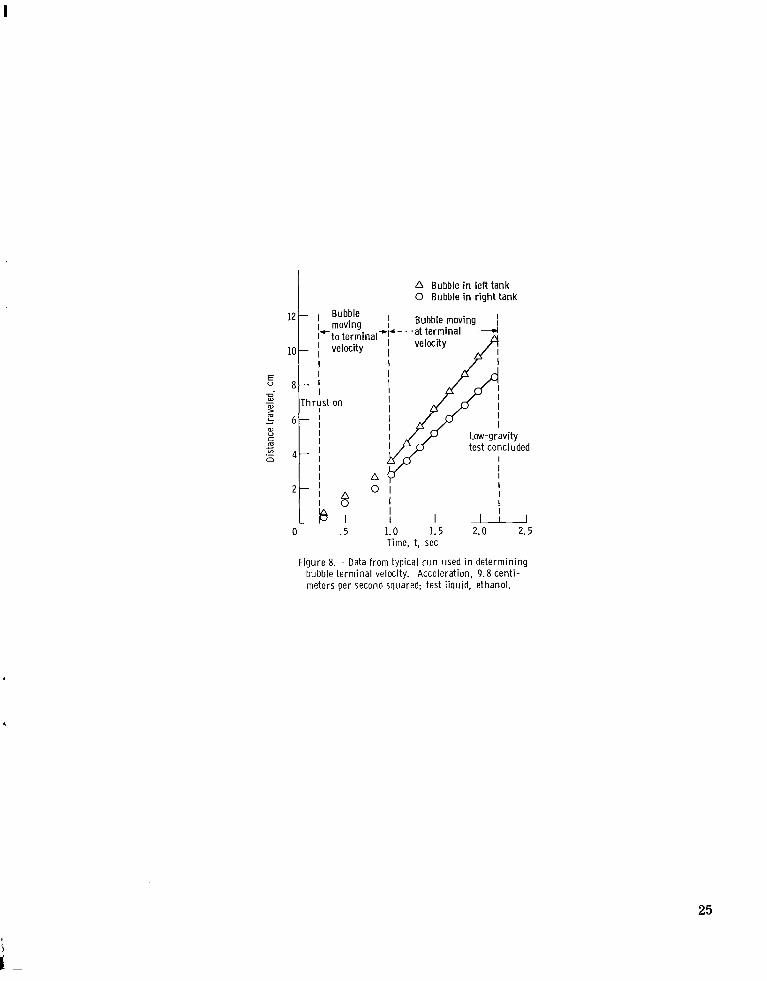
The time and distance the bubbles traveled were recorded at intervals throughout the test. After a judgement of when terminal velocity was reached, the slope of the least- mean-square f i t to the remaining points was considered to be the terminal velocity of the bubble (see fig. 8). After each bubble had reached terminal velocity, the shape mea- surements were made. The shape was determined by measuring the horizontal and ver- tical axes of the bubble and computing x, the distortion parameter. Bubbles were con- sidered to be spherical if 0 .9 5 x I 1.05, because of the inherent inaccuracies in the measurements of the bubble axes, particularly around x = 1. terminal velocity appeared to be fixed in shape with no radial oscillations. Distorted bubbles , photographed in runs using single tanks , a r e shown in figure 9. The single tanks allowed more precise measurements of the shape of the bubble.
The bubbles observed at
The drag coefficient CD was determined from the experimental data and the equa- tion
which is found by rearranging equation (6).
8
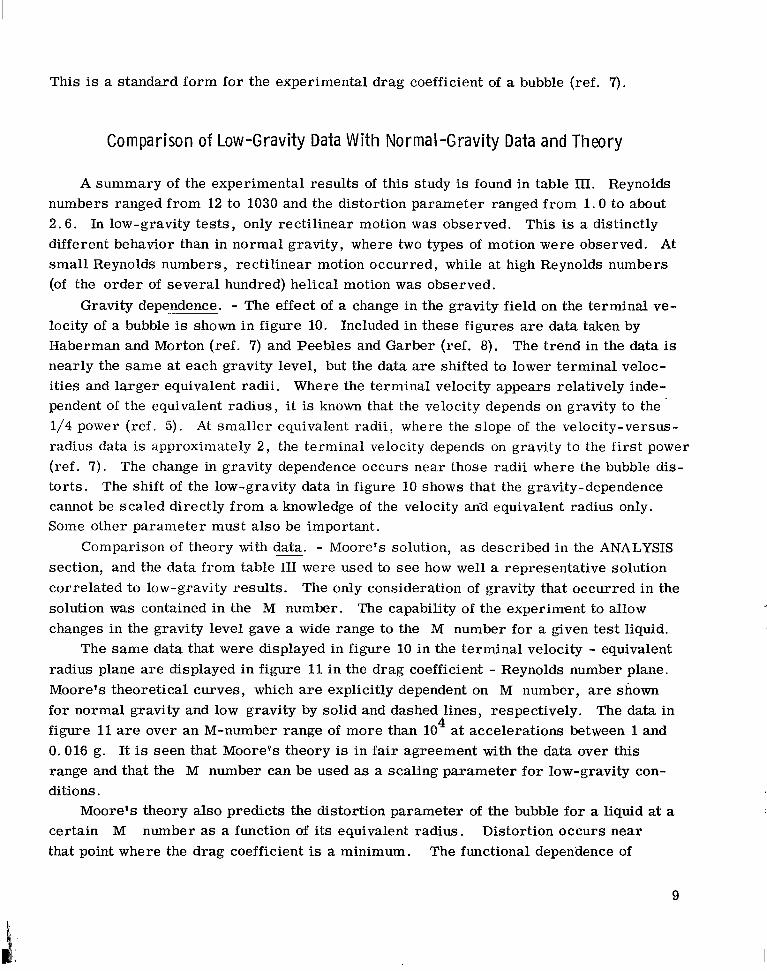
This is a standard form for the experimental drag coefficient of a bubble (ref. 7).
Comparison of Low-Gravity Data Wi th Normal-Gravi ty Data and Theory
A summary of the experimental results of this study is found in table III. Reynolds numbers ranged from 12 to 1030 and the distortion parameter ranged from 1 . 0 to about 2.6. In low-gravity tes ts , only rectilinear motion was observed. different behavior than in normal gravity, where two types of motion were observed. At small Reynolds numbers, rectilinear motion occurred, while at high Reynolds numbers (of the order of several hundred) helical motion was observed.
locity of a bubble is shown in figure 10. Included in these figures are data taken by Haberman and Morton (ref. 7) and Peebles and Garber (ref. 8). nearly the same at each gravity level, but the data are shifted to lower terminal veloc- ities and larger equivalent radii. Where the terminal velocity appears relatively inde- pendent of the equivalent radius, i t is known that the velocity depends on gravity to the 1/4 power (ref. 5). radius data is approximately 2 , the terminal velocity depends on gravity to the first power (ref. 7). torts. cannot be scaled directly from a knowledge of the velocity and equivalent radius only. Some other parameter must also be important.
section, and the data from table III were used to see how well a representative solution correlated to low-gravity results. The only consideration of gravity that occurred in the solution was contained in the M number. The capability of the experiment to allow changes in the gravity level gave a wide range to the M number for a given test liquid.
The same data that were displayed in figure 10 in the terminal velocity - equivalent radius plane are displayed in figure 11 in the drag coefficient - Reynolds number plane. Moore's theoretical curves, which are explicitly dependent on M number, are shown for normal gravity and low gravity by solid and dashed lines, respectively. figure 11 are over an M-number range of more than 10 at accelerations between 1 and 0.016 g. It is seen that Mooreps theory is in fair agreement with the data over this range and that the M number can be used as a scaling parameter for low-gravity con- ditions.
This is a distinctly
Gravity ~~~~~~ dependence. - The effect of a change in the gravity field on the terminal ve-
The trend in the data is
At smaller equivalent radii, where the slope of the velocity-versus-
The change in gravity dependence occurs near those radii where the bubble dis- The shift of the low-gravity data in figure 10 shows that the gravity-dependence
Comparison of theory with data. __ - Moore's solution, as described in the ANALYSIS
The data in 4
Moore's theory also predicts the distortion parameter of the bubble for a liquid at a certain M number as a function of i ts equivalent radius. Distortion occurs near that point where the drag coefficient is a minimum. The functional dependence of
9

x on the equivalent radius is shown in figure 12. The figure shows that Moore has rea- sonably predicted the distortion of a bubble within the limits of the experiment. It can be noted from figure 12 that, in low-gravity, the shape of the bubble distorts from a sphere to an oblate ellipsoid at much larger bubble radii than at normal gravity. The rate of distortion with increasing bubble size was observed to be much less in low grav- ity, These results are in agreement with Moore's theory.
The data obtained at NASA and from the normal-gravity experimenters (refs. 7 and 8) are shown in figure 13. The M numbers have been rounded off to the nearest half decade. Bubble distortion begins to occur near the minima of the curves. For distorted bubbles, a trend can be observed for the liquids tested. The upward shift of the curve and larger distortion of the bubble are delayed to higher Reynolds numbers and lower drag coeffi- cients for lower-M-number test conditions. The data verify this predicted shift for an M-number range from to The absolute value of the data in the various M- number regimes as compared with Moore's theory shows a larger e r r o r as the M number is decreased.
shape as functions of the bubble size, given the liquid properties and the applied gravity field. This is done by first determining a test M number, then generating a curve in the drag coefficient - Reynolds number plane by means of the techniques employed in the APPENDIX. This curve is then transformed point by point into the terminal velocity - equivalent radius plane by means of the parameteric equations (6) and (7). The terminal velocity can be found for various bubble volumes by knowing
Application. - It is possible to predict the terminal velocity of a bubble and its
req = E where V is the known bubble volume.
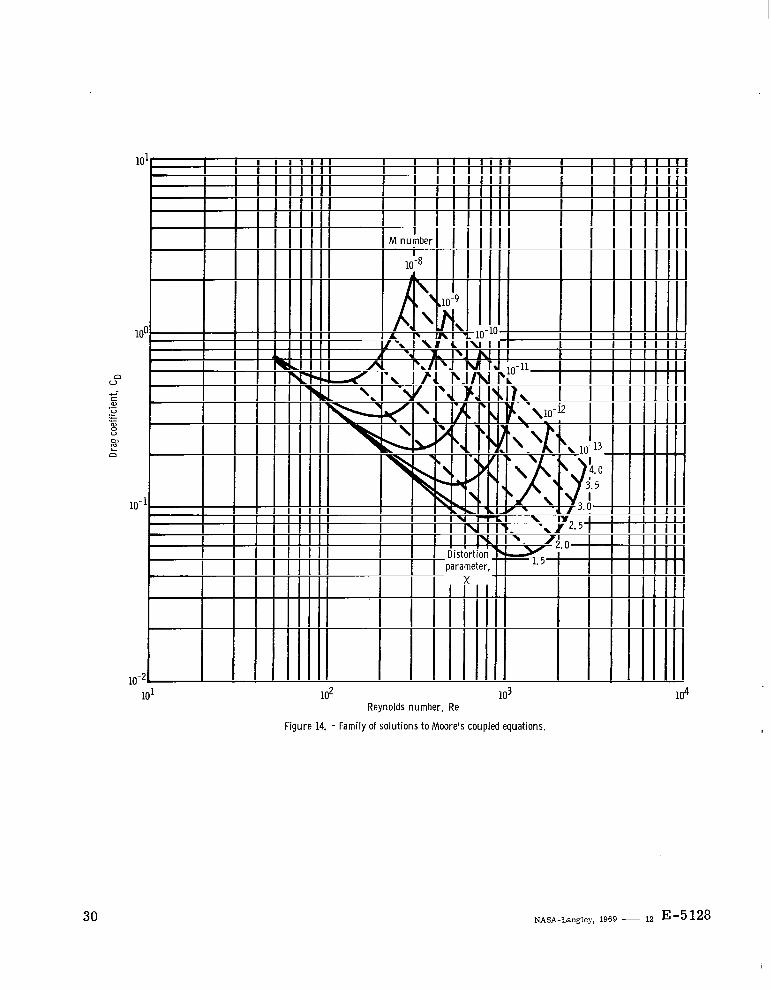
The shape is found by using the lines where the distortion parameter is constant (see fig. 14) and equation (7). The result is a curve of distortion parameter as a function of the equivalent radius. Such a curve is shown in figure 12. The preceding methods apply to bubbles with a range of the distortion parameter less than 4 and with Reynolds num- bers above 50.
SUMMARY OF RESULTS
An experimental study was undertaken to examine sclme basic aspects of the motion of single noncondensable bubbles under low-gravity conditions. Data were obtained on bubble shape and terminal velocity for Reynolds numbers from 12 to 1030, where bubble
10

radii ranged in s i ze f rom 0.07 to 0.43 centimeter. The study was conducted in the Lewis Research Center's 2.2-Second Zero-Gravity Facility, which provided gravity levels f rom 0.005 to 0.05 g. These data were compared with normal-gravity theory and empirical results.
The following results were observed: 1. Only rectilinear motion was observed in the low-gravity tes ts of this study. This
is a distinctly different behavior than in normal gravity, where over the same range of Reynolds numbers bubbles move in either rectilinear or helical motion, with Reynolds numbers of several hundred being the point where the change in the type of motion is ob- served .
pected, reduced from its normal-gravity value. The percentage of this reduction var ies with the size of the bubble.
3. In low gravity, because of the reduced velocity, the shape of the bubble distorted from spherical to ellipsoidal at much larger bubble radii than in normal gravity. The rate of change of distortion with increasing bubble radius was observed to be much less in low gravity.
4. Using Moore's solution as representative of a class of theoretical descriptions of bubble motion within the Reynolds number regimes studied, it was found that this solu- tion m s in fair agreement with the data when the solution was scaled by the M number. The M number ranged from lom7 to
2. The study showed that the terminal velocity of a bubble in low gravity is, as ex-
Lewis Research Center, National Aeronautics and Space Administration,
Cleveland, Ohio, June 23, 1969, 124-09- 17-0 1- 22.
11

APPENDIX - COMPUTATIONAL PROCEDURES FOR MOORE'S ANALYSIS
Moore's solution defines the drag coefficient CD in t e rms of the Reynolds number Re and two functions of x, a parameter which takes into account the shape of the bubble. Strict limitations on this equation state that the Reynolds number must be above 50 and that the distortion parameter x must be less than 2, for liquids and test conditions such that the M number is less than However, as was pointed out by Moore, the equa- tion yields reasonable resul ts up to x = 4. The solution that was presented in the ANALYSIS section is
where
and H(X) is a dimensionless parameter found by Moore (ref. 12) who obtained it by num- er ical integration, and for convenience is listed in table I.
mensionless form as By equating the drag and bouyant forces, a solution for CD was determined in di-
( 5) 4 4 3 3
CD = - Re We(X)- M
where We(x) has the numerical value of the Weber number and is given by
This process of generating the CD-Re curve for a given M number begins by as-
Due to the complexity suming a value of x. The functions, We(X), H(X), and G(X) a r e then determined. Equa- tions (4) and (5) a r e then solved simultaneously for CD and Re. of the functional relation of CD on Re, particularly in equation (4), numerical tech- niques were used to calculate CD to the nearest hundredth. Results of these compu-
12
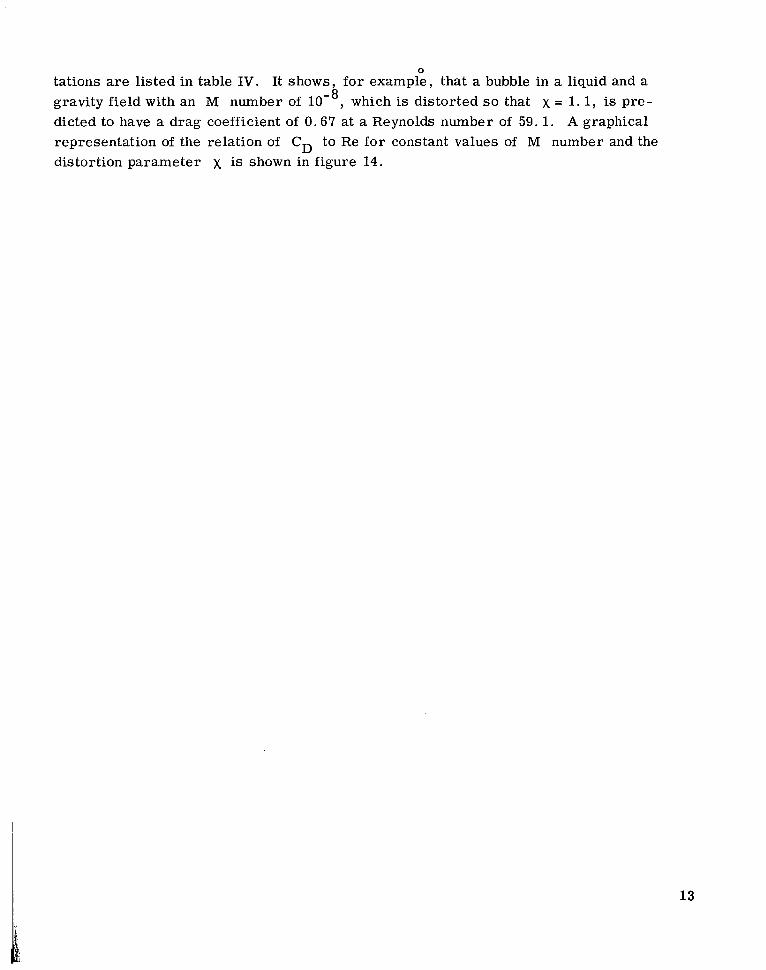
0
tations are listed in table IV. It shows, for example, that a bubble in a liquid and a gravity field with an M number of which is distorted so that x = 1. 1, is pre- dicted to have a drag coefficient of 0.67 at a Reynolds number of 59.1. A graphical representation of the relation of CD to Re for constant values of M number and the distortion parameter x is shown in figure 14.
13

REFERENCES
1. Welch, N. E . ; and Funk, E. : Distribution of Noncondensable Gases in Liquids Under Low-G Conditions. Paper presented at USAF/OSR and Lockheed Missiles and Space Co. Symposium on Fluid Mechanics and Heat Transfer Under Low Gravitational Conditions, Palo Alto, Calif., June 24-25, 1965.
2. Holister, M. P. ; Satterlee, H. M. ; Cohan, H. : A Study of Liquid Propellant Be- havior During Periods of Varying Accelerations. Rep. LMSC-A874728, Lockheed Missiles and Space Co. (NASA CR-92082), May 23, 1967.
3. Blackmon, J. B. : Ullage Gas Distribution in Liquid Propellant Tanks After Re- settling. Rep. DAC-62202, Missile and Space Systems Div., Douglas Aircraft Co., Mar. 1968.
4 . Blackmon, J. B. : Propellant Settling. Rep. DAC-62263, Missile and Space Sys- tems Div., Douglas Aircraft Co., May 1968.
5. Siegel, Robert: Effects of Reduced Gravity of Heat Transfer. Advances in Heat Transfer. Vol. 4. J. P. Hartnett and T. F. Irvine, Jr., eds . , Academic Press, 1967, pp. 190-191.
6. Brodkey, Robert S. : The Phenomena of Fluid Motions. Addison-Wesley Publ. Co., 1967.
7. Haberman, W. L. ; and Morton, R. K. : An Experimental Investigation of the Drag and Shape of A i r Bubbles Rising in Various Liquids. Rep. 802, David W. Taylor Model Basin, Sept. 1953. (Available from DDC as AD-19377).
8. Peebles, Fred N. ; and Garber, Harold J. : Studies on the Motion of Gas Bubbles in Liquids. Chem. Eng. P rogr . , vol. 49, no. 2 , Feb. 1953, pp. 88-97.
9. Winnikow, S. ; and Chao, B. T. : Droplet Motion in Purified Systems. Phys. Fluids, vol. 9, no. 1, Jan. 1966, pp. 50-61.
10. Moore, D. W. : The Rise of a Gas Bubble in a Viscous Liquid. J. Fluid Mech., VOI. 6, pt. 1, July 1959, pp. 113-130.
11. Moore, D. W. : The Boundary Layer on a Spherical Gas Bubble. J. Fluid Mech., vol. 16, pt. 2, June 1963, pp. 161-176.
12. Moore, D. W. : The Velocity of Rise of Distorted Gas Bubbles in a Liquid of Small Viscosity. J. Fluid Mech., vol. 23, pt. 4, Dec. 1965, pp. 749-766.
14
13. Masica, William J. ; and Petrash, Donald A. : Motion of Liquid-Vapor Interface in Response to Imposed Acceleration. NASA TN D-3005, 1965.
14. Uno, Seiji; and Kintner, R. C. : Effect of Wall Proximity on the Rate of Rise of Single A i r Bubbles in a Quiescent Liquid. AIChE J., vol. 2, no. 3, Sept. 1956, pp. 420-425.
15

TABLE 11. - SUMMARY O F LIQUID PROPERTIES
TABLE I. - H(X) IN MOORE'S SOLUTION Liquid property
Liquid density, g/cm3: 0.813
. 8 1 0
.a06 Surface tension, dynes/cm
26. 2 24. 6 22. 1
Liquid viscosity, cp: 3.38 2. 95 2. 30
Liquid density, g/cm3: 0.789
.785
. 7 8 1 Surface tension, dynes/cm:
23.6 22. 8 21. 9
Liquid viscosity, cP: 1.47 1. 20 1 .00
.iquid density, g/cm3: 0 . 7 9 1
. 7 8 7
. 7 8 2 ur face tens ion, dynes /cm:
24.5 22. 6 2 0 . 1
,iquid viscosity, c P 0. 60
. 5 5
. 5 1
I'emperature C 0
15 20
25
0 20 50
15 20 30
20 25 30
10 20 30
10 20
30
20 25 30
0 20 50
20 25 30
16

TABLE III. - SUMMARY OF EXPERIMENTAL RESULTS
Liquid
.-Butanol
Cthanol
fiethanol
rem per a ture T, OC
26 25 26 23 22 24 26 21 22 21 21 22 21
24 25 25 21 22 22 23 23
26 24 26 21 24 26 22 23 25 23 2 1 22 19 22
kceleration, a,
cm/sec 2
12. 0 12. 1 16.0 32. 1
i I
980
5.0 9. 5 9. 5 9 .7 9.8 9 .8
10.5 10.5
4 . 9 5 . 0 5 . 0 8. 1
18. 2 18. 2 18. 5 18. 7 18.9 30. 5 32. 3 32. 3 33 .1 47.0
I‘er minal velocity,
v, cm/sec
3 . 7 6 .9 7 . 7 2.3 4.9 7 . 5 8. 7 9. 6 9 . 7
10.4 21.7 20 .2 19.4
5. 0
3 . 7 7.9 7. 0 4. 8 6.3 1. 4 2.7
4 . 8 6. 6 7. 0 7 . 4 8 . 9 7. 9 3.8 8 .9 8.4
10.0 4.7
11.1 11. 8 12. 8
Equivalent radius,
req’ cm
0 .21 .38 . 4 2 . 0 9 . 19 . 23 . 3 2 . 4 3 .03 . 0 4 . 0 7 .11 . 17
0. 26 . 16 . 29 .38 . 18 . 23 .07 .ll
0.19 . 28 . 3 7 .40 . 26 . 3 8 . 0 9 .19 .15 . 3 7 .07 . 16 .25 . 17
3istortion iarameter,
X
0.94 1. 20 1. 32 .97
1. 02 1.09 1. 33 1 .61 1. 03 1. 13 1. 52 2. 18 2. 36
1.03 . 9 5
1. 24 1. 40 1.05 1.07
. 9 2
.93
0.98 1. 13 1. 3 1 1. 52 1. 50 2. 18
. 9 7 1. 16 1.06 2.58
.99 1. 34 2. 06 1. 65
Reynolds number,
Re
50 150 200
12 55
100 180 230
19 24 86
130 190
190 84
330 360 120 190
14 4 1
270 530 740 780 650 840
89 470 370
1030 87
500 780 580
Drag oefficient
CD
0.49 . 26 . 3 0
1.49 .67 .35 . 3 6 . 3 9 . 9 2 .97 . 4 0 . 7 1
1. 20
0. 14 . 2 9 . 1 2 . 2 0 . 2 1 . 15 .94 .45
0 . 1 1 . 0 9 .10 . 16 . 16 . 3 0 . 3 0 . 1 2 . 11 .30 . 27 . 11 . 16 . 13
-
Dimensionless parameter,
4 3 M = q a/pa
4.5X10-lo 6. 9 6 . 0 1.5x10-’ 1.7 1.4 1. 2 1. 9
5.6 5 .6 5. 1 5.6
5.1x10⁻⁸
9.4XlO- l ’ 1 . 7 ~ 1 0 - I ’ 1. 7 2. 1 2. 1 2. 1 2. 1 2. 1
5. 3 x 1 0 - l ~ 5 .7 5.4 1. 1x10-12 2. 0 2. 1 2. 4 2. 1 2. 0
3.6 4. 3 4 . 1 4 . 7 5 . 9
17
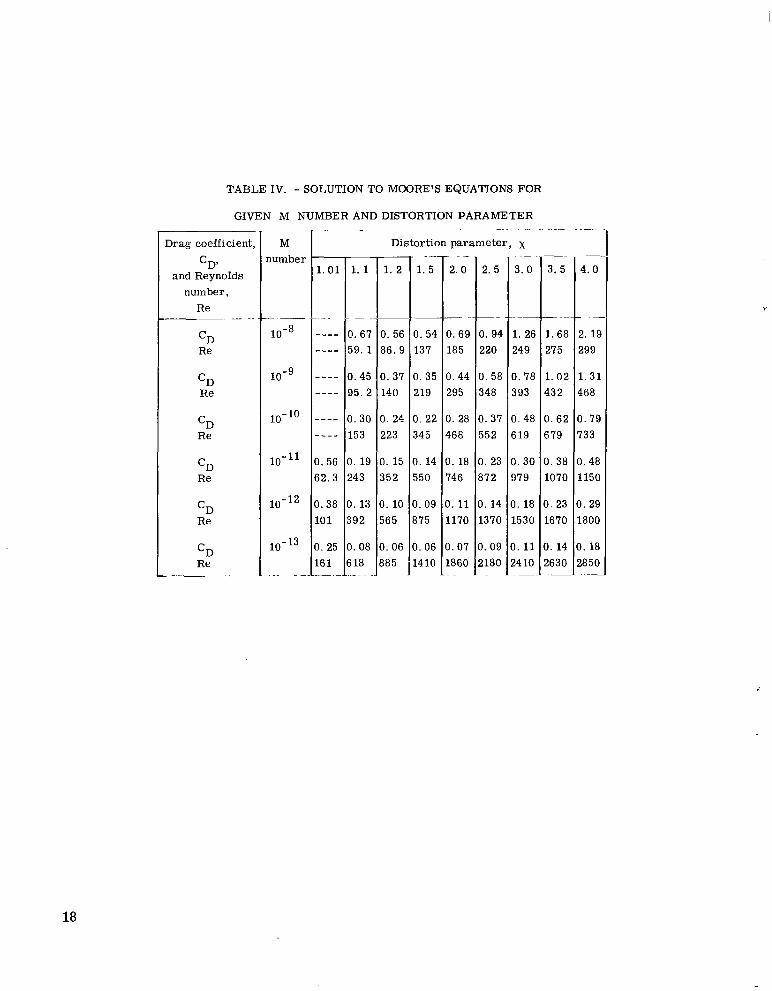
TABLE IV. - SOLUTION TO MOORE'S EQUATIONS FOR
GIVEN M NUMBER AND DISTORTION PARAMETER
Drag coefficient,
and Reynolds number,
Re
cD'
cD Re
cD Re
cD Re
cD Re
cD Re
cD Re
M lumber
10-8
IO-^
10-10
10-11
10-12
1 0 - l ~
._
-
---- 0. 67 ---- 59.1
---- 0.45 - -_ - 95.2
_-__ 0.30 153 - -_-
I . 56 0. 19 j2 .3 243
).38 0. 13 101 392
1. 25 0.08 161 618 - - .
Distortion parameter, x -
3.0
. _ _
1. 2f 249
0.78 393
0.48 6 19
0. 30 979
0. 18 1530
D. 11 24 10 .-
_ _ 3.5
- ~.
1. 68 27 5
1 .02 432
0.62 679
0. 38 1070
D. 23 1670
D. 14 2630 ___
~- 4.0
- .-
2. 1 9 299
1. 31 468
0.79 733
0.48 1150
3. 29 1800
3. 18 2850 __
18

V W VI
N- E
a- U
s ?z VI 0
> U
m
2 .- .- ..- E c Y .-
E m-
V
V W VI
Liquid - l-Butano l - - Ethanol ---- Methanol
.02 ------ _-_-- ------ - _ _ - - _ _ - - - _ . 0 1
I I (a) Kinematic viscosity.
m - 1 0 - 1 1 1
(b) Liquid property ratio.
Figure 1. - Temperature dependence of kinematic viscosity and l iquid property ratio.
19
20

Th rust nozz le
· I
"' cuua Z
Figure 3. - Experiment package.
i Reservoir /
Insert -.....,~ :r-- II
I I I/'I I
/' I I I/,/' <- Fill-vent I
Apex lines I I I I I I I
I I I I I I I I t--0. 45 em I I I I I I I
I 17. 8 em I I I I I I I I I
f---9.3 em---1
C-67-1502
C -68-1040
Figu re 4. - Experiment tank used in low~ravity tests.
21

Drag shield cou n terba Ian ce
, ,-Center-of- I/’ mass axis
Spacer
Drag shield
( a ) Position p r io r to test drop.
W Q W Q W (c) Application of t h r u s t (low-acceleration field).
I 1 I .................. ............. ......... ................ ..................
I I
$. -r
(b) Free fall.
I ,
W C D -8742-13
(d ) Position after test drop.
Figure 5. - Schematic drawing showing sequential position of experiment package and drag shield before, dur ing, and af ter test drop.
22

!--5.6 cm--j
I \ I I I I I I I I I I I I I I I I
17.8cm i : I I I I I I : O. 3 Crn---i I I I I I I
I :
O.8cm-j f--
C-68-1041
Figure 6. - Experiment tank used in normal-gravity tests.
23

24
(a) Application of thrust; time, 0.22 second.
o
(c) Bubble moving at terminal velocity; time; 1.60 seconds.
(bl Bubble moving to terminal velocity; time, 0.60 second.
(dl Position of bubble just prior to end of drop; time, 2.16 seconds.
Figu re 7. - Typical run sequence.
I
A Bubble in left tank 0 Bubble in r i g h t tank
- I Bubble moving I Bubble moving I
- ifto I velocity terminal+l-at / terminal 4
I I
_ I I
h r y s t on - I I
I I I I Low-gravity
0 1 I
I I
I test concluded I
I I I I I A
I
_ I
_ I
1 8 I I I
I I I I I
0 .5 1.0 1.5 2.0 2.5 Time, t, sec
Figure 8. - Data from typical run used in determining
B I
bubble terminal velocity. Acceleration, 9.8 cent i - meters per second squared; test liquid, ethanol.
25

26
(a) Test liquid, I-butanol; acceleration, 12.0 centimeter per second squared; equivalent radius, 0.21 centimeter; distortion parameter, 0.94; terminal velocity, 3.7 centimeters per second.
(c) Test liquid, methanol; acceleration, 33.1 centimeters per second squared; equivalent radius, 0.25 centimeter; distortion parameter, 2.06; term nal velocity, 11.8 centimeters per second.
(b) Test liquid, methanol; acceleration, 18.2 centimeters per second squared; equivalent radius, 0.26 centimeter; distortion parameter, 1. 50; terminal velocity, 8.9 centimeters per second.
(d) Test liqu id, methanol; acceleration, 30.5 centimeters per second squared; equivalent radiu s, 0.37 centimeter; distortion parameter, 2.58; terminal velocity, 10.0 centimeters per second.
Figu re 9. - Distorted bubbles.

Source Acceleration, M number
102
100 10-2
0 NASA 0 NASA A Ref. 8 V Ref. 7 0 NASA L L I
r I I
I I
i I
1 I I 1
I
I
r I 4 7
I I
980 5 ~ 1 0 - ~ 32 1 . 4 ~ 1 0 - ~
980 5 ~ 1 0 - ~ 980 8 . 9 ~ 1 0 - l ~
18 2 . 1 ~ 1 0 - ~ ~
(a) 1-Butanol.
10-1 100 Equivalent radius, req, cm
(b) Methanol.
Figure 10. - Effect of gravity on terminal velocity of bubbles.
27

I Source Acceleration, M number
101
100
c 10-1 n u
0 NASA 980 5 ~ 1 0 - ~ 0 NASA 32 1. 4 x W 9
F - a Ref. 8 980 5 ~ 1 0 - ~ - - Moore's theory
- 5 ~ 1 0 - ~ a
- for M number - a -
1. 4 x W 9 -- -
I I - - - J / ' 0
7 00 - - '&.-,a' - -
I I I I11111 I I I111111 I 1 l l l l l l l
- Source Acceleration, M number V
a, c m/ sec2
0 NASA 18 2.1x10⁻¹² V Ref. 7 980 8.9~10-' I
Moore's theory for M number - vv
V v 8 . 9 ~ 1 0 - l ~ V V 2.1x10⁻¹²
1 1
102 103 Reynolds number, Re
(b) Methanol.
Figure 11. - Effect of gravity on drag coefficient, ,
28

Source Acceleration, M number a,
cm/sec2 0 NASA 980 5 ~ 1 0 - ~ 0 NASA 32 1 . 4 ~ 1 0 ' ~
Moore's theory for M number -
L- //' /
a,
/
L m /A0 D-. CL
0
0 v)
r 1 c .- n
I I I 0 . 2 . 4 .6
Equivalent radius, req, cm
Figure 12. - Typical amount of distori t ion to an oblate ellipsoid as function of bubble size. Test liquid, l-butanol.
Figure 13. - Experiment results showing M-number t rend on drag coefficient for various liquids and gravity fields.
29
1
I
c
30
102 103 Reynolds number, Re
Figure 14. - Family of solut ions to Moore's coupled equations.
NASA-Langley, 1969 - 12 E-5128

NATIONAL AERONAUTICS A N D SPACE ADMINISTRATION WASHINGTON, D. C. 20546
OFFICIAL BUSINESS FIRST CLASS MAIL
POSTAGE AND FEES PAID NATIONAL AERONAUTICS AND
SPACE ADMINISTRATION
POSTh.fASTER: If Undeliverable (Section 158 I Postal Manual) Do Not Return
"The aesoncri/tiral diad space nctizjities of the Uuited States shall be couducted so as t o coiztsibnte . . . t o the expaasion of humm kizozul- edge of phenou iem ia the atiiiosphese a d space. T h e Adiiiiizistsatioit shall psoi'ide fos the widest psncticable aiad appropsiate dissemimtion of infosmntion coiicesnhig i t s nctisities and the resdts theseof."
-NATIONAL AERONAUTICS A N D SPACE ACT OF 1958
NASA SCIENTIFIC AND TECHNICAL PUBLICATIONS
TECHNICAL REPORTS': Scientific and technical information 'considered important, complete, and a lasting contribution to existing knowledge.
TECHNICAL NOTES: Information less broad in scope but nevertheless of importance as a contribution to existing knowledge.
TECHNICAL MEMORANDUMS: Information receiving limited distribution because of preliminary data, security classifica- tion, or other reasons.
TECHNICAL TRANSLATIONS: Information published in a foreign language considered to merit NASA distribution in English.
SPECIAL PUBLICATIONS: Information derived from or of value to NASA activities. Publications include conference proceedings, monographs, data compilations, handbooks, sourcebooks, and special bibliographies.
TECHNOLOGY UTILIZATION PUBLICATIONS: Information on technology used by NASA that may be of particular interest in commercial and other non-aerospace applications. Publications include Tech Briefs, Tcc~l,lology Utilization Reports and Notes, and Technology Surveys.
CONTRACTOR REPORTS: Scientific and technical information generated under a NASA contract or grant and considered an important contribution to existing knowledge.
Details on the availability of these publications may be obtained from:
SCIENTIFIC AND TECHNICAL INFORMATION DIVISION
NATIONAL AERONAUTICS AND SPACE ADMINISTRATION Washington, D.C. 20546