NASA TECHNICAL NASA TM X-3362 · 2013-08-31 · NASA TECHNICAL MEMORANDUM CO CO NASA TM X-3362 CAS...
31
NASA TECHNICAL MEMORANDUM CO CO NASA TM X-3362 CAS c .*•*» •« HEAT-TRANSFER CHARACTERISTICS OF PARTIALLY FILM COOLED PLUG NOZZLE ON A J-85 AFTERBURNING TURBOJET ENGINE Stanley M. Nosek and David M. Straight Lewis Research Center Cleveland, Ohio 44135 \ NATIONAL AERONAUTICS AND SPACE ADMINISTRATION • WASHINGTON, D. C. • MARCH 1976 https://ntrs.nasa.gov/search.jsp?R=19760011041 2020-03-27T22:43:58+00:00Z
Transcript of NASA TECHNICAL NASA TM X-3362 · 2013-08-31 · NASA TECHNICAL MEMORANDUM CO CO NASA TM X-3362 CAS...

NASA TECHNICAL
MEMORANDUM
COCO
NASA TM X-3362
CASc
.*•*»•«
HEAT-TRANSFER CHARACTERISTICS OF PARTIALLY
FILM COOLED PLUG NOZZLE ON A J-85
AFTERBURNING TURBOJET ENGINE
Stanley M. Nosek and David M. Straight
Lewis Research Center
Cleveland, Ohio 44135\
NATIONAL AERONAUTICS AND SPACE ADMINISTRATION • WASHINGTON, D. C. • MARCH 1976
https://ntrs.nasa.gov/search.jsp?R=19760011041 2020-03-27T22:43:58+00:00Z

I. Report No.
NASA TMX-33622. Government Accession No. 3. Recipient's Catalog No.
4. Title and Subtitle HEAT-TRANSFER CHARACTERISTICS OF
PARTIALLY FILM COOLED PLUG NOZZLE ON A J-85AFTERBURNING TURBOJET ENGINE
5. Report Date
March 19766. Performing Organization Code
7. Author(s)
Stanley M. Nosek and David M. Straight8. Performing Organization Report No.
E-8553
9. Performing Organization Name and Address
Lewis Research CenterNational Aeronautics and Space AdministrationCleveland, Ohio 44135
10. Work Unit No.
505-0411. Contract or Grant No.
12. Sponsoring Agency Name and Address
National Aeronautics and Space AdministrationWashington, D. C. 20546
13. Type of Report and Period Covered
Technical Memorandum14. Sponsoring Agency Code
15. Supplementary Notes
16. Abstract
Plug nozzle film-cooling data were obtained downstream of a slot located at 42 percent of thetotal plug length on a J-85 engine. Film cooling reduced the aft end wall temperature as muchas 150 K (250° R), reduced total pressure loss in the upstream convection cooling passages by50 percent, and reduced estimated compressor bleed flow requirement by 14 percent comparedto an all convectively cooled nozzle. Shock waves along the plug surface strongly influencedtemperature distributions on both convection and film cooled portions. The effect was mostsevere at nozzle pressure ratios below 10 where adverse pressure gradients were most severe.
17. Key Words (Suggested by Author(sl)
Turbine exhaust nozzles; Plug nozzles; Ex-haust nozzles; Film cooling; Cooling; Super-sonic heat transfer; Shock wave interaction;Heat transfer
18. Distribution Statement
Unclassified - unlimitedSTAR Category 07
19. Security Oassif. (of this report)
Unclassified20. Security Classif. (of this page)
Unclassified21. No. of Pages
30
22. Price"
$3.75
* Foi sale by the National Technical Information Sewice, Springfield, Virginia 22161

HEAT-TRANSFER CHARACTERISTICS OF PARTIALLY FILM COOLED PLUG
NOZZLE ON A J-85 AFTERBURNING TURBOJET ENGINE
by Stanley M. Nosek and David M. Straight
Lewis Research Center
SUMMARY
As part of a continuing investigation on plug nozzles, a partially film cooled plugnozzle was tested at exhaust gas temperatures up to 2040 K (3675° R). An annular filmcooling slot was located 42 percent of the plug length downstream of the nozzle's pri-mary throat. The plug surface upstream of the film cooling slot was convectivelycooled. Data were obtained over a range of coolant flow rates and nozzle pressure ra-tios at several nozzle inlet pressures and temperatures.
A comparison of the film cooled plug with a convectively cooled plug which wastruncated at 60 percent of its full length showed a 90 to 150 K (160° to 250° R) reductionin wall temperatures between the 42 and 60 percent plug locations for the film cooledconfiguration. In addition, the total pressure loss of the convectively cooled portion ofthe plug decreased about 50 percent and the plug coolant flow necessary to keep the plugsurface below its design maximum of 1220 K (2200° R) was estimated to be reduced by14 percent to 3. 0 percent of compressor flow. (The all convectively cooled plug re-quired 3. 5 percent of compressor flow.)
The temperature distributions along the surface of the plug for both the convectionand film cooled regions were strongly influenced by shock waves. Cooling the plug wasmost difficult at nozzle pressure ratios below 10 where shock waves produced the mostsevere adverse pressure gradients along the plug surface.
INTRODUCTION
An investigation was conducted with a J-85 afterburning turbojet engine to obtainheat transfer characteristics of a plug-type exhaust nozzle incorporating convection andpartial film cooling. Past investigations of plug nozzle designs at the Lewis ResearchCenter (refs. 1 to 8) have demonstrated their capability of improving thrust performanceover that of other nozzle configurations for a wide range of engine operating conditions.

These previous tests, however, were conducted with uncooled plug nozzle designs. Be-cause of the high operating temperatures of afterburning gas turbine engines, it becomesimperative to cool the surfaces exposed to the hot exhaust gases for any proposed plugnozzle design. In addition, for the plug nozzle to be given serious consideration, thedesign requires an efficient cooling scheme which minimizes cooling flow requirements,is relatively light in weight, and avoids complexity.
The methods that are commonly considered for cooling nozzles are convection, filmcooling or a combination of both. These methods as applied to plug nozzles have beeninvestigated at the Lewis Research Center (refs. 9 to 16). References 9, 10, and 11present the experimental results with a convectively cooled plug nozzle installed on anafterburning J-85 turbojet engine. In the work described in references 9 and 10, theplug was truncated at the 60 percent location downstream of the nozzle throat. The cool-ant was discharged in a downstream direction at sonic velocity from an annular slot atthe point of truncation to recover some thrust from the coolant stream. For the flighttests described in reference 11, the plug was convectively cooled to 60 percent of thelength and the remaining 40 percent was film cooled. Although these investigationsdemonstrated the feasibility of the cooling designs used, the resulting nozzle system wascomplex and heavy.
The study described in reference 12 resulted in potential reductions in weight andcooling flow requirements of several partial film cooled plug nozzle configurations com-pared to an all convection cooled design. Some concern, however, has been expressedover the effect of shock and recompression waves along the plug surface on the filmcooling effectiveness, particularly at the off-design conditions (ref. 10).
Experimental investigations in altitude facilities using small film cooled models(21. 6-cm (8. 5-in.) model diameter) are reported in references 13 to 16. References13 and 14 present the thrust performance and heat transfer results of models tested atgas temperatures up to 555 K (1000° R). References 15 and 16 present the cold flowthrust and pumping characteristics of a promising film cooling concept using ram air.
The convectively cooled plug nozzle of reference 11 was modified to increase thepartial film cooled length and was tested on an afterburning J-85 turbojet engine. Theheat transfer results are the subject of this report. The modification consisted of lo-cating a slot at a position 42 percent of the distance from the nozzle throat to the plugtip. Thus, 42 percent was convectively cooled and the remainder was film cooled.Tests were conducted over a range of nozzle inlet pressures from 5. 5 to 19. 4 newtonsper square centimeters (8 to 28 psia), pressure ratios from 2 to 30, coolant flow ratesfrom 0. 04 to 1.13 kilograms per second (0.1 to 2. 5 Ib/sec), and exhaust gas tempera-tures from 1330 to 2040 K (2400° to 3675° R). The coolant flow was supplied from a fa-cility source at ambient temperatures.
Cooling characteristics are presented as plots of plug surface temperature and pres-sure distributions. The coolant pressure-flow characteristics are described by the

coolant to primary total pressure ratio as a function of the ratio of corrected coolant toprimary weight flow ratio. The effect of independent variations in nozzle flow rate,temperature, nozzle pressure ratio, and coolant flow rates are shown. Data showingthe effect of nozzle outer shroud length are also presented. Comparisons of the filmcooled performance with that of the truncated convectively cooled configuration aremade. A list of symbols used in the report are included in the appendix.
APPARATUS
Engine Installation
The partial film cooled plug nozzle was mounted on a General Electric J85-13 turbo-jet and installed in the Lewis Research Center altitude facility (PSL 2). The installationis shown pictorially in figure 1 and schematically in figure 2. The J85-13 engine has aneight-stage axial flow compressor, an annular primary combustor, a two-stage axialflow turbine, and an afterburner with a single circumferential V-gutter flameholder andradial fuel spray bars. At sea-level static conditions the rated airflow is 20 kilogramsper second (44 Ib/sec) at an engine pressure ratio of about 2. 2. At maximum afterburn-ing the exhaust gas temperature is about 2000 K (3600° R).
The altitude facility has the capability of operating over a range of altitudes fromsea level to 24 000 meters (80 000 ft) at corresponding air flows from 218 to 5 kilogramsper second (480 to 10 Ib/sec). A range of exhaust nozzle pressure ratios with afterburn-ing from about 2 to 30 were possible.
The engine was mounted on a thrust measuring stand which consisted of a test bedsuspended from four facility support flexure rods. The altitude chamber includes a for-ward bulkhead which separates the inlet plenum from the test chamber. Atmospheric airwas supplied to the plenum at the desired pressure by control valves and flowed from theplenum through the direct connect bellmouth and duct to the engine inlet.
The exhaust gases from the engine were captured by a collector, which extendedthrough the rear bulkhead, to minimize recirculation of these gases into the test cham-ber. The exhaust pressure was controlled by valves in the exhaust system.
Plug Nozzle
General description. - A closeup view of the plug nozzle installed in the facility ispresented in figure 3. The principal parts of the plug nozzle system are illustrated bythe schematic diagram of figure 4 and consist of the plug, the primary shroud, an outershroud, and the supporting struts. The maximum diameter of the plug is 40. 64 centime-

ters (16 in.) and the plug cone forms a 10° half angle.The plug was supported from the outer shroud by three struts. The struts were el-
liptical with a major axis of 14 centimeters (5. 5 in.) and a minor axis of 6.3 centimeters(2. 5 in.). Two lengths of outer shroud were used during this investigation to simulate ahigh and a low internal area ratio obtainable with a variable outer shroud length. Ideally,there is an optimum shroud length for each operating nozzle pressure ratio for maxi-mum thrust.
The two outer shroud lengths used are shown in figure 4. The short shroud termi-nated at a point 12. 7 centimeters (5 in.) (X/D = -0. 2) upstream of the nozzle throat.The long shroud extended to a point 38.1 centimeters (15 in.) (X/D = +0. 6) downstreamof the nozzle throat. The diameter D of the outer shroud was 63. 5 centimeters(25 in.).
The forward end of the primary shroud was connected to the afterburner through apacking (hot gas slip seal shown in fig. 4) to allow for differential thermal expansion be-tween the nozzle and the afterburner. The lip at the aft end of the primary shroudformed the throat of the nozzle. It provided a throat area of about 1129 square centime-
2ters (175 in. ) and permitted operation at maximum afterburning.
Cooling system. - The various parts of the nozzle were cooled by four metered airstreams supplied from the facility at ambient temperature. The flow paths for thesecoolant streams are shown in figure 5. The secondary air stream film cooled the outershroud. The amount of corrected secondary weight flow ratio was held constant at 6 per-cent of the primary flow. The primary shroud was film cooled by two separate airstreams supplied to two slots in the shroud. The primary shroud cooling air flows wereeach held constant at approximately 1 percent of primary flow. The forward portion ofthe primary shroud was film cooled by turbine discharge gas exiting from between theafterburner liner and casing. .
The strut and plug cooling air stream was one of the major variables in the investi-gation. The struts and the front portion of the plug to a point 42 percent of the lengthfrom the throat to the theoretical tip of an uncooled plug (fig. 5) was convectively cooled.The remaining downstream portion of the plug was film cooled. All the film cooling re-sults presented in this report are with a nontruncated plug, although a truncation junc-tion at a plane 60 percent of the length from the throat existed in the assembly.
Details of the convectively cooled portion of the plug and the struts are described inreferences 9 and 10. The film cooled portion of the plug was formed by cutting off a sec-tion of the plug and welding on a slot and cone extension assembly. Figure 5 shows thedetails of the slot design. Basically, it was a slot forming a rearward facing step in thesurface of the plug that discharged the coolant stream tangentially to the surface. Theslot assembly consisted of 64 equally spaced fins which were shaped to form convergent-divergent passages. Since the slot was located in a supersonic hot gas stream, the ob-jective at design point conditions was to obtain supersonic discharge velocities from the

slot. Ideally, to obtain the maximum insulating effect of the coolant stream, the veloc-ity of the coolant stream should be matched with the primary stream to minimize mixing(ref. 17). To achieve this condition, however, a large exit to throat area ratio in theslot was required which resulted in too high a pressure inside the plug. Therefore, asa compromise, the slot was designed for the maximum Mach number M possible, con-sistent with the available pressure supply inside the plug. This resulted in a designpoint value of M = 1. 80 at the coolant slot exit compared to a primary stream M = 1.36at the slot station. The physical flow area at the exit of the slot was 40 square centime-ters (6.20 in. ) and the exit-to-throat physical area ratio was 1. 5.
Instrumentation
The results presented in this report were, obtained from measurements made withinstrumentation summarized in figure 6. Additional instrumentation was available at thestart of the tests but were lost during testing; these are not shown in the figure.
In addition to the instrumentation on the plug wall, there were two pressure taps in-side the plug p , two thermocouples T , (air temperature) and two static pressure
C CGtaps p__ , in the coolant passage at the entrance to the slot assembly, and a static pres-scsure tap just inside the exit of the slot. These measurements were used in determiningthe pressure-flow characteristics of the cooling systems.
The exhaust pressure PQ of the nozzle was measured by four static pressure tubesequally spaced around the outside surface and near the end of the outer shroud.
The gas stream total pressure at the inlet to the nozzle P was measured at sta-tion 7 (fig. 4) with a water-cooled pressure rake. The rake had ten elements, two ateach of five radii, and positioned so that they were equal area weighted.
The temperature at the inlet to the nozzle was not measured but instead determinedfrom a correlation of the temperature rise in the afterburner with the parameter
o(P§) /Wg and the afterburner fuel-air ratio. The correlation was derived from calibra-tions previously obtained from tests with water-cooled sonic nozzles.
The exhaust temperature T was then obtained from a heat balance considering theprimary shroud coolant flows and the leakage through the hot gas seal. The hot sealleakage was determined from a heat balance in the secondary flow passage.
TEST PROCEDURE
The facility air control valves permitted independent variation of engine inlet andaltitude exhaust pressures such that nozzle pressure ratio could be varied independentlyof engine inlet airflow and pressure level. The primary exhaust gas temperature was

also independently variable by different levels of afterburning. The other independentvariable having a significant effect on nozzle cooling was the plug cooling air flow rate.Thus, the four major independent test variables in addition to configuration changes are:(1) primary air flow, (2) nozzle pressure ratio, (3) coolant flow rate, and (4) exhaustgas temperature.
Test conditions were selected so that the independent effect of each of the majorvariables could be obtained. Three of the test variables were held constant while thefourth was changed. The data presented in this report were for selected test points ob-tained within the matrix of test conditions presented in table I.
RESULTS AND DISCUSSION
The results from selected typical runs are presented to show the effect of nozzlepressure ratio, coolant flow rate, and nozzle primary flow rate (nozzle inlet pressure)on the temperature and pressure distributions on the plug at maximum afterburning con-ditions, where cooling is most difficult. Results are also included to show the effect ofreducing the exhaust gas temperature and the effect of outer shroud length.
A comparison is made with the all convectively cooled plug design of reference 9.Finally, the coolant pressure-flow (pumping) characteristics are compared with the allconvectively cooled design to show the reduction in supply pressure that can be achievedby the partial film cooled design.
Temperature and Pressure Distributions
Effect of nozzle pressure ratio. - The effect of the nozzle pressure ratio PVpn on
the temperature and pressure distributions on the surface of the plug is shown in fig-ure 7. The temperatures shown (fig. 7(a)) are the measured wall temperatures uncor-rected for radiation or heat loss through the wall. The wall static pressures and exhaustpressure PQ are shown (fig. 7(b)) as ratios to the total pressure P at the entrance tothe nozzle (station 7). Both temperatures and pressures are plotted as a function of thedistance Y along the surface of the plug as a ratio to the length L from the front endto the truncation junction. Ratios greater than 1. 0 are therefore locations on the conicalextension to a full length plug. This dimensioning method was chosen to make the re-sults readily comparable with those of reference 9. The test conditions for all data infigure 7 were: exhaust gas temperature of 2030 K (3650° R), nozzle inlet pressure of
219. 3 newton per square centimeter (28 Ib/in. ), and a coolant flow ratio W /W ofcr p0.026.

With the nozzle operating at a pressure ratio of 9. 85, the wall temperature(fig. 7(a)) on the convectively cooled portion of the plug decreased uniformly from amaximum of 1110 K (2000° R) near the throat (Y/L = 0. 43) to a low temperature of 830 K(1500° R) at the slot. The solid symbols are the highest (peak values) of the seven in-dividually measured temperatures around the circumference at the throat. Immediatelydownstream of the exit of the slot (Y/L = 0. 82), the wall temperatures showed a decideddrop due to the effect of the film of air exiting from the cooling air slot which was fol-lowed by a slowly rising wall temperature in the downstream direction. At the trunca-tion junction (Y/L = 1. 0), the temperature dropped because of leakage at the joint andthen began to rise sharply. (The dashed curves represent the probable characteristicif no leak were present.)
A maximum wall temperature of about 944 K (1708° R) was measured near the mid-point of the extension which was substantially less than the 1200 K (2200° R) design walltemperature. It was, therefore, concluded that at a nozzle pressure of 10 (or higher)a coolant flow of 2. 6 percent of primary flow was more than sufficient to keep the entireplug nozzle surface cool.
The wall static pressures on the convectively cooled portion (fig. 7(b)) decreaseduniformly from the throat to the slot. This is a favorable pressure gradient and existsalong the surface from the smoothly expanding gases. Downstream of the slot, thepressure, also influenced by the cooling air film, increased to a slightly higher constantlevel over the length to the truncation junction. Downstream from the junction, themeasured wall static pressure gradient became adverse from shock waves forming.
As the nozzle pressure ratio was decreased, the shock waves moved upstream. Theadverse pressure gradients associated with the shocks, also moved upstream and thetemperatures on the surfaces (both convective and film cooled) increased along with•) fthem. The adverse gradient for a pressure ratio of 5.1 started between Y/L = 0. 53and 0. 67 and remained adverse up to Y/L = 0. 87. A weak adverse gradient was ob-served farther downstream at values of Y/L = 0. 98 to 1.11. Undoubtedly, the presenceof adverse gradients increased the turbulent mixing of hot gas into the film cooling airand caused the wall temperature of the film cooled portion of the plug to be higher thanfor the 9. 85 pressure ratio previously discussed. For a pressure ratio of 2. 9, thepresence of three shock waves along the length of the plug were indicated by three ad-verse pressure gradients plotted in figure 7(b). The combined effect of the three shocks,although each occurs over a relatively short extent but exhibiting high pressure ampli-tude, disturbed the film cooling such that the wall temperature is nearly as high for the5. 1 pressure ratio data. These data indicate that film cooling effectiveness is stronglyinfluenced by the extent and amplitude of adverse pressure gradients resulting fromshock waves. The exhaust collector was positioned far enough downstream (fig. 1) sothat it had no effect on pressure distributions and shock positions along the plug for thedata in this report.

The wall temperature level of the convectively cooled surface was highest at a noz-zle pressure ratio of 3. At pressure ratios of both 2. 9 and 5.1, peak temperatures of1110 K (2000° R) occurred at both the throat and the slot. As expected, high tempera-tures occurred at the throat due to high heat loads at this minimum flow area of the noz-zle. The peak temperature at the slot is the result of the shock (indicated by the ad-verse pressure gradient) also affecting the convection heat transfer.
For the test condition of Pp/P0 = 5. 1, the limiting temperature of 1220 K (2200° R)was reached at about the midpoint of the film cooled cone extension. A coolant flow ofabout 2. 6 percent of the engine flow was sufficient to cool the film cooled plug up to the60 percent truncation junction, but not enough to keep the full length extension withindesign limits. These results show that cooling the plug was most difficult at nozzlepressure ratios below 10 for both convection and film cooling.
Effect of coolant flow rate. - The effect of coolant flow rate is shown in figure 8 fora nozzle pressure ratio of 5. With the exhaust gas temperature and the inlet pressureset at the maximum values investigated, the coolant flow was set at 2. 6, 4.6, and 5. 7percent of primary flow. The characteristic shape of the temperature distributions(fig. 8(a)) remained unchanged for all coolant flows, and, as expected, the level de-creased as flow rate increased. The variation in coolant flow also had very little effecton pressure distributions (fig. 8(b)). It is obvious from figure 8 that a coolant flow rateof approximately 2. 6 percent would be insufficient to adequately cool the extended filmcooled surface for this pressure ratio condition.
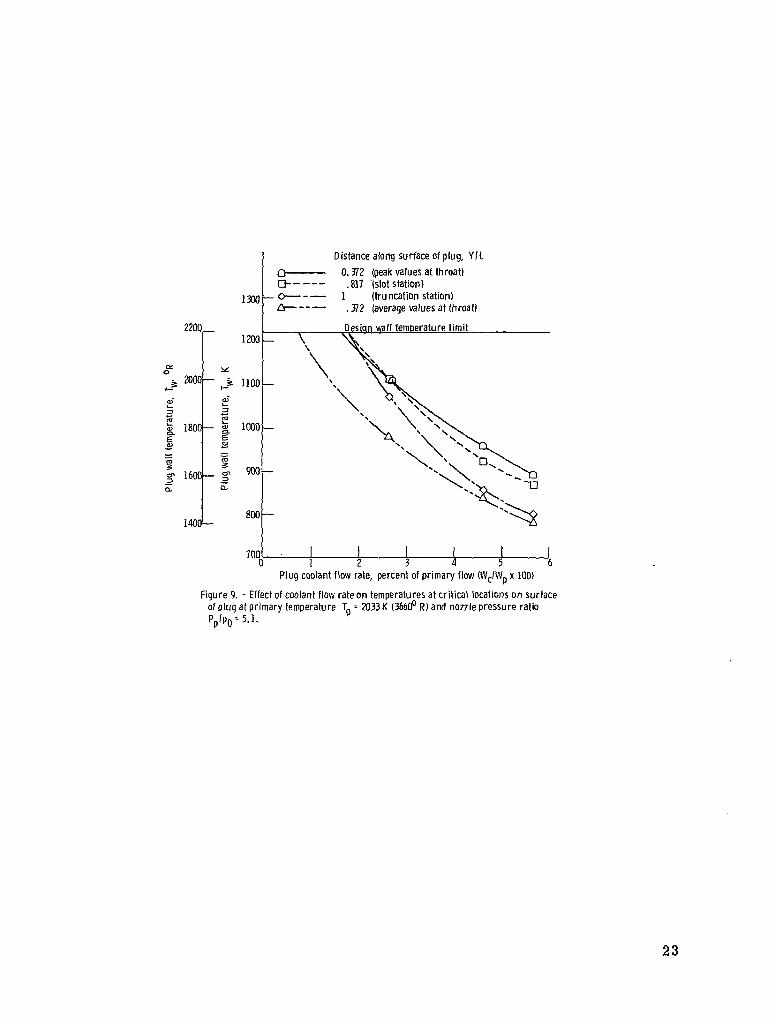
A cross plot of the data from figure 8 is presented in figure 9 to show the variationof wall temperature (at selected values of Y/L) with coolant flow rate. Assuming thatthe extrapolations to lower coolant flows are valid, the results show that a coolant flowof 1. 8 percent of primary flow would keep the film cooled portion of the truncated plugand the slot outer wall under 1220 K (2200° R). This flow rate is also considered ade-quate to cool the throat region of the plug (Y/L = 0. 372 in fig. 9). It should be pointedout, however, that these results are with the coolant supplied to the nozzle at ambienttemperature. If the coolant were to be supplied at compressor discharge temperatures,higher flow rates would be required.
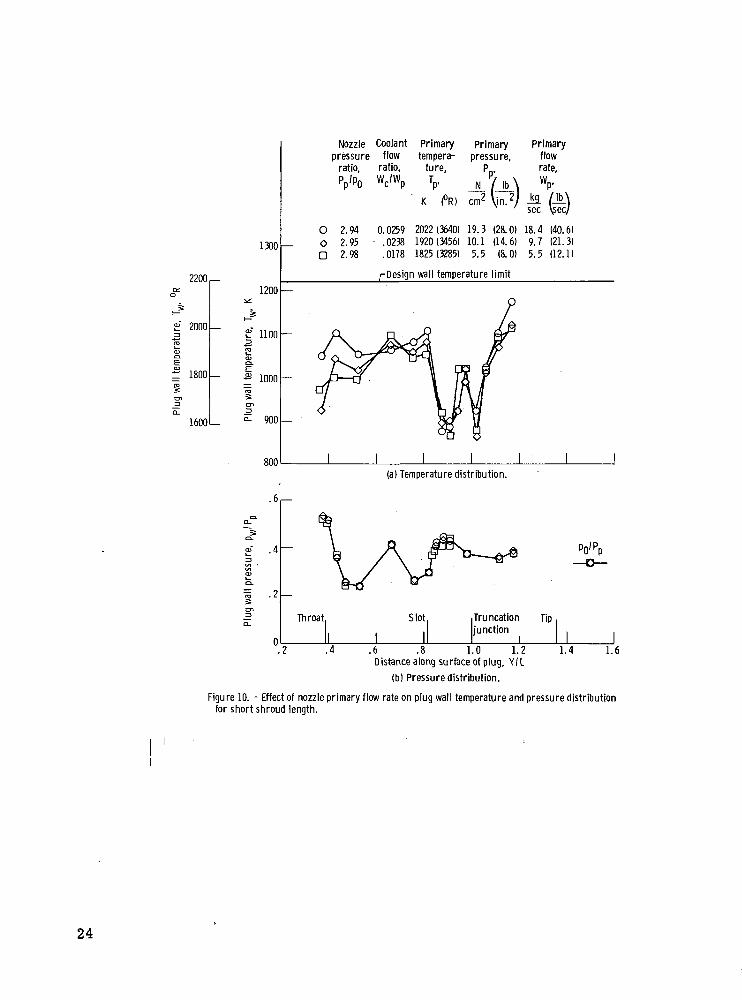
Effect of hot gas flow rate (inlet pressure). - The effect of hot gas flow rate on walltemperature and pressure distributions is presented in the curves of figure 10. The flowrate and nozzle inlet pressure both vary with engine test conditions. The nozzle pres-sure ratio was the same for the three test points shown. Although the hot gas tempera-ture and coolant flow rates are not exactly matched, the effect of the differences tend tocancel each other such that the maximum wall temperatures of the convectively cooledportion are within about 28 K (50° R) of each other. Both the temperature and pressuredistributions along the plug surface show the same trends which are independent of thehot gas flow rate and the corresponding nozzle inlet pressure.

Effect of coolant flow rate at lower hot gas temperatures. - The results of testsconducted at a lower hot gas temperature of about 1350 K (2430° R) over a range ofcoolant flow rates is presented in figure 11. The resulting temperature and pressuredistributions indicate that very low (perhaps zero) coolant would be adequate to maintainallowable temperatures for the plug at a nozzle pressure ratio of 3.2.
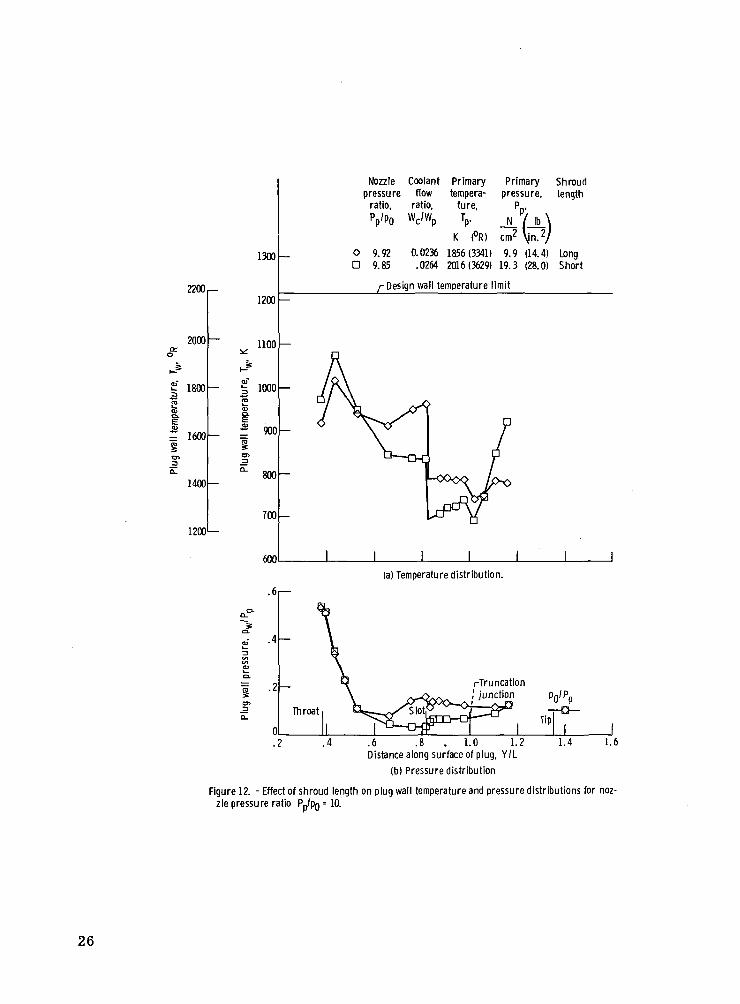
Effect of shroud length. - Change in length of the outer shroud changes the internalarea ratio of the nozzle and thus the axial velocity distribution of the expanding hot gasflowing along the plug surface. Comparisons of temperature and pressure distributionsalong the plug surface for the short and long shrouds tested are presented in figure 12
= 10) and figure 13 (Pp/P0 = 3).Two data points are shown in figure 12 where the test conditions are nearly the
same, but the shroud lengths are different which changed the position of the shock alongthe plug surface. An adverse pressure gradient began at Y/L = 0. 66 (within the con-vectively cooled portion) for the long shroud configuration and at the slot Y/L = 0. 82for the short shroud configuration. The wall temperature started climbing at the be-ginning of the adverse pressure gradient in both cases, whether in the convectivelycooled portion (long shroud) or in the film cooled portion (short shroud) of the plug.Downstream of the film cooling slot on the long 'shroud configuration, however, thepressure gradient is favorable and the film cooled wall temperature remained nearlyconstant (ignoring the effect of the small leakage at Y/L = 1). The level of the filmcooled wall temperature near the slot is higher for the long shroud than for the shortshroud indicating that, even though the pressure gradient is locally favorable, the pres-ence of the upstream shock affected the film cooling of the surface downstream of theslot. For the short shroud data, the adverse gradient persisted throughout the lengthof the film cooled surface which resulted in a rapid continual rise in wall temperature inthe downstream direction. These data reinforce the discussion of figure 7 with respectto adverse pressure gradients having a pronounced effect on film cooling whether theadverse gradient is within a film cooled portion or upstream of it.
The effect of shroud length for tests with a lower pressure ratio (PQ/PQ = 3) isshown in figure 13. The difference in pressure distributions is small (the long shroudis probably operating with unattached flow). The small difference (55 K (100° R)) inwall temperatures is probably due to the slightly higher pressure amplitude of the ad-verse pressure gradients for the long shroud configuration.
Comparison with all convection cooling. - Figure 14 shows a comparison of thetemperature and pressure distributions on the full length partially film cooled plug withthose from the truncated all convective cooled design of reference 9. Data from threetest points are presented. The first two (circular and square symbols in fig. 14) com-pare the partial film cooled plug data with the all convection cooled plug data (test pointspreviously unpublished) where the cooling air is supplied from the facility system at314 K (565° R). Again, the hot gas temperature and coolant flow rates are not exactly

matched but the effect of the differences tend to cancel each other such that the resultingplug wall temperature (fig. 14(a)) of the two cases for Y/L < 0. 8 (convective cooledportion) are within 28 K (50° R). The film cooled portion is 90 to 150 K (160° to 250° R)cooler than the all convection cooled design up to the truncation junction at Y/L = 1. 0.
The third test in figure 14 (triangular symbols) shows data for the all convectioncooled plug (data previously unpublished) with cooling air being supplied from the enginecompressor discharge (customer bleed ports) at a temperature of 509 K (916° R), ap-proximately 193 K (350° R) higher than for the other tests just described. The plug wall,hot gas, and coolant exit temperatures for this test were about the same as for the otherall convection cooled test with facility air supply. It required an additional 1.2 percentcooling air, however, because of the higher coolant supply temperature. In the discus-sion of figure 9, it was estimated that 1. 8 percent coolant would be sufficient to cool thetruncated film cooled portion using facility air. With the cooling air being supplied atthe higher temperature of 509 K (916° R), and assuming the same trend as shown in fig-ure 14, it is estimated that an additional 1. 2 percent in coolant flow (a total of 3. 0 per-cent) would be required to cool a partial film cooled plug truncated at 60 percent of thelength using compressor air. This represents a 14 percent reduction in cooling air re-quirement compared to the all convectively cooled plug, which required 3. 5 percent ofcompressor air flow (ref. 9).
The pressure distributions shown in figure 14(b) are nearly the same for the con-vectively and film cooled configurations up to the slot station. The presence of the slotand film cooling air flow affects the pressures downstream of the slot on the partial filmcooled design. The lower pressure (and temperature) at Y/L =1.0 for the customerbleed test (triangular symbol) is due to use of the short outer shroud for this test; theother two tests were with a long outer shroud. (The effect of shroud length was dis-cussed in the previous section.)
Coolant Pressure-Flow Characteristics
The data shown in figure 15 compares the pressure^flow characteristics (pumpingcharacteristics) of the partially film cooled plug design with the all convectively cooleddesign (ref. 9) obtained during engine tests. In figure 15(a) the variation of the ratio ofcoolant slot total pressure to exhaust gas total pressure with corrected coolant weightflow ratio is shown, and in figure 15(b) the ratio of plug interior pressure (total pres-sure) to exhaust gas total pressure is plotted. For the convectively cooled configura-tion both curves are based on measured total pressures. For the partially film cooledconfiguration, the total pressure at the slot is calculated from static pressure, totaltemperature, and flow rate at the inlet to the convergent-divergent slot configuration;
10

The pumping characteristics can be analytically expressed by the following equationwhich is derived from the continuity equations written for the flow at the throat of thecoolant passage and the flow at the throat of the primary, both with choked flow:
W
f(yc)f(V.
(l)
where
/y + 1\(y+i)/2(y-l)
w-For each design, if A VA and f(yJ/f(y ) remain constant with change in cor-. co p . c p f
rected coolant weight flow ratio, the relation between the coolant flow ratio and the totalpressure ratio P__/P_ is linear. The slope is predominantely dependent on the ratio
L*c p
of throat sizes A JAn. (The effect of f(y J/f(yJ is small.) The test results plotted inc/ p c rfigure 15(a) show the linear relation, and the difference in the slopes of the two datasets represents the difference in the exit throat areas of the two cooling methods.
The total pressure ratio P__/P_ may be written asCG* p
(2)
Substituting equation (2) into equation (1) yields
W f(vc)f(yp)
(3)
If the total pressure loss in the coolant passage P~_/P~ is constant, the coolantCo C
flow rate should be a linear function of P_/P • These values for each configuration areplotted in figure 15(b) and show the relation to be linear. The slopes of the curves infigure 15(b) are then a combined function of both the pressure loss and the ratio of throatareas. The change in slope between figures 15(a) and (b) for each configuration thenrepresents the total pressure loss in the coolant passage in each configuration.
For the all convectively cooled plug design, from figure 15 it is found that the totalpressure loss in the coolant passage is 25 percent of the total pressure inside the plug.
11

For the partially film cooled plug design, the total pressure loss is 13 percent or almosta 50 percent reduction. The supply pressure then could be reduced an equivalentamount. Coolant supply pressure requirements have a significant effect on choice ofsource of cooling air which in turn affects the engine cycle penalties (see ref. 12).
SUMMARY OF RESULTS
An air-cooled plug nozzle with the forward portion convectively cooled and the aftportion film cooled was tested on a J-85 afterburning turbojet in an altitude test chamberto determine the amount of air and supply pressure needed to cool the plug wall to below1220 K (2200° R) at a maximum afterburning temperature of 1940 K (3500° R). In theconfiguration tested, a tangential annular slot was located on the plug about 42 percentof the distance from the throat to the tip. The tests were conducted over a range ofcoolant flow rates and nozzle pressure ratios at various nozzle inlet pressures and tem-peratures. The coolant flow was supplied from a facility source at ambient tempera-ture. The significant results were as follows:
1. Comparing the results with an all convectively cooled plug nozzle truncated at60 percent length, equal amounts of coolant flow resulted in wall temperatures that werefrom 90 to 150 K (160° to 250° R) lower on the film cooled portion of a partial filmcooled plug of the same length.
2. Converting the all convectively cooled truncated plug to a partially film cooledplug reduced the loss of total pressure in the plug coolant passages from 25 to 13 per-cent, almost a 50 percent reduction.
3. The wall temperature distributions for both convective and film cooled portionsof the plug tested were strongly influenced by shock waves which produce adverse pres-sure gradients along the plug surface.
4. Film cooling of the plug was more difficult at nozzle pressure ratios below 10.5. From extrapolating the results of varying the coolant flow at a nozzle exhaust
temperature of 2040 K (3670 R), nozzle inlet pressure of 19. 3 newtons per square cen-timeter (28 psia), a nozzle pressure ratio of 5, and using ambient temperature coolingair, the plug cooling flow required to keep maximum wall temperatures under 1220 K.(2200° R) would be:
(a) 1. 8 percent for a 60 percent truncated plug(b) 2. 6 percent for a nontruncated plug
6. An estimated cooling air flow rate of 3.0 percent of compressor discharge wouldbe needed to cool a 60 percent truncated partially film cooled plug. This is about a14 percent reduction in cooling air from that required for an all convectively cooled plugof the same length.
12

7. At an exhaust temperature of 1330 K (2400° R), practically no coolant flow wouldbe needed to keep all surface temperatures under 1220 K (2200° R).
Lewis Research Center,National Aeronautics and Space Administration,
Cleveland, Ohio, December 12, 1975,505-04.
13

APPENDIX - SYMBOLS
A coolant slot throat area\s
A primary nozzle throat area
Dm outer shroud diameter (model diameter)
g gravitational constant
L length along plug surface, front end to truncation station
M Mach number
P coolant total pressure inside plugts
P coolant slot exit total pressure
P nozzle primary inlet total pressure
P5 turbine exit total pressure
Po^ coolant slot inlet static pressuresc
p plug wall static pressure
PQ exhaust pressure at nozzle exit
T coolant slot exit total temperature
T . coolant inlet total temperatureL* Jl
T nozzle primary total temperature
T plug wall temperature
W coolant weight flow rate
W primary weight flow rate
Wg turbine exit weight flow rate
X length of outer shroud from primary throat
Y length along plug surface from front end
y specific heat ratio
yc coolant specific heat ratio
y primary specific heat ratio
9 angular position
14

REFERENCES
1. Bresnahan, Donald L.; and Johns, Albert L.: Cold Flow Investigation of a LowAngle Turbojet Plug Nozzle with Fixed Throat and Translating Shroud at MachNumbers from 0 to 2. 0. NASA TM X-1619, 1968.
2. Bresnahan, Donald L.: Experimental Investigation of a 10° Conical Turbojet PlugNozzle with Iris Primary and Translating Shroud at Mach Numbers From 0 to 2. 0.NASA TM X-1709, 1968.
3. Bresnahan, Donald L.: Experimental Investigation of a 10° Conical Turbojet PlugNozzle with Translating Primary and Secondary Shrouds at Mach Numbers From0 to 2. 0. NASA TM X-1777, 1969.
4. Johns, Albert L.: Quiescent-Air Performance of a Truncated Turbojet Plug Nozzlewith Shroud and Plug Base Flows From a Common Source. NASA TM X-1807,1969.
5. Harrington, Douglas E.: Performance of Convergent and Plug Nozzles at MachNumbers from 0 to 1. 97. NASA TM X-2112, 1970.
6. Harrington, Douglas E.: Performance of a 10° Conical Plug Nozzle with VariousPrimary Flap and Nacelle Configurations at Mach Numbers from 0 to 1. 97. NASATMX-2086, 1971.
7. Huntley, Sidney C.; and Samanich, Nick E.: Performance of a 10° Conical PlugNozzle Using a Turbojet Gas Generator. NASA TM X-52570, 1969.
8. Samanich, Nick E.; and Chamberlin, Roger: Flight Investigation of Installation Ef-fects on a Plug Nozzle Installed on an Underwing Nacelle. NASA TM X-2295,1971.
9. Clark, John S.; Graber, Edwin J.; and Straight, David M.: Experimental HeatTransfer and Flow Results from an Air-Cooled Plug Nozzle System. NASA TMX-52897, 1970.
10. Graber, Edwin J.; and Clark, John S.: Comparison of Predicted and ExperimentalHeat-Transfer and Pressure-Drop Results for an Air-Cooled Plug Nozzle and Sup-porting Struts. NASA TN D-6764, 1972.
11. Samanich, Nick E.: Flight Investigation of an Air-Cooled Plug Nozzle with an After-burning Turbojet. NASA TM X-2607, 1972.
12. Clark, John S.; and Lieberman, Arthur: Thermal Design Study of an Air-CooledPlug-Nozzle System for a Super sonic-Cruise Aircraft. NASA TM X-2475, 1972.
15

13. Jeracki, Robert J.; and Chenoweth, Francis C.: Coolant Flow Effects on the Per-formance of a Conical Plug Nozzle at Mach Numbers from 0 to 2. 0. NASA TMX-2076, 1970.
14. Chenoweth, Francis C.; and Lieberman, Arthur: Experimental Investigation ofHeat-Transfer Characteristics of a Film-Cooled Plug Nozzle with TranslatingShroud. NASA TND-6160, 1971.
15. Straight, David M.; Harrington, Douglas E.; and Nosek, Stanley M.: ExperimentalCold-Flow Evaluation of a Ram-Air-Cooled Plug-Nozzle Concept for AfterburningTurbojet Engines. NASA TM X-2811, 1973.
16. Harrington, Douglas E.; Nosek, Stanley M.; and Straight, David M.: Cold-FlowPerformance of Several Variations of a Ram-Air-Cooled Plug Nozzle forSupersonic-Cruise Aircraft. NASA TM X-3110, 1974.
17. Hatch, James E.; and Papell, S. Stephen: Use of a Theoretical Flow Model to Cor-relate Data for Film Cooling or Heating an Adiabatic Wall by Tangential Injectionof Gases of Different Fluid Properties. NASA TN D-130, 1959.
16

TABLE I. - MATRIX OF TEST CONDITIONS
Primary flowrate, Wp
kg, sec Ib sec
19.0
9. 5
5.4
42
21
12
Nozzlepressure
ratio,
VPO
5
2 to 10
3
32 to 10
Primary exhaust gas temperature, K (°R)
1390 (2500) 1667 (3000) 1940 (3500)
Coolant flow ratio, W /W
Short shroud
0.01 to 0. 12
0.01
0.02 to 0.06
0.03
0.02 t o O . 12
0.01 to 0.21
Long shroud
19
9.5
5.4
42
21
12
1530
123 to 183 to 12
102 to 10
0. 01 to 0.06
0.01 to 0. 11 0.01 to 0. 11
0.02
0.01 to 0.200.01
0. 03 to 0. 05
0.02 to 0. 12
0.03
C-74-3075
Figure 1. - Nozzle installation in test facility.
17

Inlet plenum
Labyrinth seal^\
, \
X . N
///////,
j
Flexure rods^\
Station1
Secondary air supply-;/
Orifice -
2
/f"Bellmouth-5
Forward /'bulkhead—'
|x— .
D
ffl111r
i iT
' 1
-— .
3
— —
~q
V
4 5 6
— •
(< ,
— |~<</SLJ
r
7
P
-Nozzle inlet station--Strut and plug
cooling air/-Primary
/ exit station
8 9 0
y^~~ — .
1
r~ }Exhaust /collector /
/ m.., 1 /: \"v \ "u3 j— -^ A
Main burner ^J(rfuel flow— "^"
11
5r^<^
yX-
Ti- "-Thrust
Prr— " /
r (J-Primary filmcooling slot 2
1 Y load cell Lprjmaryf|m
Total fuel flow—
<<^^^^^^^ \ s^^^^^S\\\V
\^\^:
^Afterburner fuel flow cooling slot l
\
^
^ Rearbulkhead
^^yyy^^yfff^^^ss^^
Figure 2. - Schematic of plug-nozzle test installation.
*% C-74-3077
Figure 3. - Closeup of plug nozzle in test facility.
18

Station 7
10°
Nozzle throat
^ Plug truncation\ junction
•- Film cooling slot
^\ ^X-Struts (3) \
- Primary shroud
Figure 4. - Schematic of plug nozzle design. (All dimensions are in cm (in.) unless indicated otherwise.)
64 fins equally spaced
^-Throat
0.38(0.15) -Exit
0.71 (0.28)
Details of coolant slot0.52(0.21)
Primary shroud Secondary flow-,slot 2 coolant-^ \
Strut andplug coolant — ~~
Isometric view of coolant slot
Theoretical tip ofuncooled plug,113.51(44.69)from throat-
Primary flow
\ Diam., 14.25(5.61)
*-Truncation junction. . . •". • -Section of plug assembly
Figure 5. - Schematic and details of plug nozzle film cooling de'sign. (All dimensions are in cm (in.). I
19

Thermocouple and static pressure tap locations
Y;L
0.375
0.399
0.431
0.470
TW Pw
9,adeg
6090
105180225270315
——
60—
14239————
—
30225
45210
60195
Y/L
0.527
0.661
0.756
0.817
0.837
0.848
0.872
0.905
Tw Pw
0, deg
060
0
060
527
--
--
560
530
75180
90
105
b!65C175
0
0
0
0
Y/L
0.940
0.973
1.018
1.059
1.107
1.167
Tw PW
0, deg
530
7.5
60
60
060
0
—
350
—
—
10
10
In coolant passage
Y/L
0.756
Tee
1373
PSC
363
^Clockwise looking upstream."Outside coolant slot (hot gas stream).clnside coolant slot.
PO 0.386
L = 110.7cm (43.6 in.)(Value of Y at truncation junction)
1.35
Truncation junction
o Pressure p^
• Temperature Tw
Figure 6. - (nstrumentation of plug.
20

2000
£ 1800
= 1600
1400
12001
1300
1200
1100
^
|— >-s 1000<D~l__g
I 900
£
S. 800
700 -
600
Nozzle Coolantpressure flow
ratio, ratio.wc/wpP'PO
Primarytempera-
ture,
Primarypressure.
Pp.P' N / Ib •
K cm^Vin.
OOD
2.945.109.85
0.0259.0264.0264
2022(3640) 19.3 (28.0)2039(3671) 19.4 (28.1)2016(3629) 19.2 127.9)
Solid symbols denote circumferential peak valuesat throat
Estimated with no leakage
-Design wall temperature limit
(a) Temperature distribution.
PO'PP
.2 .4 .6 .8 1.0 1.2Distance along surface of plug, YIL
to) Pressure distribution.
1.4
Figure 7. - Effect of nozzle pressure ratio on plug wall temperature and pressure distributionfor short shroud length.
21

22001—
2000
1600
1400
1200
1300
1200
1100
— F-S 1000
900
800
700
1000600
500
.6
Nozzle Coolant Primary Primary
0QO
pressureratio,PP'PO
5.105.035.06
flowratio.
wc/wp
0.02640.04610.0566
tempera-ture,
TP'K <°R)
2039(3671)2036 (3665)2023 (3642)
pressure,Pn,
N P/ Ib \
cm? (in!)
19.37 (28.1)19.37 (28.1)19.24 (27.9)
Solid symbols are circumferential peak values
/- Design wall temperature limit
I I(a) Temperature distribution.
•5 .2
Throat
ll.2 .6 .8 1.0 1.2
Distance along surface of plug, Y/L
(b) Pressure distribution.
1.4 1.6
Figure 8. - Effect of coolant flow rate on plug wall temperature and pressure distributions atexhaust gas temperature of 2033 K (3660° R).
22
2200
2000
I
1300
1200
~- _s 1100
1000
9001600— g1
800 —
700
Distance along surface of plug, Y/L
0.372 (peak values at throat)O .817 (slot station)
. O 1 (truncation station)£ . 372 (average values at throat)
Design wall temperature limit
0 I 2 3 4 5 6Plug coolant flow rate, percent of primary flow (Wc/Wp x 100)
Figure 9. - Effect of coolant flow rate on temperatures at critical locations on surfaceof plug at primary temperature Tn - 2033 K (3660° R) and nozzle pressure ratio
Pp'PO'5.1. P
23
2200
2000
r 1800
1600
1300
1200
£ 11003
- ~ 1000
900
800
• 6,—
.4
^ .2
Nozzlepressure
ratio,PP'PO
Coolantflow
ratio.wc/wp
Primarytempera-
ture,
V
Primarypressure,
p
_N_ /JL\
Primaryflowrate,wp.
O 2.94O 2.95D 2.98
0.0259• .0238.0178
K (°R)
2022 (3640)1920 (3456)1825 (3285)
19.310.15.5
' sec
(28.0) 18.4 (40.6)(14.6) 9.7 (21.3)
(8.0) 5.5 (12.1)
/-Design wall temperature limit
(a) Temperature distribution.
PO'PP
Throat Slot
1 1 1
Truncation Tipjunction
1.2 .4 .6 .8 1.0 1.2
Distance along surface of plug, Y/L
(b) Pressure distribution.
1.4 1.6
Figure 10. - Effect of nozzle primary flow rate on plug wall temperature and pressure distributionfor short shroud length.
24

2200^
2000
^18001— Js
I1600
1300
1200
1100
1000
i 900
1400- 3
1200 —
1000—
800
700
600
500
.61—
Q-
3
£- .431/1
£a.
1 -2
O>J3Q.
0
Nozzle Coolant Primarypressure flow tempera-
ratio, ratio.
P wc;wpture.
K P(°R)
Primarypressure,
PIV,
O 3.17 0.0097 1335(2403) 8.6 (12.5)O 3.19 .0247 1374(2473) 8.7 (12.6)O 3.17 .0455 1373(2471) 8.6 (12.5)
.^Design wall temperature limit
(a) Temperature distribution.
PO'PP
TruncationThroat
11 1
Slot
|
.junction
1 1
Tip
1.2 .4 .6 .8 1.0 1.2
Distance a long surface of plug, YIL
(b) Pressure distribution.
1.4 1.6
Figure 11. - Effect of coolant flow rate on plug wall temperature and pressure distributions at ex-haust gas temperature of 1350 K (2430° R) for short shroud length.
25
2200,-
2000
£ 1800•5
~ 1600
1400
1200
1300
1200
1100
- 1000E
£ 900
800
700
600
.61—
.4
Throat
Nozzle Coolantpressure flow
ratio, ratio,Wc/WpP'PO
oD
9.929.85
0.0236.0264
Primarytempera-
ture,v
K <°R)
1856 (3341)2016 (3629)
Primarypressure,
N / Ib \
cm' \in.2/
Shroudlength
9.919.3
(14.4)(28.0)
LongShort
-Design wall temperature limit
I I I(a) Temperature distribution.
/-Truncation' junction
.2 .4 .6 .8 . 1.0 1.2Distance along surface of plug, Y/L
(b) Pressure distribution
PO'PP
1.4 1.6
Figure 12. - Effect of shroud length on plug wall temperature and pressure distributions for noz-zle pressure ratio Pp/pg • 10.
26

2200
2000
1800
1600
1300
1200
3 1100"TO
o>Q.
- 1000
_ 900
800
.6
.4
.2
0O
Nozzlepressure
ratio.
PP'PO
2.95
2.92
Coolantflow
ratio.wc/wp
0.0238.0247
Primary.tempera-
ture.
VK (°R)
1920(3456)1869 (3364)
Primarypressure,
^D'N / lb\
cm^ \in.y
10.1 (14.6)9.9 (14.3)
Shroudlength
ShortLong
/-Design wall temperature limit
I(a) Temperature distribution.
PO'PP
Throat
1 12 .4 .6
Tru ncationSlot
1
junction
1.8 1.0 1.2
Tip
1 11.4 1.
Distance along surface of plug, Y/L
(b) Pressure distribution.
Figurel3. - Effect of outer shroud length on plug wall temperature and pressure distributionsfor nozzle pressure ratio P./pQ = 3.
27

2200
2000
1800
1600
1400
1300
1200
v:_s 1100<D"i_rjE| 1000
_ * 900
oZ
800
700
Shroud Nozzle Coolant Primary Coolant Coolantlength
O All convection LongD Partial film cooling LongA All convection Snort
(customer bleed)
pressureratio,
PP'PO
6.276.005.74
flowratio,
wc/wp
0.0242.0200.0360
tempera-ture,Tp-
K (°R)
1755 (3160)1607 (2892)
1733 (3119)
inlettempera-
ture,TCi'
K (°R)
315 (567)313 (563)509 (916)
exittempera-
ture,Tce.
K (°R)
783 (1410)829 (1493)797 (1434)
i-Design wall temperature limit
(a) Temperature distribution.
• 61—
.4
Throat
PO'PP
Tru ncationjunction .
Tip
\.2 .4 .6 .8 1.0 1.2
Distance along surface of plug, Y/L(b) Pressure distribution.
1.4 1.6
Figure 14. - Comparison of temperature and pressure distributions on partially film cooledwith all convective cooled truncated plug.
28

So."
^ 1
0.
.2
Convectivelycooled -v
I
Partiallyfilm cooled
(a) As a function of total pressure at throat of coolant slot.
Convectivelycooled^
.01 .02 .03 .04 .05 .06Corrected coolant weight flow ratio, Wc/WpJTce/Tp
( b ) A s a function of total pressure in plug.
Figure 15. - Comparison of coolant pumping characteristics betweenpartially film cooled plug design and all convectively cooled design.
NASA-Langley, 1976 E-8553 29