NASA SPoRT SAC Review Huntsville, Alabama 21-22 November 2005 Satellite-derived fields for...
28
NASA SPoRT SAC Review Huntsville, Alabama 21-22 November 2005 Satellite-derived fields for Estimating Soil Moisture Satellite-derived fields for Estimating Soil Moisture for Regional WRF Model Initialization for Regional WRF Model Initialization John R. Mecikalski 1 Collaborators Martha C. Anderson 2 , Christopher Hain 1 , John M. Norman 2 1 Atmospheric Science Department University of Alabama in Huntsville 2 University of Wisconsin–Madison Soil Science Department Supported by: Supported by: The NASA SPoRT Initiative The NASA SPoRT Initiative
-
Upload
harriet-lambert -
Category
Documents
-
view
213 -
download
0
Transcript of NASA SPoRT SAC Review Huntsville, Alabama 21-22 November 2005 Satellite-derived fields for...
NASA SPoRT SAC Review Huntsville, Alabama 21-22 November 2005
Satellite-derived fields for Estimating Soil Satellite-derived fields for Estimating Soil Moisture for Regional WRF Model Moisture for Regional WRF Model
InitializationInitialization
John R. Mecikalski1
Collaborators
Martha C. Anderson2, Christopher Hain1, John M. Norman2
1Atmospheric Science Department
University of Alabama in Huntsville
2University of Wisconsin–MadisonSoil Science Department
Supported by:Supported by:
The NASA SPoRT InitiativeThe NASA SPoRT Initiative
NASA SPoRT SAC Review Huntsville, Alabama 21-22 November 2005
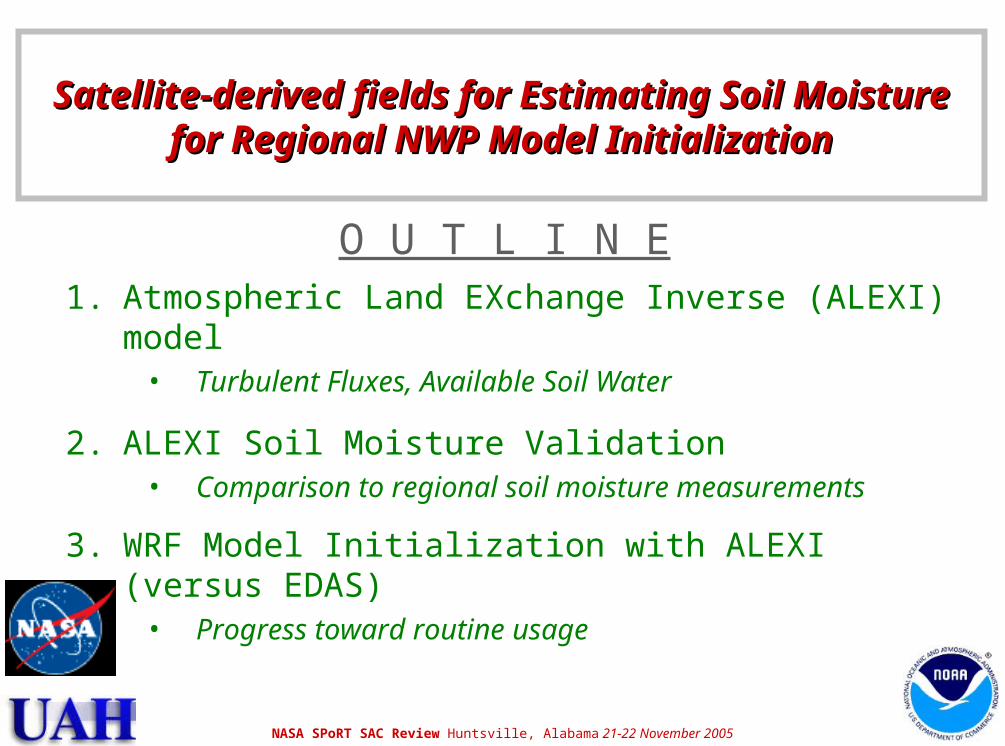
1. Atmospheric Land EXchange Inverse (ALEXI) model• Turbulent Fluxes, Available Soil Water
2. ALEXI Soil Moisture Validation• Comparison to regional soil moisture measurements
3. WRF Model Initialization with ALEXI (versus EDAS)• Progress toward routine usage
O U T L I N E
Satellite-derived fields for Estimating Soil Satellite-derived fields for Estimating Soil Moisture for Regional NWP Model Moisture for Regional NWP Model
InitializationInitialization
NASA SPoRT SAC Review Huntsville, Alabama 21-22 November 2005
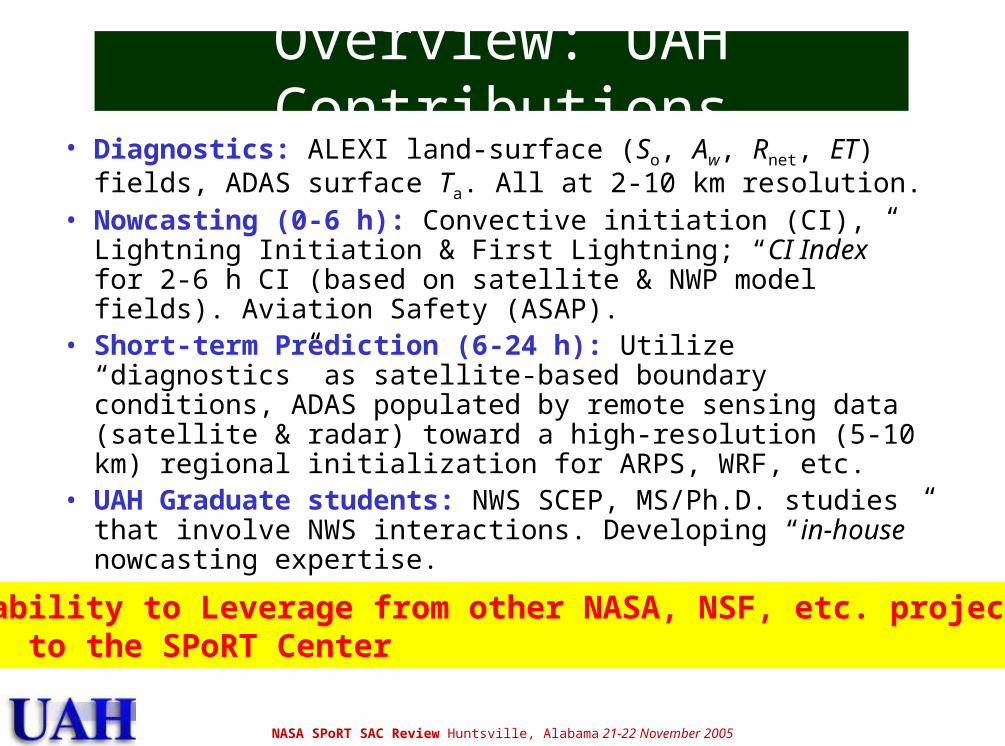
Overview: UAH Contributions• Diagnostics: ALEXI land-surface (So, Aw, Rnet, ET) fields,
ADAS surface Ta. All at 2-10 km resolution.• Nowcasting (0-6 h): Convective initiation (CI), Lightning
Initiation & First Lightning; “CI Index” for 2-6 h CI (based on satellite & NWP model fields). Aviation Safety (ASAP).
• Short-term Prediction (6-24 h): Utilize “diagnostics” as satellite-based boundary conditions, ADAS populated by remote sensing data (satellite & radar) toward a high-resolution (5-10 km) regional initialization for ARPS, WRF, etc.
• UAH Graduate students: NWS SCEP, MS/Ph.D. studies that involve NWS interactions. Developing “in-house” nowcasting expertise.
An ability to Leverage from other NASA, NSF, etc. projects,to the SPoRT Center
NASA SPoRT SAC Review Huntsville, Alabama 21-22 November 2005
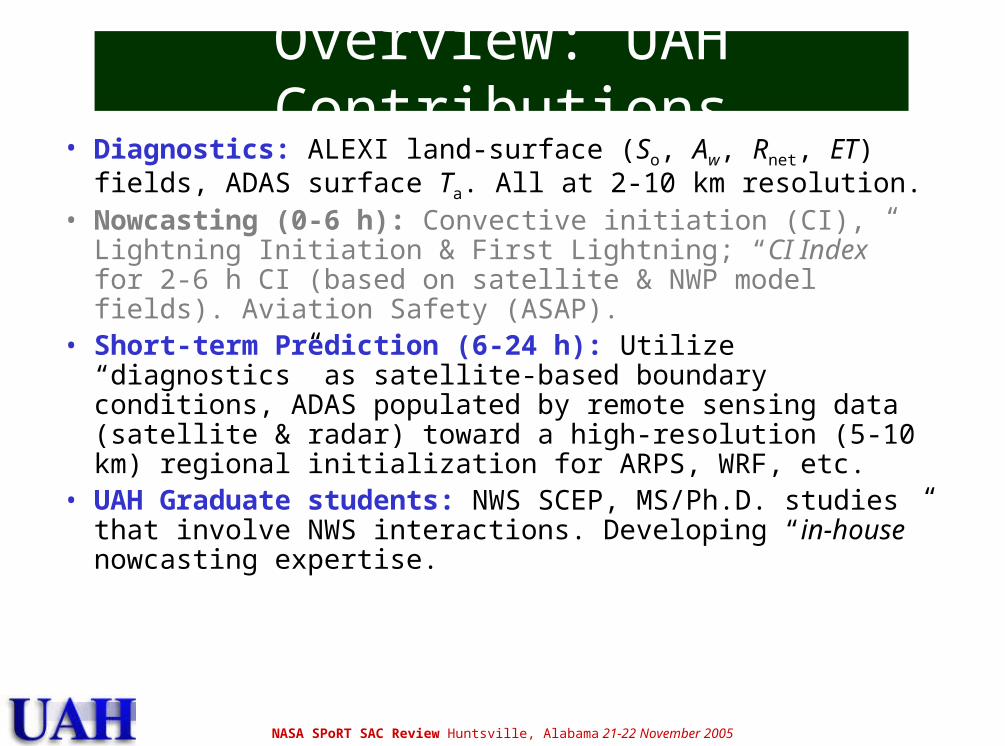
Overview: UAH Contributions• Diagnostics: ALEXI land-surface (So, Aw, Rnet, ET) fields,
ADAS surface Ta. All at 2-10 km resolution.• Nowcasting (0-6 h): Convective initiation (CI), Lightning
Initiation & First Lightning; “CI Index” for 2-6 h CI (based on satellite & NWP model fields). Aviation Safety (ASAP).
• Short-term Prediction (6-24 h): Utilize “diagnostics” as satellite-based boundary conditions, ADAS populated by remote sensing data (satellite & radar) toward a high-resolution (5-10 km) regional initialization for ARPS, WRF, etc.
• UAH Graduate students: NWS SCEP, MS/Ph.D. studies that involve NWS interactions. Developing “in-house” nowcasting expertise.
NASA SPoRT SAC Review Huntsville, Alabama 21-22 November 2005
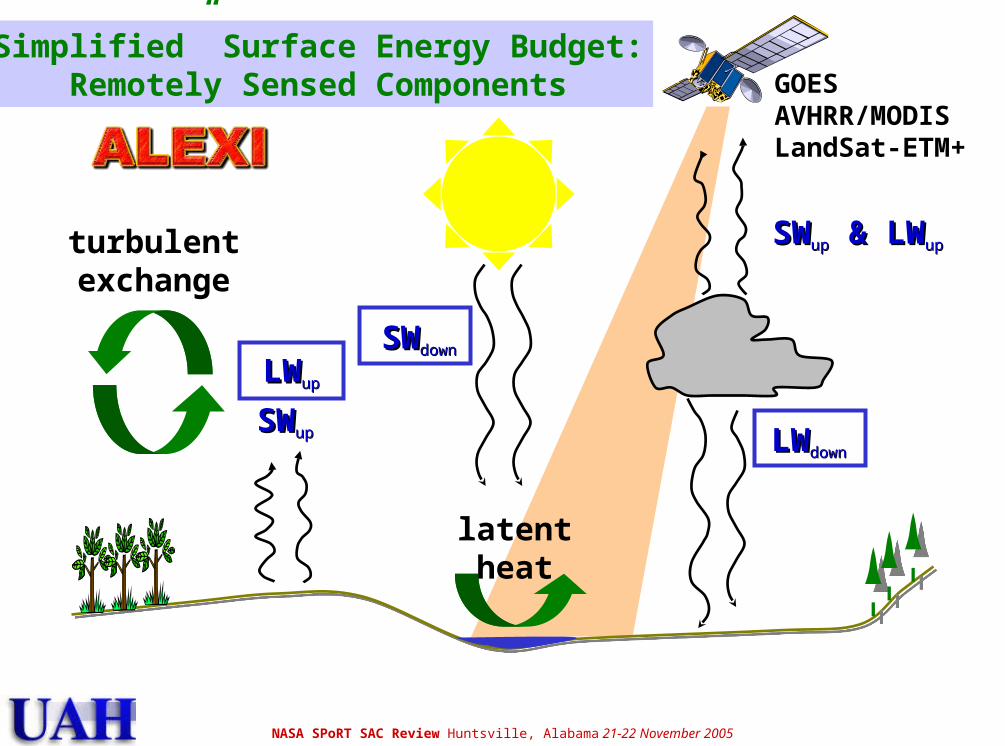
SWSWdowndown
SWSWuu
pp
LWLWdowndown
turbulentexchange
latentheat
SWSWupup & LW & LWupup
“Simplified” Surface Energy Budget:Remotely Sensed Components GOES
AVHRR/MODISLandSat-ETM+
LWLWupup
NASA SPoRT SAC Review Huntsville, Alabama 21-22 November 2005
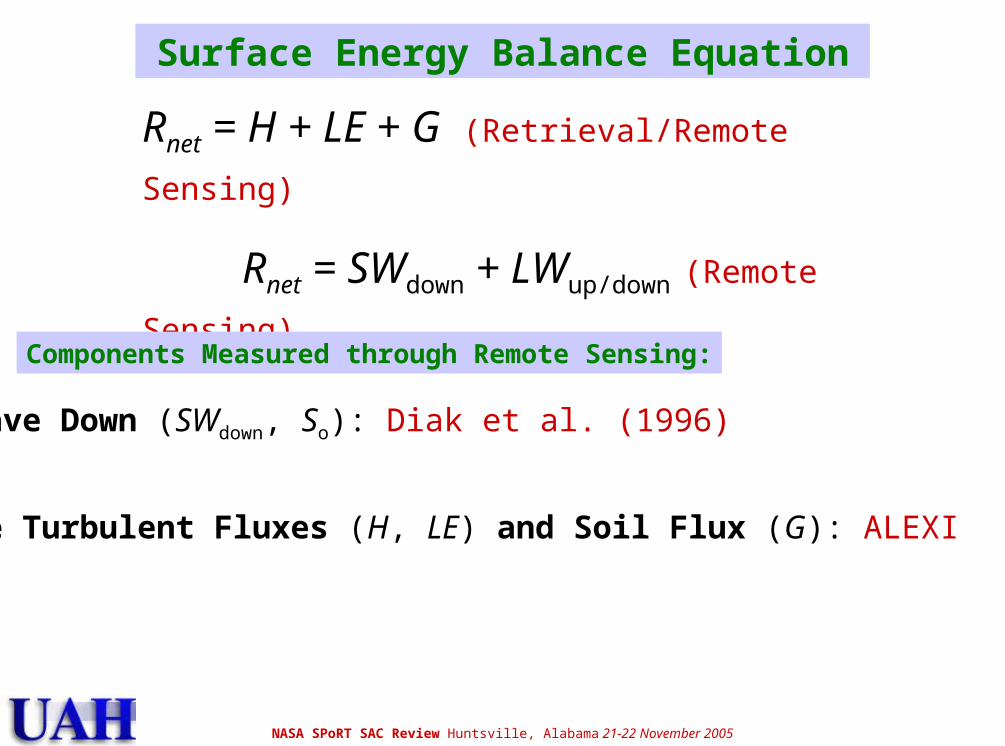
Surface Energy Balance Equation
Rnet = H + LE + G (Retrieval/Remote Sensing)
Rnet = SWdown + LWup/down (Remote Sensing)
Surface Energy Balance Equation
Components Measured through Remote Sensing:
Shortwave Down (SWdown, So): Diak et al. (1996)
Surface Turbulent Fluxes (H, LE) and Soil Flux (G): ALEXI
NASA SPoRT SAC Review Huntsville, Alabama 21-22 November 2005
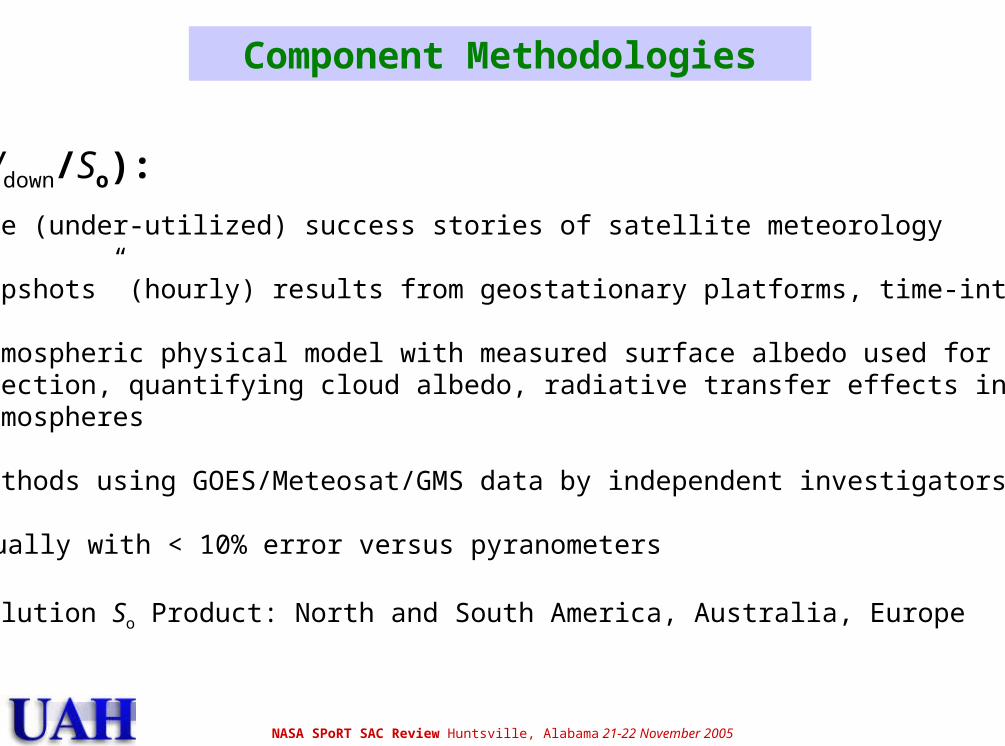
Solar (SWdown/So):
• One of the (under-utilized) success stories of satellite meteorology
• Many “snapshots” (hourly) results from geostationary platforms, time-integrated
• Simple atmospheric physical model with measured surface albedo used for cloud detection, quantifying cloud albedo, radiative transfer effects in clear and cloudy atmospheres
• Several methods using GOES/Meteosat/GMS data by independent investigators
• Daily So usually with < 10% error versus pyranometers
• 20 km resolution So Product: North and South America, Australia, Europe
Component Methodologies

NASA SPoRT SAC Review Huntsville, Alabama 21-22 November 2005
Physical Model

NASA SPoRT SAC Review Huntsville, Alabama 21-22 November 2005
Solar Insolation Validation & Products
Otkin’s stuff
Hourly GOESInsolation
versus
SurfaceObservations

NASA SPoRT SAC Review Huntsville, Alabama 21-22 November 2005
Solar Insolation: ALEXI Input
2 km
NASA SPoRT SAC Review Huntsville, Alabama 21-22 November 2005
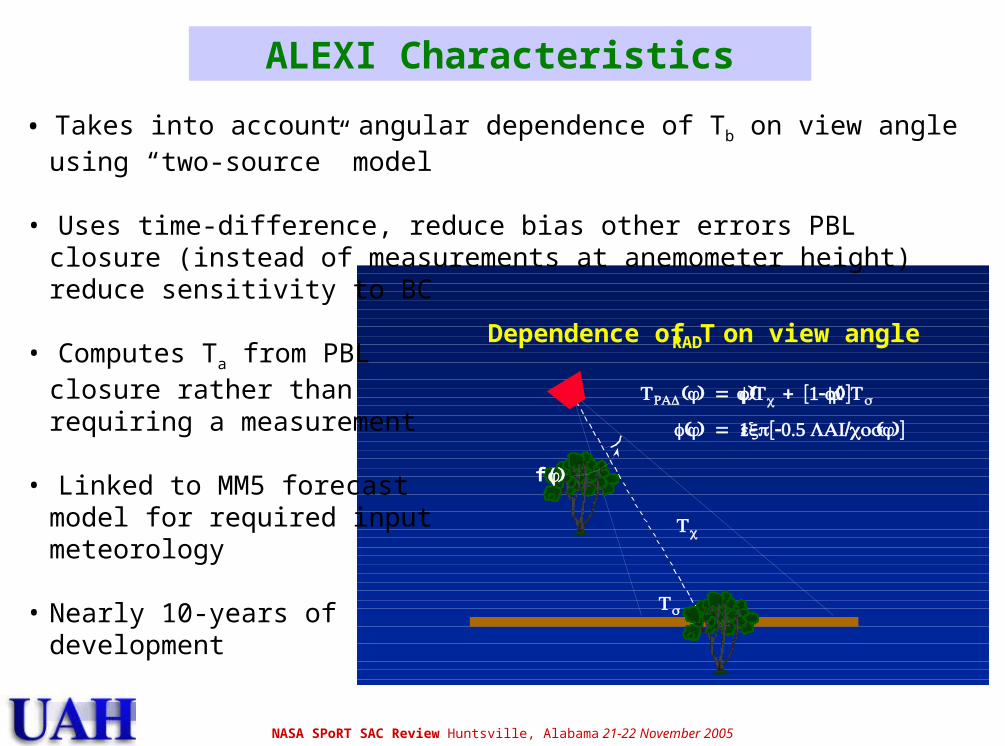
Dependence of T RAD on view angle
f(φ)
TRAD(φ) = (fφ)Tc + [1- (fφ)]T s
(f φ) = 1-exp[-0.5 /LAI cos(φ)]
Tc
Ts
• Takes into account angular dependence of Tb on view angle using “two-source” model
• Uses time-difference, reduce bias other errors PBL closure (instead of measurements at anemometer height) reduce sensitivity to BC
• Computes Ta from PBLclosure rather thanrequiring a measurement
• Linked to MM5 forecastmodel for required inputmeteorology
• Nearly 10-years ofdevelopment
ALEXI Characteristics
NASA SPoRT SAC Review Huntsville, Alabama 21-22 November 2005
zT
z1
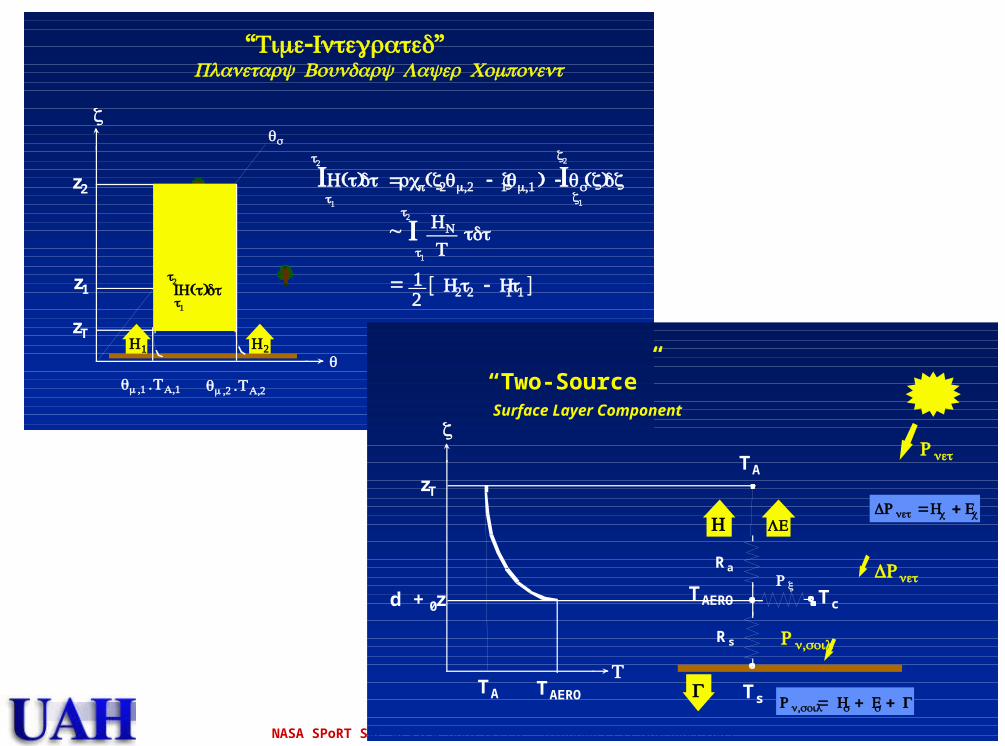
z2 Ι ( )H t dt = ρcp(z2θ ,2m - z1θ ,1m ) - Ιθs( )z dz
~ HN
Ttdt
[ H2t2 - H1t1 ]= 12
θm,2 .T ,2Aθm,1 .T ,1A
θs
“ - ”Time Integrated Planetary Boundary Layer Component
t1
t2
z1
z2
t1
t2
Ι
θ
z
H1 H2
t1
t2Ι ( )H t dt
TA
Ts
Ra
Rs
Tc
zT
d + z0
TA TAERO
“Two-Source” Surface Layer Component
TAERO
ΔRnet = Hc + Ec
Rn, soil= Hs + Es + G
Rnet
z
T
Rn,soil
ΔRnet
H LE
G
Rx
NASA SPoRT SAC Review Huntsville, Alabama 21-22 November 2005
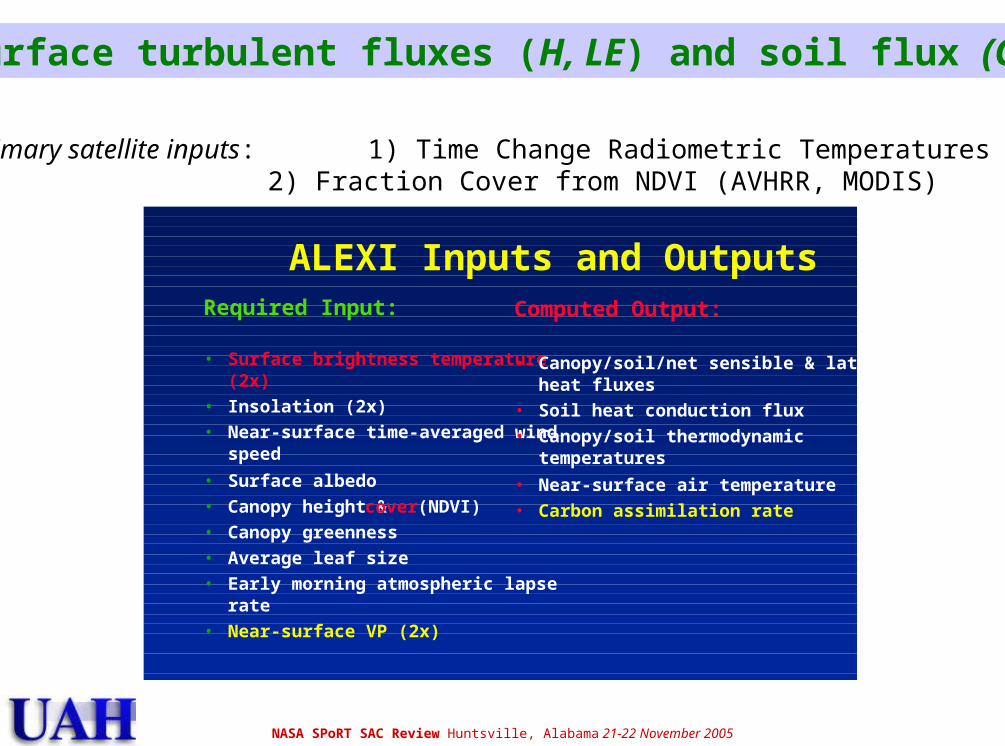
Surface turbulent fluxes (H, LE) and soil flux (G)
ALEXI Inputs and OutputsRequired Input:
• Surface brightness temperature(2x)
• Insolation (2x)
• Near-surface time-averaged windspeed
• Surface albedo
• Canopy height & cover (NDVI)
• Canopy greenness
• Average leaf size
• Early morning atmospheric lapserate
• Near-surface VP (2x)
Computed Output:
• Canopy/soil/net sensible & latentheat fluxes
• Soil heat conduction flux
• Canopy/soil thermodynamictemperatures
• Near-surface air temperature
• Carbon assimilation rate
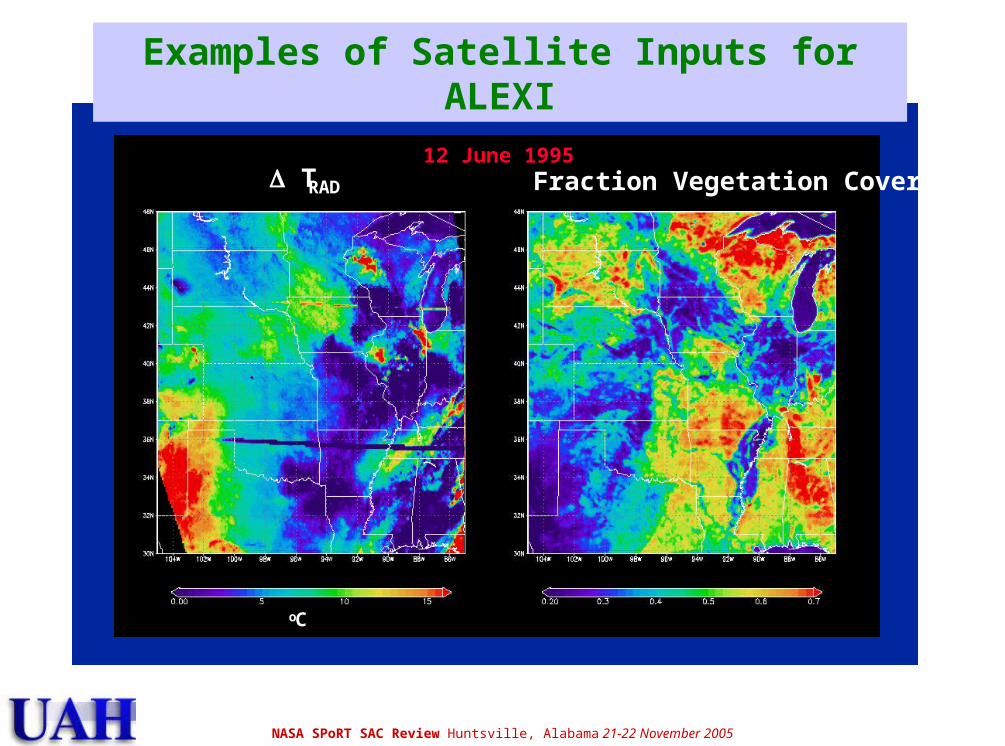
Primary satellite inputs: 1) Time Change Radiometric Temperatures (GOES)2) Fraction Cover from NDVI (AVHRR, MODIS)

NASA SPoRT SAC Review Huntsville, Alabama 21-22 November 2005
MODIS Data Usage within ALEXI
•Employ disaggregation using ALEXI (“DisALEXI”) with MODIS thermal data as twice-daily input.
•MODIS 250 m visible to sharpen thermal data to >1 km resolution.
•Develop regional-scale (e.g., over continental U.S.) disaggregation procedures that relies on MODIS imagery when available.
•Develop field-scale available water data sets at MODIS resolution for agriculture and NWP applications.
•Use MODIS land-surface products (e.g., NDVI, LAI).
1 km resolution
250 m resolution MODIS
MODIS direct broadcast capabilities at UW
Missouri
Arkansas
Illinois

NASA SPoRT SAC Review Huntsville, Alabama 21-22 November 2005
MODIS Land-Cover Data:• Transition from AVHRR NDVI & fraction vegetation cover to MODIS (“MOD15A”
Collection 4)• Anderson et al. (2006); Dr. M. C. Anderson (with NASA funds) gets credit for this
development
ALEXI Components: Driven by MODIS
-93.8 -93.75 -93.7 -93.65 -93.6 -93.55 -93.5 -93.45 -93.4
41.9
41.95
42
-93.8 -93.75 -93.7 -93.65 -93.6 -93.55 -93.5 -93.45 -93.4
41.9
41.95
42
-93.8 -93.75 -93.7 -93.65 -93.6 -93.55 -93.5 -93.45 -93.4
41.9
41.95
42
-93.8 -93.75 -93.7 -93.65 -93.6 -93.55 -93.5 -93.45 -93.4
41.9
41.95
42
-93.8 -93.75 -93.7 -93.65 -93.6 -93.55 -93.5 -93.45 -93.4
41.9
41.95
42
-93.8 -93.75 -93.7 -93.65 -93.6 -93.55 -93.5 -93.45 -93.4
41.9
41.95
42
-93.8 -93.75 -93.7 -93.65 -93.6 -93.55 -93.5 -93.45 -93.4
41.9
41.95
42
-93.8 -93.75 -93.7 -93.65 -93.6 -93.55 -93.5 -93.45 -93.4
41.9
41.95
42
-93.8 -93.75 -93.7 -93.65 -93.6 -93.55 -93.5 -93.45 -93.4
41.9
41.95
42
1 1.5 2 2.5 3 3.5 4 4.5 5
18
918
217
4
Landsat (30m) Landsat (0.01deg) MODIS (0.01deg)
Leaf Area Index
0
1
2
3
4
5
160 170 180 190 200 210 220
Day of year
MODIS
TM
MODIS vs. LandSat
NASA SPoRT SAC Review Huntsville, Alabama 21-22 November 2005
Δ TRAD Fraction Vegetation Cover
oC
12 June 1995
Examples of Satellite Inputs for ALEXI
NASA SPoRT SAC Review Huntsville, Alabama 21-22 November 2005
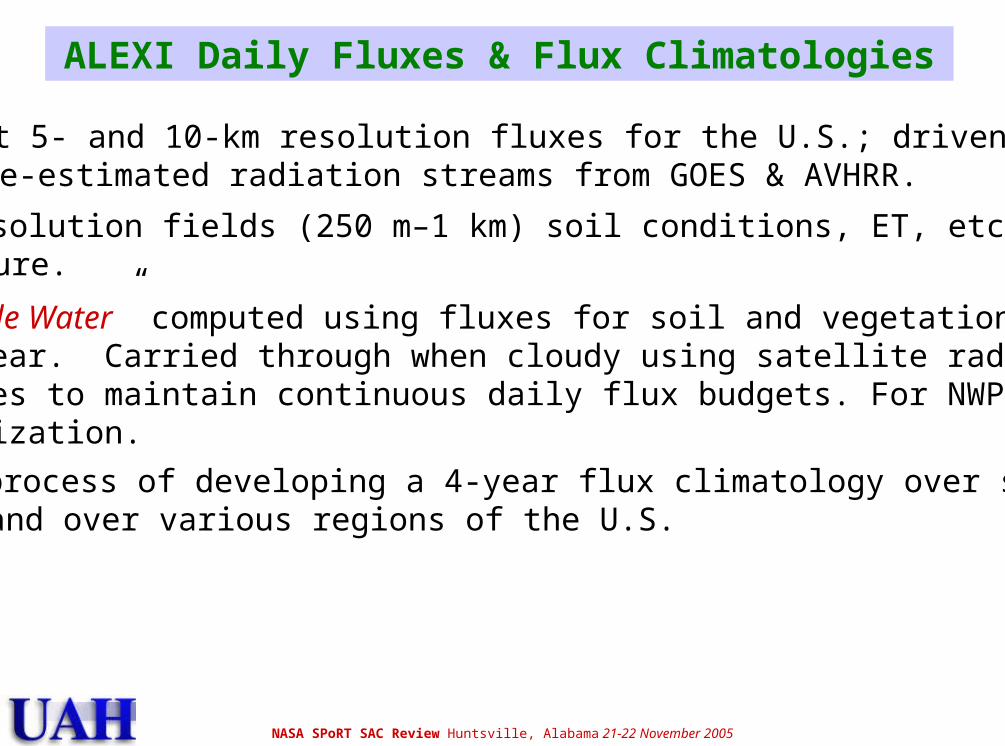
• Daily at 5- and 10-km resolution fluxes for the U.S.; driven bysatellite-estimated radiation streams from GOES & AVHRR.
• “Available Water” computed using fluxes for soil and vegetationwhen clear. Carried through when cloudy using satellite radiationestimates to maintain continuous daily flux budgets. For NWP datainitialization.
ALEXI Daily Fluxes & Flux Climatologies
• In the process of developing a 4-year flux climatology over seasons,months, and over various regions of the U.S.
• High resolution fields (250 m–1 km) soil conditions, ET, etc. foragriculture.

NASA SPoRT SAC Review Huntsville, Alabama 21-22 November 2005
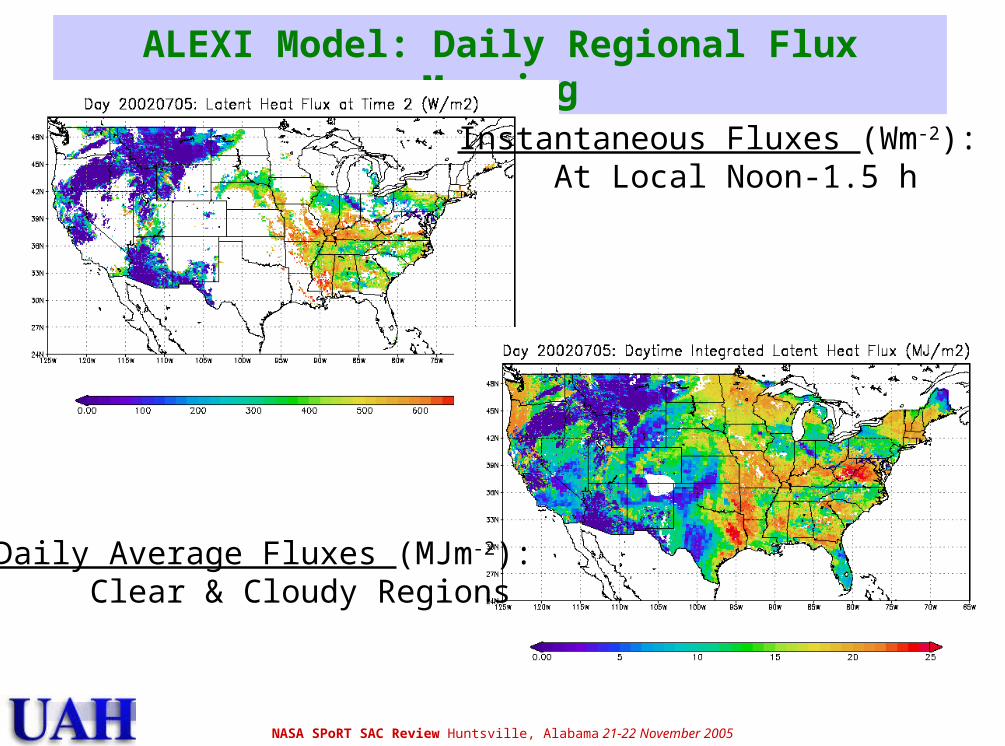
ALEXI Model: Daily Regional Flux Mapping
Region Fluxes (Wm-2):5 km Resolution
United States Fluxes (Wm-2):10 km Resolution
NASA SPoRT SAC Review Huntsville, Alabama 21-22 November 2005
ALEXI Model: Daily Regional Flux Mapping
Instantaneous Fluxes (Wm-2):At Local Noon-1.5 h
Daily Average Fluxes (MJm-2):Clear & Cloudy Regions

NASA SPoRT SAC Review Huntsville, Alabama 21-22 November 2005
1. Atmospheric Land EXchange Inverse (ALEXI) model• Turbulent Fluxes, Available Soil Water
2. ALEXI Soil Moisture Validation• Comparison to regional soil moisture measurements
3. WRF Model Initialization with ALEXI (versus EDAS)• Progress toward routine usage
O U T L I N E
NASA SPoRT SAC Review Huntsville, Alabama 21-22 November 2005
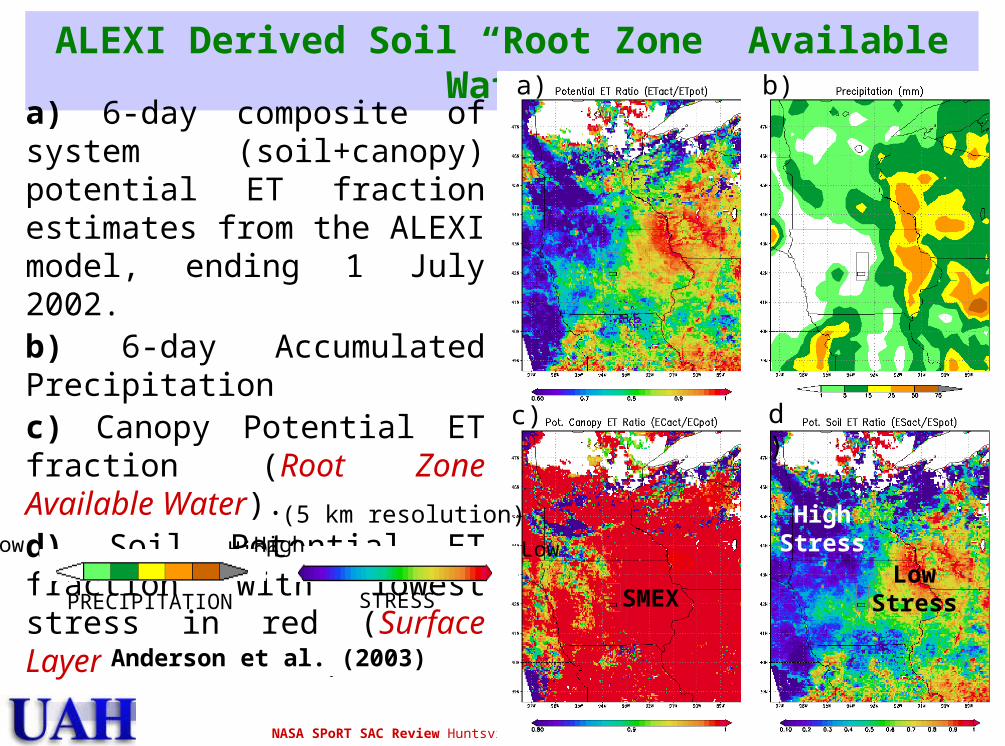
ALEXI Derived Soil “Root Zone” Available Water
a) 6-day composite of system (soil+canopy) potential ET fraction estimates from the ALEXI model, ending 1 July 2002.b) 6-day Accumulated Precipitationc) Canopy Potential ET fraction (Root Zone Available Water).d) Soil Potential ET fraction with lowest stress in red (Surface Layer Available Water)
a)
c) d)
b)
LowStressSMEX
HighStress
Anderson et al. (2003)
High Low
STRESS
Low High
PRECIPITATION
(5 km resolution)

NASA SPoRT SAC Review Huntsville, Alabama 21-22 November 2005
July 15, 2003 Radiometric ∆T
July 15, 2003 Vegetative Cover
July 15, 2003 Total System ET
An Example over the OklahomaMesonet:
Chris Hain (UAH)
NASA SPoRT SAC Review Huntsville, Alabama 21-22 November 2005
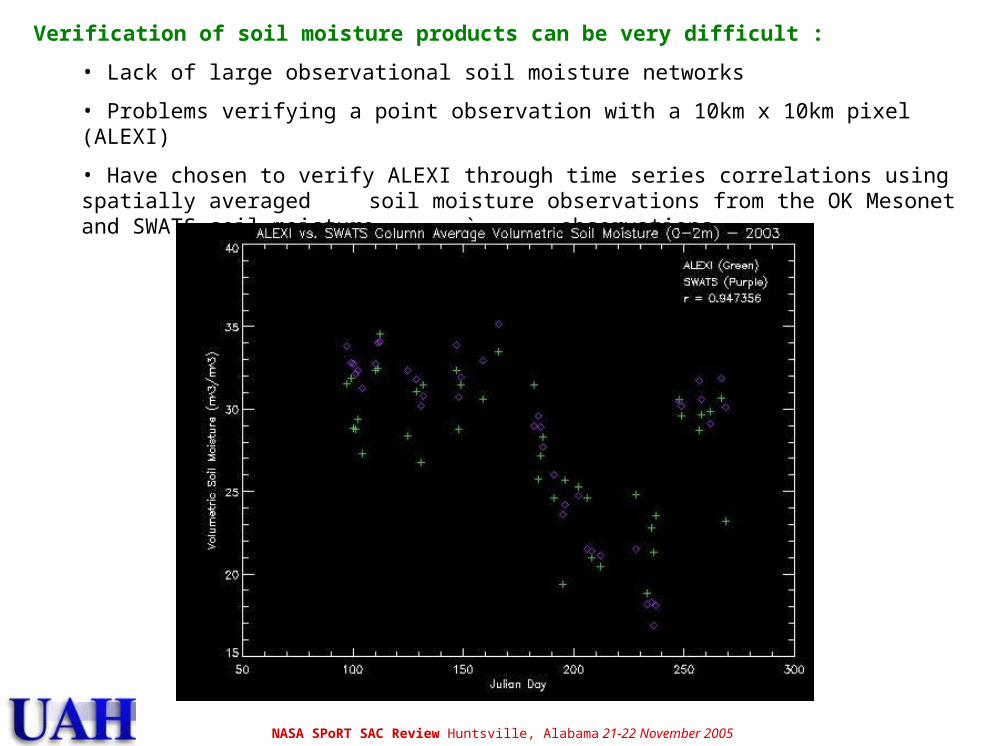
Verification of soil moisture products can be very difficult :
• Lack of large observational soil moisture networks
• Problems verifying a point observation with a 10km x 10km pixel (ALEXI)
• Have chosen to verify ALEXI through time series correlations using spatially averaged soil moisture observations from the OK Mesonet and SWATS soil moisture `observations.

NASA SPoRT SAC Review Huntsville, Alabama 21-22 November 2005
• Assume that ALEXI’s total system evapotranspiration is an integrated average of available water within the 0-200 cm soil column. Unfortunately, we know very little about the distribution of available water within that 0-200 cm soil column.
• Using the available water profile from NAM/EDAS initialization fields as a first guess of the soil profile, and adjust this profile to fit the integrated average of available water from ALEXI.
ALEXI Volumetric Soil Moisture (0 – 10 cm) – Sept 29, 2003
NASA SPoRT SAC Review Huntsville, Alabama 21-22 November 2005
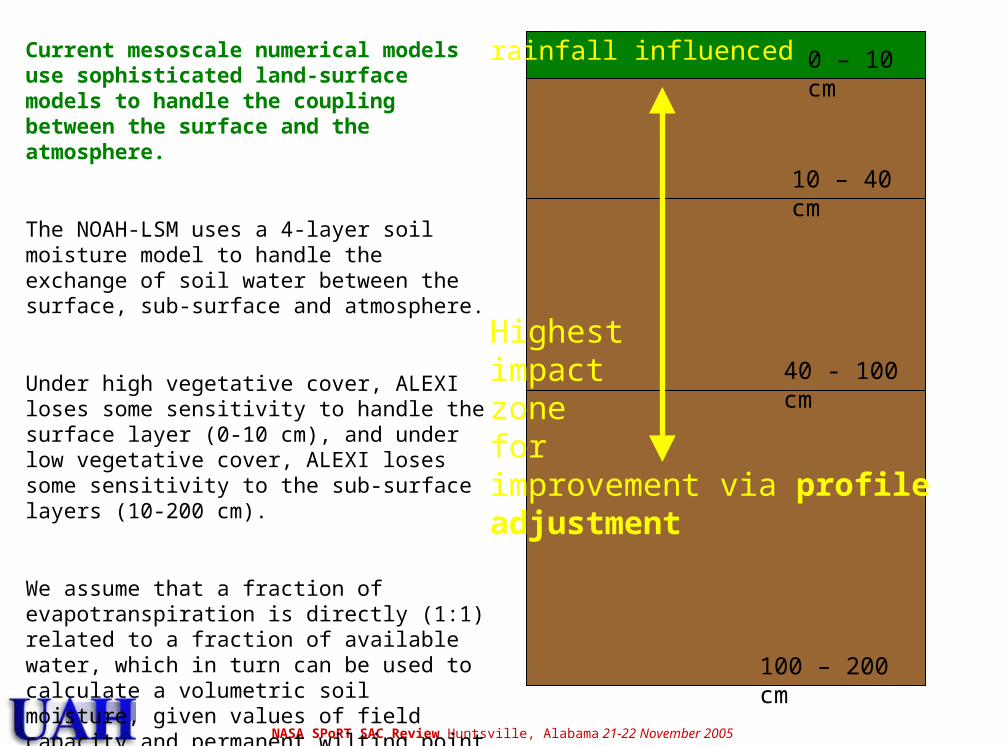
Current mesoscale numerical models use sophisticated land-surface models to handle the coupling between the surface and the atmosphere.
The NOAH-LSM uses a 4-layer soil moisture model to handle the exchange of soil water between the surface, sub-surface and atmosphere.
Under high vegetative cover, ALEXI loses some sensitivity to handle the surface layer (0-10 cm), and under low vegetative cover, ALEXI loses some sensitivity to the sub-surface layers (10-200 cm).
We assume that a fraction of evapotranspiration is directly (1:1) related to a fraction of available water, which in turn can be used to calculate a volumetric soil moisture, given values of field capacity and permanent wilting point for the soil type.
0 – 10 cm
10 – 40 cm
40 - 100 cm
100 – 200 cm
Highestimpactzoneforimprovement via profileadjustment
rainfall influenced
NASA SPoRT SAC Review Huntsville, Alabama 21-22 November 2005
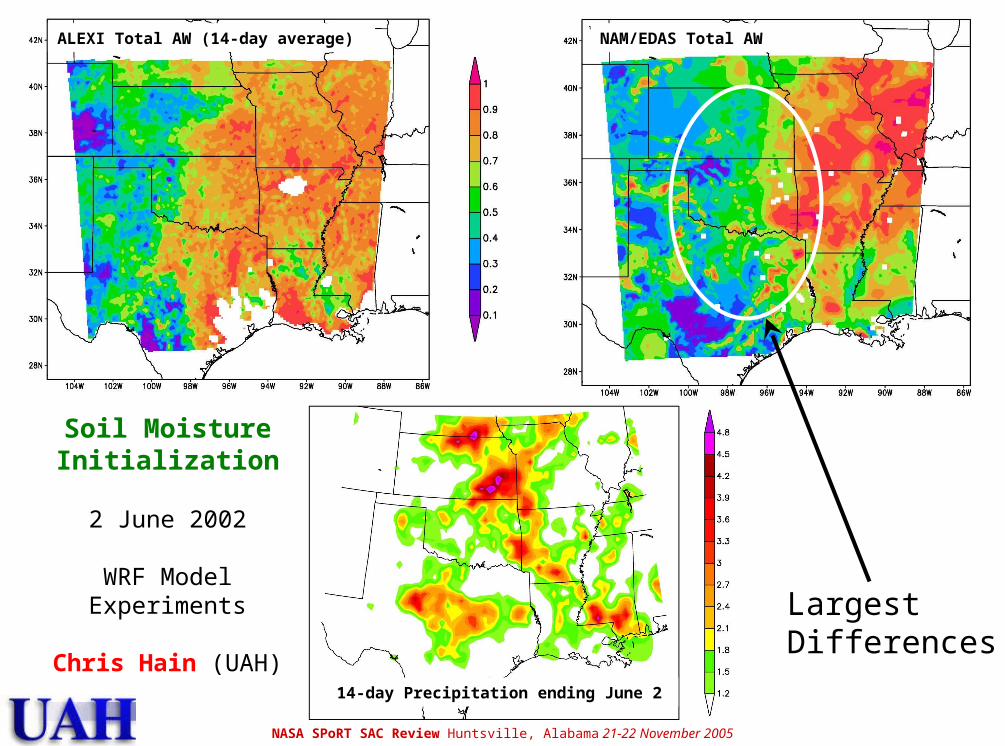
ALEXI Total AW (14-day average) NAM/EDAS Total AW
14-day Precipitation ending June 2
Soil Moisture Initialization
2 June 2002
WRF Model Experiments
Chris Hain (UAH)
LargestDifferences
NASA SPoRT SAC Review Huntsville, Alabama 21-22 November 2005
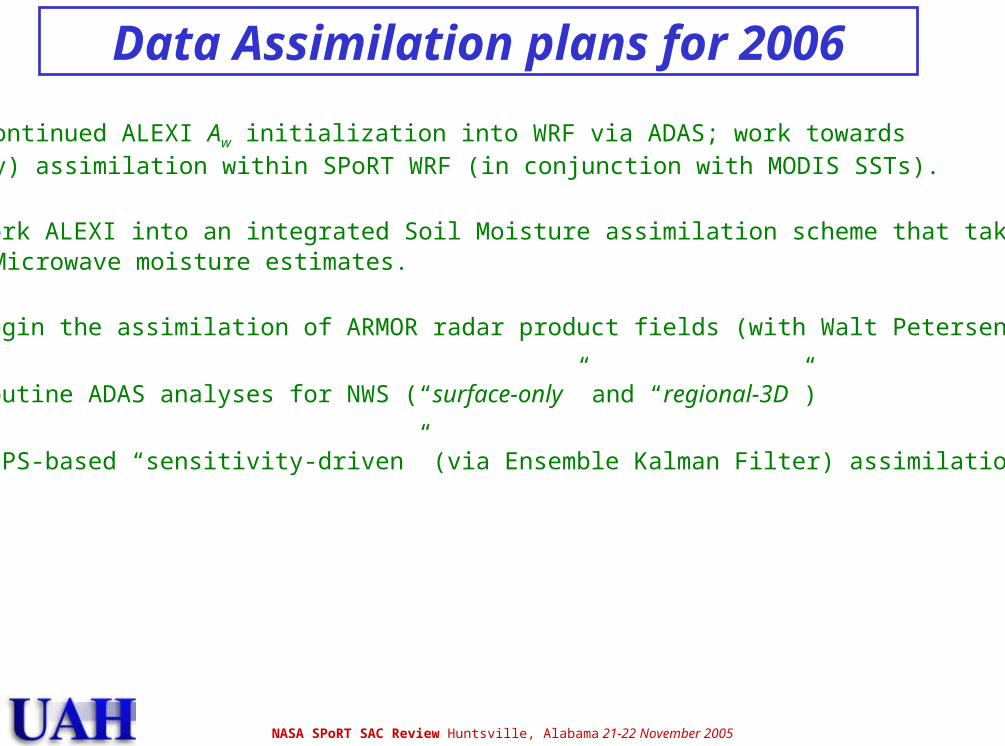
Theme 1: Continued ALEXI Aw initialization into WRF via ADAS; work towardsroutine (daily) assimilation within SPoRT WRF (in conjunction with MODIS SSTs).
Theme 2: Work ALEXI into an integrated Soil Moisture assimilation scheme that takes advantage of Microwave moisture estimates.
Theme 3: Begin the assimilation of ARMOR radar product fields (with Walt Petersen).
Theme 4: Routine ADAS analyses for NWS (“surface-only” and “regional-3D”)
Theme 5: MIPS-based “sensitivity-driven” (via Ensemble Kalman Filter) assimilation tool.
Data Assimilation plans for 2006

NASA SPoRT SAC Review Huntsville, Alabama 21-22 November 2005
Contact Information/Publications
Contact Info:Prof. John Mecikalski: [email protected] Hain: [email protected] C. Anderson: USDA (see me for email)
Web Page:nsstc.uah.edu/johnm/alexi/
Publications:Hain, C., and J. Mecikalski, 2006a: ALEXI soil moisture validation… Conf. Satellite
Meteorology and Oceanography. Atlanta, GA
Hain, C., and J. Mecikalski, 2006b: WRF-model initialization with ALEXI available soil moisture estimations… Conf. Satellite Meteorology and Oceanography. Atlanta, GA
Hain et al., 2006/07: Formal publication. In preparation. J. Hydrometeor.