NASA Jet Propulsion Laboratory Data Products · Jet Propulsion Laboratory - California Institute of...
19
NASA Jet Propulsion Laboratory Data Products National Aeronautics and Space Administration 17 April 2014 Emergency Response Spatial Tools Technical Interchange Maggi Glasscoe [email protected] Sang-Ho Yun [email protected] www.nasa.gov Jet Propulsion Laboratory California Institute of Technology Pasadena, CA Copyright 2014. All rights reserved.
Transcript of NASA Jet Propulsion Laboratory Data Products · Jet Propulsion Laboratory - California Institute of...

NASA Jet Propulsion Laboratory Data Products
National Aeronautics and Space Administration
17 April 2014 Emergency Response Spatial Tools Technical Interchange
Maggi Glasscoe [email protected]
Sang-Ho Yun [email protected]
www.nasa.gov Jet Propulsion Laboratory
California Institute of Technology Pasadena, CA Copyright 2014. All rights reserved.

National Aeronautics and Space Administration Jet Propulsion Laboratory - California Institute of Technology
Introduction
1
² JPL provides earthquake disaster decision support and an end-to-end data system to deliver rapidly processed geodetic data and actionable data products in the event of an earthquake and other natural disasters
² For the Interchange Discussion we are focusing on three products: § Tilt/Slope Change Map § Damage Proxy Map (DPM) § Infrastructure Database Service

National Aeronautics and Space Administration Jet Propulsion Laboratory - California Institute of Technology
Tilt/Slope Change Map
2
² Automatic calculation triggered from USGS earthquake event feed for >M5, iteratively refined
² Measurement of the change of slope and direction that can affect water distribution, drainage, and sewage services
² When deformation changes the tilt of essentially flat ground, or increases slopes that may be near the angle of repose, drainage or water conveyance may be affected and landslides may result.
² These products can be imported as layers that can be overlaid upon maps of critical infrastructure to determine which assets are likely to have suffered damage from the earthquake. This facilitates prioritization and assignment of available response resources

National Aeronautics and Space Administration Jet Propulsion Laboratory - California Institute of Technology
Tilt/Slope Change Map: Slope Percent and Direction
3
² Slope change map for Golden Guardian Exercise M 6.2 aftershock scenario based on modeled GPS data
² Color shows magnitude of slope change and arrows indicate direction
² This map product can be used in conjunction with infrastructure overlays to identify where damage may have occurred and response needs to be prioritized.

National Aeronautics and Space Administration Jet Propulsion Laboratory - California Institute of Technology
Damage Proxy Map (DPM)
4
² The DPM applies an automated change detection algorithm to Synthetic Aperture Radar (SAR) that has been demonstrated to detect:
§ Building damage/collapse § Liquefaction § Landslides § Flooding/inundation extent
² A DPM provides both a synoptic view and high spatial detail of damage.
² DPM’s are based on radar observations, which can be acquired day or night and can image through clouds, unlike optical imagery.
² DPMs can be provided in KML/KMZ, GeoTIFF, and Shapefile.
Example of building collapse detected by DPM from Christchurch Earthquake
National Aeronautics and Space Administration Jet Propulsion Laboratory - California Institute of Technology
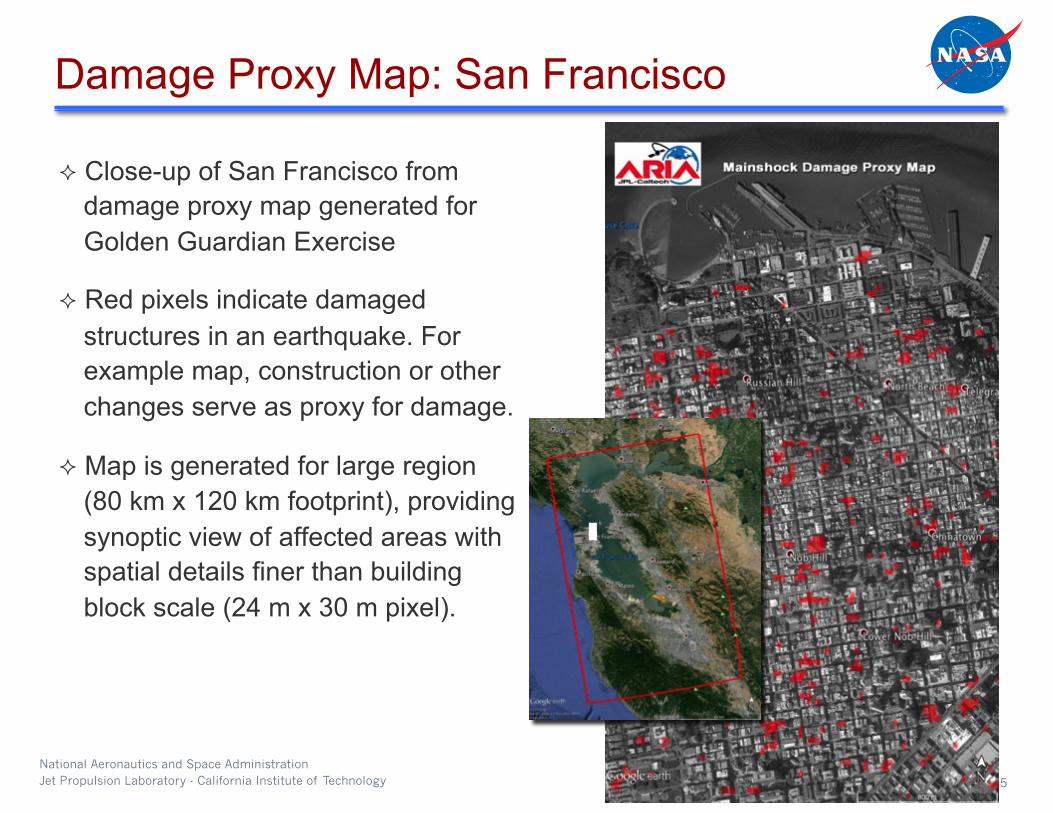
Damage Proxy Map: San Francisco
² Close-up of San Francisco from damage proxy map generated for Golden Guardian Exercise
² Red pixels indicate damaged structures in an earthquake. For example map, construction or other changes serve as proxy for damage.
² Map is generated for large region (80 km x 120 km footprint), providing synoptic view of affected areas with spatial details finer than building block scale (24 m x 30 m pixel).
5

National Aeronautics and Space Administration Jet Propulsion Laboratory - California Institute of Technology
Original ALOS Data © JAXA, METI 2011 Official damage map provided by the New Zealand Government (http://data.govt.nz)
Damage Proxy Map vs. Ground Observations
6
Feb Mar Apr May Jun Jul Aug Sep Oct 2011
• 185 people killed • > 1000 buildings destroyed • Over US $30 billion damage M6.3 Christchurch Earthquake
Radar data acquired by ALOS satellite
Official damage map released based on ground observations
DPM from radar data
Official damage map updated based on ground observations
Shakemap released by USGS NEIC

National Aeronautics and Space Administration Jet Propulsion Laboratory - California Institute of Technology
Infrastructure Database Service ² Enables user to access near 30 FEMA critical
infrastructure information layers with HSIP Freedom data overlaid upon map data products from E-DECIDER and QuakeSim (or others)
² Supports spatial query for broader range of emergency situations: point (e.g. earthquake), line (e.g. tornado, fault rupture), and polygon (e.g. flood, wildfire), and user-specified search distance; bounding box search is now supported
² Supports KML output for Google Earth and Google Map, GeoJSON output for mobile web applications, and UICDS event adaptor is under development
² Data inventory hosted on third-party GIS server can be added through WFS chain service
7
National Aeronautics and Space Administration Jet Propulsion Laboratory - California Institute of Technology
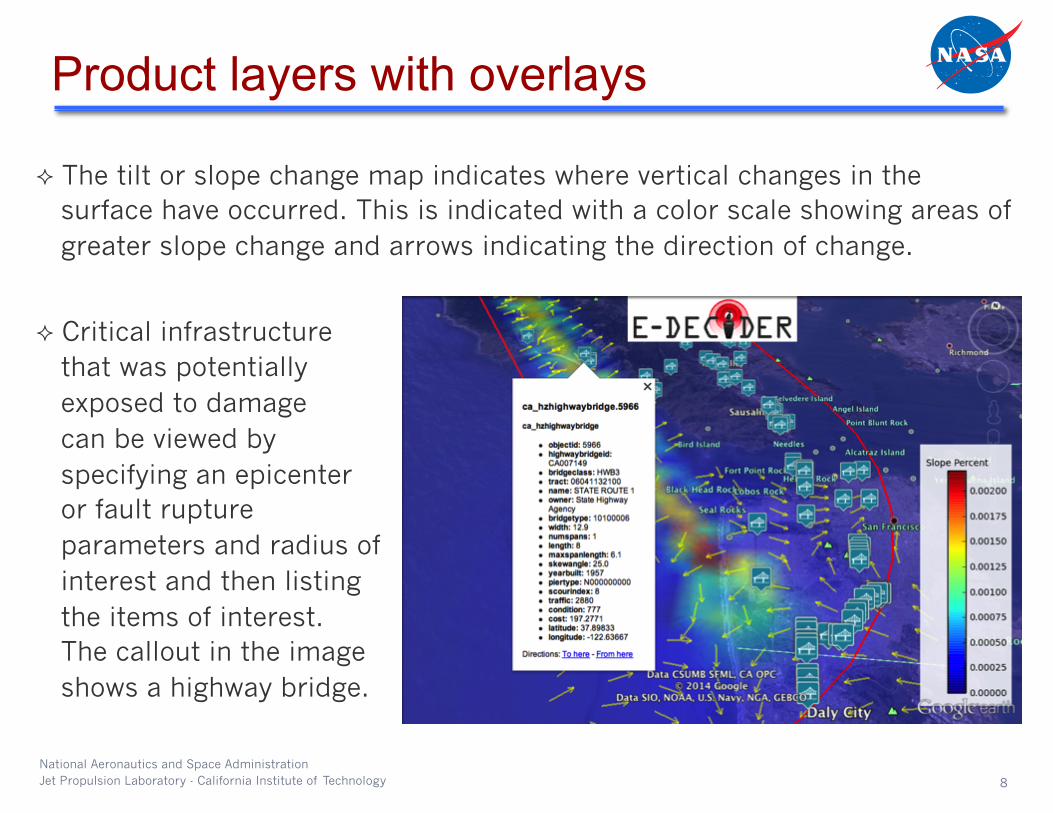
² The tilt or slope change map indicates where vertical changes in the surface have occurred. This is indicated with a color scale showing areas of greater slope change and arrows indicating the direction of change.
² Critical infrastructure that was potentially exposed to damage can be viewed by specifying an epicenter or fault rupture parameters and radius of interest and then listing the items of interest. The callout in the image shows a highway bridge.
Product layers with overlays
8

National Aeronautics and Space Administration Jet Propulsion Laboratory - California Institute of Technology
Product latencies: When will they be available?
9
Refined model based deforma/on products, a5ershock forecasts
Damage and loss es/ma/on based on remote sensing change detec/on and valida/on
Ini/al model based deforma/on products, Infrastructure database layers
Radar based Damage Proxy Maps, improved remote sensing change detec/on results
Refined GPS based deforma/on maps
0 -‐ 5 min 0 -‐ 1 hr within 24 hrs 12 hr -‐ 12 days ~7 days + 3 -‐ 24 hr
Con/nued refinement of models and forecasts, first GPS results and deforma/on maps

National Aeronautics and Space Administration Jet Propulsion Laboratory - California Institute of Technology
NASA JPL Data Exchange
10
Users query products
(Spot On Response, NICS, etc)
Pass on to Decision Makers
(local, state, federal)
Post to UICDS
Products Generated
UICDS Core
Metadata Digest
Metadata Digest
Payload
Work Product

Questions?
National Aeronautics and Space Administration
Maggi Glasscoe [email protected]
Sang-Ho Yun [email protected]
http://e-decider.org http://aria.jpl.nasa.gov
www.nasa.gov Jet Propulsion Laboratory California Institute of Technology Pasadena, CA Copyright 2014. All rights reserved.

Backup
National Aeronautics and Space Administration
www.nasa.gov Jet Propulsion Laboratory California Institute of Technology Pasadena, CA Copyright 2014. All rights reserved.

National Aeronautics and Space Administration Jet Propulsion Laboratory - California Institute of Technology
Data provided by the New Zealand Government 2011.10.28 version. http://data.govt.nz
Damage Proxy Map (ALOS PALSAR): 2010.10.10 – 2011.01.10 – 2011.02.25
Derived from Radar data acquired 3 days after the earthquake
Damage zone map based on house/land inspection 8 months after the earthquake
Original ALOS Data © JAXA, METI 2011
Damage Proxy Map vs Technical Category
13

National Aeronautics and Space Administration Jet Propulsion Laboratory - California Institute of Technology
Displacement & Strain Maps
Simulation of GPS results from a San Francisco Bay earthquake, used for California Earthquake Clearinghouse exercise. These products would be produced by ARIA and used for situational awareness by response agencies after a real event.

National Aeronautics and Space Administration Jet Propulsion Laboratory - California Institute of Technology
Displacement and DPM example

National Aeronautics and Space Administration Jet Propulsion Laboratory - California Institute of Technology
Photo Courtesy The Telegraph
Photo Courtesy AFP
Photo Courtesy NZ gov official
DPM Google Earth MEDIA
A
B
C
A
B
C

National Aeronautics and Space Administration Jet Propulsion Laboratory - California Institute of Technology
Mw6.9 earthquake example

National Aeronautics and Space Administration Jet Propulsion Laboratory - California Institute of Technology
SAR Data Acquisition Latency
² Expected wait time until the first SAR satellite to visit after an event
² Ascending + descending orbit
² Right-looking mode
² Latitude : 0°, 38°, 60°
² Present: 19 hours
² 2020: 13 hours
1995 2000 2005 2010 2015 20200
1
2
3
4
5
6
7
8
9
Year
Expe
cted
wai
t tim
e (d
ays)
SAR Data Acquisition Latency (2014/02/25)
ERS−1
ERS−2
ENVENVext
SENTINEL−1A
SENTINEL−1B
ALOS−1
ALOS−2
NI−SAR
CSK1
CSK2
CSK3
CSK4
CSG1
CSG2