NASA Instrument Cost Model Impact of Mission Class on … · · 2016-11-22NASA Instrument Cost...
35
NASA Instrument Cost Model Impact of Mission Class on Cost Joe Mrozinski Mike DiNicola Hamid Habib-Agahi NASA Cost Symposium, August 2016 Jet Propulsion Laboratory California Institute of Technology Copyright 2013 California Institute of Technology. Government sponsorship acknowledged.
Transcript of NASA Instrument Cost Model Impact of Mission Class on … · · 2016-11-22NASA Instrument Cost...

NASA Instrument Cost Model
Impact of Mission Class on Cost
Joe Mrozinski Mike DiNicola
Hamid Habib-Agahi
NASA Cost Symposium, August 2016
Jet Propulsion Laboratory California Institute of Technology
Copyright 2013 California Institute of Technology. Government sponsorship acknowledged.
Page 2

Page 3

Page 4
What is NICM?
• NASA Instrument Cost Model – Probabilistic Cost Estimates for Space Flight Instruments – Used by all NASA Centers
• And any organization proposing instruments for NASA Instruments
• And proposal evaluators – Version I Released in 2007 – Version VII Rev 2 Released 2016

Page 5
What is NICM?
• NICM also: – Estimates schedule – Estimates cost and schedule phase breakdowns – Supports JCL – Contains an normalized instrument database (for civil servants)

Page 8
Today’s Story: Mission Class
• Once upon a time… (2007): – Version I of NICM was released, and lived (mostly) in the kingdom of
Class B missions. – For many ages, NICM prospered in this land (NICM I – NICM V)… – …Until the denizens of Class C Missions revolted! – NICM VI was bestowed upon the land of Class C Missions (2014),
and everybody* lived happily ever after. – Or so we thought…
*Everybody = C Class Missions/University Built/High Inheritance

Page 9
Today’s Story: Mission Class
• In order for EVERYBODY to be happy, NICM needs to be able to help out Class D missions as well.
• And it’s Mike’s job to make everybody happy =)

Preliminary Analysis of Mission Class on Optical Instrument Cost
Mike DiNicola NASA Cost Symposium, August 2016

Page 11
Overview
• NASA’s Mission Class is way to classifyacceptable risk for NASA payloads. – “Risk” = likelihood of not achieving mission
success • Mission Class drives the scope of work
throughout development, for example: – Design – Reviews – Documentation – Testing, analysis, – Reliability qualification – Requirements
VIM
S (C
assi
ni)
Class A
Class B
LOLA
(LR
O)
GSP
EC (O
CO
)
Class C
NIS
(LC
RO
SS)
Class D
If Mission Class drives the scope of work, then shouldn’t it drive cost as well?

Page 12
What We Are Doing
• The NICM Team is analyzing the Mission Class/Instrument cost relationship for 76 remote sensing optical instruments flying on 42 NASA space missions. – Largest homogenous group of data in the NICM Database
• Review results with the NICM Team and larger cost community.
• Presented here are results of this analysis to-date, focusing on top-level observations.
Discussion is encouraged!

Page 13
Analysis Process Cost-per-kg 1 Cluster Analysis 2
Model Residuals 3
Fu,v CDF
Preliminary CERs & Formal Analysis of Covariance
4

Page 14
Normalized Data Used in this Analysis (Remote Sensing Optical Instruments Only)
Mission Instrument (Mission) Count Class *Earth Orbiting = Blue; Planetary = Black
Class A CIRS, ISS, UVIS, VIMS (all Cassini) 4
Class B ACIS (Chandra), ACRIM II (UARS), ACRIM III (ACRIMSAT), AIA 48 (SDO), AIRS (Aqua), ALICE (Rosetta), APS-Glory (Glory), CERES (TRMM), CFI (CONTOUR), CRISM (MRO), CRISP (CONTOUR), CTX (MRO), DLRE (LRO), EVE (SDO), HIRDLS (Aura), HiRISE (MRO), HMI (SDO), HRC (Chandra), HRI (Deep Impact), IRAC (Spitzer), IRS (Spitzer), ITS (Deep Impact), JunoCam (Juno), LAC (EO-1), LOLA (LRO), LORRI (New Horizons), LROC (LRO), M3 (Chandrayaan 1), MARCI (MRO), MASCS (MESSENGER), MCS (MRO), MDIS (MESSENGER), MICAS (Deep Space 1), MIPS (Spitzer), MISR (Terra), MLA (MESSENGER), MOC (Mars Observer), MODIS (Terra), MOLA (Mars Observer), MRI (Deep Impact), OLI (LDCM), ONC (MRO), PHOTO (Kepler), PMIRR (Mars Observer), TES (Aura), TES_MO (Mars Observer), TOMS (EP - Earth Probe Satellite), UVS (Juno)
Class C CHIPS, CIPS (AIM), FUV (IMAGE), GALEX, GSPEC-OCO (OCO), 16 GUVI (TIMED), IRIS, MSI (NEAR), NavCam (Stardust), NIS (NEAR), NLR (NEAR), SABER (TIMED), SOFIE (AIM), THEMIS (Mars Odyssey), TRACE, WISE
Class D MIR, NIR, NSP, TLP, VIS, VSP (all LCROSS), NuStar, RHESSI 8
Total 76

Page 15
Data Exploration: Cost-per-kg Mission Class
Tapering down of the cost-per-kg is evident as Mission Class moves from A/B to C/D.
Page 16
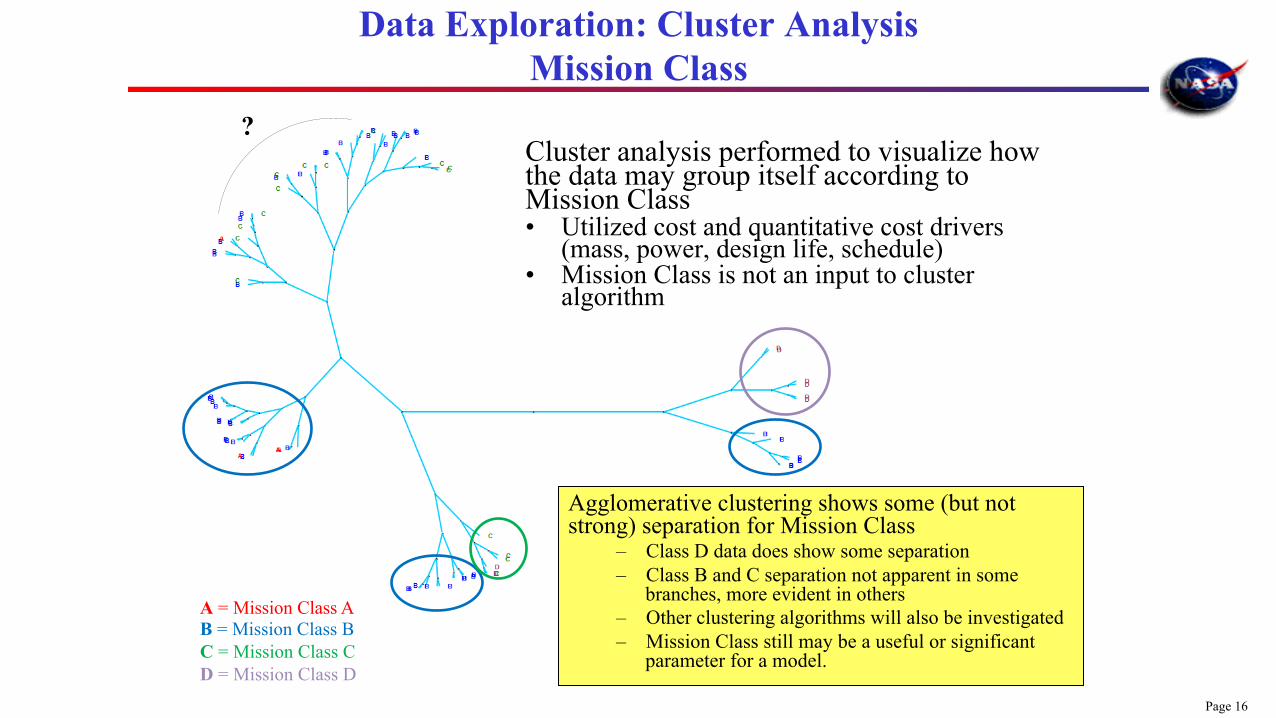
Data Exploration: Cluster Analysis Mission Class
Cluster analysis performed to visualize how the data may group itself according to Mission Class • Utilized cost and quantitative cost drivers
(mass, power, design life, schedule) • Mission Class is not an input to cluster
algorithm
?
A = Mission Class A B = Mission Class B C = Mission Class C D = Mission Class D
Agglomerative clustering shows some (but not strong) separation for Mission Class
– Class D data does show some separation – Class B and C separation not apparent in some
branches, more evident in others – Other clustering algorithms will also be investigated – Mission Class still may be a useful or significant
parameter for a model.

Page 17
Data Exploration: Cluster Analysis How about Destination?
What if we color the clusters by Destination (Earth Orbiting or Planetary)?
Agglomerative clustering shows a moderate level of separation for destination.
– Groups of Earth orbiting and Planetary instruments seem to find their own clusters or sub-clusters EO = Earth Orbiting
PL = Planetary

Page 18
Data Exploration: Cost-per-kg Mission Class vs. Destination
Grouping data according to Mission Class vs Destination results in similar changes in cost-per-kg; this is slightly more apparent when
grouped by Mission Class.

Page 19
Analysis Process (Revisited)
Fu,v CDF
Cost-per-kg Cluster Analysis
Model Residua liminary CERs & Formal Analysis of Covariance
1 2
3 4
Assess interplay between Mission
lsC lass & DestinationPre

Page 20
Model Evaluation – Mission Class
Place the power model: Cost ≈ αMassβ Pwrγ on the data and assess residuals*
* For this initial analysis, Total Mass and Max Power were used based on significance testing done for NICM VII. Other variables are currently being investigated.

Page 21
Analysis Summary
Method Mission Class Destination Clustering Some evidence for split by Moderate evidence for split by (Agglomerative) Mission Class in sub-clusters Destination (Earth Orbiting /
Planetary) Dollar-per-kg Visible $/kg trend downward Visible $/kg decrease from
from Mission Class A/B to C/ Planetary to Earth Orbiting D
Model 1-way AnCoVa Mission Class is a significant Destination is a borderline (in progress) discriminator (p<0.001) significant discriminator
(0.05<p<0.1)
Method No Grouping by Destination Group Data by Destination Model Residuals Moderate to Strong visible Some trend visible in residuals
trend in residuals for Mission for Mission Class (more for Class Earth Orbiting instruments).
Model 2-way AnCoVa TBD: Will be testing both nested and un-nested models as well as interactions

Analysis Results To-date
Clustering favors a
Destination split - Earth
Orbiting vs. Planetary
When we place a model on
the data, significance testing
seems to favor Mission Class
as a parameter
Potential Models ..---------------------------------------------
O Group data by Destination, then fit a model using
Mission Class and other cost driving variables
A Group data by Mission Class A/B and Mission Class V CID, then fit model using other cost driving variables
Page 22

Page 23
In-work CERs
• The following slides show in-work CERs to illustrate potential results
• CERs are not intended for use by the Community at this point in time

Page 24
In-work CERs: 1 Group by Destination, then Fit Class
Earth Orbiting Planetary
*Other models / variables may show significance with future analysis

Page 25
In-work CERs: 2 All Destinations, Group by Class
Class A or B
Class A Class B
Class C Cost = $344 x M^0.50 x P^0.56 Class D Cost = $68 x M^0.50 x P^0.56
Class C Class D
Class C or D
*Other models / variables may show significance with future analysis
Page 26
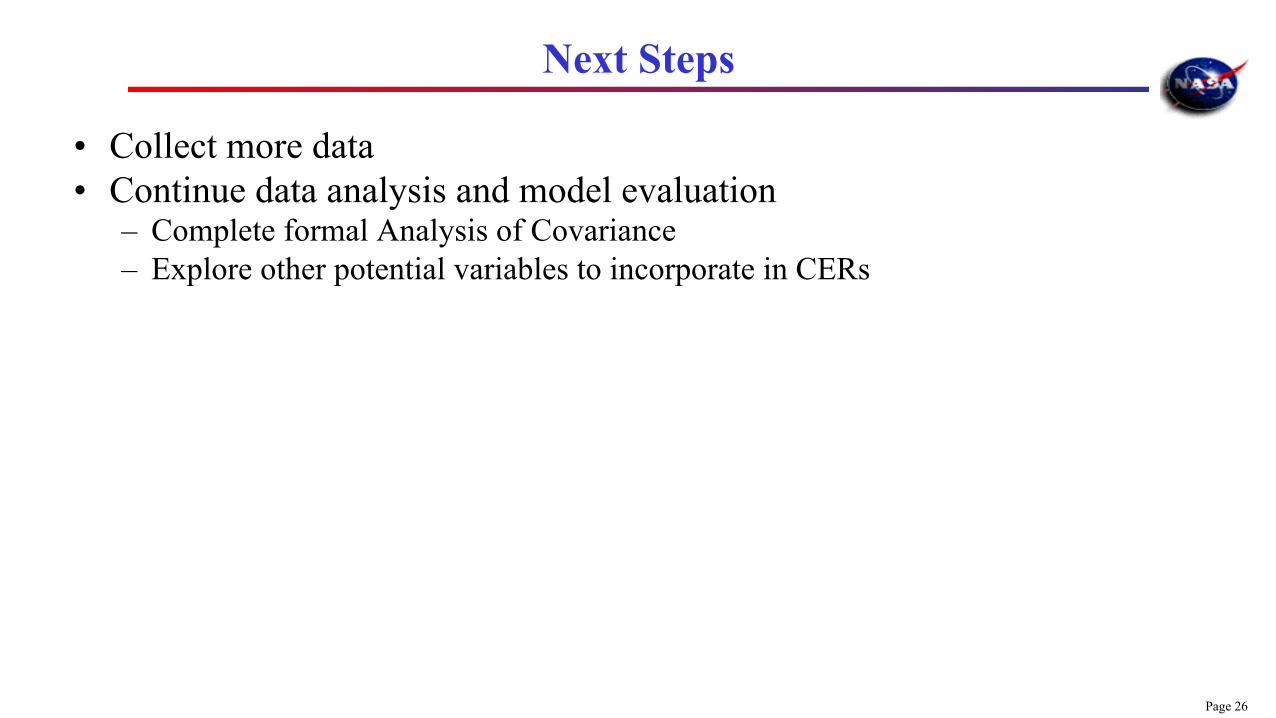
Next Steps
• Collect more data • Continue data analysis and model evaluation
– Complete formal Analysis of Covariance – Explore other potential variables to incorporate in CERs

Page 27
Thank you!
• Questions?

Page 28
Backup
• NPR 8705.4, Appendix B • Current Remote Sensing Optical CERs in NICM VII • Current NICM-E CER • Clustering vs. Fit • Preliminary Analysis of Covariance (AnCoVa)

[ Charactelization I [ Class A P1iority (Criticality High priority to Agency Strategic Plan
I[ Class B High priority
][ Class C 1[ Class D edium priority Low priority
-----
ighlr
High to medium
l edium I Low to medium r
edium to low
Mission Lifetime (Primary Baseline Mission [cost Launch Constraints I
In-Flight jN/A Maintenance [ Alternati, e o altemative Fev. or no Significant altemative Research or re-flight alternative or alternative or or re-flight Opportunities or opportunities re-flight ·e-flight opportunities Re-flight opportunities opportunitiesOpportunities JExamples HST. Cassini. MER.MRO. ESSP. Explorer SPARTAN. GAS
JIMO.JWST Discovery Payload . Can. teclmology payloads. ISS MIDEX. ISS demonstrators. simple Facility Class complex ISS. express 111.iddeck Payloads. sub rack and subrack Attached ISS ayload payloads. SMEX
ayloads
Page 29
NPR 8705.4, Appendix B

Page 30
Current NICM VII Optical RS CERs
Earth Orbiting Planetary

Page 31
Current NICM-E CER

Page 32
Clustering vs. Fit
Clusters do not necessarily provide great fit.
Fit may be good but
combine clusters of statistically different things.

Page 33
Model Evaluation – Analysis of Covariance (AnCoVa)
• What are questions we would like to answer? – Is there a significant shift in instrument cost due to Mission Class? – Is Mission Class a more significant factor than Destination (Earth Orbiting or
Planetary)? – How does Destination affect our perception of cost when we look at Mission
Class? • We will use these questions to guide our development of hypotheses to
be tested.

Page 34
1-way AnCoVa Preliminary Results
• Significant mean-shift between Mission Classes – Null Hypothesis H0: The scaler shift between Class A&B is
the same as Class C&D – Null hypothesis rejected (p-value << 0.001)
• Mean-shift for Mission Class is more significant than that for Destination – Null Hypothesis H0: The scaler shift between Earth Orbiting
instruments is the same as Planetary instruments – Null hypothesis not rejected (p-value = 0.10)
• 2-way tests for nested models and interactions currently underway – Interactions and the order
in which we group the data may have a significant impact on analysis results
Fu,v CDF
F-st
atis
tic -
Des
tinat
ion
F-st
atis
tic –
M
issi
on C
lass
F-value

Page 35
References
• Shayle R. Searle, Linear Models for Unbalanced Data, New York: Wiley Interscience, 2006.