NASA-CR-194177 / - 7- F/,' C/7, E) · Georgia Institute of Technology Atlanta, Georgia 30332-0250...
61
NASA-CR-194177 /_- 7"-__F/,'_"t C/7, E) Report To The NATIONAL AERONAUTICS AND SPACE ADMINISTRATION - AMES RESEARCH CENTER - SEMIANNUAL STATUS REPORT #5 for GRANT NAG 2-700 SEARCH FOR EXTRATERRESTRIAL INTELLIGENCE/ HIGH RESOLUTION MICROWAVE SURVEY TEAM MEMBER Paul G. Steffes, Principal Investigator Report Period: March I, 1993 through August 31, 1993 Submitted by Professor Paul G. Steffes School of Electrical Engineering Georgia Institute of Technology Atlanta, Georgia 30332-0250 (404 894-3128) (NASA-CR-194177) SEARCH FOR EXTRATERRESTRIAL INTELLIGENCE/HIGH RESOLUTION MICROWAVE SURVEY TEAM MEMBER Semiannuel Status Report No. 5, 1 Mar. - 31 Aug. 1993 (Georgia Inst. of Tech.) 61 p G3155 N94-13086 Unclas 0185928 https://ntrs.nasa.gov/search.jsp?R=19940008613 2018-07-11T16:36:53+00:00Z
Transcript of NASA-CR-194177 / - 7- F/,' C/7, E) · Georgia Institute of Technology Atlanta, Georgia 30332-0250...

NASA-CR-194177 /_- 7"-__F/,'_"t
C/7, E)
Report
To The
NATIONAL AERONAUTICS AND SPACE ADMINISTRATION
- AMES RESEARCH CENTER -
SEMIANNUAL STATUS REPORT #5
for
GRANT NAG 2-700
SEARCH FOR EXTRATERRESTRIAL INTELLIGENCE/
HIGH RESOLUTION MICROWAVE SURVEY
TEAM MEMBER
Paul G. Steffes, Principal Investigator
Report Period: March I, 1993 through August 31, 1993
Submitted by
Professor Paul G. SteffesSchool of Electrical EngineeringGeorgia Institute of TechnologyAtlanta, Georgia 30332-0250
(404 894-3128)
(NASA-CR-194177) SEARCH FOR
EXTRATERRESTRIAL INTELLIGENCE/HIGH
RESOLUTION MICROWAVE SURVEY TEAM
MEMBER Semiannuel Status Report No.
5, 1 Mar. - 31 Aug. 1993 (GeorgiaInst. of Tech.) 61 p
G3155
N94-13086
Unclas
0185928
https://ntrs.nasa.gov/search.jsp?R=19940008613 2018-07-11T16:36:53+00:00Z

TABLE OF CONTENTS
Io
II.
III.
IV.
V.
Vl.
INTRODUCTION AND SUMMARY
DEVELOPMENT OF A DATA BASE OF SPACEBORNE TRANSMITTERS
OBSERVATIONAL STUDIES
CONCLUSION
REFERENCES
APPENDICES

1. INTRODUCTION AND SUNiARY
This semiannual status report describes activities conducted by the Principal
Investigator during the first half of this third year of the NASA High Resolution
Microwave Survey (HRMS) Investigator Working Group (IWG). As a (HRMS) Team
Member with primary interest in the Sky Survey activity, this investigator
attended IWG meetings at NASA/Ames and U.C. - Santa Cruz in April and August
1992, and has traveled independently to NRAO/KittPeak, Arizona (April Igg3) and
Woodbury, Georgia (July 1993). During the July 1993 visit to the Georgia Tech
Research Corporation/Woodbury Research Facility, an experiment was conducted to
study the effects of interference from C-band (3.7 - 4.2 GHz) geostationary
spacecraft on the Sky Survey operation in that band. At the first IWG meeting
in April of this year, results of a SETI observation conducted at the 203 GHz
positronium hyperfine resonance using the NRAO facility at Kitt Peak, AZ, were
presented, as well as updates on the development of the spaceborne RFI data bases
developed for the project. (See Appendix II and Section II.) At the second
meeting, results of the study of interference from C-band geostationary
spacecraft were presented (see Appendix Ill). Likewise, a presentation was made
at the accompanying 1993 Bioastronomy Symposium describing the SETI observation
at the positronium hyperfine resonance (Steffes and DeBoer, ]gg3a--see Appendix
I). This work has also been submitted to Icarus (see Appendix II, Steffes and
DeBoer, Igg3b) after being approved by the IWG Publications Coordinator.
In the remainder of this grant year (through February 28, 1994), we expect to
continue the development of the spaceborne RFI data base. Specifically, we
intend to release a new revision including an expanded section containing the
most up-to-date information on low earth orbiting satellites. Likewise, we will
]
assisl in planning the Summer 1994 SKy Survey deployment at the Owens Valley
Radio Observatory, so as to assure that portions of the L-Band spectrum which
will soon be occupied by the mobile satellite service will be surveyed before
they are occupied by spaceborne transmitters.
II. DEVELOPMENT OF DATA BASE OF SPACEBORNE TRANSMITTERS
We have formed a data base of all non-classified satellites, giving transmission
frequencies and orbital parameters on each. The original data was derived from
six sources:
I) World Satellite Annual and the quarterly World Satellit_ Transponder
Loadinq Reports (published by Mark Long Enterprises, Inc.). This
includes all commercial satellites.
2) The Satellit_ Situation RepQrt (published by Project Operations
Branch, NASA/GSFC). This document includes all earth orbiting
spacecraft, but has only limited information on transmitting
frequencies.
3) The Space Frequency Coordination Group (SFCG) Data Base. This
includes both earth orbiting and deep-space spacecraft.
(Owned by governments)
4) The Communication@ Center (Clarksburg, MD) data base. Includes all
governmental and non-governmental geostationary spacecraft.
5) The _nternational Satellite Directory (Design Publishers). This
overlaps (1), and because of its high cost, will not be used in
future updates.

6) OuikTrak 4.0 (Low Earth Orbiter Tracking Software - AMSAT Corp.)
Provides position, right ascension, declination, etc. for low earth
or biting spacecraft. Orbital elements are obtained electronically
from a database maintained by AFIT (Air Force Institute of
Technology).
In the past six months, additional data has been derived from the Space 2000
Database, which was purchased from Space Analysis and Research, Inc., Colorado
Springs, CO; and from a database maintained by Dr. Wesley Sizemore at NRAO/Green
Bank, WV. We have found the Space 2000 Database to be extremely useful in that
it contains transmitter frequencies for many low-earth orbiting satellites
(LEO's) not listed elsewhere.
As described in previous reports, our database management and search software
(HRS) has now been distributed to 25 users both within and external to the HRMS
Project. We expect to release an updated version of the database itself in
September 1993.
Ill. OBSERVATIONAL STUDIES
At the beginning of this year, we completed development of a 64,000 channel
spectrum analyzer which simulated behavior of the Sky Survey system over a I MHz
bandwidth. This spectrum analyzer was used in two different observation studies:
I) A SETI search of 40 solar-type stars at the 203 GHz positronium hyperfine
resonance was conducted from the NRAO-Kitt Peak, AZ facility. (A complete
description of this observation is included in Appendix II.)

2) An observational experiment was conducted using a 30-meter antenna at the
Georgia Tech Research Corporation/Woodbury Research Facility in order to
characterize the nature of interference from geostationary satellites
transmitting in the 3.7 - 4.2 GHz frequency band to the Sky Survey element
operating in that band. A complete description of, and results from this
experiment are given in Appendix Ill of this report.
IV. CONCLUSION
In the remainder of this grant year we expect to complete our latest updating to
the HRS (_RMS BFI _earch) data base and distribute it electronically to all
users. Likewise, we will use information about the upcoming launches of L-Band
satellites in the mobile satellite service (MSS) in order to help determine those
frequencies most at risk, and which should be observed in the 1994 OVRO
deployment of the Sky Survey prototype system.
V. REFERENCES
Steffes, P.G. and D.R. DeBoer, 1993a. A SETI Search of Nearby Solar-Type Stars
at the 203 GHz Positronium Hyperfine Resonance. Presented at the 1993
Bioastronomy Symposium; Progress in the Search for Extraterrestrial Life, p. 30.
Steffes, P.G. and D.R. DeBoer, 1993b. A SETI Search of Nearby Solar-Type Stars
at the 203 GHz Positronium Hyperfine Resonance. Submitted to Icarus.

APPENDIX A:
A SETI Search of Nearby Solar-TypeStars at the 203 GHz Positronlum
Hyperfine Resonance
PAUL G. STEFFES and DAVID FL DeBOER
The development of advanced millimeter-wavetechnology has made it possible to constructlow noise receivers and high power transmitterscomparable to those available at much lowerfrequencies. Thls techr_!_0gy, plus certain
physical characteristics of the millimeter-wavespectrum suggest possible advantages for useof this wavelength range for interstellarcommunications. As a result, a SEn typesearch has been conducted for narrowbandwidth signals at frequencies near thepositronium hyperfine spectral line (203.385GHz), a potential natural reference frequency. Atotal of 40 solar type stars within 18 parsecswere observed, in addition to 3 locations nearthe galactic center using the NRAO 12-rootermillimeter-wave radio telescope at ICJtl Peak,Arizona. No detections were made at thedetection threshold of 8 x 10.20 w/m2 in each oftwo linear polarizations. Future observations willbe made with a higher resolution fast Fouriertransform spectrum analyzer (FFTSA) whichshould improve sensitivity by an order ofmagnitude, and reduce required observingtime.
ABSTRACTS - Page 30 1993 Bioastronorny Symposium

APPENDIX B:
A SETI Search of Nearby Solar-Type Stars at the
203 GHz Positronium Hyperfine Resonance
Paul G. Steffes
and
David R. DeBoer
School of Electrical and Computer Engineering
Georgia Institute of TechnologyAtlanta, GA 30332-0250
Submitted to
August 1993
Manuscript: 9Tables: 1
Figures: 1
Proposedrunninghead: Millimeter Wavelength SETI Observation
Mail proofs to:
Paul G. Steffes
School of Electrical and Computer Engineering
Georgia Institute of Technology
Atlanta, GA 30332-0250
Tel: 404 894 3128
Fax: 404 853 9171
Internet: psl [email protected]

AI .,LT.g6.CI
The development of advanced millimeter-wave technology has made it possible to construct
low noise receivers and high power transmitters comparable to those available at much lower
frequencies. This technology, plus certain physical characteristics of the millimeter-wave spectrum
suggest possible advantages for use of this wavelength range for interstellar communications. As
a result, A SETI (_Search for Extraterrestrial Intelligence) type search has been conducted for
narrow bandwidth signals at frequencies near the positronium hyperfine spectral line (203.385 GHz)
a potential natural reference frequency. A total of 40 solar type stars within 23 parsecs were
observed, in addition to 3 locations near the galactic center. No detections were made at the
detection threshold of 10"19 w/m, 2 in each of two linear polarizations. Future observations will be
made with a higher resolution Fast Fourier Transform Spectrum Analyzer (FFTSA) which should
improve sensitivity by an order of magnitude, and reduce required observing time.
ii

I. INTRODUCTION
The development of advanced millimeter-wave technology has made it possible to construct
low noise receivers and high power transmitters comparable to those available at much lower
frequencies. This makes a SETI (Search for KxtraIerrestrial Intelligence) type search at mUlimeter
wavelengths desirable for a number of reasons:
1. The higher gains obtainable for a given antenna size at millimeter wavelengths result in
larger transmitted EIRP (Effective Isotropic Radiated Power), and thus increase the
detectable range. (See, for example, Steffes, 1993.)
2. The effect of the "quantum limit" or "photon noise" on receiver sensitivity is still minimal
(less than 15 K) for frequencies below 300 OHz.
3. A spectral marker exists at 203.385 OHz (the hyperfme ground state spectral line of the
lightest artificial atom, positronium). (Ref: Kardashev, 1979).
4. IntersteUar scintillation is far less pronounced at millimeter-wavelengths than at centimeter
wavelengths. (ref: Cordes and Lazio, 1991).
5. Radio Frequency interference (RFI) from earth-orbiting transmitters is far less severe than
at centimeter wavelengths.
Since no previous miUimeter-wavelength SETI searches have been reported, we conducted this
initial search at the 203.385 GHz positronium hyperfme resonance using the NRAO/Tucson 12-
meter radio telescope. This is similar to the first centimeter-wavelength SETI search conducted
some 33 years previously at NRAO/Green Bank, at frequencies near the hydrogen hyperfme
resonance (Drake, 1961). The increased gain at higher frequencies makes millimeter-wave SETI
very attractive and the existence of a spectral marker at 1.48 mm (203 (3Hz) is fortuitous. Further,
since there is a low abundance of positronium and a small transition probability, the natural line
does not contribute significantly to the sky temperature and mask any potential signal. Other

reasons for the selection of the positronium hyperfme resonance as the preferred search frequency
are detailed by Kardashev (1979).
In this paper, we give the description and results of our observations of 40 solar-type stars
and of three regions near the galactic enter, at frequencies surrounding the 203.385 GHz
positronium hyperfme resonance. While no artificial signals were detected, an upper limit on
potential signal flux density has been derived, and approaches for quicker, more sensitive searches
are presented.
II. OBSERVATIONS
Observations of 40 solar type stars and three regions near the galactic center were conducted
on April 9 and 10, 1993 at frequencies surrounding the positronium hyperfme resonance, measured
as 203.8459 + 0.0012 GHz by Egan et al. (1977). The observations were conducted with the 12-
meter-diameter NRAO millimeter-wave radio telescope located at Kitt Peak, Arizona. (The
National Radio Astronomy Observatory is operated by Associated Universities, Inc. under contract
with the National Science Foundation.) The purpose of the search was to detect spectrally compact,
coherent signals such as targeted beacons or other nearly monochromatic emissions directed toward
our solar system. Unlike SETI searches conducted at longer wavelengths (see, for example, Backus,
1993 or Klein et al., 1993) where detection of unintentional "leakage" signals may be remotely
possible, the highly directive nature of millimeter-wavelength antennas and the large, time-variable
doppler shifts introduced by planetary motion makes detection of unintentional signals highly
unlikely. Thus, the search was conducted assuming a transmission targeted toward our solar system
with high spectral stability.
2

A. Observational Approach
Since we assume that the potential transmissions are targeted, any doppler shifts due to
planetary motion at the transmitting locations are assumed to be corrected, relative to a stable
reference frame by the transmitting civilization. (Obviously, our knowledge of the motions of
planets within distant solar systems is currently non-existent.) However, there is still the question
as to which stable reference frame the transmissions would be referenced. The obvious choices
would be the frame of the transmittingstar system, the local standard of rest (LSR), or our sun
(heliocentric). We chose the third (heliocentric), based on the assumption that a civilization capable
of targeting a transmission toward our solar system would be able to estimate the radial velocity of
our star and would correct for it. While referencing to LSR was our second choice, the variability
of its definitions by other civilizations would likely add to the overall uncertainty. Even if the
transmitting civilization were to reference to our solar system, there is an inherent uncertainty in
estimates of radia; velocity, which would be reflected in the transmitted frequency. As a result, we
observed a 5 MHz-wide spectral window centered at the 203.3849 OHz positronium hyperfine
resonance, adjusted to a heliocentric rest frame (i.e., heliocentric + 3.7 km/sec).
B. Equipment Configuration
All observations were conducted with the NRAO 12-meter Cassegrain antenna. Dual,
linearly polarized SIS receivers were used, exhibiting system noise temperatures of 600 K and 1000
IL respectively. Recent realignment of the reflector surface panels resulted in an overall aperture
efficiency of over 32%, providing an effective aperture of 37 m 2 at the operating wavelength of 1.5
ram. Since the antenna beamwidth is extremely narrow (approximately 30 arcseconds), and because
none of the target stars are strong emitters at this wavelength, normal tracking techniques involving
3

signal peaking were not used. However, open-loop tracking accuracies of 10 arcseconds can be
achieved with this telescope, and a collinear optical telescope is connected to a video display in the
control room which verifies the pointing to the majority of the targets, which are visible with a
moderate optical telescope.
A block diagram of the observing system is shown in Figure 1. In order to be sensitive to
signals transmitted over interstellar distance, extremely narrow channd bandwidths are necessary.
Two types of multichannel spectrum analyzers were developed. The first was a 32,000 channel Fast
Fourier Transform Spectrum Analyzer (FF_A) which used an 8-bit analog-to-digital converter in
conjunction with a 64 k-point complex FFT computer and displayed using MATLAB software on
a 386-based personal computer. By using a Hamming window and a 2 MHz sampling rate,
individual channel resolution bandwidths of approximately 32 Hz were obtained. The total
instantaneous bandwidth was 1 MHz, and the total time to sample, compute, and display each
spectrum was approximately 45 seconds. Because of the narrow channel bandwidths involved, all
local oscillators were locked to a maser reference signal obtained from the neighboring VLBA
facility so as to maintain frequency stabilities of 10"12 or better. The second spectrum analyzer used
was a Tektronix 2710 digital storage spectrum analyzer, which analyzed the same 1 H-Iz - 1.001 MHz
range as the FFTSA. Nine spectra were averaged, each with a resolution bandwidth of 3 kHz, and
a video bandwidth of 30 Hz. The resulting averaged 1 MHz-wide spectrum hand an equivalent
noise bandwidth of 100 Hz in each spectral bin, and took approximately 100 seconds to measure,
average, and display. Since both systems analyzed only a 1 MHz-wide spectrum, the receiver local
oscillator was stepped so as to allow taking of 5 individual 1 MHz-wide spectra, giving a total
bandwidth of 5 MHz. The entire process was repeated for the orthologonal polarization, as well.
The local oscillator system also provided doppler corrections for earth motion relative to the
heliocentric reference frame.
4

Unfortunately, the FFTSA (which was the more sensitive and more rapid of the two
systems) was irreparably damaged by the carrier responsible for transporting it to NRAO/Tuscon.
As a result, aU measurements were conducted with the slower, less sensitive conventional spectrum
analyzer. The detection threshold for this system was calculated from the relation
Fmi n = kTB (C/N)min/Aef f (1)
where Fmi n is the minimum detectable flux density (w/m2), k is Boltzman's constant (1.38 x 10⁻²³
J/K), T is the system noise temperatur e, B is equivalent noise bandwidth (Hz), (C/N)min is the
minimum carrier-to-noise ratio required so as not to produce an excessive false alarm rate (we
chose 5dB for our observation), and Aef r is the effective area of the receiving antenna. For our
observations, the resulting minimum detectable flux density was 10 "19 w/m 2.
C. Targets
A total of forty stars were observed, in addition to three locations near the galactic center.
The forty stars were selected from a list of solar-type stars (F6 through K7 dwarfs, luminosity class
5) within 23 pc of the earth, which was provided by D. Latham and G. Torres (private
communication). These stars are listed in Table I, together with information on position, distance,
radial velocity, spectral type, and the elevation above the horizon when the observation of that star
commenced. ( A typical observation lasted approximately 25 minutes.)
In addition to observations of the target stars, observations of 3 rites at and near the galactic
center from where 5113PkeV emission had been detected were made (See for example, Leahy,
1991; or Ligenfelter and Ramaty, 1989). Note that 511keV corresponds to the electron-positron
annihilation energy.) Because of the short lifetime of positronium (approximately 10 nsec), the
broadening of any natural positronium hyperf'me emission would be substantial (at least 100 MHz).
5
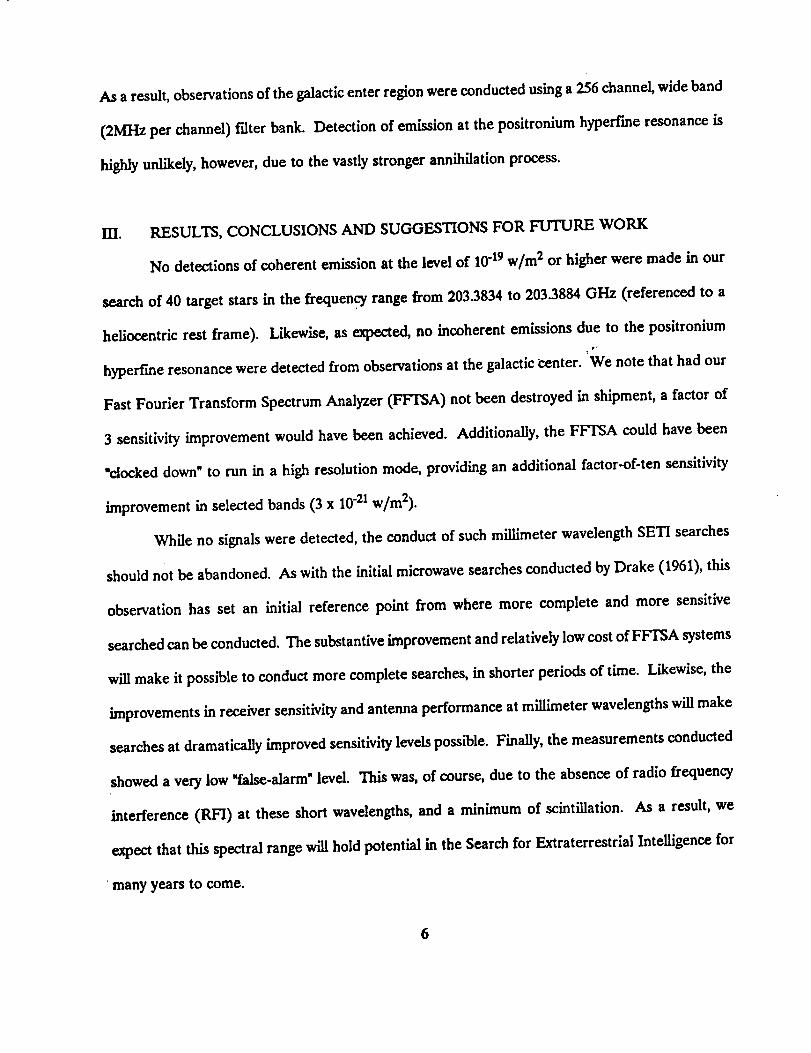
As a result, observations of the galactic enter region were conducted using a 256 channel, wide band
(2MHz per channel) filter bank. Detection of emission at the positronium hyperfme resonance is
highly unlikely, however, due to the vastly stronger annihUation process.
HI. RESULTS, CONCLUSIONS AND SUGGESTIONS FOR FUTURE WORK
No detections of coherent emission at the level of 10"19 w/m 2 or higher were made in our
search of 40 target stars in the frequency range from 203.3834 to 203.3884 OHz (referenced to a
heliocentric rest frame). Likewise, as expected, no incoherent emissions due to the positronium
hyperfme resonance were detected from observations at the galactic center. 'We note that had our
Fast Fourier Transform Spectrum Analyzer (FFTSA) not been destroyed in shipment, a factor of
3 sensitivity improvement would have been achieved. Additionally, the FFTSA could have been
=docked down" to run in a high resolution mode, providing an additional factor-of-ten sensitivity
improvement in selected bands (3 x 10"21 w/m2).
WhUe no signals were detected, the conduct of such millimeter wavelength SETI searches
should not be abandoned. As with the initial microwave searches conducted by Drake (1961), this
observation has set an initial reference point from where more complete and more sensitive
searched can be conducted. The substantive improvement and relatively low cost of FFTSA systems
will make it poss_le to conduct more complete searches, in shorter periods of time. Likewise, the
improvements in receiver sensitivity and antenna performance at millimeter wavelengths will make
searches at dramatically improved sensitivity levels possible. Finally, the measurements conducted
showed a very low "false-alarm" level. This was, of course, due to the absence of radio frequency
interference (RFI) at these short wavelengths, and a minimum of scintillation. As a result, we
expect that this spectral range will hold potential in the Search for Extraterrestrial Intelligence for
many years to come.

ACKNOWLEDGEMENTS
The authors are deeply grateful to Dr. W. Whitfield Smith, Mr. David Lasbaey, and Mr.
Richard Tatem of Georgia Institute of Technology for their assistance in the preparation and
conduct of this observation. We are also extremely grateful to the staff and operators at
NRAO/Tuscon-Kitt Peak, Arizona for their tireless help, especially Drs. Robert Freund and Philip
Jewell whose efforts in bringing some level of functionality back to our damaged equipment were
truly heroic. The National Radio Astronomy Observatory is operated by Associated Universities,
Inc., under contract with the National Science Foundation. Support for this work was received from
the High Resolution Microwave Survey (HRMS) Project of the National Aeronautics and space
Administration under Grant NAG2-700 from NASA Ames Research Center.
7
REFERENCE_
Backus, P.R., 1993. The NASA-SETI Microwave Observing Project Targeted Search. ThirdDecennial US - USSR Conference on SETI--A.S.P. Conference Series 47. 323-33.
Cordes, J.M., and T.L Lazio, 1991. Interstellar scintillations and SETI. Astrophysical Journal
376. 123-135.
Drake, F.D., 1961. Project Ozma. Physics Today 1.4, 40-46.
Egan, P.O., V.W. Hughes, and M.H. Yam, 1977. precisiondetermination of the fine structureinterval in the ground states of positr0nium. IV. Measurement of positronium fine structure
density shifts in noble gases. Physical Review A 15. 251-260.
Kardashev, N.S., 1979. Optimal wavelength region for communication with extraterrestrial
intelligence: ¥ = 1.5 ram. _ 278, 28.
Klein, M3., D.J. Burns, C. Foster, M.F. Garyantes, S. Gulkis, S. Levin, E.T. Olsen, H.C. Wilck, andG. Zimmerman, 1993. The NASA SET[ Microwave observing Project Sky Survey.
USA-USSR Conference on SET[--A.S.P. Conference Series 47. 335-347.
Leahy, D.A., 1991. Discovery of a non-thermal radio source associated with the galactic center 511keV annihilation-line source. Monthly Notices of the Royal Astronomical Socie_ _ 22.
Ligenfelter, R.E. and R. Ramaty, 1989. The nature of the annihilation radiation and gamma raycontinuum from the galactic center region. ,Astrophysical Journal 343. 686-695.
Steffes, P.G., 1993. The potential for millimeter-wave SET[. Third Decennial USA-USSR
Conference on SET[--A.S.P, Conference Series _ 367-371.
8

Tabte I: Observ•tion tist of sot•r-type •tars from miLLimeter-save search.
Nm
GL 34 AGL 34 SGL 71GL 124GL 135GL 160GL 177GL 17'8GL 188GL 197
IGL198IOL 202IGL 245IGL 262IGL 302IGL568IGL387 A
GL 392 AGL 43/,
JGL 451A
GL 475GL 484
IGL502IGL 504IGL 547IGL 549 AIGLS64IGL 566 AIGL 560 8IGL 598IGL 602IGL 611AIGL 616
632IGL
GL 651GL 672GL 779
IGL788IGL882
IRA (1950) Dec Distance Red|at Vet,city J Spectra[ Etevetton At Start
(pc) (k_•ec) i Type of Observ•tionI
OOh 46m 03s +57" 33.1'OOh 46mO3s *57" 33.1'01h 41m 45s -16 ° 12.0'03h 05m 275 +49 ° 25.4'03h 16m 30• -03" 01.4'04h 02m 225 +21" 52.5'04h 45m21s -17" 01.5'04h 47mO7s *06" 52.5'05h 04m30• "18" 34.8'05h 15m 37• +40 ° 03.4'05h 16m37• -18 ° 10.9'05h 21a 30• .17 ° 20.3'06h 43m085 +43" 37.8'07h OOm20• *290 25.4'08h 16m015 -12" 27.7'09h 45m 225 +46 ° 15.3'1Oh 1L_a30s *23 ° 21.5'1Oh 2L_n595 +49 ° 03.2'11h 38m25s *34" 29.0'11h 50m06s +38° 04.7'12h 31m 22s +41 ° 37.7'12h 42m 38s +39 ° 33.0'13h 09m325 +28 ° 07.9'13h 14m 18s +09 ° 41.1'14h 20m425 +01" 28.5'14h 23m30s +52 ° 04.9'14h 48m025 *24 ° 07.0'14h 49mO5s ÷19 ° 18.4'14h 4Shu05• ,19 ° 18.4'15h 4_nO1s +070 30.5'15h 50m 57• +42 ° 35.4'16h 03m 13• *390 17.4'16h 12m 54s -08° 14.3'16h 3/_,285 *79" 53.7'16h 50m275 *00" 04.5'17h 01m 12s +47 ° 08.4'17h 1Bm 47s *32 ° 31.9'20h 01m 51• +16 ° 56.0'20h 17m025 +66° 41.6'22h 55m OOs *20 ° 30.0'
5.945.943.50
10.8215.5817.3912.67
7.5117.0114.3915.7015.3415.1017.0612.6113.2816.4519.27
8.628.628.72
15.758.35
13.4817.2714.2814.35
6.716.71
11.9217.3912.4815.3622.3216.5316.1813.5716.6113.7217.12
* 8.2+ 10.5- 17.0* 49.5* 22.5* 23.9+ 21.7+ 24.4+ 20.6+ 60.5+ 40.3+38.1- 23.9* 25.4+ 30.5+ 5.0+ 37.5
6.85.9
-99.1+ 6.6* 80.7+ 5.1- 27.4- 18.9- 11.4
2.7+ 2.2* 3.1- 68.5- 56.4- 60.0* 12.0- 16.9+ 45.4- 47.3- 79.1+ 4.8
4.6- 33.7
G3VK7 VG8 VpGOVG1.5 VG5 VG1 VF6 VG4VG2 IV-VGOVF8 VeGOVG4VG7.5 VG0.5 V•F8 VbuF9 V68 Ve68 VIGO VGO VGO VGO VG1 VF7 VG2V68 Ve1(4 VeGO VF9 VGSV61 Vde3r.,SVGSV62 VG1 VGSVG4V
50.4" r50.4" r40.6 ° r67.3" r54.5 ° r70.7" r39.3" •64.9" •
76.2" r69.5" •28.3" •53.7" •62.7" •
53.8" •45.8" •42.3" •
42.8 ° •39.1 ° •63.3" •76.2 ° r61.5" •52.3 ° •56.0 ° •48.4" •44.1" •55.7" r50.2" r60.5° r60.5 ° r54.0 ° r73.9* r43.9" •
37.7* r40.9" r37.6" •44.9* •71.3 ° r37.1 ° •48.70 s78.5" r
elevation: "r" refers to a rising object uh{te "s" refers to • setting object.

FIGURE CAPTION
Figure 1: Block diagram of system used for 203 GI-Iz search for narrowband signals.

_t
QJC_
_J
c_
w_G_
QJ
vg.. I
q_
-r.ir.T.,
APPENDIX C:
Impact of Satellite Radio Frequency Interference (RFI) onthe High Resolution Microwave Survey (HRMS) Sky Survey
at C-band Frequencies
Richard B. TatemPaul G. Steffes
School of Electrical Engineering
Georgia Institute of Technology
Atlanta, GA 30332-0250
Submitted to
August 16, 1993
Impact of Satellite Radio Frequency Interference (RFI) on the HighResolution Microwave Survey (HRMS) Sky Survey at C-band Frequencies
ABSTRACT:
This paper describes an experiment to determine the level of interference from domesticgeostationary satellites transmitting at C-band (3.7 - 4.2 GHz) frequencies. Specifically,we discuss the use of a High Resolution Fast Fourier Transform Spectrum Analyzer
(HRSA) to obtain exceptional sensitivity in conjunction with an antenna aperture of 30meters in order to study the impact of sidelobe interference on an HRMS search. Theresults of this experiment, and implications for future searches in the C-band range are
also presented.
I. INTRODUCTION
The growth in satellite communication technology has fueled the entry of new satellite service
companies, adding congestion to what is already an overcrowded C-band downlink spectrum
(3.7 - 4.2 GHz). With recent adjustments to the orbital spacing of geostationary satellites, theconcern about effects of RFI upon the HRMS Sky Survey observation at C-band is significant.
As of April 2, 1993, the number of active geostationary satellites transmitting at C-band wasbelieved to be about 150. As a result, any attempt to conduct a high resolution survey for a
narrow band signal source originating beyond the geostationary arc would be most challenging.To this end, this paper will describe just such an experiment to observe the interference of a
typical C-band commercial satellite, Telstar-302. The goal was to observe the signal level ofa c.amer as a function of antenna elevation. The authors found that even with the antenna
pointed approximately 23.3 ° above the geostationary arc, the received carrier level wasapproximately 15 dB above the noise floor at a spectral resolution of 32 Hz in a totalinstantaneous bandwidth of I MHz.
II. OBSERVATION
The observation of Telstar-302 as the RFI source was conducted on July 17, 1993 at the Georgia
Tech Woodbury Research Facility located in Woodbury, Georgia. The observation facilityconsists of two 30 meter diameter Cassegrain antennas equipped with C-band feeds and an
accompanying 14,000 square foot building. Originally built by Aeronutronic Ford Corporationfor AT&T in 1976, the antennas are currently being refurbished under the direction of Dr. W.Whitfield Smith of Georgia Tech's School of Electrical and Computer Engineering.
The purpose of the experiment was to Observe the spectral energy level of a typical C-band satellite as the ground station receiving antenna was moved in elevation off the main beamof the satellite while holding the azimuth fixed. With the use of a high resolution spectrum
analyzer, comparable to that used in the HRMS sky survey element, the received signal strengthof a specific satellite carrier could be observed hundreds of beamwidths away from direct
pointing toward the source.

A. EQUIPMY_.aNT CONFIGURATION
The observation of Telstar-302 was conducted at the Georgia Tech Woodbury Research
Facility using the southernmost 30 meter Cassegrain antenna. Dual, orthogonal linearlypolarized receive signals arc separated by an Orthomode Transducer (OMT) which directs eachpolarization to orthogonal ports with an inherent isolation of 40 dB between ports. Thehorizontal polarization feed was attached to a 45 °K noise temperature low noise amplifier (LNA)
providing 55 dB of gain. Based on original technical specifications of the AT&T 30 meterantenna, an elevation half power beam width of 0.145 ° at 4.1995 GHz is given for theWoodbury, GA site. This implies an aperture illumination efficiency of 91.8%. The elevationantenna pattern for the Woodbury antenna is attached in Appendix D of this report.
A block diagram of the observation system is shown in Fig 1. In order to be sensitive
to signals transmitted over interstellar distances, extremely narrow channel bandwidths arenecessary. To satisfy this criterion, a high resolution spectrum analyzer (HRSA) was developed.It is a 32,000 channel Fast Fourier Transform Spectrum Analyzer which uses an 8-bit analog
to digital (A/D) converter in conjunction with a 64K point complex FFT computed and displayed
using MA_ software on a 486-DX 66 MHz personal computer. By using a Hammingwindow and a 2 MHz sampling rate, individual channel resolution bandwidths of approximately32 Hz were observed. The total instantaneous bandwidth was 1 MHz, and the total time to
sample, compute, and display each spectrum was approximately 30 seconds.To process the received C-band signals, a Har_ 6522 receiver was used to allow
selection of a desired transponder, and to downconvert the RF input to a 70 MHz IF output
signal. A second downconverter was built to downconvert this 70 MHz signal to baseband forinput to the 8-bit A/D card. The instantaneous bandwidth of the downconverter is 1 MHz wideand by adjusting the local oscillator (LO), a desired transponder signal could be shifted to fallwithin the passband response of the HRSA. Note that both downconverters used synthesizer-based local oscillators to maintain the necessary stability.
B. OBSERVATIONAL APPROACH
The observational approach consisted of two parts: (i) Acquisition of Telstar-302 at the computed
look angles of 51.7 ° elevation, 180.85 ° azimuth referenced from Woodbury, GA, and thenpeaking the received signal level by slight adjustments in azimuth and elevation while monitoringan HI' 8558-B spectrum analyzer, (ii) establishing a reference mark for the peak signal with
respect to the elevation and monitoring signal levels from a specific transponder on Telstar-302as a function of antenna offset in elevation above the reference mark.
To acquire Telstar-302, the look angles were first computed and then the antenna was
positioned accordingly. To ensure that the correct satellite was found, the latest publication ofthe nWorld Satellite Transponder Report n was consulted in conjunction with a color television
to visually confirm correct antenna positioning. Given the large antenna aperture andconstruction design, the computed beam width was found to be 0.15 ° at 4.0 GHz. Hence it
required several iterations in adjusting both azimuth and elevation until the main lobe was
acquired.To begin observation, an active transponder (channel) was selected using the Harris 6522
2

C-bandreceiver, which provided a single sharp carrier using the full transponder power. Just
such a channel was found on Transponder 18 which remained active throughout our observation
period. Spectra of the main lobe signal were taken using the HRSA. Subsequently the 1st, 2nd,and 3rd side lobes were observed on the HRSA. The observations sequence then consisted of
moving the antenna's main lobe away from the satellite to selected positions (offsets above theelevation reference mark), until finally the stow position of 75 ° was reached. The construction
of the 30 meter dish does not allow for an elevation above 85 °. For Telstar-302, an elevation
of 75 ° corresponds to an offset of 23.3 ° above the geostationary arc, approximately 155 beamwidths away. At this position, the tIRSA observed a signal strength approximately 15 dB abovethe receiver noise floor at a spectral resolution of 32 Hz in a total instantaneous bandwidth of1 MHz. It should be mentioned that this signal level may not have been the peak signal strength
of the corresponding sidelobe since no effort was made to move the antenna beyond the stowposition to observe the corresponding local maximum. Once the series of observations weremade, the antenna was repositioned back on the main satellite lobe to verify that the signal was
still being transmitted at the same power level and modulation rate. ,,
IIl. RF_ULTS
The observation of Telstar-302 plainly shows the substantial likelihood of RFI to be
encountered at C-band frequencies (3.7 - 4.2 GI-Iz) for an HRMS sky survey. Included with this
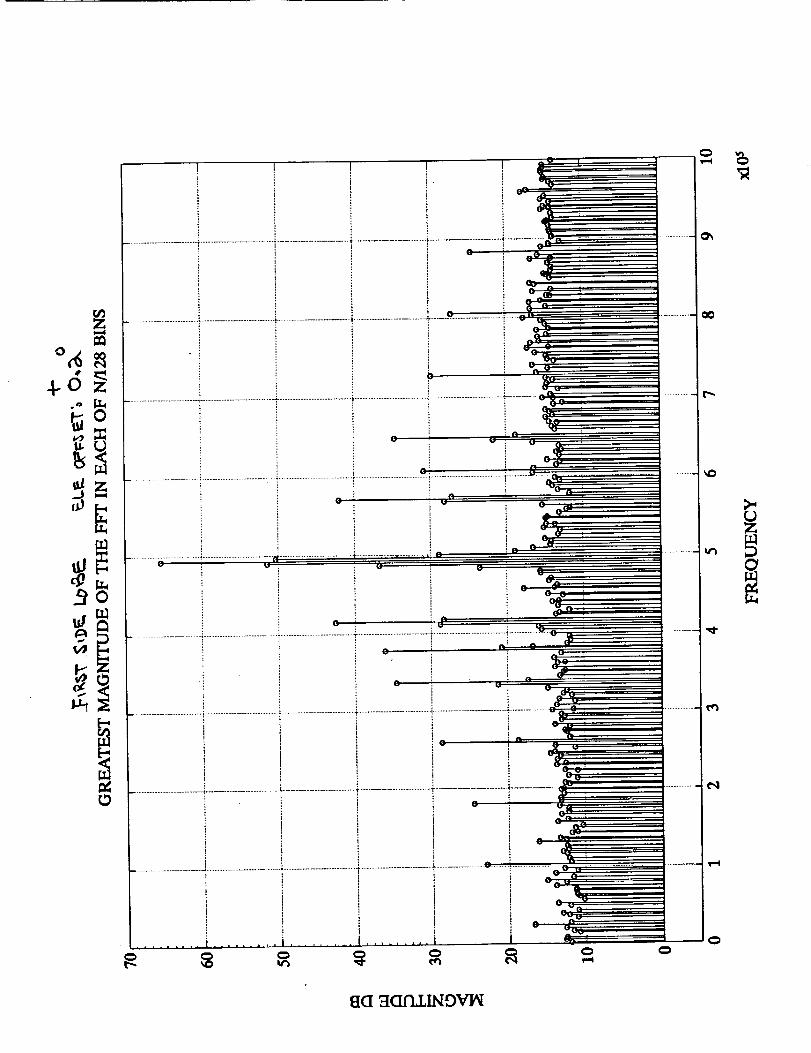
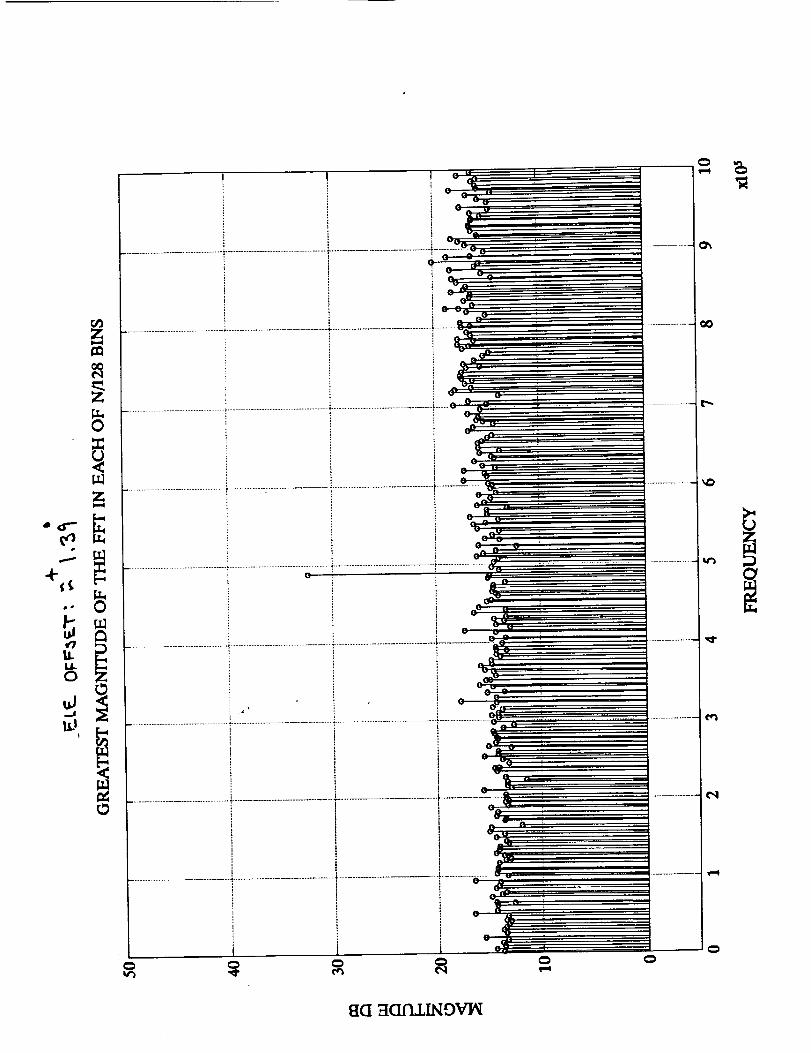
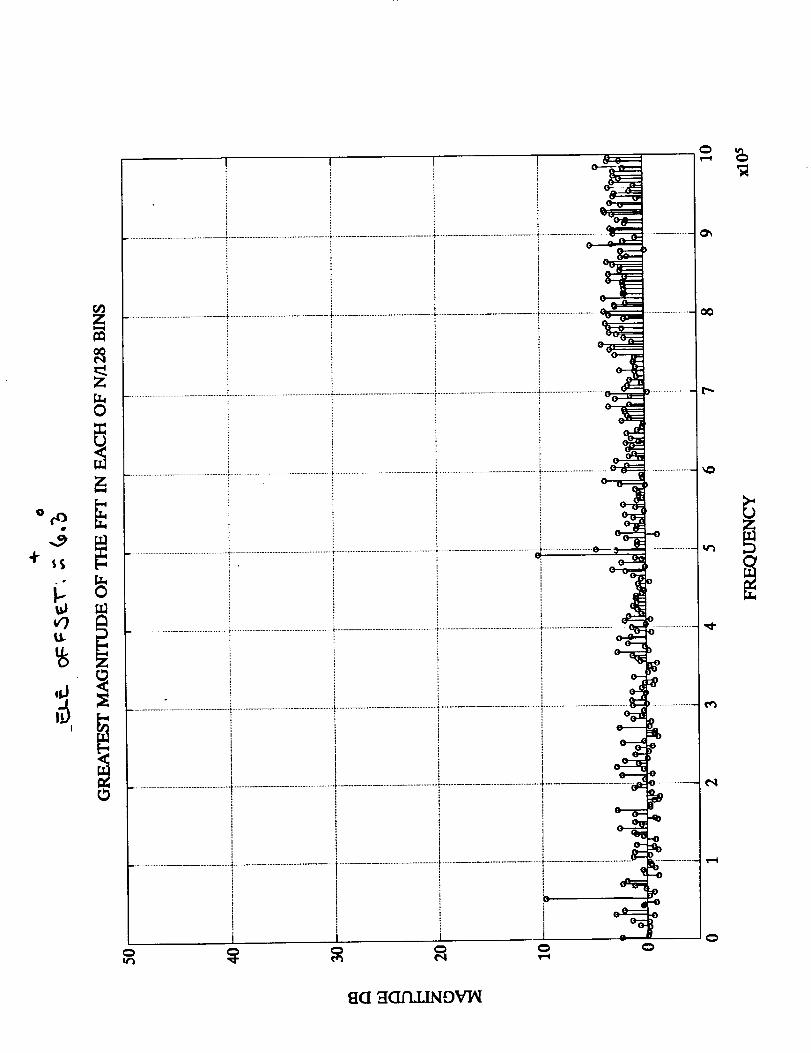
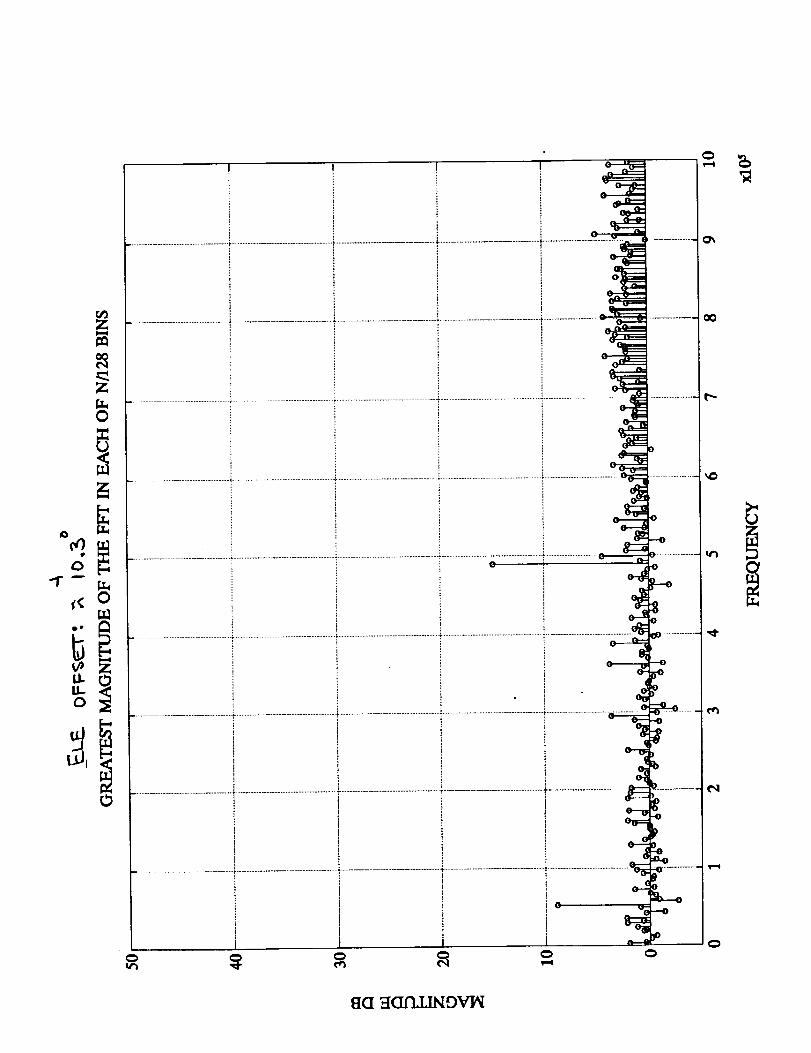
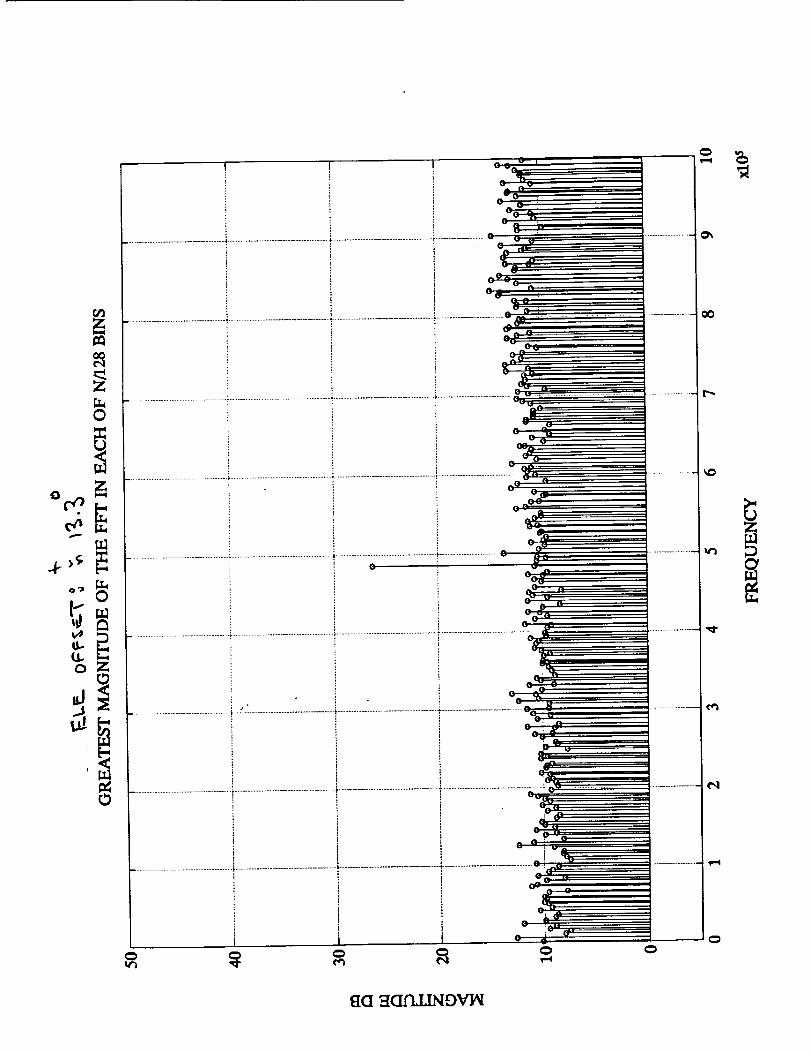
report are the spectral plots made during the observation (see Appendix A). A series of 13 plots
illustrating the peak spectral intensity levels over the 1 MHz window is provided as a functionof antenna elevation offset. The "lollypop n plots consist of plotting the maximum frequency
value per bin, where a bin size of 128 points was chosen thus providing 256 maximum signal
points (bins) per plot. Due to the enormous gain and low noise of our receiving system, it wascalculated that a carrier to noise ratio (C/N) of 88.0 dB would be achieved at the input to the
C-band receiver/downconverter. Hence the Harris 6522 receiver was highly saturated when the
main receive lobe was pointed directly at the satellite. In fact the manufacturer's specificationfor maximum RF input power is -60.0 dBW for the Harris receiver. However when the antenna
was pointed directly at Telstar-302, a received power of -44.0 dBW was achieved. For the firstsidelobe, a received signal strength of -66.0 dBW was achieved which despite beingapproximately 20 dB down still nearly manages to saturate the C-band receiver.
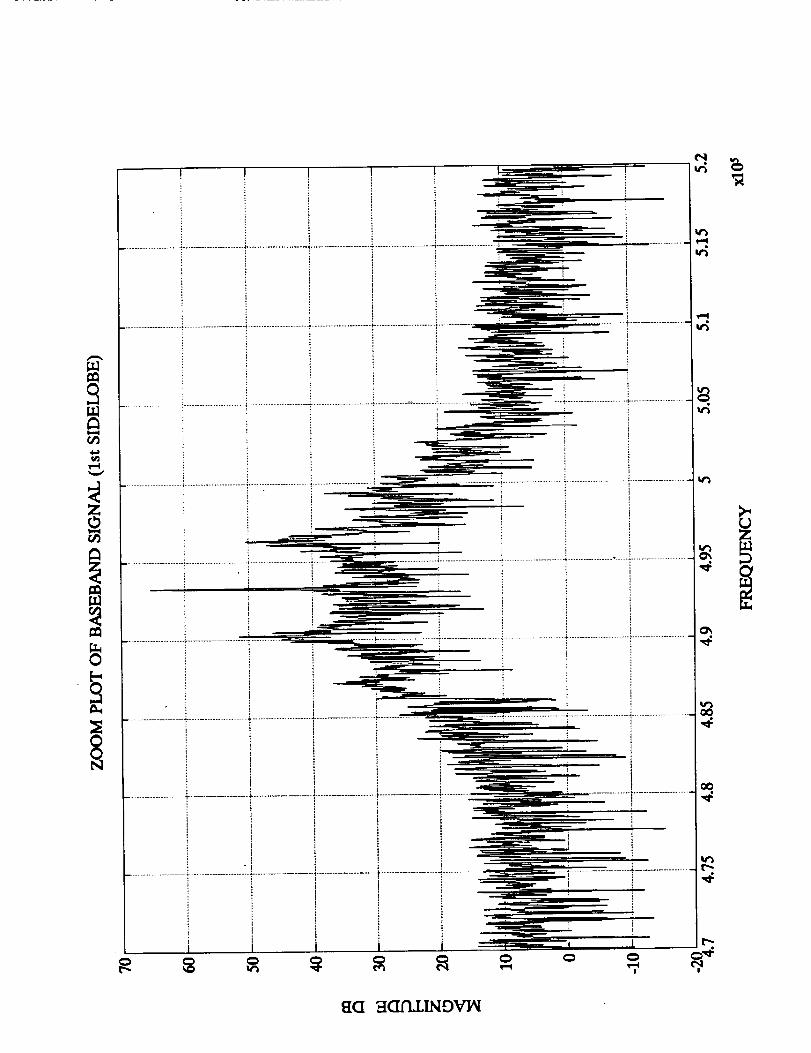
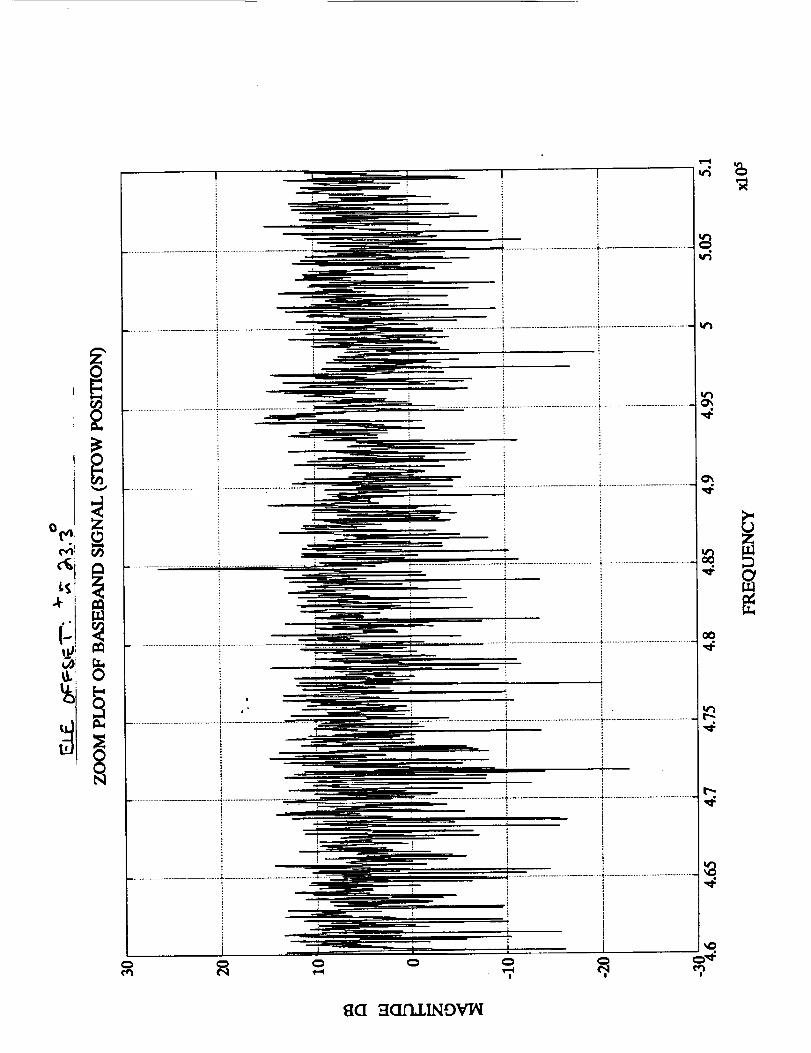
In addition to the maximum intensity plots, several full band spectral plots were made
to illustrate the signal spectra that was used to characterize this experiment. Specifically, full
spectra plots occurring at the main lobe, 1st side lobe, 2nd side lobe, and antenna stow position(23.3 ° away) are provided in Appendix B. Finally, a summary bar graph illustrating receivedsignal level vs. elevation offset is included in Appendix C illustrating the relative signal strengthsat offsets ranging from several beam widths out to approximately 155 beam widths away.
During the observation of Telstar-302, as the antenna offset reached approximately 7.0 °above the geostationary arc, a second in-band signal was detected which was believed to befrom an adjacent geostationary satellite. The signal strength of this new signal was observed torise and fall as the antenna swept through the peaks and nulls of this signal. Hence the
possibility of RFI from other geostationary sateMtes is highly likely since the distance to Telstar-302 or it's neighbors at this antenna offset is about the same.
3

During the observationof Telstar-302,as the antenna feed system was increased ininclination, an out of band oscillation was generated by our LNA due to an unterminated smaconnector on the feed waveguide used to couple in a noise source. This oscillation wasoccurring at approximately 30 MH.z away from the center frequency of 4060 MHz correspondingto channel 18 of the Harris receiver. The net result was that this artificially lowered the noise
floor on several of our observation points until the problem was rectified. There was no effect
on the characteristics of the in-band signal we were monitoring, hence this did not effect the
integrity of the experiment.Upon completion of the observation, a measurement of antenna noise temperature was
made by observing the change in the system noise floor as a mechanical waveguide switch wasused to toggle the antenna feed between a known 3000K noise source and the antenna. Takinginto account the insertion loss of the waveguide switch as well as other salient losses andcomponent noise temperatures, an antenna noise temperature of 37.9°K was obtained. Thiscorresponds to a system noise temperature of approximately 85.0"K for the horizontalpolarization feed used for this observation.
IV. CONCLUSION
By using a high resolution spectrum analyzer in conjunction with the Georgia TechWoodbury Research Facility, we have shown that substantial RFI would be received by the
HRMS Sky Survey System at C-band frequencies, almost regardless of antenna pointing. Thissuggests that resources would be better devoted to efforts not involving a search at C-band (3.7- 4.2 GHz) until less contaminated spectrum regions have first been explored.
Future activities may include several similar observation scenarios involving otherdomestic C-band satellites over a wider range of elevation offsets. With the successfuldevelopment of the HRSA running on a 486-based PC, the observations of several geostationarysatellites could be made in one or two days with instantaneous feedback of results. It is believed
that by the end of 1993, full motion tracking capability will exist at the Woodbury site enablingfull radio astronomy capability.
4

REFERENCES
1. M. Long, "World Satellite Transponder Report n, Mark Long Enterprises, Inc. Vol.4 No. 2, pp. 56-57, May, 1993.

T
N
_P i®il

APPENDIX A
Peak Intensity Spectral PlotsVS.
Antenna Elevation Offset

+o
L_
$
o
v , u
_Ri o 9 '0
-"_.-.---D_:==
o i 0u _ Uo_
o-m
o o i i,.,a _ io o i
° i " _,,,.
O0
!
1
c
o
o
C ,_._)
u
%
_0 'v"
cc_
................... _...................................................... 0_. ........................ _ .... . .............
I _c:-. ,t ,. 0 v
,e,,,¢
r,_
°_
.o
"R
oO
C'-
_D
,q.


zO
o o
6
apl _
LU_
r_
_tQ _[QII.LIN£)VIN
i ! _ ;
i i _-- i
i i ! _ :
T 8_ _.
T ..... i "_ "
,._ i i i ___.
1#./ ..........................................................._...........................................................'_........................................................! ................ c_ . ....................
_"' i i J!o i ....<
...................................................T............. i %_-i i "" n
i i i _-
_ i L_I _

cr_
_z
U.D
uJ
L_
•

EI .':I(II_INE)VI,_
O
°_. _
i i i
! .
i J I0
fG _ICIIILINgVIAI

r_
i o--
t1
C_iml
0
_D
t"..
W_
q,,a"
v-,4
C_
B(I _(II-II_OVI_I
zO
"i!
T
iO
0
O0
',0
v...q
C_
_CI _CIn,LINOVT,_
I I
B(I _g.Q_INOV_I

i°
BQ _(:T.C)XTN.D'V]_

0
-_._
"II
0
ii
ii
i
_ICI _IQIIIINDVI_I

APPENDIX B
Fullband Spectral Plots of Main Lobe, 1st Side Lobe2nd Side Lobe, and Antenna Stow Position

o _g oi
...... i.............................. ,...............................
.................................. i.................................
O_
aO
>,0Z
HQ _IGS_INDVI_

! i r' i !
i-- i
............ i ...................................................................... 4................................ _.............................. 1................. i ' ......................... i ...........
! i ' I ,i , '
! i --'_ ' i i
i i__
i
t',.
........................................................................_.................................... ............................. . .........................,...................................,,..................................._................................
i ', !
i
' i
i ...... i
i : '................................i' ""_ l _ "r......................._.............................................................................,............................_................................_............................ " . • _ _
: i _ i i
l i i i

fig _ICI/_INgVIAI
0
• !
]
[
]
, i
I
, ilF .
|
r,-
I

I
oO
flO _Of'kI.li_IOVl_

i
I
II
aO
r-:.

o_
g_
w _
l
I i --
i irll ----
• , i
i

APPENDIX C
Relative RFI Signal Strength Summary Plots
This appendix summarizes the observed stgnal strengths as a functton ofantenna elevation offset. The peak s|gnal values tn dB were obtatned from the
13 spectra plots found tn Appendix A. For the matn lobe, the observed stgnalstrength appears to be only about 4 dB greater than the first side lobe. Weexpected amatn lobe stgnal strength approximately 16 dB stronger. Thisdisparity ts due to saturation of the Harris 6522 receiver by approximately ]6dB above manufacturer's specification for maximum RF tnput power.
T-

Signal Strength vs Elevation OffsetWoodbury, GA 30 Meter Antenna
54.00_
m 48.00
_,_oo__oo_
_o.ooI . ,24.oo_ I . I !
18.001
12.00 i
6.00_0.001
1.611.81
2 4.4 7.91 11.91 18.913 5.91 10.66 14.91 24.91
Elevation Offset Above 50.09 Degrees

Total Signal Power vs Elevation OffsetWoodbury, GA 30 Meter Antenna
74.00_D"ID
t,.
° 68.0013.
O
.__
N
t
O
O
_- 56.00
50.OC0.00 3.00 6.00 9.00 12.00 15.00 18.00
I;'levafion Offset Above 50.09 Degrees
21.00 24.00
APPENDIX D
Georgia Tech 30 Meter Observation FacilityAntenna Beam Patterns

+
rL
-4-
L_
_i _ '._all
3
a --
L.
_.=
12
i
2i
11
;i
I,i
+
+1ti
+
1
i
iJ-
)
_z
ix
1

i1
I,
J
J
"rUZ
a,,.JIt
o
x
.t
L!
1
ii
-'r--
:!
r i
i'
L_:j,
,!
'i:
.-,,.
L_i,
L
-H-
ii
APPENDIX E
Commercial Smnmary Sheet of Telstar-302 Specifications

ITU Region 2
Telstar 302 [U.S.--A T&I"], 85 Degrees West
AT&T Communications is the owner and operator of• satellite system designed to complement AT&T's
extensive network of terrestrial communications facilities. On August 30,1984, Tebutr 302 was launched
into space by the NASA space shuttle Discovery. The satellite transmits voice, data, audio, and TV services
,o u.s.. ........Telstar 301, 3432,and 303 transmit AT&T s Skynet family ot ousmess serwces, wmcn includes Skynet
1.5, • data transmission service ope.r.ating at 1.5.me.gabits per second 0rib/s); Skynet Television and Skynetaudio broadcast services for television and radio stgnals; and Skynet Transponder Service, • program that
allows customers to lease transponders on • part- or full-time basis. Major Skynet customers includebroadcasters such as the ABC and CBS television networks, Mcadowlands Communications, Inc., Keystone
Communications, and Hughes Television Network.AT&T's Telstar 3 series of satellites were built by the Hughes Aircraft Corp. of El Segundo, California.
These satellites conform to specifications developed by AT&T Bell Laboratories.
Tdsmr 302 at a Glance
Operational HistoryPresent Orbital Assignment:Launch Date:Launch Vehicle:
Status:
Design Life:
85 degrees West Longitude
August 30, 1984
NASA space shuttleAmerican domestic satellite with AT&T
telephony, data, and video services
10 years
Communications Payload
Frequency Band(s):
Chsnnds
Signal Power (EIRP):
Antenna Coverage:
SSPA & TWTA Power.
Cop ty:
Receive: 5.9_.425 Gl-Iz
Transmit: 3.700-4.200 OHz
12 with horizontal polarization
12 with vertical polarization
CONUS: 34 dBWAlaska, Hawaii, or Puerto Rico spot beams: 34 dBW
CONUS; Plash spot, Hawaii spot or Puerto Rico spot;or CONUS combined with one of three spot beams.8.5 watt SSPAs or 8.5 watt TWTAs
21,600 simultaneous long-distance telephone calls
SpacecraftSatellite Type: Hughes HS 376 _in-t_abilizedInitial On-Station Weight: 653kg (1,438 lbs)
Maximum (deployed) Dimensions: 6.8 (22 P,, 3 in) in height2.2m (Tft, 2in) in diameter
Electrical Power: 670 watts at end of life
490 The World S4ttelllte Almanac

TELSTAR 302
Degrees East: -275.0 Degrees West: 45
16
6
TELSTAR 3O2
Degrees East: -275.0 Degrees West: -85
C)WNER/OPERATOR: AT&T _'YNET 8ATELUTE OOMMUNICATIONS
PRESENT STATUS:-. ............................. ..... .......................... ... ................ OPERATIONALTYPE OF SERVICE :-. ................................................................................................ FBSTYPICAL USES:-. ...................................................... --.. ........... TELEPHONE, DATA. TVGEOGRAPHIC COVERAGE:-. .............. ................................................................ USALAUNCH DATE:. ................................................................................ 81 AUG. 1984LAUNCH VEHICLE:-. ....................... . ........................................ . ...... _JTTLE DISCOVERYLAUNCH WEIGHT:-. ...................... ................................................................. 1440 I.BSTYPE OF SATELLITE:- ................................................................................... HS 376PRIME CONTRACTORS:-. ................................................................ HUGHES NRCRAFTDESIGN UFETIME:-. .................. ....oo... ........................................................... 10 YEARSIrrABILIZATION :.. ..................... ....... ......................................................................... 8PINDIMENSIONS:.. ....................................... . ................. . ................... 22 FT HEIGHT. ?FT DIAMETERBANDWIDTH:.. ....... _ .......... .... ............. .... ............................................................................... 34 dBWNO. OF • C SAND:.. .................................. ..................................................................... 24 _ BACKUPNO. OF. K BAND:-. ................................................................................................................... NONENO. OF. OTHER:-. ........................................................................................................................... NONE
EOUENCY BAND:.. .................................... ., ........ ....RECEIVE (5.925.6.425) TRANSMIT (3.74.2) GHz• MAIN SEAM:.. ..................................................... ...................................... 84 dBW - _6 dBW
TWTA POWER:-. ................. ..... ............................................................. ,............................... 8.5 WATTSELECTRIC POWER:.. ...................................................................... ............................... 670 WATT EOL