NASA Ares I Launch Vehicle First Stage Roll Control System ... · American Institute of Aeronautics...
30
American Institute of Aeronautics and Astronautics 1 NASA Ares I Launch Vehicle First Stage Roll Control System Cold Flow Development Test Program Overview Adam Butt 1 , Christopher G. Popp 2 , and Kimberly A. Holt 3 NASA George C. Marshall Space Flight Center, Huntsville, AL, 35812 and Hank M. Pitts 4 Qualis Corporation, ESTS Group, Huntsville, AL, 35812 The Ares I launch vehicle is the selected design, chosen to return humans to the moon, Mars, and beyond. It is configured in two inline stages: the First Stage is a Space Shuttle derived five-segment Solid Rocket Booster and the Upper Stage is powered by a Saturn V derived J-2X engine. During launch, roll control for the First Stage (FS) is handled by a dedicated Roll Control System (RoCS) located on the connecting Interstage. That system will provide the Ares I with the ability to counteract induced roll torque while any induced yaw or pitch moments are handled by vectoring of the booster nozzle. This paper provides an overview of NASA’s Ares I FS RoCS cold flow development test program including detailed test objectives, types of tests run to meet those objectives, an overview of the results, and applicable lessons learned. The test article was built and tested at the NASA Marshall Space Flight Center in Huntsville, AL. The FS RoCS System Development Test Article (SDTA) is a full scale, flight representative water flow test article whose primary objective was to obtain fluid system performance data to evaluate integrated system level performance characteristics and verify analytical models. Development testing and model correlation was deemed necessary as there is little historical precedent for similar large flow, pulsing systems such as the FS RoCS. The cold flow development test program consisted of flight-similar tanks, pressure regulators, and thruster valves, as well as plumbing simulating flight geometries, combined with other facility grade components and structure. Orifices downstream of the thruster valves were used to simulate the pressure drop through the thrusters. Additional primary objectives of this test program were to: evaluate system surge pressure (waterhammer) characteristics due to thruster valve operation over a range of mission duty cycles at various feed system pressures, evaluate temperature transients and heat transfer in the pressurization system, including regulator blowdown and propellant ullage performance, measure system pressure drops for comparison to analysis of tubing and components, and validate system activation and re-activation procedures for the helium pressurant system. Secondary objectives included: validating system processes for loading, unloading, and purging, validating procedures and system response for multiple failure scenarios, including relief valve operation, and evaluating system performance for contingency scenarios. The test results of the cold flow development test program are essential in validating the performance and interaction of the Roll Control System and anchoring analysis tools and results to a Critical Design Review level of fidelity. 1 Propulsion Engineer, Spacecraft and Auxiliary Propulsion Systems Branch, ER23, MSFC, AL 35812, AIAA Member. 2 Senior Propulsion Engineer, Spacecraft and Auxiliary Propulsion Systems Branch, ER23, MSFC, AL 35812. 3 Propulsion System Analyst, Spacecraft and Auxiliary Propulsion Systems Branch, ER23, MSFC, AL 35812. 4 Propulsion Engineer, Propulsion Systems Design and Integration, Qualis Corporation, MSFC, AL 35812, AIAA Member. https://ntrs.nasa.gov/search.jsp?R=20100034921 2018-06-02T18:00:51+00:00Z
-
Upload
duongkhuong -
Category
Documents
-
view
216 -
download
0
Transcript of NASA Ares I Launch Vehicle First Stage Roll Control System ... · American Institute of Aeronautics...

American Institute of Aeronautics and Astronautics
1
NASA Ares I Launch Vehicle First Stage Roll Control System Cold Flow Development Test Program Overview
Adam Butt1, Christopher G. Popp2, and Kimberly A. Holt3 NASA George C. Marshall Space Flight Center, Huntsville, AL, 35812
and
Hank M. Pitts4
Qualis Corporation, ESTS Group, Huntsville, AL, 35812
The Ares I launch vehicle is the selected design, chosen to return humans to the moon, Mars, and beyond. It is configured in two inline stages: the First Stage is a Space Shuttle derived five-segment Solid Rocket Booster and the Upper Stage is powered by a Saturn V derived J-2X engine. During launch, roll control for the First Stage (FS) is handled by a dedicated Roll Control System (RoCS) located on the connecting Interstage. That system will provide the Ares I with the ability to counteract induced roll torque while any induced yaw or pitch moments are handled by vectoring of the booster nozzle. This paper provides an overview of NASA’s Ares I FS RoCS cold flow development test program including detailed test objectives, types of tests run to meet those objectives, an overview of the results, and applicable lessons learned. The test article was built and tested at the NASA Marshall Space Flight Center in Huntsville, AL.
The FS RoCS System Development Test Article (SDTA) is a full scale, flight representative water flow test article whose primary objective was to obtain fluid system performance data to evaluate integrated system level performance characteristics and verify analytical models. Development testing and model correlation was deemed necessary as there is little historical precedent for similar large flow, pulsing systems such as the FS RoCS. The cold flow development test program consisted of flight-similar tanks, pressure regulators, and thruster valves, as well as plumbing simulating flight geometries, combined with other facility grade components and structure. Orifices downstream of the thruster valves were used to simulate the pressure drop through the thrusters. Additional primary objectives of this test program were to: evaluate system surge pressure (waterhammer) characteristics due to thruster valve operation over a range of mission duty cycles at various feed system pressures, evaluate temperature transients and heat transfer in the pressurization system, including regulator blowdown and propellant ullage performance, measure system pressure drops for comparison to analysis of tubing and components, and validate system activation and re-activation procedures for the helium pressurant system. Secondary objectives included: validating system processes for loading, unloading, and purging, validating procedures and system response for multiple failure scenarios, including relief valve operation, and evaluating system performance for contingency scenarios. The test results of the cold flow development test program are essential in validating the performance and interaction of the Roll Control System and anchoring analysis tools and results to a Critical Design Review level of fidelity.
1 Propulsion Engineer, Spacecraft and Auxiliary Propulsion Systems Branch, ER23, MSFC, AL 35812, AIAA Member. 2 Senior Propulsion Engineer, Spacecraft and Auxiliary Propulsion Systems Branch, ER23, MSFC, AL 35812. 3 Propulsion System Analyst, Spacecraft and Auxiliary Propulsion Systems Branch, ER23, MSFC, AL 35812. 4 Propulsion Engineer, Propulsion Systems Design and Integration, Qualis Corporation, MSFC, AL 35812, AIAA Member.
https://ntrs.nasa.gov/search.jsp?R=20100034921 2018-06-02T18:00:51+00:00Z

Figure 1. First Stage Roll Control System - System Development Test Article Computer Aided Design Model, Test Cell Layout.
Figure 2. First Stage Roll Control System - System Development Test Article Hardware Integrated into Test Cell.
American Institute of Aeronautics and Astronautics
2

American Institute of Aeronautics and Astronautics
1
NASA Ares I Launch Vehicle First Stage Roll Control System Cold Flow Development Test Program Overview
Adam Butt1, Christopher G. Popp2, and Kimberly A. Holt3 NASA George C. Marshall Space Flight Center, Huntsville, AL, 35812
and
Hank M. Pitts4
Qualis Corporation, ESTS Group, Huntsville, AL, 35812
The Ares I launch vehicle has been selected to replace the Space Shuttle to transfer astronauts to low earth orbit, enabling them to return to the moon, and travel to Mars and beyond. It is configured in two inline stages: the First Stage (FS) is a Space Shuttle derived five-segment Solid Rocket Booster and the Upper Stage is powered by a Saturn V derived J-2X engine. Roll control for the FS is handled by a dedicated Roll Control System (RoCS) located on the connecting Interstage. That system provides the Ares I with the ability to counteract induced roll torque while any induced yaw or pitch moments are handled by vectoring of the booster nozzle.
The FS RoCS System Development Test Article (SDTA) is a full scale, flight representative water flow test article whose primary objective is to obtain fluid system performance data to evaluate integrated system level performance characteristics and verify analytical models. Development testing and model correlation was deemed necessary as there is little historical precedent for similar large flow, pulsing systems such as the FS RoCS. The cold flow development test program consisted of flight-similar tanks, pressure regulators, and thruster valves, combined with plumbing simulating flight geometries, and facility grade components and structure. Orifices downstream of the thruster valves were used to simulate the pressure drop through the thrusters. Primary objectives of this test program were to: evaluate system surge pressure (waterhammer) characteristics due to thruster valve operation over a range of mission duty cycles at various feed system pressures, evaluate temperature transients and heat transfer in the pressurization system, including regulator blowdown and propellant ullage performance, measure system pressure drops of tubing and components for comparison to analysis, and validate system activation and re-activation procedures for the Helium pressurization system. Secondary objectives included: validating system processes for loading, unloading, and purging, validating procedures and system response for multiple failure scenarios, including relief valve operation, and evaluating system performance for contingency scenarios. The test results of the cold flow development test program are essential in validating the performance and interaction of the Roll Control System and anchoring analysis tools and results to a Critical Design Review level of fidelity.
This paper provides an overview of NASA’s Ares I FS RoCS cold flow development test program including detailed test objectives, layout of the test article, deviations from the flight design, and types of tests conducted to meet the objectives. The test article was built and tested at the NASA Marshall Space Flight Center in Huntsville, AL.
1 Propulsion Engineer, Spacecraft and Auxiliary Propulsion Systems Branch, ER23, MSFC, AL 35812, AIAA Member. 2 Senior Propulsion Engineer, Spacecraft and Auxiliary Propulsion Systems Branch, ER23, MSFC, AL 35812. 3 Senior Propulsion System Analyst, Spacecraft and Aux. Propulsion Systems Branch, ER23, MSFC, AL 35812. 4 Propulsion Engineer, Propulsion Systems Design and Integration, Qualis Corporation, MSFC, AL 35812, AIAA Member.

ESTS = Engineering, Science, and Technical Services
°F = Degree Fahrenheit FOM = Figures of Merit FS = First Stage FT = Fault Tolerant GHe = Gaseous Helium GN&C = Guidance Navigation and Control HFTA = Hot Fire Test Article ReCS = Reaction Control System Isp = Specific Impulse lbf = Pound Force SCI = Source Controlled Items lbm = Pound Mass MDC = Mission Duty Cycle sec = Second MDP = Maximum Design Pressure MEOP = Maximum Expected Operating
Pressure MGA = Mass Growth Allowance MPS = Main Propulsion System MSFC = Marshall Space Flight Center MSL = Mars Science Laboratory MTO = Mass to Orbit
NDT = NASA Design Team N2H4 = Hydrazine NTO = Nitrogen Tetroxide PDR = Preliminary Design Review psig = Pounds per Square Inch Gauge psia = Pounds per Square Inch Absolute psid = Pounds per Square Inch Differential RCS = Reaction Control System
RoCS = Roll Control System
SDTA = System Development Test Article
SRB = Solid Rocket Booster SSME = Space Shuttle Main Engine TPS = Thermal Protection System TRL = Technology Readiness Level US = Upper Stage USPC = Upper Stage Production Contractor VAB = Vehicle Assembly Building
I. Introduction
American Institute of Aeronautics and Astronautics
2
l System (RoCS), loc
EV) is shown in Fig 1. The foc s of this paper is to provide an overview of t e test article design and test planning for th S RoCS System Development Test Article (SDTA) cold flow test program. A discussion of detailed test
ce 1, “NASA Are
The Ares I launch vehicle is currently in development by the National Aeronautics and Space Administration (NASA) at the Marshall Space Flight Center (MSFC) in Huntsville, Alabama, as part of the Constellation Program (CxP). The vehicle is slated to replace the Space Shuttle for manned spaceflight and is currently being designed by the NASA Design Team (NDT), with component selection, procurement, and production being handled by the Upper Stage Production Contractor (USPC), Boeing. The Ares I is configured in two inline stages: a Space Shuttle derived five-segment Solid Rocket Booster (SRB) First Stage (FS) and an Upper Stage (US) powered by a Saturn V derived J-2X engine. Roll control for the FS is handled by a dedicated Roll Contro
ated on the connecting Interstage with induced yaw and pitch moments being handled by booster nozzle thrust vectoring. The FS SRB operates for approximately two minutes after which point the FS separates from the vehicle ending the mission of the FS RoCS.
A representation of the Ares I launch vehicle in the stacked configuration with the Orion Crew Exploration Vehicle (C
uhe F
results can be found in Referens I First Stage Roll Control System Cold
Flow Development Test Program Results”.
Figure 1. Layout of the Ares hicle I Launch Ve
First Stage Roll Control System
(FS RoCS)
Upper Stage Reaction Control System
(US ReCS)
First Stage Solid Rocket
Interstage (Ares I)
Upper S s I) tage (Are
Orion (Crew Exploration Vehicle)
Booster (Ares I)

American Institute of Aeronautics and Astronautics
3
ion, propellant loading, propellant storage, consumable acquisition, propellant delivery, and thr
e vehicle. Each thruster assembly centerline is can
or both propellant tank pressurization and actuation of t
n in Table 1. acilitate llant ill/dra e intersta e wall to
nd decontamination per
inlets and outlets of each propellant tank and
A. Flight System Description The FS RoCS flight design incorporates a distributed, pressure-regulated Gaseous Helium (GHe) pressurization
system, with localized sets of monopropellant Hydrazine (N2H4) tanks. The FS RoCS configuration has two thruster modules that are 180o apart, with a pair of localized propellant tanks located behind each thruster module inside the Interstage surface. The overall FS RoCS architecture includes: pressurant loading, pressurant storage, pressurant regulation and isolat
uster assemblies to deliver the required impulse and moment generation capability. This architecture provides one failure tolerance for function and prevention of catastrophic hazards, such as inadvertent thruster firing, bulk propellant leakage, and over-pressurization.
The pressurization system includes two ambient-referenced regulators on parallel strings to attain the required system level single Fault Tolerance (FT) for function. A single burst disk and relief valve assembly is included to ensure single FT for must-not-occur catastrophic hazards.
The system is designed to support the simultaneous firing of multiple thrusters as required to counteract roll torque disturbances. Each thruster module contains six 625-lbf thrusters (three each in the positive and negative roll directions), four acting as primary thrusters and two as redundant thrusters. The thruster flowrate is approximately 3.0 lbm/sec of Hydrazine at the rated thrust level. All thrusters are in an inline configuration (catalyst chamber and nozzle), with nozzle centerlines being parallel to the Y-Z plane of th
ted 20o relative to the tangent of the interstage outer wall (28° absolute) in order to reduce plume thermal effects and subsequent interstage Thermal Protection System (TPS) mass. The baseline design also incorporates series redundant, pneumatically actuated Thruster Control Valves (TCV).
Propellant is stored in four supply tanks, with two located in a localized configuration behind each thruster module inside the Interstage structure. Propellant tanks are an all-metal cylindrical design, with elastomeric diaphragms for positive expulsion. The total propellant mass is approximately 1136 lbm with 40 lbm of that being unusable. The volume and dry mass for each propellant tank is approximately 8115 cubic inches (in3) and 40.0 lbm with the nominal and Maximum Expected Operating Pressures (MEOP) being approximately 639 and 793 psia respectively. The distributed pressurization subsystem is located along the inner wall of the Interstage, approximately halfway between the thruster modules and is comprised of three high pressure helium storage tanks and a Helium Pressurant Module (HPM). Each of the high pressure, cylindrical composite over-wrapped GHe pressurant tanks are designed to operate at a maximum helium pressure of 4500 psia and has an internal volume of approximately 8438 in3 and an estimated weight of 74.0 lbm. The total amount of GHe loaded is estimated to be 35 lbm, with 21.5 lbm being unusable due to end of mission pressure and temperature constraints as well as the rapid mission usage timeline. A common pressurant system is used f
he pneumatic thruster valves due to commonality of operating pressure levels. Additionally, helium manual valves and service valves are added to facilitate propellant loading of the localized propellant tanks from the service panel. General dimensions for the RoCS are show
The FS RoCS configuration is designed to fsystem. The service panel (which contains the fallow access to the service valves from outside the vehicle. A liquid trap/low point is located on the propellant fill/drain lines. A purge line is located at the top of each thruster module and routed back to the service panel. Two service valves, one for the +ZS thruster module and one for the –ZS thruster module, provide a continuous purge circuit for each module and are used in conjunction with the propellant manifold to facilitate faster draining. The outer diameter of the fill/drain line is ¼” to ensure adequate drain a
draining, purging, and decontamination of the propein valves) is located on the outside of th g
formance. Further details concerning the evolution of the FS RoCS design can be found in References 4 and 5.
To provide system compliance for misalignments, tolerance stack up, vibrations and other loads, flex lines are installed at the
Table 1. G sions for Ares I FSeneral Dimen RoCS Pressurant Tank - Cylindrical COPV
Diameter 18.5" ID Length 39.6" ID
Propellant T cal Metal ank - Cylindri Diameter 21.25" ID Length 30" ID
Thr leuster Modu Height 48.7" Width 40 " .0 Depth 17.4"
Approximate Line Lengths Pressurant Tank to Propellant Tank 1159"
Propellant Tank to Thruster Valve 196"

American Institute of Aeronautics and Astronautics
4
thruster mounting plates so that, in conjunction with the flex lines, the vibration loads from the lines do not restrict the thruster vibration isolators. A schematic of the flight design used for Phase I testing is provided in Fig 2.
where the propellant lines pass across the interface between interstage and the thruster module. A split manifold was utilized in each thruster module to feed propellant to the thrusters. The manifold is mounted to the
Key
Pressure Transducer
Change in Line Size
Service Valve
P
Redundant Catalyst Bed/
Injector Heaters
Helium Test Port
Helium Burst Disk / Relief
Valve
Helium Pressure Regulator
Helium Isolation Valve(W ith Integral Filter)
FS RoCS Thruster Control Valve
Helium Manual Valve
Resistance Temperature
DetectorT
(Independently Controlled, Contains
Component Assembly
an Integral Filter)
Flex Line
Mechanical Fitting
Flange Connection
T
Filter
Figure 2. FS RoCS Flight Plumbing and Instrumentation Schematic and Key

American Institute of Aeronautics and Astronautics
5
as determined to be 12
opellant pressure at the thruster valve inlet and a high nominal expected thrust (approximately 632 lbf). A summary of the FS RoCS expected nominal and 1-FT pressure drops and pressure budget are presented in Tables 2 and 3.
Table 2. Estimated component pressure drop nominal values and exp ges for various 1-fault
tolerant conditio
Component
Nominal P
Drop [psid]
Expected P
[
The approach of the Constellation Program has been to require encompassing transient system pressures into the definition of Maximum Design Pressure (MDP), which is the value from which proof and burst pressure levels are determined. In general, higher proof and burst pressures result in more complex, heavier, and more expensive components. It is therefore desirable to minimize the MDP, and the FS RoCS incorporates a few design features to help mitigate the transient (waterhammer) pressure levels. These design features include large manifold line sizes with increased propellant feed line wall thickness, localized propellant tanks to help minimize propellant line lengths and staggered thruster closing times to minimize wave amplification. The MDP for the RoCS w
50 psia by analysis and includes transient effects such as waterhammer surge pressures. System fluid analysis was provided using the MSC software EASY5™ for estimates of preliminary operating conditions.
The system pressure budget includes both nominal and 1-FT component pressure drops, regulator set pressure accuracy (± 4.0%), relief valve cracking and full flow pressure settings. The regulator set pressure (and subsequently the MEOP, MDP, tank pressure, and thruster valve inlet pressure) is based on the component pressure drops associated with a 1-FT operating condition in order to deliver the TCV inlet pressure required for the rated thrust. This is done to ensure that the desired 625 lbf thrust level is achieved in any single failure scenario. Three 1-FT scenarios are also tracked: the propellant filter at maximum holding capacity resulting in an increased fluid pressure drop, a failed regulator which drives the pressure to MEOP, and a failed regulator in which the pressure drops below an acceptable value, before switching to the redundant regulator. Under nominal operating conditions, the pressure drop across the entire feed system is lower than each of the 1-FT cases. The outcome of this analysis results in a high pr
ected ran
ressureDrop
ns
ressureRange psid]
Regulator to Tank Line = 12 10-14 Tank Isolation Valve = 5 4-6 Tank Pressure [psig] = 639 613-793
Tank Outlet = 2 2-3 System Filter = 3 9-14
Line loss = 19 18-27 Flexline - Tank Outlet = 3 3-4
FleModule =
xline - Interstage to Thruster 4 4-5
Thruster Valve Inlet [psia] = 593 562-737
3. First Stage Roll Control System Pressure Budget % Tolerance DAC2B_E
Table
GHe Supply Inlet Supply Min [psia] = 1500
Inlet Supply @ 160F [psia] = 4500 Regulator
Operating (Nominal) [psia] = 656 Operating Min [psia] = -4.0% below nom. 629 Operating Max [psia] = 4.0% above nom. 682
Lock Up [psia] = 7.0% above nom. 702 Maximum Overshoot [psia] = 7.0% above nom. 702
Burst Disk
Minimum BD Rupture [psia] = overshoot 4.0% above Reg. 730
M 8.0 re aximum BD Rupture [psia] = % above min ruptu 788
American Institute of Aeronautics and Astronautics
6
Relief Valve
Minimum RV Reseat [psia] =3.5 % above Reg.
overshoot 726
Minimum RV Cracking [psia] =3.5 % above min RV
reseat 752
RV Full Flow Pressure [psia] =5.0 % above min RV
crac ing k 789
High Pressure GHe MEOP and MDP [psia] 4500 Upstream Low Pressure GHe MEOP [psia]* 843 Downstream Low Pressure GHe and Propellant MEOP** [psia] 793
Propellant MDP*** [psia] 1250 * Upstream low pressure GHe defined from regulator outlet to BD inlet. ** Downstream low pressure GHe defined from BD outlet to prop. tank outlet.
5 F for the propellant and pressurant tank and line heaters and 70 F ± 15 F for the fairing heaters. The insulation used on both the tanks and lines is 1.0” thick Fiberfrax® with
verings, or equivalent.
(CDR). No further test results for fluid analysis will be available until Fiscal Year 2012 or 2013, during the motives for conducting this test program
potential concerns that would be design altering.
the Component Development Area (CDA) located at building 4656 of NA
tinued iterations in the design of the FS RoCS, upon completion of the first and primary phase of t sting in the summer of 2009 (May – July), a second phase of testing was planned and conducted in the spring of
ristics and verify analytical models. De-
owing:
ssures. g Pressure Regulator
to analysis of tubing and components.
*** Propellant MDP defined from tank outlet to thruster valve inlet, as MEOP waterhammer surge pressure.
The FS RoCS employs a thermal conditioning system to maintain the thruster module and remainder of system
within acceptable temperatures ranges prior to operation. The thermal conditioning system consists of a vehicle-provided, warm Gaseous Nitrogen (GN2) purge from the Environmental Conditioning System, and a series of RoCS tank, line, and thruster module wall heaters, and insulation. The purge enters the thruster modules through a 1.0” port from the Interstage at a flowrate of 50 standard cubic feet per minute (scfm), 60oF nominal, and exits back into the interstage via a second port. The set points are 90oF ± o
o o
Astroquartz® inner and outer co
B. Purpose and Background The FS RoCS SDTA cold flow test program is a flight representative water flow test article whose primary
objective is to obtain fluid system performance data to evaluate integrated system level performance characteristics and validate analytical models. The test data generated will be used to anchor fluid models for the Critical Design ReviewHot Fire Test Article (HFTA) system qualification tests. Three additionalare:
• Identify any • Allow for further development of critical components - the Thruster Control Valves (TCV) and Pressure
Regulators. • Little historical precedent for large flow, pulsing system (e.g., Space Shuttle primary Reaction Control
System, Mars Science Laboratory) The test article was built and tested bySA’s Marshall Space Flight Center in Huntsville, Alabama, and is managed by the Valves, Actuators & Ducts
Design and Development Branch (ER33). Due in part to cone
2010 (April – June).
1. Phase I Testing The overall goal of the SDTA program is to obtain fluid system performance data using a flight representative
configuration to evaluate integrated system level performance characteIonized (DI) water, with similar fluid properties to Hydrazine, is used to simulate the propellant. The detailed FS RoCS SDTA cold flow test program objectives consist of the foll
1. Evaluate system surge pressure (waterhammer) characteristics due to TCV operation over a range of mission duty cycles and expected operating pre
2. Evaluate temperature transients and heat transfer in the pressurization system, includinblowdown and propellant ullage performance.
3. Measure system pressure drops for comparison

American Institute of Aeronautics and Astronautics
7
on
rocesses for loading, unloading and purging. ion.
including six thrusters are being fired
ditions are met: ort.
hich will be built unique to the as-built SDTA architecture for comparison to test data, due to the SDTA configuration not being an exact copy of the flight system.
etween the test data and the analytical models are resolved post-testing, some of which are inc
ll of the major continuing iterations to the flight lay t were not incorporated. Planning for Phase II testing began in the winter of 2009 to incorporate and generate
of 2010. The rationale which arose du
- nifold layout
below in Fig 3. • urge and Fill/Drain manifolds were increased from 0.25” to 0.5” lines to further reduce
waterhammer surge pressures, reduce loading and unloading times, and improve the ability to decontaminate the system.
4. Validate system activation and re-activation procedures for the Gaseous Helium (GHe) pressurizatisystem and the simulated propellant system.
5. Validate system p6. Validate procedures and system response for multiple failure scenarios, including relief valve operat7. Evaluate system performance for contingency scenarios
simultaneously. The general success criteria is that a test series is deemed successful if the following con
1. The test is completed for the full duration without an ab2. A post-test checkout / inspection verifies no damage to the test article. 3. Test data indicates all operating parameters are within normal operating ranges. 4. All required data is recorded at the specified data rate.
Test data is interpreted in several different ways. First, data is reviewed to ensure no test limits are violated. Second, the data is used to validate the analytical models, w
Any discrepancies bluded in the objectives for the second phase of SDTA testing.
2. Phase II Testing
Throughout the planning and testing of the FS RoCS SDTA, work continued on iterating and increasing fidelity in the flight article design towards CDR. In order to move out on the construction and testing of the SDTA, the design and layout had to be frozen in April of 2009, and therefore a
outest data with these iterations, and the test series was completed in late spring
ring, and subsequent to, Phase I for additional testing including:
Insufficient waterhammer data with updated flight ma• The thruster module manifold design was changed from “Split” manifold to a “Single” manifold
layout two months after completion of Phase 1 testing. The updated manifold design used for Phase II testing is representedP
Figure 3. FS RoCS Updated Flight Thruster Module Manifold Schematic

American Institute of Aeronautics and Astronautics
8
Phase I in order to compress test schedule and additional data was needed
thermocouples was insufficient for model correlation
t of data for the discrete steady state demand of 1 – 6 thrusters for analytical
ss than predicted ace for Phase II testing)
results were generated for:
se II
easurements for relatively
• New software controls for FS SDTA to be shunt calibrated daily added to DACS
flight-like thruster valves lated GHe COPVs
m response for simulated failed Regulator, with more flight-like GHe isolation valve flow area/orifice
as 0.25”), and capped purge line
ts 8. Verification of flight loading procedures with flight-like service valve orifice sizes
by the NASA Design Team (NDT) and assembled and tested by the MSFC Component Development Area.
A.
- Heat transfer in insulated pressurization system: • Insulated GHe COPV loading takes approximately 8 hours therefore only a few tests were run
with insulation duringfor model correlation
− Leakage occurred in 2 of the 3 tests, invalidating Phase I results − Location and quantity of surface
(more added for Phase II testing) - Regulator performance for varying thruster demand
• Insufficient amounmodel correlation
- System response for simulated failed regulator • Worst case conditions (i.e. minimum ullage) was not tested • GHe isolation valve orifice size was smaller as compared to flight, resulting in le
maximum flow through SDTA regulators (new HIV in pl- Service valve orifice sizes larger than anticipated flight designs
• Consequently, inaccurate Phase I − Purge Circuit Flow test − Gross Pneumatic Leakage test − Simulated flight KSC pressurant and propellant loading
• Orifices added to SDTA service valves to accurately simulate flight for Pha- Repeatable pressure transducer results for precise pressure drop measurements
• New data acquisition and control system (DACS) coupled with no built in method to perform “shunt”, or in-place daily calibration, led to non-repeatable pressure msmall range of anticipated component and manifold pressure drops
• Improved process developed in subsequent US ReCS SDTA test program
The detailed FS RoCS SDTA Phase II test objectives include: 1. Waterhammer results with new thruster module manifold design and three2. GHe pressurization system heat transfer data with insu3. Regulator performance for varying thruster demand 4. Syste
size 5. Waterhammer results with 0.5” fill/drain and purge manifolds (w6. Purge circuit flowrate with flight-like service valve orifice sizes 7. Repeatable pressure transducer measurements for precise pressure drop measuremen
II. Test Article Design The FS RoCS SDTA is configured for formal system-level flight development cold flow testing using DI water
to simulate the hydrazine propellant and incorporates flight similar hardware (with respect to function). The test article was designed
Deviations from Flight Design The SDTA simulates the majority of the flight system, but does not contain all of the redundant hardware of the
flight configuration, represented in Fig 2. The layout of the Ares I FS RoCS flight configuration, as seen below in Fig 4, has been modified to create the SDTA; only one set of localized propellant tanks and one thruster module is simulated in the SDTA. The rationale for only incorporating one set of propellant tanks and thruster module is that the two sides of the propellant system are isolated in the “localized” propellant tank configuration (i.e. there is no way for propellant to communicate from one side of the system to the other). It was therefore determined that only one set of propellant tanks and thruster module need be incorporated to adequately simulate propellant fluid dynamic environments and interactions. The flight pressurization system is, however, a distributed architecture and thus in order to simulate the full pressurization system dynamics and flow rates, a simulated pressurant usage valve panel was incorporated (details below). The SDTA uses propellant tanks which are flight similar and mounted in

American Institute of Aeronautics and Astronautics
9
Where most applicable, a welded assembly is used to e
the individual flo
rature sensors, strain gauges, flowmeters, capacitance probes and accelerometers (further details in Table 5 below).
d lines lengths and bend radii are slightly modified. Line length deviations are detailed below in Fig 5 and Table 4.
approximately the same location as the flight tanks. A water distribution manifold which is identical (or very similar) to the flight configuration in terms of tube lengths, and bends, including additional ports for test instrumentation is also incorporated into the test article design.
nsure similarity to the all-welded flight propellant manifold. The SDTA does not contain any thrusters. Representative Thruster Control Valves (TCV) are placed at three of
the thruster locations with restrictions (manually-adjustable needle valves) downstream to simulate the thruster flow resistance. The representative thruster valves are designed to specifically mimic flow and pressure drop characteristics of the flight thruster valves. The TCVs also mimic the closing shuttle time of the flight thruster valves. The manifold is designed such that the TCVs can be relocated to other thruster locations within the module as needed to achieve all of the test objectives. Turbine flow meters located downstream of the metering valve are used to calibrate steady state flow rates, prior to system testing. Total flow is measured by summing
w rates. The remaining thruster valve locations are capped off to replicate the complete manifold. All SDTA components are mounted to a support structure. The primary support structure is designed to be stiff
to decouple feed system dynamics. The components are mounted to the support structure using a similar approach to the flight bracketry such that dynamic response of the tubing is simulated. All thruster module plumbing is welded with tubing thickness and material the same as the flight design with the exception of the additional instrumentation ports. Tubing throughout the remainder of the system is assembled using 37o flare, AN-style fittings. Instrumentation includes dynamic pressure transducers, static pressure transducers, tempe
Figure 4. Ares I FS RoCS flight configuration layout
Excluded for SDTA testing
In order to fit the entire system into the applicable test facilities, the footprint of the SDTA is reduced from that
of the flight article (approximately 18 ft diameter Interstage), to 10 ft X 10 ft. Pictures of the test article installed in the test cell are shown below in Fig 6. To reduce the footprint of the SDTA, some of the propellant and pressurant fee

Figure 5. FS RoCS SDTA line length deviations from flight (DAC2B_S_RevF)
Table 4. Line length differences between flight and SDTA
O.D. Line Size [in]
Flight Length (DAC2B_S_RevF)
[in]
FS SDTA Length [in]
SDTA Difference
[in] %
0.25 1234 1274 +40 +3% 0.5 100 121 +21 +17%
0.75 586 615 +29 +5% 1.0 60 58 -2 -3% 1.5 39 38 -1 -3%
The SDTA is supported by a non flight-like strong back support structure. The pressurant and water tank
assemblies, as well as the panel assemblies are mounted to panels that simulate the curvature of the Ares I Interstage Outer Mold Line (OML). The support structure is designed to support an additional pressurant tank and an ASME code water tank.
Figure 6. System Development Test Article Hardware Integrated into Test Cell (Phase I)
American Institute of Aeronautics and Astronautics
10

A thruster module GHe facility purge is incorporated into the propellant (water) subsystem to allow for low pressure purging of the thruster control valves, as well as to assist with the drying of the system between tests. Facility regulated pressure is incorporated into the test article at the Service Valve panel and is sized to provide sufficient GHe flowrates at pressures from ambient to 1000 psig.
American Institute of Aeronautics and Astronautics
11
In addition to the instrumentation in the FS RoCS flight configuration, additional test instrumentation is incorporated into the SDTA. The added instrumentation is used to generate data necessary to meet all of the objectives of the system level cold flow development testing.
The flight article will experience several environments that will not be simulated during cold flow testing. These environments include:
Table 5. FS RoCS SDTA Hardware List
Hardware Current Flight
Quantity
SDTA Quantity (Range indicates
alternate configurations)
Thruster Module Assembly 2 1 Thruster Assembly 12 0
Thruster Control Valve 24 2 - 6 Baseplate 2 1 Fairing 2 0
Localized Propellant Tank Assembly 2 1 Propellant Tanks 4 3 Flight Support Brackets 4 0
Pressurization Tank Assembly 1 1 Pressurant Tanks 3 3-4 Flight Support Brackets 3 0
Pressurization Panel 1 1 GHe Isolation Valves 2 4 • Thruster thermal effects Pressure Regulators 2 2 • Entire range of expected external
and internal temperatures Burst Disk 1 0 Relief Valve 1 1
• Aerodynamically induced vibrations
Propellant System Filter 2 1 Service Panel 1 1
Pressurization Service Valve 1 1 • Vehicle-level induced vibrations Pressurization Fill / Drain Valve 1 1 • Shock events generated at launch
and separation Helium Manual Valve 2 1 GHe Vent Valve 0 1
• Aerothermal heating Propellant Fill / Drain Valve 2 1 Thruster Module Service Valve 2 1 The FS RoCS SDTA consists of a sub
set of hardware associated with the flight article, summarized in Table 5, as well as additional hardware necessary for testing.
SDTA Support Structure 0 1 Simulated Pressurant Usage Valves 0 3 Low Point Drain Valve 0 1 High Point Bleed Valve 0 1
B. Phase I Testing 1. Layout
The FS RoCS flight configuration incorporates a distributed pressurization system, in which the GHe pressurant is evenly distributed from a centrally-located set of GHe tanks to each of the localized sets of propellant tanks. In order to accurately simulate the fluid dynamics associated with overall system operation while using only one of the two propellant subsystems with the distributed pressurization system, the SDTA includes Simulated Pressurant Usage (SPU) valves. The SPU valves simulate:
1. The GHe usage associated with tank pressurization needed to operate one thruster 2. The GHe usage associated with tank pressurization needed to operate two thrusters simultaneously 3. The GHe usage associated with tank pressurization needed to operate three thrusters simultaneously 4. The GHe usage associated with pneumatic valve actuation
Development grade, flight-similar Composite Overwrapped Pressure Vessel (COPV) water tanks are used for
SDTA testing. To conserve the cycle lives of the life-limited COPVs, as well as to allow for vacuum loading (COPV liners are too thin), a more heavy duty ASME (American Society of Mechanical Engineers) Code tank is incorporated into the SDTA for use during portions of the testing. The COPV water tanks selected for FS SDTA testing have an internal volume of 6,912 in3 (4 ft3) as compared to 8,115 in3 for the current (DAC2B_S_RevF) flight configuration (14.8% difference in volume). The difference in tank volumes was due the availability of a more off-the-shelf liner size (4 ft3) than that of the flight tanks. The ASME code tank was sized to be approximately twice the volume of one of the flight propellant tanks, 9.4 ft3 (16,243 in3).

Within the pressurization system development grade flight-similar GHe COPV pressurant tanks are used for SDTA testing. The COPV pressurant tanks selected for FS SDTA testing have an internal volume of 6,912 in3 as compared to 8,438 in3 for the current (DAC2B_S_RevF) flight configuration (18.1% difference in volume). Additionally a flight qualified Carleton Delta IV COPV is included in the test article to more closely simulate the heat transfer characteristics of the flight COPVs.
The pressurant valve panel includes parallel GHe pressure isolation and regulation legs. Each leg consists of two high pressure GHe isolation valves (HIV). The downstream (and primary) valves were selected for similar operating conditions to the flight design, in terms of opening and closing response time and flow capacity. The upstream isolation valves are Annin cryogenic ball valves and are included to insure isolation of the high pressure GHe for safety reasons, in case the GHe temperature exceeds the minimum operating temperature of the primary isolation valves. Both types of valves are remotely actuated and used in automated test sequences. Downstream of each primary HIV is a position for a regulator, of which three separate vendor designs were used. Pictures of the Pressurant Valve and Simulation Pressurant Usage Valve Panels are shown below in Fig 7. The regulators were specifically designed for the FS RoCS and were part of an earlier Advanced Development Hardware (ADH) program from 2007 and 2008 to assist with the determination of the detailed flight component specifications.
Figure 7. Pressurant Valve (left) and Simulated Pressurant Usage Valve Panels (right) (Phase I)
As previously mentioned, the SDTA manifold line lengths are designed to match the flight line lengths as closely
as possible. The tubing is fabricated from 316L stainless steel. Lines are designed to be bent or welded as much as is practical thereby minimizing the use of fittings in the water feed system, as per the flight design. Flight-similar flex lines, with respect to diameter and length, are also incorporated into the test article design.
A support structure is included to provide hardware support and to interface to the Test Facility. The structural design philosophy is to build a rigid steel test structure such that it is decoupled from the feed system dynamics. Figures 8 and 9 below show the layout of the Ares I FS RoCS SDTA. The plumbing and instrumentation schematic for the test article is shown in Fig 10.
American Institute of Aeronautics and Astronautics
12

10 ft
10 ft
Figure 8. FS RoCS SDTA Computer Aided Design Model, Test Cell Layout
Front Right 9 ft
6 ft
American Institute of Aeronautics and Astronautics
13
Figure 9. Dimensioned layout of FS RoCS SDTA
6.5 ft

Figure 10. FS RoCS SDTA Phase I Plumbing and Instrumentation Schematic
American Institute of Aeronautics and Astronautics
14

American Institute of Aeronautics and Astronautics
15
2. Instrumentation The SDTA incorporates additional instrumentation to that included in the flight configuration to be tested. The
additional instrumentation is used to generate the data necessary to meet all of the objectives of the system development cold flow testing. A summary of the instrumentation is listed below in Table 6. All instruments used for test operation were verified to be in current calibration prior to the beginning of testing.
Table 6. FS RoCS SDTA Instrumentation Requirements
Instrument Quantity Range Accuracy Sample
Rate (Filtered)
Manufacturer
Thermocouples – Internal Fluid 52 -120 to 32oF 32 to 160oF
± 3oF or 1% ± 3oF or 0.5% 100 Hz Omega
Thermocouples – External Surface 13 0 to 160oF ± 3oF or 0.5% 100 Hz Omega
Pressure Transducer – Low Frequency 40
0 to 5000 psig ± 25 psi, @ Constant T
100 – 1000 Hz
Delta Metrics
0 to 2000 psig [± 10 psi] Constant
T or ± 10 psi + 0.2psi/°F
(> 50kHz response)
Delta Metrics, Sensotech
Pressure Transducer – High Frequency 6 0 to 15000
psid ± 150 psi 10 kHz Kistler
Pressure Transducer – Vacuum 1 N/A N/A 100 Hz N/A
Flow Meter (turbine) 5 5 to 55 GPM ± 1%
10 kHz N/A
1 to 20 ACFM GHe ± 1% N/A
Capacitance Probe 3 0 to 100%,
the length of 32” probe
± 1% 100 Hz N/A
Optical Displacement Probe 2 N/A N/A N/A N/A Current Trace 3 N/A N/A N/A N/A
Static pressure transducers (PT) are used to measure water and GHe pressures at various locations throughout the
system. In the water manifold, static PTs are placed upstream and downstream of the thruster valves, downstream of the water tanks, in the thruster module manifold, and upstream of the propellant service valves. The static PTs are either mounted to the tubing via short (< 4”) stand-off tubes, or flush mounted to the inner diameter of tubing (ID) via custom made fittings. Within the water manifold all static PT’s are mounted horizontally so as to minimize the probably of accumulating trapped gas at the instrument interface.
High frequency pressure transducers are placed upstream of each set of serial thruster valves to measure the high frequency, high amplitude waterhammer surge pressures generated during the rapid closing of the thruster valves. Dynamic PTs are also placed just upstream of the propellant service valves on the service panel to verify surge pressure levels at those locations, as well as downstream of the pressure regulators to verify dynamic response. Due to the fact that dynamic PTs only measure transient (delta) pressures, a static PT is installed in each position that there is a dynamic PT. The dynamic PTs are flush mounted to the ID of the tubing, and are capable of a 50,000 samples/second sampling rate. A picture of a portion of the thruster module instrumentation is shown in Fig 11.
Various types of temperature sensors are incorporated into the SDTA to measure temperatures throughout the system. Thermocouples are flush mounted to the ID of the tubing (or penetrating into the fluid flow path where applicable) to measure internal fluid temperatures, and externally mounted to tubing, component and tank external surfaces to measure external temperatures. They are used for model correlation of heat transfer within the system.
Additional instrumentation included in the test article includes: • Capacitance probes - Measures water levels in the water tanks. • Flowmeters - Included downstream of the TCV’s to measure water flowrates and upstream of
the GHe SPU valves to measure pressurant flowrate. • Optical probes - Installed onto each stage of one of the series-redundant thruster valves to
record the physical displacement of the main pistons during actuation. • Current traces – Installed on all of the thruster valves to record the current supplied to the pilot
valves

The Data Acquisition and Control System (DACS) consists of National Instruments hardware, and Labview™ based software. The DACS includes three different speed chasses – 24 channels at 50 kHz, 24 channels at 10 kHz, 24 channels at 1 kHz, and 64 thermocouple channels at 100 Hz. Instruments are filtered by the DACS from 50 kHz to 10 kHz, 10 kHz to 1 kHz, and 1 kHz to 100 Hz respectively.
Custom instrumentation
fitting
American Institute of Aeronautics and Astronautics
16
Figure 11. Thruster Module Instrumentation Layout (Phase I)
C. Phase II Testing 1. Layout Updates
As previously mentioned, during and subsequent to Phase I testing, the FS RoCS thruster module manifold design was updated due to concerns with flexibility within the manifold and excessive loads predicted to be transmitted to the thruster valve inlets. To remedy this issue, the Split manifold design used during Phase I testing, was updated to a Single manifold design in which all six 1¼” thruster legs are fed from a single 2” manifold. The Phase II SDTA manifold however incorporated three thruster legs of varying sizes (1”, 1¼”, and 1½”) on the left side of the module to allow for model correlation in the case of a future flight manifold change. Representations of the flight (Single) manifold design as well as the schematic for the Phase II version of this manifold are shown below in Fig 12. Each of the individual thruster legs in the flight design are bent to allow flexibility within the manifold, however for the SDTA manifold the thruster legs were designed as straight segments, as the curvature was not anticipated to affect the fluid dynamics within the manifold.
To reduce propellant loading and unloading times, as well as decontamination purge times in the case of a launch scrub, the fill/drain and purge manifolds were increased on the flight design from ¼” (0.028” wall thickness) to ½” (0.049” wall thickness) lines. Additional rationale for modifying the propellant lines was to increase structural margins and reduce maximum waterhammer surge pressures to provide additional margin to MEOP. In addition, HIV-01 was replaced with a larger flow capacity valve to more accurately simulate the flight design. Orifices were also placed upstream of the service valves to also more closely simulate the associated flight designs.
Pneumatically-actuated Series
Redundant Thruster Valves
Flush mounted static Pressure
Transducer
Flush mounted dynamic Pressure
Transducer
Internal fluid Thermocouple
External surface Thermocouple

Figure 12. FS RoCS SDTA Phase II Updated Flight and Test Article Thruster Module Manifolds.
2. Instrumentation Updates
The general layout of the instrumentation was maintained from Phase I to Phase II testing. Within the thruster module, the only significant update was that static PTs were placed at the blind flanges representing the inlets at the thruster valve locations on the opposite side of the manifold not used for testing, as shown in Fig 13. Within the pressurization system additional surface thermocouples were added to the midspan of various sections of tubing to acquire more targeted data for analytical model correlation. To insure the transient waterhammer pressure peaks were adequately captured, the 50 kHz and 10 kHz PT’s DACS filtering was removed.
Figure 13. FS RoCS SDTA Phase II Thruster Module Plumbing and Instrumentation Schematic and as-
built Manifold.
American Institute of Aeronautics and Astronautics
17

American Institute of Aeronautics and Astronautics
18
III. Development Test Planning A range of system level development tests were performed with the FS RoCS SDTA. Various sets of tests were
conducted to assess different aspects of system performance in order to meet the test objectives. Details of the various sets of tests as well as the rationale to conduct these tests are provided below. The Test Procedures used to conduct the tests were generated by the test facility, CDA.7
Hardware from the NASA MSFC Ares I RCS Advanced Development Hardware (ADH) programs was used for the SDTA regulators and Thruster Control Valves, as available. The remaining hardware is facility grade and sized to be similar flight specifications in terms of fluid performance characteristics. The water and GHe tanks, as well as the thruster module manifold were precision cleaned (per MSFC-SPEC-164, Class I) prior to test article assembly and were maintained with a constant GN2 trickle purge to reduce the chance of contamination.
The FS SDTA is designed to allow for multiple hardware configurations, depending on the particular type of test being conducted. Multiple hardware configurations were available for:
• Three FS RoCS advanced development regulators • GHe tanks - Three Delay (MSFC Development) COPVs, or Two Delay COPVs + Carleton COPV • GHe tank orientation – Reversing inlet and outlet to assess effects on heat transfer • Water tanks – Two Delay COPVs or ASME Code tank • Relief valve – 1100 psig set pressure for majority of testing, 780 psig (MEOP) for simulated regulator failure
tests • Two Thruster Control Valve (TCV) designs and multiple positions within the Thruster Module
The test article is designed for different thruster valves to be tested in any thruster location within the Thruster
Module. This includes both different sets of hardware from the same manufacturer, as well as valves from different manufacturers.
A. Checkout Testing Checkout tests were conducted to verify performance of various components and instruments within the test
article as well as to calibrate GHe and water orifices used to accurately simulate expected flow rates in the flight system. Checkout test series “A” was a series of GHe flow tests through each of the SPU valves, and corresponding downstream orifices, to establish the as-installed flow through each SPU valve. Orifice sizes were iteratively tested until the desired flowrate of 3.0 ± 0.2 ACFM per SPU valve was achieved in the upstream, inline flowmeter (FM-05).
Checkout test series “B” was a series of water flow tests for each of the Thruster Control Valves (TCV) to establish the set point of the needle valves downstream of each TCV to establish the desired water flowrate. A series of iterative two second steady state pulse sequences were conducted with the pressure being vented and needle valve position adjusted between each test. The target flowrate was 21.5 ± 1.075 GPM at a static inlet pressure of 641 ± 5 psig and was measured using the respective downstream turbine flowmeters (FM-02, FM-03, FM-04). Once the targeted flow rate was set for each TCV, a custom stem locking mechanism was locked in place to prevent the needle valve stem from rotating during the remainder of the test program. Flowrate through each of the valves was indirectly verified at least weekly during the test program as a part of the waterhammer test series to insure no set point deviation. Pictures of the thruster module manifold and TCVs are shown below in Fig 14.

Needle Valves with custom stem-lock
Thruster Control Valves
Figure 14. FS RoCS SDTA Thruster Simulators – Thruster Valves and Needle Valves (Phase II) Checkout test series “D” consisted of GHe regulator functional checks. Specifically, two types of regulator
check out tests were run: regulator lockup and regulator blowdown performance. Regulator lockup tests consisted of pressurizing the lines downstream of the regulator outlets as well as the tank ullage (with no flow demand), allowing the regulator to go to the maximum non-flowing set pressure, also known as the lockup pressure. The sequence used to perform the lockup tests was to close all downstream vents, pre-pressurize the pressurant lines and tank ullage to a predetermined “pad” pressure (typically 100 psig, but varied between ambient and 600 psig depending on the test), then open the high pressure GHe Isolation Valve (HIV) upstream of the regulator to be tested. This method of pressurization is also referred to as slam-start pressurization due to the nature of the rapid opening of the HIV and the large pressure differential across the regulators.
Pressurant tank blowdown tests were used to determine the baseline performance of the regulator as it regulates the GHe flowrate from high (4500 psig) to low (1500 psig or lower) inlet pressures. The sequence for these tests consisted of the same steps as the regulator lockup test, followed by opening of two of the Simulated Pressurant Usage (SPU) valves to initiate flow through the desired regulator. Flow was terminated by closing the HIV upstream of the regulator at the predetermined minimum inlet pressure (typically 1500 psig). Both of the types of regulator checkout tests were repeated at various points throughout the test program to verify repeatable performance.
B. Simulated Flight Loading A series of procedures and tests were incorporated in the program to simulate and verify the intended propellant
and pressurant loading procedures for the flight design. Pressurant loading from the facility was conducted through the GHe service valve, HSV-03. As is intended for the flight design, the GHe COPVs were limited to 160°F during loading. The facility isolation valve separating the high pressure (6k psig) pressure source from the test article therefore had to be cycled during pressurization to allow the tanks to cool and not exceed the maximum operating temperature. Water was loaded via the propellant service valve PSV-02 to simulate flight loading, and through MV-08 for rapid tank filling when flight loading procedures were not being simulated.
C. Characterization Testing System characterization tests were conducted to establish baseline performance of various aspects of the test
article including GHe blowdown, performance of the flowmeters, pressure drops throughout the system, leakage
American Institute of Aeronautics and Astronautics
19

American Institute of Aeronautics and Astronautics
20
response, and flowrate within the purge system. As with the checkout tests, characterization tests were run at various times throughout the test program to insure consistent results and to track any changes.
Test series “E” was a series of GHe COPV pressure blowdown tests. These tests were performed to characterize the temperature and pressure profiles for full-pressure range blowdowns. Parameters varied were the heat transfer of the tanks with and without flight-similar insulation, initial loaded pressure, initial test pressure (after the tanks had cooled from loading), and final test pressure. Instrumentation used to compare performance included:
• Thermocouples mounted on the external surface composite overwrap (T-02, 05, 08, 11) • Thermocouples mounted tank outlet boss (T-01, 04, 07, 10) • Internal thermocouple probe (T-03, 06, 09, 12) penetrating approximately 8” into the tank through the outlet • Internal gas pressure (P-01, 02, 03, 04)
Additionally, MSFC-developed COPVs and a Carleton spaceflight-qualified COPV were compared during testing. The test sequence consisted of filling the water tanks to the starting ullage volume, pressurizing three of the four GHe COPVs to the start pressure, and letting the GHe temperature decay. This was followed by opening the HIV upstream of the regulator to be tested, allowing the regulator to come up to lockup pressure, opening two SPU valves to begin the GHe blowdown, and finally closing the SPU valves at a pre-designated end pressure. The only operational constraint for this test was to limit the maximum gas temperature in the COPVs to 160oF during loading, to prevent material property changes of the overwrap epoxy.
Test series “F” was a series of runtime integration tests, performed to verify the installed performance of the liquid turbine flowmeters. This was done to verify flowmeter calibration. These tests consisted of filling the test article with a known quantity of water, pressurizing the system to the nominal set pressure and flowing through two thruster valves continuously until the capacitance probe indicated the liquid level was approximately at the bottom of the COPV water tanks. The water that remained in the tanks and propellant manifold was then drained from the system and weighed to see how much water remained in the system (also referred to as catch and weigh). The resulting flow rate measured by the turbine flowmeters was integrated over the pulse length to calculate the quantity of water used. This was then compared to the measured weight of the water loaded, minus the remaining water drained from the test at the completion of the pulse. The initial water loading was accomplished by filling a large container (165 gallons) with water, raising it with a forklift and weighing it with a hanging scale, then loading the test article from that container and weighing the container at the end of the load.
Test series “G” was a series of tests to assess pressure drops in the system. An important aspect of system design is characterization of the pressure drops throughout the system. This enables accurate system simulation and prediction of flight performance. The impact of the flexlines and filter in the propellant manifold on the overall system pressure drop were of greater uncertainty and were assessed in the system characterization “G” tests. This was accomplished by running a baseline flow test to establish the nominal pressure drop from the tank outlet to the TCV inlets. The filter was then removed and replaced with a straight section of tubing and the flow test was repeated at the same tank pressure, thus, quantifying the pressure drop associated with the filter. Following this test, the filter was reinstalled, and the flexline entering the thruster module was removed and replaced in the same manner to quantify the associated pressure drop.
System characterization test series “H” was a series of system leakage tests conducted to compare the predicted and actual leakage rates of the pressurized system. These tests were conducted to generate test data to compare to analytical flight system models which are being used to determine the verification criteria for the flight system during future build up, test and checkout, planned at the NASA Michoud Assembly Facility (MAF). As previously mentioned, one of the differences between the SDTA and the flight design is that the test article is primarily assembled with standard mechanical 37o flare fittings (with the exception being the thruster module manifold which is primarily welded) and the flight system is an all welded design.
Three system leakage tests were conducted. The first test consisted of pressurizing the system from the outlet of the regulators to the inlet of the thruster valves up to 800 psig (approximately system MEOP) with GHe, isolating the system, then holding the pressure for 90 minutes while recording the resultant pressure decay. The pressure was then vented and the test repeated at 100 psig (pad pressure). The final leakage test was conducted to isolate and quantify the leakage in the more complex (and flight-similar) thruster module manifold. This was accomplished by isolating the water tanks and pressurization tubing with manual valves and repeating the pressure decay tests at 800 and 100 psig. Leakage results compared favorably with the analytically predicted values.
Test series “I” was a series of tests to assess the flowrate in the purge circuit within the system. The purge circuit was designed to facilitate decontamination of the flight system in the event of a post-loading mission scrub, requiring the unloading of propellant and removal of hardware. In order to decontaminate the system within a defined timeframe, the flowrate through the purge circuit must be quantified. This test was conducted to verify the flowrate through the as-built, flight-similar test article tubing layout. Because the service valves used for SDTA
American Institute of Aeronautics and Astronautics
21
testing were larger in flow area that those being designed for flight, Phase II testing with updated orifice sizes was conducted to further verify the test results and more accurately quantify the flowrate through the purge system.
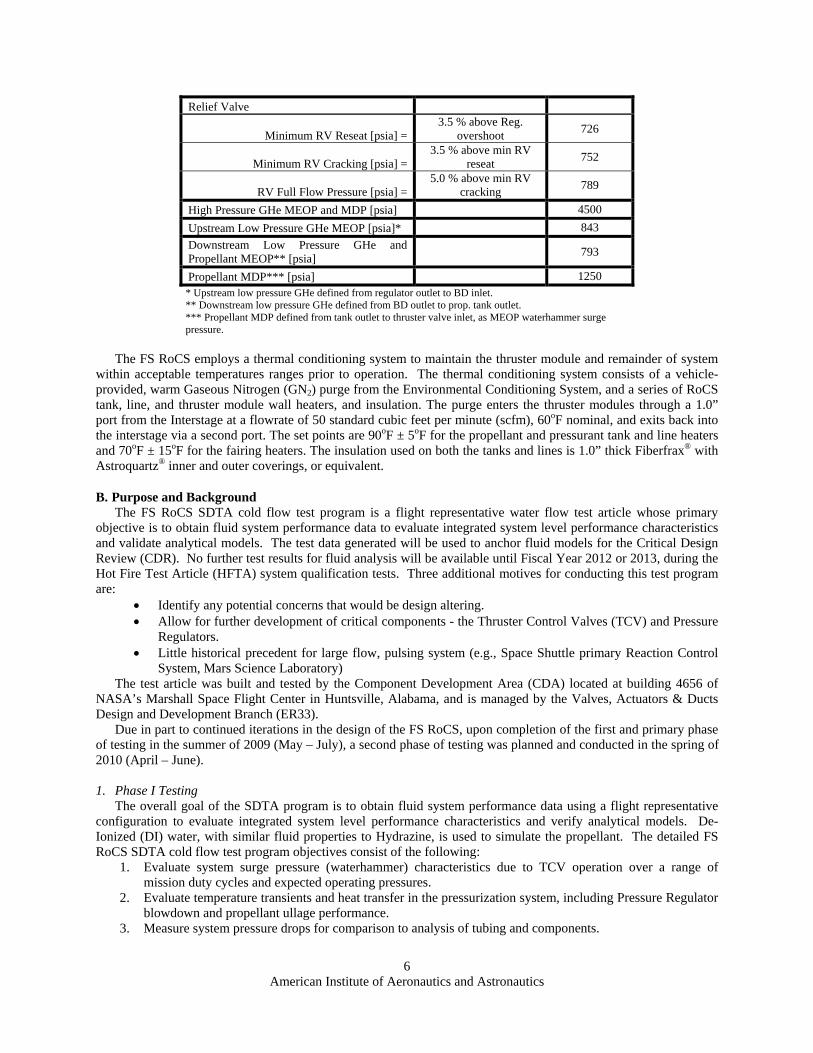
D. Waterhammer Testing Characterization of system level transient surge pressures was a significant portion of this test program. All
tubing and component safety factors (proof and burst pressures) are defined as multiples of MDP. Primarily for this reason, a significant portion of the flight design was focused on mitigating maximum surge pressures in the propellant system, commonly referred to as waterhammer. Waterhammer is primarily generated within the liquid manifold following the rapid closing of a thruster valve. For details on aspects of the system design incorporated to mitigate surge pressures, see Reference 4, “Ares I Launch Vehicle Roll and Reaction Control Systems Overview”. A series of waterhammer tests were conducted to bound the response in the system for a range of variable parameters including: TCV inlet pressure, number of thrusters firing, initial vacuum load pressure, amount of high point bleeding to eliminate gas in the system, and stagger time between valve closings. The waterhammer tests included single TCV and dual TCV runs several two second pulses. A summarized set of parameters varied during waterhammer testing, as well as the nominal flight design parameters, are provided below in Table 7. A summary of the waterhammer test series conducted is provided in Table 8.
Table 7. Waterhammer Test Parameters
Parameter Flight /
Nominal Test Conditions
Min Max Vacuum Load Pressure [psia] 0.5 0.25 Ambient
Stagger Time between valve closings [msec] 200 100 200 Tank Pressure [psig] 650 630 780
Number of Thrusters Firing 4 1 6
Table 8. Waterhammer Test Series Details Waterhammer Test Series #
Program Phase Description Thrusters Valve Sets System
Pressure Duty Cycle
1 Phase I Single TCV Steady State Pulsing TCV-4, TCV3, TCV10
Nominal, Reg.
Lockup, MEOP
2 sec On / 2 sec Off
2 Phase I Dual TCV Steady State Pulsing
TCV-4/TCV-3, TCV-4/TCV-10
Nominal, Reg.
Lockup, MEOP
2 sec On / 2 sec Off, with
200 msec stagger
3 Phase I Reduced Vacuum Water Load tests (5 psia, 8 psia,
ambient)
TCV-4/TCV-3, TCV-4/TCV-10
Nominal, Reg.
Lockup, MEOP
2 sec On / 2 sec Off, with
200 msec stagger
4 Phase I Alternate Closing Stagger Time
TCV-4/TCV-3, TCV-4/TCV-10
Nominal, Reg.
Lockup, MEOP
2 sec On / 2 sec Off, with
100 msec stagger
5 Phase II Three Flight-Like TCVs, Steady State Pulsing
TCV-4/TCV-3/TCV-10
Nominal, Reg.
Lockup, MEOP
2 sec On / 2 sec Off, with
200 msec stagger
6 Phase II Purge Line Removed TCV-4/TCV-3, TCV-4/TCV-10
Nominal, Reg.
Lockup, MEOP
2 sec On / 2 sec Off, with
200 msec stagger

The dynamic pressure transducers are delta pressure measurements (i.e. transient change in static value), therefore the method used to calculate the maximum transient surge pressure was to add the static pressure measurement to the dynamic pressure. The maximum waterhammer surge pressures are determined by adding the maximum high frequency inlet pressure (filtered to 10 kHz) following valve closure to the average steady state flowing inlet pressure measurement (filtered to 100 – 1000 Hz). The pulse sequence, or duty cycle, for the single TCV tests consisted of 4 two second pulses with two seconds between pulses. This was selected to ensure steady flow through the thruster valve and to insure adequate time between pulses for the waterhammer pressure wave to dampen prior to initiation of the next pulse.
One of the major objectives for conducting this test program was to generate flight-similar data to support benchmarking of the in-house EASY5™ (MSC Software) fluid analysis models for increased fidelity towards the Critical Design Review (CDR). The closing response of the thruster valve is an important parameter required for modeling transient pressures within the propellant manifolds. For more information regarding the analytical EASY5™ FS RoCS fluid model and correlation to SDTA data, see Reference 8, “Ares I First Stage Roll Control Feedsystem Modeling: Test Data Correlation of Fluid Transients”. The relative increase in pressure due to waterhammer effects is directly proportional to the closing response time of the actuated thruster control valve. The FS RoCS flight and SDTA waterhammer models analyze the entire fluid system up to the inlet of the thruster valve, with an orifice downstream to simulate the pressure drops due to the injector and catalyst bed.
The physical time that the main poppet of the valve takes to go from the open to close position (or vice versa) after the command signal has been sent is commonly referred to as the “shuttle” time. The length of the shuttle time and the slope of the closing curve can be affected by a number of different physical phenomena such as (but not limited to):
• Friction in the shaft seal(s) • Dynamic mass • Pneumatic vs. direct solenoid actuation • Force margin • Pneumatic vent orifice size
Since the two flight-similar thruster designs used during SDTA were new valves specifically designed for the FS RoCS and not heritage designs, it was critically important to accurately measure the closing shuttle time response. Optical displacement probes were added to each stage of one of the series redundant RoCS thruster valves in order to better characterize the thruster valve shuttle time. This was accomplished by modifying the spring cap for each valve stage to allow the optical probe to both be mounted to the valve and have a view to the entire of the spring cavity. Within the spring cavity, a piece of reflective tape was attached to the top end of the main piston. Thus as the piston displaced from it’s starting position as the valve was commanded open and closed, the optical probe which was in a fixed position, would record the motion of the piston. The response of the optical probe was measured in Volts from the initial starting position (approximately 10 V) to the fully closed position (approximately 5.2 V), with the measured shuttle time and slope of the curve being the parameters of importance.
Figure 15. FS RoCS SDTA Service
Valve Panel
The highest expected surge pressures were anticipated to be at the outlet of the propellant service valves on the flight system (PSV-02 and PSV-04). A picture of the Service Valve Panel is represented in Fig 15. Within the propellant system there are two types of service valves, fill/drain, and thruster module purge valves. The service panel is located 90° around the vehicle from both thruster modules, and both the purge lines and the fill and drain lines must each travel approximately 25 feet to reach the service valves from the thruster manifold. Due to this long line length and the small line diameter of 0.25 inches, early analysis results predicted maximum system pressure surges at the service valve interfaces. In order to accurately quantify the effects of the waterhammer surge pressures at the service valves, high frequency (HFP-02, HFP-03) and low frequency pressure transducers (P-12, P-13) were mounted just downstream of the SDTA service valves.
American Institute of Aeronautics and Astronautics
22

American Institute of Aeronautics and Astronautics
23
E. Mission Duty Cycle Testing The waterhammer test series explored one portion of the fluid system response, primarily the effects of rapid
thruster valve cycling at high pressures within the propellant system. In order to assess the overall system performance a series of tests were conducted that simulated anticipated mission profiles over the entire operation of the flight design and are referred to as Mission Duty Cycle (MDC) tests.
The primary valve sequence used for the MDC tests was a modified version of a nominal flight FS RoCS trajectory generated by the NASA Guidance, Navigation, and Control (GN&C) group. The flight sequence consists of a long initial pulse (5-45 seconds) to orient the Ares I vehicle towards the International Space Station, followed by a series of short pulses (0.3 – 2 seconds) to provide roll control for any roll torques generated during the remaining 132 second FS mission. This sequence was modified for SDTA testing to consist of a 40 second pulse, followed by a series of shorter, 1.3 second pulses, until 132 seconds is reached. The pulses were scaled to deplete the SDTA COPV water tanks over the course of each MDC test. To accurately simulate the performance of the full flight pressurization system (in which two thruster modules are being operated simultaneously), SPU valves are cycled in conjunction with the thruster valves. Depending on the demand of the specific test, one, two, or three SPU valves are operated to simulate two, four, or six thrusters firing. A summarized set of parameters varied during MDC testing, as well as the nominal flight design points are provided below in Table 9. The complete series of MDC tests and duty cycles used are represented below in Table 10. In addition to the nominal duty cycle, various alternate valve sequences were also used, including:
• “Half-system” in which only two of the GHe COPVs were used and only two thruster valves were operated without the use of any SPU valves, closely approximately the volumes and demand of half of the flight system
• Intermediate usage cycle used to analyze the effects of longer off times • Contingency scenarios which simulated the operation of six thrusters firing (see Contingency
Testing below) • SPU-lead sequences in which a twenty or fifty second two-SPU valve lead was used to generate
lower GHe COPV temperatures due to increased flight propellant tank ullages (Phase II)
The focus of MDC testing was to characterize the following parameters: • Regulator blowdown and propellant ullage performance • Temperature transients and heat transfer in the pressurization system • Pressurant and pneumatic system interactions at high peak demands • Temperature effects in the pneumatic system • System pressure drops
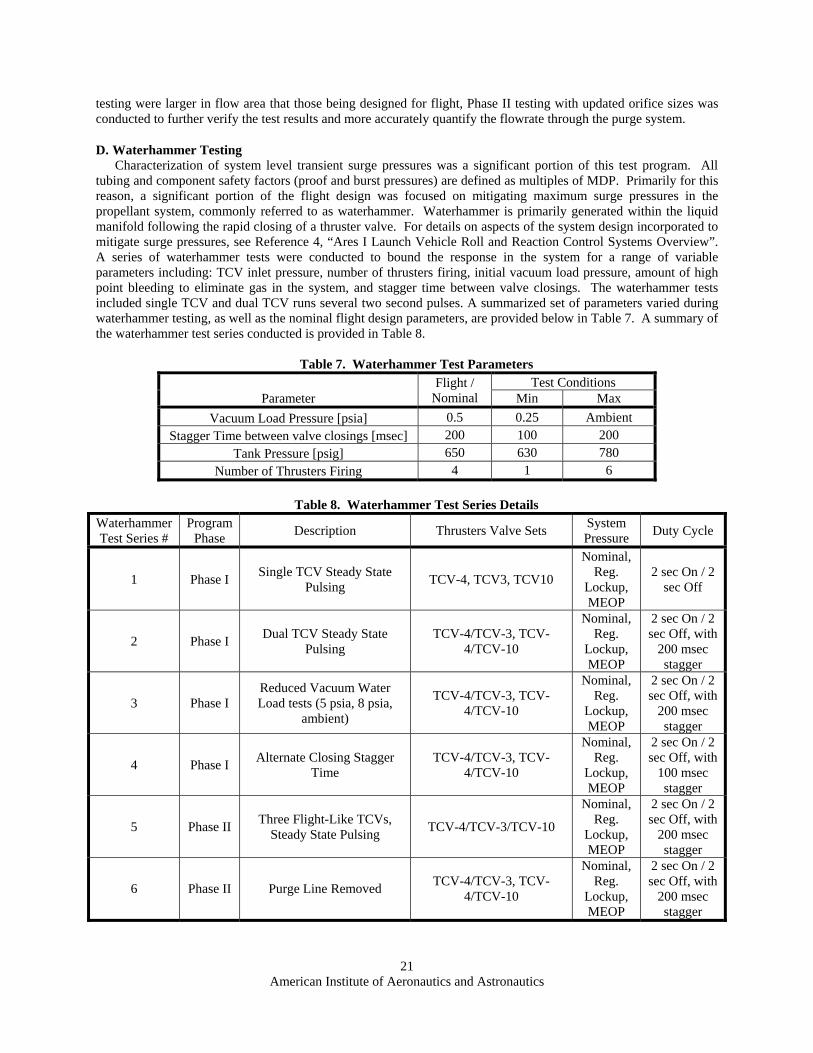
FS RoCS ADH Regulators
15” Thermocouple
probes to measure internal gas temperature
High Pressure GHe Isolation
Valves
Insulated GHe Composite
Overwrapped Pressure Vessels
Figure 16. FS RoCS SDTA Pressurization System Details (Phase I)
In addition to integrated response characterization of the FS RoCS development thruster valves, the FS RoCS
development GHe pressure regulators were also critical components for developing end-to-end performance data. A picture of the pressurization system is shown above in Fig 16. The GHe COPVs were tested with and without external insulation indicative of the intended flight insulation. Schedule availability determined whether tests included COPV insulation, due to the relatively long time required to fill the GHe COPVs within the temperature constraints (~8 hours with insulation as opposed to ~2 hours without). All of the pressurant lines and water tanks were insulated throughout the test program.
Table 9. Mission Duty Cycle Test Parameters
Parameter Flight /
Nominal Test Conditions
Min Max GHe COPV Load Pressure [psig] 4500 2500 4500 GHe COPV End Pressure [psig] 1500 800 3200
GHe Start Temperature [oF] 90 80 120 Water Tank Ullage – Starting [%] 3 1 10
Pad Pressure [psig] 100 Ambient 650 Number of Thrusters Firing 4 1 6
American Institute of Aeronautics and Astronautics
24

American Institute of Aeronautics and Astronautics
25
Table 10. Mission Duty Cycle Test Series Details MDC Test
Series
Program Phase Description GHe
Regulation
Water Tank Starting
Ullage Range
GHe COPV Start P Range
[psig]
1 Phase I Duty Cycle #6* simulating four thrusters firing, insulated GHe
COPVs
ADH Regulator 1 3% 4500
2 Phase I Duty Cycle #6* simulating four thrusters firing
ADH Regulator 2 1 - 10% 2500 - 4500
3 Phase I Duty Cycle #6* simulating four thrusters firing
ADH Regulator 3 1 - 10% 2500 - 4500
4 Phase I Duty Cycle #10† simulating six thrusters firing
ADH Regulator 2 3 - 10% 2500 - 4500
5 Phase I Duty Cycle #10† simulating six thrusters firing
ADH Regulator 3 3 - 10% 2500 - 4500
6 Phase I
“Half-System” tests, Duty Cycle #6a‡ simulating two thrusters firing, and half of flight system volume using
two GHe COPVs
ADH Regulator 2 3% 3700 - 4500
7 Phase I
“Half-System” tests, Duty Cycle #6a‡ simulating two thrusters firing, and half of flight system volume using
two GHe COPVs
ADH Regulator 3 3% 3700 - 4500
8 Phase I Intermediate Usage – Four thrusters, using about half of the water load.
Duty Cycle #6b§
ADH Regulator 2 0% 3700
9 Phase I Intermediate Usage – Six thrusters, using about half of the water load.
Duty Cycle #6c°
ADH Regulator 2 0% 3700
10 Phase II Duty Cycle #6* simulating four thrusters firing, with 20 sec SPU valve lead to chill GHe COPVs
ADH Regulator 2 3% 4025
11 Phase II Duty Cycle #6* simulating four thrusters firing, with 50 sec SPU valve lead to chill GHe COPVs
ADH Regulator 2 3% 4025
* Duty Cycle #6: Two TCV's + two SPU valves @ 40/0.3 + 40.2/0.1 sec on/off, then 30 pulses @ 1.1/2.0 + 1.3/1.8 sec on/off, until water tank depletion
† Duty Cycle #10: Three TCV's + three SPU valves @ 40/0.5 + 40.2/0.3 + 40.4/0.1 sec on/off, then 30 pulses @ 1.1/2.0 + 1.3/1.8 sec + 1.5/1.6 sec on/off, until water tank depletion
‡ Duty Cycle #6a: Two TCV's @ 40/0.3 + 40.2/0.1 sec on/off, then 30 pulses @ 1.1/2.0 + 1.3/1.8 sec on/off, until water tank depletion § Duty Cycle #6b: Two TCV's + two SPU valves @ 40/0.3 + 40.2/0.1 sec on/off, then 10 pulses @ 1.0/10 + 1.2/10 sec on/off ° Duty Cycle #10a: Three TCV's + three SPU valves @ 40/0.5 + 40.2/0.3 + 40.4/0.1 sec on/off, then 10 pulses @ 1.0/10 + 1.2/10 sec +
1.4/10 sec on/off
F. Contingency Scenario Testing Contingency scenarios are low probability events that are outside of the nominal range of expected conditions.
A summary of the contingency scenario test series is provided in Table 11. Four types of contingency scenarios were tested:
• Simulated demand of six thrusters firing (instead of four) – Low probability scenario predicted by GN&C Monte Carlo mission analyses in which and additional two more are needed to maintain the Ares I within predefined roll rate margins.
• Alternate stagger (shorter) time waterhammer tests – Assessment of system pressure response if thruster valves are inadvertently commanded or experience a failure in which the staggered closing time between two thrusters in one module are less than 200 msec.
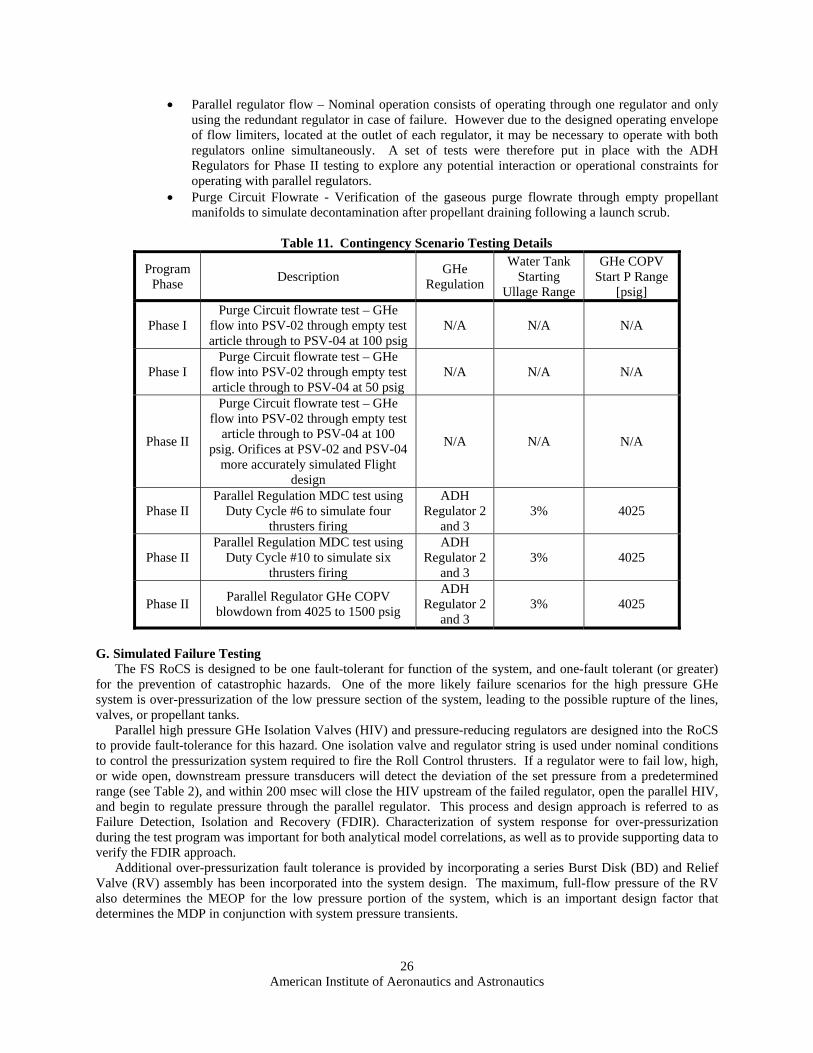
American Institute of Aeronautics and Astronautics
26
• Parallel regulator flow – Nominal operation consists of operating through one regulator and only using the redundant regulator in case of failure. However due to the designed operating envelope of flow limiters, located at the outlet of each regulator, it may be necessary to operate with both regulators online simultaneously. A set of tests were therefore put in place with the ADH Regulators for Phase II testing to explore any potential interaction or operational constraints for operating with parallel regulators.
• Purge Circuit Flowrate - Verification of the gaseous purge flowrate through empty propellant manifolds to simulate decontamination after propellant draining following a launch scrub.
Table 11. Contingency Scenario Testing Details
Program Phase Description GHe
Regulation
Water Tank Starting
Ullage Range
GHe COPV Start P Range
[psig]
Phase I Purge Circuit flowrate test – GHe
flow into PSV-02 through empty test article through to PSV-04 at 100 psig
N/A N/A N/A
Phase I Purge Circuit flowrate test – GHe
flow into PSV-02 through empty test article through to PSV-04 at 50 psig
N/A N/A N/A
Phase II
Purge Circuit flowrate test – GHe flow into PSV-02 through empty test
article through to PSV-04 at 100 psig. Orifices at PSV-02 and PSV-04
more accurately simulated Flight design
N/A N/A N/A
Phase II Parallel Regulation MDC test using
Duty Cycle #6 to simulate four thrusters firing
ADH Regulator 2
and 3 3% 4025
Phase II Parallel Regulation MDC test using
Duty Cycle #10 to simulate six thrusters firing
ADH Regulator 2
and 3 3% 4025
Phase II Parallel Regulator GHe COPV blowdown from 4025 to 1500 psig
ADH Regulator 2
and 3 3% 4025
G. Simulated Failure Testing The FS RoCS is designed to be one fault-tolerant for function of the system, and one-fault tolerant (or greater)
for the prevention of catastrophic hazards. One of the more likely failure scenarios for the high pressure GHe system is over-pressurization of the low pressure section of the system, leading to the possible rupture of the lines, valves, or propellant tanks.
Parallel high pressure GHe Isolation Valves (HIV) and pressure-reducing regulators are designed into the RoCS to provide fault-tolerance for this hazard. One isolation valve and regulator string is used under nominal conditions to control the pressurization system required to fire the Roll Control thrusters. If a regulator were to fail low, high, or wide open, downstream pressure transducers will detect the deviation of the set pressure from a predetermined range (see Table 2), and within 200 msec will close the HIV upstream of the failed regulator, open the parallel HIV, and begin to regulate pressure through the parallel regulator. This process and design approach is referred to as Failure Detection, Isolation and Recovery (FDIR). Characterization of system response for over-pressurization during the test program was important for both analytical model correlations, as well as to provide supporting data to verify the FDIR approach.
Additional over-pressurization fault tolerance is provided by incorporating a series Burst Disk (BD) and Relief Valve (RV) assembly has been incorporated into the system design. The maximum, full-flow pressure of the RV also determines the MEOP for the low pressure portion of the system, which is an important design factor that determines the MDP in conjunction with system pressure transients.

American Institute of Aeronautics and Astronautics
27
A facility regulated supply was used to simulate the wide-open failure of a regulator. The facility supply is tied into the test article downstream of the SDTA regulators at the service valve HSV-02. The initial RV which had been used for the majority of testing has a set pressure of 1100 psig ± 10%. This RV was replaced with a second RV, set at the intended flight MEOP value of 778 psig ± 10%. Multiple automated valve sequences were used to simulate a regulator failure. The first sequence consisted of the simulated nominal firing of four thrusters in a 20 second steady state pulse, with regulated pressurant supply coming from one of the SDTA regulators. Prior to the test the facility regulator (ROR-301) was set to a pressure higher than MEOP (~1000 psig) and isolated from the rest of the test article via an additional isolation valve (ROV-304). A the midway point of the steady state pulse, the facility isolation valve was opened, exposing the system to elevated pressures, locking up the SDTA regulator, quickly (~20 msec) exceeding the minimum cracking pressure of the RV. The facility isolation valve would close after a short duration and the SDTA regulator would again begin to regulate after the outlet pressure dropped back into the operating regulation band. The second automated pulse sequence used was similar in the initiation of facility regulation, but utilized 10 shorter pulses with the simulated over-pressurization again occurring the middle of the sequence. Details of the simulated failure test series is provided in Table 12.
Table 12. Simulated Failure Testing Details
Test Series
Program Phase Description GHe
Regulation
Water Tank Starting Ullage Range
GHe COPV Start P Range
[psig]
1 Phase I
Simulated Regulator Failure – Single 10 sec pulse simulating four thrusters firing.
Midway through pulse regulation is switched from ADH Regulator #3 to #2
ADH Regulator 2
and 3 3% 2500
2 Phase I
Simulated Regulator Failure – Ten 1 sec on / 0.5 sec off pulses simulating four thrusters firing. Following 5th pulse
regulation is switched from ADH Regulator #3 to #2
ADH Regulator 2
and 3 3% 2500
3 Phase I
Simulated Regulator Failure - Single 10 sec pulse simulating four thrusters firing.
Midway through pulse regulation is switched from ADH Regulator #3 to
facility regulator set at MEOP
ADH Regulator 3 and Facility Regulator
3% 2500
4 Phase I
Gross Pneumatic Leakage – Duty Cycle #6 simulating 4 thrusters firing, while simulating the leakage of a broken ¼”
pneumatic line
ADH Regulator 2 3% 4500
5 Phase II Simulated Regulator Failure – No
thruster flow, simulate overpressure with small ullage volumes
Facility Regulator 3 - 10% N/A
6 Phase II
Simulated Regulator Failure - Duty Cycle #6 simulating four thrusters firing.
Midway through initial 40 sec pulse regulation is switched from ADH
Regulator #3 to facility regulator set at MEOP
ADH Regulator 3 and Facility Regulator
3% 4025
7 Phase II
Gross Pneumatic Leakage – Duty Cycle #6 simulating 4 thrusters firing, while simulating the leakage of a stuck open
thruster pilot valve
ADH Regulator 3 3% 4025

American Institute of Aeronautics and Astronautics
28
IV. Conclusion The Ares I FS RoCS SDTA cold-flow test program was conducted to simulate the fluid dynamics of the system
using flight-similar pressurant and propellant manifolding, valving, tankage, and flight-like pressure regulators and thruster valves. Phase I of the test program reflected the flight system design as of spring 2009, which was followed by Phase II testing using an updated thruster module manifold design, in addition to minor layout and instrumentation updates. A series of waterhammer tests were formulated to assess the transient response within the system across a range of operating conditions and setups. Mission Duty Cycle tests were performed to assess the integrated end-to-end performance of the combined pressurization and propellant systems. Finally contingency and simulated failure scenario tests were formulated to envelope the response and performance of the FS RoCS under the maximum and minimum ranges of possible operating conditions.
The results from Phase I, and preliminary results from Phase II testing, indicate that all stated test objectives were successfully fulfilled. Significant data was collected to benchmark analytical fluid models, provide insight into the function and design requirements for components such as the thruster valve and regulator, and refine planned operating procedures for the flight system.6,8 In addition, no major results were identified to invalidate the system design approach. Results, procedures, and correlations from the SDTA program will be used for refining the flight design towards CDR, and also for final system qualification as part of the RoCS Hot Fire Test Article (HFTA) program. This program is currently scheduled for testing in 2012 at the NASA White Sands Test Facility outside of Las Cruces, New Mexico.
Acknowledgments The authors gratefully acknowledge the assistance and support of Mr. Pat McRight, Mr. Chuck Pierce, and
Alicia Turpin, Branch Chief, Deputy Branch Chief, and Team Lead of the NASA MSFC Spacecraft and Auxiliary Propulsion Systems Branch (ER23). Additionally, the support of Mr. Kevin Ward and Mr. Jim Richard, Branch Chief and Deputy Branch Chief of the NASA MSFC Valves, Actuators & Ducts Design and Development Branch (ER33), and Ares I RCS Program Manager, Phil Best, was gratefully appreciated. Support for the design, testing, and analysis of results by Miranda Holton was also greatly appreciated. The support of Ben Stein is also greatly appreciated for the review of this document. Finally, the authors would like to recognize the FS RoCS SDTA test crew of John Wiley, Ken Ashcraft, Kent Gatlin, Nick Case and the rest of the folks at CDA for all of their dedication, hard work, and provided support in completing the test program.
References 1Butt, A., Holt, K. A., Popp, C. G., Wiley, J. T., Stein, W. B., Pitts, H. M., “NASA Ares I First Stage Roll Control System
Cold Flow Development Test Program Results”, 57th Joint Army, Navy, NASA, Air Force Interagency Propulsion Meeting, JANNAF-1371, Johns Hopkins University, Chemical Propulsion Information Analysis Center, Baltimore, MD, May 2010.
2Pierce, C. W., “First Stage Roll Control System Subsystem Description Document”, National Aeronautics and Space Administration, Ares-USO-DE-25169, 2008.
3Turpin, A. A., “First Stage Roll Control System Subsystem Design Specification”, National Aeronautics and Space Administration, Ares-USO-SE-25719, 2008.
4Butt, A., Popp, C. G., Pitts, H. M., and Sharp, D. J., “NASA Ares I Launch Vehicle Roll and Reaction Control Systems Overview”, Joint Army, Navy, NASA, Air Force Interagency Propulsion Meeting, JANNAF-SPS-I-17, Johns Hopkins University, Chemical Propulsion Information Analysis Center, Baltimore, MD, December 2008.
5Butt, A., Popp, C. G., Pitts, H. M., and Sharp, D. J., “NASA Ares I Launch Vehicle Roll and Reaction Control Systems Design Status”, 45th AIAA/ASME/SAE/ASEE Joint Propulsion Conference & Exhibit, AIAA 2009-5130, Reston, VA, August 2009.
6Butt, A., “First Stage Roll Control System: System Level Cold Flow Development Test Plan”, National Aeronautics and Space Administration, RCS-PLAN-DTP-029, 2009.
7Wiley, J. T., Case, N. L., “Test Procedure for Ares I First Stage Roll Control System Development Test Article”, National Aeronautics and Space Administration, ER33-TP-081, 2009.
8Holton, M. L., and Holt, K. A., “Ares I First Stage Roll Control Feedsystem Modeling: Test Data Correlation of Fluid Transients”, 57th Joint Army, Navy, NASA, Air Force Interagency Propulsion Meeting, JANNAF-1157, Johns Hopkins University, Chemical Propulsion Information Analysis Center, Baltimore, MD, May 2010.