NASA Activities in Risk Assessment Activities in Risk ... Program and project decisions shall be...
28
1 NASA Activities in Risk Assessment NASA Project Management Conference March 30-31, 2004 NASA Activities in Risk Assessment NASA Project Management Conference March 30-31, 2004 Michael G. Stamatelatos, Ph.D.,Director Safety and Assurance Requirements Division Office of Safety and Mission Assurance NASA Headquarters
-
Upload
truongmien -
Category
Documents
-
view
216 -
download
2
Transcript of NASA Activities in Risk Assessment Activities in Risk ... Program and project decisions shall be...
1
NASA Activities in Risk Assessment
NASA Project Management Conference
March 30-31, 2004
NASA Activities in Risk Assessment
NASA Project Management Conference
March 30-31, 2004
Michael G. Stamatelatos, Ph.D.,DirectorSafety and Assurance Requirements DivisionOffice of Safety and Mission AssuranceNASA Headquarters
2
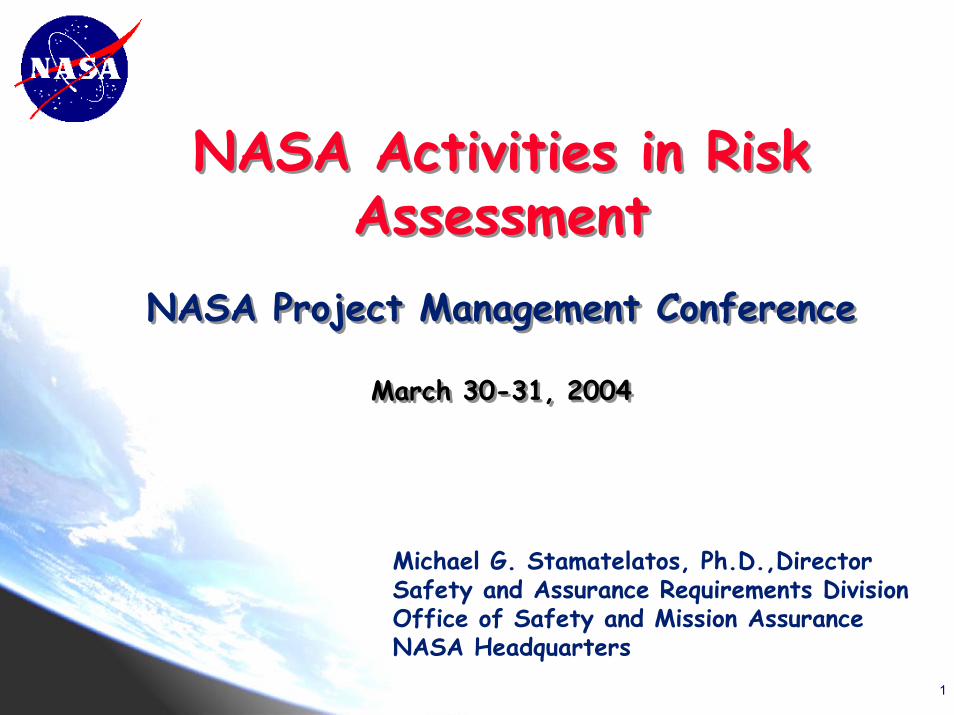
NASA is a Pioneer and a Leader in Space; Therefore Its Business Is Inherently Risky
International Space StationSafe assembly and operation
Space TransportationSpace Shuttle Orbital Space Plane

3
Our Goal
Improve risk awareness in the AgencyConduct PRA training for line and project managers and for personnel
Develop a corps of in-house PRA expertsTransition PRA from a curiosity object to baseline method for integrated system safety, reliability and risk assessmentAdopt organization-wide risk informed culture
PRA to become a way of life for safety and technical performance improvement and for cost reductionImplement risk-informed management process

4
Probabilistic Risk Assessment (PRA)Answers Three Basic Questions
Risk is a set of triplets that answer the questions:
1) What can go wrong? (accident scenarios)
2) How likely is it? (probabilities)
3) What are the consequences? (adverse effects)
Kaplan & Garrick, Risk Analysis, 1981
InitiatingEvent
Selection
EventSequence
LogicDevelopment
EventSequenceModeling
EventSequenceFrequencyEvaluation
ConsequenceModeling
RiskIntegration
2. How frequently does it happen?(Scenario frequency quantification)
1. What can go wrong?(Definition of scenarios) 3. What are the consequences?
(Scenario consequence quantification)
Risk statement
PRA Insights
Decision Support
PRA is generally used for low-probability and high-consequence events

5
Relationship Between Risk Managementand Probabilistic Risk Assessment (PRA)
MethodContinuous Risk Management Technique Application
QualitativeRisk
Assessment
QualitativeRisk
Assessment
ProbabilisticRisk
Assessment
ProbabilisticRisk
Assessment Actuarial/StatisticalAnalyses
Actuarial/StatisticalAnalyses
FMEA.MLD,ESD,ETA,FTA,RBD
FMEA.MLD,ESD,ETA,FTA,RBD
DecisionAnalysis
DecisionAnalysis
TechnicalRisk
and/or
ProgramRisk
TechnicalRisk
and/or
ProgramRisk
Legend:FMEA - Failure Modes & Effects AnalysisMLD - Master Logic DiagramESD - Event Sequence DiagramETA - Event Tree AnalysisFTA - Fault Tree AnalysisRBD - Reliability Block Diagram
ManagementSystem
ManagementSystem

6
NASA Risk Management and Assessment Requirements
• NPG 7120.5A, NASA Program and Project Management Processes and Requirements
The program or project manager shall apply risk management principles as a decision-making tool which enables programmatic and technical success.Program and project decisions shall be made on the basis of an orderly risk management effort.Risk management includes identification, assessment, mitigation,and disposition of risk throughout the PAPAC (Provide Aerospace Products And Capabilities) process.
• NPG 8000.4, Risk Management Procedures and GuidelinesProvides additional information for applying risk management as required by NPG 7120.5A.
• NPG 8705.x (draft) PRA Application Procedures and GuidelinesProvides guidelines on how to apply PRA to NASA’s diversified programs and projects
7
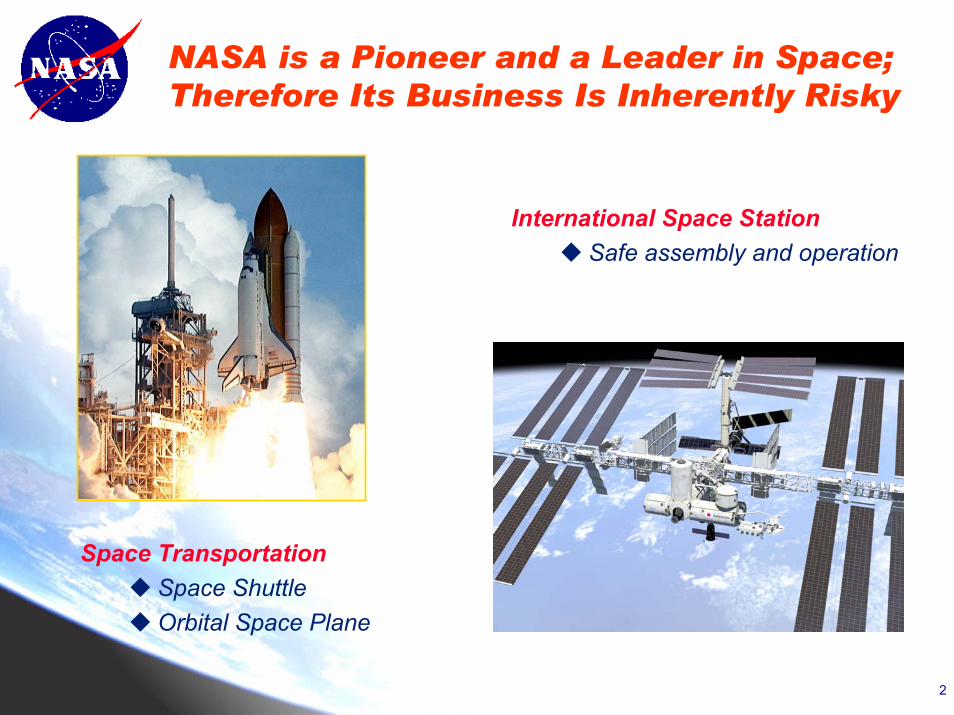
How Does PRA Help Safety?
Provides a basis for risk reduction through:
1. Accident/Mishap Prevention (best)2. Accident/Mishap Consequence Mitigation
Adverse Eventin a Sequence
Prevention Mitigation

8
The Concept of an Accident Scenario
PIVOTAL EVENTS
PivotalEvent 1 End StateIE
Detrimentalconsequence ofinterest(Quantity of interesetto decision-maker)
The perturbation MitigativeAggrevative
PivotalEvent n
Risk Scenario is a string of events that (if they occur) will lead to an undesired end state.

9
Exact vs. Uncertain Probabilities
Uncertainty distributionof probability values
Prob
abili
ty
Exactlyknown
probabilityvalue
Prob
abili
ty
A narrower range means a moreprecise knowledge of the distribution,
or less uncertainty
10
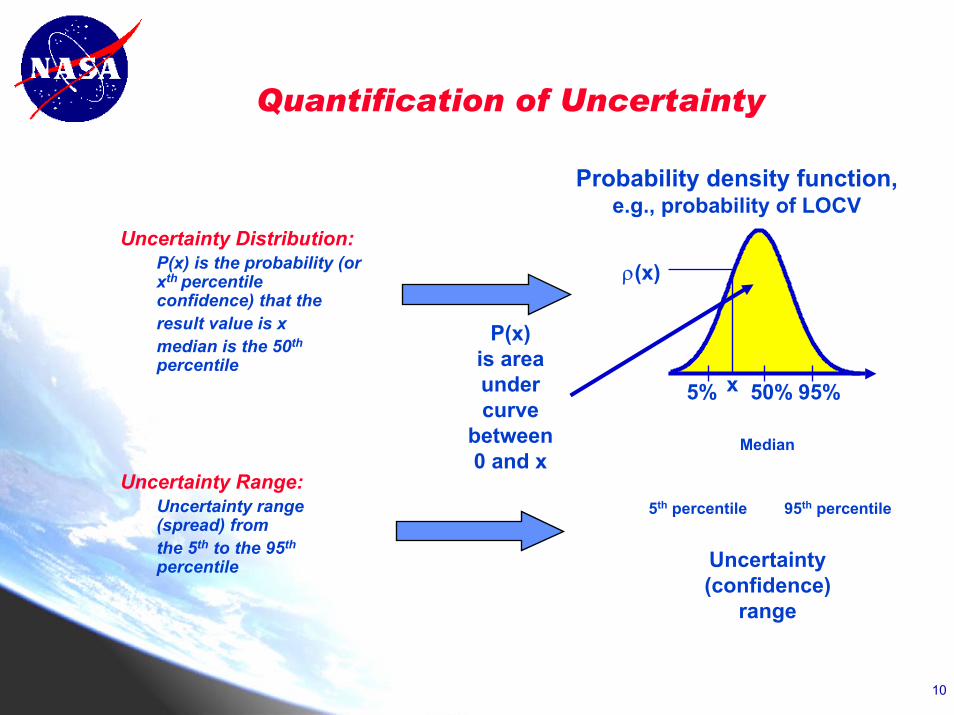
Quantification of Uncertainty
Probability density function,e.g., probability of LOCV
ρ(x)
5% 95%50%x
Uncertainty Distribution:P(x) is the probability (or xth percentile confidence) that theresult value is xmedian is the 50th
percentile
Uncertainty Range:Uncertainty range (spread) fromthe 5th to the 95th
percentile
P(x)is areaundercurve
between0 and x
Median
Uncertainty(confidence)
range
5th percentile 95th percentile

11
Event- and Fault-Tree Scenario Modeling
Hydrazine leaks Leak detected Leak isolatedNo damage toflight critical
avionics
No damage toscientific
equipmentEnd state
OK
Loss of science
Loss ofSpacecraft
Loss ofSpacecraft
OK
Loss of science
Loss ofSpacecraft
OK
Loss of science
Leak not detected
Presuretransducer 1
fails
P1
Presuretransducer 2
fails
P2
Controller fails
CN
common causefailure of P.transducers
PP
IE LD LI A S
Fault tree Event tree
distribution

12
PRA Methodology Synopsis
Event Tree (Inductive Logic)
IE B C D E EndState
1: OK
2: ES1
3: ES2
4: ES2
5: ES2
6: ES2
A
Event Sequence Diagram (Logic)Master Logic Diagram (Hierarchical Logic)
One to Many Mapping of an ET-defined Scenario
Internal initiating eventsExternal initiating eventsHardware componentsHuman errorSoftware errorCommon causeEnvironmental conditionsOther
Fault Tree (Logic)
Not A
Link to another fault tree
0.01 0.02 0.03 0.04102030405060
0.02 0.04 0.06 0.08
51015202530
0.02 0.04 0.06 0.08
1020304050
Probabilistic Treatment of Basic Events
one or moreof these
elementaryevents
One of these events
The uncertainty in occurrence of an event ischaracterized by a probability distribution
Examples (from left to right):Probability that the hardware x fails when neededProbability that the crew fail to perform a taskProbability that there would be a windy condition at the time of landing
Model Integration and Quantification of Risk Scenarios
Integration and quantification oflogic structures (ETs and FTs)and propagation of epistemicuncertainties to obtain
minimal cutsets (riskscenarios in terms ofbasic events)likelihood of riskscenariosuncertainty in thelikelihood estimates
0.01 0.02 0.03 0.04 0.05
20
40
60
80
100
End State: ES1
End State: ES2
Risk Results and Insights
Displaying the results in tabular and graphical formsRanking of risk scenariosRanking of individual events (e.g., hardware failure,human errors, etc.)Insights into how various systems interactTabulation of all the assumptionsIdentification of key parameters that greatlyinfluence the resultsPresenting results of sensitivity studies
Basic EventLogic Gate
End State: ES2
End State: ES1
End State: ES2
Inputs to Decision Making Process
AND
NEW STRUCTURE
IE End State: OK
End State: ES1
End State: ES2
End State: ES2
A B
C D E
LOG
IC M
OD
ELIN
GPR
OB
AB
ILIS
TIC
13
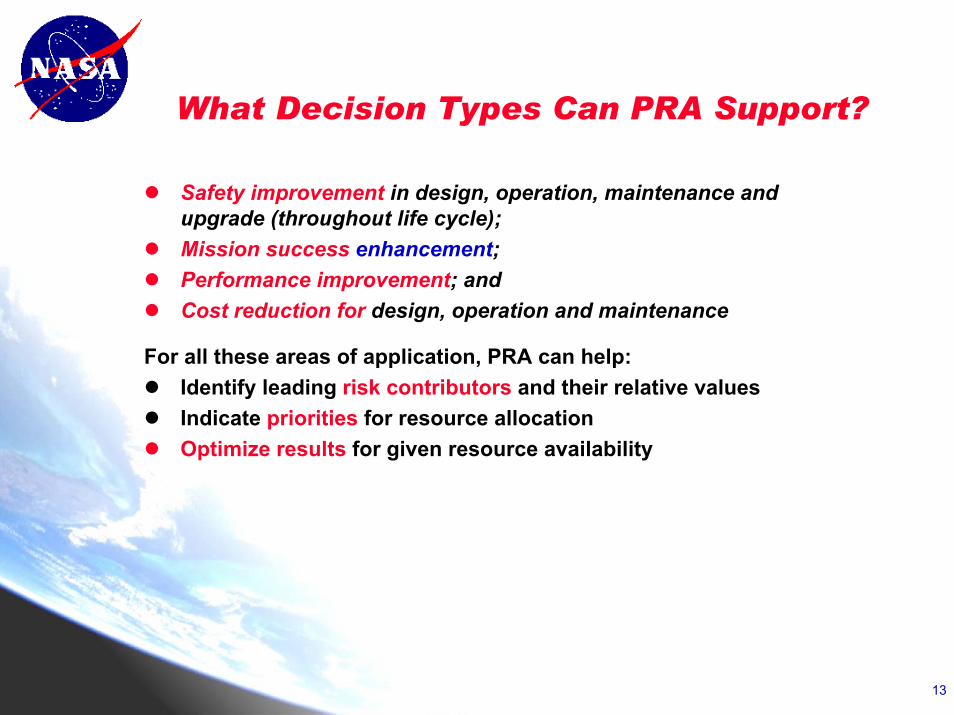
What Decision Types Can PRA Support?
Safety improvement in design, operation, maintenance and upgrade (throughout life cycle);Mission success enhancement;Performance improvement; andCost reduction for design, operation and maintenance
For all these areas of application, PRA can help:Identify leading risk contributors and their relative valuesIndicate priorities for resource allocationOptimize results for given resource availability
14
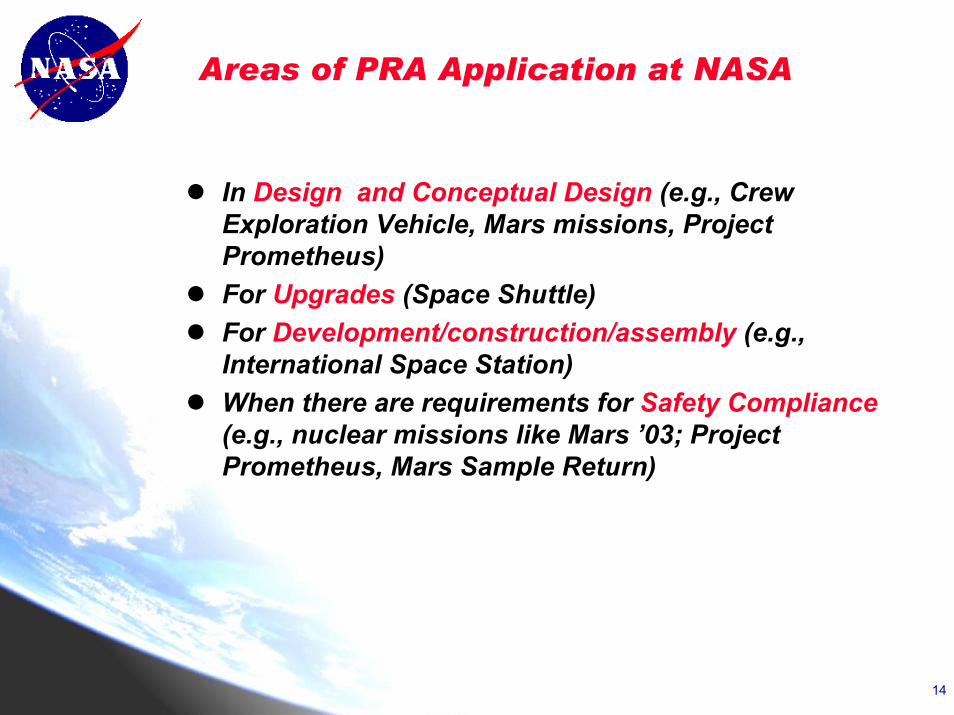
Areas of PRA Application at NASA
In Design and Conceptual Design (e.g., Crew Exploration Vehicle, Mars missions, Project Prometheus)For Upgrades (Space Shuttle)For Development/construction/assembly (e.g., International Space Station)When there are requirements for Safety Compliance(e.g., nuclear missions like Mars ’03; Project Prometheus, Mars Sample Return)
15
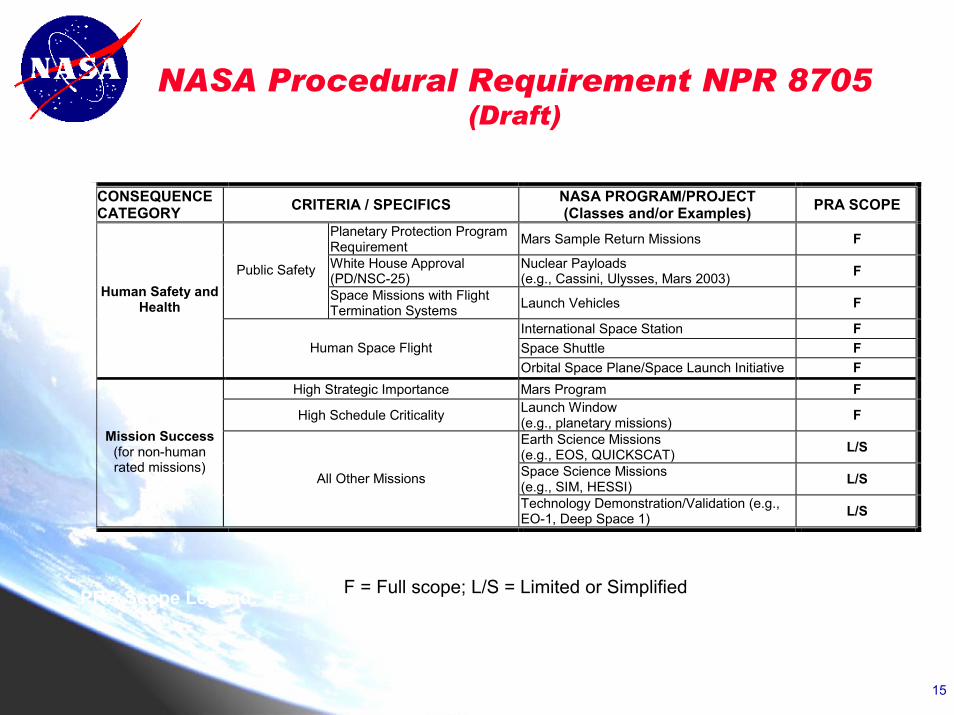
NASA Procedural Requirement NPR 8705 (Draft)
CONSEQUENCE CATEGORY CRITERIA / SPECIFICS NASA PROGRAM/PROJECT
(Classes and/or Examples) PRA SCOPE Planetary Protection Program Requirement Mars Sample Return Missions F
White House Approval (PD/NSC-25)
Nuclear Payloads (e.g., Cassini, Ulysses, Mars 2003) F Public Safety
Space Missions with Flight Termination Systems Launch Vehicles F
International Space Station F Space Shuttle F
Human Safety and Health
Human Space Flight Orbital Space Plane/Space Launch Initiative F
High Strategic Importance Mars Program F
High Schedule Criticality Launch Window (e.g., planetary missions) F
Earth Science Missions (e.g., EOS, QUICKSCAT) L/S
Space Science Missions (e.g., SIM, HESSI) L/S
Mission Success (for non-human rated missions)
All Other Missions
Technology Demonstration/Validation (e.g., EO-1, Deep Space 1) L/S
PRA Scope Legend: F = Full scope; L = Limited scope; S = Simplified PRAF = Full scope; L/S = Limited or Simplified

16
NASA Special PRA Methodology Needs
Broad range of programs: Conceptual non-human rated science projects; Multi-stage design and construction of the International Space Station; Upgrades of the Space ShuttleRisk initiators that vary drastically with type of programUnique design and operating environments (e.g., microgravity effects on equipment and humans)Multi-phase approach in some scenario developmentsUnique external events (e.g., micro-meteoroids and orbital debris)Unique types of adverse consequences (e.g., fatigue and illness in space) and associated databasesDifferent quantitative methods for human reliability (e.g., astronauts vs. other operating personnel)Quantitative methods for software reliability
17
Space Shuttle Probabilistic
Risk Assessment

18
t ~ 150kft)
TAL
ASCENT completesORBIT completes
ENTRY completes
TIG-5
APU Shutdown
SSME startAPU start
STS Nominal Mission Profile

19
Current Shuttle PRA Results for LOCV(provisional)
0
100
0.00 0.01 0.02 0.03 0.04 0.05
Number of Missions
Prob
abili
ty D
ensi
ty
Func
tion
median = 1 in 123
mean = 1 in 76
95th percentile = 1 in 23
5th percentile = 1 in 617
1/500 truncated
1/100 1/50 1/33 1/25 1/20
1/25
1/25
20
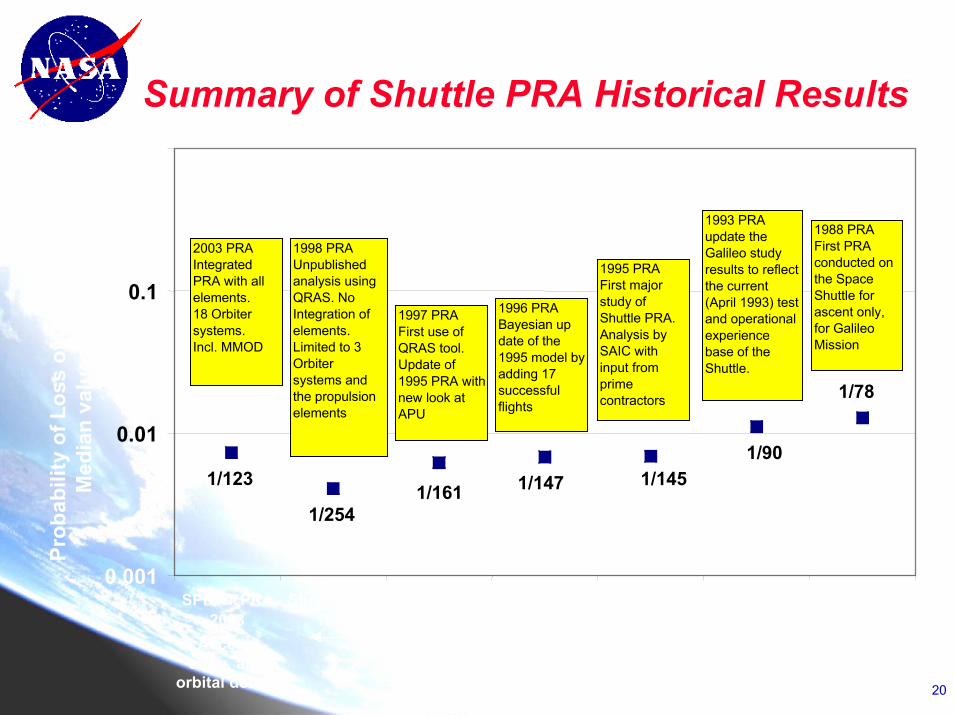
Summary of Shuttle PRA Historical Results
1/78
1/901/1451/1471/161
1/245
0.001
0.01
0.1
SPRAT PRA2003
Shuttle PRA1998
Shuttle PRA1997
Shuttle PRA1996
Shuttle PRA1995
Phase 1 -1993 (Ascent
only)
Galileo 1988(Ascentonly)
Prob
abili
ty o
f Los
s of
Cre
w a
nd V
ehic
le
Med
ian
valu
es (l
og s
cale
)
2003 PRAIntegrated PRA with all elements.18 Orbiter systems.Incl. MMOD
1998 PRAUnpublished analysis using QRAS. No Integration of elements. Limited to 3 Orbiter systems and the propulsion elements
1997 PRAFirst use of QRAS tool. Update of 1995 PRA with new look at APU
1996 PRABayesian up date of the 1995 model by adding 17 successful flights
1995 PRAFirst major study of Shuttle PRA. Analysis by SAIC with input from prime contractors
1993 PRAupdate the Galileo study results to reflect the current (April 1993) test and operational experience base of the Shuttle.
1988 PRAFirst PRA conducted on the Space Shuttle for ascent only, for Galileo Mission
Ascent and entry onlyAscent,entry, and
orbital debris
1/2541/2451/123

21
Annual Voluntary Risks in Some Sports -Comparable in Magnitude to Shuttle Risk
Professional stunting 1/100Dedicated mountain climbing 1/167Air show/air racing and acrobatics 1/200Amateur flying in home-built aircraft 1/333Experienced whitewater boating 1/370Sport parachuting 1/500
Source: R. Wilson and E. Crouch,Risk-Benefit Analysis,Harvard University Press, 2001
22
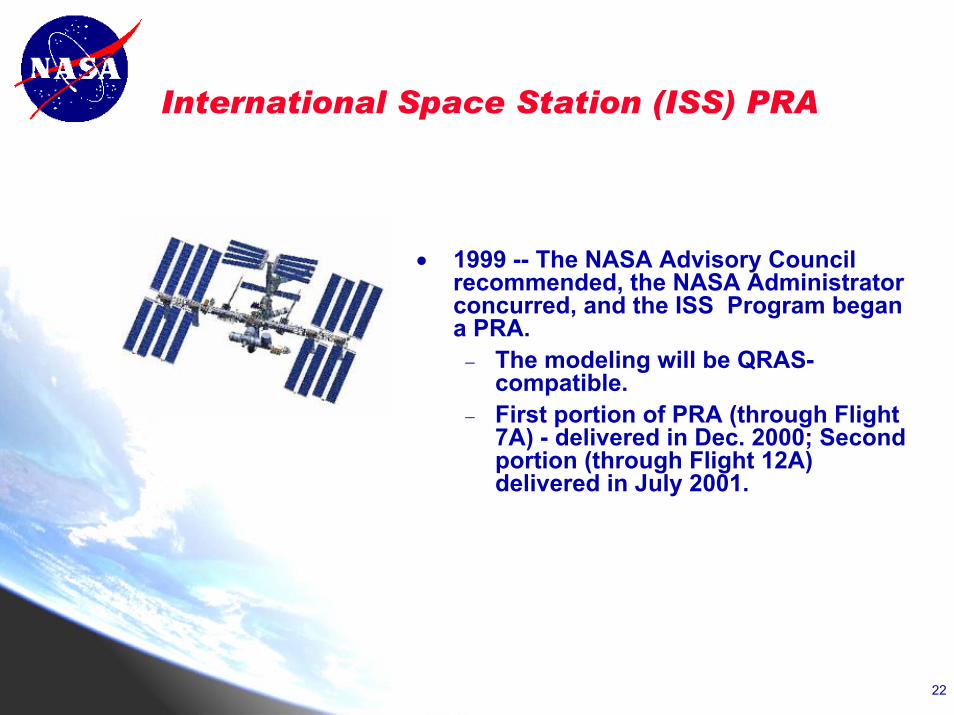
International Space Station (ISS) PRA
• 1999 -- The NASA Advisory Council recommended, the NASA Administrator concurred, and the ISS Program began a PRA. − The modeling will be QRAS-
compatible.− First portion of PRA (through Flight
7A) - delivered in Dec. 2000; Second portion (through Flight 12A) delivered in July 2001.
23

24
Important ISS PRA Findings
MMOD: lead contributor to loss of station (LOS) risk
Illness in space: lead contributor to loss of crew (LOC) risk
25
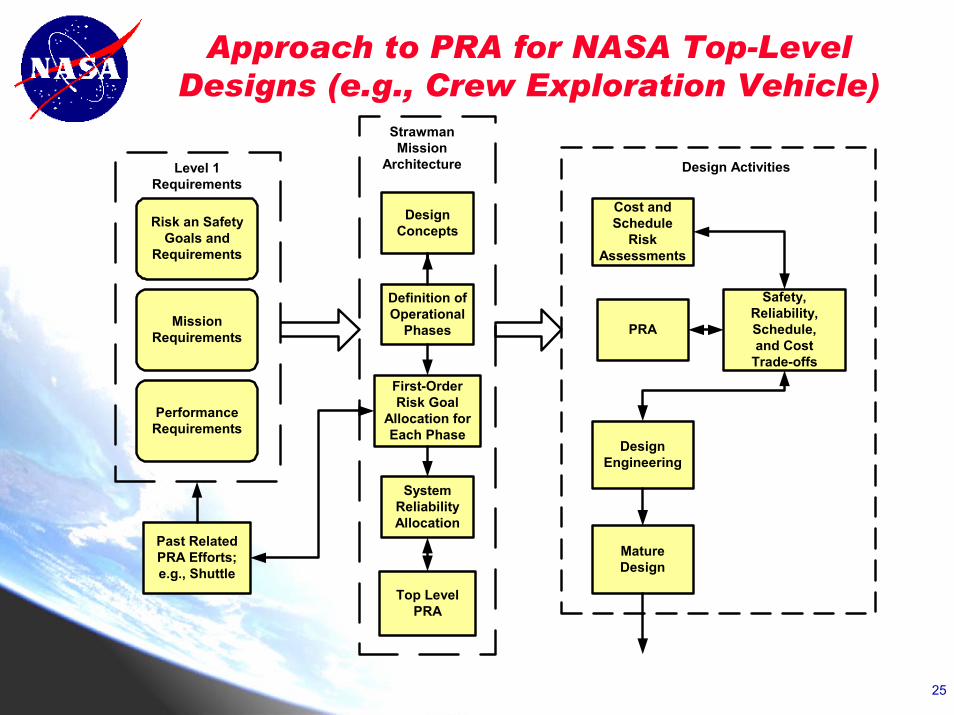
Approach to PRA for NASA Top-Level Designs (e.g., Crew Exploration Vehicle)
MissionRequirements
PerformanceRequirements
Risk an SafetyGoals and
Requirements
Level 1Requirements
StrawmanMission
Architecture
Definition ofOperational
Phases
DesignConcepts
First-OrderRisk Goal
Allocation forEach Phase
SystemReliabilityAllocation
PRA
Safety,Reliability,Schedule,and Cost
Trade-offs
DesignEngineering
Cost andSchedule
RiskAssessments
Past RelatedPRA Efforts;e.g., Shuttle
Top LevelPRA
MatureDesign
Design Activities

26
Advanced PRA Methods or Tools
QRAS (Quantitative Risk Assessment System) – a state of the art integrated PRA computer programGalileo/ASSAP – Dynamic fault tree programSoftware reliability methodology for use in PRAExternal event methodology for micro-meteoroid and orbital debris (MMOD)risk into the overall risk assessment

27
QRAS 1.7 Is Being Commercialized
Risk Aggregation
ETSSME SRB ORBITER
Space Shuttle
MCCLPFTP HPFTP HEX
BoltFail
ManifWeldFail
SealFail
Element/Subsystem Hierarchy
Loss of flowto LPFTP Successful
op.No
No
Is crack smallenoung to survive
1 mission?Successful
op.Yes
No
Is crackdetectable?
ManifWeld
FailureIs repair
100% effect.?Successful
op.Yes
HPFTP cavitatesLOX rich op.
Event Sequence Diagram
What if?
1. Remove old subsystem andreplace with design.
2. Change failure probabilities forinitiating events.
3. Eliminate failure modes.4. Vary parameters of engineeringmodels.
Tool Box
BayesianUpdating
MathematicaOthers
(future)
R(i,x, t) = R0(i,x, t)where:
R is reliability of manifold weldi is physical statex is vector of physical variablest is time
Event Tree (quantification)(furure unhancement: dynamic)
S = 0.9
F = 0.1 S = 0.96F = 0.04
S = ... S = ...F = ...S = ...F = ...
F = ...
Success Prob.
Success Prob.LOV Prob.
LOV Prob.
LOV Prob.Mission Fail. Prob.
time in seconds
SSMEHPOTP _______________LPFTP _______________HEX _______________MCC _______________
SRBTVC _______________NOZZLE _______________
t1 t2 t3 t4-6 0 128 510
Mission Timeline
Probability Distributionfor initiating event
median
Pr5% tile 95% tile
Fault Tree(use to quantify pivotal events)
ManifoldWeld
Failure
InitiatingEvent
Results
Engineering Modesto determine initiating event probability
Probability ofManifold WeldFailure
28
In Summary, We Plan to
Continue to improve risk awarenessConduct PRA training for line and project managers and for personnel
Continue to develop a corps of in-house PRA expertsTransition PRA to baseline method for safety assessmentIntegrate risk assessment with system safety and reliability assessmentAdopt organization-wide risk informed culture
PRA to become a way of life for safety and technical performance improvement and for cost reductionImplement risk-informed management process