NAS Infrastructure Modernization - UMD ISR · NAS Infrastructure Modernization: ... (FAA Tech...
25
NAS Infrastructure Modernization: A common theme to Volpe’s aviation research program Nelson Keeler Director, Office of Aviation Programs Volpe National Transportation Systems Center
Transcript of NAS Infrastructure Modernization - UMD ISR · NAS Infrastructure Modernization: ... (FAA Tech...
NAS Infrastructure Modernization:A common theme to Volpe’s aviation research program
Nelson KeelerDirector, Office of Aviation Programs
Volpe National Transportation Systems Center

6/16/2006 2
Modernized Concept for Arrivals:Continuous Descent Approach (CDA)
• “Minimum Thrust” approach on arrival• Minimize/eliminate level segments on arrival
– Reduces thrust increases– Reduces use of speed brakes– May increase altitude above population in places
• Lower noise received on ground• Fewer Local Air Quality impacts
• “Create new analytical tools to understand better the relationship between noise and emissions, the different types ofemissions, and the costs and benefits of different policies and actions”
What is a CDA?
Relationship to NGATS:

6/16/2006 3
Potential CDA Benefits
• Noise• Emissions
– Local Air Quality– From Top of Descent
• Fuel burn
Hei
ght
×
Streaming/Sequencing Spacing Monitoring Intervention
Descent from Cruise Initial Approach Low Noise Descent Leg Missed App.
Low Noise
Conventional
FAF
Wake VertexSeparation4 - 6 nm•Intermediate
metering point•Initial separation established
Hei
ght
×
Streaming/Sequencing Spacing Monitoring Intervention
Descent from Cruise Initial Approach Low Noise Descent Leg Missed App.
Low Noise
Conventional
FAF
Wake VertexSeparation4 - 6 nm•Intermediate
metering point•Initial separation established
NonNon--CDACDA
CDACDA
Demonstrated CDADemonstrated CDA(validation)(validation)
Conceptual CDAConceptual CDA

6/16/2006 4
Volpe’s Role on CDA
• Aviation Environmental Design Tool (AEDT) –Volpe Lead Developer– Development of single tool capable of analyzing both
noise and emissions impacts– Algorithm development to understand implications of
CDAs– Modeling demonstration analysis for ICAO Committee on
Environmental Protection (CAEP)
• Coordination with FAA PARTNER Center of Excellence - Tests have shown up to:– 6 dBA noise reduction– 30 less NOx emitted– 500 lbs less fuel used

6/16/2006 5
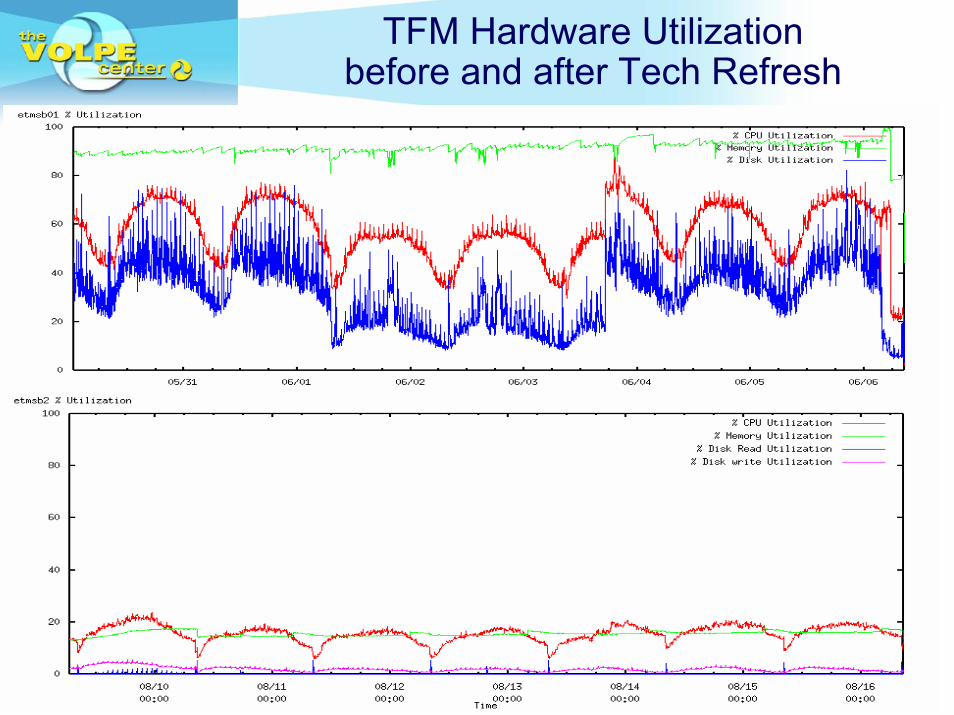
Goals of Traffic Flow Management (TFM) Tech Refresh
• Replace legacy Y2K infrastructure with up to date technology to reduce costs and increase functionality
• Scope: TFM Hubsite (Volpe), Disaster Recovery site (FAA Tech Center), and 80 FAA field sites.
• Timeframe: fall 2004 – spring 2005• Results:
– New HW and training to all sites– TFM HW maintenance reduced $1M/year– Order of magniture improvement in HW speed– Linux OS replaces proprietary Unix OS– Noticeable application response time benefit to users– New functionality to reduce congestion is now achievable
6/16/2006 6
TFM Hardware Utilization before and after Tech Refresh

6/16/2006 7
Benefits of Tech Refresh onMonitor Alert transmission times
TMD Timeline
4.5
10
8
8
8
8
4
1.5
9
9
2
9
9
12
9
10
2
10
13.5
11
14
28
27
12
2
2
4
7
8
7
4
0 10 20 30 40 50 60
8.0
7.9
7.8
7.7
7.6
7.5
7.4
ETM
S R
elea
se
Seconds Afte r The M inute
TDB TMSCON ASP FTP DACS/TSD

6/16/2006 8
Enhanced FAA Safety Metrics
• Background: FAA wanted a more objective method of categorizing the severity of runway incursions.
• Volpe developed a computer model that takes into account the: conflict configuration, closest proximity between aircraft, visibility, avoidance maneuvers executed, and other factors to categorize the severity of the incursion.

6/16/2006 9
Enhanced Safety Metrics -Ground
• This Runway Incursion Severity Classification (RISC) model is currently being validated by the FAA and other countries and is under consideration at ICAO as a tool for standardized ratings of runway incursions.

6/16/2006 10
Scenaro # 48a- One takeoff aircraft One aircraft or vehicle enters runway with other aircraft on takeoff roll
ALL BEST CASE EXCEPT FOR WORST CASE OF PRIMARY FACTOR CLOSESTHORIZONTAL COMBINED COMBINED Visibility/ Information AvoidancePROXIMITY BEST CASE WORST CASE RVR/Ceiling Comm. manuever
100 A =4 A =4
500 C =2 A =4 B+ =3.3 B+ =3.3 A- =3.7
1000 D =1 B =3 C+ =2.3 C+ =2.3 B- =2.7
2500 D =1 D =1
Runway Incursion Severity Model
From tabled worst severities S for visibility, communication and avoidance maneuver factors,given the incursion scenario and closest proximity,
objective data for a particular incursion event then can determine weightings P for each factor, e.g. visibility (see above right) and then a vector severity S* is determined by
RVR/ VISIBILITY/ CEILING FACTOR
CEILINGDAY RVR or VISIBILITY > 1000 ft. 500 ft. 200 ft. 100 ft.
> 3 mi. 0 1 3 101 mi. = 6000 ft. 5 5 5 103/4 mi. or 4500 ft. 8 8 8 101/2 mi. or 3000 ft. 10 10 10 101/4 mi. or 1500 ft. 10 10 10 10
NIGHT RVR or VISIBILITY> 3 mi. 3 4 5 101 mi. = 6000 ft. 8 8 8 103/4 mi. or 4500 ft. 10 10 10 101/2 mi. or 3000 ft. 10 10 10 101/4 mi. or 1500 ft. 10 10 10 10
S=2P=0,0,0(BestCase)
S=3.3 P=0,1,0 (Information,communication)
S=3.3 P=1,0,0(Visibility)
S=3.7P=0,0,1(Avoidance Maneuver)
S=4P=1,1,1(Worst case)
S*S* = Sb + P1(S1–Sb) + [Σ i =2 to N Pi
2 (Si–1)2 / Σ i=2 to N (Si–1)2]0.5 (Sw-S1)

6/16/2006 11
Leading a/c LARGE Following aircraft: HEAVY B757 LARGE SMALLTrailing a/c SMALLh-separation 4 Leading h (ft.) below Estimated separation, nmEstimated separation, nmEstimated separation, nmEstimated separation, nmv-separation 400 aircraft glideslope 1 2 3 4 5 6 1 2 3 4 5 6 1 2 3 4 5 6 1 2 3 4 5 6
0 A B C C C C A B C C C C A B C C C C A B C C C CList of sizes: HEAVY 50 A A B C C C A A B C C C A A B C C C A A B C C CHEAVY 100 A A B C C C A A B C C C A A A B C C A A A A B CB757 200 A A B C C C A A B C C C A A A B C C A A A A B CLARGE 300 A A B C C C A A B C C C A A A B C C A A A A B CSMALL 400 A A B C C C A A B C C C A A A B C C A A A A B C
500 A B C C C A B C C C A A B C C A A A B Ccolumn 4 600 B C C C B C C C A B C C A A B Crow 6 700 B C C C B C C C A B C C A A B C
800 C C C C C C B C C A B Ctable LARGE-SMALL 900 C C C C C C B C
1000 C C C CLead HEAVY NA 0 A B C C C C A B C C C C A B C C C C A B C C CLead B757 NA B757 50 A A B C C C A A B C C C A A B C C C A A B C C CLead LARGE C 100 A A B C C C A A B C C C A A B C C C A A A B C C
200 A A B C C C A A B C C C A A B C C C A A A B C CSeverity C 300 A A B C C C A A B C C C A A B C C C A A A B C C
400 A A B C C C A A B C C C A A B C C C A A A B C C500 A B C C C A B C C C A B C C C A A B C C600 B C C C B C C C B C C C A B C C700 B C C C B C C C B C C C A B C C800 C C C C C C C C C B C C900 C C C C C C C C
1000 C C C C0 A B C C C C A B C C C C
LARGE 50 A B C C C C A A B C C C100 A B C C C C A A B C C C200 A B C C C C A A B C C C300 A B C C C C A A B C C C400 B C C C C A B C C C500 B C C C C A B C C C600 C C C C B C C C700 C C C C C C800 C C C C900 C C
1000
Severity of Wake Vortex Encounter

6/16/2006 12
Enhanced Safety Metrics –Radar Environments
• Volpe is now developing metrics to categorize the severity of losses of standard separation in the radar environments (ARTCC and TRACON). Metrics are being designed to reflect the: proximity to collision, degree of the loss of required separation, severity of the operational error that resulted in the loss of standard separation.

6/16/2006 13
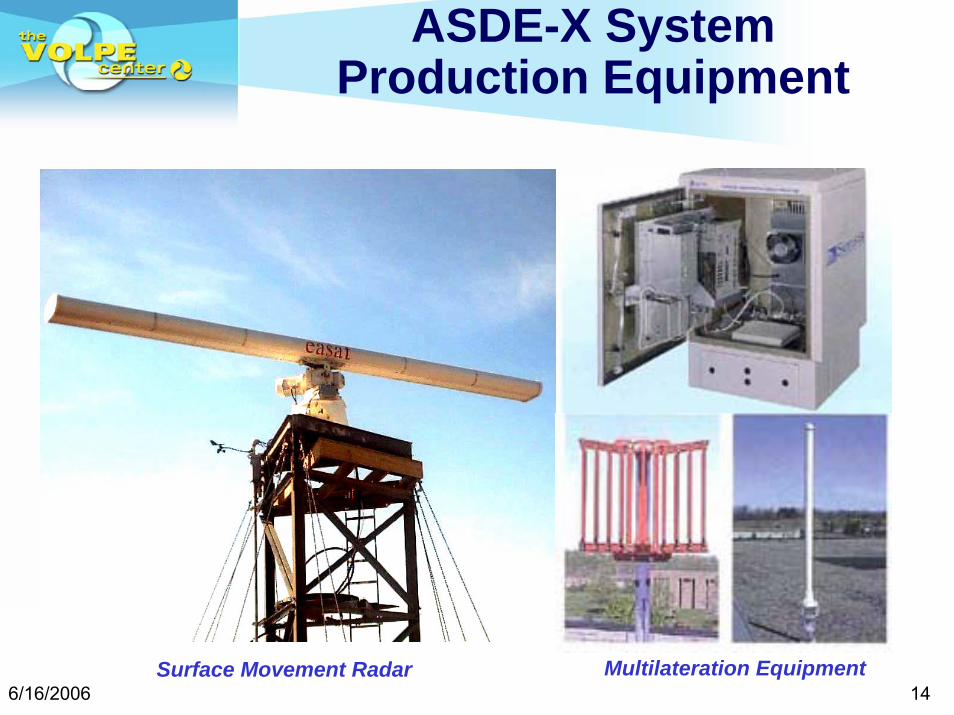
Airport Surface Detection Equipment (ASDE-X)
• New-generation airport surface surveillance system
• Two sensor subsystems– Primary radar– Beacon multilateration
• Volpe evaluated low-cost candidate– Automatic detection, high resolution surveillance
of airport movement areas, approach corridors, other areas of interest
– Extracted radar plot data and processed digital video
• FAA conducted competitive acquisition• Volpe supporting deployment
– Installation and test– Ad hoc problem solutions– RF Modem development
ELAR Radar at Salt Lake City
Dassault Radar at Norfolk
6/16/2006 14
ASDE-X SystemProduction Equipment
Surface Movement Radar Multilateration Equipment

6/16/2006 15
Gulf of Mexico Evaluation of ADS-B and Multilateration
• Sponsors:– NASA — Original sponsor– FAA — Program participant
• Problems– No radar coverage across Gulf– No coverage of offshore aircraft
• Two Candidate Solutions• ADS-B
– New transponders– One ground station in view
• Wide Area Multilateration– Current transponders– Multiple ground stations in view
• Three-phase / four-year effort– Standard terminal area– Small terminal area (helo-focus)– En Route / Oceanic

6/16/2006 16
Experimental ADS-B TrackGulf of Mexico
18
20
22
24
26
28
30
32
-98 -96 -94 -92 -90 -88 -86 -84 -82 -80
Longitude
Latit
ude
MonterreyFIR
HoustonOceanic
MeridaFIR
JacksonvilleARTCC
MiamiOceanic
MiamiARTCC
HoustonARTCCIAH
MIA
J86
A626
FRISHSWORD
A758
A509
FAA B-727 “N40”
2 / 12 / 2004MIA to IAH
FL350

6/16/2006 17
Space-Based PNT
Requirements
GNSS(GPS II, GPS III,
Galileo, GLONASS)
Standalone
GNSS
Augmented
GNSS
Error
SourcesResidual Error
Sources
Ionosphere
Troposphere
Multipath
Clock
Ephemeris
Interference
Space-Based PNT
Requirements
GNSS(GPS II, GPS III,
Galileo, GLONASS)
Standalone
GNSS
Augmented
GNSS
Error
SourcesResidual Error
Sources
Ionosphere
Troposphere
Multipath
Clock
Ephemeris
Interference
Focus of Space-Based PNT Research and Applications

6/16/2006 18
GNSS Impact on CNS/ATM
• GNSS is Different From Ground Based Navaids
• Areas of Degraded Coverage Not Stationary due to Motion of Satellite Tracks
• Pilots/ATC Need to Know Where and When GNSS is Not Available
• Vulnerabilities of GNSS Must be Addressed

6/16/2006 19
FAA
GPSRAIM
PROCESSOR
US NOTAM OFFICE
FAA/DOD
DEFENSEINTERNET
NOTAMSERVICE
US NOTAMSYSTEM
CLASS ONE
NOTAM
CIVIL USERS
AERONAUTICALINFORMATION
AWP(2)
AFSS(61)
GPS MCSNANUs
DOD
*ALMANACDATA
*UNSCHEDULEDSV EVENTS
*SCHEDULED SVMAINTENANCE
MilitaryCivilian
FSDPS(21)
AFTN
INT’L
Volpe Center IntegrationHosted at ATCSCC

6/16/2006 20
TSO C129 RAIM NPA AvailabilityPRN 5 Out of Service September 2005
Volpe Center Model

6/16/2006 21
DECEA
Web AccessWeb Access
Aeronautical Aeronautical InformationInformation
Brasilia
Rio de Janeiro
Curitiba
ManausRecife
Output
Brazil TRS
GRTM
Brazil TMS
Porto Alegre
GNSSGALILEOGPS
Monitor
GPMSGPMSProcessingProcessing
GEO
MonitoringCGNA/ACC/APP
Brazil GPS Performance Monitoring System Overview

6/16/2006 22
Wake Vortex Program Goals
• Increase airport arrival and departure rates by reducing wake-imposed aircraft separations
• Increase safety margin by employing new procedures only under specific conditions
Part of Volpe Instrumentation at St. Louis Airport

6/16/2006 23
Wake RMP Sequence of Mitigation Changes
1. Procedure changes only (weather independent)
2. Changes based on data from existing airport weather sensors• Primarily wind
3. Changes based on new weather sensors• Wind ― vertically and horizontally dispersed• Wake demise
4. New procedures using data from newly-procured wake sensors

6/16/2006 24
Current Volpe Activities• Experimental data collection and analysis for procedure
and safety case development– St. Louis (on-going)
• Waiver to 2500-ft rule (procedural change)• Change to Order 7110.65 to 2500-ft rule (procedural change)• Preparing for departure measurements
– Denver (on-going)• Support to STL work• Experimental sensor evaluation
– Planning for additional airports• San Francisco• Cleveland• Memphis• Houston
• Contributing to– ConOps development– A380 Issue– B757 Classification Issue
• Wake sensor developmentPulsed Lidar at St. Louis Airport

6/16/2006 25
STL SensorsLargest Wake Data Collection Effort to Date
Pressure Transducer Laser
Range Finder
Aircraft Detectors (2)
Sodar (3)
Windline (2)
Pulsed Lidar (3)
Data Bases• TAMIS• ASDE-X• ASOS• LLWAS