NARA Goal One€™s goal is to achieve 22 bone dried tons (BDT) per chip truck with a combination...
86
2 nd Cumulative Report Develop a sustainable biojet fuel industry in the Pacific Northwest that uses residual woody biomass as feedstock. NARA Goal One Sustainable Biojet April 2013 - March 2014
Transcript of NARA Goal One€™s goal is to achieve 22 bone dried tons (BDT) per chip truck with a combination...

12ND CUMULATIVE REPORT | APRIL 2013 - MARCH 2014
2nd Cumulative Report
Develop a sustainable biojet fuel industry in the Pacific Northwest that uses residual woody biomass as feedstock.
NARA Goal One
Sustainable Biojet
April 2013 - March 2014

22ND CUMULATIVE REPORT | APRIL 2013 - MARCH 2014
TABLE OF CONTENTSGOAL ONE: SUSTAINABLE BIOJET
Task FD-2: Phenomics Analysis
Task C-P-1: Pretreatment to Overcome Recalcitrance of Lignocellulose
Task C-AF-1: Production of Lignocellulosic Isobutanol by Fermentation and Conversion to Biojet
Task C-P-3: Preparation of Pretreated Biomass
Task C-AF-2: Production of Jet Fuel using BioChemCat
Task C-P-4: Mild Bisulfite Pretreatment of Forest ResidualsTask C-P-5: Clean Sugar and Lignin Pretreatment Technology
Task FL-1: Feedstock SourcingTask FL-2: Logistics Decision Support and Improvement
Task FD-3: Combining Genomic and Field-based Breeding and testing Methods to Improve Woody Feedstock ProductionTask FD-4: Genetic Variation Underlying Amenability to Pretreatment/BioconversionTask FD-5: Screen and Identify Suitable Plant Feedstocks for Large Scale Pretreatments to Produce High Yield Sugar and High Quality Lignin
FEEDSTOCK
CONVERSION
1
21
29
56
33
70
3544
915
2325
26
8
28
SUMMARY 3TRAINING 6RESOURCE LEVERAGING
FEEDSTOCK DEVELOPMENT TEAM
PRETREAMENT TEAM
AVIATION TEAM
FEEDSTOCK LOGISTICS TEAM
7
20
28
55
8
GOAL ONE GANTT CHARTS 74

32ND CUMULATIVE REPORT | APRIL 2013 - MARCH 2014
SUMMARYAll the activities in the NARA project contribute to the goal of providing an industry road-map used to sus-tainability produce jet fuel (biojet) from wood residuals in the Pacific Northwest, and some activities con-tribute directly to the technology of this process. The NARA Feedstock and Conversion teams are focused directly on securing the wood residual feedstock and integrating the technologies employed to convert this feedstock into fuel. Specifically, the following efforts provide an integrated approach to creating a viable pathway from forest residuals to biojet:
1) Feedstock Logistics team: Integrating feedstock col-lection, preprocessing, and transportation to deliver cost effective materials suitable for conversion
2) Feedstock Development team: Focusing on iden-tifying growing stock varieties amenable to sugar production and delineating traits responsible for increased volume production in Douglas-fir trees
3) Pretreatment team: Refining effective pretreatment methods to release sugars from representative forest biomass
4) Aviation Biofuels team: Refining the Gevo fermen-tation/separation and WSU BioChemCat process-es to produce aviation biofuels from representative pretreated forest residuals.
FEEDSTOCK LOGISTICSThe NARA feedstock team is divided into two efforts: feedstock logistics and feedstock development. For this reporting period, the feedstock logistics team evaluated methods to improve the costs associated with processing and transporting forest residuals. The processing considerations evaluated were grinding, bulk density and sizing. A collaborative economic analysis indicates that accommodations to process oversized “overs” and undersized “fines” feedstock chips adds little impact to feedstock costs, whereas, methods to improve grinder and transport efficiencies had a significant impact on cost. The feedstock costs associated with grinding can vary as much as $22
per oven-dried short ton. Lowest grinding costs were achieved by: a) starting with smaller sixed pieces, b) grinding to larger final sizes, and c) using (sharp) knife bits instead of (blunt) hammer bits (Task FL-1).
Improved transport efficiencies are correlated with higher bulk density of the load. Blower tests on dry forest residues suggest significant gains in bulk den-sity can be achieved by vertical acceleration of dry grindings. NARA’s goal is to achieve 22 bone dried tons (BDT) per chip truck with a combination of lower moisture content coupled with increased bulk densi-ty. This would reduce transport costs up to 33%. In addition, results show that the tops and limbs gave higher bulk densities for all conditions. Methods to im-prove bulk density could reduce feedstock transport costs by as much as $10 per oven-dried short ton (Task FL-2.4). A forest residue decision support sys-tem (Residue Evaluation and Network Optimization, RENO) was completed and is designed to improve processing and transportation costs (Task FL-2.3).
The range of net feedstock cost variation when considering grinding, bulk density and sizing options together is $30 per oven-dried short ton. This amount of change to feedstock costs in the NARA base case economic analysis changes total costs by more than $25 million per year. This variation affects the overall project internal rate of return (IRR) by about 1.4%. (Task FL-1.1).
Additional efforts undertaken to improve the cost of processing forest residuals include developing models to predict biomass availability and moisture content. Fieldwork performed to establish recovery coefficients at various costs for forest residual collection has been completed. A statistical model incorporating these recovery coefficients plus field procedures will be implemented in July 2014 and used to determine re-coverable biomass from timber product output (TPO) data (Task FL-2.1). Field data for a forest residue
collection model was completed February 2014 and will be incorporated into the forest residue decision support system RENO (Task FL-2.3). For the past year, temperature, humidity and radiation sensors have recorded data from slash piles, and the moisture content for live branch wood has been recorded. This data collection will conclude July 2014. Preliminary results indicate that live branches have moisture con-tent lower than 50% in most tested sites during fall and winter seasons (Task FL-2.2).
FEEDSTOCK DEVELOPMENTFor this reporting period, the feedstock development effort has initiated screening Douglas-fir seedlings for drought response. To screen Douglas-fir seed-lings, a pilot experiment was performed in which 50 Douglas-fir seedlings were screened at the WSU Phenomics facility (Task FD-2). This pilot screening helps establish the protocol used for an experiment planned in the summer of 2014 to screen over 1000 Douglas-fir seedlings.
The data from the drought screening will be com-bined with data derived from quantifying Douglas-fir chemical composition and recalcitrance among multi-ple individuals. These data will contribute to develop-ing a Douglas-fir phenotype profile that can be linked to DNA samples assembled on a single nucleotide polymorphism (SNP) chip. The chemical composition and recalcitrance screening has advanced from last year, as 265 new tree samples have been tested. A “recalcitrance factor” parameter has been developed to quantify the degree of recalcitrance among tree samples (Task FD-5). A limited number of Douglas-fir DNA samples will be used to generate a SNP chip, therefore, initial screening steps to narrow the pool of samples has begun. A breeding simulation and testing program has been developed to assist in this process.
42ND CUMULATIVE REPORT | APRIL 2013 - MARCH 2014
Significant Feedstock Team outputs for this reporting period are listed below. • Slash pile measuring techniques were evaluated.
This information is used for biomass availability models and for harvest operations planning (Task FL 2.3). http://www.ingentaconnect.com/content/saf/fs/pre-prints/content-saf_0015749x_forsci13001
• A computerized model, Residue Evaluation and Network Optimization (RENO), was completed. It is used to estimate the cost of processing and transporting forest residuals at the operational level. This model is designed to improve processing and transportation costs and is being introduced to stakeholders (Task FL 2.3). http://forestprodjour-nals.org/doi/abs/10.13073/FPJ-D-13-00031
PRETREATMENTThe Pretreatment team’s efforts this year were focused on increasing the scale of operations and selecting a single preferred pretreatment method for continued focus in Year 4 and 5. This effort was informed by technical performance, economics, co-product opportunities, and commercialization potential and was evaluated using a phase and gate analysis. This extensive process culminated with the mild bisulfite (MBS) pretreatment protocol selected as the single pretreatment method used to produce a NARA deliverable of 1000 gallons of jet fuel. Downse-lection to the MBS process represents a major NARA milestone and allows for a single pretreatment proto-col to be considered for the NARA techno-economic analysis (TEA) and life cycle assessment (LCA). The mild bisulfite pretreatment protocol is a modification of the SPORL process and was developed by NARA affiliates Catchlight Energy and the USDA Forest Products Laboratory.
In downselecting to the MBS pretreatment, the MBS and wet oxidation (WOX) protocols were optimized using the FS-10 feedstock sample. Under optimized conditions for each pretreatment protocol, a mass balance was generated, hydrolysate was tested for fermentability, and the solid and liquid residuals were tested for co-product development (Task C-P-3, C-P-
4, C-P-1). The downselection process considered these results along with economic and environmental considerations, plus feedstock and infrastructure compatibility. The NARA Advisory Board and Execu-tive Committee reviewed the comparisons and made recommendations with the final selection made by NARA’s Executive Director Ralph Cavalieri.
Improvements to the MBS pretreatment protocol include a reduction of sulfur dioxide applied to wood from 12% to 6% and a cook temperature reduction from 165°C to 145°C. It was also demonstrated that pretreatment efficiencies could occur without signif-icant chip size reduction. These changes improve energy efficiency, reduce chemical cost and gener-ate fewer inhibitors to the fermentation process. An integrated pretreatment/fermentation plant is eco-nomically better than a situation where sugar must be shipped to an existing ethanol plant, and producing hydrolyzing enzymes on site is more economical than purchased enzymes (Task C-P-4.1).
Another pretreatment strategy investigated this year involves wood milling. The distinction of wood milling compared to MBS and WOX pretreatment is that no chemicals, water or high temperatures are required. In areas such as the Pacific Northwest where electricity is relatively inexpensive, wood milling may prove to be an attractive pretreatment alternative. The wood milling process has four steps: (1) wood residuals chipping; (2) chip size reduction before drying; (3) chip drying to reduce chip moisture from 50% to 10%; and (4) wood milling.
During this reporting period, FS-10 feedstock sam-ples were reduced by two grinding technologies and characterized for particle size. The reduced samples were then milled and hydrolyzed. The hydrolysate was sent to Gevo for fermentation analysis and to the NARA Co-Products team for co-product develop-ment. The carbon dioxide emissions associated with the wood milling drying process were measured and will be used for a later life cycle assessment. Energy usage was calculated for all four steps in the milling process and will be used to generate a techno-eco-
nomic analysis. Based on the small-scale milling re-sults generated thus far, the total energy requirement for wood milling could range from 1.45 to 1.73 kWh/oven-dried kg. The energy usage data for this pro-cess will be refined when large-scale milling (currently underway) is analyzed.
Significant Conversion Team outputs for this reporting period are listed below.
• MBS (mild bisulfite: based on the SPORL pretreat-ment protocol) pretreatment temperature at 145°C is superior to a previous 165°C temperature both economically and in reduced inhibitor formation (Task C-P-4). http://www.sciencedirect.com/science/article/pii/S1359511313007435• The SPORL pretreatment protocol was optimized using Douglas-fir forest residuals. http://www.science-direct.com/science/article/pii/S0961953413003607
AVIATION BIOFUELSThe NARA Aviation Biofuels Team focused on two fer-mentation technologies: Gevo’s fermentation, sepa-ration, and upgrading process and Washington State University’s (WSU) BioChemCat process managed at the WSU-Bioproducts, Sciences & Engineering Laboratory (BSEL). During this reporting period, Gevo characterized the pretreated hydrolysate generated by the SPORL, wet-oxidation, mild bisulfite and mill wood pretreatments on FS-10 feedstock. Hydrolysate characterization included sugar and inhibitor analyses and fermentability to isobutanol. These characteriza-tions were considered in the pretreatment downselect process (see Phase Gate model in the Organizational Structure chapter).
The isobutanol producing biocatalysts being devel-oped are stable and continue to improve in growth rate and isobutanol production. Sodium hydroxide was substituted for ammonium hydroxide to balance pH, which reduced impurities significantly. In a 1 liter GIFT® system, biocatalyst growth rates and isobuta-nol production were measured in 60% hydrolysates derived from varied pretreatment processes. Growth

52ND CUMULATIVE REPORT | APRIL 2013 - MARCH 2014
rates were relatively similar within each hydrolysate; however, isobutanol production varied with the high-est isobutanol production and hexose consumption generated from the MBS hydrolysate. A 20L GIFT® pilot scale system was designed and built for future scale-up trials.
Gevo provided NARA mass and energy balance information and capital expenditure (CapEx) costs covering Gevo’s process of converting sugars into isobutanol, which is combined to form iso-paraffinic kerosene (IPK). This data will be incorporated into the NARA techno-economic and life cycle assessments. The saccharified biomass sugars are fermented and isobutanol recovered in a process essentially identical to the corn mash process currently being used at Gevo’s plant in Luverne, MN. Preliminary analysis of isobutanol quality derived from Douglas-fir biomass and corn starch are very similar.
WSU BSEL fermented carbohydrates, derived from FS-01, FS-03 and FS-10 feedstock samples pretreat-ed by wet oxidation. Calculated yields of volatile fatty acids produced ranged from 410 kg/ton biomass to 510 kg/ton. These results translate to a range of 60.1 gallons to 74.8 gallons of jet fuel per biomass ton, with FS-01 (clean wood chips) producing the highest results.Three different separation methods: (i) pressurized carbon dioxide extraction; (ii) ion exchange resin-me-diated extraction; and (iii) esterification have been investigated for efficiency in extracting organic acids from the fermentation broth. While the extraction of volatile fatty acids (VFAs) using pressurized carbon dioxide and ion exchange show high recovery rates, the technology at its current stage can be considered expensive. Conversion of VFAs into mixed alcohols by esterification has been initiated. To integrate the fermentation/conversion process into a continuous system, a lab-scale cata-lytic system has been designed and is currently in the process of being set-up at the BSEL laboratory (Task C-AF-2).

62ND CUMULATIVE REPORT | APRIL 2013 - MARCH 2014
Name Affiliation Role ContributionCarlos Alvarez- Vasco
WSU, BSEL PhD Student Assay development
Ruoshui Ma WSU, BSEL PhD Student Lignin workScott Geleynse WSU, BSEL PhD student Pretreatment and enzyme hydrolysisRoland Gleisner USFS, FPL Tech support Pretreatment and preprocessingHongming Lou USFS, FPL Post Doc Enzyme and lignin interactionJinLan Cheng USFS, FPL Visiting Scholar Pretreatment StudiesAndrea Laguna University Wisconsin-Madison Undergraduate Student Saccharification StudiesJingzhi Zhang USFS, FPL Visiting Student Saccharification StudiesRene Zamora OSU Post Doc See Publication List; Task FL-2Storm Beck OSU MS Student See Publication List; Task FL-2Francisca Belart OSU PhD Student See Publication List; Task FL-2Justin Long OSU Res. Associate See Publication List; Task FL-2Keerthi Srinivas WSU, BSEL Post-doc BioChemCat developmentBen Garrett WSU, BSEL Graduate student BioChemCat developmentRicarda Hoehner WSU Post-Doc Established the screening platform for Douglas-fir including data analysisAhmad Zia WSU Post-Doc Helped to Established the screening platform for Douglas-fir including data analysisRajib Biswas WSU, BSEL Post-doc Mass balances: Enzymatic hydrolysis
Training

72ND CUMULATIVE REPORT | APRIL 2013 - MARCH 2014
Resource LeveragingResource Type Resource Citation Amount Relationship or Importance to NARADOE BRDI To be received March, 2014. Humboldt
State University, Lead $300,000 sub-award to John Sessions
as Co-PI.Additional Funds for Decision Support
Salary US Forest Service Support of J.Y. Zhu & Roland GleisnerScholarship China Scholarship Council Support Haifeng Zhou, JinLan Cheng,
and Jingzhi ZhangGrant USDA SBIR Phase II program to Biop-
ulping International (Contract Number: 2010-33610-21589)
NSF Grant Award 1067012 Understand biomass recalcitrance: X. Zhang
DOE Port of Benton Biorectors $100,000 Parallel project terminating end of April, 2014
EquipmentPretreatment
DOE Port of Benton $400,000 Provided funding for the equipment

82ND CUMULATIVE REPORT | APRIL 2013 - MARCH 2014
FEEDSTOCK LOGISTICS TEAM
FEEDSTOCK
92ND CUMULATIVE REPORT | APRIL 2013 - MARCH 2014
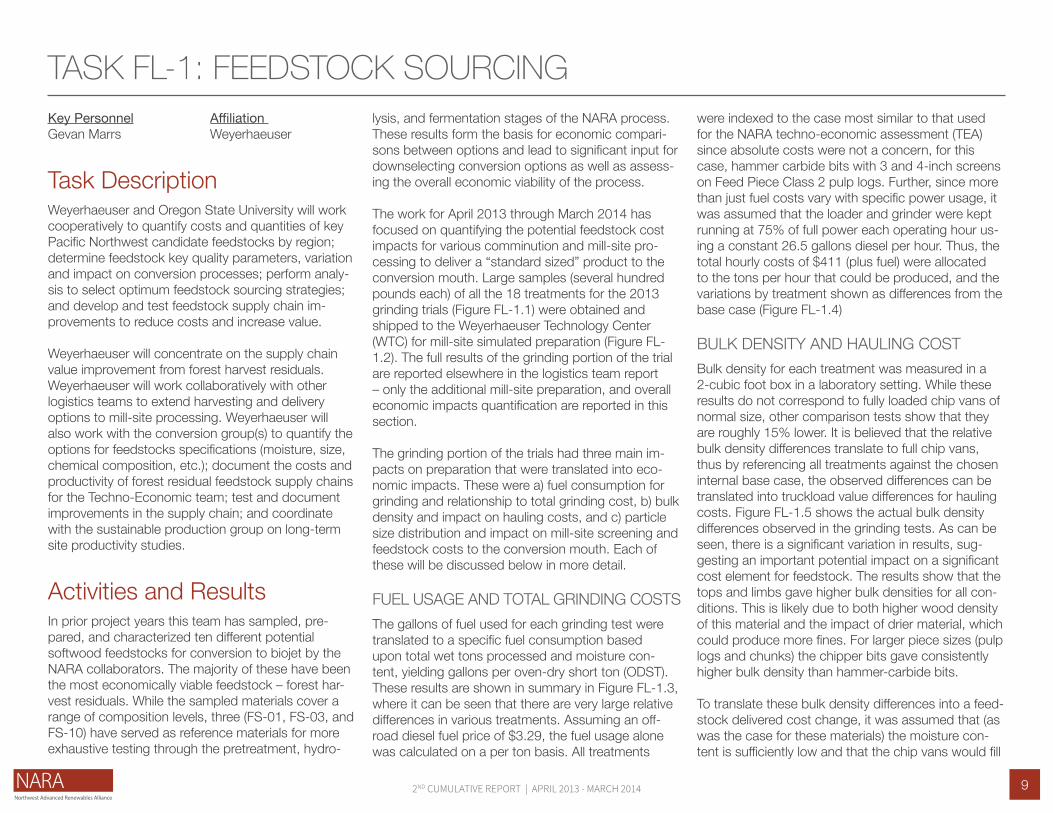
TASK FL-1: FEEDSTOCK SOURCING
Task Description
Activities and Results
Key Personnel Affiliation Gevan Marrs Weyerhaeuser
Weyerhaeuser and Oregon State University will work cooperatively to quantify costs and quantities of key Pacific Northwest candidate feedstocks by region; determine feedstock key quality parameters, variation and impact on conversion processes; perform analy-sis to select optimum feedstock sourcing strategies; and develop and test feedstock supply chain im-provements to reduce costs and increase value.
Weyerhaeuser will concentrate on the supply chain value improvement from forest harvest residuals. Weyerhaeuser will work collaboratively with other logistics teams to extend harvesting and delivery options to mill-site processing. Weyerhaeuser will also work with the conversion group(s) to quantify the options for feedstocks specifications (moisture, size, chemical composition, etc.); document the costs and productivity of forest residual feedstock supply chains for the Techno-Economic team; test and document improvements in the supply chain; and coordinate with the sustainable production group on long-term site productivity studies.
In prior project years this team has sampled, pre-pared, and characterized ten different potential softwood feedstocks for conversion to biojet by the NARA collaborators. The majority of these have been the most economically viable feedstock – forest har-vest residuals. While the sampled materials cover a range of composition levels, three (FS-01, FS-03, and FS-10) have served as reference materials for more exhaustive testing through the pretreatment, hydro-
lysis, and fermentation stages of the NARA process. These results form the basis for economic compari-sons between options and lead to significant input for downselecting conversion options as well as assess-ing the overall economic viability of the process.
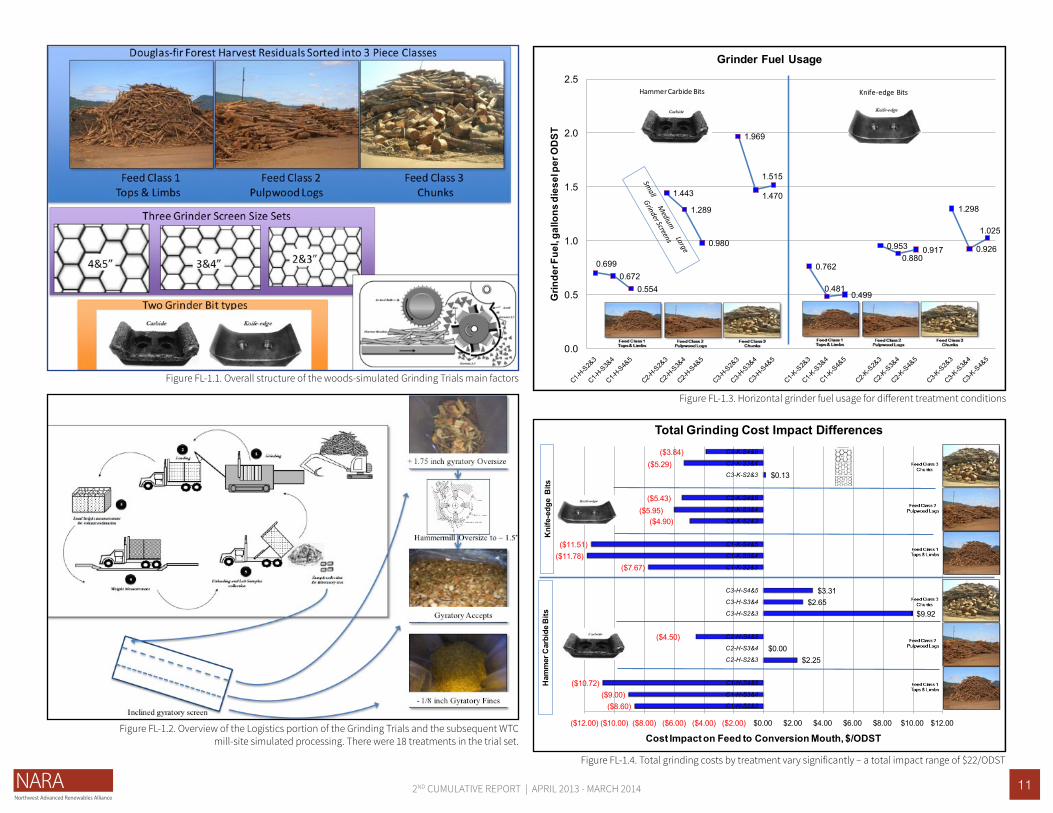
The work for April 2013 through March 2014 has focused on quantifying the potential feedstock cost impacts for various comminution and mill-site pro-cessing to deliver a “standard sized” product to the conversion mouth. Large samples (several hundred pounds each) of all the 18 treatments for the 2013 grinding trials (Figure FL-1.1) were obtained and shipped to the Weyerhaeuser Technology Center (WTC) for mill-site simulated preparation (Figure FL-1.2). The full results of the grinding portion of the trial are reported elsewhere in the logistics team report – only the additional mill-site preparation, and overall economic impacts quantification are reported in this section.
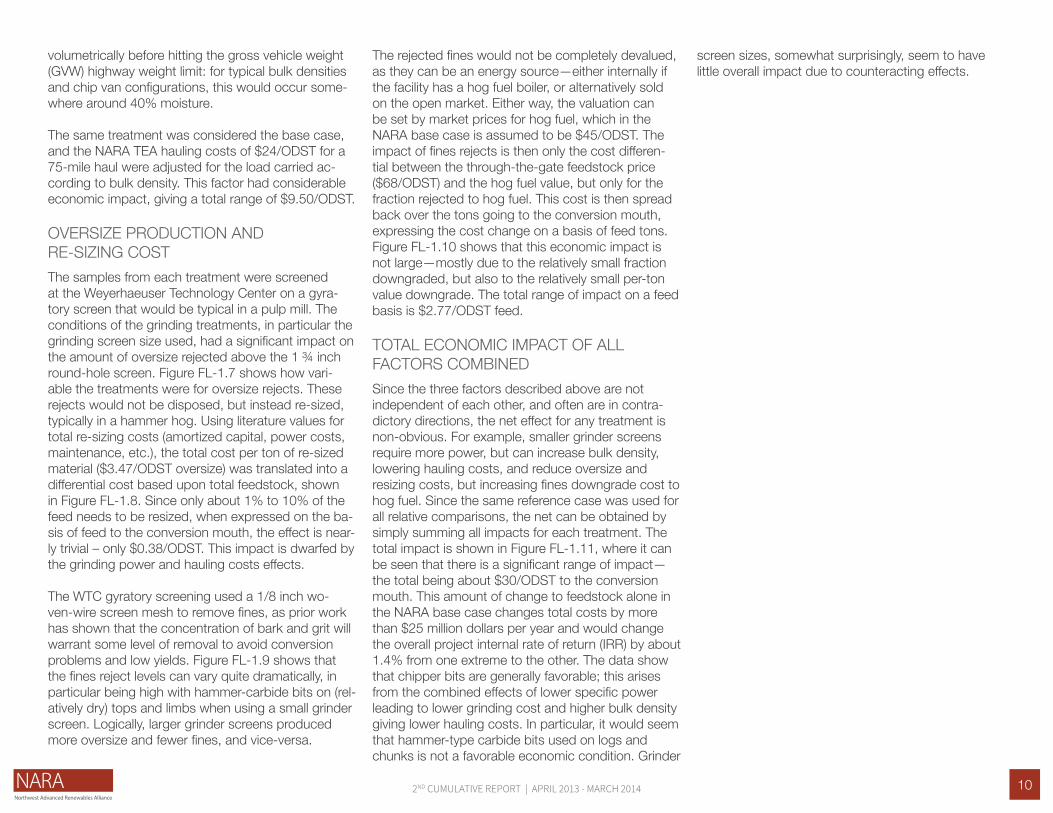
The grinding portion of the trials had three main im-pacts on preparation that were translated into eco-nomic impacts. These were a) fuel consumption for grinding and relationship to total grinding cost, b) bulk density and impact on hauling costs, and c) particle size distribution and impact on mill-site screening and feedstock costs to the conversion mouth. Each of these will be discussed below in more detail.
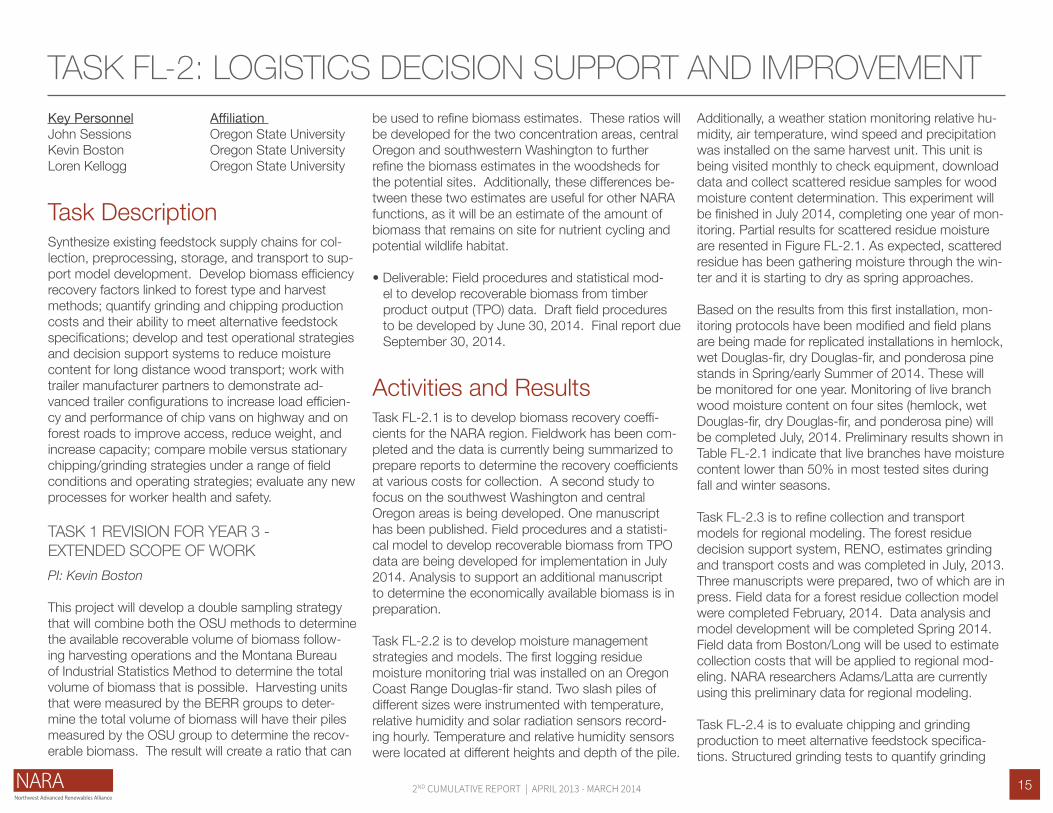
FUEL USAGE AND TOTAL GRINDING COSTSThe gallons of fuel used for each grinding test were translated to a specific fuel consumption based upon total wet tons processed and moisture con-tent, yielding gallons per oven-dry short ton (ODST). These results are shown in summary in Figure FL-1.3, where it can be seen that there are very large relative differences in various treatments. Assuming an off-road diesel fuel price of $3.29, the fuel usage alone was calculated on a per ton basis. All treatments
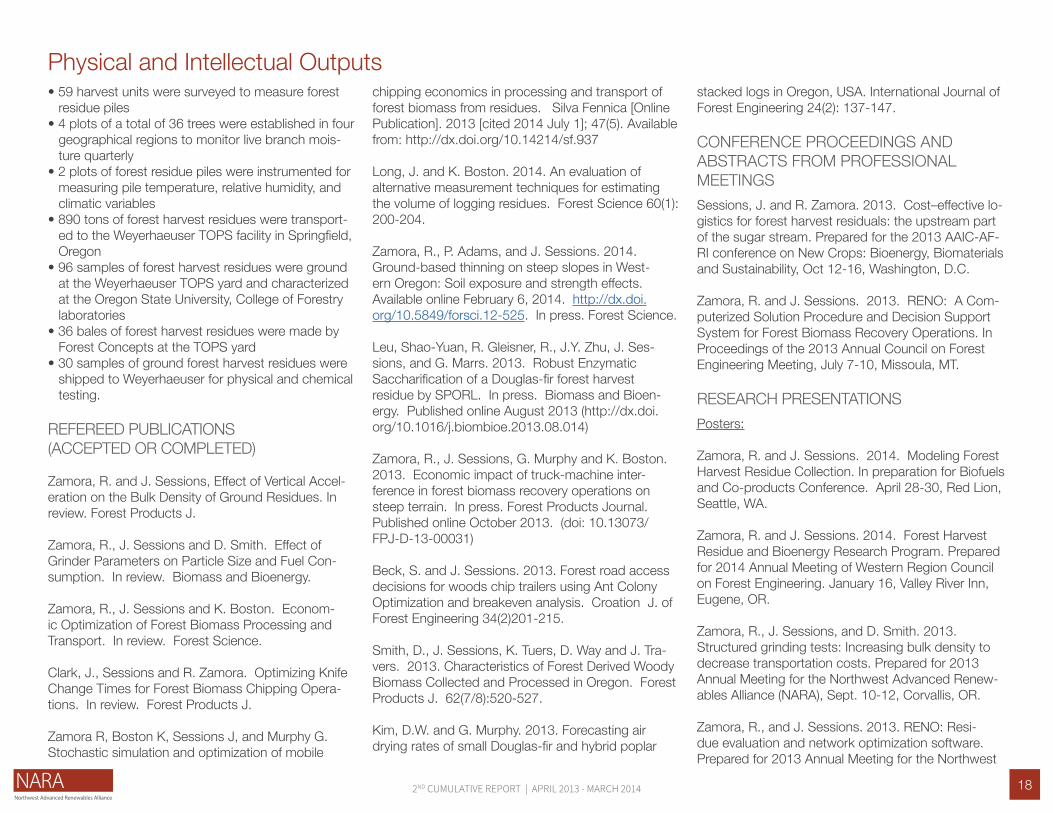
were indexed to the case most similar to that used for the NARA techno-economic assessment (TEA) since absolute costs were not a concern, for this case, hammer carbide bits with 3 and 4-inch screens on Feed Piece Class 2 pulp logs. Further, since more than just fuel costs vary with specific power usage, it was assumed that the loader and grinder were kept running at 75% of full power each operating hour us-ing a constant 26.5 gallons diesel per hour. Thus, the total hourly costs of $411 (plus fuel) were allocated to the tons per hour that could be produced, and the variations by treatment shown as differences from the base case (Figure FL-1.4)
BULK DENSITY AND HAULING COSTBulk density for each treatment was measured in a 2-cubic foot box in a laboratory setting. While these results do not correspond to fully loaded chip vans of normal size, other comparison tests show that they are roughly 15% lower. It is believed that the relative bulk density differences translate to full chip vans, thus by referencing all treatments against the chosen internal base case, the observed differences can be translated into truckload value differences for hauling costs. Figure FL-1.5 shows the actual bulk density differences observed in the grinding tests. As can be seen, there is a significant variation in results, sug-gesting an important potential impact on a significant cost element for feedstock. The results show that the tops and limbs gave higher bulk densities for all con-ditions. This is likely due to both higher wood density of this material and the impact of drier material, which could produce more fines. For larger piece sizes (pulp logs and chunks) the chipper bits gave consistently higher bulk density than hammer-carbide bits.
To translate these bulk density differences into a feed-stock delivered cost change, it was assumed that (as was the case for these materials) the moisture con-tent is sufficiently low and that the chip vans would fill
102ND CUMULATIVE REPORT | APRIL 2013 - MARCH 2014
volumetrically before hitting the gross vehicle weight (GVW) highway weight limit: for typical bulk densities and chip van configurations, this would occur some-where around 40% moisture.
The same treatment was considered the base case, and the NARA TEA hauling costs of $24/ODST for a 75-mile haul were adjusted for the load carried ac-cording to bulk density. This factor had considerable economic impact, giving a total range of $9.50/ODST.
OVERSIZE PRODUCTION AND RE-SIZING COSTThe samples from each treatment were screened at the Weyerhaeuser Technology Center on a gyra-tory screen that would be typical in a pulp mill. The conditions of the grinding treatments, in particular the grinding screen size used, had a significant impact on the amount of oversize rejected above the 1 ¾ inch round-hole screen. Figure FL-1.7 shows how vari-able the treatments were for oversize rejects. These rejects would not be disposed, but instead re-sized, typically in a hammer hog. Using literature values for total re-sizing costs (amortized capital, power costs, maintenance, etc.), the total cost per ton of re-sized material ($3.47/ODST oversize) was translated into a differential cost based upon total feedstock, shown in Figure FL-1.8. Since only about 1% to 10% of the feed needs to be resized, when expressed on the ba-sis of feed to the conversion mouth, the effect is near-ly trivial – only $0.38/ODST. This impact is dwarfed by the grinding power and hauling costs effects.
The WTC gyratory screening used a 1/8 inch wo-ven-wire screen mesh to remove fines, as prior work has shown that the concentration of bark and grit will warrant some level of removal to avoid conversion problems and low yields. Figure FL-1.9 shows that the fines reject levels can vary quite dramatically, in particular being high with hammer-carbide bits on (rel-atively dry) tops and limbs when using a small grinder screen. Logically, larger grinder screens produced more oversize and fewer fines, and vice-versa.
The rejected fines would not be completely devalued, as they can be an energy source—either internally if the facility has a hog fuel boiler, or alternatively sold on the open market. Either way, the valuation can be set by market prices for hog fuel, which in the NARA base case is assumed to be $45/ODST. The impact of fines rejects is then only the cost differen-tial between the through-the-gate feedstock price ($68/ODST) and the hog fuel value, but only for the fraction rejected to hog fuel. This cost is then spread back over the tons going to the conversion mouth, expressing the cost change on a basis of feed tons. Figure FL-1.10 shows that this economic impact is not large—mostly due to the relatively small fraction downgraded, but also to the relatively small per-ton value downgrade. The total range of impact on a feed basis is $2.77/ODST feed.
TOTAL ECONOMIC IMPACT OF ALL FACTORS COMBINEDSince the three factors described above are not independent of each other, and often are in contra-dictory directions, the net effect for any treatment is non-obvious. For example, smaller grinder screens require more power, but can increase bulk density, lowering hauling costs, and reduce oversize and resizing costs, but increasing fines downgrade cost to hog fuel. Since the same reference case was used for all relative comparisons, the net can be obtained by simply summing all impacts for each treatment. The total impact is shown in Figure FL-1.11, where it can be seen that there is a significant range of impact—the total being about $30/ODST to the conversion mouth. This amount of change to feedstock alone in the NARA base case changes total costs by more than $25 million dollars per year and would change the overall project internal rate of return (IRR) by about 1.4% from one extreme to the other. The data show that chipper bits are generally favorable; this arises from the combined effects of lower specific power leading to lower grinding cost and higher bulk density giving lower hauling costs. In particular, it would seem that hammer-type carbide bits used on logs and chunks is not a favorable economic condition. Grinder
screen sizes, somewhat surprisingly, seem to have little overall impact due to counteracting effects.
112ND CUMULATIVE REPORT | APRIL 2013 - MARCH 2014
Figure FL-1.1. Overall structure of the woods-simulated Grinding Trials main factors
Figure FL-1.3. Horizontal grinder fuel usage for different treatment conditions
Figure FL-1.4. Total grinding costs by treatment vary significantly – a total impact range of $22/ODST
Figure FL-1.2. Overview of the Logistics portion of the Grinding Trials and the subsequent WTC mill-site simulated processing. There were 18 treatments in the trial set.
0.6990.672
0.554
1.443
1.289
0.980
1.969
1.470
1.515
0.762
0.4810.499
0.9530.880
0.917
1.298
0.926
1.025
0.0
0.5
1.0
1.5
2.0
2.5
Grin
der F
uel, g
allo
ns d
iese
l per
OD
ST
Grinder Fuel Usage
Hammer Carbide Bits Knife-edge Bits
($8.60)($9.00)
($10.72)
$2.25 $0.00
($4.50)
$9.92 $2.65
$3.31
($7.67)($11.78)($11.51)
($4.90)($5.95)
($5.43)
$0.13 ($5.29)
($3.84)
($12.00) ($10.00) ($8.00) ($6.00) ($4.00) ($2.00) $0.00 $2.00 $4.00 $6.00 $8.00 $10.00 $12.00
C1-H-S2&3
C1-H-S3&4
C1-H-S4&5
C2-H-S2&3
C2-H-S3&4
C2-H-S4&5
C3-H-S2&3
C3-H-S3&4
C3-H-S4&5
C1-K-S2&3
C1-K-S3&4
C1-K-S4&5
C2-K-S2&3
C2-K-S3&4
C2-K-S4&5
C3-K-S2&3
C3-K-S3&4
C3-K-S4&5
Cost Impact on Feed to Conversion Mouth, $/ODST
Total Grinding Cost Impact Differences
2013 grinding and sizing trials.xlsx Gevan Marrs
Ham
mer
Car
bide
Bits
Kni
fe-e
dge
Bits

122ND CUMULATIVE REPORT | APRIL 2013 - MARCH 2014
Figure FL-1.5. Laboratory bulk density variations by treatment Figure FL-1.7. Grinder screen size had the only, and large, impact on gyratory screen oversize rejects levels
Figure FL-1.6. Bulk density differences impact hauling costs to a significant degree - $9.50/ODST Figure FL-1.8. Surprisingly, when expressed on a feed basis, the oversize re-sizing total costs are almost trivial, ranging only a total of $0.38/ODST feedstock

132ND CUMULATIVE REPORT | APRIL 2013 - MARCH 2014
Figure FL-1.9. Rejects to fines can vary quite dramatically, relatively
Figure FL-1.10. The cost impact of fines downgrade to hog fuel value has an impact of about $2.77/ODST feed material
Figure FL-1.11. The net total impact range is about $30/ODST feedstock to conversion mouth

142ND CUMULATIVE REPORT | APRIL 2013 - MARCH 2014
Recommendations | Conclusions1) Lowest grinding power was achieved by: a) starting
with smaller piece sizes, b) grinding to larger final sizes, and c) using (sharp) knife bits instead of (blunt) hammer bits.
2) Under the assumptions used here, total grinding costs are the largest impact factor, in the directions noted in results, to the tune of $22 / ODST impact range.
3) Highest bulk density was obtained with: a) smaller feed piece size class – tops & limbs, otherwise, with b) knife bits compared to hammer.
– The reason for higher bulk density with tops and limbs is probably due to some combination of higher wood density, greater fines content due to drier wood and higher bark content.
4) Higher bulk density (as long as moisture is low enough) reduces hauling cost and is the second most powerful economic effect, having an impact range of $10 / ODST.
5) Oversize material production is, logically, almost totally controlled by grinder screen size.
– The economic impact of resizing oversize is very small – impact range of <$0.40 / ODST.
6) Fines downgraded to hog fuel is mostly related to grinder screen size, particularly for tops and limbs with hammer bits.
– The economic impact of fines downgrade is relatively small – impact range of <$3 / ODST.
7) Overall, the total net impact of variables assessed here can be quite large – the impact range is $30 / ODST.
– Because both lower total grinding costs and higher bulk density was achieved consistently with tops and limbs, this Feed Piece Size class was consistently economically favored for both bit types.– For other Feed Class Piece Sizes (pulp logs and chunks), knife bits were economically favor-able to hammer bits, mostly due to lower grind-ing costs and higher bulk density for knife bits.
CAVEATS1) Knife bits are somewhat more expensive and likely
have higher maintenance costs and these charac-teristics were not tested in this trial.
2) It is probably not realistic to sort material size class-es in practice. That is, avoiding grinding material after one is already set up at the harvesting site is not logical, even if slightly more expensive on a per unit cost. What materials remain in residue piles is likely driven by pulp material market demand.
3) Some of the bulk density benefit of tops and limbs is probably due to higher bark content creating more fines, which have lower conversion yield and are not accounted for in this analysis.
4) While the tops and limbs have cost advantages to conversion, they also will have a lower conversion yield due to higher bark content – that impact has not been quantified here.
RECOMMENDATIONS1) Samples of each material type should be tested
via the NARA analytical protocol (that is, added to the feedstock database) so that approximations of economic impacts of higher bark (really, lower total polysaccharides) can be quantified. This impact can be compared to the impacts cited in this report.
2) Although a “pulp chip” type size criteria was used for the work here, there is no disciplined analysis of optimum particle size distribution to conversion that trades added cost for preparing smaller parti-cles against the presumed decreased conversion costs. This optimization should be explored for the downselected NARA pretreatment).
PHYSICAL AND INTELLECTUAL OUTPUTS• Three additional forest harvest residue samples
were collected, processed, and characterized for the NARA Feedstocks database.
152ND CUMULATIVE REPORT | APRIL 2013 - MARCH 2014
Task Description
Key Personnel Affiliation John Sessions Oregon State UniversityKevin Boston Oregon State UniversityLoren Kellogg Oregon State University
Synthesize existing feedstock supply chains for col-lection, preprocessing, storage, and transport to sup-port model development. Develop biomass efficiency recovery factors linked to forest type and harvest methods; quantify grinding and chipping production costs and their ability to meet alternative feedstock specifications; develop and test operational strategies and decision support systems to reduce moisture content for long distance wood transport; work with trailer manufacturer partners to demonstrate ad-vanced trailer configurations to increase load efficien-cy and performance of chip vans on highway and on forest roads to improve access, reduce weight, and increase capacity; compare mobile versus stationary chipping/grinding strategies under a range of field conditions and operating strategies; evaluate any new processes for worker health and safety.
TASK 1 REVISION FOR YEAR 3 - EXTENDED SCOPE OF WORKPI: Kevin Boston
This project will develop a double sampling strategy that will combine both the OSU methods to determine the available recoverable volume of biomass follow-ing harvesting operations and the Montana Bureau of Industrial Statistics Method to determine the total volume of biomass that is possible. Harvesting units that were measured by the BERR groups to deter-mine the total volume of biomass will have their piles measured by the OSU group to determine the recov-erable biomass. The result will create a ratio that can
TASK FL-2: LOGISTICS DECISION SUPPORT AND IMPROVEMENTbe used to refine biomass estimates. These ratios will be developed for the two concentration areas, central Oregon and southwestern Washington to further refine the biomass estimates in the woodsheds for the potential sites. Additionally, these differences be-tween these two estimates are useful for other NARA functions, as it will be an estimate of the amount of biomass that remains on site for nutrient cycling and potential wildlife habitat.
• Deliverable: Field procedures and statistical mod-el to develop recoverable biomass from timber product output (TPO) data. Draft field procedures to be developed by June 30, 2014. Final report due September 30, 2014.
Activities and ResultsTask FL-2.1 is to develop biomass recovery coeffi-cients for the NARA region. Fieldwork has been com-pleted and the data is currently being summarized to prepare reports to determine the recovery coefficients at various costs for collection. A second study to focus on the southwest Washington and central Oregon areas is being developed. One manuscript has been published. Field procedures and a statisti-cal model to develop recoverable biomass from TPO data are being developed for implementation in July 2014. Analysis to support an additional manuscript to determine the economically available biomass is in preparation.
Task FL-2.2 is to develop moisture management strategies and models. The first logging residue moisture monitoring trial was installed on an Oregon Coast Range Douglas-fir stand. Two slash piles of different sizes were instrumented with temperature, relative humidity and solar radiation sensors record-ing hourly. Temperature and relative humidity sensors were located at different heights and depth of the pile.
Additionally, a weather station monitoring relative hu-midity, air temperature, wind speed and precipitation was installed on the same harvest unit. This unit is being visited monthly to check equipment, download data and collect scattered residue samples for wood moisture content determination. This experiment will be finished in July 2014, completing one year of mon-itoring. Partial results for scattered residue moisture are resented in Figure FL-2.1. As expected, scattered residue has been gathering moisture through the win-ter and it is starting to dry as spring approaches.
Based on the results from this first installation, mon-itoring protocols have been modified and field plans are being made for replicated installations in hemlock, wet Douglas-fir, dry Douglas-fir, and ponderosa pine stands in Spring/early Summer of 2014. These will be monitored for one year. Monitoring of live branch wood moisture content on four sites (hemlock, wet Douglas-fir, dry Douglas-fir, and ponderosa pine) will be completed July, 2014. Preliminary results shown in Table FL-2.1 indicate that live branches have moisture content lower than 50% in most tested sites during fall and winter seasons.
Task FL-2.3 is to refine collection and transport models for regional modeling. The forest residue decision support system, RENO, estimates grinding and transport costs and was completed in July, 2013. Three manuscripts were prepared, two of which are in press. Field data for a forest residue collection model were completed February, 2014. Data analysis and model development will be completed Spring 2014. Field data from Boston/Long will be used to estimate collection costs that will be applied to regional mod-eling. NARA researchers Adams/Latta are currently using this preliminary data for regional modeling.
Task FL-2.4 is to evaluate chipping and grinding production to meet alternative feedstock specifica-tions. Structured grinding tests to quantify grinding

162ND CUMULATIVE REPORT | APRIL 2013 - MARCH 2014
and chipping production costs and its ability to meet alternative feedstock specifications at low moisture contents were completed in August. Two manu-scripts are in review and one additional manuscript is in preparation. In general, knife-edge bits produced denser grindings compared to carbide bits. Knife-edge bits produced a higher proportion of fine par-ticles (pieces<0.95 cm) compared to carbide bites. Oversized particles (>7.62 cm) were also reduced with the use of knife-edge bits. Significant decreas-es in fuel consumption can be achieved when using knife-edge bits compared to carbide bits. Although several benefits can be obtained by using knife-edge bits, they are more susceptible to dirt, and they cost approximately $10 more per hour compared to carbide bits. Although productivity was not measure directly, power requirement is related to fuel con-sumption. The lower the fuel consumption per unit volume, the higher the potential productivity of the grinder (Table FL-2.2).
In terms of screen size, a smaller screen size combi-nation produced denser material compared to larger screen combinations, however the effect was not as evident as with the bit type. In branches and tops a slight effect of screen size was found. As piece size increased, stronger differences, especially between the small screen compared to the medium and large screen combination, was observed. Although the effect of screen in bulk density did not show the same trend for all the treatments, fuel was highly impacted by the screen size especially when using carbide bits. Since carbide bits lack of the ability to cut the mate-rial, they depend on the hammering of the residue, and thus they are more affected by a reduction in the screen size than knife-edge bits. The screen size also affected the proportion of oversized particles. In general, a higher proportion of oversized particles were found when processing the material using large screen compared to the small screen combination. Limbs produced denser material compared to the other classes. This was caused in part by the high-er specific gravity of this grindings compared to the other size classes. The known presence of reaction wood in branches can be related to this increase in
specific gravity. In addition, the proportion of fines in this class was higher, probably due to the presence of dust, sand and dirt in general. Non-wood con-tent is higher in branches and tops as compared to larger size classes due to larger pieces being partially debarked by the log processor when the log manu-facturing was performed at the landing during the har-vesting, particularly in the spring when bark is looser on the stem.
Stand Season Sample mean Std Dev SE U95CL L95CL Max MinSummer 0.45 0.07 0.013 0.47 0.42 0.58 0.23
Fall 0.48 0.06 0.019 0.51 0.44 0.58 0.28Winter 0.47 0.06 0.020 0.51 0.43 0.67 0.28
Summer 0.44 0.07 0.008 0.45 0.42 0.59 0.13Fall 0.48 0.06 0.027 0.53 0.42 0.59 0.31
Winter 0.51 0.06 0.020 0.55 0.47 0.63 0.25Summer 0.48 0.06 0.018 0.52 0.45 0.67 0.29
Fall 0.49 0.06 0.029 0.54 0.43 0.63 0.33Winter 0.51 0.09 0.026 0.56 0.46 0.75 0.33
Fall 0.48 0.07 0.015 0.51 0.45 0.75 0.26Winter 0.50 0.07 0.026 0.55 0.45 0.73 0.31
Valley - D-Fir
Sisters-PondPine
Newport- WHemlock
Dry -D-Fir
Preliminary attempts at increasing bulk density through vertical acceleration of grindings by blowing into a dump truck trailer resulted in significant increas-es bulk density (Figure FL-2.2). Blower tests included grindings from standard carbide bits, knife-edge bits, and a combination of standard carbide/knife-edge bits. Grinding of fresh forest residues at high moisture content (50+ percent) and testing of baling green residues was completed in early March. Lab tests are ongoing.
Figure FL-2.1. Average and 95% confidence intervals for scattered residue moisture content (wet basis)
Table FL-2.1. Live branch moisture content (wet basis) for different forest types

172ND CUMULATIVE REPORT | APRIL 2013 - MARCH 2014
Bit Type/Screen Size 2&3” 3&4” 4&5”Limbs and Tops
Knife-Edge 36.28 57.45 54.98Carbide 39.21 41.20 49.96
Pulpwood LogsKnife-Edge 28.87 31.23 30.14Carbide 19.08 21.39 27.98
Large Chunks, Butt CutsKnife-Edge 21.20 29.65 26.83Carbide 13.97 18.75 18.20
Figure FL-2.2. In-place bulk density as a function of loading method
Table FL-2.2. Estimated productivity (BDT/hr) of a grinder averaging 550 hp output as a function of feedstock, bit type and screen size
Recommendations | ConclusionsGrinder efficiency of forest residues at low moisture content showed that grinder parameters and feed-stock size have important impacts on grinder fuel consumption per dry ton, grinder production, bulk density, and particle size distribution. A collabora-tive economic analysis with NARA researcher Gevan Marrs suggests that downstream handling at the mill to accommodate overs and fines adds little cost, and emphasis needs to be placed on potential increas-es in grinder productivity and transport efficiency. Grinding tests of different feedstock components also suggests that the presence or absence of pulpwood markets will influence grinder productivity, fuel con-sumption, bulk density, and non-wood components. Non-wood products negatively impact sugar recovery.
Blower tests on dry forest residues suggest significant gains in bulk density can be achieved by vertical ac-celeration of dry grindings. This is particularly relevant as chip vans loaded with ground residues at less than 40% moisture content are often volume limited. Chip vans carrying ground residues in western Oregon/Washington generally carry about 15-16 BDT. It is
quite possible to achieve 22 BDT with a combination of lower moisture content coupled with increased bulk density. This would reduce transport costs up to 33%. At longer hauls, transport efficiency becomes increasingly important.
The grinding tests indicate that using knife-edge bits will reduce grinding costs by reducing fuel consump-tion per dry ton processed. Theoretically, grinder pro-ductivity should also increase proportionally, but other factors affect grinder utilization including grinder/truck interactions, road accessibility, truck scheduling, and more frequent changes of the bits.
Work in Year 4 will:• Complete the work extension of Task FL-2.1 to
collect biomass data using TPO data.• Complete the work extension of Task FL-2.1 to col-
lect biomass data using TPO data in collaboration with the BEER group.
• Complete live-branch analysis of moisture content to understand impact of harvest season on begin-ning moisture content of harvest residues.
• Complete installation of field plots for monitoring field moisture content of piled and unpiled residues and continue data collection.
• Complete the analysis of high moisture residues. It is possible that high moisture residues are less cost effective due to high non-wood content and low net dry wood per truckload. Samples have been shipped to Weyerhaeuser to test Impacts on sugar yield.
• Complete a preliminary supply chain analysis of baled residues.
• Work with industrial cooperators to test methods for increasing bulk density of ground residues
• Install a set of structured tests designed to improve large trailer access to forest sites through controlling road cross slope on horizontal curves.
182ND CUMULATIVE REPORT | APRIL 2013 - MARCH 2014
Physical and Intellectual Outputs• 59 harvest units were surveyed to measure forest
residue piles • 4 plots of a total of 36 trees were established in four
geographical regions to monitor live branch mois-ture quarterly
• 2 plots of forest residue piles were instrumented for measuring pile temperature, relative humidity, and climatic variables
• 890 tons of forest harvest residues were transport-ed to the Weyerhaeuser TOPS facility in Springfield, Oregon
• 96 samples of forest harvest residues were ground at the Weyerhaeuser TOPS yard and characterized at the Oregon State University, College of Forestry laboratories
• 36 bales of forest harvest residues were made by Forest Concepts at the TOPS yard
• 30 samples of ground forest harvest residues were shipped to Weyerhaeuser for physical and chemical testing.
REFEREED PUBLICATIONS (ACCEPTED OR COMPLETED)
Zamora, R. and J. Sessions, Effect of Vertical Accel-eration on the Bulk Density of Ground Residues. In review. Forest Products J.
Zamora, R., J. Sessions and D. Smith. Effect of Grinder Parameters on Particle Size and Fuel Con-sumption. In review. Biomass and Bioenergy.
Zamora, R., J. Sessions and K. Boston. Econom-ic Optimization of Forest Biomass Processing and Transport. In review. Forest Science.
Clark, J., Sessions and R. Zamora. Optimizing Knife Change Times for Forest Biomass Chipping Opera-tions. In review. Forest Products J.
Zamora R, Boston K, Sessions J, and Murphy G. Stochastic simulation and optimization of mobile
chipping economics in processing and transport of forest biomass from residues. Silva Fennica [Online Publication]. 2013 [cited 2014 July 1]; 47(5). Available from: http://dx.doi.org/10.14214/sf.937
Long, J. and K. Boston. 2014. An evaluation of alternative measurement techniques for estimating the volume of logging residues. Forest Science 60(1): 200-204.
Zamora, R., P. Adams, and J. Sessions. 2014. Ground-based thinning on steep slopes in West-ern Oregon: Soil exposure and strength effects. Available online February 6, 2014. http://dx.doi.org/10.5849/forsci.12-525. In press. Forest Science.
Leu, Shao-Yuan, R. Gleisner, R., J.Y. Zhu, J. Ses-sions, and G. Marrs. 2013. Robust Enzymatic Saccharification of a Douglas-fir forest harvest residue by SPORL. In press. Biomass and Bioen-ergy. Published online August 2013 (http://dx.doi.org/10.1016/j.biombioe.2013.08.014)
Zamora, R., J. Sessions, G. Murphy and K. Boston. 2013. Economic impact of truck-machine inter-ference in forest biomass recovery operations on steep terrain. In press. Forest Products Journal. Published online October 2013. (doi: 10.13073/FPJ-D-13-00031)
Beck, S. and J. Sessions. 2013. Forest road access decisions for woods chip trailers using Ant Colony Optimization and breakeven analysis. Croation J. of Forest Engineering 34(2)201-215.
Smith, D., J. Sessions, K. Tuers, D. Way and J. Tra-vers. 2013. Characteristics of Forest Derived Woody Biomass Collected and Processed in Oregon. Forest Products J. 62(7/8):520-527.
Kim, D.W. and G. Murphy. 2013. Forecasting air drying rates of small Douglas-fir and hybrid poplar
stacked logs in Oregon, USA. International Journal of Forest Engineering 24(2): 137-147.
CONFERENCE PROCEEDINGS AND ABSTRACTS FROM PROFESSIONAL MEETINGSSessions, J. and R. Zamora. 2013. Cost–effective lo-gistics for forest harvest residuals: the upstream part of the sugar stream. Prepared for the 2013 AAIC-AF-RI conference on New Crops: Bioenergy, Biomaterials and Sustainability, Oct 12-16, Washington, D.C.
Zamora, R. and J. Sessions. 2013. RENO: A Com-puterized Solution Procedure and Decision Support System for Forest Biomass Recovery Operations. In Proceedings of the 2013 Annual Council on Forest Engineering Meeting, July 7-10, Missoula, MT.
RESEARCH PRESENTATIONSPosters:
Zamora, R. and J. Sessions. 2014. Modeling Forest Harvest Residue Collection. In preparation for Biofuels and Co-products Conference. April 28-30, Red Lion, Seattle, WA.
Zamora, R. and J. Sessions. 2014. Forest Harvest Residue and Bioenergy Research Program. Prepared for 2014 Annual Meeting of Western Region Council on Forest Engineering. January 16, Valley River Inn, Eugene, OR.
Zamora, R., J. Sessions, and D. Smith. 2013. Structured grinding tests: Increasing bulk density to decrease transportation costs. Prepared for 2013 Annual Meeting for the Northwest Advanced Renew-ables Alliance (NARA), Sept. 10-12, Corvallis, OR.
Zamora, R., and J. Sessions. 2013. RENO: Resi-due evaluation and network optimization software. Prepared for 2013 Annual Meeting for the Northwest

192ND CUMULATIVE REPORT | APRIL 2013 - MARCH 2014
Advanced Renewables Alliance (NARA), Sept. 10-12, Corvallis, OR.
Belart, F., J. Sessions, G. Murphy, M. Jolly and K. Tuers. 2013. Moisture management model for optimal forest biomass delivery in the Pacific Northwest. Prepared for 2013 Annual Meeting for the Northwest Advanced Renewables Alliance (NARA), Sept. 10-12, Corvallis, OR.
Presentations:
Marrs, G., J. Sessions, and R. Zamora. 2014. Economic Impacts of Forest Residue Feedstocks Preparation for Biofuels. In preparation for Bioenergy + Co-products Conference, April 28-30, Red Lion Hotel, Seattle, WA.
Zamora, R. 2014. Improving efficiencies in biomass collection and transportation. Presented at Wash-ington Contract Loggers Association (WCLA) Annual Meeting. March 14, Red Lion Hotel, Spokane, WA.
Long, J, and K. Boston, 2013, Measuring Biomass Using LiDAR, Lasers, and Lucky guesses. Field Tech-nology Conference for Data Collection and Mapping in Forestry and Natural Resources. October 23-24, Portland Oregon.
Zhu, J.Y., C. Zhang, R. Gleisner and J. Sessions. 2013. Upgrading forest residues of Douglas-fir through physical fractionation for fermentable sugar production. Presented at 35th Symposium on Bio-technology for Fuels and Chemicals. April 29-May 2, 2013. Hilton Hotel, Portland, OR.
Sessions, J. 2013. Jet Fuel from Woody Biomass. Presentation at 68th Olympic Logging Conference, May 1-3, Fairmont Empress Hotel, Victoria, BC, Canada.
Sessions, J. 2013. Jet Fuel from Woody Biomass. Presentation at 76th Oregon Logging Conference, Feb 21-23, Lane County Convention Center, Eugene, OR.
Sessions, J. 2012. Perspectives and Priorities for Bioenergy Research at Oregon State University. Pre-sentation at Northwest Bioenergy Research Sympo-sium, Seattle, WA. November 14. Invited Opening Plenary Presentation.
Belart, F., J. Sessions, G. Murphy, M. Jolly, L. Mad-sen and L. Muszynski . 2013. Moisture management model for optimal forest biomass delivery in the Pacific Northwest. 2013 Western Forestry Gradu-ate Research Symposium. OSU College of Forestry, Corvallis, April 23.
Zamora, R. and J. Sessions. 2013 RENO: Economic optimization of forest biomass and transport. 2013 Western Forestry Graduate Research Symposium. OSU College of Forestry, Corvallis, April 23.
THESIS AND DISSERTATIONSZamora, Rene. 2013. Economic Optimization of For-est Biomass Processing and Transport. PhD thesis. Completed May 23, 2013. John Sessions, Advisor.

202ND CUMULATIVE REPORT | APRIL 2013 - MARCH 2014
FEEDSTOCK DEVELOPMENT TEAM
FEEDSTOCK

212ND CUMULATIVE REPORT | APRIL 2013 - MARCH 2014
Task Description
Activities and Results
Key Personnel Affiliation Helmut Kirchhoff Washington State University
Selected plant lines will be subjected to phenomics analyses. This phenomics system currently relies upon chlorophyll fluorescence analysis, a well-estab-lished and versatile tool for studying stress response in plants in situ. In addition to numerous studies on annual plants, this technique has also been applied to study salt-stress responses in poplar trees. Therefore, chlorophyll fluorescence based phenomics will be used as a second screening filter to identify softwood tree individuals, Douglas-fir and western hemlock, that are best adapted to their designated growth habitat. The WSU phenomics facility will speed up the selection process for three reasons: (i) Chlorophyll fluorescence screening can identify stress before it becomes visible; (ii) It is non-invasive, thus screened plants can be further used;(iii) It is fully automated and therefore allows the screening of a large number of plants. Furthermore, due to a fast detection system, screening parameters can be measured multiple times ensuring good statistics and therefore high fidelity data.
The following parameters will be examined because they are expected to be most relevant for growing trees in different designated areas such as: (i) soil composition (N-deprived soil), (ii) fertilizers (iii) salin-ity, (iv) drought. Softwood trees will be used which passed the first selection criteria for maximal biomass production and quality. Trees to be screened are Douglas fir, at stress conditions. For each of the four parameters, a set of the 500 selected individuals will be grown and screened in parallel (about 2000 plants total). Beside morphometric parameters (leaf size and number, chlorophyll content), the maximal photo-chemical quantum efficiency, photosynthetic electron
A large screening on about 1000 Douglas-fir plants in the WSU Phenomics facility is planned for develop-ment of the SNP chip. In follow-up discussions with the Feedstock Development group (Dr. Howe, Dr. Jayawickrama, Dr. Kirchhoff), after the 2013 NARA meeting, it was decided to postpone these measure-ments to early summer 2014. The reason for post-poning is that the Doug-las-fir trees go into dor-mancy and therefore the meaning of data collected in the winter on these trees for summer drought resistance is limited. Also, the existing pool of trees at OSU is too valuable to start a large-screen drought experiment with the risk that the plants will not survive this treatment. To be as well prepared as possible for the summer measurements, a pilot ex-periment with Doulgas-fir trees provided by Dr. Jayawickrama (OSU) was conducted.
TASK FD-2: PHENOMICS ANALYSISflux, capacity of photoprotective non-photochemical quenching, as well as the degree of photoinhibition of photosystem II will be deduced from chlorophyll fluorescence measurements. This detailed analysis will indicate the stress status of the trees under the different environmental parameters and will allow selection of the most robust plants.
For the pilot experiment about 50 trees were screened in the WSU Phenomics facility during the reporting period. The trees were acclimated in a greenhouse and transported into the Phenomics facility after two weeks of acclimation. The purpose of this pilot experiment is to gain further experience in collecting data with Douglas-fir and to induce drought stress that will be used for the summer experiment.
Figure FD-2.1 shows an example how the plants were measured in the facility. The arrangement of the plants was organized in a way that avoids overlapping growth. This is essential for assignment of individual plants. Compared to previous measurements, the plants were grown in smaller pots (Fig. FD-2.1).
Figure FD-2.1. Example for Screening Douglas-fir in the WSU phenomics facility. Bottom left, top view on Douglas-fir seedlings. The pattern of the plants were optimized to minimize overlap of the individual plants.
Top, example of selected plants. Bottom right, False color chlorophyll fluorescence image.

222ND CUMULATIVE REPORT | APRIL 2013 - MARCH 2014
Figure FD-2.2 shows analysis of chlorophyll fluores-cence parameters. After watering was stopped (day 0), the maximal photochemical fluorescence param-eter (Fv/Fm) starts to decline significantly starting on the fourth day. This decline is well correlated to stress and is accompanied by a decrease in photo-synthetic electron flux (Phi ll parameter). Furthermore, the decrease in the qL parameter indicates redox pressure on the photosynthetic electron transport chain caused by less efficient CO2 fixation by the Cal-vin-Benson cycle. This in turn is caused by drought-stress induced stomatal closure. The decline in pho-toprotective high energy quenching is indicated by the qE parameter. That is most likely caused by loss of energetization of the photosynthetic membranes. Overall, the photosynthetic parameters measured in the pilot experiment consistently show drought-in-duced stress symptoms that are caused by closure of stomata. Compared to previous measurements of Douglas-fir in the phenomics facility, the drought response was faster. This is due to the smaller pot size in this round of experiments. The smaller pot size also allows screening more plants. The successful pilot experiment indicates that all is set for the large screen scheduled for summer 2014. Due to the fast plant response, it is expected that the drought period can be shortened to three to four weeks.
Figure FD-2.2. Analysis of chlorophyll fluorescence parameters. Moderate watered Douglas-fir trees were exposed to drought stress at day ‘0’
Physical and Intellectual OutputsREFEREED PUBLICATIONS (ACCEPTED OR COMPLETED)Kirchhoff, H. 2014. Diffusion of molecules and macromolecules in thylakoid membranes. Biochim. Biophys. Acta,1837(4), pp.495-502. DOI: 10.1016/j.bbabio.2013.11.003
RESEARCH PRESENTATIONSHoehner, R. Poster at the 16th International Photo-synthesis Congress, Phenomics symposium. August 11-13, 2013, Saint Louis, MO, USA

232ND CUMULATIVE REPORT | APRIL 2013 - MARCH 2014
Task Description
Activities and Results
Key Personnel Affiliation Keith Jayawickrama Oregon State University
Genetic selection and testing has been applied on timber species in the west for over 50 years. One re-sult of that work is data and genetic gain predictions for several traits from replicated, randomized progeny tests for over 30,000 families of Douglas-fir and west-ern hemlock. A range of phenotypic variation, and some level of genetic control, has been demonstrated between families for every trait studied, so variation and genetic control in traits pertaining to biofuel pro-duction can be expected. Another result is that over 150,000 timberland acres are reforested annually with seedlings from open-pollinated seed orchards, thus delivering real genetic gains (in whatever traits are selected for) to operational plantations in the west.
Over the last decade, the cost of using genomic and marker-based tools to complement field-based breeding and testing has dropped rapidly in forest tree species. These tools have the potential to improve the efficiency, speed of delivering genetic gain, especially given the long times needed for field-based breeding, and reduce cost. Recent advances by the Conifer Translational Genomics Network (a multi-institution project for major US conifers) can be put to use in this project. It is proposed, as an expanded/strength-ened Task 2 (Identify single nucleotide polymorphisms [SNP] genotypes), to use the power of both of these approaches in tandem. A state-of-the art genotyping array will be developed based on SNP technology for marker-based selection of phenotypes conducive to the production of biofuels from woody residuals. The intent is to add these traits to trees already selected for the production of lumber and other products of saw logs.
Task FD-3.1. Collect samples and combine with phe-notypic data
Sample collection from the Moon Creek site of the CL98 series, for a total of 360 samples, was complet-ed. All samples were processed and shipped to the Zhang lab at WSU.
Genetic gains for pretreatment yield, pretreated holocellulose, enzymatic hydrolysis yield, and recalci-trance factor have been predicted for 145 trees and 43 parents from the T96 population, and 45 trees from the Moon Creek population. Pretreatment yield, pretreated holocellulose, enzymatic hydrolysis yield and recalcitrance factor have been assessed on 220 more trees from the Moon Creek population. Pretreat-ment heritability estimates from the CL98 population appeared to be much higher than in the T96 popula-tion, so efforts are focused on CL98. The preliminary estimates of predicted genetic gain show that it would be possible to genetically select for decreased recalci-trance factor.
TASK FD-3: COMBINING GENOMIC AND FIELD-BASED BREEDING AND TESTING METHODS TO IMPROVE WOODY FEEDSTOCK PRODUCTION
The specific objectives of this project are: (1) Quantify the phenotypic variation in biofuel production poten-tial in a subset of Douglas-fir and western hemlock families, pre-selected for commercially important traits such as rapid growth, adaptability, wood specific gravity and wood stiffness; (2) (expanded/strengthened Task 2) Identify SNP genetic markers in Douglas-fir associated with useful variations in biofuel production potential; and (3) Make selections for in-creased biofuel production in woody residuals of trees developed for use as saw logs using a combination of phenotypic and SNP genetic marker data.
Task FD-3.2. Collect tree tissue samples and obtain marker data
Very good progress was made on identifying markers to be used in the SNP chip, with collaboration from NCGR. Another focus was on narrowing down the optimal population to genotype. Selecting the most appropriate population of trees is very important, since the SNP chip is expensive and only a limited number of trees can be genotyped. First, a sim-ulation program called QMSIM was evaluated but was later modified in-house. This in-house program (Tree Genome Simulator) can simulate the types of mixed-matings that occur in natural populations of Douglas-fir.
A 3-generation pilot genomic selection population with elite genetic material from a cooperative Doug-las-fir breeding program was developed. Consent was obtained from the breeding program to use the required seed from 3rd-cycle crosses; for greenhouse space to sow the study in 2014; and for agreement by a large industrial landowner to outplant the study in 2015. The trial was sown at the end of March, 2014.
The pool of trees considered for processing through the array are as follows:
Z (≈49) grandparents of 3rd cycle crosses X (≈38) parents of 3rd cycle crosses ∑Yi (≈340) 2nd cycle progeny Total training population = 427
≈1,000 3rd cycle progeny (selection population)≈400 2nd-cycle T96 and CL98 trees used in wood
chemistry analysis≈50 Parents of T96 and CL98 treesTotal = 1,920

242ND CUMULATIVE REPORT | APRIL 2013 - MARCH 2014
Foliage samples from the parents and grandparents in the training population have been collected. Arrange-ments have been made for extracting DNA from all the samples.
OSU intends to award the contract for building the genotyping array to GeneSeek (based in Lincoln Nebraska). The array is to be in the order of 15,000-50,000 SNPs, capable of running about 1,900 sam-ples, and costing in the range of $144,000 – 150,000. The contract will likely be finalized and signed by April 21. Due to the cost of the contract and OSU con-tracting rules, a Request for Proposals is in prepara-tion.
Task FD-3.4. Provide Douglas-fir seedlings for phe-nomics study
The preliminary trial at the Kirchoff lab indicated that the drought period applied to the first batch of seedlings was too short for Douglas-fir, leading them to revise the experimental plan for the main group of seedlings. Over 1,000 seedlings from 107 elite fami-lies were transplanted to 615A cavities in May 2013.
The main phenomics study was postponed to May 2014 since any drought-hardiness/ stress response results obtained over the winter of 2013-14 (dormant season) would be less valuable and informative than those obtained when the seedlings are actively grow-ing. The seedlings will be kept at their current location (BLM Sprague Seed Orchard in Merlin, OR) till May 2014. At that point, seedlings will be sent to Pullman using a refrigerated truck.
In late November 2013, 50 seedlings were shipped to the Kichhoff lab for preliminary drought application and imaging work.
Recommendations | ConclusionsThe preliminary estimates of heritability and predict-ed genetic gains show that it would be possible to genetically select for decreased recalcitrance factor. It looks as though a SNP chip can be built with consid-erably greater capacity than originally estimated.
Physical and Intellectual OutputsREFEREED PUBLICATIONS (ACCEPTED OR COMPLETED)Scott Geleynse, Carlos Alvarez-Vasco, Karissa Garcia, Keith Jayawickrama, Matt Trappe, Xiao Zhang. “A Multi-Level Analysis Approach to Measuring Variations in Biomass Recalcitrance of Douglas fir,” submitted.
CONFERENCE PROCEEDING AND AB-STRACTS FROM PROFESSIONAL MEETINGSGeleynse, S., Alvarez-Vasco, C., Jayawickrama, K., Trappe, M, Garcia, K. and Zhang, X. 2013. Phenotyp-ic variations of biomass recalcitrance in Douglas-fir families. Poster presented at 35th Symposium on Biotechnology for Fuels and Chemicals, April 29- May 2, 2013. Hilton Portland, Portland, Oregon.
RESEARCH PRESENTATIONSOral, Posters or Display Presentations
Jayawickrama, K.J.S., G. Howe, S. Guida and C.J. Bell. 2013. SNP chip development for Coastal Douglas-fir. Poster presentation at the NARA Annual Meeting, Corvallis, OR, September 10, 2013.
Jayawickrama, KJS. 2013. Overview of Feedstock Development: NARA Years 1-3. Presentation at 2nd NARA Annual Meeting, September 12, 2013, Oregon State University, Corvallis, OR
Geleynse, S., K. Jayawickrama, K. Garcia, M. Trappe and X. Zhang. Improving Douglas Fir Feedstocks by Screening Families for Biomass Recalcitrance. Poster presentation at the NARA Annual Meeting, Corvallis, OR, September 10, 2013.

252ND CUMULATIVE REPORT | APRIL 2013 - MARCH 2014
Task Description
Activities and Results
Key Personnel Affiliation Callum Bell National Center for Genome Resources
NCGR (National Center for Genomic Resources) will build an updated reference transcriptome for Doug-las-fir. NCGR will apply its Batched Parallel Assembly (BPA) software to these Illumina reads. The work-horse of the assembly is the ABySS assembler, which applies a De Bruijn graph approach. The ABySS kmer pool is fed into an overlap consensus using Mira to further contiguity and collapse redundancy. If the pool is very large (>several million sequences), a cd-hit-est can be performed to reduce the set to the best two cluster representatives. The final synthetic-EST set is then deredundified further using cd-hit-est if desired, and is fed into alignment using BWA. The ex-isting reference transcriptome contigs can be fed into the BPA pipeline at the Mira stage, which will yield a new transcriptome reference that unifies the available resources.
SNP (Single Nucleotide Polymorphism) discovery and prioritization (Task FD-4.4) will be done by alignment of the newly available Illumina sequence reads to the updated reference transcriptome, and identification of mismatches. NCGR will do this by applying Alpheus, its high-throughput alignment and variant detection pipeline. Alpheus is a parallelized workflow that aligns short reads to the reference using the GSNAP algo-rithm, and parses the output to tabulate all variants that are discovered along with supporting statistics such as the number of reads having a variant, variant nucleotide quality, and sequence coverage at the variant position. Threshold heuristics are then applied to arrive at a draft set of putative variants that have strong support. Alpheus will be supplemented by
This task has been modified and incorporated into Task FD-3: Combining Genomic and Field-based Breeding and Testing Methods to Improve Woody Feedstock Production
TASK FD-4: GENETIC VARIATION UNDERLYING AMENABILITY TO PRETREATMENT/BIOCONVERSION
bioinformatic methods, already applied in Douglas-fir genetics, to arrive at a candidate set of new SNPs ready for validation. The goal is to supplement the existing SNP set with new polymorphic variants, with the particular goal of having SNPs in every Douglas-fir gene.

262ND CUMULATIVE REPORT | APRIL 2013 - MARCH 2014
TASK FD-5: SCREEN AND IDENTIFY SUITABLE PLANT FEEDSTOCKS FOR LARGE SCALE PRETREATMENTS TO PRODUCE HIGH YIELD SUGAR AND HIGH QUALITY LIGNIN
Task Description
Physical and Intellectual OutputsActivities and ResultsKey Personnel Affiliation Xiao Zhang Washington State University
Biomass recalcitrance, a collective term describing the resistances of biomass material toward mechan-ical and/or biochemical deconstructions, is the key barrier hindering the development of an economically viable biomass conversion process. Despite the larger abundance, softwood and its forest residues are still not an economically viable feedstock for biofuel pro-duction. The feedstock collection, transportation and processing all contribute significantly to the overall cost. One effective means of reducing feedstock cost and subsequent conversion cost is to select biomass with high amounts of sugars and low recalcitrance toward releasing sugar.
Our work carried out in the last two years has clearly demonstrated that there is a significant variation in biomass recalcitrance among different Douglas-fir families. A parameter “recalcitrance factor” is intro-duced to quantify the level of biomass recalcitrance toward sugar production from different Douglas-fir families. The goal of this research is to develop and implement a selective feedstock breeding method-ology used to identify and produce “ideal” softwood biomass that provides maximum sugar yields and re-duced conversion (pretreatment and hydrolysis) cost.
REFEREED PUBLICATIONS (ACCEPTED OR COMPLETED)Scott Geleynse, Carlos Alvarez-Vasco, Karissa Garcia, Keith Jayawickrama, Matt Trappe, Xiao Zhang. “A Multi-Level Analysis Approach to Measuring Variations in Biomass Recalcitrance of Douglas fir,” submitted.
RESEARCH PRESENTATIONSGeleynse, S., K. Jayawickrama, K. Garcia, M. Trappe and X. Zhang. Improving Douglas Fir Feedstocks by Screening Families for Biomass Recalcitrance. Poster presentation at the NARA Annual Meeting, Corvallis, OR, September 10, 2013.
Garcia, K. Not all Douglas fir Trees are Created Equally for Conversion to Biofuels. Poster presenta-tion at the NARA Summer Undergraduate Research Symposium, Pullman, WA, August 2, 2013.
Geleynse, S., “Not All Trees Are Created Equally: Exploring Variations in Douglas Fir Trees for Biofuel Production” WSU showcase, March 28, 2014
Significant progress has been made toward demon-strating a new methodology to determine biomass recalcitrance. From the work done in the previous year, a new methodology for measuring the recalcitrance of woody biomass has been completed on three levels (biomass composition, response to pretreatment, and enzymatic digestibility). This method was applied as a high-throughput screening tool to analyze Douglas-fir from different families. In addition to 150 tree sam-ples previously shown, over 265 new tree samples collected from another plantation site have been fully analyzed in this year. It was found that a significant vari-ation in the tree characteristics across all three biomass recalcitrance levels was observed (Figure FD-5.1). It was further observed that, in general, trees did not follow any major trend between any particular factor and the overall degree of recalcitrance (i.e. while a high lignin content is often considered an indicator of high recalcitrance, it is not necessarily the case here), and each tree can demonstrate differing susceptibility to different pretreatment methods. A parameter, recalci-trance factor, combining both physical and chemical properties contributing to biomass recalcitrance was applied to quantify the difference among different tree samples. The previous results suggest that the chem-ical compositions such as cellulose and lignin seem to associate with heritability. The additional analysis of the new sample pool from the different plantation site also indicated a relationship between recalcitrance factor and heritability may also exist. Detailed further analysis is currently being carried out at WSU and OSU. The outcome from this project has clearly demonstrated the complexity of the nature of biomass recalcitrance. The multi-level data generated from this new screen-ing methodology can be used to identify and selec-tively breed low recalcitrance softwood feedstock for biochemical conversion, which will help reduce both feedstock and conversion costs.

272ND CUMULATIVE REPORT | APRIL 2013 - MARCH 2014
Figure FD-5.1. Recalcitrance Factors Using Dilute Acid (Graph A) and Alkaline Peroxide (Graph B) Pretreatments. The recalcitrance factors represent the overall conversion for each sample including pretreatment and hydrolysis yield combined. This value is the most relevant factor for consideration in choosing and optimizing feedstocks, including through genetic selection

282ND CUMULATIVE REPORT | APRIL 2013 - MARCH 2014
PRETREATMENT TEAM
CONVERSION

292ND CUMULATIVE REPORT | APRIL 2013 - MARCH 2014
Task DescriptionActivities and ResultsKey Personnel Affiliation
Junyong (J.Y.) Zhu USFS Forest Products Lab
Sulfite pretreatment to overcome recalcitrance of lignocellulose (SPORL) has demonstrated robust per-formance to remove recalcitrance of woody biomass, including softwood species. SPORL outperforms com-peting technologies in terms of sugar/ethanol yield and energy efficiency/net energy output (Zhu et al., Applied Microbiology and Biotechnology, 86:1355-1365, 2010; Tian et al. Bioresource Technology 101:8678-8685; Lan et al., Bioresource Technology, 127:291-297, 2013). The major work for the proposed study is to demonstrate the performance of the SPORL using Douglas-fir forest residues with relatively high lignin contents, and its scalability at two pilot plant facilities for 1000 gallon biojet fuel production. The focus of the study is on low cost and low value Douglas-fir forest residues to improve economics and sustainability. The specific objectives are: (1) to optimize SPORL pretreat-ment conditions for Douglas-fir forest residues under laboratory bench scale conditions based on sugar yield after subsequent enzymatic saccharification; (2) to conduct SPORL pretreatments of Douglas-fir forest residues using the Forest Products Lab (FPL) pilot scale pulping facility to realize first step scale-up, to deter-mine optimal conditions based on total sugar yield after subsequent enzymatic saccharification under high sol-ids loadings of approximately 20%; (3) to conduct large scale, approximately ten tons of wood, production of SPORL substrate at an industrial scale facility with a potential one-step production process under optimal conditions through preliminary large scale production study at FPL; (4) to work with Washington State Univer-sity, Weyerhaeuser and Gevo for large scale biojet fuel production and lignin co-product development using SPORL hydrolysate and lignin fractions.
The major activities in this reporting period were: (1) optimizing pretreatment of Douglas-fir forest resi-dues, FS-03 and FS-10; (2) developing kinetic based parameters for pretreatment scale-up; (3) conduct pilot scale pretreatment; (4) conducting a laboratory fermentation study to evaluate inhibitor formation; (5) integrating FPL’s original SPORL pretreatment with CatchLight Energy’s sulfite pretreatment at the FPL pilot scale facility.
In the optimization study, FS-03 was pretreated at 165°C in a range of chemical loadings and durations. Bisulfite loading of 12% and acid loading of 2.2% and pretreatment duration of 75 min were identified as optimal. Enzymatic glucose yield of 345 kg/ton of FS-03 was achieved (Fig. C-P-1.1).
A combined hydrolysis factor (CHF), a pretreatment severity measurer developed previously, was used to scale pretreatment temperature (T) and time (t). A low T and extended pretreatment duration can reduce inhibitor formation with a significant effect on saccha-rification because the activation energy of sugar deg-radation is higher than hemicellulose dissolution (Fig. C-P-1.2). Using first order kinetics, sugar degradation (D) can be predicted as a function of pretreatment severity, CHF, and time as shown in Eq.(1).
Equation (1)
Using the data derived from Eq. (1), the ratio of sugar degradation at a low and high temperature can be determined in Eq. (2). The symbols E and Ed repre-sent activation energy of hemicellulose dissolution
TASK C-P-1: PRETREATMENT TO OVERCOME RECALCITRANCE OF LIGNOCELLULOSE
and sugar degradation respectively. Equation (2)
While maintaining constant pretreatment severity, CHF, pretreatment temperature and time can be pre-dicted using the below relationship (Eq. 3):
Equation (3)
These relationships allow a low temperature pre-treatment while balancing sugar yield and inhibitor formation.
The optimal pretreatment conditions were applied to a pilot scale study using the Douglas-fir residual FS-10 sample. The pilot scale reactor used is a 390 liter (L) rotating pulping digester (Fig. C-P-1.3). The pilot scale conditions produced a high sugar yield with low inhibitor furan formation. S. cerevisiae was used to ferment the pretreated whole slurry. Fermentation conditions using 21% total solids produced high titer and yield with no apparent inhibition.
Lastly, our laboratory collaborated with NARA affiliate member Catchlight Energy to evaluate pretreatment using sulfur dioxide (SO2) and calcium hydroxide (Ca(OH)2). It was found that bisulfite loading can be reduced to 6.5% to achieve equivalent results when pretreatment was conducted at 150°C for 240 min. Data analyses are still in progress.

302ND CUMULATIVE REPORT | APRIL 2013 - MARCH 2014
Figure C-P-1.1. Overall mass balance of the optimal pretreatment of FS-03 at lab scale of 150 g at T =165°C, t=75 min, Bisulfite=12%, and Acid = 2.2% with liquid to solid ratio of 3:1. All numbers are expressed in kg
Figure C-P-1.3. The FPL pilot scale 390 L rotating reactor for pretreating 50 kg (oven dry) forest residue.
Figure C-P-1.2. Correlation between the HMF and furfural concentration in the pretreatment hydrolysate with the combined hydrolysis factor
(CHF) in comparisons with model predictions

312ND CUMULATIVE REPORT | APRIL 2013 - MARCH 2014
Figure C-P-1.4. Pilot scale 50 kg SPORL pretreatmet of FS-10. Overall mass balance of pretreatment at T =165°C, t=75 min, Bisulfite=12%, and Acid = 2.2% with liquid to solid ratio of 3:1. All numbers are expressed in kg
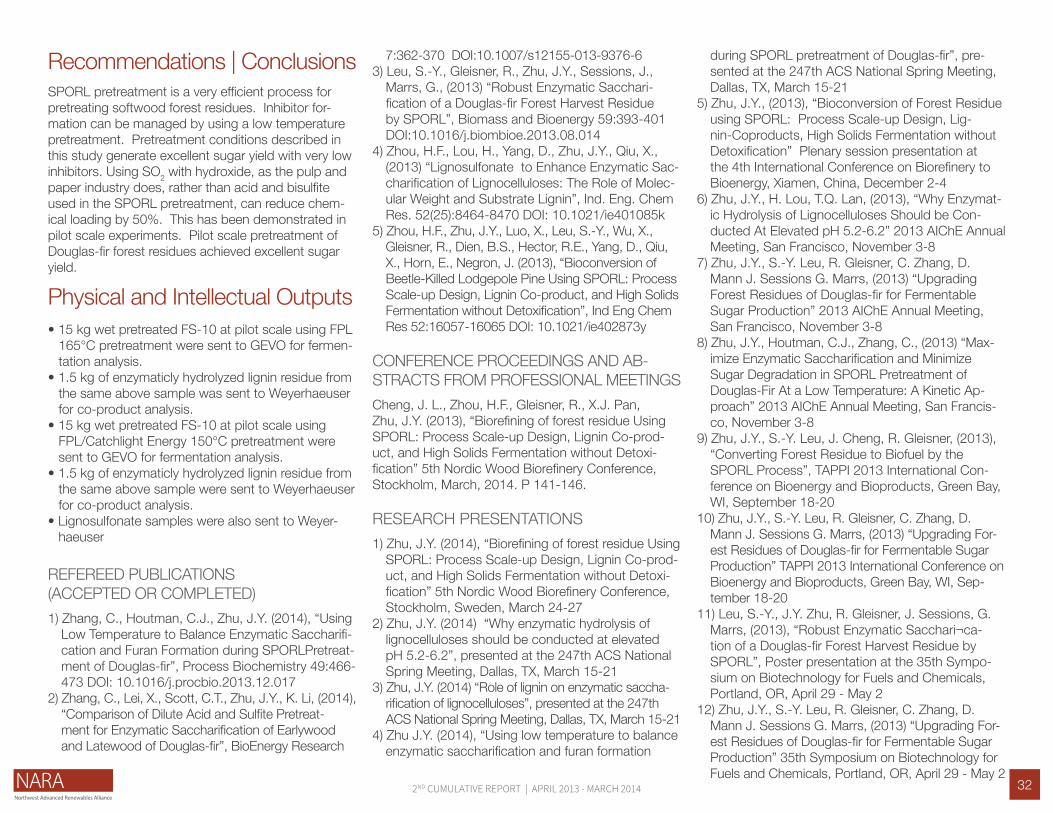
322ND CUMULATIVE REPORT | APRIL 2013 - MARCH 2014
Physical and Intellectual Outputs• 15 kg wet pretreated FS-10 at pilot scale using FPL
165°C pretreatment were sent to GEVO for fermen-tation analysis.
• 1.5 kg of enzymaticly hydrolyzed lignin residue from the same above sample was sent to Weyerhaeuser for co-product analysis.
• 15 kg wet pretreated FS-10 at pilot scale using FPL/Catchlight Energy 150°C pretreatment were sent to GEVO for fermentation analysis.
• 1.5 kg of enzymaticly hydrolyzed lignin residue from the same above sample were sent to Weyerhaeuser for co-product analysis.
• Lignosulfonate samples were also sent to Weyer-haeuser
REFEREED PUBLICATIONS (ACCEPTED OR COMPLETED)1) Zhang, C., Houtman, C.J., Zhu, J.Y. (2014), “Using
Low Temperature to Balance Enzymatic Saccharifi-cation and Furan Formation during SPORLPretreat-ment of Douglas-fir”, Process Biochemistry 49:466-473 DOI: 10.1016/j.procbio.2013.12.017
2) Zhang, C., Lei, X., Scott, C.T., Zhu, J.Y., K. Li, (2014), “Comparison of Dilute Acid and Sulfite Pretreat-ment for Enzymatic Saccharification of Earlywood and Latewood of Douglas-fir”, BioEnergy Research
Recommendations | ConclusionsSPORL pretreatment is a very efficient process for pretreating softwood forest residues. Inhibitor for-mation can be managed by using a low temperature pretreatment. Pretreatment conditions described in this study generate excellent sugar yield with very low inhibitors. Using SO2 with hydroxide, as the pulp and paper industry does, rather than acid and bisulfite used in the SPORL pretreatment, can reduce chem-ical loading by 50%. This has been demonstrated in pilot scale experiments. Pilot scale pretreatment of Douglas-fir forest residues achieved excellent sugar yield.
7:362-370 DOI:10.1007/s12155-013-9376-63) Leu, S.-Y., Gleisner, R., Zhu, J.Y., Sessions, J.,
Marrs, G., (2013) “Robust Enzymatic Sacchari-fication of a Douglas-fir Forest Harvest Residue by SPORL”, Biomass and Bioenergy 59:393-401 DOI:10.1016/j.biombioe.2013.08.014
4) Zhou, H.F., Lou, H., Yang, D., Zhu, J.Y., Qiu, X., (2013) “Lignosulfonate to Enhance Enzymatic Sac-charification of Lignocelluloses: The Role of Molec-ular Weight and Substrate Lignin”, Ind. Eng. Chem Res. 52(25):8464-8470 DOI: 10.1021/ie401085k
5) Zhou, H.F., Zhu, J.Y., Luo, X., Leu, S.-Y., Wu, X., Gleisner, R., Dien, B.S., Hector, R.E., Yang, D., Qiu, X., Horn, E., Negron, J. (2013), “Bioconversion of Beetle-Killed Lodgepole Pine Using SPORL: Process Scale-up Design, Lignin Co-product, and High Solids Fermentation without Detoxification”, Ind Eng Chem Res 52:16057-16065 DOI: 10.1021/ie402873y
CONFERENCE PROCEEDINGS AND AB-STRACTS FROM PROFESSIONAL MEETINGSCheng, J. L., Zhou, H.F., Gleisner, R., X.J. Pan, Zhu, J.Y. (2013), “Biorefining of forest residue Using SPORL: Process Scale-up Design, Lignin Co-prod-uct, and High Solids Fermentation without Detoxi-fication” 5th Nordic Wood Biorefinery Conference, Stockholm, March, 2014. P 141-146.
RESEARCH PRESENTATIONS1) Zhu, J.Y. (2014), “Biorefining of forest residue Using
SPORL: Process Scale-up Design, Lignin Co-prod-uct, and High Solids Fermentation without Detoxi-fication” 5th Nordic Wood Biorefinery Conference, Stockholm, Sweden, March 24-27
2) Zhu, J.Y. (2014) “Why enzymatic hydrolysis of lignocelluloses should be conducted at elevated pH 5.2-6.2”, presented at the 247th ACS National Spring Meeting, Dallas, TX, March 15-21
3) Zhu, J.Y. (2014) “Role of lignin on enzymatic saccha-rification of lignocelluloses”, presented at the 247th ACS National Spring Meeting, Dallas, TX, March 15-21
4) Zhu J.Y. (2014), “Using low temperature to balance enzymatic saccharification and furan formation
during SPORL pretreatment of Douglas-fir”, pre-sented at the 247th ACS National Spring Meeting, Dallas, TX, March 15-21
5) Zhu, J.Y., (2013), “Bioconversion of Forest Residue using SPORL: Process Scale-up Design, Lig-nin-Coproducts, High Solids Fermentation without Detoxification” Plenary session presentation at the 4th International Conference on Biorefinery to Bioenergy, Xiamen, China, December 2-4
6) Zhu, J.Y., H. Lou, T.Q. Lan, (2013), “Why Enzymat-ic Hydrolysis of Lignocelluloses Should be Con-ducted At Elevated pH 5.2-6.2” 2013 AIChE Annual Meeting, San Francisco, November 3-8
7) Zhu, J.Y., S.-Y. Leu, R. Gleisner, C. Zhang, D. Mann J. Sessions G. Marrs, (2013) “Upgrading Forest Residues of Douglas-fir for Fermentable Sugar Production” 2013 AIChE Annual Meeting, San Francisco, November 3-8
8) Zhu, J.Y., Houtman, C.J., Zhang, C., (2013) “Max-imize Enzymatic Saccharification and Minimize Sugar Degradation in SPORL Pretreatment of Douglas-Fir At a Low Temperature: A Kinetic Ap-proach” 2013 AIChE Annual Meeting, San Francis-co, November 3-8
9) Zhu, J.Y., S.-Y. Leu, J. Cheng, R. Gleisner, (2013), “Converting Forest Residue to Biofuel by the SPORL Process”, TAPPI 2013 International Con-ference on Bioenergy and Bioproducts, Green Bay, WI, September 18-20
10) Zhu, J.Y., S.-Y. Leu, R. Gleisner, C. Zhang, D. Mann J. Sessions G. Marrs, (2013) “Upgrading For-est Residues of Douglas-fir for Fermentable Sugar Production” TAPPI 2013 International Conference on Bioenergy and Bioproducts, Green Bay, WI, Sep-tember 18-20
11) Leu, S.-Y., J.Y. Zhu, R. Gleisner, J. Sessions, G. Marrs, (2013), “Robust Enzymatic Sacchari¬ca-tion of a Douglas-fir Forest Harvest Residue by SPORL”, Poster presentation at the 35th Sympo-sium on Biotechnology for Fuels and Chemicals, Portland, OR, April 29 - May 2
12) Zhu, J.Y., S.-Y. Leu, R. Gleisner, C. Zhang, D. Mann J. Sessions G. Marrs, (2013) “Upgrading For-est Residues of Douglas-fir for Fermentable Sugar Production” 35th Symposium on Biotechnology for Fuels and Chemicals, Portland, OR, April 29 - May 2

332ND CUMULATIVE REPORT | APRIL 2013 - MARCH 2014
Task DescriptionActivities and ResultsKey Personnel Affiliation
Brigitte Ahring Washington State University
Using an innovative wet explosion pretreatment pro-cess, pretreated samples (up to 100 kg) have been prepared from feedstocks supplied by Weyerhaeus-er in accordance with their specific needs (Task 1). The specific operational conditions for the different biomass materials will initially include temperature, pressure and oxygen level. The pretreatment process is fully instrumented, and initial testing under a range of operating conditions will take less than a month per biomass feedstock. During the year of 2013, the pretreatment work has been conducted by a post doctoral fellow, along with a full time technician under supervision of the pilot plant manager. This has allowed WSU BSEL to make full mass balances over feed stock materials and further evaluate the conditions for optimal enzyme hydrolysis of pretreated materials from an economic perspective. The WSU BSEL group will continually consult with the different partners to ensure that the material delivered meets their needs. The group will further evaluate the sam-ples produced for release of C5 and C6 sugars using commercial enzyme products as well as the level of inhibitory compounds such as hydroxymethylfurfural (HMF), furfural and acetic acids. Conversion results from the fermentation and co-product experiments will be reported back to WSU BSEL and used to adjust the pretreatment process to optimize it (Task 2). In year 4, the results will be evaluated against other pre-treatment methods used in the project. If our pretreat-ment method proves most successful, further activi-ties will be planned at that time and a new budget will be determined for further work in the NARA project.
Extensive optimization of pretreatment and enzymatic hydrolysis along with composition analysis on FS-10 has been conducted throughout the period; the results of this work are summarized in Figure C-P-3.1.
Optimizing WetOx pretreatment for maximum sugar yield was performed using the following conditions (170-190)ºC; (10-30)min; (0.5-7.5) % O2, from the results in Table C-P-3.1.
Maximum total sugar obtained at a minimum result-ing concentration of HMF and furfural is obtained at relatively mild conditions (23.9min, 170.5ºC, 7.5%O2). Increasing the temperature slightly (23.1min, 177.5ºC, 7.5%O2) will give a slightly higher total sugar concen-tration, but still within the standard deviation of the results.
Maximum glucose concentration is obtained at the high end of the severity scale (30min, 189.5ºC, 7.5%O2) and clearly shows that high severity is need-ed in order to increase the digestibility of the cellulose. As high severity is needed to access the C6, and low severity is needed to recover the C5, it is clear that a two-step pretreatment is preferred for obtaining the highest possible sugar yield from FS-10. A single test on FS-10, in a two phase pretreatment, was conduct-ed in the fall of 2013 and showed an overall sugar yield of 88%. However, the samples produced were not further tested by Gevo and, therefore, the final test made by Gevo was done on a process which is not optimal for either C5 or C6 sugars.
TASK C-P-3: PREPARATION OF PRETREATED BIOMASS
Physical and Intellectual Outputs• (04-16-2013) Lignin sample sent to Weyerhaeuser
(FS-03)• (11-18-2013) 17.1kg of liquid sample of whole
hydrolysate was shipped to, and received by, Gevo. (FS-10)
• (11-25-2013) 57kg @ 28.76% dry matter (DM)– Fermented high lignin residual fiber sample at was send to Weyerhaeuser. (FS-10)
• (01-25-2014) 57 lb. of pretreated (not hydrolyzed) FS-10 was shipped to Gevo.
• (01-29-2014) 12 kg of pretreated (not hydrolyzed) FS-10 was shipped to Gevo.
RESEARCH PRESENTATIONS35 SBFC, Portland, Oregon. April 29 – May 2, 2013. Pretreatment of Forest Slash using Wet Oxidation.
Recommendations | ConclusionsFrom the studies performed in 2013, it is evident that a maximum total sugar yield from FS-10 can be ob-tained when using a two-step WOX pretreatment and that the one-step process which has been evaluated by Gevo is suboptimal. A low severity WOX followed by liquid/solid separation will recover the C5 sugar. The fibers can then be pretreated a second time at high severity to maximize the cellulose accessibility and C6 yield.
It is essential that feedback is provided from our partners, Gevo and Weyerhauser to make the optimal pretreatment. Unfortunately, very limited input has been received from the partners during the last 8 months.

342ND CUMULATIVE REPORT | APRIL 2013 - MARCH 2014
Enzymatic hydrolysis performed using 40mg EP/g cellulose Ctec + 10% Htec v/v in 100ml@10%DM in 250ml flasksCriteria: Maximum total sugar 23.1min 177.5ºC 7.5%O2 (26.6 std1.7
g/l)Criteria: Maximum total sugar, Minimum HMF+Furfural
23.9min 170.5ºC 7.5%O2 (25.8 std1.9 g/l)
Criteria: Maximum glucose 30.0min 189.5ºC 7.5%O2 (10.4 std0.8 g/l)
Figure C-P-3.1. Optimized pretreatment and enzymatic hydrolysis has been performed and is shown in figure 2 Figure C-P-3.2. Mass balance over pretreatment and enzymatic hydrolysis of FS10
Table C-P-3.1. Enzymatic hydrolysis performed using 40mg EP/g cellulose Ctec + 10% Htec v/v in 100ml@10%DM in 250ml flasks

352ND CUMULATIVE REPORT | APRIL 2013 - MARCH 2014
Task Description
Activities and ResultsKey Personnel Affiliation Dwight Anderson Catchlight EnergyJohnway Gao Weyerhauser
Catchlight Energy will identify the pretreatment parameters that give the greatest sugar yield for the Mild Bisulfite Pretreatment on a NARA feedstock such as FS-03. Lignin co-product value has the potential for significant contribution to overall economics, so Catchlight Energy will also produce samples to enable the identification of economic opportunities with co-products.
In Year 1, Catchlight Energy participated as a non-funded Member by providing pretreatment data for a NARA feedstock (FS-01) to enable an economic comparison of pretreatments. Catchlight Energy had also provided initial lignin samples to the Co-Products team. Catchlight Energy contributed additional lignin samples from FS-03 to the Co-Products team at Catchlight Energy’s own expense.
Year 2 research focused on optimizing Mild Bisulfite pretreatment of softwood forest residues. Pretreat-ment runs were conducted in a one cubic foot batch pilot digester at Weyerhaeuser Technology Center. The feedstock of choice was softwood residues such as FS-10. The subtasks developed were: a) Identify mild bisulfite pretreatment conditions that optimize the yield of fermentable sugars in the selected feedstock. b) Produce additional samples of lignosulfonate and residual lignin beyond what would be previously pro-vided by Catchlight Energy funding for analysis by the Co-Products team.
Task CP-4.1. Identify effect of pretreatment process variables on total sugar yield
Catchlight Energy had demonstrated mild bisulfite pretreatment in the pilot scale prior to joining the NARA project, but significant optimization was possi-ble for the following variables:
• Chip Size Distribution – Early development runs were conducted with wood chips that had been re-chipped and screened through a ¾” round hole, with 3 mm fines discarded. This was done as a precaution against the effect of aberrations in chip sizes, but the added handling and loss of mate-rial comes at a cost. The first variable explored is the absence of re-chipping and screening. Chips provided by NARA (FS-10) were used as-is, without either screening or further drying. Pilot runs demon-strated that these chips did not act significantly different from the unscreened chips.
• Equivalent sulfur dioxide (SO2) on wood was re-duced from 12% to 6% while maintaining over 80% of the theoretical total sugar yield. This reduces chemical costs and the carbon intensity of the process.
• Temperature and time were varied to achieve lower levels of fermentation inhibitors and demonstrate successful pilot operation at temperatures closer to conventional sulfite pulping. Temperatures inves-tigated include 165°C, 145°C, and 140°C. These results were completed in the last quarter and are described below. The optimal time/temperature appears to be three hours of pretreatment time at 145°C. Using ideal conditions reduces furan forma-tion by 80% compared to the initial condition used as the optimization starting point and achieves 88% of the theoretical hydrolysis possible.
• These results mentioned above can be obtained with 4.0% CTec3 and 0.4% HTec3 enzyme product
TASK C-P-4: MILD BISULFITE PRETREATMENT OF FOREST RESIDUALSloading on pretreated material. There is little advan-tage to increasing enzyme dosage beyond this, and subsequent optimization may end up showing an optimum at a lower level.
Detailed Description of Optimization Results
Initial Work Demonstrating Ability to Use Chips As-Is
Five pilot pretreatment tests on the FS-10 Douglas-fir softwood residues were completed from April to June, 2013. These pretreatments were performed in a one cubic foot batch pilot digester at Weyerhaeuser Tech-nology Center. Three kilograms of FS-10 chips were used with a pretreatment liquor to OD (oven dry) chip ratio of 4:1. The changes of pretreatment parameters included calcium bisulfite dosage (indicated as equiv-alent SO2 on wood), pretreatment temperature and pretreatment time at temperature. The enzyme dos-age (CTec3 and HTec3 products) varied from 0.5% to 15% weight of enzyme mixture on the pretreated FS-10 biomass. Table C-P-4.1 summarizes the pretreat-ment conditions of these five cooks. Liquor samples were collected during each pretreatment to monitor the changes in cooking pH, liquor sugar, and furan formation to guide further optimization of the pretreat-ment conditions.
Runs 253A and 254A show the extent to which chip size reduction and fines removal affects the results. In development work done by Catchlight Energy before NARA began, chips were re-chipped and screened through a ¾” round hole to ensure that oversized chips weren’t biasing results between runs. The re-chipping process produces additional fines, so the 3 mm fines were discarded from the re-chipped wood prior to charging in the pilot digester. Since this has both operational and raw material cost implications, it is worth understanding whether this treatment is nec-essary. A comparison of runs 253A and 254A suggest that this treatment has no detectable adverse effect:
362ND CUMULATIVE REPORT | APRIL 2013 - MARCH 2014
• Figure C-P-4.1 shows that the pH profile over time is the same between the two cooks. Similarly in Fig-ure C-P-4.2, the usage of equivalent SO2 profile is the same for these two cooks. In fact, SO2 residual is needed in the cook to enable sulfonation. Even at the lower SO2 charge of 6-7% on wood, there remained a residual of 1.1% to 1.4% on the wood. Reducing chip size would decrease the amount of SO2 residual, but there seems to be little opportunity available for further residual reduction.
• Figure C-P-4.3 shows that sugar forms in the liquor at the same rate; however, there may be a slight hint that the re-chipped wood begins to lose sugar to degradation sooner.
• Figure C-P-4.4 shows that the formation of furans is similar for both samples, with perhaps a hint that the re-chipped wood has more furans, consistent with the hint in Figure C-P-4.2.
In summary, there is no apparent disadvantage to using chips as-is. They behave remarkably similar to the re-chipped wood.
Chemical/Time/Temperature Optimization: The Cumu-lative Perspective
Building on the success of lower temperature runs from work earlier in this project year, such as Cook 262A and 271A, the pretreatment conditions for the NARA FS-10 feedstock was further optimized with a combination of lower temperature, lower chemical dosage and shorter pretreatment time. The following optimized results at lower temperatures of 145°C and 140°C were compared with the previous results at the higher temperature of 165°C. The results are summa-rized in Table C-P-4.3. It should be noted that lower temperatures are desirable for reducing inhibitor for-mation. In conclusion, the most optimal pretreatment conditions are represented by pretreatment run 351A:
• While the cooking temperature was maintained at 145°C and the chemical dosage was kept at 6% SO2 equivalent on wood (7.3% as calcium bisulfite and 1.4% as free SO2 on wood), the pretreatment time was reduced from 240 minutes to 180 minutes at
the same cook temperature. This produced a yield of 80.38% on wood. The results are summarized and compared in Table C-P-4.1. Figure C-P-4.1 also shows the total sugar formation in the prehydrolysate liquor, which contains 19.62% of the original wood material.
• Compared to the higher temperature cook at 165°C for 75 minutes, the total furan formation results are shown in Figure C-P-4.3 for the pretreatment times of 240 and 180 minutes at lower temperatures. While a 50% reduction was previously associated with the drop from 165°C to 145°C, an 80% drop for the lower temperature and reduced time is now evident.
• After enzymatic hydrolysis for 96 hours, fermentation was conducted on the optimized pretreated FS-10 feedstock hydrolysate with a standard ethanol yeast NABC Bio-Ferm® XR. The ethanol titer and lignin content in the fermented residuals are shown in Ta-bles C-P-4.2 and C-P-4.3. This data shows that the higher the sugar yields, the higher the ethanol titers are in the fermentation.
The optimization results in Table C-P-4.2 show that while the cooking temperature was maintained at 145°C and the chemical dosage was kept at 6% SO2 equivalent on wood, the total sugar yield increased from 82% to 88% by reducing cooking time from 240 minutes to 180 minutes at cook temperature. At the same temperature of 145°C and same cooking time of 240 minutes, the total sugar yield increased from 82% to 87% when the SO2 dosage increased from 6% to 7% on wood. When the cooking time decreas-es from 180 minutes to 120 minutes at 145°C, the total sugar yield decreased from 88% to 81%. When the cooking temperature further decreased from 145°C to 140°C while the cooking time was the same at 240 minutes, the total sugar yield decreased from 82-87% to 76%. Figure C-P-4.2 shows the total sugar formation in the prehydrolysate liquor. The pretreatments with higher total sugar yields showed level or increasing total liquor sugar while the formation of furan (hy-droxymethylfurfural and furfural) was very low in the
liquor as shown in Figure C-P-4.6. Compared to the higher temperature cook at 165°C for 75 minutes, the furan formation was reduced by 55% in 333A cook and 77% in 351A cook, respectively for 240 and 180 minute cooking time at 145°C.
The hydrolysate samples produced from the pre-treated biomass samples, 333A, 336A, 351A and 355A were also used to test the ethanol fermentabil-ity with a standard ethanol fermenting yeast, NABC Bio-Ferm® XR Saccharomyces cerevisiae (North American Bioproducts Corporation, Duluth, GA). The fermentation was conducted in 100 ml hydrolysate in 250-mL Erlenmeyer shake flask, supplemented with urea (1 g/L) and corn steep liquor (0.5%). The yeast seed was 2 g/L in the hydrolysate. The fermentation temperature was controlled at 33°C. The fermentation went extremely well and was completed within 48 hours. With about 15% pretreated biomass loading after hydrolysis and fermentation, the ethanol titer in the fermentation broth achieved 3.9% (wt/wt) in the hydrolysate samples of 333A and 351A, while the sample from 336A only achieved 3.3% ethanol. The carbohydrate in the fermented residuals was as low as 9.6% and the lignin (Klason lignin and acid soluble) was as high as 73% in the 333A sample. The overall sugar balance is shown in Figure C-P-4.7.
An interesting observation about the effect of tem-perature on pretreatment is that higher pretreatment temperatures result in denser pulp. The apparent den-sities of pretreated FS-10 feedstocks are compared at cook temperatures of 165°C, 145°C and 140°C. The results are summarized in Figure C-P-4.8 and Table C-P-4.4.
Various cooked FS-10 biomass samples were tested for apparent densities by filling a graduated cylinder with 20 grams of wet pulp. The apparent pretreated and refined biomass density was calculated by the oven-dried biomass divided by the apparent volume of the biomass in the graduate cylinder (Figure C-P-4.8). The results in table C-P-4.4 show that when the cooking temperature is lower, the pretreated material’s apparent density is lighter. This is a useful parameter
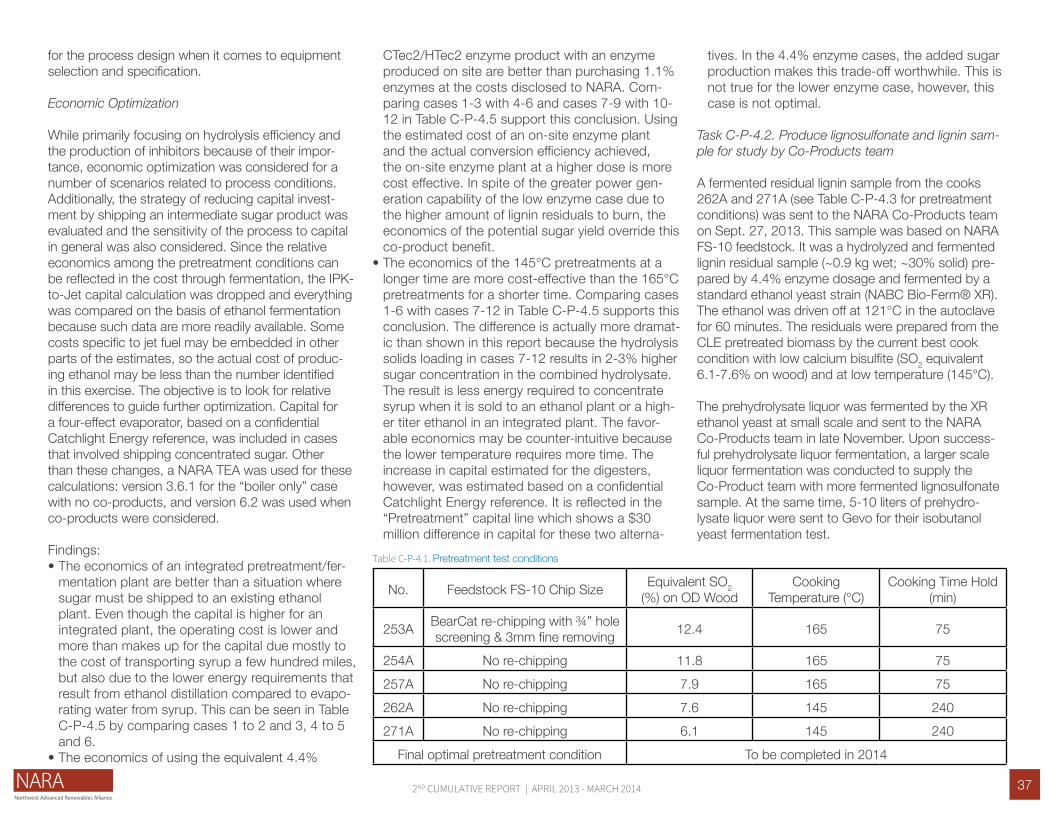
372ND CUMULATIVE REPORT | APRIL 2013 - MARCH 2014
for the process design when it comes to equipment selection and specification.
Economic Optimization
While primarily focusing on hydrolysis efficiency and the production of inhibitors because of their impor-tance, economic optimization was considered for a number of scenarios related to process conditions. Additionally, the strategy of reducing capital invest-ment by shipping an intermediate sugar product was evaluated and the sensitivity of the process to capital in general was also considered. Since the relative economics among the pretreatment conditions can be reflected in the cost through fermentation, the IPK-to-Jet capital calculation was dropped and everything was compared on the basis of ethanol fermentation because such data are more readily available. Some costs specific to jet fuel may be embedded in other parts of the estimates, so the actual cost of produc-ing ethanol may be less than the number identified in this exercise. The objective is to look for relative differences to guide further optimization. Capital for a four-effect evaporator, based on a confidential Catchlight Energy reference, was included in cases that involved shipping concentrated sugar. Other than these changes, a NARA TEA was used for these calculations: version 3.6.1 for the “boiler only” case with no co-products, and version 6.2 was used when co-products were considered.
Findings:• The economics of an integrated pretreatment/fer-
mentation plant are better than a situation where sugar must be shipped to an existing ethanol plant. Even though the capital is higher for an integrated plant, the operating cost is lower and more than makes up for the capital due mostly to the cost of transporting syrup a few hundred miles, but also due to the lower energy requirements that result from ethanol distillation compared to evapo-rating water from syrup. This can be seen in Table C-P-4.5 by comparing cases 1 to 2 and 3, 4 to 5 and 6.
• The economics of using the equivalent 4.4%
CTec2/HTec2 enzyme product with an enzyme produced on site are better than purchasing 1.1% enzymes at the costs disclosed to NARA. Com-paring cases 1-3 with 4-6 and cases 7-9 with 10-12 in Table C-P-4.5 support this conclusion. Using the estimated cost of an on-site enzyme plant and the actual conversion efficiency achieved, the on-site enzyme plant at a higher dose is more cost effective. In spite of the greater power gen-eration capability of the low enzyme case due to the higher amount of lignin residuals to burn, the economics of the potential sugar yield override this co-product benefit.
• The economics of the 145°C pretreatments at a longer time are more cost-effective than the 165°C pretreatments for a shorter time. Comparing cases 1-6 with cases 7-12 in Table C-P-4.5 supports this conclusion. The difference is actually more dramat-ic than shown in this report because the hydrolysis solids loading in cases 7-12 results in 2-3% higher sugar concentration in the combined hydrolysate. The result is less energy required to concentrate syrup when it is sold to an ethanol plant or a high-er titer ethanol in an integrated plant. The favor-able economics may be counter-intuitive because the lower temperature requires more time. The increase in capital estimated for the digesters, however, was estimated based on a confidential Catchlight Energy reference. It is reflected in the “Pretreatment” capital line which shows a $30 million difference in capital for these two alterna-
tives. In the 4.4% enzyme cases, the added sugar production makes this trade-off worthwhile. This is not true for the lower enzyme case, however, this case is not optimal.
Task C-P-4.2. Produce lignosulfonate and lignin sam-ple for study by Co-Products team
A fermented residual lignin sample from the cooks 262A and 271A (see Table C-P-4.3 for pretreatment conditions) was sent to the NARA Co-Products team on Sept. 27, 2013. This sample was based on NARA FS-10 feedstock. It was a hydrolyzed and fermented lignin residual sample (~0.9 kg wet; ~30% solid) pre-pared by 4.4% enzyme dosage and fermented by a standard ethanol yeast strain (NABC Bio-Ferm® XR). The ethanol was driven off at 121°C in the autoclave for 60 minutes. The residuals were prepared from the CLE pretreated biomass by the current best cook condition with low calcium bisulfite (SO2 equivalent 6.1-7.6% on wood) and at low temperature (145°C).
The prehydrolysate liquor was fermented by the XR ethanol yeast at small scale and sent to the NARA Co-Products team in late November. Upon success-ful prehydrolysate liquor fermentation, a larger scale liquor fermentation was conducted to supply the Co-Product team with more fermented lignosulfonate sample. At the same time, 5-10 liters of prehydro-lysate liquor were sent to Gevo for their isobutanol yeast fermentation test.
No. Feedstock FS-10 Chip Size Equivalent SO2 (%) on OD Wood
Cooking Temperature (°C)
Cooking Time Hold (min)
253A BearCat re-chipping with ¾” hole screening & 3mm fine removing 12.4 165 75
254A No re-chipping 11.8 165 75257A No re-chipping 7.9 165 75262A No re-chipping 7.6 145 240271A No re-chipping 6.1 145 240
Final optimal pretreatment condition To be completed in 2014
Table C-P-4.1. Pretreatment test conditions

382ND CUMULATIVE REPORT | APRIL 2013 - MARCH 2014
00.20.40.60.8
11.21.41.61.8
2
0 100 200 300
pH in
Pre
trea
tmen
t Liq
uor
Pretreatment Time (minutes)
53A
54A
57A
62A
71A
0%
2%
4%
6%
8%
10%
12%
14%
0 100 200 300Equi
vale
nt S
O2
Left
(% o
n w
ood)
Pretreatment Time (minutes)
53A
54A
57A
62A
71A
0
0.01
0.02
0.03
0.04
0.05
0.06
0 100 200 300
Tota
l Fur
an (k
g) in
Liqu
or
Pretreatment Time (minutes)
53A
54A
57A
62A
71A
Figure C-P-4.1. pH profiles during pretreatment. Conditions: 253A (SO2 12.4%, 165°C, 75 min); 254A (SO2 11.8%, 165°C, 75 min); 257A (SO2 7.9%, 165°C, 75 min); 262A (SO2 7.6%, 145°C, 240 min); 271A (SO2 6.1%,
145°C, 240 min).
Figure C-P-4.3. Monomeric sugar formation in liquor during pretreatment. Conditions: 253A (SO2 12.4%, 165°C, 75 min); 254A (SO2 11.8%, 165°C, 75 min); 257A (SO2 7.9%, 165°C, 75 min); 262A (SO2 7.6%, 145°C, 240
min); 271A (SO2 6.1%, 145°C, 240 min).
Figure C-P-4.2. SO2 equivalent amount on wood during pretreatment as residual in the liquor. Conditions: 253A (SO2 12.4%, 165°C, 75 min); 254A (SO2 11.8%, 165°C, 75 min); 257A (SO2 7.9%, 165°C, 75 min); 262A (SO2
7.6%, 145°C, 240 min); 271A (SO2 6.1%, 145°C, 240 min).
Figure C-P-4.4. Furan (total HMF and furfural) formation in liquor during pretreatment. Conditions: 253A (SO2 12.4%, 165°C, 75 min); 254A (SO2 11.8%, 165°C, 75 min); 257A (SO2 7.9%, 165°C, 75 min); 262A (SO2 7.6%,
145°C, 240 min); 271A (SO2 6.1%, 145°C, 240 min).

392ND CUMULATIVE REPORT | APRIL 2013 - MARCH 2014
Feed-stocks, analysis
based on 100 kg OD
wood
Cook No. Temp., °C Time at T, min
Equivalent SO2 on
wood (%)
Pulp Yield, %
Furan for-mation, % on wood
Acetic acid formation,
% on wood
Pulp sugar composi-tion, %
Sugar in liquor, kg
Sugar in hydrolysis,
kg
Total Sugar Yield (%)
Douglas-fir, FS-10 253A 165 75 12.4 68.1 1.51 2.13 53.9 9.4 39.6 73
Douglas-fir, FS-10 254A 165 75 11.8 65.7 1.37 2.05 47.9 11.8 24.8 -**
Douglas-fir, FS-10 257A 165 75 7.9 74.4 1.65 1.89 56.7 12.0 42.4 82
Douglas-fir, FS-10 262A 145 240 7.6 78.9 0.28 1.71 55.2 10.9 42.3 80
Douglas-fir, FS-10 271A 145 240 6.1 76.6 0.75 1.93 55.3 12.6 42.4 82
Douglas-fir, FS-10 333A 145 240 7.2 78.2 0.68 1.91 54.4 14.3 43.1 87
Douglas-fir, FS-10 336A 140 240 4.9 79.5 0.24 1.70 52.4 10.6 40.9 76
Douglas-fir, FS-10 351A 145 180 6.0 80.4 0.35 1.88 62.4 10.7 46.4 88
Douglas-fir, FS-10 355A 145 120 6.5 82.3 0.17 1.72 56.8 8.6 45.7 81
Table C-P-4.2. Pretreatment Summary: 54A pretreated feedstock was air-dried, so this data is inconsistent with other samples
Table C-P-4.3. Hydrolysate Fermentation Summary of Pretreated Douglas-fir FS-10 Feedstocks
Cook No. Pretreated biomass loading at hydrolysis (%)
Ethanol titer (%wt/wt) after fermentation
Carbohydrate in fermented residuals (%wt/wt)
Total lignin in fermented residuals (%wt/wt)
333A 14.7 3.9 9.6 72.0336A 15.0 3.3 34.0 61.1351A 14.9 3.9 21.4 70.0355A 14.9 3.7 25.4 64.9
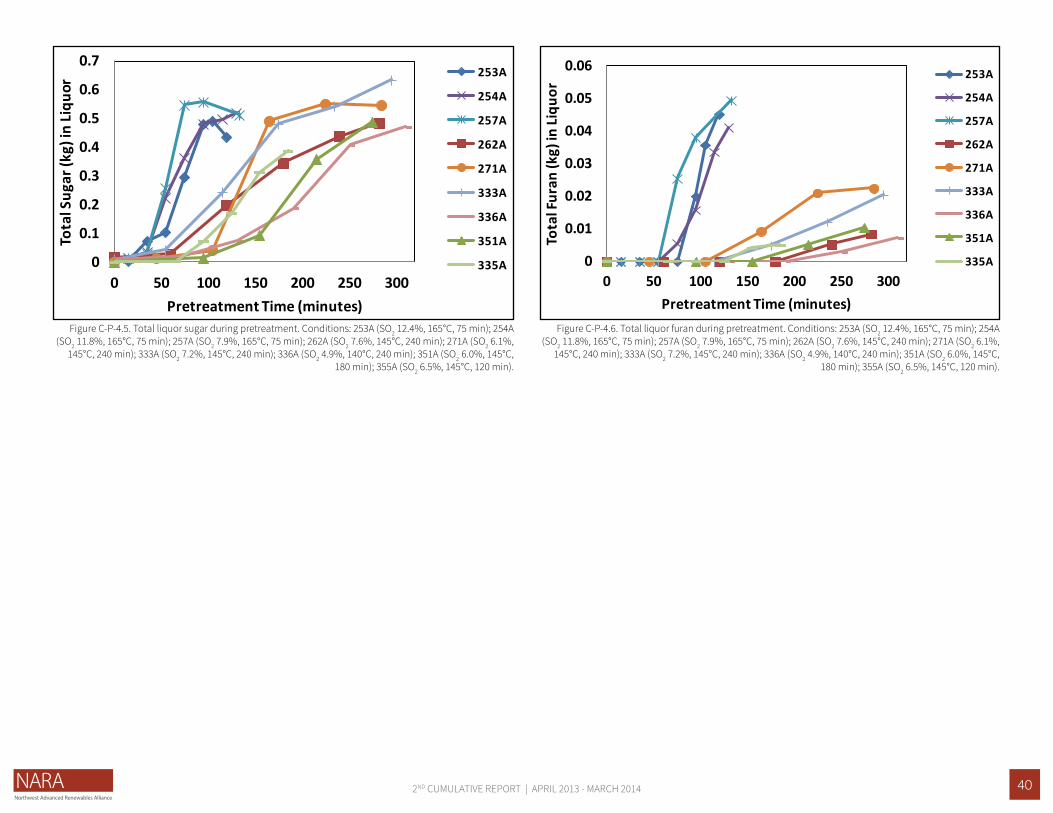
402ND CUMULATIVE REPORT | APRIL 2013 - MARCH 2014
0
0.1
0.2
0.3
0.4
0.5
0.6
0.7
0 50 100 150 200 250 300
Tota
l Sug
ar (k
g) in
Liqu
or
Pretreatment Time (minutes)
253A
254A
257A
262A
271A
333A
336A
351A
335A 0
0.01
0.02
0.03
0.04
0.05
0.06
0 50 100 150 200 250 300
Tota
l Fur
an (k
g) in
Liqu
or
Pretreatment Time (minutes)
253A
254A
257A
262A
271A
333A
336A
351A
335A
Figure C-P-4.5. Total liquor sugar during pretreatment. Conditions: 253A (SO2 12.4%, 165°C, 75 min); 254A (SO2 11.8%, 165°C, 75 min); 257A (SO2 7.9%, 165°C, 75 min); 262A (SO2 7.6%, 145°C, 240 min); 271A (SO2 6.1%,
145°C, 240 min); 333A (SO2 7.2%, 145°C, 240 min); 336A (SO2 4.9%, 140°C, 240 min); 351A (SO2 6.0%, 145°C, 180 min); 355A (SO2 6.5%, 145°C, 120 min).
Figure C-P-4.6. Total liquor furan during pretreatment. Conditions: 253A (SO2 12.4%, 165°C, 75 min); 254A (SO2 11.8%, 165°C, 75 min); 257A (SO2 7.9%, 165°C, 75 min); 262A (SO2 7.6%, 145°C, 240 min); 271A (SO2 6.1%,
145°C, 240 min); 333A (SO2 7.2%, 145°C, 240 min); 336A (SO2 4.9%, 140°C, 240 min); 351A (SO2 6.0%, 145°C, 180 min); 355A (SO2 6.5%, 145°C, 120 min).

412ND CUMULATIVE REPORT | APRIL 2013 - MARCH 2014
Figure C-P-4.7. Overall Sugar Balance for Optimized Pilot Run on FS-10.
CLE Bisulfite Pretreatment Mass Balance for Aspen
Pretreatment 42 min to 145°C 180 min at 145°C
Enzymatic Hydrolysis of
14.9% (w/w) Solid at pH 5.0, 50°C
Mass Balance Unit Biomass 100 kg
Polymer Sugar Input Glucan 39.67 kg Xylan 5.19 kg
Mannan 11.23 kg Arabinan 1.16 kg Galactan 2.84 kg Total 60.09 kg
Items Values Units Polymer Sugar ComposiJon (%)
Pulp Yield 80.3 % Solid Out 80.3 kg OD
Polymer Sugar Output Glucan 41.32 kg 51.40 Xylan 2.99 kg 3.71
Mannan 4.39 kg 5.46 Arabinan 0.34 kg 0.42 Galactan 1.12 kg 1.39 Total 50.14 kg 62.38
Calcium bisulfite on wood: 7.3% Free SO2 on wood: 1.41%
Pretreated Liquor 309.0 liters
Enzyme Dose (g/g solid) CTec 0.04 HTec 0.004
Enzyme CTec/HTec Total Sugar Yield (%) on Wood
Sugar 88
Hydrolysate: Monomeric Sugars aAer EnzymaDc Hydrolysis
Sugars Total Sugar
(kg) Sugar Titer
(%) Glucose 35.37 7.28 Xylose 2.74 0.58
Mannose 3.84 0.79 Arabinose 0.29 0.06 Galactose 0.99 0.20 Total sugar 43.24 8.92
Total Sugar Yields on Biomass Sugar
pH 1.26
Water
Water
Low Inhibitor FormaDon in Liquor Components On wood (%) Titer (%)
HMF 0.17 0.017 Furfural 0.35 0.057
Prehydrolysate (SSL) Sugars
Sugars Total Sugar
(kg) Sugar Titer
(%) Glucose 1.61 0.52 Xylose 2.40 0.78
Mannose 4.75 1.54 Arabinose 0.45 0.15 Galactose 1.50 0.49 Total sugar 10.71 3.47
By Johnway Gao, Dwight Anderson March 11, 2014
Other components in pretreated biomass Klason lignin (%) 23.45
Acid soluble lignin (%) 0.48 ExtracJves (%) 14.2
Ash (%) 2.93
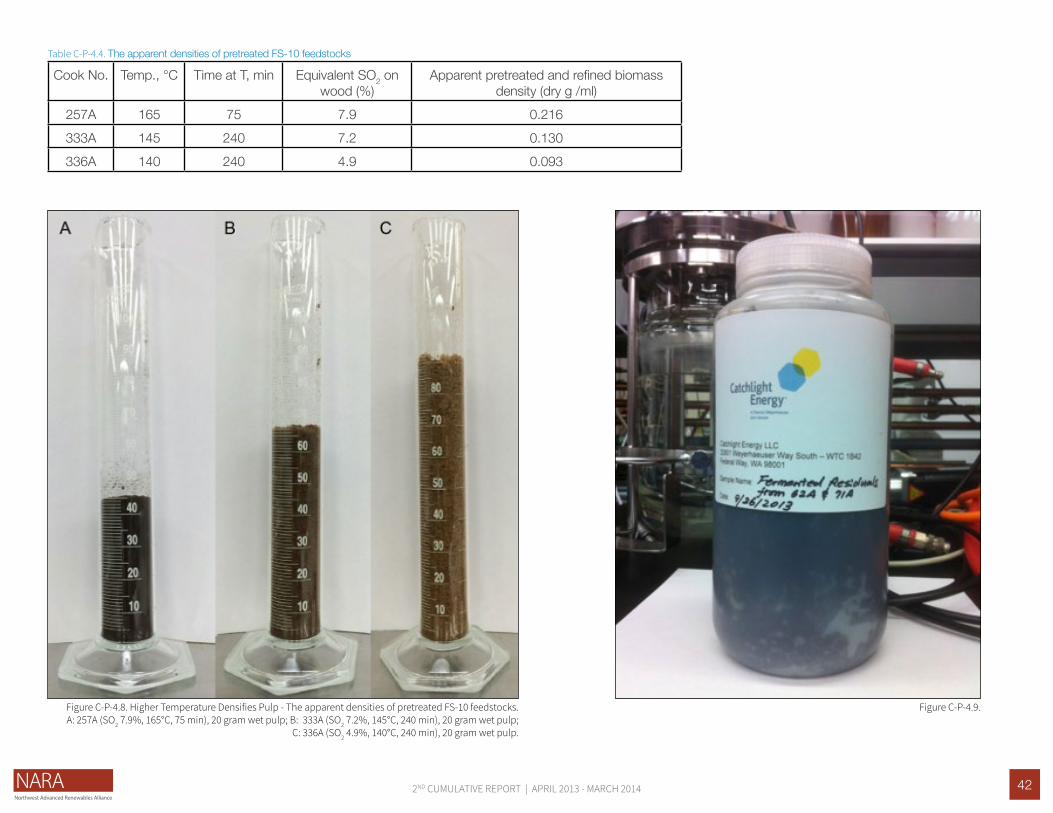
422ND CUMULATIVE REPORT | APRIL 2013 - MARCH 2014
Cook No. Temp., °C Time at T, min Equivalent SO2 on wood (%)
Apparent pretreated and refined biomass density (dry g /ml)
257A 165 75 7.9 0.216333A 145 240 7.2 0.130336A 140 240 4.9 0.093
Figure C-P-4.8. Higher Temperature Densifies Pulp - The apparent densities of pretreated FS-10 feedstocks. A: 257A (SO2 7.9%, 165°C, 75 min), 20 gram wet pulp; B: 333A (SO2 7.2%, 145°C, 240 min), 20 gram wet pulp;
C: 336A (SO2 4.9%, 140°C, 240 min), 20 gram wet pulp.
Figure C-P-4.9.
Table C-P-4.4. The apparent densities of pretreated FS-10 feedstocks

43
Case 1 2 3 4 5 6 7 8 9 10 11 12Pretreatment ID# 71A 71A 71A 71A 71A 71A 57A 57A 57A 57A 57A 57ADescription Integrated on-site enzymesShip 31% Sugar, On-site enzymesShip 50% sugar, on-site enzymesIntegrated, low enzyme purchaseShip 31% sugar, low enzyme purchaseShip 50% Sugar, low enzyme purchaseIntegrated on-site enzymes, high titer runShip 31% Sugar, On-site enzymesShip 50% sugar, on-site enzymesIntegrated, low enzyme purchaseShip 31% sugar, low enzyme purchaseShip 50% Sugar, low enzyme purchaseFeedstock ODSTPD (NARA FS-10) 2200 2200 2200 2200 2200 2200 2200 2200 2200 2200 2200 2200
% Glucan 39.67 39.67 39.67 39.67 39.67 39.67 39.67 39.67 39.67 39.67 39.67 39.67% Galactan 2.84 2.84 2.84 2.84 2.84 2.84 2.84 2.84 2.84 2.84 2.84 2.84% Mannan 11.23 11.23 11.23 11.23 11.23 11.23 11.23 11.23 11.23 11.23 11.23 11.23% Arabinan 1.16 1.16 1.16 1.16 1.16 1.16 1.16 1.16 1.16 1.16 1.16 1.16% Xylan 5.19 5.19 5.19 5.19 5.19 5.19 5.19 5.19 5.19 5.19 5.19 5.19
Base (Ca w/out recycle, Mg w/90% recycle) Ca Ca Ca Ca Ca Ca Ca Ca Ca Ca Ca CaPretreatment Conditions
Cook Temp (°C) 145 145 145 145 145 145 165 165 165 165 165 165Heat Up Time (min.) 45 45 45 45 45 45 58 58 58 58 58 58Pretreatment Time (min.) 240 240 240 240 240 240 75 75 75 75 75 75Total SO2, % on wood 6.06 6.06 6.06 6.06 6.06 6.06 7.89 7.89 7.89 7.89 7.89 7.89% of total SO2 bound to bisulfite cation 66.3 66.3 66.3 66.3 66.3 66.3 59.9 59.9 59.9 59.9 59.9 59.9
Enzymes Purchased? (Y/N) N N N Y Y Y N N N Y Y Y% CTec2/HTec2 on Pretreated 4.4% 4.4% 4.4% 1.0% 1.0% 1.0% 4.4% 4.4% 4.4% 1.1% 1.1% 1.1%
Hydrolysate Sugar Production (ODTPD) 742.2 742.2 742.2 374.1 374.1 374.1 656.0 656.0 656.0 408.6 408.6 408.6 Prehydrolysate Sugar Production (ODTPD) 329.7 329.7 329.7 251.4 251.4 251.4 260.2 260.2 260.2 260.2 260.2 260.2 Combined Sugar Production (ODTPD) 1,071.8 1,071.8 1,071.8 625.5 625.5 625.5 916.2 916.2 916.2 668.8 668.8 668.8 Combined Sugar Concentration (% Sugar) 8.2 8.2 8.2 5.4 5.4 5.4 10.8 10.8 10.8 8.2 8.2 8.2 Final Sugar Concentration (% Sugar) 9.0 31.0 50.0 9.0 31.0 50.0 10.8 31.0 50.0 9.0 31.0 50.0 TPD water removed for concentrating 1,161.9 9,613.6 10,927.5 4,633.2 9,565.3 10,332.1 - 5,491.5 6,614.6 697.4 5,971.0 6,790.8 Ethanol production (equiv, MM gal/year) 49.8 49.8 49.8 28.6 28.6 28.6 42.6 42.6 42.6 31.1 31.1 31.1 Steam Demands (MM Btu/hr)
Net Pretreatment MM BTU/HR 42.8 42.8 42.8 42.8 42.8 42.8 54.2 54.2 54.2 54.2 54.2 54.2Concentrate Sugar MM BTU/HR 77.5 640.9 728.5 308.9 637.7 688.8 0.0 366.1 441.0 46.5 398.1 452.7Lignin Drying MM BTU/HR (+AC mfg) 57.3 57.3 57.3 82.7 82.7 82.7 64.2 64.2 64.2 77.8 77.8 77.8Ethanol Production MM BTU/HR 162.6 85.5 85.5 93.4 49.1 49.1 73.1 73.1 73.1 53.3 53.3 53.3Total Demand at Site of Sugar Plant 340.1 741.0 828.5 527.8 763.2 814.3 191.4 557.5 632.4 178.5 583.4 638.1
Steam Supply (MM Btu/hr)Sulfur burning 17.5 17.5 17.5 17.5 17.5 17.5 22.8 22.8 22.8 22.8 22.8 22.8Lignin Residual Burning 663.6 663.6 663.6 958.1 958.1 958.1 743.5 743.5 743.5 901.7 901.7 901.7Lignosulfonate Burning 178.6 178.6 178.6 178.6 178.6 178.6 203.6 203.6 203.6 203.6 203.6 203.6
Power Demand (kW)Sugar Plant (& AC plant when applicable) 24818 24818 24818 24961 24961 24961 23876 23876 23876 23877 23877 23877Ethanol Plant 2661 2661 2661 1529 1529 1529 2275 2275 2275 1660 1660 1660MM BTU/HR steam for on-site power 375 338 338 361 340 340 357 326 326 348 326 326
Power SupplykW generated 38098 8704 2281 45928 28669 24921 57084 30240 24750 69626 39937 35929Purchased Steam (MM BTU/HR) if > 0 -145 220 307 -265 -51 1 -422 -87 -12 -601 -219 -164or kW sold from Sugar Plant if > 0 10618 -16114 -22537 19438 3709 -39 30934 6364 874 44089 16060 12053L/ODT 261 261 261 150 150 150 223 223 223 163 163 163kWH/L sold (if >0) 0.44 (0.67) (0.94) 1.41 0.27 (0.00) 1.51 0.31 0.04 2.95 1.08 0.81
Operational Costs ($/gal ethanol)Feedstock 1.09 1.09 1.09 1.89 1.89 1.89 1.27 1.27 1.27 1.74 1.74 1.74
Natural Gas - 0.18 0.24 - - 0.02 - 0.02 0.02 - 0.02 0.02 Power Cost (not including credit) - 0.03 0.03 - 0.03 0.03 - 0.03 0.03 - 0.03 0.03 Enzymes - - - 0.20 0.20 0.20 - - - 0.20 0.20 0.20 Chemicals Sulfur Consumption 0.04 0.04 0.04 0.06 0.06 0.06 0.05 0.05 0.05 0.07 0.07 0.07 CaCO3 Consumption 0.01 0.01 0.01 0.02 0.02 0.02 0.02 0.02 0.02 0.02 0.02 0.02 MgO Make-Up - - - - - - - - - - - - Maintenance Materials 0.32 0.28 0.28 0.54 0.48 0.48 0.34 0.29 0.30 0.46 0.39 0.39 Labor 0.18 0.18 0.18 0.30 0.30 0.30 0.20 0.20 0.20 0.28 0.28 0.28 Co-product opex (from TEA 6.2) - - - - - - - - - - - - Transport ethanol and (if needed) sugar 0.06 0.60 0.43 0.06 0.60 0.43 0.06 0.60 0.43 0.06 0.60 0.43 Waste Disposal 0.03 0.03 0.03 0.05 0.05 0.05 0.04 0.04 0.04 0.05 0.05 0.05
Sub-Total $/gal 1.70 2.42 2.31 3.12 3.64 3.48 1.97 2.52 2.35 2.88 3.41 3.23 By-Product Credits
50% Calcium Ligno-Sulfonate - - - - - - - - - - - - Activated Carbon - - - - - - - - - - - - Power (sell) 0.10 - - 0.32 0.06 - 0.34 0.07 0.01 0.67 0.24 0.18
Sub-Total $/gal 0.10 - - 0.32 0.06 - 0.34 0.07 0.01 0.67 0.24 0.18 Capital $MM (Based on NARA TEA)
Feedstock handling 43.9 43.9 43.9 43.9 43.9 43.9 43.9 43.9 43.9 43.9 43.9 43.9Pretreatment 133.0 133.0 133.0 133.0 133.0 133.0 103.5 103.5 103.5 103.5 103.5 103.5Enzyme Production and Hydrolysis 39.6 39.6 39.6 25.4 25.4 25.4 39.6 39.6 39.6 25.4 25.4 25.4Fermentation and Separation 61.7 0.0 0.0 44.6 0.0 0.0 61.7 0.0 0.0 61.7 0.0 0.0
CLE Concentrator (4 effect, not in NARA) 11.6 41.4 44.7 27.6 42.6 44.6 0.0 30.5 34.1 8.9 32.1 34.7IPK to Jet or co-products, as needed 0.0 0.0 0.0 0.0 0.0 0.0 0.0 0.0 0.0 0.0 0.0 0.0Wastewater Treatment 49.4 49.4 49.4 49.4 49.4 49.4 49.4 49.4 49.4 49.4 49.4 49.4Product Storage, Blending, Distribution 29.8 14.2 10.7 29.8 14.2 10.7 29.8 12.9 9.7 29.8 12.9 9.7Power Boiler 48.4 48.4 48.4 57.9 57.9 57.9 51.9 51.9 51.9 56.9 56.9 56.9Utilities 6.9 6.9 6.9 6.9 6.9 6.9 6.9 6.9 6.9 6.9 6.9 6.9Other Direct (based on ISBL) 50.7 45.1 45.7 48.0 42.9 43.2 43.5 38.1 38.7 42.6 35.9 36.3Indirect Cost 285.0 253.1 253.3 279.9 249.7 249.0 258.1 226.0 226.6 257.4 220.2 220.1Fixed Capital Investment (land, working capital)25.4 25.4 25.4 25.4 25.4 25.4 25.4 25.4 25.4 25.4 25.4 25.4
Sub-Total $MM 785 700 701 772 691 689 714 628 630 712 613 612Sub-Total $/gal, 12.5% Capital Recovery Factor 1.97 1.76 1.76 3.37 3.02 3.01 2.09 1.84 1.85 2.86 2.46 2.46 Total Cost $/gal 3.57 4.18 4.07 6.17 6.59 6.49 3.72 4.29 4.18 5.07 5.63 5.51
OR
Group A: Improved Pretreatment, but low hydrolysis solids Group B: Higher Titer Hydrolysis
Table C-P-4.5. Modeling Relative Pretreatment Condition Economics
Physical and Intellectual OutputsRESEARCH PRESENTATIONSPoster Presentation at NARA Annual Meeting in Cor-
valis, OR in September 2013: Mild Bisulfite Pre-treatment, by Dwight Anderson and Johnway Gao
Gao, Johnway; Anderson, Dwight; “Optimization of Mild Bisulfite Pretreatment on Softwood,” Harvest-ing Clean Energy Conference, Helena, Montana, February 4-6, 2014.
Gao, Johnway; Anderson, Dwight; “Optimization of Mild Bisulfite Pretreatment on Pacific Northwest Softwood,” Northwest Wood-Based Biofuels and Co-Products Conference, Seattle, Washington, April 28-30, 2014.
Recommendations | ConclusionsWhile further optimization is certainly possible, the most optimal condition in the Year 3 scale up work conducted jointly by Forest Products Lab and Catch-light Energy was targeted. The preferred conditions are as shown for the 145°C pretreatment, with 4.0% CTec2 on pretreated feedstock and 0.4% HTec2 on pretreated feedstock, with 6% total SO2 on wood that includes 6-7% calcium bisulfite on wood. A total cook time of 3 hours is adequate, although 4 hours was used in the first run by Forest Products Lab to pro-duce the final, large lignin residual and lignosulfonate samples required by Gevo and the Co-Products team.
Although separate sugar production transported to another location is not as cost-effective as an integrat-ed plant, we will continue to explore a trial alternative that makes use of the Cosmo mill in Cosmopolis, Washington to do a demonstration or off-site produc-tion.
442ND CUMULATIVE REPORT | APRIL 2013 - MARCH 2014
Task Description
Activities and Results
Key Personnel Affiliation Johnway Gao Weyerhauser
A majority of current pretreatment technologies use chemical or thermal treatments to alter the lignocellu-losic structure and enhance saccharification. Many of these methods have been proven to be effective with high yield. But the disadvantage of these methods involve the costs of chemicals, chemical recycling, or capital cost to achieve efficient scale; environmental consequence of the chemical use; and contamination of both the pretreated feedstock or lignin co-products. Evidence exists in the literature that milling of lignocel-lulosic materials to micron- or nano-scale can pro-duce good hydrolysis performance without the use of any chemicals in the pretreatment. To effectively utilize this approach to mechanical pretreatment, energy effi-cient methods of milling are needed. Recent advances in ball mill designs have yielded commercial equip-ment that potentially can mill wood in the sub-micron size range with low energy input. This technique has been investigated in preliminary trials and found to yield adequate sugar production in an un-optimized condition. A preliminary techno-economic analysis estimates nearly a 40% savings in total pretreatment costs compared to the current bisulfite processes. This technology also demonstrates a strong potential for cost effectiveness at small scales, thereby facilitat-ing deployment in depot settings.
While moving towards a feasibility validation of this mechanical pretreatment method, the goals for Year 3 were to investigate the potential yield improvements, verify energy consumption, and environmental bur-dens by manipulating process parameters. The tasks were as follows:
• Comprehensive literature study of wood milling technologies
The clean sugar and lignin pretreatment project was initiated in October, 2013 under the NARA Year 3 funding. All the activities are outlined above and fo-cused on the feasibility and validation of a mechanical pretreatment method:
• A literature study was performed on relevant wood or biomass chipping and milling technologies and on commercial machinery. With the techno-eco-nomic analysis, the milling process for clean sugar production and lignin fuel production seems plausi-bly feasible if the overall energy consumption ranges from 1.45-1.73 kWh/oven dry (OD) kg wood from wood chips to sugar and lignin products, where 0.56-0.84 kWh/OD kg wood is the targeted energy for wood milling.
• The LCA was performed on the wood milling pro-cess. The wood drying step, either by natural gas or by wood residuals as fuels, contributes to the emission of carbon dioxide equivalent (CO2e), while the mechanical wood chipping or milling by abun-dant hydroelectricity in the Northwest does not emit
TASK C-P-5: CLEAN SUGAR AND LIGNIN PRETREATMENT TECHNOLOGY• Conduct life cycle analysis (LCA) of wood milling• Verify energy consumption in tandem mill at [redact-
ed]• Produce small-scale clean sugar and lignin for Gevo
fermentation and lignin co-product evaluation• Optimize hydrolysis• Produce large-scale clean sugar and lignin produc-
tion for Gevo fermentation and lignin co-product evaluation
Expected Outputs are:
• Report on the feasibility of the mechanical pretreat-ment method with specific yield, cost, and environ-mental performance metrics
CO2 to the environment.• An energy consumption evaluation was undertaken
during an on-site visit to a tandem ring milling op-eration in [redacted] in October 2013. Milled FS-10 feedstock samples were obtained during the visit. The efficient milling is being optimized in [redacted] after more Douglas-fir chips FS-01 were sent to [redacted] in March, 2014. More milling optimization results are expected towards end of April and more milled wood samples will be obtained for validation from May to June. All the results will be reviewed for the final feasibility study and report.
• Small scale clean sugar samples and un-fermented and fermented lignin samples were produced. The sugars were provided to Gevo for fermentation evaluation and the lignin was given to the NARA co-product team for co-product testing.
• Various milled wood samples were analyzed for its sugar and lignin composition. In addition, higher milled wood solid was hydrolyzed and fermented with ethanol-producing yeast for hydrolysis evalua-tion. More hydrolyses testing will be conducted for optimization.
The targeted energy consumption by wood milling, which is being optimized, is used for the techno-eco-nomic analysis (TEA) for clean sugar and lignin pro-duction from wood residual chips. Based on the TEA, if the targeted energy consumption of wood milling is met or achieved within the range of 0.56-0.84 kWh/OD kg wood at a sugar conversion yield of about 58-65%, the economics by milling as a pretreatment technology looks plausible.
WOOD MILLING TECHNOLOGY REVIEW
In current milling literature of lignocellulosic sugar con-version from biomass, quantitative analyses showed that in some instances, wet-disk milling (WDM) can achieve high cellulose saccharification yield of 78.5% from milled rice straw with an energy consumption
Information on this page is potentially proprietary and has been omitted and replaced with the word “redacted”. Please contact members of the NARA executive committee (see “organizational structure” in this report) for further information.
452ND CUMULATIVE REPORT | APRIL 2013 - MARCH 2014
of 5.4 MJ/kg biomass (Hideno et al., 2009). In some other instances, WDM can only achieve 44.7% of cel-lulose saccharification yield when bagasse is milled, and a 59.5% yield when sugarcane straw is milled (da Silva et al., 2010). Resized biomass particles of 2 mm were as used and fed into the WDM milling machine with a 20-40 micron gap between the upper and lower grinders, with a biomass to water ratio of about 1 to 20. The water need is large in the WDM. The WDM process is material sensitive and the energy consumption is very high. The energy consumption of WDM process is not yet economical for lignocellulosic sugar conversion from biomass.
In 2008, a tandem ring milling machine was intro-duced by Takahashi et al. (2008). The milling is a dry milling process that does not require water. Japanese cedar of less than 20% moisture was tested in the milling machine. A mean wood particle size of about 30 microns was achieved in 60 minutes with 71% cellulose saccharification yield. The initial goal for economical energy milling was estimated at around 0.9 MJ/kg wood by [redacted]. When the large scale trial is reviewed by [redacted], it is estimated that the targeted energy consumption of Douglas-fir milling will be around 2.0 MJ/kg wood.
LCA OF WOOD MILLING
In the Pacific Northwest, hydroelectricity is used for wood chipping and milling energy. However, wood chip drying can use either natural gas or wood resid-uals as the energy source, which was evaluated for its life cycle assessment (LCA). The LCA reported by ICF International (2012) on natural gas estimated that 78.5 g CO2e/MJ will be generated by upstream natu-ral gas processing and combustion for heating. Thus, the chip drying energy of 0.8278 kWh/OD kg wood (see tandem wood milling section) translates into an emission of 234 g CO2e/kg OD wood, summarized in Table C-P-5.1.
If wood residuals are used as fuel for wood drying, the report by Bowyer (2012) shows that the emission
of 24.6 g CO2e/kWh or 6.8 g CO2e/MJ will be gener-ated. Thus, the chip drying energy of 0.8278 kWh/OD kg wood translates into an emission of 20.4 g CO2e/kg OD wood as shown in Table C-P-5.2.
TANDEM WOOD MILLING
The wood milling process has four steps before the milled wood powder can be enzymatically hydrolyzed for clean sugar and lignin production. These four steps include: (1) Wood residuals chipping; (2) Chip size reduction before drying; (3) Chip drying to reduce chip moisture from 50% to 10%; and (4) Wood milling. The first three steps are well known technol-ogies and the equipment is commercially available. The last step of large scale wood milling, with high performance and optimized energy efficiency, is being tested and will be validated for this project in May and June 2014. The current investigation and analysis results are shown in the tandem milling section.
(1) WOOD RESIDUALS CHIPPING:
Commercial chipping machine is available for wood residual chipping operation. Table C-P-5.3 shows the scale and energy requirement for wood residual chipping.
Two pieces of equipment were reviewed for chip size reduction, one is a wood resizing machine, Crum-blerTM M24 by Forest concepts LLC, and the other is commercially available sawdust making machine. For the tandem wood milling process, wood chips with a 2 mm mean size is required.
(2.1). CRUMBLERTM M24 MACHINE
On September 24, 2013, Douglas-fir FS-10 feedstock chips with a geometric mean dimension (Xgm) of 13.42 mm and a moisture content of 10% were resized into small chips with a Xgm of 1.29 mm in the CrumblerTM M24 machine at Forest Concepts LLC (Auburn, WA). The energy consumption was recorded by LabView® software Universal and analyzed via Excel® based
program Comminution Energy Rev16.5. Figure C-P-5.1 shows the FS-10 sample before and after resizing. Table C-P-5.4 shows the specific energy consumption to resize FS-10 chips to 1.29 mm Xgm, which were used in small scale milling trials at [redacted].
To calculate the specific energy required to convert raw FS-10 wood chips through a cascading multi-stage process involves measuring the energy con-sumed during subsequent passes and applying that energy to the diminishing mass of material to be re-processed, as shown in Table C-P-5.4. The 13.2 mm chips were first resized down to about 5 mm before the chips are further reduced to 2.21 mm (Xgm).
The specific energy required for the first pass of the raw wood chips through the Crumbler™ M24 with 4.8 mm cutters was 27 MJ/OD Mg (7.5 kWh/OD tonne) (Table C-P-5.4). Processing all the mate-rial through recirculation until it passed the No. 10 screen (Xgm = 1.29 mm) consumed 162 MJ/OD Mg or 0.162 MJ/OD kg (45 kWh/tonne). Note that these values would have been considerably lower had the chips been processed at moisture levels above the fiber saturation point. It is expected that a minor increase in target screen size to 2.4 mm will require fewer passes through the Crumbler™ machine and will still yielded a geometric mean particle size of less than 2 mm. It is estimated that increasing the screen to 2.4 from 1.6 mm would reduce the specific energy to approximately 130 MJ/OD Mg or 0.130 MJ/OD kg (36 kWh/tonne).
(2.2). SAWDUST MACHINE
The sawdust machine is commercially available for the production of 2 mm size chips, without requiring two steps in the size reduction process. Table C-P-5.5 shows the scale and energy requirement for wood residual chipping. This sawdust machine does not require initial wood chipping to 5-13 mm size.
Information on this page is potentially proprietary and has been omitted and replaced with the word “redacted”. Please contact members of the NARA executive committee (see “organizational structure” in this report) for further information.

462ND CUMULATIVE REPORT | APRIL 2013 - MARCH 2014
(3). WOOD CHIPS DRYING:
Tandem wood milling or wood milling to fine wood particles requires wood chip moisture of about 10% or less to be efficient. A wood chip drum dryer with a natural gas burner to provide heat energy for wood drying is commercially available. Table C-P-5.6 shows the actual energy needs to dry the wood chips from 50% moisture to 10% moisture. The specific energy requirement is 1375 Btu/lb water (Savovic Z, TSI, Lyn-wood, WA, March 2014, personal communication).
(4). TANDEM WOOD MILLING
(4.1) Large scale tandem milling machine
In October 2013, NARA members visited the team that developed the ttandam ring milling technology. They evaluated the energy consumption of the first tandem ring milling machine with a capacity of one metric ton per hour (MT/hr), which was under optimi-zation studies for design and performance.
The 1 MT/hr tandem machine milling machine (Model HV-70) requires twin 6-meter-long tandem milling chambers equipped with two motors, each capable of 100 kW actual running power. The 6-meter cham-ber tandem ring milling machine was first built in 2011 and tested for its structural stability. It was found that the 6-meter machine was not quite stable in oper-ation, in part from excessive sympathetic vibration. Subsequently, an improved HV-70 version was built in 2012 with twin 3 meter chambers and a 0.5 MT/hr capacity. The improved HV-70 was found to be stable during operation. Large scale optimizations in power, wood chip loading (productivity) and perfor-mance have not been completed yet but are ongoing. The design goal of energy consumption in large scale tandem milling was 0.9 MJ/kg OD wood. At low solid loading of Japanese cedar chips (apparent density = 0.1 kg/L) at 144 kg/hr and 240 kg/hr, the energy consumption would be estimated as 2.5 and 1.4 MJ/kg OD wood, under an assumption that half of the equipped motor power for the 6-meter milling ma-
chine could be needed for the 3-meter improved HV-70 tandem ring milling machine. The best enzymatic hydrolysis yields were 62.5% and 37.6%, respectively. Upon large scale optimization, it is plausible that lower energy consumption will be sufficient to achieve a good enzymatic hydrolysis yield.
The design plan for the tandem ring milling machine will eventually achieve a processing capacity of 1 to 5 metric tons/hr. From October 2013 to December 2014, trials will be conducted with (1) the Improved HV-70 model (3-meter model); (2) a new TR-3000 model (100 kg/hr, under construction now); (3) large scale prototype design/production/test. This program will be reviewed before March 2015 to determine the feasibility of large scale design.
It should be noted that large scale tests or trials re-quire more than 100 kg OD chips of 2 mm Xgm size.
(4.2) Small scale tandem milling trials
Douglas-fir FS-10 feedstocks of 10 kg with 1.29 Xgm were used for milling trials. Small scale milling screen-ing trials were conducted in the small scale tandem ring milling machine (1.6 kg capacity). This small machine has much higher energy consumption as compared to the 0.5 MT/hr machine due to the small machine’s heavy frame design vs. its small capacity. However, the small trials could help understand the particle size distribution vs. milling time and lignocellu-losic conversion yield to sugar.
(4.3) Douglas-fir tandem milling energy optimization
We reviewed the large scale tandem milling design and Japanese cedar mill trial results. The Japanese cedar fine chips have a density of 0.1 kg/L while the Weyerhaeuser Douglas-fir chips have a density of 0.26 kg/L. Thus, the treatment of powder volume factor is 0.26/0.1 = 2.6, indicating that less energy is needed for a more dense material. The estimated power consumption target for Douglas-fir chips milling is ~2 MJ/OD kg wood chips.
The large scale milling test is being conducted on 2250 pounds of dry Douglas-fir FS-01 chips in the im-proved HV-70 tandem milling machine (0.5 MT/hr) to validate the estimated power consumption of ~2 MJ/OD kg wood chips.
In summary, if the fine wood milling energy consump-tion target will be met at 2 MJ/OD kg wood or even 3 MJ/OD kg wood (0.56-0.84 kWh/OD kg biomass), the total energy requirement for wood milling could range from 1.45 to 1.73 kWh/OD kg, summarized in Table C-P-5.7.
SMALL-SCALE CLEAN SUGAR AND LIG-NIN PRODUCTION
To provide Gevo with a hydrolysate of milled FS-10 feedstocks and the Co-Product Team with lignin rich residuals from the hydrolyzed milled FS-10 pow-der, larger scale and higher solid hydrolyses at 15% consistency with 5.5% CTec3/HTec3 enzyme product were conducted in 1000 ml shake flasks with 700 ml working volume. After hydrolysis, a simple vacuum filtration was used to separate hydrolysate from the lignin rich solid residuals. The hydrolysate has a sugar titer of about 7.5% total sugar, which was further concentrated to 10% total sugar titer with a vacuum evaporator at 61-63°C. The generated 5 liter hydroly-sate, as shown in Figure C-P-5.2, was sent to Gevo for a preliminary isobutanol fermentation evaluation. More hydrolysate of 1.8 liters (Figure C-P-5.3) was sent to Gevo on March 25, 2014 for GIFT fermenta-tion system testing.
The hydrolysis-generated 1.1 OD kg equivalent lignin residuals (3x washed by deionized water at equal wet weight each time and shown in Figure C-P-5.4) was sent to the NARA Co-Product team on November 21, 2013 for characterization and application analyses. In addition, fermentation by regular ethanol producing yeast was conducted on milled wood hydrolysate without the separation of hydrolyzed wood residuals from the hydrolysate. The resulting fermented milled residuals of 0.75 kg OD, as shown in Figure C-P-5.5,
Information on this page is potentially proprietary and has been omitted and replaced with the word “redacted”. Please contact members of the NARA executive committee (see “organizational structure” in this report) for further information.
472ND CUMULATIVE REPORT | APRIL 2013 - MARCH 2014
was produced and sent to the NARA Co-Product team on January 30, 2014 for evaluation.
OPTIMIZATION OF MILLED WOOD HYDROLYSIS
Particle distribution under various milling times
Small scale tandem milling produced various FS-10 milled wood samples as shown in Figure C-P-5.6. There is some particle size variation in milling between the left chamber and the right chamber, as shown in Figure C-P-5.7. The left chamber was cooled to a lower temperature than the right chamber due to a serial cooling connection (left chamber first, and then to right chamber) rather than a parallel cooling connection. Within 30 minutes of milling, the mean particle diameters of wood powder are 32-38 mi-crons in the left chamber and 34-43 microns in the right chamber. Within 60 minutes of milling, the mean particle diameters of wood powder are 29-34 microns in the left chamber and 41-44 microns in the right chamber. Longer milling of 80-100 minutes seems to cause wood particle agglomerations even with soni-cation prior to particle size analysis and counting.
The crystallinity of the FS-10 milled Douglas-fir wood was measured by X-ray diffraction. The results are shown in Figure C-P-5.8. After 60 minutes of milling, the milled wood crystallinity shows no further or signif-icant reduction, which means 60 minutes of milling is sufficient.
All the FS-10 milled wood sugar compositions were analyzed and shown Table C-P-5.8. Results show that there is small sugar loss after the milling process. Some samples were analyzed for lignin, and the lignin composition shows some proportional increase due to small sugar loss in the milled samples (Table CP-5.8).
HYDROLYSIS OPTIMIZATION
The enzymatic hydrolysis of milled FS-10 was con-
ducted at a solid of 2% consistency with 5% Meice-lase enzyme product (solid enzyme product) on wood powder. The hydrolysis results at 48 hours are shown in Figure C-P-5.9. The low solid loading at 2% consis-tency achieves saccharification efficiencies or yields of holocellulose (cellulose and hemicellulose) of 67% by 30 minutes of milling and of 71-81% by 60 minutes of milling as shown in Figure C-P-5.9.
The hydrolysis of higher solid loading at 10% consis-tency was conducted at the Weyerhaeuser Technol-ogy Center. The hydrolyses achieved saccharification efficiencies of holocellulose of 53-56% by 30 minutes of milling and of 56-72% by 60 minutes of milling, as shown in Figure CP-5.10. Milling longer, at 80-100 minutes, only shows a slight yield increase and the total yield ranging from 60-75%.
The small scale FS-10 milled Douglas-fir was also hydrolyzed at 20.6% consistency by 6% CTec2 and 0.6% HTec2 enzyme dose on milled wood achieving a hydrolysis yield of 58% on a four day hydrolysis with total sugar titer of 7.7%, as shown in Figure CP-5.11. Hydrolysate fermentation by ethanol yeast can achieve 4.2% ethanol at 24-hr fermentation. More hydrolysis optimization will be conducted in the next trimester.
TECHNO-ECONOMIC ANALYSIS (TEA) FOR CLEAN SUGAR AND LIGNIN PRODUCTION
The targeted wood milling energy consumption of 0.56-0.84 kWh/OD kg wood, which is being tested and optimized, is used for the techno-economic anal-ysis (TEA) for clean sugar and lignin production from wood residual chips.
With the NARA depot concept, a depot size sugar and lignin pellet fuel plant is assumed to process annual softwood wood residuals of 222,000 BDT/year. The techno-economic analysis is conducted for this depot sized plant. Natural gas is used for wood drying. The plant parameters are summarized in Table C-P-5.10 and the commodity cost or product sale
price information is shown in Table C-P-5.11.
A cost stack bar chart is shown Figure C-P-5.12 for the sugar cost with lignin pellet fuel as co-product. The total plant cost is $23.2 million for the production of 97,794 BDT sugar/year and 133,977 BDT lignin pellet/year, with an annual expense of $14.8 million. The lignin pellet fuel has a positive credit of $0.0463 per lb of sugar produced.
The sugar product cost is very competitive at $0.1340/lb when the feedstock price is at $65/BDT. At the market sugar price of $0.169/lb, the net profit would be $0.035/lb sugar or a total profit of $6,965,974/yr, indicating a good TEA case.The feedstock cost is very significant in sugar pro-duction, and the production cost can be reduced to $0.1170/lb if the feedstock price can be reduced from $65/BDT to $50/BDT. In addition, if at $50/BDT feed-stock price, the sugar production cost is $0.1285/lb although the milling energy is 0.84 kWh/OD kg wood, which is still very competitive. In certain location, if the feedstock cost is $45/BDT, the sugar production cost can be as low as $0.1106-0.1235/lb. At sugar production cost of $0.1106/lb, the net profit would be $0.0584/lb sugar or a total profit of $10 million/yr, indicating a very good TEA case.
Various cases of cost analyses are summarized in Ta-ble C-P-5.12. The TEA analysis is being refined, and the full TEA report will be issued in the next trimester.
Information on this page is potentially proprietary and has been omitted and replaced with the word “redacted”. Please contact members of the NARA executive committee (see “organizational structure” in this report) for further information.

482ND CUMULATIVE REPORT | APRIL 2013 - MARCH 2014
Emission Amount kg CO2e /MWh (g CO2e /MJ) (g CO2e /OD kg wood drying)
CO2e* 282 78.5 234
Emission Amount kg CO2e /MWh (g CO2e /MJ) (g CO2e /OD kg wood drying)
CO2e 24.6 6.8 20.4
Items Output Size (mm) Specific Energy Consumption (kWh/
OD kg wood)
Scale (metric ton/hr) Commercial Prod-uct
Wood chipping 38 0.0098 27.2 Yes†
Table C-P-5.1. Carbon dioxide equivalent emission at natural gas production and its conversion to wood chip drying by natural gas
Table C-P-5.2. Carbon dioxide equivalent emission at wood chip drying using residual wood as fuel
Table C-P-5.3. Specific energy consumption by a wood drum chipper
†Parameters provided by (redacted)
*Sum of upstream and end combustion emission for natural gas production
Figure C-P-5.1. Raw Douglas-fir FS-10 chips with 13.42 mm Xgm and finished feedstocks with 2 mm Xgm
Information on this page is potentially proprietary and has been omitted and replaced with the word “redacted”. Please contact members of the NARA executive committee (see “organizational structure” in this report) for further information.

492ND CUMULATIVE REPORT | APRIL 2013 - MARCH 2014
Items Output Size (mm) Specific Energy Consumption (kWh/
OD kg wood)
Scale (metric ton/hr) Commercial Product
Size reduction by sawdust machine
2 0.0505 2 Yes†
Items Output Size (mm) Specific Energy Consumption (kWh/
OD kg wood)
Scale (metric ton/hr) Commercial Product
Chip drying NA 0.8278 8 Yes‡
Line Sample ID Description GMD (Xgm) mm Comminution Ratio
% Retained from prior run % Original Mass
Specific E (MJ/OD Mg)
RunCumulative,
Original mass basis
1 2013.09.23.001 Raw Chips 13.4 - - 100 - -2 2013.09.23.001. A-C 1st Pass 4.8mm 5.66 2.4 - 100 27 273 2013.09.23.001. A-C.A 2ndPass 4.8mm 4.12 1.4 - 100 16 434 2013.09.23.001. A-C.B 1st Pass 1.6mm 2.21 1.9 - 100 67 1105 2013.09.23.002 2ndPass 1.6mm 2.21 73 73 37 1376 2013.09.23.003 3rd Pass 1.6mm 2.21 70 51 26 1507 2013.09.23.004 4th Pass 1.6mm 2.21 62 32 20 1578 2013.09.23.005 5th Pass 1.6mm 2.21 58 18 17 1609 2013.09.23.006 6th Pass 1.6mm 2.21 56 10 14 161
10 2013.09.23.007 Final Product 1.29 53 5 12 162
Table C-P-5.4. Comminution energy results of raw Douglas-fir FS-10 feedstock chips with 13.42 Xgm to finished feedstocks with 1.29 mm Xgm
Table C-P-5.5. Specific energy consumption by a sawdust machine
Table C-P-5.6. Specific energy consumption by a sawdust machine
†Parameters provided by (redacted)
‡Parameters provided by (redacted). The specific energy includes 0.0186 kWh/OD kg as the mechanical energy for the rotary drum dryer.
Information on this page is potentially proprietary and has been omitted and replaced with the word “redacted”. Please contact members of the NARA executive committee (see “organizational structure” in this report) for further information.

502ND CUMULATIVE REPORT | APRIL 2013 - MARCH 2014
Steps Output Size (mm)Specific Energy Consumption
(kWh/OD kg wood)
Scale (metric ton/hr)
Commercial Product
1. Wood chipping 38 0.0098 27.2 Yes†2. Size reduction 2 0.0505 2 Yes†
3. Chip drying NA 0.8278 8 Yes‡
4. Fine milling* 0.030-0.050 0.5587-0.8368 (target) 0.12-0.5 Not yet
Total Energy (kWh/OD kg) 1.45-1.73
†Parameters provided by [redacted]‡Parameters provided by (redacted). The specific energy includes 0.0186 kWh/OD kg as the mechanical energy for the rotary drum dryer.
*The fine milling is being tested in [redacted]
Table C-P-5.7. Wood milling energy requirement in each size reduction step
Figure CP-5.2. Hydrolysate of 5 liters with 10% total sugar concentration, sent to Gevo on November 21, 2013
Figure CP-5.3. More hydrolysate of 1.8 liters, sent to Gevo on March 25, 2014 for the GIFT fermentation system testing.
Information on this page is potentially proprietary and has been omitted and replaced with the word “redacted”. Please contact members of the NARA executive committee (see “organizational structure” in this report) for further information.
Figure C-P-5.4. Lignin rich residuals of 1.1 OD kg equivalent, sent to the Co-Product Team on November 21, 2013

512ND CUMULATIVE REPORT | APRIL 2013 - MARCH 2014
Figure C-P-5.7. Mean particle diameter of milled FS-10 under various milling times
Figure C-P-5.5. Lignin rich residuals of 0.75 OD kg equivalent, sent to the Co-Product Team on January 30, 2014
Figure C-P-5.8. Cellulose crystallinity of milled FS-10 under various milling times
0
10
20
30
40
50
60
0 20 40 60 80 100 120
Mea
n pa
rticl
e di
amet
er (
mm
)
Milling time (min)
L-ChamberR-Chamber
0
5
10
15
20
25
30
35
0 10 20 30 40 50 60 70 80 90 100
Cry
stal
linity
(%)
Milling Time (min)
L-Chamber
R-Chamber
Figure C-P-5.6. Milled wood powders of FS-10 chips, under various milling time, 30, 60, 80, and 100 minutes. L-from left milling chamber; R- from right milling chamber. Lighter color of milled wood in L-chamber indicates milling temperature was cooler than that in the R-chamber (onsite photo
during our visit to [redacted])

522ND CUMULATIVE REPORT | APRIL 2013 - MARCH 2014
FS-10 Sample ID Milling Time (min) Total Polymer Sugar (%) Loss (%)2 mm chips 0 60.40 NA
1.L30 30 59.85 0.912.R30 30 60.28 0.203.L60 60 59.10 2.154.R60 60 58.48 3.187.L80 80 58.99 2.338.R80 80 58.41 3.29
11.L100 100 58.85 2.5712.R100 100 58.92 2.45
FS-10 Samples Milling Time (min) Total Lignin (%) Increase (%)2 mm chips 0 27.34 NA
L/R 60 60 27.96 2.2L/R 100 100 28.23 3.3
Table C-P-5.9. FS-10 milled wood lignin composition under various milling conditions
Table C-P-5.8. FS-10 milled wood carbohydrate composition under various milling conditions
Note: L-left milling chamber; R-right milling chamber; L/R-left and right data average.
0%10%20%30%40%50%60%70%80%90%
100%
0 20 40 60 80 100 120
Sacc
harif
icat
ion e
ffeci
ency
of
holo
cellu
lose
(%)
Milling time (min)
L-ChamberR-Chamber
MeicelaseMeicelaseDouglas fir
0%10%20%30%40%50%60%70%80%90%
100%
0 20 40 60 80 100 120
Sacc
harif
icat
ion e
ffeci
ency
of
holo
cellu
lose
(%)
Milling time (min)
L-ChamberR-Chamber
CTec/HTecDouglas fir
0123456789
0 20 40 60 80 100 120
Tota
l Sug
ar T
iter (
%w
t/wt)
Hydrolysis Time (hours)
Test 2Test 1
CTec/HTecDouglas fir
Figure C-P-5.9. Enzymatic hydrolysis efficiency or yield of low solid concentration at 2% consistency with 5% Meicelase enzyme product on
wood powder. Hydrolysis time = 2 days
Figure C-P-5.10. Enzymatic hydrolysis efficiency or yield of higher solid concentration at 10% consistency with 4.4% CTec3/HTec3 enzyme
product on wood powder. Hydrolysis time = 4 days
Figure C-P-5.11. The small scale milled Douglas-fir FS-10 hydrolysis sugar titer profile. Conditions: milled wood at 20.6% (wt/wt) from 60-minute
milling sample; milled wood sugar composition at 58.48%; enzyme dose at 6% CTec2 and 0.6% HTec2 enzyme product on milled wood; pH at
~5.0-5.2; temperature at 50°C; shaking at 200 rpm

532ND CUMULATIVE REPORT | APRIL 2013 - MARCH 2014
Items AmountBiomass Input (bdt/yr)) 222,000
Operation days (/yr) 330Plant staff (FTE) 42
Sugar yield from biomass (%) 65%Sugar output on dry basis (bdt/yr) 97,794
Lignin pellet fuel on dry basis (bdt/yr) 133,977Total Capital $9,773,180
Installed Capital $14,659,770 With 20% Contingency $17,591,724
With 20% OSBL $21,110,068 With 10% owner’s cost $23,221,075
Annual Recovery Rate (%) 12%Annual Capital Recovery ($/yr) $2,786,529
Annual Operation and Labor ($/yr) $12,057,110 Grant Annual Expense ($/yr) $14,843,639
Items Cost/Sale Price ($)Biomass cost at depot door ($/bdt) 65
Electricity cost ($/kWh) 0.0401Natural gas cost ($/MMBtu) 4.5
Lignin pellet fuel bulk price ($/lb) 0.070Sugar price (dry basis equivalent) ($/lb) 0.169
$0.0130
$0.0738 $0.0530 $0.0405
$(0.0463)
$0.1340
Capex Feedstocks Opex Enzyme Lignin credit Total Cost
Sugar Production Cost ($/lb sugar)
Case No. Feedstock Cost ($/bdt) Milling Energy (kWh/OD kg wood)
Sugar Yield (%) Sugar Production Cost ($/lb)
1 65 0.56 65 0.13402 50 0.56 65 0.11703 50 0.84 65 0.12854 50 0.56 58 0.12155 50 0.84 58 0.13446 45 0.56 58 0.11067 45 0.84 58 0.1235
Table C-P-5.10. Sugar production cost under various assumptions Table C-P-5.11. Commodity cost information for the TEA analysis
Table C-P-5.12. Sugar production cost under various assumptions
Figure C-P-5.12. Sugar production cost stack bar chart. Analysis conditions: feedstock cost at $65/ton; plant size 222,000 bdt wood/year; sugar yield from milled wood 65%; lignin pellet selling price at $0.070/lb; NW
electricity cost at $0.0401/kWh; installed capital with additional 20% contingency cost, 20% OSBL cost and 10% owner’s cost; annual capital recovery at 12%; sugar and lignin plant staffed with 42 FTE; wood drying by
natural gas price at $4.50/MMBtu; operated for 330 days/year.

542ND CUMULATIVE REPORT | APRIL 2013 - MARCH 2014
Physical and Intellectual Outputs References• In September 2013, 100 kg FS-10 chips were
reduced to 2 mm mean size and the energy con-sumption for this size reduction was tested at Forest Concepts LLC, Auburn, WA.
• In October 2013, 10 kg FS-10 2 mm size chips were milled into powder by tandem milling machine.
• In November 2013, 5 liters of milled wood hydrolysate was sent to Gevo for fermentation test.
• In November 2013, 1.1 kg (oven dry based) of un-fer-mented hydrolyzed FS-10 milled wood residuals was sent to the NARA Co-Product team for lignin evalua-tion.
• In November 2013, 100 kg FS-10 chips were shipped to [redacted] for some wood milling tests.
• In January 2014, 0.75 kg (oven dry based) of fer-mented hydrolyzed FS-10 milled wood residuals was sent to the NARA Co-Product team for lignin evalua-tion.
• In March 2014, an additional 1.8 liters of milled wood hydrolysate was sent to Gevo for GIFT testing.
• In March 2014, 2250 lbs of FS-10 chips were shipped to [redacted] for tandem milling optimization studies in the improved HV-10 tandem milling machine.
1) Bowyer J. 2012, Life cycle impacts of heating with wood in scenarios ranging from home and institutional heating to community scale district heating systems, reported by Dovetail Partners, Inc. with funding provided by the Minnesota Environment and natural Resources Trust Fund.
2) da Silva AS, Inoue H, Endo T, Yano S, Bon EPS, 2009, Milling pretreatment of sugarcane bagasse and straw for enzymatic hydrolysis and ethanol fermenta-tion. Bioresource Technology, 101, 7402–7409.
3) Hideno A, Inoue H, Tsukahara K, Fujimoto S, Minowa T, Inoue S, Endo T, Sawayama S. 2009. Wet disk milling pretreatment without sulfuric acid for enzymatic hydrolysis of rice straw. Bioresource Technology, 100, 2706–2711.
4) ICF International. 2012, Life cycle greenhouse gas emissions of natural gas: A literature review of key studies comparing emissions from natural gas and coal, prepared for The Canadian Natural Gas Initiative (CNGI).
5) Mori Y, Takahashi T, Ito k, Kobayashi J, Ito A, Gochi M. 2012. Examination of the energy efficiency of the continuation tandem ring mill. The Japan Society of Mechanical Engineers, Vol. 78, No. 787, 400-404.
6) Takahashi T, ItoA, Kobayashi J, Enda Y. 2008. Research and development of mechanical milling technology for bio-ethanol production. 16th European Biomass Conference & Exhibition, 2-6 June, 2008, Valencia, Spain.
Recommendations | ConclusionsThe targeted energy consumption by wood milling, which is being optimized, is used for the techno-eco-nomic analysis (TEA) for clean sugar and lignin produc-tion from wood residual chips. Based on the TEA, if the targeted energy consumption of wood milling is met within the range of 0.56-0.84 kWh/OD kg wood at a sugar conversion yield of about 60%, the economics by wood milling as a pretreatment technology looks very plausible for clean sugar and lignin fuel.
Recommendations• Wait for the large scale milling energy consumption
results to further calibrate the techno-economic analysis results on sugar production cost.
• Need to characterize and understand more on energy-efficient milling to achieve high yield milling (saccharification) by understanding more wood particle characterization.
• Need to optimize enzymatic hydrolysis on milled wood.
• Need to understand market feasibility on wood pellet, since the sugar production cost is largely dependent upon the lignin credit (high Btu lignin-rich wood pellet).
ConclusionsThe clean sugar and lignin pretreatment technology by wood milling can produce excellent hydrolysate with almost no impact on isobutanol organism growth and with enhancement on isobutanol production.The potential global warming gas emission is minimal in this pretreatment technology. No chemical is used in the pretreatment. No water is needed in wood milling pretreatment technology. Wood milling could become a unique depot size technology for biomass pretreat-ment and for sugar and lignin fuel production.
Information on this page is potentially proprietary and has been omitted and replaced with the word “redacted”. Please contact members of the NARA executive committee (see “organizational structure” in this report) for further information.

552ND CUMULATIVE REPORT | APRIL 2013 - MARCH 2014
AVIATION TEAM
CONVERSION
562ND CUMULATIVE REPORT | APRIL 2013 - MARCH 2014
Task Description
Key Personnel Affiliation Andrew Hawkins Gevo, IncGlenn Johnson Gevo, IncBob Wooley Gevo, Inc
Over the past year, Gevo received and tested several pretreated FS-03 and FS-10 derived Douglas fir bio-mass samples. Three batches of FS-10 wet oxidation (WO) pretreated biomass from Dr. Birgitte Ahring at Washington State University that are noted as Batch A, B, and C. One batch of FS-10 SPORL pretreated biomass was received from Dr. JY Zhu at the USDA Forest Products Lab. Two batches of FS-03 derived biomass (Clean and Combined) were received from Catchlight Energy. Two batches of FS-10 mild bisul-fite (MB) pretreated biomass (a small batch separated into solids and SSL and a larger combined batch) that is a joint effort between Catchlight Energy and the Forest Products Lab. Lastly, two different batches (concentrated and unconcentrated) of FS-10 milled wood (MW) pretreated biomass were produced by a Japanese company but received through Dr. Johnway Gao at Catchlight Energy. All of the materials have been analyzed for sugars and inhibitors and charac-terized via fermentation using an isobutanol producing biocatalyst. Based on Pretreatment and Conver-sion Team meetings, three FS-10 biomass samples (WO, SPORL, and MB Solids) were tested in GIFT® fermentation systems in order to provide data for the pretreatment down-selection gate review. Following the gate review, the unconcentrated milled wood (UMW) and combined mild bisulfite (CMBS) biomass samples were tested in 1L GIFT® fermentation sys-tems. Gevo also continued a biocatalyst adaptation program using previously received WO and SPORL pretreated hydrolyzates to generate biocatalysts with better performance. Isolates adapted to WO and/or
TASK C-AF-1: PRODUCTION OF LIGNOCELLULOSIC ISOBUTANOL BY FERMENTATION AND CONVERSION TO BIOJET
SPORL pretreated material with improved growth are continuously generated, selected, and characterized to verify improved growth and fermentation perfor-mance. To date, Gevo has produced isobutanol using multiple pretreatment types of Douglas-fir derived biomass in 1L batch fermentations and 1L GIFT® fermentation systems using the currently best hydroly-zate-adapted biocatalyst (LB4) producing isobutanol. Fermentation process parameters to improve biocata-lyst performance in Douglas-fir hydrolyzates continue to be identified through numerous experiments. Over the last year, Gevo created a process box that in-cludes material flows plus capital and operating costs, and that data was forwarded to the NARA Process Team.
Task C-AF-1.1. Characterize toxicity of a representa-tive sample of pre-treated woody biomass (Douglas fir) for fermentation
Sugar and inhibitor concentrations were determined by high-pressure liquid chromatography (HPLC) anal-ysis for each feedstock and pretreatment method re-ceived (Table C-AF-1.1). To date, Gevo has received and characterized the following: FS-01, FS-03, and FS-10 SPORL pretreated materials from Dr. JY Zhu at the USDA Forest Products Laboratory (Madison, WI), FS-01, FS-03, and FS-10 wet oxidation pretreated materials from Dr. Birgitte Ahring at Washington State University – Tricities (Richland, WA), FS-03 pretreated material (Clean and Combined) from Catchlight Ener-gy (Federal Way, WA), FS-10 mild bisulfite pretreated materials (Combined, Solids, and Spent Sulfite Liquor (SSL)) that is a collaborative product from Catchlight Energy and the USDA Forest Products Lab, and FS-10 milled wood pretreated material (Concentrated and Unconcentrated) pretreated at a [redacted] company but received through Dr. Johnway Gao at Catchlight Energy.
After analytical analysis, characterization of new feedstock hydrolyzates occurs through benchmarking growth and fermentation using an isobutanol pro-ducing biocatalyst. A review of hydrolyzate samples tested in the shake flask benchmarking process is presented in Figure C-AF-1.1. Additional data can be found in the prior trimester reports from this year. A new hydrolyzate material received during the most re-cent trimester, FS-10 Concentrated Milled Wood, was characterized using shake flask fermentations. Growth performance was compared in different concentra-tions of the Concentrated Milled Wood pretreated hy-drolyzates media (Figure C-AF-1.2). All of the pretreat-ed hydrolyzate media was clarified and supplemented with a nutrient package prior to the experiments.
The growth and isobutanol production data using the Concentrated Milled Wood hydrolyzate media showed excellent results using the 100% hydrolyzate. Growth of LB4 in the 100% hydrolyzate media was only slight-ly lower than the mock (control) media, and isobutanol production was comparable with higher maximum titers (Figure C-AF-1.2). Based on these results, addi-tional testing should be performed with Concentrated Milled Wood hydrolyzates if the process is economical and scalable.
Task C-AF-1.2. Adapt yeast biocatalyst to pretreated biomass hydrolyzates
Inhibitor concentrations in biomass pretreatments can vary widely depending on the pretreatment meth-od. To generate robust biocatalysts, adaptation to a specific pretreated hydrolyzate is needed. A biocata-lyst adaptation program is ongoing to generate better performing isobutanol producing biocatalysts to the different hydrolyzates. Hydrolyzate adapted strains with improved performance have been isolated from
Information on this page is potentially proprietary and has been omitted and replaced with the word “redacted”. Please contact members of the NARA executive committee (see “organizational structure” in this report) for further information.
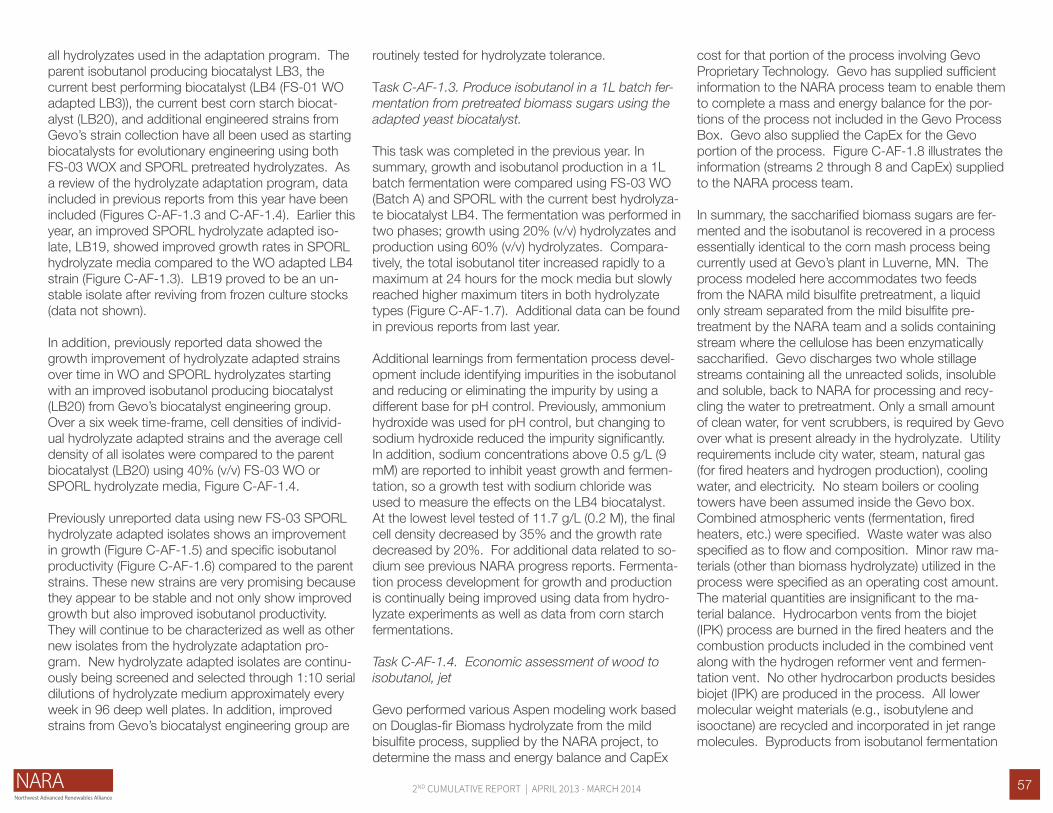
572ND CUMULATIVE REPORT | APRIL 2013 - MARCH 2014
all hydrolyzates used in the adaptation program. The parent isobutanol producing biocatalyst LB3, the current best performing biocatalyst (LB4 (FS-01 WO adapted LB3)), the current best corn starch biocat-alyst (LB20), and additional engineered strains from Gevo’s strain collection have all been used as starting biocatalysts for evolutionary engineering using both FS-03 WOX and SPORL pretreated hydrolyzates. As a review of the hydrolyzate adaptation program, data included in previous reports from this year have been included (Figures C-AF-1.3 and C-AF-1.4). Earlier this year, an improved SPORL hydrolyzate adapted iso-late, LB19, showed improved growth rates in SPORL hydrolyzate media compared to the WO adapted LB4 strain (Figure C-AF-1.3). LB19 proved to be an un-stable isolate after reviving from frozen culture stocks (data not shown).
In addition, previously reported data showed the growth improvement of hydrolyzate adapted strains over time in WO and SPORL hydrolyzates starting with an improved isobutanol producing biocatalyst (LB20) from Gevo’s biocatalyst engineering group. Over a six week time-frame, cell densities of individ-ual hydrolyzate adapted strains and the average cell density of all isolates were compared to the parent biocatalyst (LB20) using 40% (v/v) FS-03 WO or SPORL hydrolyzate media, Figure C-AF-1.4.
Previously unreported data using new FS-03 SPORL hydrolyzate adapted isolates shows an improvement in growth (Figure C-AF-1.5) and specific isobutanol productivity (Figure C-AF-1.6) compared to the parent strains. These new strains are very promising because they appear to be stable and not only show improved growth but also improved isobutanol productivity. They will continue to be characterized as well as other new isolates from the hydrolyzate adaptation pro-gram. New hydrolyzate adapted isolates are continu-ously being screened and selected through 1:10 serial dilutions of hydrolyzate medium approximately every week in 96 deep well plates. In addition, improved strains from Gevo’s biocatalyst engineering group are
routinely tested for hydrolyzate tolerance.
Task C-AF-1.3. Produce isobutanol in a 1L batch fer-mentation from pretreated biomass sugars using the adapted yeast biocatalyst.
This task was completed in the previous year. In summary, growth and isobutanol production in a 1L batch fermentation were compared using FS-03 WO (Batch A) and SPORL with the current best hydrolyza-te biocatalyst LB4. The fermentation was performed in two phases; growth using 20% (v/v) hydrolyzates and production using 60% (v/v) hydrolyzates. Compara-tively, the total isobutanol titer increased rapidly to a maximum at 24 hours for the mock media but slowly reached higher maximum titers in both hydrolyzate types (Figure C-AF-1.7). Additional data can be found in previous reports from last year.
Additional learnings from fermentation process devel-opment include identifying impurities in the isobutanol and reducing or eliminating the impurity by using a different base for pH control. Previously, ammonium hydroxide was used for pH control, but changing to sodium hydroxide reduced the impurity significantly. In addition, sodium concentrations above 0.5 g/L (9 mM) are reported to inhibit yeast growth and fermen-tation, so a growth test with sodium chloride was used to measure the effects on the LB4 biocatalyst. At the lowest level tested of 11.7 g/L (0.2 M), the final cell density decreased by 35% and the growth rate decreased by 20%. For additional data related to so-dium see previous NARA progress reports. Fermenta-tion process development for growth and production is continually being improved using data from hydro-lyzate experiments as well as data from corn starch fermentations.
Task C-AF-1.4. Economic assessment of wood to isobutanol, jet
Gevo performed various Aspen modeling work based on Douglas-fir Biomass hydrolyzate from the mild bisulfite process, supplied by the NARA project, to determine the mass and energy balance and CapEx
cost for that portion of the process involving Gevo Proprietary Technology. Gevo has supplied sufficient information to the NARA process team to enable them to complete a mass and energy balance for the por-tions of the process not included in the Gevo Process Box. Gevo also supplied the CapEx for the Gevo portion of the process. Figure C-AF-1.8 illustrates the information (streams 2 through 8 and CapEx) supplied to the NARA process team.
In summary, the saccharified biomass sugars are fer-mented and the isobutanol is recovered in a process essentially identical to the corn mash process being currently used at Gevo’s plant in Luverne, MN. The process modeled here accommodates two feeds from the NARA mild bisulfite pretreatment, a liquid only stream separated from the mild bisulfite pre-treatment by the NARA team and a solids containing stream where the cellulose has been enzymatically saccharified. Gevo discharges two whole stillage streams containing all the unreacted solids, insoluble and soluble, back to NARA for processing and recy-cling the water to pretreatment. Only a small amount of clean water, for vent scrubbers, is required by Gevo over what is present already in the hydrolyzate. Utility requirements include city water, steam, natural gas (for fired heaters and hydrogen production), cooling water, and electricity. No steam boilers or cooling towers have been assumed inside the Gevo box. Combined atmospheric vents (fermentation, fired heaters, etc.) were specified. Waste water was also specified as to flow and composition. Minor raw ma-terials (other than biomass hydrolyzate) utilized in the process were specified as an operating cost amount. The material quantities are insignificant to the ma-terial balance. Hydrocarbon vents from the biojet (IPK) process are burned in the fired heaters and the combustion products included in the combined vent along with the hydrogen reformer vent and fermen-tation vent. No other hydrocarbon products besides biojet (IPK) are produced in the process. All lower molecular weight materials (e.g., isobutylene and isooctane) are recycled and incorporated in jet range molecules. Byproducts from isobutanol fermentation
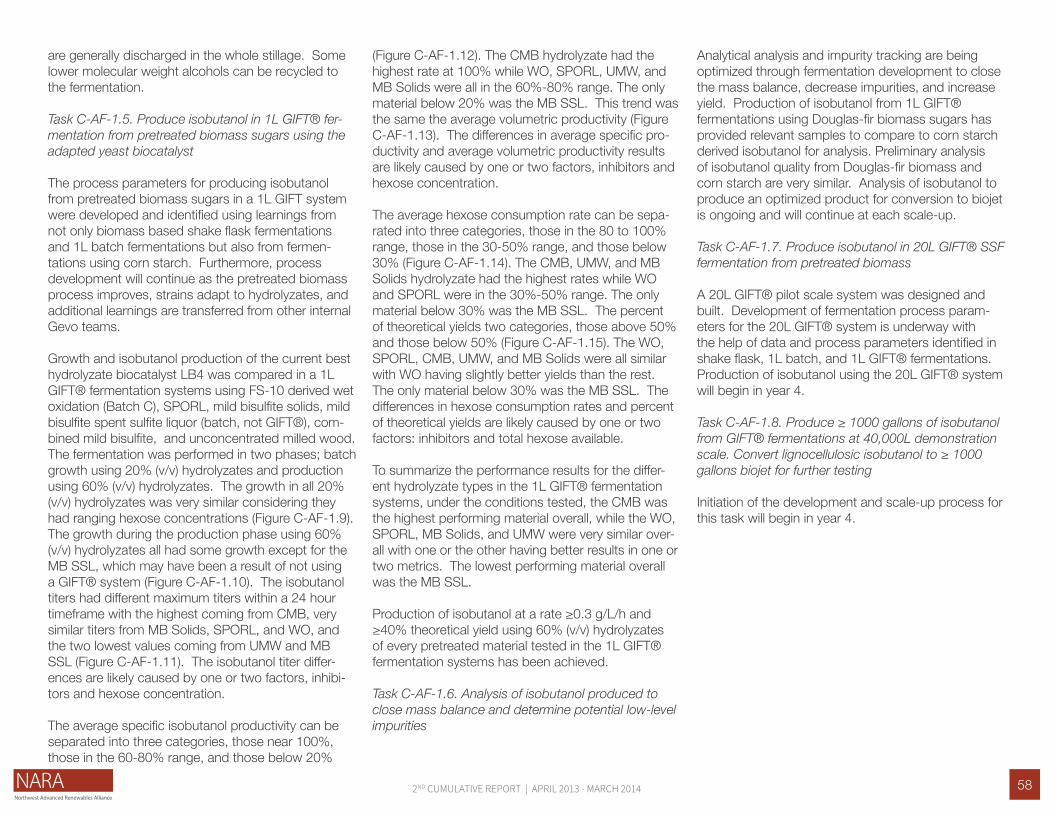
582ND CUMULATIVE REPORT | APRIL 2013 - MARCH 2014
are generally discharged in the whole stillage. Some lower molecular weight alcohols can be recycled to the fermentation.
Task C-AF-1.5. Produce isobutanol in 1L GIFT® fer-mentation from pretreated biomass sugars using the adapted yeast biocatalyst
The process parameters for producing isobutanol from pretreated biomass sugars in a 1L GIFT system were developed and identified using learnings from not only biomass based shake flask fermentations and 1L batch fermentations but also from fermen-tations using corn starch. Furthermore, process development will continue as the pretreated biomass process improves, strains adapt to hydrolyzates, and additional learnings are transferred from other internal Gevo teams.
Growth and isobutanol production of the current best hydrolyzate biocatalyst LB4 was compared in a 1L GIFT® fermentation systems using FS-10 derived wet oxidation (Batch C), SPORL, mild bisulfite solids, mild bisulfite spent sulfite liquor (batch, not GIFT®), com-bined mild bisulfite, and unconcentrated milled wood. The fermentation was performed in two phases; batch growth using 20% (v/v) hydrolyzates and production using 60% (v/v) hydrolyzates. The growth in all 20% (v/v) hydrolyzates was very similar considering they had ranging hexose concentrations (Figure C-AF-1.9). The growth during the production phase using 60% (v/v) hydrolyzates all had some growth except for the MB SSL, which may have been a result of not using a GIFT® system (Figure C-AF-1.10). The isobutanol titers had different maximum titers within a 24 hour timeframe with the highest coming from CMB, very similar titers from MB Solids, SPORL, and WO, and the two lowest values coming from UMW and MB SSL (Figure C-AF-1.11). The isobutanol titer differ-ences are likely caused by one or two factors, inhibi-tors and hexose concentration.
The average specific isobutanol productivity can be separated into three categories, those near 100%, those in the 60-80% range, and those below 20%
(Figure C-AF-1.12). The CMB hydrolyzate had the highest rate at 100% while WO, SPORL, UMW, and MB Solids were all in the 60%-80% range. The only material below 20% was the MB SSL. This trend was the same the average volumetric productivity (Figure C-AF-1.13). The differences in average specific pro-ductivity and average volumetric productivity results are likely caused by one or two factors, inhibitors and hexose concentration.
The average hexose consumption rate can be sepa-rated into three categories, those in the 80 to 100% range, those in the 30-50% range, and those below 30% (Figure C-AF-1.14). The CMB, UMW, and MB Solids hydrolyzate had the highest rates while WO and SPORL were in the 30%-50% range. The only material below 30% was the MB SSL. The percent of theoretical yields two categories, those above 50% and those below 50% (Figure C-AF-1.15). The WO, SPORL, CMB, UMW, and MB Solids were all similar with WO having slightly better yields than the rest. The only material below 30% was the MB SSL. The differences in hexose consumption rates and percent of theoretical yields are likely caused by one or two factors: inhibitors and total hexose available.
To summarize the performance results for the differ-ent hydrolyzate types in the 1L GIFT® fermentation systems, under the conditions tested, the CMB was the highest performing material overall, while the WO, SPORL, MB Solids, and UMW were very similar over-all with one or the other having better results in one or two metrics. The lowest performing material overall was the MB SSL.
Production of isobutanol at a rate ≥0.3 g/L/h and ≥40% theoretical yield using 60% (v/v) hydrolyzates of every pretreated material tested in the 1L GIFT® fermentation systems has been achieved.
Task C-AF-1.6. Analysis of isobutanol produced to close mass balance and determine potential low-level impurities
Analytical analysis and impurity tracking are being optimized through fermentation development to close the mass balance, decrease impurities, and increase yield. Production of isobutanol from 1L GIFT® fermentations using Douglas-fir biomass sugars has provided relevant samples to compare to corn starch derived isobutanol for analysis. Preliminary analysis of isobutanol quality from Douglas-fir biomass and corn starch are very similar. Analysis of isobutanol to produce an optimized product for conversion to biojet is ongoing and will continue at each scale-up.
Task C-AF-1.7. Produce isobutanol in 20L GIFT® SSF fermentation from pretreated biomass
A 20L GIFT® pilot scale system was designed and built. Development of fermentation process param-eters for the 20L GIFT® system is underway with the help of data and process parameters identified in shake flask, 1L batch, and 1L GIFT® fermentations. Production of isobutanol using the 20L GIFT® system will begin in year 4.
Task C-AF-1.8. Produce ≥ 1000 gallons of isobutanol from GIFT® fermentations at 40,000L demonstration scale. Convert lignocellulosic isobutanol to ≥ 1000 gallons biojet for further testing
Initiation of the development and scale-up process for this task will begin in year 4.

592ND CUMULATIVE REPORT | APRIL 2013 - MARCH 2014
Glucose (g/L) Xylose (g/L) Galactose (g/L)
Arabinose (g/L)
Mannose (g/L) Acetate (g/L) HMF (g/L) Furfural (g/L) Total Hexose (g/L)
FS-01 Wet Oxidation Hydrolyzate
57.20 6.67 5.12 1.58 20.87 7.27 3.90 0.99 83.19
FS-03 Wet Oxidation Hydrolyzate (Batch A)
87.54 4.67 5.14 0.76 10.06 12.46 3.66 0.81 102.74
FS-03 Wet Oxidation Hydrolyzate (Batch B)
89.58 5.25 3.00 n.d. 7.66 7.00 n.d. n.d. 100.24
FS-10 Wet Oxidation Hydrolyzate (Batch A)
44.76 6.61 4.18 6.00 16.84 7.94 2.42 0.56 65.78
FS-10 Wet Oxidation Hydrolyzate (Batch B)
67.22 4.57 2.37 n.d. 9.04 3.90 n.d. n.d. 78.63
FS-10 Wet Oxidation Hydrolyzate (Batch C)
54.79 12.01 5.38 4.43 9.59 7.99 3.53 0.26 69.76
FS-01 SPORL Hydro-
lyzate93.65 6.89 4.94 1.24 23.01 4.56 0.79 0.10 121.60
FS-03 SPORL Hydro-lyzate
81.81 5.79 3.82 0.40 7.02 5.78 1.84 0.63 92.65
FS-10 SPORL Hydro-lyzate
62.74 6.84 5.07 n.d. 11.83 0.62 n.d. n.d. 79.64
FS-03 Catchlight Com-
bined Hydrolyzate164.12 8.56 5.24 0.94 13.34 3.45 0.15 0.14 182.70
FS-03 Catchlight Clean Hydrolyzate
130.89 1.84 0.49 n.d. 1.34 0.26 0.14 0.01 132.72
FS-10 Mild Bisulfite SSL 7.83 7.32 5.29 2.21 18.06 3.61 n.d. n.d. 31.18
FS-10 Mild Bisulfite Solids Hydrolyzate
63.88 3.77 2.07 0.68 7.52 1.65 n.d. n.d. 73.47
FS-10 Combined Mild Bisulfite Hydrolyzate
84.22 10.14 5.26 2.02 20.93 3.44 n.d. n.d. 110.41
FS-10 Unconcentrated Milled Wood Hydroly-
zate
39.84 7.61 1.87 2.04 11.40 0.74 n.a. n.a. 53.11
FS-10 Concentrated Milled Wood Hydroly-
zate
61.84 9.21 0.46 1.36 12.76 0.77 n.d. n.d. 75.06
Table CAF-1.1. Sugar and inhibitor concentrations in FS-01, FS-03, and FS-10 feedstocks from different pretreatment methods. Concentrations were determined using HPLC at Gevo. (n.d. = not detected) (n.a. = not available)
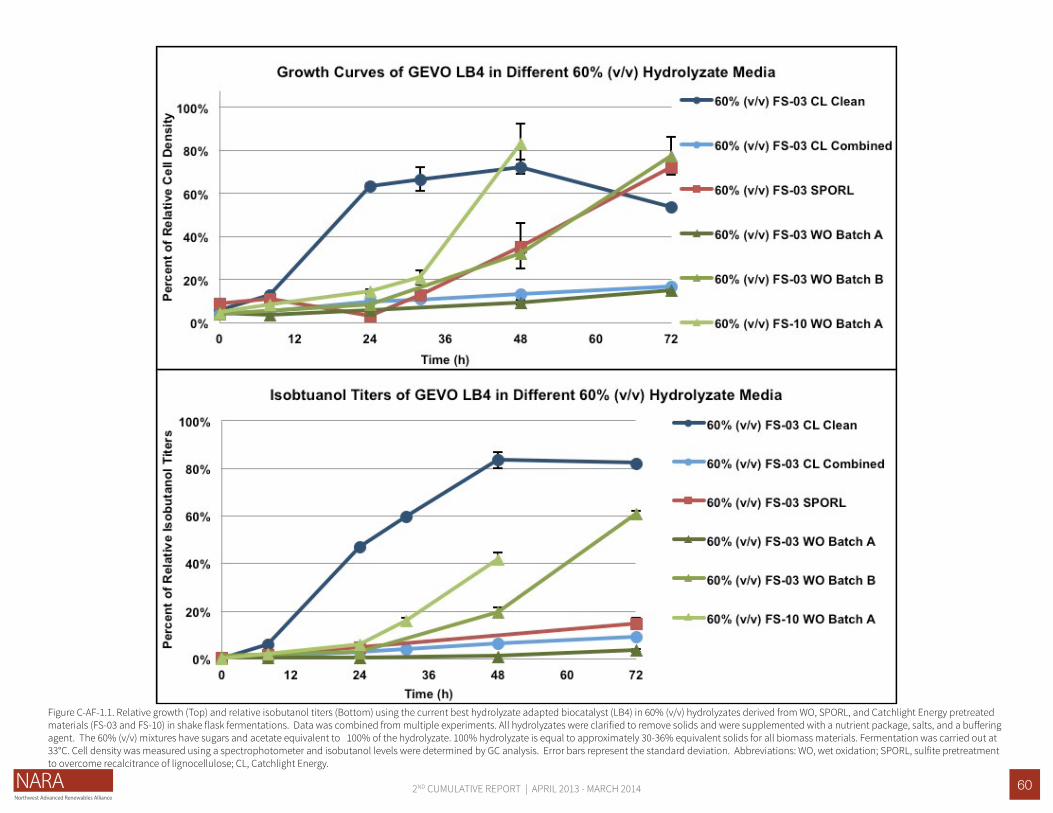
602ND CUMULATIVE REPORT | APRIL 2013 - MARCH 2014
Figure C-AF-1.1. Relative growth (Top) and reIative isobutanol titers (Bottom) using the current best hydrolyzate adapted biocatalyst (LB4) in 60% (v/v) hydrolyzates derived from WO, SPORL, and Catchlight Energy pretreated materials (FS-03 and FS-10) in shake flask fermentations. Data was combined from multiple experiments. All hydrolyzates were clarified to remove solids and were supplemented with a nutrient package, salts, and a buffering agent. The 60% (v/v) mixtures have sugars and acetate equivalent to 100% of the hydrolyzate. 100% hydrolyzate is equal to approximately 30-36% equivalent solids for all biomass materials. Fermentation was carried out at 33°C. Cell density was measured using a spectrophotometer and isobutanol levels were determined by GC analysis. Error bars represent the standard deviation. Abbreviations: WO, wet oxidation; SPORL, sulfite pretreatment to overcome recalcitrance of lignocellulose; CL, Catchlight Energy.
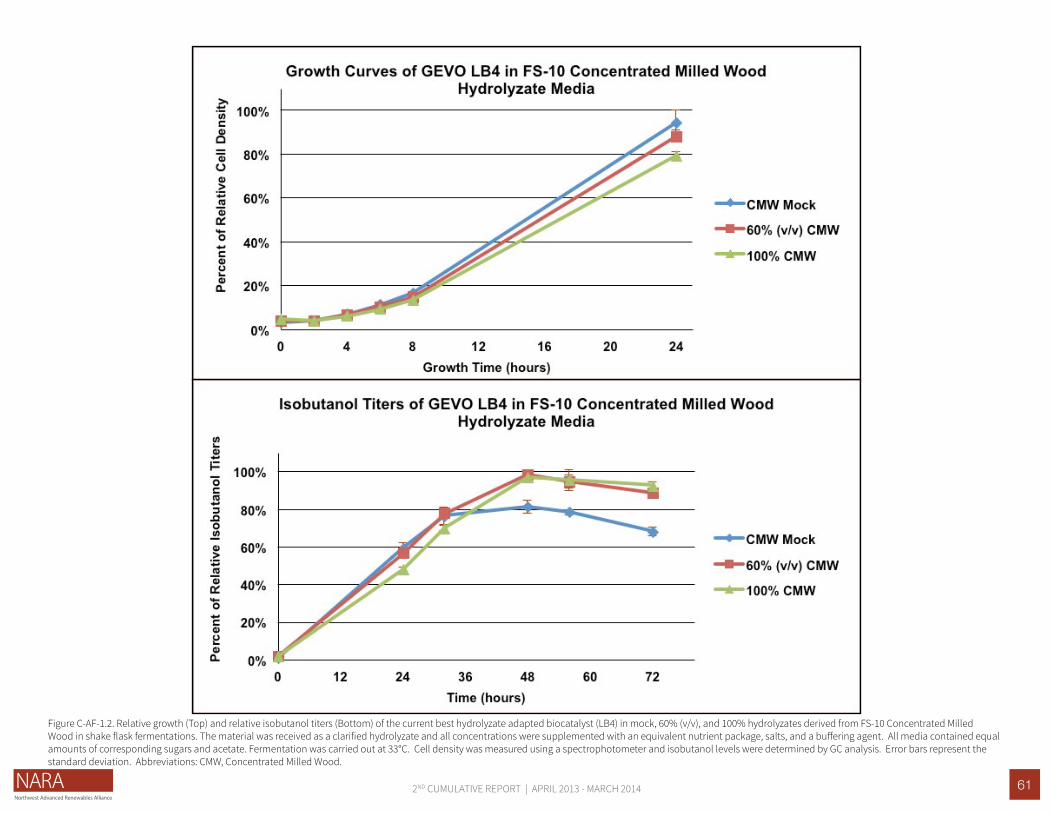
612ND CUMULATIVE REPORT | APRIL 2013 - MARCH 2014
Figure C-AF-1.2. Relative growth (Top) and relative isobutanol titers (Bottom) of the current best hydrolyzate adapted biocatalyst (LB4) in mock, 60% (v/v), and 100% hydrolyzates derived from FS-10 Concentrated Milled Wood in shake flask fermentations. The material was received as a clarified hydrolyzate and all concentrations were supplemented with an equivalent nutrient package, salts, and a buffering agent. All media contained equal amounts of corresponding sugars and acetate. Fermentation was carried out at 33°C. Cell density was measured using a spectrophotometer and isobutanol levels were determined by GC analysis. Error bars represent the standard deviation. Abbreviations: CMW, Concentrated Milled Wood.

622ND CUMULATIVE REPORT | APRIL 2013 - MARCH 2014
Figure C-AF-1.3. High throughput growth screening showing the percent of relative growth rates of the current best performing hydrolyzate adapted biocatalyst (LB4) and a new SPORL adapted biocatalyst derived from LB4 (LB19). Percent relative growth rates were obtained using a high-throughput microfermentation system (BioLector, m2p-labs). All hydrolyzates were clarified to remove solids and all were supplemented with a nutrient package, salts, and a buffering agent. The different percentages of hydrolyzate and mock media contained equal amounts of corresponding sugars, acetate, and supplements. 100% (v/v) hydrolyzate is equal to approximately 30-36% equivalent solids for all biomass materials. Error bars represent the standard deviation. Abbreviations: WO, wet oxidation; SPORL, sulfite pretreatment to overcome recalcitrance of lignocellulose.
Figure C-AF-1.4. Relative maximum cell densities of hydrolyzate adapted LB20 biocatalysts over time in 40% (v/v) FS-03 WO and SPORL pretreated hydrolyzates. The maximum cell density of the parental strain, LB20 (control), was compared to newly adapted isolates by following the maximum cell density approximately each week. Cell transfer and cell density measurements were performed using a Tecan Freedom Evo robotic system and Infinite M1000 Pro microplate reader, respectively. Relative cell densities in the graphs were normalized to the maximum cell density. The clarified FS-03 WO and SPORL hydrolyzates were supplemented with a nutrient package, salts, and a buffering agent. Abbreviations: WO, wet oxidation; SPORL, sulfite pretreatment to overcome recalcitrance of lignocellulose.

632ND CUMULATIVE REPORT | APRIL 2013 - MARCH 2014
Figure C-AF-1.5. Relative cell densities of hydrolyzate adapted LB4 and LB20 derived biocatalysts using 40% (v/v) FS-03 SPORL pretreated hydrolyzate medium in shake flask fermentations. All hydrolyzates were clarified to remove solids and were supplemented with a nutrient package, salts, and a buffering agent. The 40% (v/v) mixtures have sugars and acetate equivalent to 100% of the hydrolyzate. 100% hydrolyzate is equal to approximately 30-36% equivalent solids. Fermentation was carried out at 33°C. Cell density was measured using a spectrophotometer. Error bars represent the standard deviation. Abbreviations: SPORL, sulfite pretreatment to overcome recalcitrance of lignocellulose.
Figure C-AF-1.6. Relative average specific isobutanol productivities of hydrolyzate adapted LB4 and LB20 derived biocatalysts using 40% (v/v) FS-03 SPORL pretreated hydrolyzate medium in shake flask fermentations. All hydrolyzates were clarified to remove solids and were supplemented with a nutrient package, salts, and a buffering agent. The 40% (v/v) mixtures have sugars and acetate equivalent to 100% of the hydrolyzate. 100% hydro-lyzate is equal to approximately 30-36% equivalent solids. Fermentation was carried out at 33°C. Cell density and isobutanol titers were measured using a spectrophotometer and GC, respectively. Average specific productivity is the g CDW / (g/L/h of isobutanol). Error bars represent the standard deviation. Abbreviations: SPORL, sulfite pretreatment to overcome recalcitrance of lignocellulose.

642ND CUMULATIVE REPORT | APRIL 2013 - MARCH 2014
Figure C-AF-1.7. Relative average specific isobutanol productivities of hydrolyzate adapted LB4 and LB20 derived biocatalysts using 40% (v/v) FS-03 SPORL pretreated hydrolyzate medium in shake flask fermentations. All hydrolyzates were clarified to remove solids and were supplemented with a nutrient package, salts, and a buffering agent. The 40% (v/v) mixtures have sugars and acetate equivalent to 100% of the hydrolyzate. 100% hydro-lyzate is equal to approximately 30-36% equivalent solids. Fermentation was carried out at 33°C. Cell density and isobutanol titers were measured using a spectrophotometer and GC, respectively. Average specific productivity is the g CDW / (g/L/h of isobutanol). Error bars represent the standard deviation. Abbreviations: SPORL, sulfite pretreatment to overcome recalcitrance of lignocellulose.
Figure C-AF-1.8. Gevo approach to modeling material flows and capital and operating costs

652ND CUMULATIVE REPORT | APRIL 2013 - MARCH 2014
Figure C-AF-1.9. One liter GIFT® system fermentation data using the current best hydrolyzate adapted isobutanol producing biocatalyst (LB4) showing the percent relative dry cell weight during the growth phase in 20% (v/v) of each FS-10 hydrolyzate. The clarified hydrolyzates were supplemented with a nutrient package, salts, and pH controlled adjusted during the fermentation. The 20% (v/v) mixture of each hydrolyzate contained equal amounts of corresponding sugars to the 100% material and equivalent supplements were added to each hydrolyzate. Cell dry weight (CDW) was calculated using a conversion factor multiplied by the cell density measured on a spec-trophotometer. All of the hydrolyzates were tested in GIFT® systems except the MB SSL. Error bars represent the standard deviation of duplicates. Abbreviations: WO, wet oxidation; SPORL, sulfite pretreatment to overcome recalcitrance of lignocellulose; CMB, combined mild bisulfite; UMW, unconcentrated milled wood; MB, mild bisulfite; SSL, spent sulfite liquor.
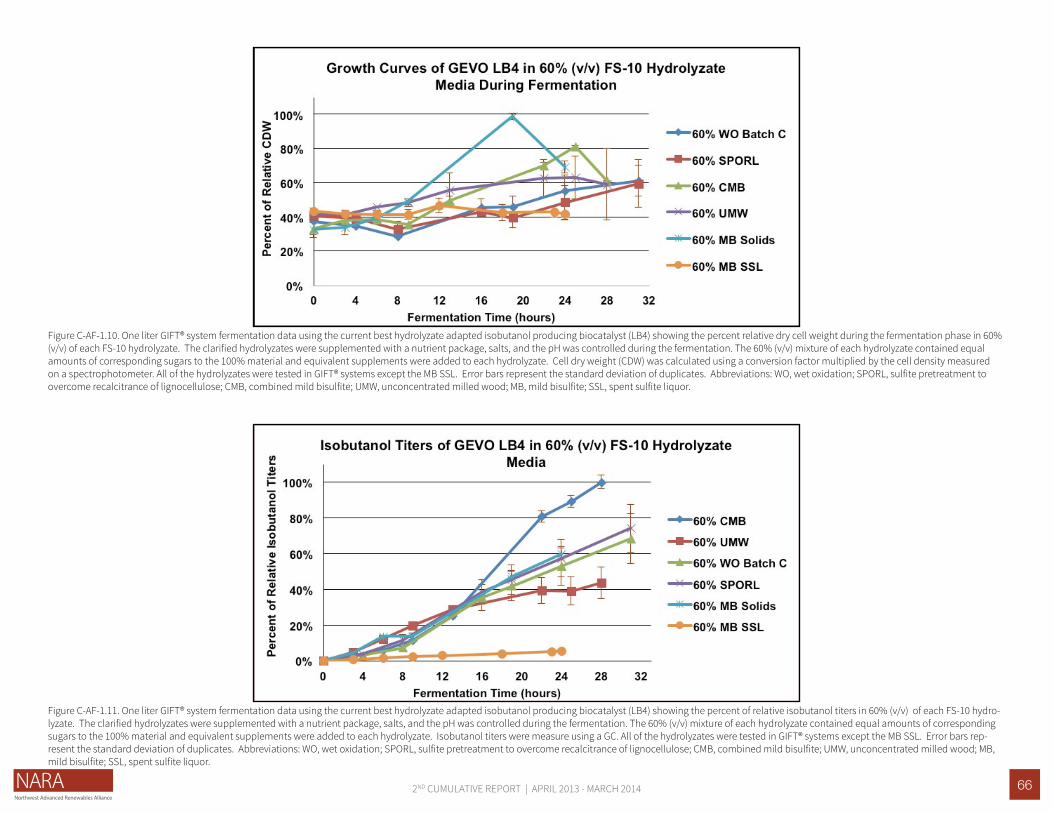
662ND CUMULATIVE REPORT | APRIL 2013 - MARCH 2014
Figure C-AF-1.10. One liter GIFT® system fermentation data using the current best hydrolyzate adapted isobutanol producing biocatalyst (LB4) showing the percent relative dry cell weight during the fermentation phase in 60% (v/v) of each FS-10 hydrolyzate. The clarified hydrolyzates were supplemented with a nutrient package, salts, and the pH was controlled during the fermentation. The 60% (v/v) mixture of each hydrolyzate contained equal amounts of corresponding sugars to the 100% material and equivalent supplements were added to each hydrolyzate. Cell dry weight (CDW) was calculated using a conversion factor multiplied by the cell density measured on a spectrophotometer. All of the hydrolyzates were tested in GIFT® systems except the MB SSL. Error bars represent the standard deviation of duplicates. Abbreviations: WO, wet oxidation; SPORL, sulfite pretreatment to overcome recalcitrance of lignocellulose; CMB, combined mild bisulfite; UMW, unconcentrated milled wood; MB, mild bisulfite; SSL, spent sulfite liquor.
Figure C-AF-1.11. One liter GIFT® system fermentation data using the current best hydrolyzate adapted isobutanol producing biocatalyst (LB4) showing the percent of relative isobutanol titers in 60% (v/v) of each FS-10 hydro-lyzate. The clarified hydrolyzates were supplemented with a nutrient package, salts, and the pH was controlled during the fermentation. The 60% (v/v) mixture of each hydrolyzate contained equal amounts of corresponding sugars to the 100% material and equivalent supplements were added to each hydrolyzate. Isobutanol titers were measure using a GC. All of the hydrolyzates were tested in GIFT® systems except the MB SSL. Error bars rep-resent the standard deviation of duplicates. Abbreviations: WO, wet oxidation; SPORL, sulfite pretreatment to overcome recalcitrance of lignocellulose; CMB, combined mild bisulfite; UMW, unconcentrated milled wood; MB, mild bisulfite; SSL, spent sulfite liquor.

672ND CUMULATIVE REPORT | APRIL 2013 - MARCH 2014
Figure C-AF-1.13. One liter GIFT® system fermentation data using the current best hydrolyzate adapted isobutanol producing biocatalyst (LB4) showing the percent of relative average volumetric isobutanol productivity in 60% (v/v) of each FS-10 hydrolyzate. The clarified hydrolyzates were supplemented with a nutrient package, salts, and the pH was controlled during the fermentation. The 60% (v/v) mixture of each hydrolyzate contained equal amounts of corresponding sugars to the 100% material and equivalent supplements were added to each hydrolyzate. Isobutanol was measured using a GC. All of the hydrolyzates were tested in GIFT® systems except the MB SSL. Error bars represent the standard deviation of duplicates. Abbreviations: WO, wet oxidation; SPORL, sulfite pretreatment to overcome recalcitrance of lignocellulose; CMB, combined mild bisulfite; UMW, unconcentrated milled wood; MB, mild bisulfite; SSL, spent sulfite liquor.
Figure C-AF-1.12. One liter GIFT® system fermentation data using the current best hydrolyzate adapted isobutanol producing biocatalyst (LB4) showing the average specific isobutanol productivity in 60% (v/v) of each FS-10 hydrolyzate. The clarified hydrolyzates were supplemented with a nutrient package, salts, and the pH was controlled during the fermentation. The 60% (v/v) mixture of each hydrolyzate contained equal amounts of corre-sponding sugars to the 100% material and equivalent supplements were added to each hydrolyzate. Cell dry weight (CDW) was calculated using a conversion factor multiplied by the cell density measured on a spectropho-tometer and isobutanol was measured using a GC. All of the hydrolyzates were tested in GIFT® systems except the MB SSL. Error bars represent the standard deviation of duplicates. Abbreviations: WO, wet oxidation; SPORL, sulfite pretreatment to overcome recalcitrance of lignocellulose; CMB, combined mild bisulfite; UMW, unconcentrated milled wood; MB, mild bisulfite; SSL, spent sulfite liquor.

682ND CUMULATIVE REPORT | APRIL 2013 - MARCH 2014
Figure C-AF-1.15. One liter GIFT® system fermentation data using the current best hydrolyzate adapted isobutanol producing biocatalyst (LB4) showing the percent of relative isobutanol titers in 60% (v/v) of each FS-10 hydro-lyzate. The clarified hydrolyzates were supplemented with a nutrient package, salts, and pH controlled adjusted during the fermentation. The 60% (v/v) mixture of each hydrolyzate contained equal amounts of corresponding sugars to the 100% material and equivalent supplements were added to each hydrolyzate. Cell dry weight (CDW) was calculated using a conversion factor multiplied by the cell density measured on a spectrophotometer. All of the hydrolyzates were tested in GIFT® systems except the MB SSL. Error bars represent the standard deviation of duplicates. Abbreviations: WO, wet oxidation; SPORL, sulfite pretreatment to overcome recalcitrance of lignocellulose; CMB, combined mild bisulfite; UMW, unconcentrated milled wood; MB, mild bisulfite; SSL, spent sulfite liquor.
Figure C-AF-1.14. One liter GIFT® system fermentation data using the current best hydrolyzate adapted isobutanol producing biocatalyst (LB4) showing the percent of relative isobutanol titers in 60% (v/v) of each FS-10 hydro-lyzate. The clarified hydrolyzates were supplemented with a nutrient package, salts, and the pH was controlled during the fermentation. The 60% (v/v) mixture of each hydrolyzate contained equal amounts of corresponding sugars to the 100% material and equivalent supplements were added to each hydrolyzate. Cell dry weight (CDW) was calculated using a conversion factor multiplied by the cell density measured on a spectrophotometer. All of the hydrolyzates were tested in GIFT® systems except the MB SSL. Error bars represent the standard deviation of duplicates. Abbreviations: WO, wet oxidation; SPORL, sulfite pretreatment to overcome recalcitrance of lignocellulose; CMB, combined mild bisulfite; UMW, unconcentrated milled wood; MB, mild bisulfite; SSL, spent sulfite liquor.

692ND CUMULATIVE REPORT | APRIL 2013 - MARCH 2014
Physical and Intellectual OutputsPhysical
• Andrew Hawkins presented at the Joint USDA AFRI CAP/AAIC Meeting 10/12/13 in Washington, DC.
• Grant Balzer presented at the Harvesting Clean Ener-gy Conference 2/4/14 in Helena, MT.
Conference Proceedings and Abstracts from Profes-sional Meetings
Harvesting Clean Energy Abstract:
Fermentative Conversion of Hydrolyzed Douglas fir Biomass into Isobutanol and Biojet
The pretreatment and hydrolysis of lignocellulosic biomass to release nutrients and sugars can ultimate-ly lead to the production of biofuels and biochemi-cals. Gevo has developed fermentation and process technology to convert biomass sugars to isobutanol, followed by chemical processing into renewable jet fuel. Gevo uses GIFT®, Gevo Integrated Fermentation Technology, to produce isobutanol at high productiv-ity, titer, and yield using a biocatalyst. As part of the Northwest Advanced Renewables Alliance (NARA), Gevo’s goal is to fermentatively convert hydrolyzed Douglas fir biomass into isobutanol at a specification developed by Gevo that ensures the isobutanol will be further converted into renewable biojet using existing Gevo technology. The specific tasks of Gevo’s project for NARA include: (1) Characterize and evaluate repre-sentative samples of pretreated Douglas fir biomass; (2) Adapt yeast biocatalysts to pretreated biomass hydrolyzates; (3) Produce isobutanol at laboratory scale to optimize isobutanol production using the adapted yeast biocatalyst; (4) Economic assessment of wood to isobutanol, biojet; (5) Analyze isobutanol to close the mass balance and determine potential low-level impu-rities; (6) Produce isobutanol at demonstration scale using GIFT® fermentations and convert the lignocellu-losic derived isobutanol to biojet for further testing.
Recommendations | ConclusionsWork is proceeding according to the project plan. Characterization of pretreated materials has been com-pleted for the materials considered in the pretreatment downselection process. The adaptation program con-tinues to provide biocatalysts with better performance in both growth and isobutanol production with new strains from Gevo’s biocatalyst engineering group. In order to obtain the best biocatalyst possible and identify the best conditions for fermentations, narrowing down the types of pretreatments examined will allow a more focused adaptation program. Batch and GIFT® fermentations at the 1L scale showed that isobutanol production in hydrolyzates reach similar titers as the control media, under the conditions tested. One liter GIFT® fermenta-tions will continue in order to find the optimum process parameters for isobutanol production. Gevo has com-pleted a process model and will continue to refine it.

702ND CUMULATIVE REPORT | APRIL 2013 - MARCH 2014
Task DescriptionActivities and ResultsKey Personnel Affiliation
Birgitte Ahring Washington State University
Using the proprietary BioChemCat Process, the Washington State University’s Bioproducts, Scienc-es and Engineering Laboratory (WSU BSEL) will, in parallel with Gevo, investigate the production of jet fuel from woody residues. In the project, WSU BSEL will concentrate ist efforts on the following two areas: Task 1: Co-culture optimization for high production yield and productivity of volitile fatty acids (VFA) from pretreated biomass hydrolysate. Task 2: Catalysis of platform molecules into jet fuel. WSU BSEL will work with teh Pacific Northwest National Laboratory (PNNL) using the PNNL combinatorial catalysis computational laboratory platform.
The BioChemCat process is a new way to produce more biofuels from biomass at a significantly low-er cost. The cost reductions will come from: 1) the process does not use enzymes, a significant cost reduction; 2) the mixed culture fermentation used is non-sterile and robust; 3) no special seed culture needs to be grown, and the culture needs no expen-sive additives; 4) simple low-cost reactors as used for anaerobic digestion; 5) only a fraction of the biomass material needs to be pretreated and with low retention times which considerably lowers the cost of pretreat-ment (see below); 6) a large part of the lignin can be converted to biofuels along with the carbohydrates in the biomass material.
TASK C-AF-2: PRODUCTION OF JET FUEL USING BIOCHEMCAT
[Redacted introduction]
Task 1
Fermentation was performed on both FS-01, FS-03 and FS-10 feedstock samples which were pretreat-ed using the wet oxidation method and then further fermented using 2% Corn Steep Liquor as the only supplement. The fermentation was run in fed batch, and the productivity varied between 0.3 to 0.8 g/L/h. Compared to traditional processes operating from cellulosic sugars where enzymatic hydrolysis is need-ed before the fermentation, the overall process time is comparable.
Preliminary results have been done showing higher productivities when using continuous fermentation. [Redacted information]
Separation of the VFAs from the fermentation broth is a main unit operation of major importance for the eco-nomics of the overall process. Carboxylic acids are normally separated out by precipitation during the fer-mentation as a calcium salt using calcium hydroxide to stabilize pH. The salt will, however, interfere with the upgrading processes which is often performed in a gaseous phase, and gypsum will be formed when the acids are recovered with sulfuric acids. Further-more, the acid salt will influence the fermentation in a negative way through product inhibition to the conversion process; therefore, different solutions have been investigated to remove the acids in the native form during their production.
Three different separation methods: (i) pressurized carbon dioxide extraction; (ii) ion exchange resin-me-diated extraction; and (iii) esterification, have been investigated for the extraction of organic acids from fermentation broth.
The extraction of acetic acid from the model solu-tion using pressurized carbon dioxide was optimized based on a response surface model as discussed in the NARA cumulative report for the year 2012-2013. In the first quarter of fiscal year 2013, the volatile fatty acids from the fermentation broth were extracted using pressurized carbon dioxide at the conditions optimized through the response surface model. The fermentation broth used as a model was spiked to contain approximately 15, 30, 50 and 75 g/L acetic acid, and carbon dioxide was used as the extraction solvent. The broth was acidified to pH at around 3.0 to facilitate the extraction process. The conditions for the extraction of acetic acid from the broth using carbon dioxide was at a temperature of 50°C, solvent flow rate of 991.4 standard cubic centimeters per second (sccm), pressure of 2500 pounds per square inch (psi) and extraction time of 1hr. The percent of acetic acid extracted, and the mass of acetic acid extracted per gram of CO2, from cow rumen versus model acetic acid solution is shown in Figure C-AF-2.1. The data obtained in this study of pressurized carbon dioxide extraction of acetic acid from fermentation broth has been compiled into a manuscript which has been submitted to a peer-reviewed journal.
Unlike with supercritical carbon dioxide extraction, where negligible amount of studies were available in the literature, ion exchange extraction of volatile fatty acids has been studied for the last 20 years but has not been optimized for extraction from fermentation broth. A literature review revealed that the use of a weak-base ion exchange resin can help achieve greater extraction of volatile fatty acids while requir-ing lower amounts of a strong base such as sodium hydroxide or ammonium hydroxide to elute the acid from the resin. AmberlieTM IRA-67 and IRA-96 pro-duced by DOW chemical was purchased to optimize the extraction of volatile fatty acids from fermentation broth.
Information on this page is potentially proprietary and has been omitted and replaced with the word “redacted”. Please contact members of the NARA executive committee (see “organizational structure” in this report) for further information.
712ND CUMULATIVE REPORT | APRIL 2013 - MARCH 2014
Preliminary column experiments were done, using pure C3-acid solution passing through a fixed bed of AmberliteTM IRA-67 (18 cm length x 1 cm i.d.) at different flow rates, to measure the breakthrough and saturation limits of the resin for C-3 acids. It should be noted that AmberliteTM IRA-67 has a micro-porous gel structure with ammonium free base cation that binds with the lactate ion from the solution to facilitate extraction.
Further studies were done by using a mixed bacterial consortia to optimize the fermentation of pretreated FS-10 hydrolyzate to produce C-3 acids. Briefly, 120g of AmberliteTM IRA 67 free base resin was added to the resin flask after washing with approximately 2.5N NaOH, followed by washing with water, until the pH of the resin droped to around 8.5-9.5. Varying amounts of deionized water (20-100mL) was added to the resin flask to maintain the resin in a semi-solid form. The initial pH of the solution in the fermentation flask was initially brought up to 5.5 using 5N NaOH solution. The pH of the fermentation was initially con-trolled using 5N NaOH solution until the concentration of C-3 acid-salt in the fermenter reached around 20 g/L. The pH control and C-3 acid separation was then changed to the resin flask usually after the first feeding (done when glucose concentration decreased below 10g/L in the broth) between 24 and 36 hours. Recirculation pumps were operated through a de-crease in the pH of the fermenter allowing the broth to flow through the ion exchange resin bed to even-tually regulate the pH inside the fermenter to the set point through adsorption of the C-3 acid onto the ion exchange resin. The fermenter was fed continuously until the recirculation pumps ran continuously due to the inability of the ion exchange resin to regulate pH of the fermenter due to saturation with C-3 acid. At this point, the ion exchange resin flask was swapped with a new or a regenerated resin bed and the C-3 acid was desorbed from the ion exchange resin using 2.5 N NaOH using three simultaneous elution’s yielding concentrations of 60g/L, 25g/L and 3g/L C-3 acid-salt with each elution, respectively.
The fermentation using regenerated ion-exchange resin beds in the recirculation loop was run with minimal issues in repeated fed-batch form for around 65 days. It was found that during this time, the concentrations of sugar in the fermentation broth were around 10-12 g/L glucose and 8g/L xylose. The concentration of C-3 acid in the fermentation broth was found to be around 12g/L with the rest separated out using ion-exchange resin bed. The concentrations of the sugars, C-3 and C-2 acids in the fermentation broth, as a function of time, are shown in Figure C-AF-2.3.
The VFAs present in the fermentation broth, sepa-rated by either ion exchange resin bed or the salt precipitation process, form byproducts such as sodium sulphate or gypsum (based on the salt used for elution of the ion exchange resin or neutralization of fermentation broth) which have limited applications. The formation of such byproducts can be prevented through direct esterification of the carboxylic acid or carboxylic acid salt using an acid-catalyzed or reac-tive esterification method.
[Information and figures C-AF-2.4 and C-AF-2.5 are redacted.]
The acetic acid extracted from the fermentation broth and the model solution was not significantly different from each other especially at concentrations of acetic acid in the feed exceeding 50g/L. The difference in the total percent of acetic acid extracted using pres-surized carbon dioxide between fermentation broth and model solution can be attributed to the presence of other volatile fatty acids in the broth. While the concentration of these other acids (propionic and butyric) does not change, it seems that the carbon dioxide preferentially extracted the higher fatty acids. It was found that as the concentration of the acetic acid in the fermentation broth increased, the ratio of the higher fatty acids decreased, thereby, significantly decreasing the difference between the experimental data and the prediction model. Further studies are
currently being done to study the effect of higher organic acids on the extraction of acetic acid from fermentation broth using supercritical carbon dioxide.
While the extraction of volatile fatty acids using pressurized carbon dioxide has shown close to 100% recovery of acetic acid at the optimized conditions, the technology at its current stage can be considered expensive due to the compression requirements for carbon dioxide. However, these costs can be miti-gated by further optimizing the conditions and also through carbon dioxide serving as a carrier or solvent for these volatile fatty acids as it progresses further into catalytic upgrading to convertion to jet fuels. With carbon dioxide as a solvent for the acids in catalytic upgrading, the need for other solvents such as organ-ic or hydroalcoholic solvents, and any acid-base reac-tion resulting in waste production, can be avoided.
Experiments done using ion exchange resin (Amber-liteTM IRA-67) mediated acid separation from the fermentation broth indicated that the capacity of the resin bed was around 120 mg C-3 acid/g resin which varies with the presence of C-2 (20 mg/g resin). C-4 and other acids produced during fermentation also bind onto the resin bed and can be eluted using NaOH. The re-usability of the ion exchange resin after washing with 2.5 N NaOH to desorb the separated C-3 acid was also studied using two ion exchange resin beds, used interchangeably with the fermenta-tion. These two ion exchange beds were regenerated twice, and the resin loading (mg acid/g initial resin) for C-3 and C-2 acids was plotted as a function of re-generation (or elution) cycles. It was found that the ion exchange resins can be sufficiently generated, and the regeneration process does not affect the ability of the resin to separate the acids from fermentation broth.
While the ion exchange resin mediated separation process showed high capacity for selective removal of VFA from the fermentation broth, while subsequently maintaining pH in the fermentation broth, the capital costs associated with using ion exchange resins in a scaled-up process could be prohibitive. Also, the acid
Recommendations | Conclusions
Information on this page is potentially proprietary and has been omitted and replaced with the word “redacted”. Please contact members of the NARA executive committee (see “organizational structure” in this report) for further information.

722ND CUMULATIVE REPORT | APRIL 2013 - MARCH 2014
Future Workneeds to be eluted from the ion exchange resin after saturation using a salt. However, the further conver-sion of this acid to alcohols through catalytic hydroge-nation is more efficient when done in vapor phase ver-sus liquid phase since the water content in the acid feed, which is toxic to several common hydrogenation catalysts, is used. Hence, it would significantly reduce process costs and increase process efficiency if the acid was selectively converted to its ester and further taken in the vapor phase to be hydrogenated, in the presence of a catalyst, to produce alcohols that can then be eventually converted to jet fuel components. Studies published in the literature indicate VFA purity as high as 98% through esterification, and several methods show greater conversion efficiency of esters to alcohols through vapor phase hydrogenation when compared to the VFAs in their acid forms.
[Information redacted]
Task 1
[Information redacted]
Task 2
Work to covert VFAs into mixed alcohols has been initiated. [Information redacted]
After next year, all elements will be in place to move the BioChemCat process to large scale pilot and further commercialization scenarios. (Figure C-AF-2.6 redacted)
As can be seen from Figure C-AF-2.7, a lab-scale catalytic system has been designed and is currently in process of being set-up in the laboratory at BSEL. There is also significant impetus towards financing the new equipment through different sources. The parts required for constructing the catalytic hydrogenation system have been purchased through funding from other sources, and an experimental procedure has been designed to optimize and study the conversion of the methyl ester of carboxylic acids into alcohols. Inprovements have been made in this task from those reported in previouse NARA progress reports. The hydrogenation catalysts have been produced and are being characterized using various equipment avail-able through our collaboration with Pacific Northwest National Laboratory (service facility).
Biomass Yield of VFA Yield of Mixed Alcohols Yield of Jet FuelFS 01 510 kg/ton 126 gal/ton 74.8 gal/tonFS 03 410 kg/ton 101 gal/ton 60.1 gal/tonFS 10 440 kg/ton 109 gal/ton 64.5 gal/ton
Table CFA-2.1. The yield of VFA and the calculated yield of mixed alcohols and jet fuel from the fermentations performed under NARA.
Physical and Intellectual OutputsNone for this reporting period
Information on this page is potentially proprietary and has been omitted and replaced with the word “redacted”. Please contact members of the NARA executive committee (see “organizational structure” in this report) for further information.
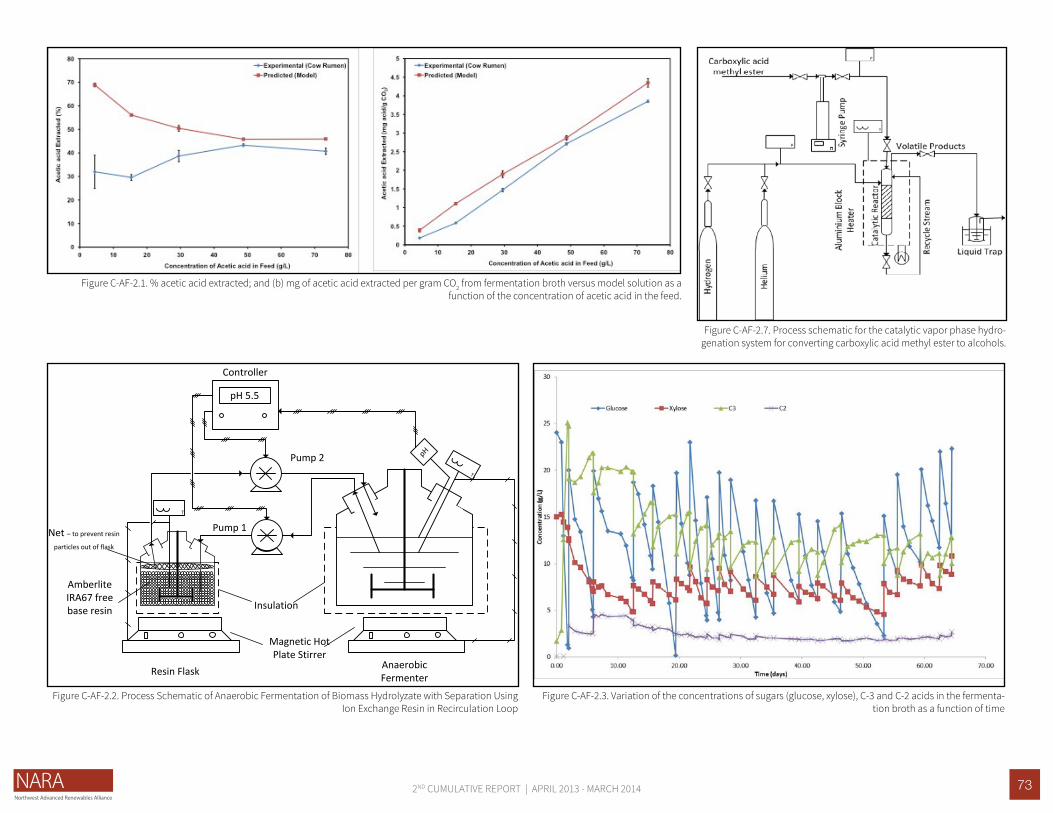
732ND CUMULATIVE REPORT | APRIL 2013 - MARCH 2014
T
pH
Magnetic Hot Plate Stirrer
Insulation
Amberlite IRA67 free base resin
Controller
pH 5.5
Pump 1
Pump 2
Resin Flask Anaerobic Fermenter
Net – to prevent resin
particles out of flask
T
Figure C-AF-2.2. Process Schematic of Anaerobic Fermentation of Biomass Hydrolyzate with Separation Using Ion Exchange Resin in Recirculation Loop
Figure C-AF-2.3. Variation of the concentrations of sugars (glucose, xylose), C-3 and C-2 acids in the fermenta-tion broth as a function of time
Figure C-AF-2.7. Process schematic for the catalytic vapor phase hydro-genation system for converting carboxylic acid methyl ester to alcohols.
Figure C-AF-2.1. % acetic acid extracted; and (b) mg of acetic acid extracted per gram CO2 from fermentation broth versus model solution as a function of the concentration of acetic acid in the feed.

742ND CUMULATIVE REPORT | APRIL 2013 - MARCH 2014

752ND CUMULATIVE REPORT | APRIL 2013 - MARCH 2014

762ND CUMULATIVE REPORT | APRIL 2013 - MARCH 2014

772ND CUMULATIVE REPORT | APRIL 2013 - MARCH 2014
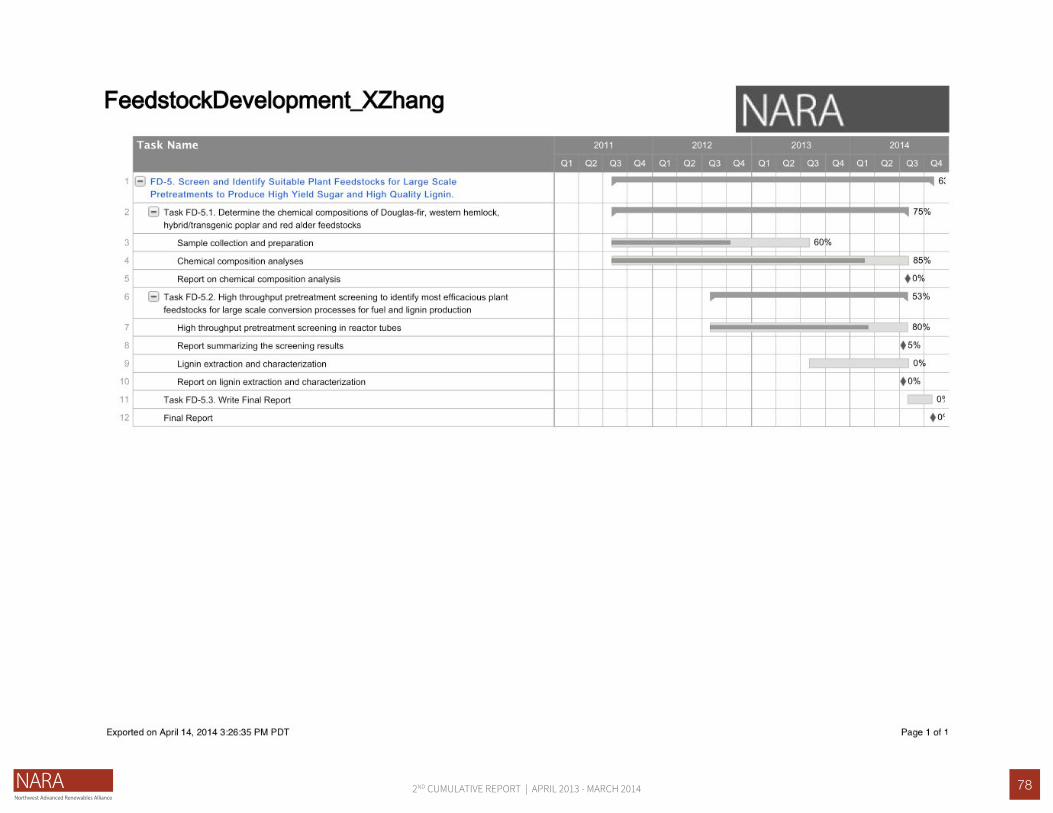
782ND CUMULATIVE REPORT | APRIL 2013 - MARCH 2014

792ND CUMULATIVE REPORT | APRIL 2013 - MARCH 2014
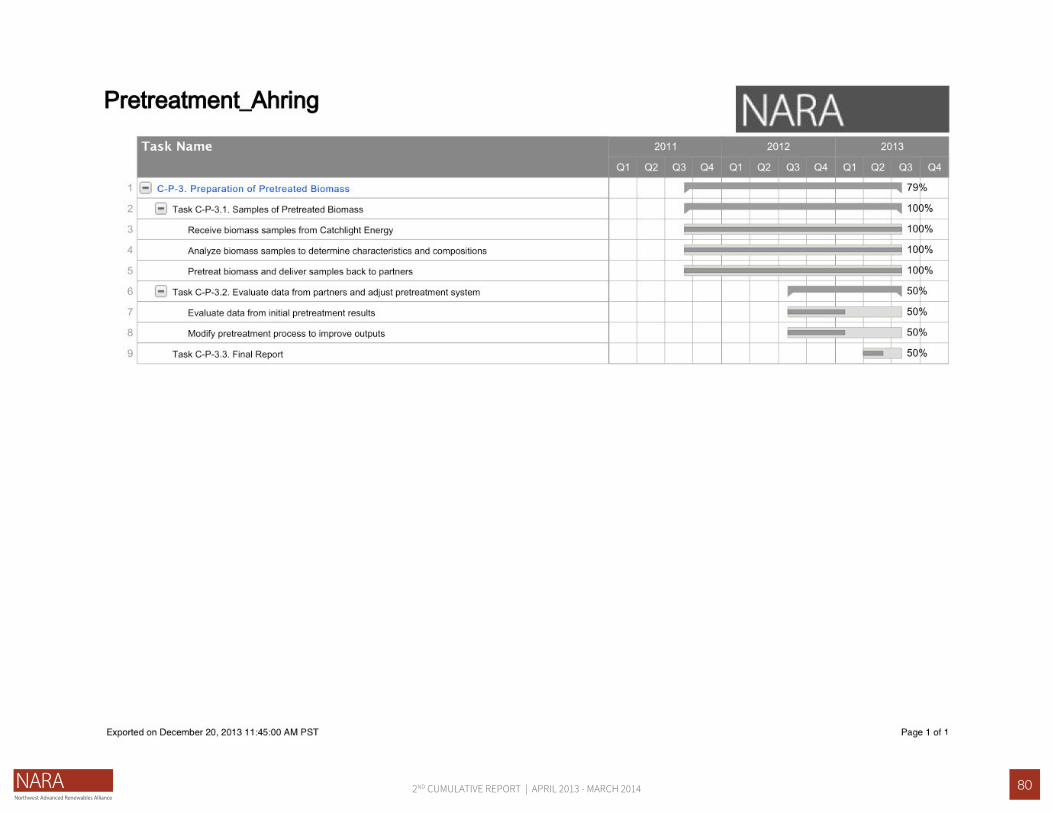
802ND CUMULATIVE REPORT | APRIL 2013 - MARCH 2014

812ND CUMULATIVE REPORT | APRIL 2013 - MARCH 2014

822ND CUMULATIVE REPORT | APRIL 2013 - MARCH 2014
Page 1 of 2Exported on December 5, 2013 2:39:21 PM PST

832ND CUMULATIVE REPORT | APRIL 2013 - MARCH 2014
Page 2 of 2Exported on December 5, 2013 2:39:21 PM PST
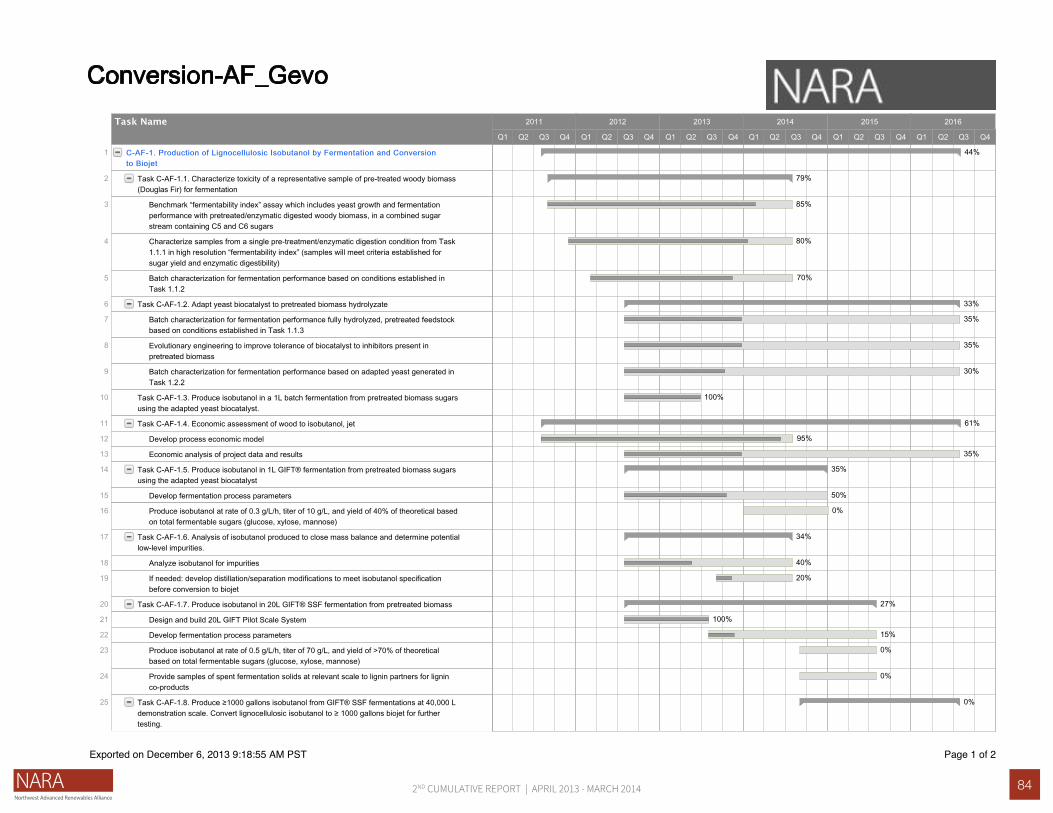
842ND CUMULATIVE REPORT | APRIL 2013 - MARCH 2014
Page 1 of 2Exported on December 6, 2013 9:18:55 AM PST

852ND CUMULATIVE REPORT | APRIL 2013 - MARCH 2014
Page 2 of 2Exported on December 6, 2013 9:18:56 AM PST

862ND CUMULATIVE REPORT | APRIL 2013 - MARCH 2014