NAPTP 2015 MLP Investor Conference
36
NAPTP 2015 MLP Investor Conference May 2015
-
Upload
irjpenergy -
Category
Investor Relations
-
view
1.238 -
download
0
Transcript of NAPTP 2015 MLP Investor Conference
NAPTP 2015 MLP Investor Conference
May 2015
Disclaimers
2
Forward Looking StatementsThis presentation contains forward‐looking statements. These statements discuss future expectations, contain projections of results of operations or of financial condition or state other forward‐looking information. These statements are based upon various assumptions, many of which are based, in turn, upon further assumptions, including examination of historical operating trends made by the management of the Partnership. Although the Partnership believes that these assumptions were reasonable when made, because assumptions are inherently subject to significant uncertainties and contingencies, which are difficult or impossible to predict and are beyond its control, the Partnership cannot give assurance that it will achieve or accomplish these expectations, beliefs or intentions. These forward‐looking statements involve risks and uncertainties. When considering these forward‐ looking statements, you should keep in mind the risk factors and other cautionary statements in the Partnership’s 10‐K and other documents on file with the Securities and Exchange Commission. The risk factors and other factors noted in the Partnership’s public filings could cause the Partnership’s actual results to differ materially from those contained in any forward‐looking statement.
This document includes certain non‐GAAP financial measures as defined under SEC Regulation G. A reconciliation of those measures to most directly comparable GAPP measures is provided in the appendix to this presentation.
Non‐GAAP MeasuresAdjusted EBITDA is defined as net income (loss) plus (minus) interest expense (income), income tax expense (benefit), depreciation and amortization expense, asset impairments, (gains) losses on asset sales, certain non‐cash charges such as non‐cash equity compensation and non‐cash vacation expense, non‐cash (gains) losses on commodity derivative contracts (total (gain) loss on commodity derivatives less net cash flow associated with commodity derivatives settled during the period) and selected (gains) charges and transaction costs that are unusual or non‐recurring and other selected items that impact comparability.
We define distributable cash flow as Adjusted EBITDA less net cash interest paid, income taxes paid and maintenance capital expenditures.

JP Energy Partners LP (JPEP) Overview
3
• NYSE Listed: JPEP• Formed in May 2010; IPO in October 2014• JPEP is a publicly traded, diversified master limited partnership with operations including:
• Crude Oil Pipelines and Storage• Refined Products Terminals and Storage• NGL Distribution and Sales• Crude Oil Supply and Logistics
• JPEP Trading Summary (1)
• Unit Price: $13.34• Units Outstanding: 36.4mm• Market Cap: $486mm• Current Yield: 9.7%
___________________________1. As of May 15, 2015 close. Assumes $1.30 annual distribution
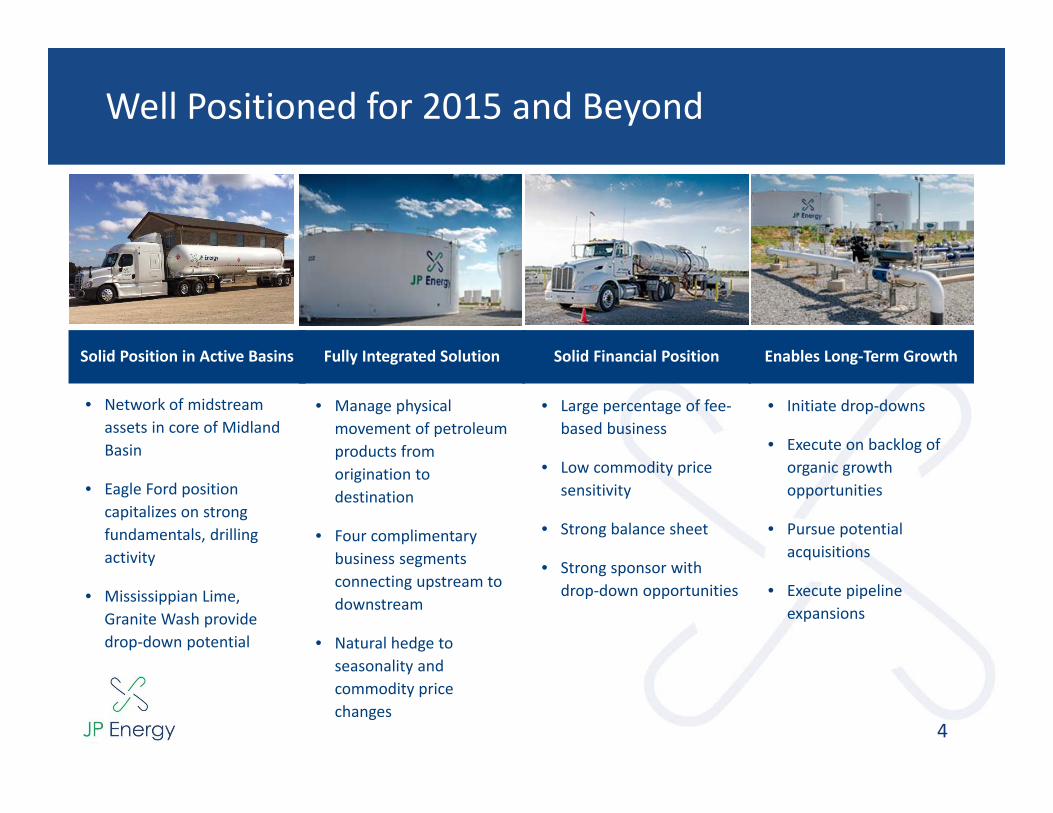
Well Positioned for 2015 and Beyond
4
Solid Position in Active Basins Fully Integrated Solution Solid Financial Position
• Network of midstream assets in core of Midland Basin
• Eagle Ford position capitalizes on strong fundamentals, drilling activity
• Mississippian Lime, Granite Wash provide drop‐down potential
• Manage physical movement of petroleum products from origination to destination
• Four complimentary business segments connecting upstream to downstream
• Natural hedge to seasonality and commodity price changes
• Large percentage of fee‐based business
• Low commodity price sensitivity
• Strong balance sheet
• Strong sponsor with drop‐down opportunities
Enables Long‐Term Growth
• Initiate drop‐downs
• Execute on backlog of organic growth opportunities
• Pursue potential acquisitions
• Execute pipeline expansions

Business Diversification

Cylinder Exchange (National)
Geographically Diversified Midstream Platform
6
Crude Oil Pipelines and Storage
Crude Oil Supply and Logistics
Refined Products Terminals and Storage
NGL Sales, NGL Transportation

Diversified Offering From Upstream to Downstream
Integrated logistics solutions from the wellhead to the end‐user
Crude Oil
Producers Refiners
Truck
Pipeline Gathering
Injection Station Pipeline Terminal/Storage/Exchange Location
Pipeline
Refined ProductsNatural Gas LiquidsRefineries
OFS and Agriculture
Gas Stations
Barge
Common Carrier Pipelines
Tanker
Storage
Rail
Diluent for Heavy Crude
Producers
Refinery Produced LPG
Spec Products
Retail Distributor
Storage
7

8
Growing, Fee‐Based Cash Flows with High Quality Customer Base
Refined Products Terminals and Storage– Fixed fees for throughput and storage– Fixed fees for blending services, injection of additives and ancillary
services, including product handling and transfer services– Rollup strategy and optimization
NGL Distribution and Sales– Recent acquisition of NGL truck services from JP Development with
fixed fees based on distance and volume transported Crude Oil Pipelines and Storage
– Fixed storage and throughput or minimum volume commitment fees
– Growing volumes in the Southern Wolfcamp from existing contracted producers with long‐term fee‐based commitments
– Pursuing additional customer acreage and MVC within JP Energy’s capture area
– Expansion of Silver Dollar Pipeline Crude Oil Supply and Logistics
– Crude oil trucking and “fee equivalent” lease gathering
Focused on
Growing Fee‐ba
sed Ca
sh Flows NGL
Distribution and Sales
Refined Products Terminals and Storage
Crude Oil Pipelines & Storage
2014 Adjusted EBITDA Mix
NGL Distribution and Sales
28%
Refined Products Terminals and
Storage19%
Crude Oil Pipeline and Storage
36%
Crude Oil Supply and Logistics
17%
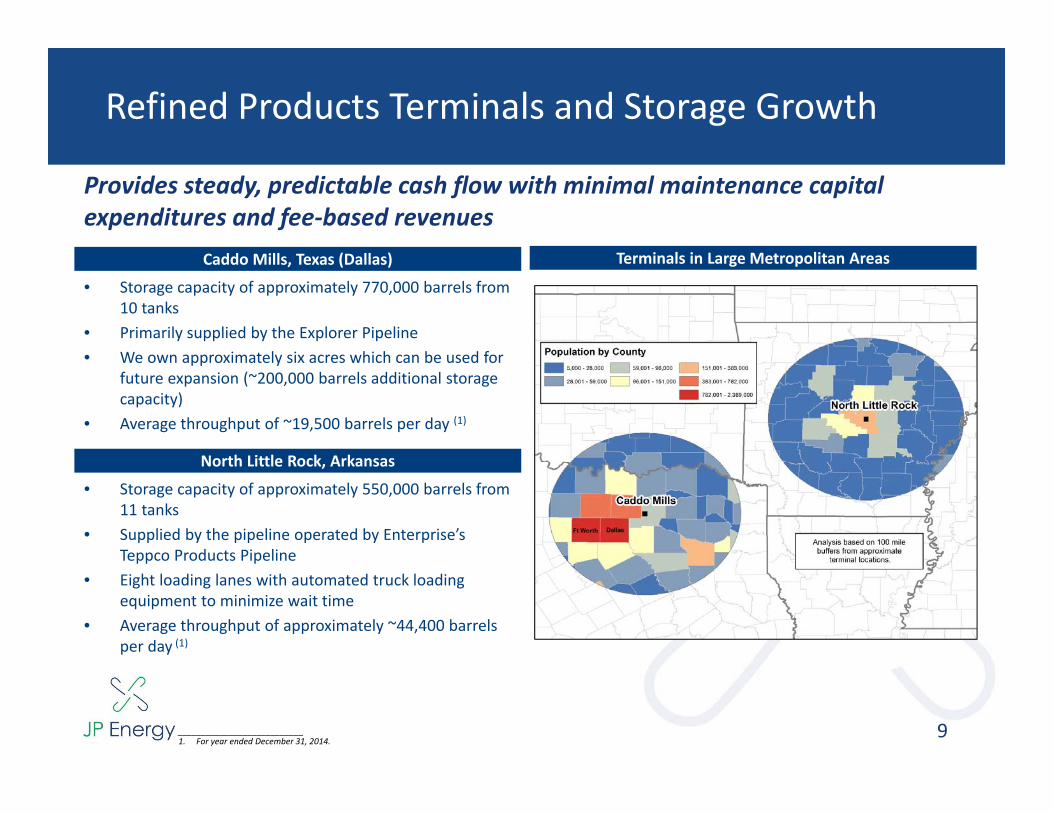
Refined Products Terminals and Storage Growth
• Storage capacity of approximately 770,000 barrels from 10 tanks
• Primarily supplied by the Explorer Pipeline• We own approximately six acres which can be used for
future expansion (~200,000 barrels additional storage capacity)
• Average throughput of ~19,500 barrels per day (1)
Caddo Mills, Texas (Dallas) Terminals in Large Metropolitan Areas
9
• Storage capacity of approximately 550,000 barrels from 11 tanks
• Supplied by the pipeline operated by Enterprise’s Teppco Products Pipeline
• Eight loading lanes with automated truck loading equipment to minimize wait time
• Average throughput of approximately ~44,400 barrels per day (1)
North Little Rock, Arkansas
Provides steady, predictable cash flow with minimal maintenance capital expenditures and fee‐based revenues
___________________________1. For year ended December 31, 2014.
‐50%
‐40%
‐30%
‐20%
‐10%
0%
10%
20%
30%
40%
50%
Jan‐87
Sep‐87
May‐88
Jan‐89
Sep‐89
May‐90
Jan‐91
Sep‐91
May‐92
Jan‐93
Sep‐93
May‐94
Jan‐95
Sep‐95
May‐96
Jan‐97
Sep‐97
May‐98
Jan‐99
Sep‐99
May‐00
Jan‐01
Sep‐01
May‐02
Jan‐03
Sep‐03
May‐04
Jan‐05
Sep‐05
May‐06
Jan‐07
Sep‐07
May‐08
Jan‐09
Sep‐09
May‐10
Jan‐11
Sep‐11
May‐12
Jan‐13
Sep‐13
May‐14
Jan‐15
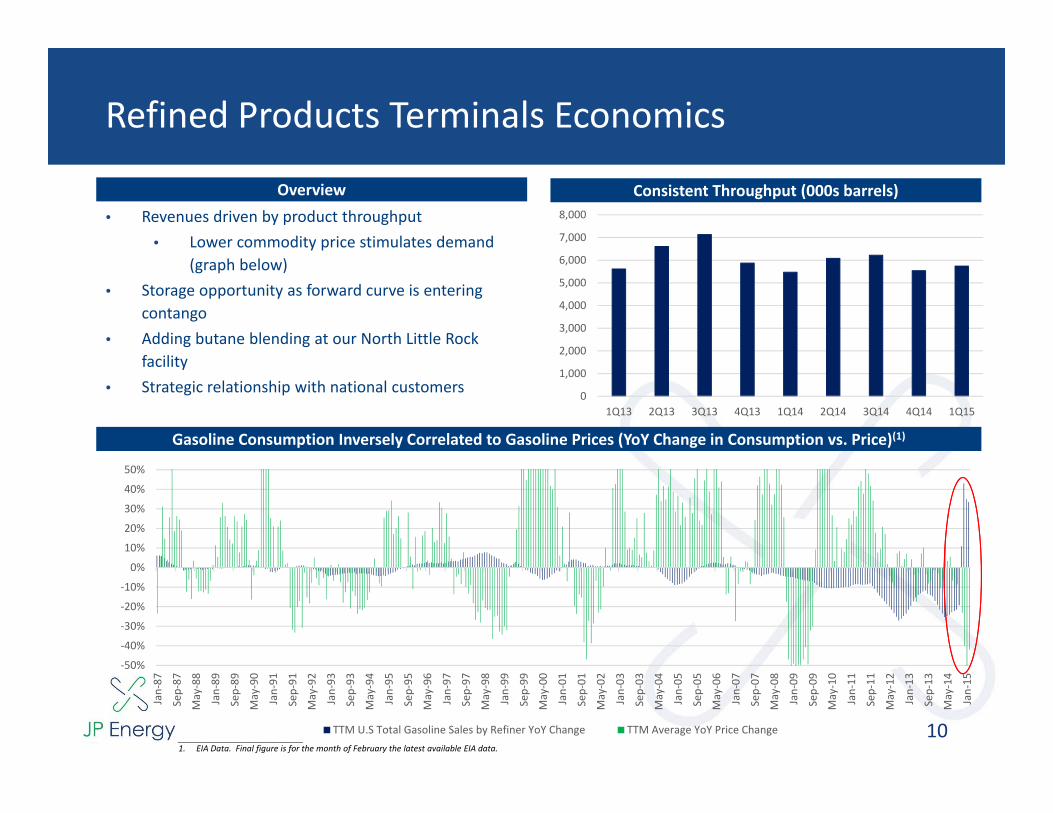
TTM U.S Total Gasoline Sales by Refiner YoY Change TTM Average YoY Price Change
• Revenues driven by product throughput• Lower commodity price stimulates demand
(graph below)• Storage opportunity as forward curve is entering
contango• Adding butane blending at our North Little Rock
facility• Strategic relationship with national customers
Refined Products Terminals Economics
10
Overview
Gasoline Consumption Inversely Correlated to Gasoline Prices (YoY Change in Consumption vs. Price)(1)
Consistent Throughput (000s barrels)
___________________________1. EIA Data. Final figure is for the month of February the latest available EIA data.
0
1,000
2,000
3,000
4,000
5,000
6,000
7,000
8,000
1Q13 2Q13 3Q13 4Q13 1Q14 2Q14 3Q14 4Q14 1Q15
0
10,000
20,000
30,000
40,000
50,000
60,000
70,000
1Q13 2Q13 3Q13 4Q13 1Q14 2Q14 3Q14 4Q14 1Q15
Crude Oil Storage
11
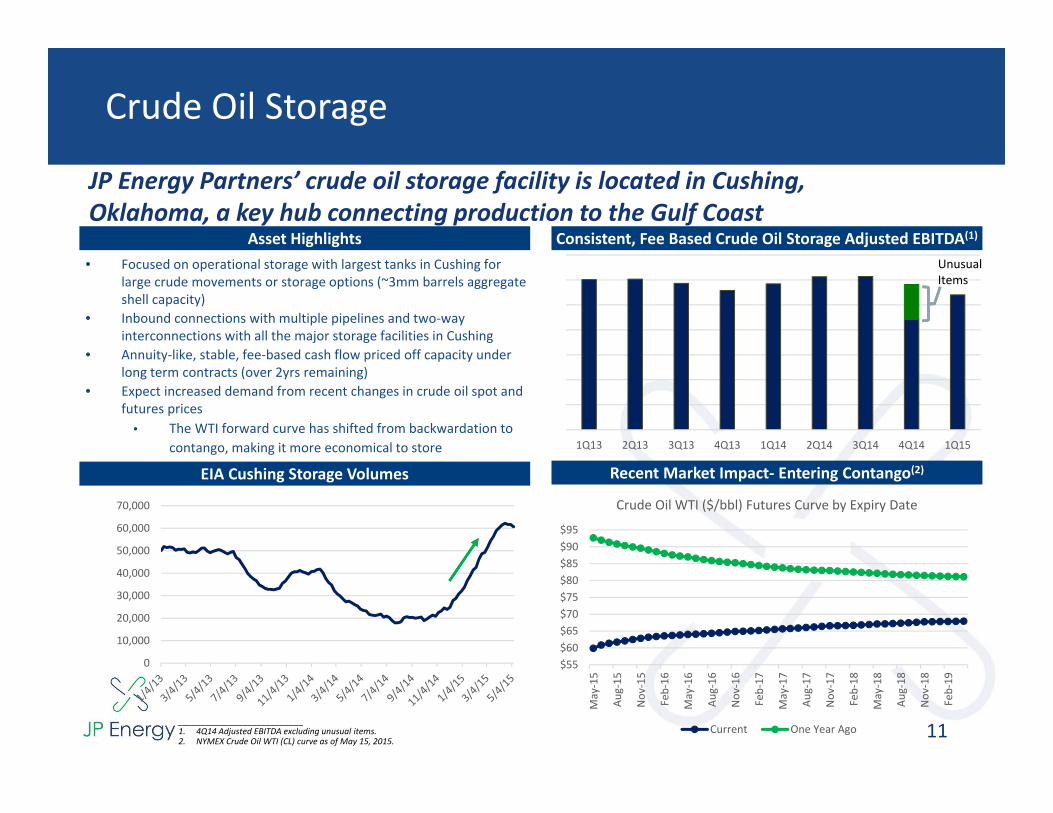
JP Energy Partners’ crude oil storage facility is located in Cushing, Oklahoma, a key hub connecting production to the Gulf Coast
Asset Highlights• Focused on operational storage with largest tanks in Cushing for
large crude movements or storage options (~3mm barrels aggregate shell capacity)
• Inbound connections with multiple pipelines and two‐way interconnections with all the major storage facilities in Cushing
• Annuity‐like, stable, fee‐based cash flow priced off capacity under long term contracts (over 2yrs remaining)
• Expect increased demand from recent changes in crude oil spot and futures prices
• The WTI forward curve has shifted from backwardation to contango, making it more economical to store
Recent Market Impact‐ Entering Contango(2)
Consistent, Fee Based Crude Oil Storage Adjusted EBITDA(1)
EIA Cushing Storage Volumes
___________________________1. 4Q14 Adjusted EBITDA excluding unusual items.2. NYMEX Crude Oil WTI (CL) curve as of May 15, 2015.
Unusual Items
$55$60$65$70$75$80$85$90$95
May‐15
Aug‐15
Nov
‐15
Feb‐16
May‐16
Aug‐16
Nov
‐16
Feb‐17
May‐17
Aug‐17
Nov
‐17
Feb‐18
May‐18
Aug‐18
Nov
‐18
Feb‐19
Crude Oil WTI ($/bbl) Futures Curve by Expiry Date
Current One Year Ago
NGL Distribution and Sales
12
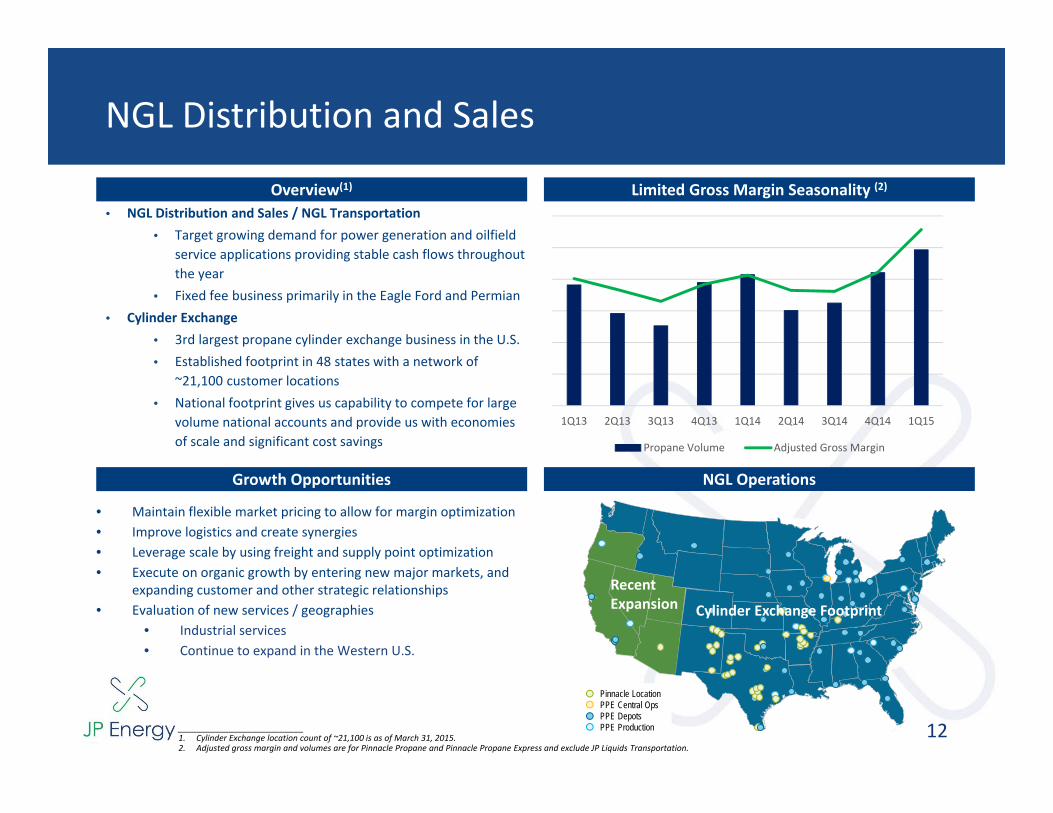
Limited Gross Margin Seasonality (2)Overview(1)
• NGL Distribution and Sales / NGL Transportation• Target growing demand for power generation and oilfield
service applications providing stable cash flows throughout the year
• Fixed fee business primarily in the Eagle Ford and Permian• Cylinder Exchange
• 3rd largest propane cylinder exchange business in the U.S.• Established footprint in 48 states with a network of
~21,100 customer locations• National footprint gives us capability to compete for large
volume national accounts and provide us with economies of scale and significant cost savings
• Maintain flexible market pricing to allow for margin optimization• Improve logistics and create synergies• Leverage scale by using freight and supply point optimization• Execute on organic growth by entering new major markets, and
expanding customer and other strategic relationships• Evaluation of new services / geographies
• Industrial services• Continue to expand in the Western U.S.
Growth Opportunities NGL Operations
Cylinder Exchange Footprint
Recent Expansion
Pinnacle LocationPPE Central OpsPPE DepotsPPE Production___________________________
1. Cylinder Exchange location count of ~21,100 is as of March 31, 2015.2. Adjusted gross margin and volumes are for Pinnacle Propane and Pinnacle Propane Express and exclude JP Liquids Transportation.
1Q13 2Q13 3Q13 4Q13 1Q14 2Q14 3Q14 4Q14 1Q15
Propane Volume Adjusted Gross Margin

NGL Distribution and Sales Economics
13
Overview• Two primary businesses reduce seasonality
• Propane Sales and Distribution business is winter weighted, although decreasing seasonality due to growth in industrial and oilfield services
• Propane Cylinder Exchange business summer weighted
• Margins tend to expand as commodity prices fall• Longer dated sales contracts
Limited Seasonality (1)
___________________________1. Based on adjusted gross margin for the year ended December 31, 2014. Winter includes three months ending March 31, 2014 and December 31, 2014 , and summer includes the
three months ending June 30, 2014 and September 30, 2014.2. NYMEX Propane Non‐LDH Mt. Belvieu (OPIS) front month and NYMEX WTI Front Month through May 15, 2015.
Mt. Belvieu ($/gal) Correlated With NYMEX WTI ($/bbl)(2)
Winter, 54%Summer, 46%
$0
$20
$40
$60
$80
$100
$120
$0.00
$0.20
$0.40
$0.60
$0.80
$1.00
$1.20
$1.40
$1.60
$1.80
12/4/13
1/4/14
2/4/14
3/4/14
4/4/14
5/4/14
6/4/14
7/4/14
8/4/14
9/4/14
10/4/14
11/4/14
12/4/14
1/4/15
2/4/15
3/4/15
4/4/15
5/4/15
NYMEX Propane Mt. Belvieu (OPIS) WTI NYMEX

Silver Dollar Anchored by Active Producers and Provides Access to Multiple End‐Markets
JP Energy Partners’ crude oil pipeline system is base loaded by three customers with over 350,000 contiguous acres in the Permian Basin
14
~5 years remaining on
minimum volume commitment
~9 years remaining with 110,000 acre dedication
Major Customer A
Major Customer B
10 years with53,000 acreage dedication
Major Customer C
Irion
Reagan
Crockett
Upton
Sterling
Schleicher
Tom Green
Glasscock
Pecos
Midland
JPE - Silver Dollar Pipeline
LegendReagan Lateral Station
Future Station
Stations
Take Away Options
Reagan Pipeline
Rail
Major Highways
Counties
UTM Zone 1405/18/15
0 105 Miles
Oxy Barnhart Station (Centurion Interconnect
to Colorado City)
Owens Station(Plains Interconnect
to Midland)
MidwayTruck
Station
Future TruckStation
Future TruckStation
TruckStation
TruckStation
Magellan Barnhart Station (Longhorn Interconnect to E. Houston – Q3 2015)

Silver Dollar Pipeline Continuing To Grow
15
Overview
• Volume growth from the core of the Permian continues in current oil price environment
• Connection to Cline Shale immediately expanded system capacity
• Customers remain committed to developing Permian acreage
• Most stated break‐evens look to be in high‐$40s• Area producers expect year over year growth
despite declining rig counts• Substantial optionality with three connections
• Oxy Cline Shale• Plains Owens• Magellan Longhorn
• Trucking stations create synergies with Crude Oil Supply and Logistics segment
• Increases capture area of the system
Volume Growth Accelerating
10,000
12,000
14,000
16,000
18,000
20,000
22,000
24,000
26,000
28,000
30,000
4Q13 1Q14 2Q14 3Q14 4Q14 1Q15
Pipeline Volumes (Barrels Per Day)
16
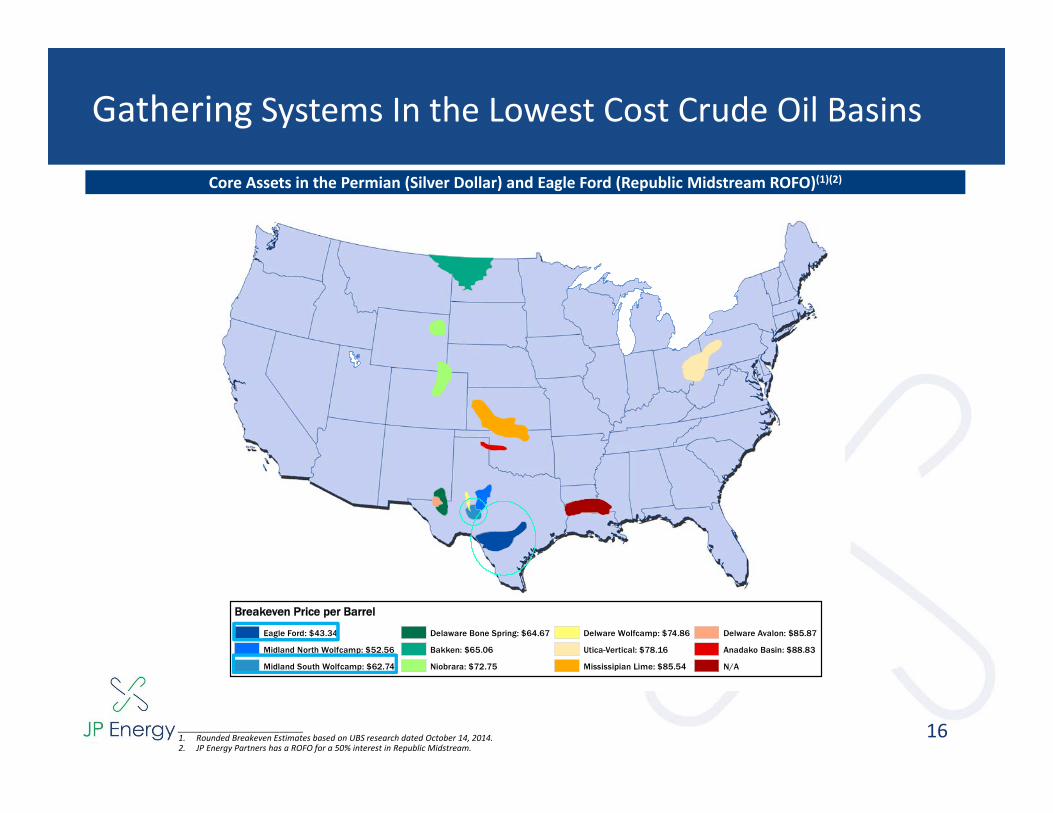
Gathering Systems In the Lowest Cost Crude Oil Basins
Core Assets in the Permian (Silver Dollar) and Eagle Ford (Republic Midstream ROFO)(1)(2)
___________________________1. Rounded Breakeven Estimates based on UBS research dated October 14, 2014.2. JP Energy Partners has a ROFO for a 50% interest in Republic Midstream.
JP Energy Focus Areas
Breakeven Price per Barrel
Eagle Ford: $43.34
Midland North Wolfcamp: $52.56
Midland South Wolfcamp: $62.74
Delaware Bone Spring: $64.67
Bakken: $65.06
Niobrara: $72.75
Delware Wolfcamp: $74.86
Utica-Vertical: $78.16
Mississipian Lime: $85.54
Delware Avalon: $85.87
Anadako Basin: $88.83
N/A
________________
____________________________

Recent Project Updates
18
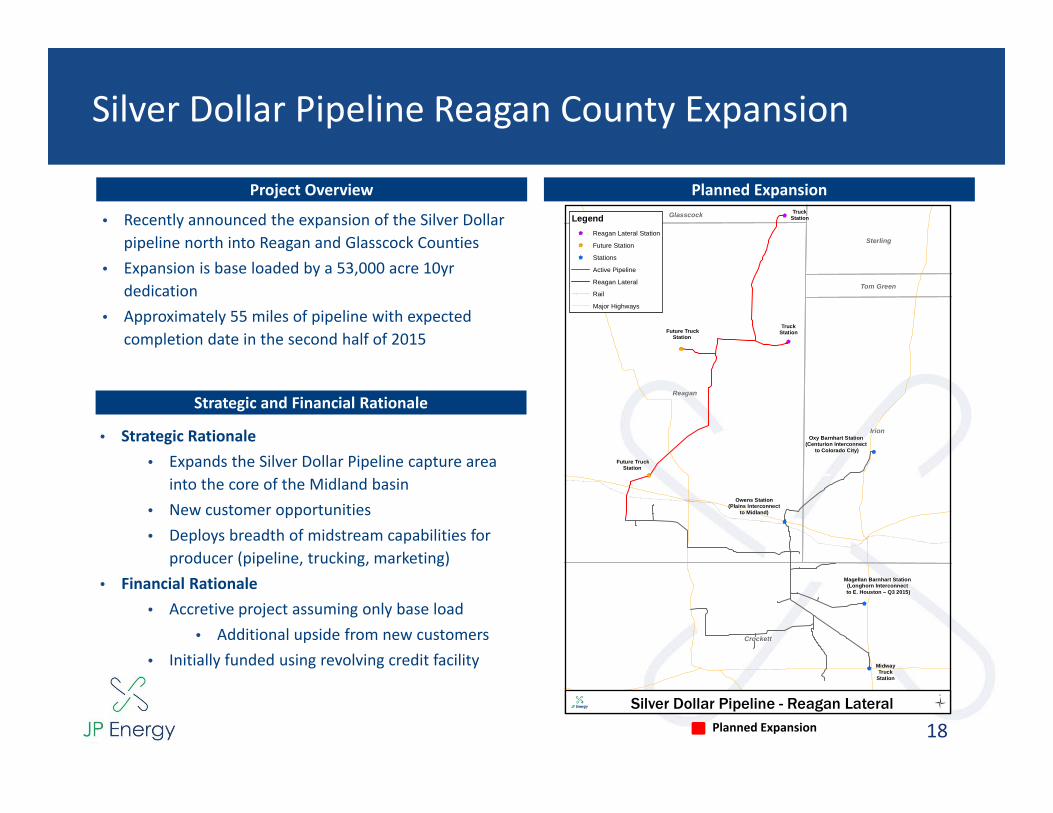
Silver Dollar Pipeline Reagan County Expansion
Project Overview
• Recently announced the expansion of the Silver Dollar pipeline north into Reagan and Glasscock Counties
• Expansion is base loaded by a 53,000 acre 10yr dedication
• Approximately 55 miles of pipeline with expected completion date in the second half of 2015
Planned Expansion
Strategic and Financial Rationale
• Strategic Rationale• Expands the Silver Dollar Pipeline capture area
into the core of the Midland basin• New customer opportunities• Deploys breadth of midstream capabilities for
producer (pipeline, trucking, marketing)• Financial Rationale
• Accretive project assuming only base load• Additional upside from new customers
• Initially funded using revolving credit facility
Planned Expansion
Reagan
Irion
Crockett
Sterling
Glasscock
Tom Green
Silver Dollar Pipeline - Reagan Lateral
LegendReagan Lateral Station
Future Station
Stations
Active Pipeline
Reagan Lateral
Rail
Major Highways
Oxy Barnhart Station (Centurion Interconnect
to Colorado City)
Owens Station(Plains Interconnect
to Midland)
MidwayTruck
Station
Future TruckStation
Future TruckStation
TruckStation
TruckStation
Magellan Barnhart Station (Longhorn Interconnect to E. Houston – Q3 2015)

19
Magellan Longhorn Interconnection
Project OverviewProject Overview
• In April, JP Energy executed an interconnection agreement with an affiliate of Magellan Midstream Partners, L.P. (“Magellan”)
• The agreement connects our Silver Dollar Pipeline System to Magellan’s Longhorn pipeline at Barnhart Terminal in Crockett County, TX
• Expected to be in service by the third quarter of 2015
Multiple Take‐Away OptionsMultiple Take‐Away Options
Strategic and Financial RationaleStrategic and Financial Rationale
• Strategic Rationale• Provide producers with a third take‐away option
• Optionality helps producers find the most attractive end markets and avoid congestion at any given market
• Provide producers with direct access from the core of the Midland Basin to Houston end markets
• Attractive selling point for current and future potential customers
Colorado City
Houston
Midland
PlainsOxy Cline’s Centurion
Magellan Longhorn
Silver Dollar Pipeline

20
Southern Propane Acquisition
Project OverviewProject Overview
• In April, JP Energy announced it entered into a definitive agreement to acquire substantially all of the assets of Southern Propane Inc. (“Southern”) for $14.9mm, subject to certain adjustments
• The transaction closed on May 8th
• Southern Propane services mostly industrial and commercial clients in the greater Houston area
• Transaction was largely funded with cash from our revolver as well as a ~267,000 unit issuance to the Seller
Complementary FootprintComplementary Footprint
Strategic and Financial RationaleStrategic and Financial Rationale
• Strategic Rationale• Non‐heating degree day dependent
commercial/industrial propane gallons• Complementary footprint should reduce travel
times across busy Houston roads and increase route density
• Strengthen footprint in attractive Houston Industrial market
• Southern has displayed a strong growth profile• Financial Rationale
• Immediately accretive
• Southern storage tank
• JPEP storage facilities

Strong Equity Sponsorship

JP Energy Family Overview
22
JP Energy Partners has a strategic partnership with JP Development and Republic Midstream
JP Development• Founded in July 2012 to support JP
Energy’s growth
• JP Development projects may be dropped down to us
– In February 2014, we completed our first drop down valued at $319 million
• JP Development has extended us a right of first offer (ROFO) for the five years following the IPO on all of JP Development’s current and future assets
JP Energy Partners• Founded in May 2010 to own,
operate, develop and acquire a diversified portfolio of midstream energy assets
• Operations currently consist of four business segments:
– Crude Oil Pipelines and Storage
– Crude Oil Supply and Logistics
– Refined Products Terminals and Storage
– NGL Distribution and Sales
Republic Midstream• Formed with $400 million
commitment from ArcLight to design, build and operate a crude gathering system for Penn Virginia in the Eagle Ford shale
– Managed by JPEP and American Midstream
– JPEP has a ROFO for 18 months following the IPO for a 50% interest in the joint venture

Permian
NorthBarnett
Combo Play
Eagle Ford
MississippianLime
GraniteWash Woodford
Woodford
Woodford-SCOOP
Management & ArcLight have created near term drop‐down opportunities
Crude Oil Drop‐Down Opportunities
• ArcLight has demonstrated the ability to invest broadly and profitably across the energy industry
• ArcLight has a substantial equity commitment to JP Energy Partners / JP Development
• Right of First Offer with JP Development & Republic Midstream
ArcLight Sponsorship
23
Great Salt Plains Pipeline• ~115 mile crude oil pipeline• Transports Mississippian Lime
supply to Cushing, Oklahoma• Ability to expand capacity from
27 Mbbls/d to 40 Mbbls/d
Red River Pipeline• ~75 mile crude oil pipeline that
transports oil from N. Texas to Garvin City, Oklahoma
• Current capacity of 5 Mbbls/d
Republic Midstream• 180‐mile crude oil gathering
system in Gonzales & Lavaca counties, Texas
• Central delivery point (“CDP”) with storage and blending capacity
• 30‐mile takeaway pipeline
Potential Drop‐Downs

Financial Strategy
Available Liquidity ($mm)(1)
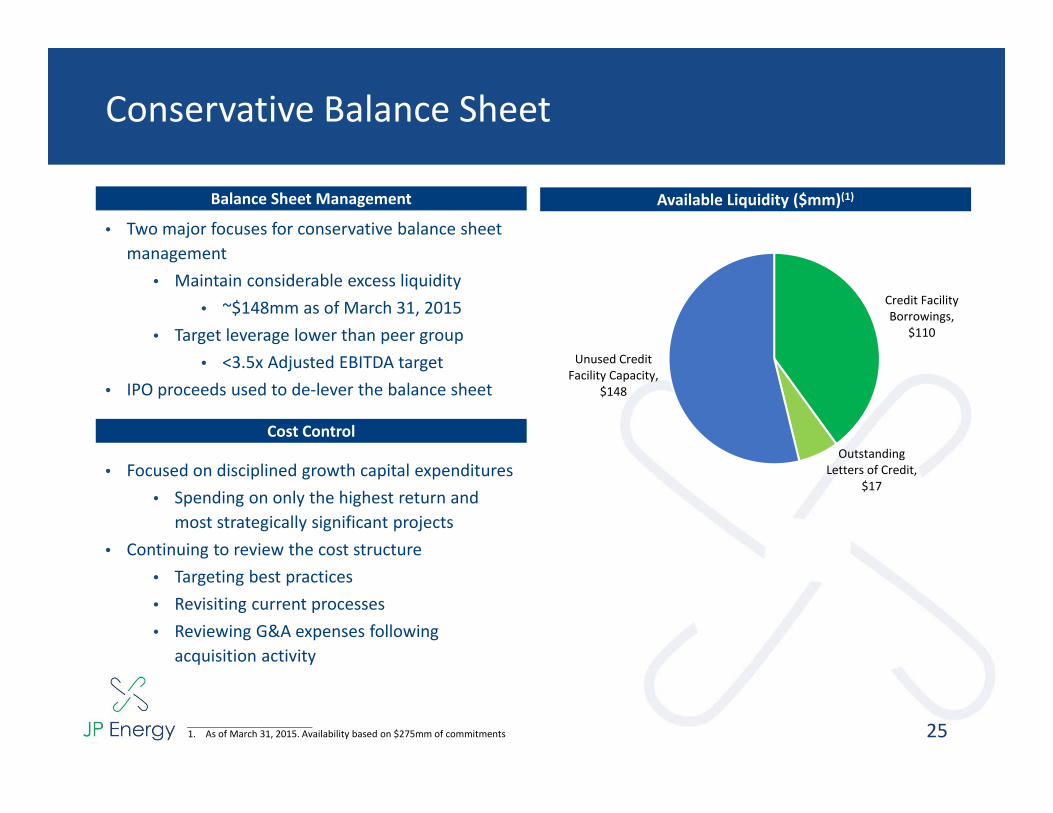
Conservative Balance Sheet
25
Balance Sheet Management
• Two major focuses for conservative balance sheet management
• Maintain considerable excess liquidity• ~$148mm as of March 31, 2015
• Target leverage lower than peer group• <3.5x Adjusted EBITDA target
• IPO proceeds used to de‐lever the balance sheet
Cost Control
• Focused on disciplined growth capital expenditures• Spending on only the highest return and
most strategically significant projects• Continuing to review the cost structure
• Targeting best practices• Revisiting current processes • Reviewing G&A expenses following
acquisition activity
Credit Facility Borrowings,
$110
Outstanding Letters of Credit,
$17
Unused Credit Facility Capacity,
$148
___________________________1. As of March 31, 2015. Availability based on $275mm of commitments

Fee Based, 47%
Fixed Margin, 10%
Variable Margin, 43%
Fee Based, 47%
Fixed Margin, 3%
Variable Margin, 49%
Stable Cash Flows
Business
26
2014 Adjusted EBITDA Mix(1)
___________________________1. Based on Adjusted EBITDA for the year ended December 31, 20142. Based on planned Adjusted EBITDA for the year ended December 31, 2015. Includes 1Q15 actual results
Contract Description
Crude Oil Pipelines & Storage
• Pipeline throughput fees• Crude Oil Storage fees
Refined Products Terminals • Throughput volume fees
Crude Oil & NGL Trucking • Fee based trucking for third parties
Fixed
Margin NGL Fixed Margin Product
Sales• NGL sales under fixed price contracts that are financially hedged
Crude Oil and NGL Supply & Logistics
• Typically back to back transactions at index‐based prices creating fee equivalent gross margin
NGL Variable Margin Product Sales
• NGL sales at market prices
Refined Products Sales • Product sales that vary with market prices
Fee Based
Varia
ble Margin
2015 Plan Adjusted EBITDA Mix(2)

Recent Financial Updates & Project Highlights
27
Q1 2015 RecapQ1 2015 Recap
• Adj. EBITDA growth vs. prior year (+79%) and sequentially (+26%1)• Q1 2015 distribution of $0.325/unit2, equivalent to MQD • Distributable cash flow of $13.3 mm, equates to 1.1x coverage• Strong volume growth across segments from new/existing customers
Recent Project
Highlights
Recent Project
Highlights
• Announced extension of Silver Dollar Pipeline into the core of the Midland Basin in February
• Executed agreement to connect Silver Dollar Pipeline to Magellan’s Longhorn Pipeline in April
• Completed immediately accretive $14.9 million acquisition of Southern Propane assets in May
2015 Guidance2015
Guidance
• Reiterated 2015 Adjusted EBITDA guidance of $50‐60 million• Remain on track for Republic Midstream drop down in 2H 2015• Forecast distribution coverage of 1.2x by Q4 2015
___________________________1. Excludes $2.1 million of non‐recurring charges in Q4 20142. Paid May 14, 2015 to unitholders of record on May 7, 2015. Note: Guidance includes Silver Dollar extension into the Midland Basin. Guidance excludes Silver
Dollar interconnection with Magellan’s Longhorn Pipeline and the recent Southern Propane acquisition

Financial Strategy
28
Long term contracts for our crude oil pipelines Refined products and NGL segments offer diversification in mature markets
but with considerable growth opportunities
Near‐term organic growth projects already being pursued in existing businesses
Strategic drop‐downs from JP Development and Republic Midstream could further bolster growth
Remain open to acquisition opportunities that are strategic to the platform
Revolver has ~$148 million in availability Target 3.5x leverage over the long‐term
Established risk management policies and procedures to monitor and manage the market risks associated with commodity prices, counterparty credit and interest rates
Commodity price exposure is minimized through fixed‐fee contracts or margin‐based arrangements
Maintain Stable Cash Flows
Comprehensive Risk Management
Commitment to Financial Flexibility
Deliver Consistent Distribution Growth
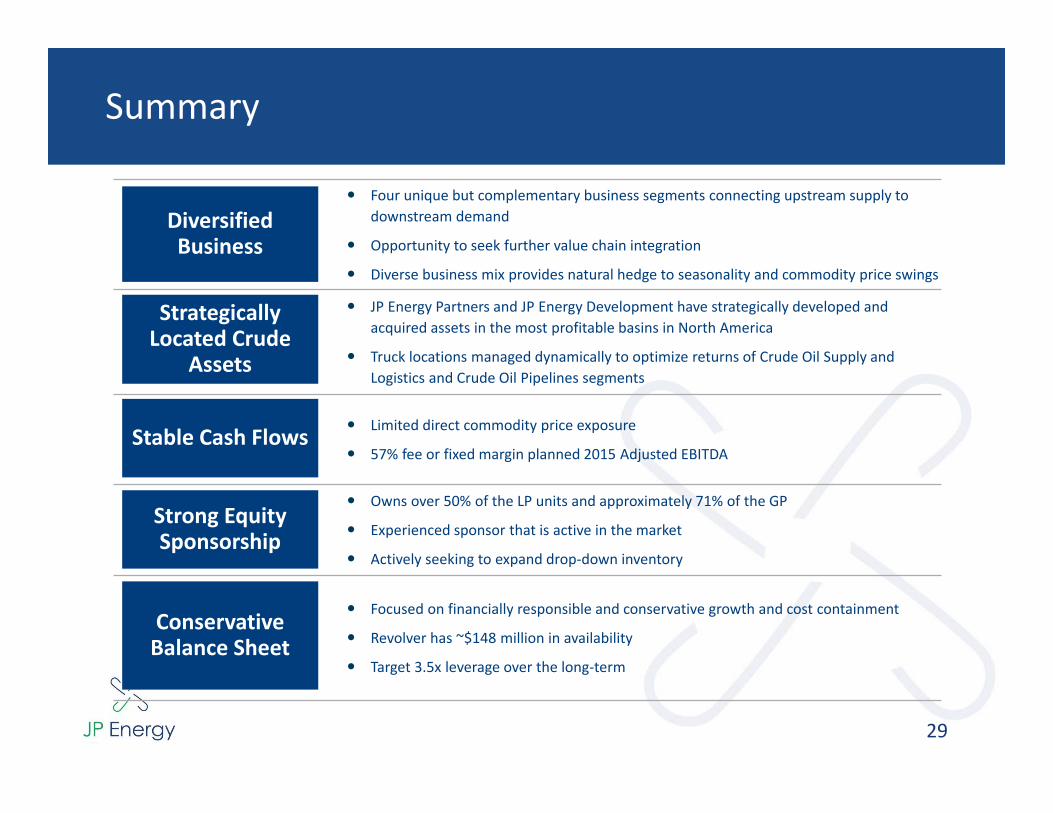
Summary
29
Four unique but complementary business segments connecting upstream supply to downstream demand
Opportunity to seek further value chain integration
Diverse business mix provides natural hedge to seasonality and commodity price swings
JP Energy Partners and JP Energy Development have strategically developed and acquired assets in the most profitable basins in North America
Truck locations managed dynamically to optimize returns of Crude Oil Supply and Logistics and Crude Oil Pipelines segments
Limited direct commodity price exposure
57% fee or fixed margin planned 2015 Adjusted EBITDA
Owns over 50% of the LP units and approximately 71% of the GP
Experienced sponsor that is active in the market
Actively seeking to expand drop‐down inventory
Focused on financially responsible and conservative growth and cost containment
Revolver has ~$148 million in availability
Target 3.5x leverage over the long‐term
Conservative Balance Sheet
Stable Cash Flows
Diversified Business
Strategically Located Crude
Assets
Strong Equity Sponsorship

Appendix
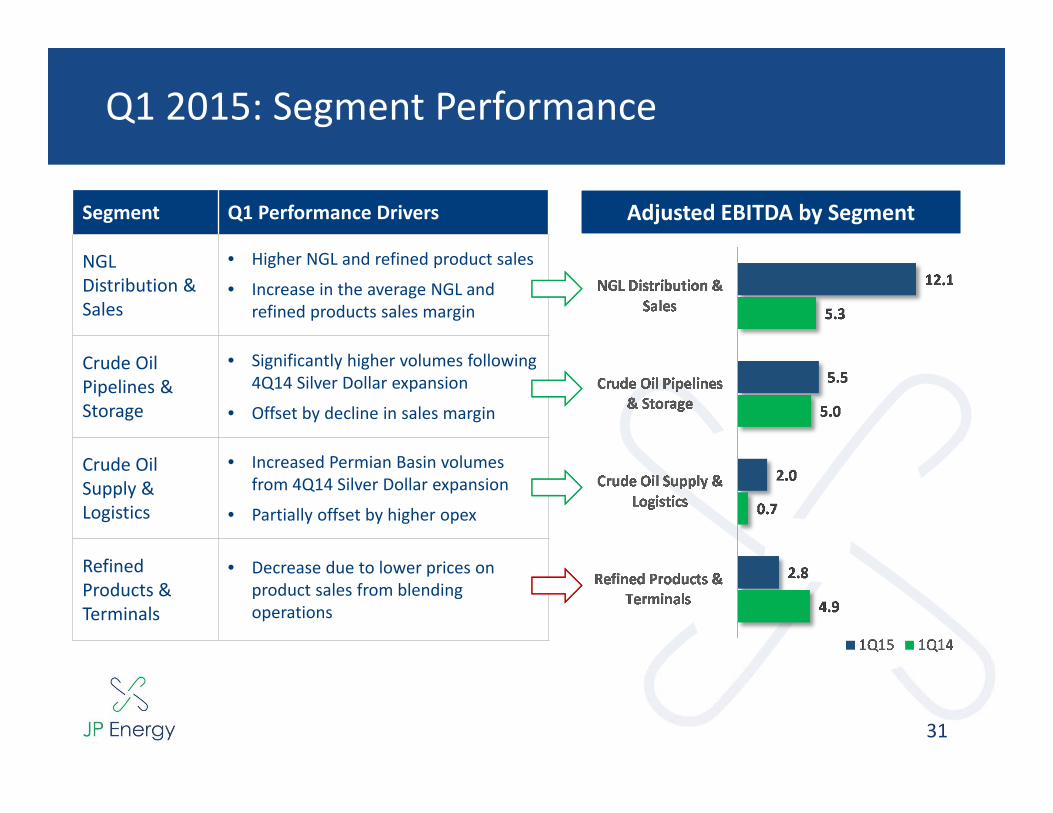
Q1 2015: Segment Performance
31
Adjusted EBITDA by SegmentAdjusted EBITDA by SegmentSegment Q1 Performance Drivers
NGL Distribution & Sales
• Higher NGL and refined product sales
• Increase in the average NGL and refined products sales margin
Crude Oil Pipelines & Storage
• Significantly higher volumes following 4Q14 Silver Dollar expansion
• Offset by decline in sales margin
Crude Oil Supply & Logistics
• Increased Permian Basin volumes from 4Q14 Silver Dollar expansion
• Partially offset by higher opex
Refined Products & Terminals
• Decrease due to lower prices on product sales from blending operations

Q1 2015: Operational Summary
32
Key Operational Data Q1 2015 Q1 2014 YoY % Change
Crude oil pipeline throughput (bpd) 28,329 18,129 +56%
Crude oil sales (bpd) 73,779 43,356 +70%
Terminal and storage throughput (bpd) 63,787 61,619 +4%
NGL and refined product sales (bpd) 6,524 5,619 +16%

Q1 2015: Balance Sheet & Liquidity
33
Strong Metrics, Access to CapitalStrong Metrics, Access to Capital
• Maintained conservative leverage of 2.9x
‒ Leverage ratio remains below peer average and JPEP long‐term target of ~3.5x
• $148 million unused credit facility capacity1
• Strong interest coverage of 5.0x
• Ample liquidity and balance sheet capacity to support capital needs
Available Liquidity ($mm)1Available Liquidity ($mm)1
Available debt capacity expected to fully support planned 2015 organic capex
Credit Facility Borrowings,
$110
Outstanding Letters of Credit,
$17
Unused Credit Facility Capacity,
$148
___________________________1. As of March 31, 2015

Non‐GAAP Reconciliation – Adjusted EBITDA
34
2015 2014
Segment Adjusted EBITDACrude oil pipelines and storage 5,476$ 4,968$ Crude oil supply and logistics 1,982 695 Refined products terminals and storage 2,822 4,853 NGLs distribution and sales 12,098 5,252 Discontinued operations - 79 Corporate and other (7,189) (7,349)
Total Adjusted EBITDA 15,189 8,498 Depreciation and amortization (11,339) (10,094) Interest expense (1,173) (3,259) Loss on extinguishment of debt - (1,634) Income tax (expense) benefit (22) 57 Loss on disposal of assets, net (130) (356) Unit-based compensation (431) (282) Total gain on commodity derivatives 771 135
3,192 (633) Non-cash inventory costing adjustment (2,915) - Transaction costs and other (2,477) (536) Discontinued operations - (484)
Net income (loss) 665$ (8,588)$
Three months ended March 31,
(in thousands)
Net cash (receipts) payments for commodity derivatives settled during the period

Non‐GAAP Reconciliation – Distributable Cash Flow
35
Three months ended
March 31, 2015
(in thousands)Net cash provided by operating activities 3,440$
Depreciation and amortization (11,339) Derivative valuation changes 4,008 Amortization of deferred financing costs (227) Unit-based compensation (431) Loss on disposal of assets (130) Bad debt expense (467) Other non-cash items (71) Changes in assets and liabilities 5,882
Net income 665$ Depreciation and amortization 11,339 Interest expense 1,173 Income tax expense 22 Loss on disposal of assets, net 130 Unit-based compensation 431 Total gain on commodity derivatives (771)
(3,192) Non-cash inventory costing adjustment 2,915 Transaction costs and other 2,477
Adjusted EBITDA 15,189$ Less: Cash interest paid, net of interest income 887 Maintenance capital expenditures 990
Distributable cash flow 13,312$ Less: Distributions 11,966
Amount in excess of distributions 1,346$ Distribution coverage 1.11x
Net cash receipts (payments) for commodity derivatives settled during the period

Consolidated Income Statement
36
Three Months Ended March 31,2015 2014
(in thousands, except unit and per unit data)REVENUES:
231,917$ 341,005$ Gathering, transportation and storage fees 6,951 8,096
54,185 63,801 3,108 2,663
Other revenues 3,125 3,102 Total revenues 299,286 418,667
COSTS AND EXPENSES:Cost of sales, excluding depreciation and amortization 254,890 382,889 Operating expense 16,611 16,153 General and administrative 14,475 12,633 Depreciation and amortization 11,339 10,094 Loss on disposal of assets, net 130 356
Total costs and expenses 297,445 422,125
OPERATING INCOME (LOSS) 1,841 (3,458)
OTHER INCOME (EXPENSE)Interest expense (1,173) (3,259) Loss on extinguishment of debt - (1,634) Other income, net 19 111
LOSS FROM CONTINUING OPERATIONS BEFORE INCOME TAXES 687 (8,240)
Income tax (expense) benefit (22) 57
INCOME (LOSS) FROM CONTINUING OPERATIONS 665 (8,183)
DISCONTINUED OPERATIONS- (405)
NET INCOME (LOSS) 665$ (8,588)$
Crude oil sales
NGL and refined product salesRefined products terminals and storage fees
Net loss from discontinued operations