Naperville CY16 Sustainability Report CY16 Sustainability Report May 2017. ... investments in...
22
Naperville CY16 Sustainability Report May 2017
Transcript of Naperville CY16 Sustainability Report CY16 Sustainability Report May 2017. ... investments in...

Naperville CY16Sustainability Report
May 2017

ACKNOWLEDGMENTSMayor Steve Chirico
Naperville City CouncilCouncilwoman Becky Anderson Councilman Kevin GallaherCouncilwoman Rebecca Boyd-Obarski Councilwoman Patty GustinCouncilwoman Judy Brodhead Councilman Paul Hinterlong Councilman Kevin Coyne Councilman John Krummen
City Leadership TeamDoug Krieger, City ManagerMarcie Schatz, Deputy City ManagerLinda LaCloche, Communications ManagerPam Gallahue, City ClerkRachel Mayer, Finance DirectorMark Puknaitis, Fire ChiefJim Sheehan, Director of Human ResourcesJeff Anderson, Director of Information TechnologyMike DiSanto, Deputy Legal DirectorRobert W. Marshall, Police ChiefMark Curran, Director of Public Utilities - ElectricJim Holzapfel, Director of Public Utilities - WaterBill Novack, Director of Transportation, Engineering & Development
Why Sustainability?The Changing Landscape of Society – Organizations today face heightened expectations around their wider role in society.
The Role of Government – Cities have a civic responsibility to properly manage public goods, resources and facilities in a way that supports sustainable development objectives and promotes the public interest.
Sustainability Report Prepared byAmy Emery, Strategic Projects SupervisorKasey Evans, Community PlannerKelley Munch, Communications Specialist
TABLE OF CONTENTS
INTRODUCTION p. 4 Letter from Mayor Chirico Benefits of Sustainable Reporting Sustainable Categories
LEADERSHIP & EDUCATION p. 6 Governor’s Sustainability Award Responsibility for Sustainability Community Survey
RESOURCES & ENERGY p. 8 Leak Detection Conservation Voltage Reduction Snow and Salt Renewable Energy Program Energy Consumption Renewable Energy Grant
TRANSPORTATION & MOBILITY p. 12 Expanding Transit Access Transit Ridership Sidewalk Program Electric Vehicle Charging Stations
WASTE MANAGEMENT & RECYCLING p. 14 Diversion Rate Household Hazardous Waste Prescription Drug Collection Electronics Recycling Recycle My Fridge
DEVELOPMENT & INFRASTRUCTURE p. 17 LED Lighting Storm Sewer Maintenance Burn Box for Leaf Disposal Arbor Day Tree Sale Urban Forest Canopy Emerald Ash Borer
IN THE WORKS p. 20 Waste Water Treatment Floating Wetlands

In conjunction with the City’s change from a fiscal year (May-April) to a calendar year (January-December) financial reporting period in 2016, this report has also changed to a calendar year format. We hope the readers of this report find it provides more clarity and transparency for the community to appreciate the measureable impact of sustainable programs in Naperville.
• Operational efficiency• Reputation management• Employee satisfaction
• Potential access to capital• Minimized environmental
and societal impacts
BENEFITS OF SUSTAINABLE REPORTING
INTRODUCTION
4
Greetings,
I am excited to share this snapshot report of the City of Naperville’s sustainability efforts in 2016 with the community. As you will read, Naperville continues to be an environmental leader amongst its peers making measurable, cost-effective investments in our infrastructure to provide more sustainable services.
Together with the City Council, I approved four ends policies in May of 2016 to focus on bigger-picture outcomes. Being a “High Performing Government” by providing reliable, efficient and high-quality services was one of the four. Sustainability efforts are an important part of this ends policy. Strategic investments in programs like LED lighting, smart grid and leak detection surveys are saving millions of dollars of taxpayer money each year.
Speaking of high-performing government, in 2016 Naperville completed nearly all of the 49 tasks identified in its 2010 Sustainability Plan. This effort was led by a committed and dedicated group of staff members known as the EnviroTeam. The legacy of the EnviroTeam can be seen in every City department, as sustainability considerations are an integral part of the way the City of Naperville does business.
Finally, let me express my gratitude to Naperville’s residents and businesses for your commitment to improve our City. I appreciate all the things you do to make Naperville more sustainable – from curbside recycling and composting, to personal choices in energy and water conservation. Every effort is making a difference in the quality of our future environment. I hope, as you read this report, you are encouraged by the progress and inspired to continue to make more sustainable choices.
Mayor Steve Chirico

SUSTAINABLE CATEGORIES
LEADERSHIP & EDUCATIONEnvironmental stewardship is a value reflected in the Naperville community. When it comes to the more efficient and effective use of our natural resources, the City of Naperville not only encourages residents and businesses to respect and protect the environment but also is an active participant in doing the same. By embracing its role as a municipal leader in environmental sustainability, the City of Naperville becomes more marketable to businesses. These efforts will further advance the City of Naperville into the global economy and protect the environment for generations.
RESOURCES & ENERGYResources and energy represent a critical intersection between the City of Naperville as a consumer and the City of Naperville as a provider of such commodities. As a good consumer, the City strives to conserve resources in a fiscally responsible manner. As a provider of energy, the City facilitates informed decision-making by its consumers. As a provider of water, the City recognizes the finite availability of this resource and supports fiscally responsible conservation efforts.
TRANSPORTATION & MOBILITYA sustainable transportation system is accessible, affordable, operates efficiently and offers a variety of easily navigable transportation modes which support a vibrant and successful community.
WASTE MANAGEMENT & RECYCLING Waste management and recycling programs provide consumers with a variety of options to responsibly dispose of their waste while benefitting the environment in a number of ways.
SUSTAINABLE DEVELOPMENT & INFRASTRUCTURESustainable development encourages economic growth and development while conserving resources in the long-term interest of individuals, the community and our ecosystem. Key elements of sustainable development include thoughtful land planning, protecting land and ecosystems and using natural resources wisely. Naperville’s sustainable infrastructure includes sanitary sewer lining, storm sewer maintenance, flood and storm water improvements and tree preservation and protection measures.
Did You Know?Naperville is home to one of only four household hazardous waste collection facilities in the entire state of Illinois. Located at 156 Fort Hill Drive, the facility is open to all Illinois residents from 9 a.m. to 2 p.m. every Saturday and Sunday, excluding holidays. The facility accepts such hazardous items as automotive fluids, oil-based paints, household cleaners, fluorescent bulbs and more. For a complete list of accepted items and additional information about the facility, visit www.naperville.il.us/hhw.
5

Lea
der
ship
& e
du
cati
on
6
Naperville Wins Governor’s Sustainability Award
The City of Naperville won the Illinois Governor’s Sustainability Award for its citywide environmental sustainability efforts. Council-woman Becky Anderson and Councilman Kevin Gallaher accepted the award on behalf of the City at a November 1st ceremony at the Union League Club of Chicago.
The Illinois Governor’s Sustainability Award is administered by the Illinois Sustainable Technology Center (ISTC). ISTC is a division of the Prairie Research Institute at the University of Illinois at Urbana-Champaign, which provides research and solutions to allow citizens and decision makers to make sustainable choices. Now in its 30th year, the award acknowledges the sustainable practices and operations that entities employ throughout their organizations. Naperville was among 25 public and private organizations honored with the award in 2016.
Naperville’s award application cited its ongoing commitment to sustainability throughout all levels and departments in the City, including the successful and ongoing completion of all 49 goals in the City’s 2010 Sustainability Plan. Projects specifically noted in the 2016 award application included the Water Leak Detection Survey, which has detected 145 leaks in various
water mains and fire hydrants over the last three years. Repairs on these leaks saved the City approximately 604 million gallons of water and resulted in a cost avoidance of more than $2.9 million.
Also noted was the new Household Hazardous Waste Facility that opened in early 2015, which has increased collection of household hazardous waste by 8 percent while reducing wait times from up to four hours to less than 10 minutes, and the Recycling Cart Program, which has helped increase the City’s landfill diversion rate to 30.2 percent in 2015, the highest in six years. The changeover of City streetlights to LEDs, the ongoing success of the Emerald Ash Borer treatment program and the plans to construct a compressed natural gas (CNG) fueling station in the City also won praise.
Responsibility for Sustainability Shifts to DepartmentsOver the last six years, the City’s EnviroTeam has taken a leadership role in facilitating implementation of the 2010 Naperville Sustainability Plan. The membership and organization of the group has changed over the years, but they have always been focused on the nearly 50 items included in the plan. In 2016, nearly all of the plan items have been completed, and the actions have made the City of Naperville a far more sustainable organization.
Seeking cost-effective and sustainable solutions through technology, process improvements and other means is now standard operating practice. Having accomplished its mission, the group was disbanded in 2016. City departments now are responsible for the ongoing implementation of the 2010 Naperville Sustainability Plan through practices, programs and policies in place.

7
Naperville Community SurveyEvery few years, the City of Naperville conducts a citizen survey to assess satisfaction with City services, gather input about priorities for the community and help the City understand how satisfaction levels have changed since previous surveys. The most recent survey was conducted by the ETC Institute in the fall of 2016 covering 11 major categories. A total of 1,395 Naperville households completed and returned the survey, providing a 95% confidence level (+/- 2.6%) in the results.
When surveyed about waste disposal services, 95% of those surveyed who had an opinion were satisfied with residential garbage collection; 91% were satisfied with curbside recycling; and 85% were satisfied with the garbage and recycling cart program. The waste disposal services that residents felt should receive the greatest increase in emphasis over the next two years were: (1) household hazardous waste disposal services, (2) residential recycling program and (3) curbside bulk leaf removal services.
Residents were also asked several questions regarding their opinions on environmental issues. The following is a summary of their responses:
• 87% of the residents surveyed who had an opinion felt it was important for the City to provide opportunities to increase electronics recycling; 75% felt it was important for the City to reduce the use of energy in City operations.
• When asked to rank the importance of five environmental sustainability initiatives, the initiative that had the highest “most important” rating was waste management and recycling.
• 90% of the residents surveyed felt it was “very important,” “important” or “somewhat important” for the City to invest in initiatives that will help preserve the environment.
The overall satisfaction score for the City increased since the last survey was conducted in 2012, as well as the scores for a number of specific areas. For example, satisfaction increased 10% regarding reducing use of energy in city operations. However, there were several areas that reported decreases in satisfaction, including providing ways for the community to reduce greenhouse gas emissions (-7%) and curbside bulk leaf removal service (-5%).
The information obtained from the survey is used by the City to benchmark current practices, make service delivery decisions and as a resource in setting future goals. The complete results of the 2016 Community Survey are available on the City’s website.

Leak Detection Saves ResourcesThe Department of Public Utilities-Water and Wastewater (DPU-W) reported a 7.1% loss of water in its annual water audit for 2016. The system loss remained well below the average of other communities, which typically range between 10% and 20%.
Also in 2016, DPU-W conducted an annual Water Distribution Leak Detection survey. The survey uses acoustical listening equipment to identify leaks, which make a hissing noise as water escapes the system.
The program discovered 32 leaks in 2016 and saved an estimated 363,000 gallons of water per day after repairs. Total savings from the survey was estimated at more than 130 million gallons of water for the year, equaling an estimated $642,600 in cost avoidance (e.g., not having to purchase additional water). The 2016 survey cost $74,801 and was conducted by ADA Environmental Services.
8reso
urc
es &
en
erg
y
2010 2011 2012 2013 2014 2015 2016
% Loss 3.51% 5.78% 5.71% 11.36% 2.75% 7.10% 7.10%
12.00%
10.00%
8.00%
6.00%
4.00%
2.00%
0.00%
2010 2011 2012 2013 2014 2015 2016
Daily Demand 15.26 14.75 16.57 15.08 14.07 14.10 14.46
17.00
16.50
16.00
15.50
15.00
14.50
14.00
Gallo
ns (m
illio
ns)
WaterDemand
Water Loss

Winter 2010 2011 2012 2013 2014 2015 2016 2017Snow
(Inches) 49.20 52.73 21.76 27.90 79.14 40.09 26.21 17.44
Tons of Salt 18,000 16,046 8,501 13,686 21,964 11,768 7,707 4,439
* This annual data for 2017 reflects information gathered from November 2016 through April 2017 of the following year in order to accurately record snowfall statistics.
Ratio 365.85 304.30 390.67 490.54 277.53 287.73 294.05 255.00
Innovative Conservation Voltage Reduction Program Provides Savings
Snow and Salt
An innovative program only offered by a few electric utilities across the nation is providing energy savings for Naperville’s Electric Utility customers. Conservation Voltage Reduction (CVR) helps to reduce three components of energy usage: system energy losses, customer consumption and street light energy consumption. A significant portion of the savings of this program is passed on directly to the customer.
Unlike other demand response or conservation programs, this program automatically determines the optimum voltage settings, based on real-time data provided by the Advanced Metering Infrastructure (AMI), also known as the Smart Meters. The CVR
software does not require a complex distribution model to operate and, as a result, is extremely cost-effective to implement and maintain.
The CVR software also will help to reduce demand with no impact on the customer or a need for changes in customer behavior, which allows the Electric Utility to maximize savings while maintaining service reliability.
Launched in 2015, CVR was fully implemented in 2016, which resulted in a reduction of 28,567,529 kilowatt hours
for a cost savings of $1.286 million.
600.00
500.00
400.00
300.00
200.00
100.00
0.00 09/10 10/11 11/12 12/13 13/14 14/15 15/16 16/17
Tons
of Sa
lt
Inches of Snow Tons of Salt Per Inch of Snow
9
Naperville, like the rest of the Midwest, experienced an extremely mild winter this year. Snowfall for the season was 17.44 inches – the lowest Naperville has seen in decades.
The application ratio for the winter was 255 tons of salt per inch of snow, less than previous years due to less icy weather conditions. The application ratio also reflects a salt conservation effort implemented in the winter of 2014. By reducing salt application, the City has minimized budget costs and environmental strains, as road salt can alter the chemistry of water and erode infrastructure and vegetation.

10
Energy Consumption 2010 2011 2012 2013 2014 2015 2016
Total Consumed (MWh) 1,452,379 1,397,985 1,387,621 1,361,752 1,432,671 1,342,515 1,382,295
Consumption Change N/A -3.75% -0.74% -1.86% 5.21% -6.29% 2.96%
Total Customers 56,470 56,784 57,300 57,482 58,693 59,022 59,195
Customer Change N/A 314 516 182 1,211 329 173
MWh Per Customer 25.72 24.62 24.22 23.69 24.41 22.75 23.35
Residential
Year Customers MWh perCustomer
2010 50,622 11.96
2011 50,825 10.84
2012 51,278 11.47
2013 51,440 10.23
2014 52,411 10.20
2015 52,627 9.65
2016 53,003 10.06
Non-Residential
Year Customers MWh per Customer
2010 5,848 144.79
2011 5,959 142.17
2012 6,022 132.73
2013 6,042 138.29
2014 6,282 142.94
2015 6,395 130.52
2016 6,192 137.04
The Naperville Renewable Energy Program (NREP) supports clean energy in Illinois, including wind and solar power. All energy purchases are sourced from wind farms and solar energy providers in Illinois, supporting businesses and economic development in our state.
Total enrollment in 2016 was 3,392 electric utility customers, a 4.7% decrease from 2015. Since 2013, the program has awarded grants to local businesses and organizations that are supporting clean energy. See the article on the next page for additional information.
The goals of the NREP are to increase or create opportunities for our community to learn about
renewable solutions, support grant projects that measurably increase renewable energy usage and displace fossil fuels and support the development of projects that can be replicated.
For just a few extra dollars per month, NREP allows residential and commercial Naperville Electric Utility customers to make voluntary monthly donations through their electric bill to support the City’s investment in renewable energy. To sign up for the NREP, fill out the form located at http://bit.ly/2krIpCB and mail it to or present it in person at the City’s Finance Department, 400 S. Eagle St., Naperville, IL 60540 or fax it to (630) 305-6226.
NREP Powers Up with Wind & Solar
Total Energy Consumption
2010 2011 2012 2013 2014 2015 2016
Number of Participants 4,446 4,534 4,392 4,049 3,609 3,560 3,392
% Change N/A 1.98% -3.13% -7.81% -10.87% -1.36% -4.7%
Amount of Energy (MWh) 16,741 17,555 17,014 14,299 13,401 13,060 11,240
% of Energy Purchased 1.15% 1.26% 1.23% 1.05% 0.94% 0.97% 0.81%
1,600,000
1,400,000
1,200,000
1,000,000
800,000
600,000
400,000
200,000
0
Meg
awat
ts-h
ours
2010 2011 2012 2013 2014 2015 2016
846,737 847,179 799,270 835,571 897,954 834,706 848,555
605,642 550,806 588,351 526,181 534,717 507,809 533,739
Non-residential
Residential
Renewable Energy Program

11
Naperville Awards Renewable Energy Grants
Naperville uses three programs to assist utility customers interested in energy efficiency, renewable energy and green technologies:
• The Renewable Energy Grant Program
• Illinois Municipal Electric Agency (IMEA) Electric Efficiency Incentives Program
• Nicor Gas energy efficiency upgrade rebate program
The Renewable Energy Grant Program provides resources for projects related to renewable energy development. Grants are awarded to organization supporting the Renewable Energy Program through monthly utility bills. Grants are provided through rebates and will cover half of the total project cost to a cap of $50,000. Projects eligible for grants include solar, wind, photovoltaic, biomass and fuel cell technologies.
In 2016, the Naperville Renewable Energy Grant Program awarded a $50,000 grant to North Central College (NCC) for a roof-mounted 538.56 kW 1,632-panel photovoltaic solar array at the Res/Rec Center at 440 S. Brainard St. The unique building
houses approximately 400 students wrapped around a 91,000-square-foot recreation center. NCC chose the Res/Rec Center site for this installation, in part, because this building has the highest electric use compared to all other campus buildings.
The system is estimated to produce an annual kWh production of 729,964, providing up to 22% of the building’s 3,274,167 kWh annual consumption. This is an energy savings of approximately $37,228 per year. It is also estimated that this project will save about 10% of the building’s average annual demand of 483 kW with approximately $1,063 in demand savings per year.
In CY2016, the IMEA Electric Efficiency Incentives Program awards were issued to 30 different interior and exterior lighting replacement projects for a total of $266,780, which are estimated to save 2.8 million kWh annually.
The Nicor Gas energy efficiency rebate is provided for upgrades to products such as furnaces, boilers, programmable thermostats and water storage heaters.
Applications for Renewable Energy Grants are available through the Naperville website and are accepted between April 1 and December 1 each year.
A Naperville Renewable Energy Grant helped fund this roof-mounted 1,632-panel photo-voltaic solar array at North Central College’s Res/Rec Center, located at 440 S. Brainard St. in 2016. The array is projected to save the college nearly $40,000 annually.

Tran
spo
rTa
Tio
n &
Mo
bili
Ty
12
Greyhound Expands Transit AccessIn June 2015, the City entered into a license agreement with Greyhound Lines, Inc., to permit a bus stop at the Route 59 Metra Station parking lot for their new Illinois Connect service. The route provides a connection between Chicago and Davenport, Iowa, via Interstate 88 with stops in Naperville, DeKalb at Northern Illinois University, Rochelle, Dixon and Moline. The service makes four stops at the Route 59 station per day. On average, 20 riders per month have utilized the service to or from the Route 59 station stop. To date, the Greyhound activities have not had any impact to the commuter activities at the Route 59 station.
Metra and Pace RidershipMetra
According to data collected in 2014, the Route 59 and Downtown Naperville Metra have an average weekday boarding ridership of 9,876 riders, the highest usage on the BNSF railway. The BNSF is one route with a total of 94 trains. Metra collected additional station boarding/alighting count data in fall of 2016, however, that information is not yet available.
PacePace provides ridership data on a monthly basis. CY 2016 shows a 6.78% decrease in ridership*. In July 2016, two commuter feeder routes were discontinued and combined with existing routes. Pace also added two additional routes in 2016, Route 559 and Route 722. Route 559 is a bus service providing transportation along the Route 59 corridor. Route 722 provides transportation along Ogden Avenue from Naperville to Lombard.
* Ridership data does not include routes 820, 827, 829, 888, 722 and 559. The four routes in the 800 series originate and terminate outside of Naperville. Routes 722 and 559 are new routes that started midway through 2016; they are excluded in order to provide consistency from year-to-year.
Pace Ridership2010 2011 2012 2013 2014 2015 2016
# Routes 19 19 19 19 21 21 22
# Riders 1,234 1,276 1,167 1,315 1,277 1,188 1,107
% Change -4.50% 3.40% -8.547% 12.68% -2.89% -7.01% -6.78%

Electric Vehicle Charging Stations The City of Naperville offers two dual port electric vehicle charging stations - one located in the Van Buren Surface Lot and the other on the first level of the Van Buren Parking Deck. The current cost is $1.50 an hour to charge, and vehicles are permitted to charge for up to three hours.
All charging stations are Level 2 stations employing 220-240 volts requiring a shorter charging time than a wall-plug residential unit.
Electric Vehicle Charging Stations 2012 2013 2014 2015 2016
# Ports 2 2 4 4 4# Plug Ins 161 707 579 670 772Plug Ins % Change N/A 32% -18% 16% 15%Consumption (kWh) 842 4,783 2,329 3,740 4,453kWh % Change N/A 100% -51.30% 61% 19%
Sidewalk Program Continues to Connect Community
13
The Naperville Sidewalk Program added more than 1,000 feet of new sidewalk to the City in 2016. These new sidewalks were installed along the west side of Webster Road from 10th Avenue to 11th Avenue, the east side of Main Street from 11th Avenue to Ogden Avenue and the east side of Wright Street from Hillside Road to Wehrli Drive.
The sidewalk work in 2016 completed the balance of the work approved in the City’s Comprehensive Sidewalk Program by City Council and the Transportation Advisory Board (TAB) in 2014. The work was spread over 2015 and 2016 based on the availability of school funding, easements needed to do the work and staff vacancies.
In December 2016, City Council and TAB approved the location list for 2017 sidewalk improvements. In 2017, the City plans to address sidewalk segments on the 10 block locations shown at right. To help maintain a more consistent amount of sidewalk additions each year, the City’s engineering staff has reorganized its administration of the sidewalk program for improved efficiency.
2017 Sidewalk Segments
STREET SIDE FROM TO
Wright St. West 5th Ave. 8th Ave.
Wright St. West 12th Ave. 14th Ave.
Highland Ave. South Coumbia St. Julian St.
Santa Maria West Sunset Dr. Cul-de-sac
Eagle St. West 10th Ave. 13th Ave.
Chicago Ave. North Columbia St. Julian St.
Ellsworth St. East Ogden Ave. 216 E. Ogden Ave.
Porter Ave. South Main St. 606 S. Main St.
Ewing St. East Benton Ave. Jefferson Ave.
Loomis St. West Hillside Rd. Sunset Dr.
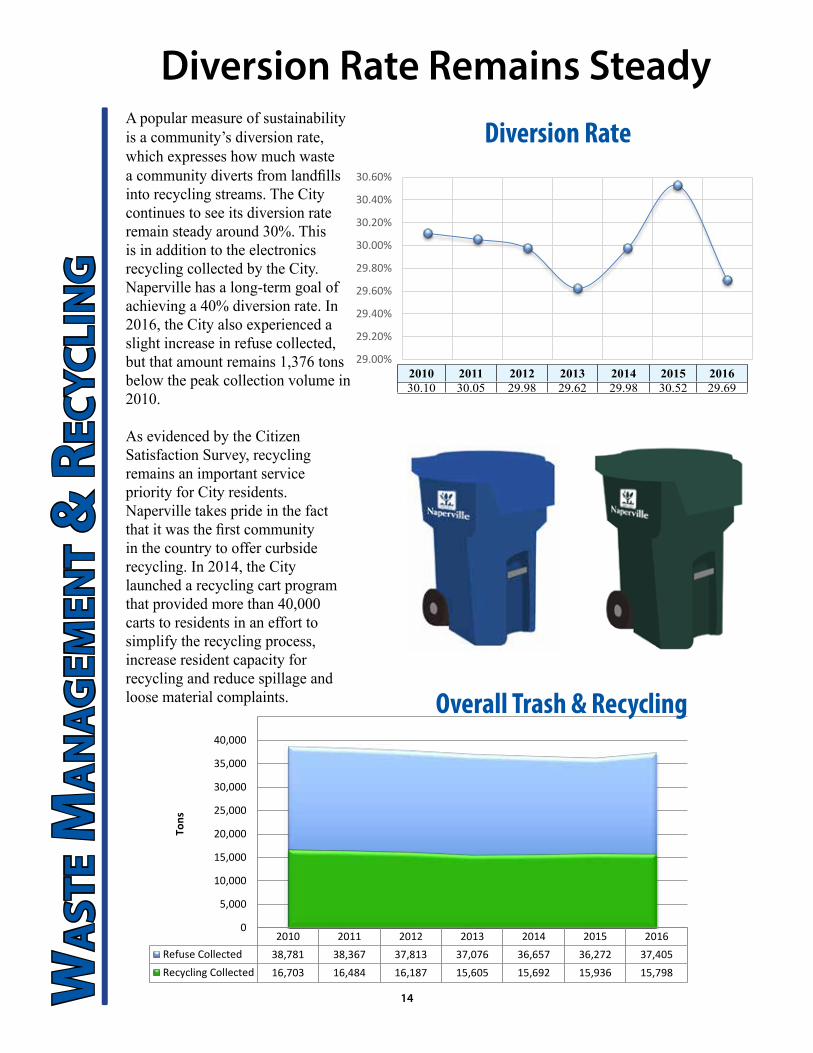
2010 2011 2012 2013 2014 2015 201630.10 30.05 29.98 29.62 29.98 30.52 29.69
Wa
ste M
an
ag
eMen
t & r
ecyc
Lin
g
14
A popular measure of sustainability is a community’s diversion rate, which expresses how much waste a community diverts from landfills into recycling streams. The City continues to see its diversion rate remain steady around 30%. This is in addition to the electronics recycling collected by the City. Naperville has a long-term goal of achieving a 40% diversion rate. In 2016, the City also experienced a slight increase in refuse collected, but that amount remains 1,376 tons below the peak collection volume in 2010.
As evidenced by the Citizen Satisfaction Survey, recycling remains an important service priority for City residents. Naperville takes pride in the fact that it was the first community in the country to offer curbside recycling. In 2014, the City launched a recycling cart program that provided more than 40,000 carts to residents in an effort to simplify the recycling process, increase resident capacity for recycling and reduce spillage and loose material complaints.
Diversion Rate Remains Steady
2010 2011 2012 2013 2014 2015 2016Refuse Collected 38,781 38,367 37,813 37,076 36,657 36,272 37,405Recycling Collected 16,703 16,484 16,187 15,605 15,692 15,936 15,798
0
5,000
10,000
15,000
20,000
25,000
30,000
35,000
40,000
45,000
Tons
Overall Recycling
Diversion Rate
Overall Trash & Recycling
29.00%
29.20%
29.40%
29.60%
29.80%
30.00%
30.20%
30.40%
30.60%
2010 2011 2012 2013 2014 2015 2016
Diversion Rate

15
Household Hazardous Waste Visits Jump by Nearly 20%
Naperville’s Household Hazardous Waste Facility, located at 156 Fort Hill Drive, is one of only four locations in the State of Illinois where residents can safely discard waste for free. Since opening in February 2015, the facility has continued to see steady increases in visitors. In fact, in 2016, the number of cars visiting the facility topped 20,000 for the first time, representing an increase of 18% over 2015.
The majority of visitors passing through the facility came from DuPage County (12,594), followed by Will (3,699), Kane (2,833) and areas beyond (1,640).
Nearly 680,000 pounds of hazardous material was collected in 2016. Consistent with prior years, the most common materials collected were flammable liquids (gasoline, mineral spirits, kerosene), oil-based paint,
toxic liquids (medication, weed killer, pesticides), adhesives or paint-related materials and toxic solids (medication, weed killer, pesticides).
The facility also accepts numerous other items including aerosol cans, automotive fluids, asbestos materials, used batteries, fire extinguishers, fluorescent bulbs, households clearness, peanut oil, poison, fertilizers, propane tanks, solvents and strippers and thermostats.
2010 2011 2012 2013 2014 2015 2016
HHW (lbs.) 432,250 440,700 515,950 531,600 570,050 539,619 679,950
Cars 15,187 14,670 15,890 15,988 16,107 17,586 20,766
Avg. per Car 28.46 30.04 32.47 33.25 35.39 30.68 32.74
The Prescription Drug Drop Box Program con-tinues to generate positive results, with nearly 1,900 pounds of prescription and over-the-counter medica-tion collected in 2016.
The City provides 24-hour drop boxes at all 10 fire stations and an additional drop box in the main lobby of the police sta-tion from 7 a.m. to 8 p.m., Monday through Friday and 10 a.m. to 6 p.m. on Saturdays. The police station drop box also provides a disposal area for medications containing controlled substances.
The program offers free and easy proper disposal of expired or unneeded prescription drugs and over-the-counter medica-tions, reducing the chance of drugs contaminating water sources or being ingested by minors and animals.
PrescriptionDrug Collection
2015 2016NPD 319.20 527.60
NFD 1,653.12 1,336.83
Total (lbs.) 1,972.32 1,864.43
For more information, including hours and
a complete list of materials collected, visit
www.naperville.il.us/hhw

In previous years, the City of Naperville, in partnership with DuPage County, was able to host an electronics drop off facility. This important environmental service enabled our residents to be compliant with State law, which bans electronics disposal in landfills in Illinois. Because the recyclers secured funding from the manufacturers to accept and process materials, residents were not charged. Unfortunately, this model could not be sustained due to a combination of high volume, more stringent regulations and costs centered around material processing, in particular the handling of leaded CRT glass.
As a result, many recyclers went out of business, forcing the closure of municipal collection sites, including Naperville’s in 2015.
In October of 2016, through an agreement with DuPage County and eWorks Electronics Services, Inc., the City of Naperville resumed collection of residential electronics.
eWorks accepts all electronic devices with a fee for all screened devices. Any television or monitor 21” and under costs $25 and anything greater than 21” in size costs $35. All other electronic items are collected free of charge. eWorks manages all transactions and staffs the collection operations hosted at the City’s Environmental Collections Campus located on Fort Hill Drive. Services are available Monday thru Friday from 7 a.m. to 3:30 p.m.
Since re-opening on November 7, 2016, the electronics recycling program has been well utilized, serving 1,190 visitors through the end of 2016.
16
2010 2011 2012 2013 2014 2015 2016
Electronics N/A 434,950 485,801 825,800 985,341 N/A 70,370*
2015 total was unavailable due to unavailable statistics from New Life Electronics Recycling*2016 total only includes two months of data
Electronics Recycling Returnsto Naperville
In 2016, Naperville recycled 104 refrigerators and 20 freezers. Since 2011, the City has recycled 614 refrigerators and freezers, saving an estimated 392 tons of carbon dioxide over the life of the program.
Through the Recycle My Fridge program, residents served by an Illinois Municipal Electric Agency (IMEA)-member utility, which includes Naperville, are able to recycle an old refrigerator or freezer and receive a $50 prepaid gift card.
2011 2012 2013 2014 2015 2016
Units Recycled 120 63 53 102 152 124
CO2 Savings (tons) 1,148 603 507 976 1,454 1,186
Residents Recycle Refrigerators & Freezers

In 2016, the City installed 6,500 LED lights to complete the conversion from high-pressure sodium (HPS) to light emitting diode (LED) fixtures in all residential neighborhoods across the City. The work began in January and was contracted through Meade Electric.
dev
eLo
pMen
t & in
fra
stru
ctu
re
17
City Nears Completion of LED Light Installation
JULIE Locates
12,480 tickets
Inlets/Catch Basin
Cleaned/Inspected
7,530
Sewer Lines Flushed
36,439 linear feet
Lines Televised
18,269 linear feet
Pipe Re-Lined
15,937 linear feet
Storm Sewer Recon-
struction130
Storm Sewer Maintenance
The Department of Public Works handles ongoing and emergency stormwater man-agement projects for the City. These projects are designed to control erosion, stormwater system failures and localized flooding. Projects include structure rebuilding and repairs, pipe-lining, recon-struction, patch work and open drainage repairs and cleaning.
In 2016, the City received 1,074 requests from residents for stormwater repairs. The goal of the program is to reduce localized flooding issues and ensure the stormwater system functions properly. Here is a breakdown of the results of those requests.
In 2015, the City completed the first phase of this project converting 1,550 arterial road lights on streets maintained by the City of Naperville. The new light fixtures emit a clearer light contributing to an improved aesthetic and increased safety in City neighborhoods.
LED lights are projected to save the City $4.56 million over 10 years through reduced energy usage, re-lamping fees and maintenance costs. While the lights are not individually metered, a pilot conducted in 2009 on Diehl Road showed a savings in electric power consumption of 54%.
LEDs are rated for 50,000 hours, or approximately 15 years, which far exceeds the previously used HPS light that ranged from 70 to 400 watts with a life expectancy of 10,000 hours, or three to four years. In total the LED project will cost an estimated $1.65 million.
The third and final phase of replacements is budgeted for 2017 and will replace 3,387 specialty streetlights including downtown lighting and parking lot lights. The light conversion will be completed in 2018.
Staff is monitoring all concerns regarding these lights and is committed to looking at methods to remedy any complaints or disruptions, such as affixing light shields.

18
Efficiencies Achieved in Leaf Collection
Arbor Day Tree SaleThe Department of Public works hosted the 26th annual Arbor Day Tree Sale on April 22, 2016. Of the 447 trees available during the event, a total of 412 trees were sold and 200 free souvenir trees were distributed. After the sale, the Naperville Park District purchased 15 trees, and the remaining 20 trees that were not sold were planted on City properties. Since 2010, more than 3,000 trees have been planted as a result of this program. The total cost in 2016 for the purchase of the trees and shipping was $17,968.35 and the total collected through the sale of the trees was $20,585. Measuring the impact of the tree sale is not simply a
# Trees Planted
Overall ($) Benefit at
Time of Planting
ANNUAL Stormwater
Runnoff Intercepted
(gallons)
ANNUAL Cooling Savings
(kilowatts)
ANNUAL CO2
Reduction (lbs)
At Maturity (6”)
ANNUAL Benefit ($)
2010 (est) 425 $1,700 6,588 1,743 5,525 $15,853
2011 (est) 425 $5,100 19,763 5,228 16,575 $31,705
2012 443 $10,272 39,804 10,529 33,384 $48,229
2013 430 $15,392 59,644 15,777 50,024 $64,268
2014 478 $25,968 100,626 26,617 84,396 $82,097
2015 443 $29,474 114,206 30,211 112,556 $98,621
2016 447 $48,908 189,519 50,131 158,951 $115,294
SOURCE: National Tree Benefits Calculator
The bulk curbside leaf collection program occurs each fall. Three times per year, residents rake their leaves into the street next to the curb in front of their house, and Department of Public Works (DPW) crews pick them up using specialized mechanical equipment. On average, 52,000 cubic yards of leaves are collected annually. The leaves that are collected are trucked to local farms throughout the area.
Disposing of the leaves has become more challenging over the years. Local farmland is becom-ing scarce, thus requiring leaves to be trucked to farms further away at a higher fuel cost to the City. Weather also plays a role in DPW’s ability to dispose of leaves at the various local farms. As farmland becomes saturated with rain, which is typical during the fall season, heavy trucks cannot access the sites to dispose of the leaves.
Beginning in the fall of 2016, DPW initiated a new cost-effective method to help dispose of 50-80% of the leaves collected during the annual bulk curbside
leaf collection program. The alternative utilizes a burn box to reduce the leaves that are collected to ash. A burn box costs approximately $150,000 to purchase and is an approved method for disposing of leaves by the Illinois Environmental Protection Agency. The box is essentially the size of a large trash dumpster, utilizes a small diesel motor and includes proprietary fans and ceramic material to safely generate a fire at a temperature of about 1,200 degrees Fahrenheit. The material in the box burns cleanly and with limited smoke or smell, comparable to a campfire.
The budget for reserving farm land and trucking leaves to the farms (i.e. leaf disposal) had been approximately $260,000 annually. The cost of the burn box is a one-time expense with annual maintenance and operation of the burn box costing the City approximately $5,000. Those leaves not incinerated will be disposed of at area farms. Using the new approach, the City will achieve a return on investment within CY17.
matter of dollars and cents. Trees provide a number of benefits including: reduction in CO2 gas, energy savings due to the cooling effect of trees, reduced stormwater runoff and improved aesthetics. Using the National Tree Benefits Calculator, the impact of the Naperville Arbor Day Tree Sales held since 2010 can be seen in the table at right. This data represents less than half of the overall tree sale efforts, which started back in 1990.

19
Naperville’s Urban Forest Canopy
Canopy
Vegetation
Bare Soil
Water
Buildings
Roads/Rail
Other Paved
Area
(acr
es)
Golf
Agriculture
Cemetery
Commercial
Institutional
Natural areaPark
ResidentialTransit
UtilityVacant
Water
Naperville Land Cover Area by Land Use
The urban forest provides numerous benefits to the community, such as improved air and water quality, reduced flooding and urban heat island effect, improved wildlife habitat,
reduced energy use and increased property values.
Naperville’s land area is currently comprised of approximately 21% canopy, 41% other vegetation and 3% water, with buildings, roads/rails and other paved surfaces comprising the remaining 35%. The City’s urban forest canopy is made up of all the trees in the City, including parkway trees, natural forest areas, residential yards and all other trees growing on public and private property.
The information generated through CRTI’s analysis helps Naperville understand existing conditions and identify opportunities to increase local urban forest canopy, and reap the benefits that come with it. The City’s continued treatment of Ash trees located in the public parkway for Emerald Ash Borer is one example of the City’s efforts to maintain a healthy and beneficial tree canopy in Naperville.
Canopy
Vegetation
Bare Soil
Water
Buildings
Roads/Rail
Other Paved
Naperville Land Cover
The Chicago Region Trees Initiative (CRTI), with several partner organizations, mapped land cover across the seven-county Chicago Region. The analysis identified seven land cover types and determined the amount of the land coverage types in each county/municipality, including Naperville.

in th
e Wo
rks
20
Waste Water Treatment Plant Changes in the Works
Naperville’s Water Utility provides its customers with high-quality water and wastewater services that enhance our residents’ quality of life and make Naperville an attractive location for businesses. In fact, our 2016 Citizen Survey showed 95% people are satisfied with the reliability of their water service.
As part of a new Federal permit to operate the Springbrook Water Reclamation Center, the City must remove more phosphorus than it currently does from the water it treats. This will have positive environmental impacts for local and national waterways, as excess phosphorus in water can cause “dead zones” where no aquatic life can survive. These phosphorus improvements must begin in 2025.
After careful consideration, a decision was made on rates that accomplish several
actions, including eliminated customers classes subsidizing each other’s service, increasing capital funding to address upcoming projects and implementing a transparent surcharge on customers’ bills to solely fund phosphorus improvements. In addition the surcharge, phosphorus improvements will also be funded by the Electric Utility repaying a loan made to it by the Water Utility in 2014 and debt service.
Naperville already enjoys some of the lowest rates among other communities that source water from Lake Michigan, and rates will remain competitive following rate changes. In addition, the utility will be poised for long-term financial stability and will continue to provide the reliable service that is a hallmark of Naperville.
Springbrook Water Reclamation Center

21
Floating Wetlands Pilot ProjectThe City of Naperville Department of Public Works is in the process of piloting a floating wetland project. This effort seeks to address an ongoing issue experienced across the city… poor storm water retention pond water quality. Floating wetlands are a cheaper and more environmentally friendly alternative to chemical treatments that are typically used to keep ponds looking clean and clear. Currently, the City of Naperville is piloting a floating wetland program to discover just how well these wetlands will improve water quality, habitat and ecosystem of the site. If the project is successful, the City hopes to encourage homeowners associations and citizens to build and deploy floating wetlands in their own backyards.
What is a floating wetland?
A floating wetland is essentially a floating container garden containing native, perennial plants that mimics the function of a natural wetland. Natural wetlands are known to control flooding, serve as a habitat for
wildlife and filter water by removing undesirable substances and pollutants.
How do floating wetlands work?
The body of the wetland is made from filter material similar to the material that keeps backyard ponds clean. Numerous native wetland plants are planted within the filter material so that their roots suspend in the water. It is then placed within a body of water and will over time reduce algae, repopulate the ecosystem and improve the quality of water by controlling substances such as phosphorus, nitrogen and oxygen.

www.naperville.il.us For up-to-date information on environmental initiatives,
please visit Naperville’s sustainability webpage at www.naperville.il.us/sustainability.