NAOSITE: Nagasaki University's Academic Output...
23
This document is downloaded at: 2018-06-24T06:18:03Z Title Time dependent spectral change upon potential step perturbation for Au nanoparticles immobilized on an organic monolayer-modified ITO electrode Author(s) Toyota, Ayumi; Sagara, Takamasa Citation Colloids and Surfaces A 286(1-3), pp.62-69; 2006 Issue Date 2006-09-01 URL http://hdl.handle.net/10069/20947 Right Copyright © 2006 Elsevier B.V. All rights reserved. NAOSITE: Nagasaki University's Academic Output SITE http://naosite.lb.nagasaki-u.ac.jp
Transcript of NAOSITE: Nagasaki University's Academic Output...

This document is downloaded at: 2018-06-24T06:18:03Z
TitleTime dependent spectral change upon potential step perturbation for Aunanoparticles immobilized on an organic monolayer-modified ITOelectrode
Author(s) Toyota, Ayumi; Sagara, Takamasa
Citation Colloids and Surfaces A 286(1-3), pp.62-69; 2006
Issue Date 2006-09-01
URL http://hdl.handle.net/10069/20947
Right Copyright © 2006 Elsevier B.V. All rights reserved.
NAOSITE: Nagasaki University's Academic Output SITE
http://naosite.lb.nagasaki-u.ac.jp

1
Published in: Colloids and Surfaces A: Physicochem. Eng. Aspects, 286 (2006) 62–69.
Time dependent spectral change upon potential step perturbation for Au nanoparticles immobilized on an organic monolayer-modified ITO
electrode
Ayumi Toyotaa, Takamasa Sagarab,*
a Department of Materials Science, Graduate School of Science and Technology, Nagasaki
University, Bunkyo 1-14, Nagasaki 852-8521, Japan b Department of Applied Chemistry, Faculty of Engineering, Nagasaki University, Bunkyo 1-14,
Nagasaki 852-8521, Japan
* Corresponding author. Tel. and fax: +81 95 819 2676.
E-mail address: [email protected] (T. Sagara).
Received 24 December 2005; received in revised form 25 February 2006; accepted 3 March 2006
Available online 18 April 2006

2
Abstract
Time dependent spectral change of Au nanoparticles immobilized on an ITO electrode upon the
change of electrode potential was investigated. Au nanoparticles of a diameter of 11 nm were
immobilized on a monolayer of alkylsiloxane with an amine or thiol end group on an ITO electrode.
In addition to the previously clarified charging-discharging process of the particles in response to
the sine-wave potential modulation at frequencies higher than 8 Hz, very slow relaxation of visible
light absorption after a potential step was found in the present work. The transient of absorbance
in response to the potential step was a sum of a fast component within 1 s and a slow single
exponential component with a half-life of the order of 30−150 s. The half-life of the slow
component and the magnitude ratio of the two components depended on the incident light
wavelength and the direction of the potential step. These results suggested that the absorption
spectrum of the Au nanoparticles after the potential change is time dependent. The relative
magnitude of the slow relaxation in the total spectral change was enhanced in the presence of
adsorptive electrolyte anions such as Cl− and Br−, especially at positive potentials, at the expense of
the fast component. Implications of these results were discussed, and the possibility of the
presence of a slow surface process on the Au nanoparticle surface in the presence of adsorptive
anions was invoked.
Keywords: Au nanoparticles; ITO electrode; Plasmon absorption; Potential step transient; Anion
effect

3
1. Introduction
Nanoparticles of noble metals such as Au and Ag exhibit a plasmon absorption band in the
visible wavelength region. The absorption spectrum is sensitive to various factors such as particle
size [1−3] and shape [4,5], particle charge [6−10], aggregation state [11,12], and physicochemical
micro-environment of the surrounding medium [13−16]. The increase of the electron density on
the particle results in the increase of the plasma frequency of the electrons in the particle, leading to
a blue shift of the plasmon absorption band. Particle aggregation causes the appearance of an
additional low-energy absorption peak, which is ascribable to coupled plasmons of interacting
particles. The increase of the refractive index of the surrounding medium results in a red shift in
plasmon band position. Regulation of the spectrum through the construction of nano-ordered two
dimensional lattices is among the current topics.
Clarification of the spectral change of a metal particle at an electrified interface is of importance
in the application to chemical sensors. In the sensor application, shortening of the response time is
highly desirable as well as the sensitization and quantification of the plasmon absorption change.
To mention just one example, Nath and Chilkoti detected steptavidin at a detection limit of 16 nM
using the absorbance change of the localized surface plasmon resonance for the
biotin-functionalized Au colloidal particle immobilized on a siloxane monolayer-modified glass
substrate (Au-biotin) [17]. When they monitored the absorbance change at a wavelength of
550 nm due to the local refractive index change upon the initiation of the binding between
streptavidin and Au-biotin, the full absorbance change typically took over 30 min. In a number of
reports of the sensor application of the plasmon absorption, however, the response time has not
been described explicitly.
Immobilization of metal nanoparticles on an optically transparent electrode is well-suited to
measure the potential dependence of the plasmon absorption spectrum of the particles both
statically and dynamically. Especially, potential dependent particle charge, aggregation state, and
microenvironment can be highlighted. In our previous report, the potential dependence of
plasmon absorption band was described using the results of the measurements of sine-wave
potential-modulated UV-vis transmission-absorption (PMTA) signal for Au nanoparticles on a
modified ITO electrode in 0.1 M phosphate buffer solution at pH 7.0 [10]. The observed spectral
change was mainly due to the charging-discharging process of the particles. Negative change of
the electrode potential results in the increase of the electron density on the particle. This leads to
4
the increase of the plasma frequency of the electrons in the particle. As a result, the plasmon
absorption is enhanced and shifted to blue at more negative potentials. Our combined analysis of
frequency dependencies of PMTA signal and charging current has demonstrated that the absorbance
change at frequencies higher than 5 Hz is due to the charging-discharging. The spectral change
well corresponds to the charging of a 11 nm particles by a rate of 1500 electrons V−1, in good
agreement with the Mie-Drude optical theory [6].
We herein focus on the response time of the plasmon spectral change of Au nanoparticles under
potential control. As mentioned above, the accurate grasp of the apparent end-point or equilibrium
point of the spectral change is highly important in sensing business. The initial event of
opto-electronic process should be usually a rapid process (≤ 10−15 s). Apparent slow response may
originate from interfacial electron transfer, chemical process, mass transfer, or other processes.
In our recent extension of the study to confirm the time-dependent spectral change as a response
to potential step for the Au nanoparticles on an ITO electrode, we have found a very slow relaxation
taking over 400 s under certain conditions. We herein describe the nature of the slow relaxation in
detail using the results of potential step measurements of the transients of the absorbance at various
conditions.
2. Experimental
Chemicals. Hydrogen tetrachloroaurate(III) tetrahydrate (Wako), trisodium citrate dihydrate
(Kanto), 4-aminobutyltriethoxysilane (Gelest), and 3-mercaptopropyltrimethoxysilane (TCI) as well
as all other chemicals were of reagent grade and used as received. Water was purified through a
Milli-Q Plus Ultrapure water system coupled with an Elix-5 kit (Millipore). Its resistivity was
over 18 MΩ cm.
Preparation of Au particles. Citrate-stabilized Au nanoparticles (TEM diameter, 11.5 ±
1.1 nm; plasmon absorption maximum of the colloidal solution, λmax = 520.0 nm) were prepared by
water-phase reduction of AuCl4− by trisodium citrate as described in our previous paper [9].
Preparation of modified ITO electrode. An ITO electrode (surface resistivity, 6.2 Ω/sq,
purchased from Kuramoto Seisakusho CO., LTD.) of a surface area of 1.51−1.68 cm2 was cleaned
by immersing in 1% NewVista #50 (INUI) aqueous solution for 3 min under sonication and rinsed

5
with a copious amount of water and then ethanol. Then, the electrode was immersed in an
ethanolic solution of 0.1 M 4-aminobutyltriethoxysilane for 10−30 min to prepare an
amine-terminated siloxane (ABSiO)-monolayer modified electrode. The thiol-terminated siloxane
(MPSiO)-monolayer modified electrode was also prepared from the ethanolic solution of 0.1 M
3-mercaotopropyltrimethoxysilane. After the modified electrode was rinsed copiously with
ethanol and subsequently with water, it was immersed in the Au colloidal solution (24 nM
Au-particle sol) for a period of 30−120 min. After it was rinsed with water, the Au particles
deposited on the rear glass surface were completely wiped off. The amount of immobilized
particles was estimated from the absorption spectrum on the assumption that the particle absorption
coefficient on the electrode surface is equal to that in the colloidal solution.
Electrochemical measurements. The base electrolyte solution used in electrochemical
measurements was 0.1 M phosphate buffer (Pi) solution of pH 7.0 prepared from potassium salts
unless otherwise stated. All the electrochemical measurements were conducted using a
Ag|AgCl|sat-KCl reference electrode and a coiled Au wire counter electrode in an Ar gas
(>99.998%) atmosphere at 23 ± 2 °C. Electrode potentials are cited with respect to this reference
electrode.
Spectroelectrochemical measurements. A UV-Vis spectrophotometer (U-3000, Hitachi)
equipped with an optical integration sphere of a diameter of 60 mm (ISN-470, Hitachi) was
employed to measure the transmission−absorption spectrum. The modified ITO electrode was
vertically inserted in a quartz cuvette of a light path length of 10.0 mm. The electrode surface was
perpendicular to the incident light. The cuvette was filled with electrolyte solution, in which
reference and counter electrodes were put in so as not to intermit the light path.
The time course measurements of the change of absorbance in response to potential step
perturbation and during a potential scan were conducted. Time resolution was 0.1 s. The
changes in absorbance are described as a normalized form, ΔA(t)/A0, where ΔA(t) is the time
dependent absorbance change after the potential step and A0 is the absorbance at 0.0 V.
3. Results
An ABSiO-ITO electrode (Fig. 1-A), on which Au nanoparticles of an amount of 1.2 ×

6
1012 particles cm-2 were immobilized, was subjected to absorption spectral measurements at various
constant potentials in Pi solution. Representative spectra at two different potentials are shown in
Fig. 1-B. The plasmon absorption band was observed with its maximum at a slightly longer
wavelength than that of the Au colloidal solution (line c). Within the full potential range used
(−0.6 V ≤ E ≤ 1.0 V), monotonic change of the spectrum was observed. That is, at more negative
potentials, a sharper and greater absorption peak was observed at a shorter wavelength. This
spectral change was interpreted as being due to potential-dependent charging-discharging of the
particle in our previous paper [10].
Fig. 1 See page 17
Fig. 2 See page 18
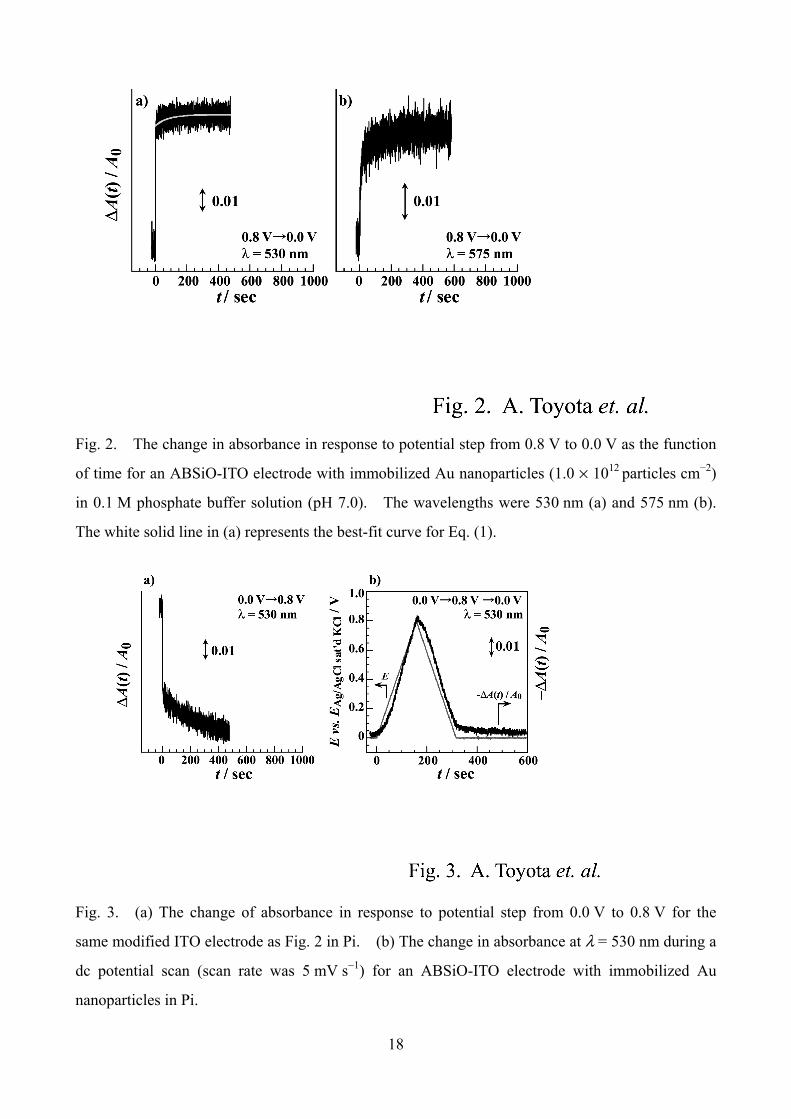
The transients of the absorbance in response to single potential step perturbations were
monitored between the two potentials cited in Fig. 1-B, namely 0.0 V and 0.8 V. Fig. 2 shows the
typical transients. At an incident light wavelength (λ) of 530 nm, a total change of the absorption
of approximately 6% with respect to A0 was observed when a negative step was used. An
immediate change within 1 s was followed by minor slow relaxation. The transients were found to
be dependent of λ as seen by comparison of Fig. 2-a and b. The transients were fitted to an
equation described by
)1()(
0τΔt
ebaA
tA −−+= (1)
where a is the immediate absorbance change component just after the potential step, b is the
pre-exponential factor, t is the time, and τ is the relaxation time constant. The fitting calculation
was made by the use of the least squares regression, which was successful in most of the cases,
albeit the considerable white noise. The fitting calculation was also examined by the use of the
other types of function of time including double exponential and t1/2-type functions. Among them,
Eq. (1) always gave rise to the best fit. The white solid line in Fig. 2-a shows the best-fit curve.
The set of the values of (a, b, τ) was (0.0589, 0.00502, 77.3 s) at λ = 530 nm and (0.0133, 0.0150,
44.0 s) at λ = 575 nm. We found that both the ratio of |b/(a + b)|, representing the fractional

7
content of slow relaxation component, and the value of τ are dependent on λ.
Fig. 3 See page 18
Fig. 3-a shows the transient obtained by reverse (positive) potential step at λ = 530 nm. The
transient could also be fit to Eq. (1). The set of the values of (a, b, τ) was (−0.0457, −0.0206,
210 s). Comparing to the negative step transient in Fig. 2-a, the contribution of the slow relaxation
component is greater. The content ratios of the slow component, |b/(a + b)|, are 0.311 for the
positive step (0.0 V→0.8 V) and 0.0785 for the negative step. Comparing these three transients
(Figs. 2-a, b, and 3-a), we found that the content ratio of slow relaxation and its time constant
depend on both λ and the step direction, indicating that the absorption spectrum is time dependent.
Fig. 3-b demonstrates how the absorbance change delays the linear potential sweep. In the
absorbance change during a linear potential sweep (scan rate was 5 mV s−1), the delay in the change
of absorbance was obviously observed.
It is important to note the fact that the transient was not influenced by the stirring of the solution
phase at all. The transients at quiescent and hydrodynamic conditions were identical. That is, the
spectral change with time is governed by surface process on the Au particle or charge transfer
process between the ITO electrode and the particle but not the convection or mass transfer process
in the solution phase.
Fig. 4 See page 19
Fig. 4 illustrates the comparison among absorbance transients at λ = 530 nm in the presence of
various additive salt in the electrolyte solution. Through (a) to (e), the potential step was given
from 0.8 V to 0.0 V. In KI solution (f), a negative potential step was given from 0.2 V to –0.4 V
to avoid the occurrence of the redox reaction of I–.
The test of the addition of citrate (a) was conducted to see the effect of the remaining citrate
used in the particle synthesis upon the potentials step response. The transient obtained in the
presence of 50 mM citrate was similar to Fig. 2-a, indicating that presence of various residual
amounts of citrate does not affect the transient. Addition of 1.0 M NaClO4 or KF was tested to see
the effect of higher ionic strength upon the transient by the use of an anion that does not exhibit
specific adsorption on the Au surface. As a result, the content of slow relaxation component was
8
minimal, indicating that no effect upon the transition was observed at the concentration up to 1.0 M
(Figs. 4-b and c). In sharp contrast, the pronounced effect of the addition of the salts of
specifically adsorptive anions was observed. Increasing the concentration of NaCl, KBr, and KI,
the magnitude of the slow component became gradually greater, while the fast component
decreased. In the case of Cl–, the fast component disappeared completely at 1.0 M. These results
indicate that specifically adsorbed anions quench the fast relaxation component. It is important to
note the fact that, even in the presence of KCl, the stirring of the solution phase gave rise to no
change of the transient curve. Again, the spectral change is governed by some surface process on
the Au particle or charge transfer process between the ITO electrode and the particle.
Fig. 5 See page 20
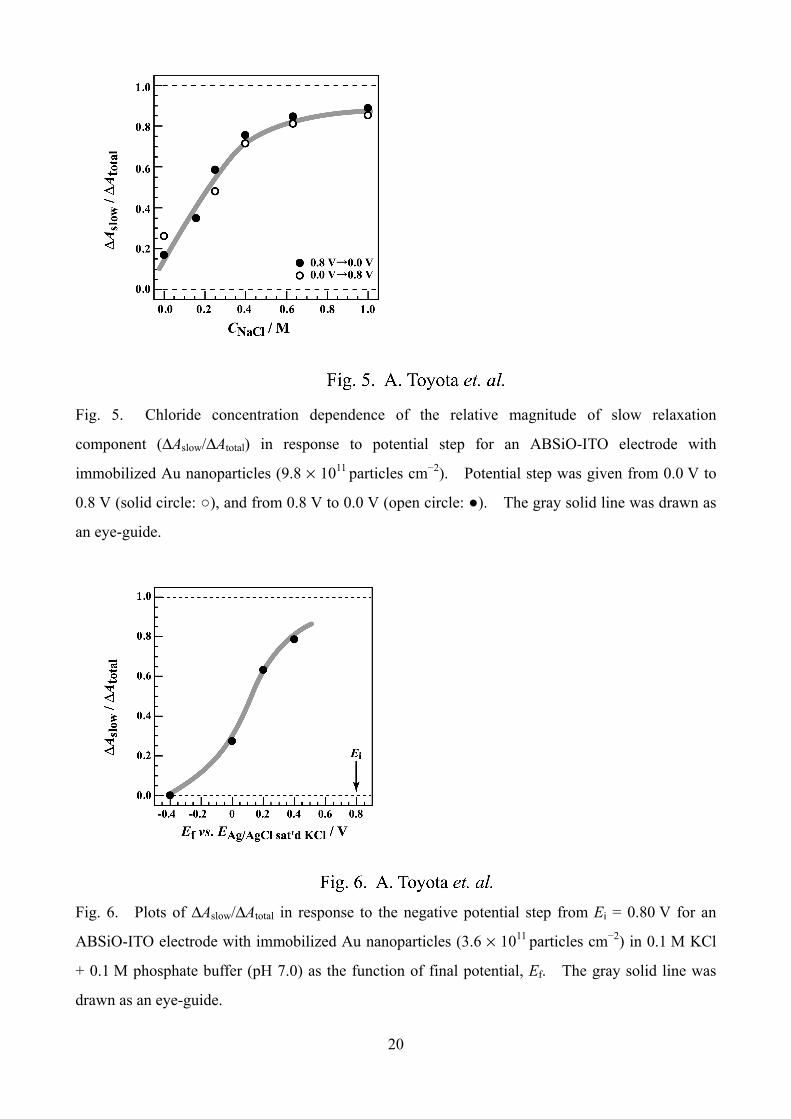
Fig. 5 shows the dependence of the magnitude of the slower relaxation component relative to
the total change (ΔAslow/ΔAtotal) upon NaCl concentration. The value of ΔAslow/ΔAtotal was equated
to |b/(a + b)| obtained by fitting calculation to Eq. (1). Equation (1) still held at [NaCl] = 1.0 M
with τ = 185 s. The relative magnitude of the slow component became greater at higher
concentrations at the expense of faster response. Finally, the faster one nearly disappeared at
[NaCl] = 1.0 M. It is now clear that the slow response is not an additive component to the faster
response. That is, substitution of the slow component for the fast component or disappearance of
the fast component takes place. This concentration dependence feature was also the cases of Br−
and I−.
In the previous paragraph, we noted by the use of the results in Figs. 2-a and 3-a that
ΔAslow/ΔAtotal (= |b/(a + b)|) for the negative potential step (0.8 V→0.0 V) is much smaller than that
for the reverse step in Pi. Taking a look at Fig. 5 closely, the difference due to the step direction is
smaller at all the concentrations including zero concentration than the above-mentioned data
obtained in Pi solution. We found that this represents a sample-to-sample variability. But the
following tendency always held in repeated experiments: (i) ΔAslow/ΔAtotal for negative potential step
(0.8 V→0.0 V) is much smaller than that for the reverse step in Pi in the absence Cl−. (ii) In the
absence of Cl−, the step direction dependence has relations with the amount of Au nanoparticles and
thus with the value of A0. The smaller the value of A0, the greater the extent of the step direction
dependence. (iii) In the presence of Cl−, ΔAslow/ΔAtotal for negative potential step is much greater
than that for reverse step at higher concentrations of Cl−, irrespective of the value of A0.

9
Fig. 6 See page 20
Fig. 6 shows the dependence of ΔAslow/ΔAtotal on the final potential (Ef) for the transients of the
negative potential step from Ei = 0.80 V in 0.1 M KCl solution. When the potential step was
extended to Ef = –0.4 V, the slower component disappeared. In contrast, when the final potential
was more positive than 0.20 V, the slower component was predominant. It is known that the
adsorption of Cl− on a Au(111) electrode surface is negligible at –0.1 V, and the adsorption amount
increases steeply around 0.2−0.4 V to be saturated at more positive potentials [18]. The (111)
facet of a Au crystal possesses the lowest surface energy. Therefore, Cl– adsorption on the Au
nanoparticle should take place at slightly less positive potential than 0.2 V, because the Au
nanocrystal exposes low index facets other than (111) as well as some higher index ones. The
result in Fig. 6 tells us that the fast component largely appears only when the potential step width
involves the potential range where Cl– does not adsorb on Au nanoparticle surface. As far as the
surface is covered with adsorbed Cl– at near saturation amounts, the faster response is almost
eliminated. Note that the slower component exhibits the half-life of approximately 200 s when it
was predominant in the presence of Cl–. At much higher KCl concentration (for examples, 0.3 M
or above), the slower component was still predominant even when Ef = –0.4 V (data not show here).
This fact indicates that the elimination of the slower response may be delicately sensitive to the
superficial amount of adsorbed Cl–.
Fig. 7 See page 21
It is known that Au nanoparticles are immobilized on the monolayers exposing amine end
groups so strongly that an AFM probe does not move the deposited particles as demonstrated in our
previous publication [9]. However, the binding of amine group to the surface of the Au
nanoparticle is not due to the formation of strong covalent bond. Partly, electrostatic attraction
contributes to the binding. The presence of higher concentrations of Cl– may possibly screen the
electrostatic attraction and weaken the binding. On the other hand, a thiol end group may interact
with the surface of a Au nanoparticle much more strongly than an amine end group. The binding
strength is not weakened by higher anion concentration. With these considerations in mind, the
use of an MPSiO-ITO electrode as the substrate to immobilize Au nanoparticles was examined for
10
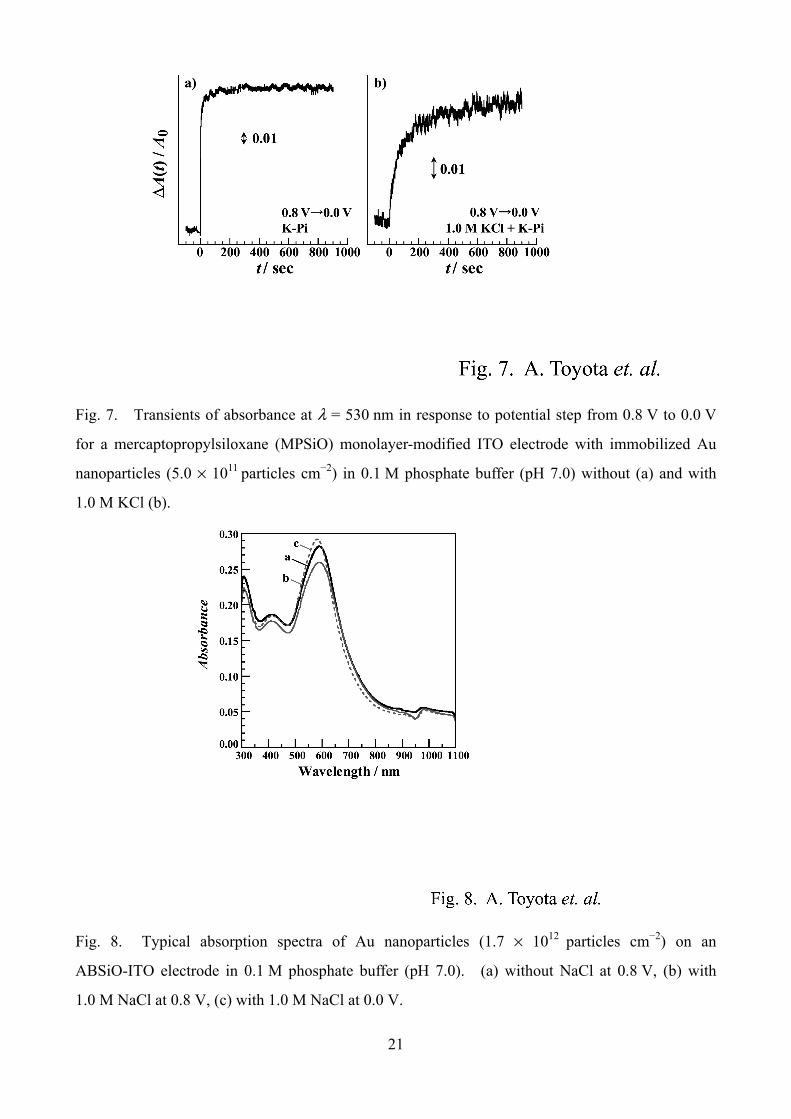
comparison. Fig. 7 shows the absorbance transients at λ = 530 nm at an MPSiO-ITO electrode in
response to potential step from 0.8 V to 0.0 V without (a) and with 1.0 M KCl (b). There was no
remarkable change by substitution of thiol end group for amine. Figs. 7-a and 7-b were quite
similar to Figs. 2-a and 4-d, respectively. These results suggest that the slow relaxation at higher
concentrations of Cl– is not specific to the amine-particle binding.
4. Discussion
A very slow relaxation of the absorption spectrum of Au nanoparticles immobilized on two
different siloxane-modified ITO electrodes was found in the potential step response. The features
of the relaxation of the absorbance can be summarized as follows. The absorbance transient
obtained by potentials step is described by Eq. (1), which involves a term of a single exponential
component with a long relaxation time constant ranging from 44 s to over 200 s. Both the content
ratio of slow component and the relaxation time constants depend on λ and the step direction.
Additions of stabilizer citrate and non-adsorptive anions at Au surface (ClO4− and F−) induce no
change of the transient. In contrast, addition of specifically adsorptive anions at Au surface (Cl−,
Br−, and I−) affected greatly. The contribution of the slow relaxation became greater at higher
concentrations of such anions at the expense of the faster response. Even in the presence of Cl−, if
the potential is stepped into the potential region of no Cl− adsorption, slow relaxation is not
observed.
Fig. 8 See page 21
In order to discuss the origin of the effect of halide adsorption, it is worthwhile to see constant
potential spectra in a wide wavelength region. Fig. 8 shows the effect of the addition of 1.0 M
NaCl upon the absorption spectra of Au nanoparticles on an ABSiO-ITO electrode. Even in the
presence of Cl–, blue shift and peak height enhancement of the plasmon absorption band were
observed (Fig. 8, line b to c). The spectral feature is in line with the Mie-Drude model as
discussed in our previous report [10]. Note that the enhancement was of relatively greater extent
than in the absence of Cl– (see Fig. 1). The addition of Cl– at a constant potential of 0.8 V resulted

11
in the decrease of the peak height (Fig. 8, lines a to b) without considerable spectral change at
wavelengths longer than 650 nm. This change by the addition of NaCl is in line with the
absorption spectral change for a 6.0 nm colloidal gold synthesized in the presence of sodium citrate
and tannic acid as reported by Cumberlang and Strouse: the decrease of the plasmon peak height
takes place without spectral change in longer wavelength region [19]. A few groups have also
analyzed the absorption spectral changes of Ag and Au nanoparticles by the addition of adsorptive
halide ions in terms of damping effects resulting in the plasmon band weakening and broadening
[15,20,21], aggregation/fusion of the particles resulting in the appearance of new band in a longer
wavelength region [20,21], or reshape of particles [21]. Ali and Foss, Jr. previously discussed the
effects of anion adsorption upon the potential dependent plasmon absorption spectrum of Au
nanoparticles in terms of surface shell layer formation [22]. Their simulation showed both red
shift and peak height damping accompanied by an increase in intensity in the longer wavelength
region with the increase of the shell layer thickness. Taken together, the spectral change observed
in the present work is at least not due to aggregation/fusion of the nanoparticles, while contribution
of the damping by Cl– adsorption remains likely.
Previously, slow absorbance relaxation of Ag nanoparticles under potential control was reported
by Chapman and Mulvaney [8]. The time scale of spectral shift of Ag particles embedded in a
polymer film on an ITO electrode in aqueous solution was of the order of several minutes. The
need of a long time period was interpreted as being due to a slow rate-determining ion diffusion
process in the film used to embed the particles. In the case of the Au particles of our interest,
given the absence of the effect of stirring, some surface process on the Au particle or charge transfer
process between the ITO electrode and the particle should be the origin of the sluggish response
rather than the diffusion process. In the report of Ali and Foss, Jr. describing the effect of anion
adsorption upon the potential dependent plasmon absorption spectrum of Au nanoparticles, the time
scale of the spectral change was not touched on [22].
In our previous reports, we demonstrated that potential dependent spectral change is due to
charging-discharging. It is meaningful to answer a question: “Is the slow spectral relaxation still
synchronized with the change of particle charge?”
Fig. 9 See page 22
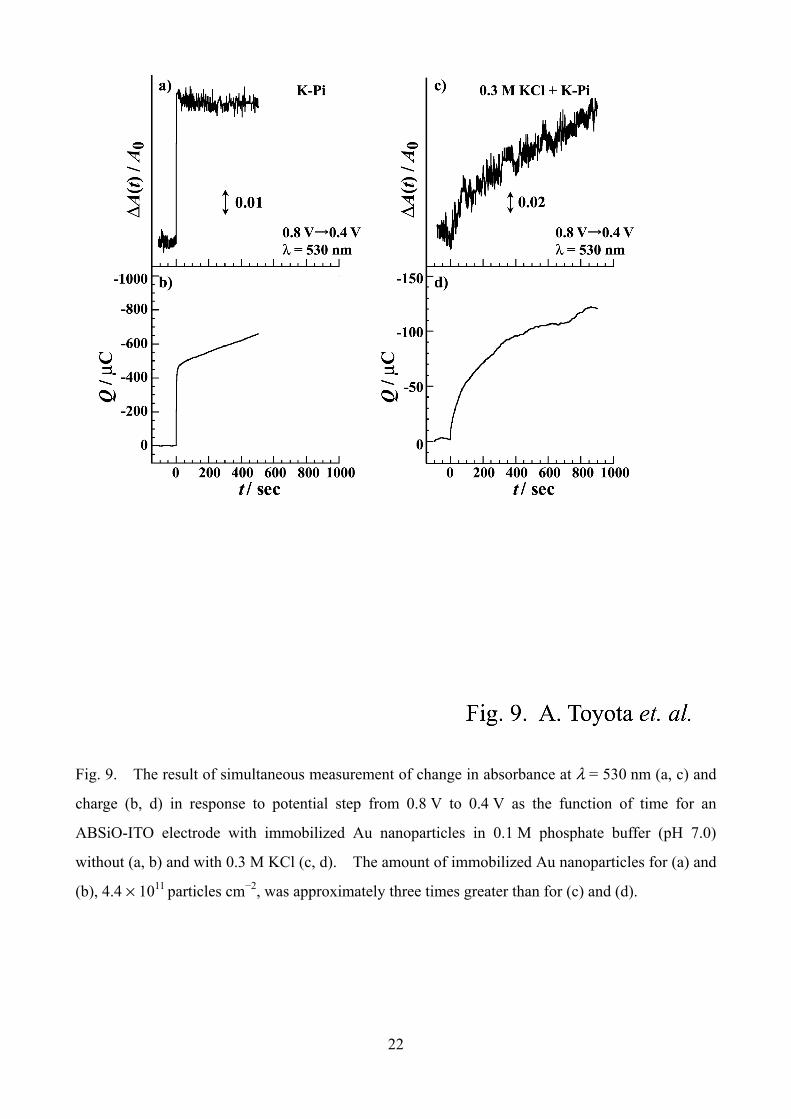
We made simultaneous measurements of the changes of absorbance and the charge. The
12
charge was obtained by the time integration of current transients. Fig. 9 shows the result of
simultaneous measurement of absorbance at λ = 530 nm (a, c) and charge (b, d) in response to
potential step from 0.8 V to 0.4 V as the function of time for an ABSiO-ITO electrode with
immobilized Au nanoparticles in Pi solution without (a, b) and with 0.3 M KCl (c, d). In the
absence of Cl−, the faster component of absorbance change was well accompanied by the fast rise of
the charge (Q). The dominant part of the particle charging, which is synchronized by the faster
component of the absorbance change, was quickly completed just after the potential step. In sharp
contrast, when 0.3 M KCl was added, the quick rise of Q was not observed, while the time
dependence of Q is almost in line with the absorbance change. Taken together, we can conclude
that the slow charging of the particle is concomitant with the slow component of the absorbance
change. The slow charging reflects the sluggish kinetics of either electron transfer process
between ITO electrode and Au particles or the double layer charging process at the surfaces of Au
particles. The charge transfer between the particle and adsorbed ion or surface structural change
of the particle may also be the origin of the slow charging, because solution stirring has nothing
effective.
We have carried out the following additional experiments to narrow down the possible origin of
the slow relaxation.
Experiment I: The ac impedance was measured with an amplitude of 5 mVrms both in the
absence and presence of KCl at the frequencies down to 1.0 mHz at –0.2, 0.2, and 0.6 V. As the
results, the effect of the addition of KCl on the impedance was not observed even in the
mHz-frequency region.
Experiment II: The faradaic ac impedance was measured also for the redox reaction of
Fe(CN)63−/4− in the solution phase. As the result, any considerable increase of the charge transfer
resistance by the addition of KCl was not observed.
The result of Experiment I may reveal that large amplitude potential change is a prerequisite to
realize the slow relaxation. That is, small ac amplitude cannot induce the slow relaxation. A
great extent of hysteresis is also probable as the reason why we got above-mentioned result. The
result of Experiment II may reveal that the faradaic electron transfer from electrode to solution
species via Au nanoparticles is not retarded as far as small amplitude ac technique is used.
We herein discuss the origin of slow response on a somewhat speculative basis.
A possible slow process is a rotatory reorientation of the particles on a ABSiO monolayer by the
weakening of the binding of terminal amino groups to the particle surface by the competition with
13
the halide adsorption. But the anion effect was also observed on the monolayer terminated with
thiol group, which more firmly binds to particle surface than amine group. Therefore, the rotatory
reorientation of the nanoparticles would be excluded as the origin of slow relaxation.
As far as the ionic adsorption kinetics is concerned, Cl– adsorption on a bare Au electrode is so
fast that its rate is almost diffusion limited [23]. To attain an adsorption equilibrium for Cl– on
Au(111) electrode surface, a period of 3 min is enough as claimed by Shi and Lipkowski [24]. A
slow adsorption process as the origin of the slow response may be allowed only if the anion
permeation through the blocking surface layer of citrate to the Au surface of the Au particle-ABSiO
contact region limits the adsorption rate. However, this cannot be the origin alone, because the
content of the slow response does not take a maximum for the potential step across the potential of
the steepest surface excess change (see Fig. 6) and the fast component is annihilated almost
completely at higher concentrations.
Recently, Rai and coworkers have demonstrated the effect of halide ions on the reshape of Au
nanotriangles prepared using the leaf extract of lemongrass plant [25]. The purified triangles were
kept in aqueous solutions of halides for a period of 24 h to examine the effect of halide ions on the
morphology of nanotriangles. Flat Au nanotriangles were transformed into circular disklike
structures in the presence of I–. This change in the morphology has been explained in term of
adsorption-induced interfacial stain leading to distortion of the triangular morphology. This
change was also observed in the case of Br−, and the trace of similar change was seen in the case of
Cl– in their TEM images. This fact reveals that Au atoms restructuring takes place at the surface
of particulate Au exposing multiple facets. An example of the movement of surface Au atoms on
a bulk Au surface was reported taking over 4 min in the presence of Cl− [26]. Cuesta and Kolb
demonstrated in situ STM images of Au(100) electrode surface, on which the surface structure with
adsorption layer of Cl− and Br− depend on electrode potentials [27].
One must be aware of the fact that the surface energy of the facet of metal nanoparticle is higher
than that of bulk metal [28,29]. This means that the movement of surface Au atoms to take the
lowest surface energy is more drastic at a nanoparticle surface than at the bulk Au surface through
the surface reconstruction as well as formation and disappearance of surface atom islands. Such
processes may be induced by potential change and cause the change of the interfacial electric
capacity. If the halide anion adsorption slows down the rate of surface reconstruction or enhances
the slow island formation, such processes may be observed as a slow charging-discharging. Slow
surface atom restructuring processes at bulk single crystal Au [30] and Cu [31] electrodes in the
14
presence of adsorptive anions also was reported. The potential induced slow relaxation of an
atomic-level facet structure may be a candidate of the origin of the slow relaxation observed in the
present work. This consideration raises an issue of the necessity of the direct observation of the
surface reconstruction on a metal nanoparticle, which can be different from bulk metal. Such a
research has, however, not been reported so far to our best knowledge.
Finally, the possibility of the potential dependent slow movements of particles themselves other
than rotatory reorientation should be also noted. We are, therefore, currently underway of the
examination of particle size dependence because the movements should depend on the size.
5. Conclusion
We have described herein the time-dependent spectral change as a response to potential step for
the Au nanoparticles immobilized on an ITO electrode. The transient of absorbance in response to
the potential step was a sum of a fast component and a slow single exponential component. The
half-life of the slow component and the ratio of the two components depended on the incident
wavelength and the direction of the potential step. The content of the slow relaxation in the total
spectral change was enhanced by the presence of adsorptive electrolyte anions such as Cl− and Br−,
especially at positive potentials, at the expense of the fast component. Additionally, it was found
that the transient curves not influenced by the stirring of the solution phase, indicating that the
response of the spectral change is governed by some surface process on the Au particle or charge
transfer process between the ITO electrode and the particle. The potential induced slow
movement of surface Au atoms on a Au particle surface can be one of the candidates of the origin
of the slow relaxation observed in the present work. The importance of the future investigation of
the potential dependent slow restructuring process at an atomic-level on the surface a Au
nanoparticle in the presence of adsorptive ions such as halide anions, which may different from
bulk metal, was pointed out. These results may provide a significant data for the sensor
application of the plasmon absorption, because it is of importance to grasp the time scale of the
spectral change.
15
Acknowledgements
This work was financially supported in part by a Grant-in-Aid for Scientific Research on
Priority Areas (Area no. 417 for T.S.) and Scientific Research B (No. 16350077 for T.S.) from the
Ministry of Education, Culture, Sports, Science, and Technology. Financial supports from Yazaki
Memorial Foundation for Science and Technology and Iketani Science and Technology Foundation
are also acknowledged.
References
[1] U. Kreibig, G. Bour, A. Hilger, M. Gartz, Phys. Stat. Sol. (a) 175 (1999) 351.
[2] S. Link, M. A. El-Sayed, J. Phys. Chem. B 103 (1999) 4212.
[3] K. R. Brown, M. J. Natan, Langmuir 14 (1998) 726.
[4] T. K. Sau, C. J. Murphy, J. Am. Chem. Soc. 126 (2004) 8648.
[5] N. R. Jane, L. Gearheart, C. J. Murphy, Adv. Mater. 13 (2001) 1389.
[6] T. Ung, M. Giersig, D. Dunstan, P. Mulvaney, Langmuir 13 (1997) 1773.
[7] T. Baum, D. Bethell, M. Brust, D. J. Schiffrin, Langmuir 15 (1999) 866.
[8] R. Chapman, P. Mulvaney, Chem. Phys. Lett. 349 (2001) 358.
[9] T. Sagara, N. Kato, N. Nakashima, J. Phys. Chem. B 106 (2002) 1205.
[10] A. Toyota, N. Nakashima, T. Sagara, J. Electroanal. Chem. 565 (2004) 335.
[11] J. Schmitt, P. Mächtle, D. Eck, H. Mohwald, C. A. Helm, Langmuir 15 (1999) 3256.
[12] A. N. Shipway, M. Lahav. R. Gabai, I. Willner, Langmuir 16 (2000) 8789.
[13] A. C. Templeton, J. J. Pietron, R. W. Murray, P. Mulvaney, J. Phys. Chem. B 104 (2000) 564.
[14] H. Hövel, S. Fritz, U. Kreibig, M. Vollmer, Phys. Rev. B 48 (1993) 18178.
[15] P. Mulvaney, Langmuir 12 (1996) 788.
[16] D. Eck, C. A. Helm, N. J. Wagner, K. A. Vaynberg, Langmuir 17 (2001) 957.
[17] N. Nath, A. Chilkoti, Anal. Chem. 74 (2002) 504.
[18] J. Lipkowski, Z. Shi, A. Chen, B. Pettinger, C. Bilger, Electrochim. Acta 43 (1998) 2875.
[19] S. L. Cumberlang, G. F. Strouse, Langmuir 18 (2002) 269.
[20] F. W. Vance, B. I. Lemon, J. T. Hupp, J. Phys. Chem. B 102 (1998) 10091.
16
[21] W. Cheng, S. Dong, E. Wang, Angew. Chem. Int. Ed. 42 (2003) 449.
[22] A. H. Ali, C. A. Foss, Jr., J. Electrochem. Soc. 146 (1999) 628.
[23] Z. Kerner, T. Pajkossy, Electrochim. Acta 47 (2002) 2055.
[24] Z. Shi, J. Lipkowski, J. Electroanal. Chem. 403 (1996) 225.
[25] A. Rai, A. Singh, A. Ahmad, M. Sastry, Langmuir 22 (2006) 736.
[26] M. Labayen, O. M. Magnussen, Surf. Sci. 573 (2004) 128.
[27] A. Cuesta, D. M. Kolb, Surf. Sci. 465 (2000) 310.
[28] J. E. Morris, T. J. Coutts, Thin Solid Films 47 (1997) 3.
[29] T. Castro, R. Reifenberger, E. Choi, R. P. Andres, Phys. Rev. B 42 (1990) 8548.
[30] S. Zou, X. Gao, M. J. Weaver, Surf. Sci. 452 (2000) 44.
[31] O. M. Magnussen, Chem. Rev. 102 (2002) 679.

17
Figures
Fig. 1. (A) Schematic model of the surface of aminobutylsiloxane (ABSiO) monolayer-modified
ITO electrode with immobilized Au nanoparticles (presentation not in correct scale). (B) Typical
absorption spectra of Au nanoparticles (1.2 × 10¹² particles cm−2) on an ABSiO-modified ITO
electrode in 0.1 M phosphate buffer (pH 7.0) at two different potentials: 0.0 V (a) and 0.8 V (b).
Line c represents the absorption spectrum of the colloidal solution of the Au nanoparticles.
18
Fig. 2. The change in absorbance in response to potential step from 0.8 V to 0.0 V as the function
of time for an ABSiO-ITO electrode with immobilized Au nanoparticles (1.0 × 10¹² particles cm−2)
in 0.1 M phosphate buffer solution (pH 7.0). The wavelengths were 530 nm (a) and 575 nm (b).
The white solid line in (a) represents the best-fit curve for Eq. (1).
Fig. 3. (a) The change of absorbance in response to potential step from 0.0 V to 0.8 V for the
same modified ITO electrode as Fig. 2 in Pi. (b) The change in absorbance at λ = 530 nm during a
dc potential scan (scan rate was 5 mV s−1) for an ABSiO-ITO electrode with immobilized Au
nanoparticles in Pi.

19
Fig. 4. Transients of absorbance in response to potential step for an ABSiO-ITO electrode with
immobilized Au nanoparticles in the presence of various additive salts in the solution phase. (a)
50 mM trisodium citrate + Pi, (b) 1.0 M NaClO4 + Pi, (c) 1.0 M KF + Pi, (d) 1.0 M NaCl + Pi, (e)
1.0 M KBr + Pi, and (f) 0.158 M KI + Pi. Potential step was given from 0.8 V to 0.0 V (a ~ e),
and from 0.2 V to −0.4 V (f).
20
Fig. 5. Chloride concentration dependence of the relative magnitude of slow relaxation
component (ΔAslow/ΔAtotal) in response to potential step for an ABSiO-ITO electrode with
immobilized Au nanoparticles (9.8 × 10¹¹ particles cm−2). Potential step was given from 0.0 V to
0.8 V (solid circle: ○), and from 0.8 V to 0.0 V (open circle: ●). The gray solid line was drawn as
an eye-guide.
Fig. 6. Plots of ΔAslow/ΔAtotal in response to the negative potential step from Ei = 0.80 V for an
ABSiO-ITO electrode with immobilized Au nanoparticles (3.6 × 10¹¹ particles cm−2) in 0.1 M KCl
+ 0.1 M phosphate buffer (pH 7.0) as the function of final potential, Ef. The gray solid line was
drawn as an eye-guide.
21
Fig. 7. Transients of absorbance at λ = 530 nm in response to potential step from 0.8 V to 0.0 V
for a mercaptopropylsiloxane (MPSiO) monolayer-modified ITO electrode with immobilized Au
nanoparticles (5.0 × 10¹¹ particles cm−2) in 0.1 M phosphate buffer (pH 7.0) without (a) and with
1.0 M KCl (b).
Fig. 8. Typical absorption spectra of Au nanoparticles (1.7 × 10¹² particles cm−2) on an
ABSiO-ITO electrode in 0.1 M phosphate buffer (pH 7.0). (a) without NaCl at 0.8 V, (b) with
1.0 M NaCl at 0.8 V, (c) with 1.0 M NaCl at 0.0 V.
22
Fig. 9. The result of simultaneous measurement of change in absorbance at λ = 530 nm (a, c) and
charge (b, d) in response to potential step from 0.8 V to 0.4 V as the function of time for an
ABSiO-ITO electrode with immobilized Au nanoparticles in 0.1 M phosphate buffer (pH 7.0)
without (a, b) and with 0.3 M KCl (c, d). The amount of immobilized Au nanoparticles for (a) and
(b), 4.4 × 10¹¹ particles cm−2, was approximately three times greater than for (c) and (d).