NANOGRAPHENE REINFORCED CARBON/CARBON COMPOSITES … · nanographene reinforced carbon/carbon...
137
NANOGRAPHENE REINFORCED CARBON/CARBON COMPOSITES by DHRUV BANSAL SELVUM PILLAY, CHAIR UDAY VAIDYA DERRICK DEAN ALAN SHIH MARK WEAVER A DISSERTATION Submitted to the graduate faculty of The University of Alabama at Birmingham, in partial fulfillment of the requirements for the degree of Doctor of Philosophy BIRMINGHAM, ALABAMA 2012
Transcript of NANOGRAPHENE REINFORCED CARBON/CARBON COMPOSITES … · nanographene reinforced carbon/carbon...
NANOGRAPHENE REINFORCED CARBON/CARBON COMPOSITES
by
DHRUV BANSAL
SELVUM PILLAY, CHAIR
UDAY VAIDYA
DERRICK DEAN
ALAN SHIH
MARK WEAVER
A DISSERTATION
Submitted to the graduate faculty of The University of Alabama at Birmingham,
in partial fulfillment of the requirements for the degree of
Doctor of Philosophy
BIRMINGHAM, ALABAMA
2012

Copyright by
DHRUV BANSAL
2012
iii
NANOGRAPHENE REINFORCED CARBON/CARBONCOMPOSITES
DHRUV BANSAL
MATERIALS SCIENCE AND ENGINEERING
ABSTRACT
Carbon/Carbon Composites (CCC) are made of carbon reinforcement in carbon
matrix and have high thermal stability and fatigue resistance. CCC are used in nose
cones, heat shields and disc brakes of aircrafts due to their exceptional mechanical prop-
erties at high temperature. The manufacturing process of CCC involves a carbonization
stage in which unwanted elements, except carbon, are eliminated from the polymer pre-
cursor. Carbonization results in the formation of voids and cracks due to the thermal
mismatch between the reinforcement and the matrix and expulsion of volatiles from the
polymer matrix. Thermal cracks and voids decrease the density and mechanical proper-
ties of the manufactured CCC.
In this work, Nanographene Platelets (NGP) were explored as nanofillers to fill
the voids/cracks and reduce thermal shrinkage in CCC. They were first compared with
Vapor Grown Carbon Nanofibers (VGCNF) by dispersion of different concentrations
(0.5wt%, 1.5wt%, 3wt%) in resole-type phenolic resin and were characterized to explore
their effect on rheology, heat of reaction and wetting behavior. The dispersions were then
cured to form nanocomposites and were characterized for morphology, flexure and ther-
mal properties. Finally, NGP were introduced into the carbon/carboncomposites in two
stages, first by spraying in different concentrations (0.5wt%, 1.5wt%, 3wt%, 5wt %) dur-
iv
ing the prepreg formation and later during densification by directly mixing in the corre-
sponding densification mix. The manufactured NGP reinforced CCC were characterized
for microstructure, porosity, bulk density and mechanical properties (Flexure and ILSS)
which were further cross-checked by non-destructive techniques (vibration and ultrason-
ic).
In this study, it was further found that at low concentration (≤1.5 wt%) NGP were
more effective in increasing the heat of reaction and in decreasing the viscosity of the
phenolic resin. The decrease in viscosity led to better wetting properties of NGP / phenol-
ic dispersions compared to VGCNF/phenolic dispersions. In nanocomposites, at low
concentration (≤ 1.5 wt%), NGP were effective in increasing the flexure strength, char
content and lowering the porosity and coefficient of thermal expansion of neat phenolic
resin. At higher concentration (>1.5wt%), NGP had a tendency to agglomerate and lost
their effectiveness. The behavior observed in nanocomposites continued in manufactured
CCC. The highest Inter Laminar Shear Strength (ILSS), flexure strength/modulus, stiff-
ness and density was observed at 1.5 wt% NGP. In CCC at concentrations > 1.5 wt%,
the properties (ILSS, flexure, stiffness, density) decreased due to agglomeration but they
were still higher compared to that of neat CCC (without NGP).
Keywords: Carbon/carboncomposites, Nanographene Platelets, Vapor Grown Carbon
nanofibers
v
DEDICATION
To my family for their constant support and guidance
vi
ACKNOWLEDGMENTS
This work is the result of contributions from many people. I am extremely thank-
ful to Dr. Pillay and Dr. Vaidya for their constant support and guidance. They kept be-
lieving in my abilities and encouraged me as I matured into my research.
I am indebted to Dr. Dean for his insight into polymer research, access to polymer
lab and serving on my committee. I am also grateful to my committee members Dr. Shih
and Dr. Weaver for their support and agreeing to be part of this work.
Words of special thanks to Dr. Ning, Dr. Parthasarathy and Andy Grabany for
equipment training and research-related suggestions. I am thankful to Dr. Foley for help-
ing in conducting SEM studies and to Dr. Chawla for providing research counsel. Much
thanks to Preston R Beck from School of Dentistry, UAB, for helping in wettability and
nanoindentation studies. I am thankful to MSE faculty and staff for their constant availa-
bility and help whenever needed.
I am grateful to my composite research group members for being my family and
being very cooperative, specially Eric, Pete, John & Dan, for their help in brainstorming
and discussions. I would like to express gratitude towards the Polymer research group,
especially John Tipton for equipment training and suggestions.
I must also thank Shahid Quereshi from Georgia Pacific for providing phenolic
resin and Applied Sciences, Columbus, Ohio, for supplying Vapor Grown Carbon Nano
Fibers.

vii
I feel obliged to Dr. Mahesh Hosur for providing the support through NSF Exper-
imental Program to Stimulate Competitive Research (EPSCoR) – Alabama Center for
Nanostructured Materials (ACNM). NSF EPSCoR RII Grant number 1158862.
Lastly, I would like to thank my family and friends for their constant support and
encouragement.
viii
TABLE OF CONTENTS
page
ABSTRACT .................................................................................................................. iii
DEDICATION ................................................................................................................v
ACKNOWLEDGMENTS ............................................................................................. vi
TABLE OF CONTENTS ............................................................................................ viii
LIST OF TABLES ..........................................................................................................x
LIST OF FIGURES ....................................................................................................... xi
LIST OF ABBREVATIONS .........................................................................................xv
1. INTRODUCTION .......................................................................................................1
1.1 Carbon/Carbon composites ....................................................................................1
1.2 Incorporation of Micro-Nano carbon fillers in carbon/carboncomposites.............3 1.3 Nanographene Platelets (NGP’s) as carbon nanofilles ..........................................4
1.3.1 Introduction .................................................................................................4
1.3.2 Properties of NGP’s ....................................................................................6
1.3.3 Manufacturing of NGP ................................................................................7 1.3.4 Applications of Nanographene ....................................................................8
1.4 Objectives ............................................................................................................14
1.4.1 Objective 1 ................................................................................................14 1.4.2 Objective 2 ................................................................................................14
1.4.3 Objective 3 ................................................................................................14
2. EXPERIMENTAL ....................................................................................................15
2.1 Materials ..............................................................................................................15 2.2 Methods ................................................................................................................15
2.2.1 Dispersion of VGCNF/NGP in phenolic resin ..........................................15
2.2.2 Materials and manufacturing of nanocomposites .....................................16 2.2.3 NGP sprayed pre-preg formation ..............................................................16 2.2.4 Curing of pre-preg by applying pressure and heat/As-cured stage ...........17 2.2.5 Carbonization or formation of carbon/carboncomposite. .........................17
2.2.6 Densification with dispersions of different concentrations of
NGP/Phenolic dispersions .......................................................................17
2.3 Testing ..................................................................................................................18
2.3.1 DSC, Rheometery and Contact Angle Measurement of the
Dispersions ..............................................................................................18
ix
2.3.2 TMA, TGA and Porosity testing ...............................................................19
2.3.3 Microscopy, Scanning Electron Microscopy (SEM), X-Ray
Diffraction (XRD) and Fourier Transform Infra-Red Spectra (FT-
IR) ............................................................................................................19
2.3.4 ILSS and Flexure testing ...........................................................................20 2.3.5 Non-Destructive testing – ultrasonic through transmission and
vibration testing .......................................................................................21
3. ORGANIZATION OF WORK ....................................................................................22
PROCESSING AND CHARACTERIZATION OF NANOGRAPHENE
PLATELETS MODIFIED CARBON/CARBONCOMPOSITES (PRECURSOR
PHENOLIC RESIN-PART I) .......................................................................................23
PROCESSING AND CHARACTERIZATION OF NANOGRAPHENE
PLATELETS MODIFIED CARBON/CARBONCOMPOSITES (PRECURSOR
PHENOLIC RESIN-PART II) ......................................................................................45
NANOGRAPHENE REINFORCED CARBON/CARBONCOMPOSITES ................72
GENERAL SUMMARY AND CONCLUSIONS ......................................................106
GENERAL LIST OF REFERENCES .........................................................................110
x
LIST OF TABLES
Table Page
PROCESSING AND CHARACTERIZATION OF NANOGRAPHENE
PLATELETS MODIFIED CARBON/CARBONCOMPOSITES (PRECURSOR
PHENOLIC RESIN-PART II)
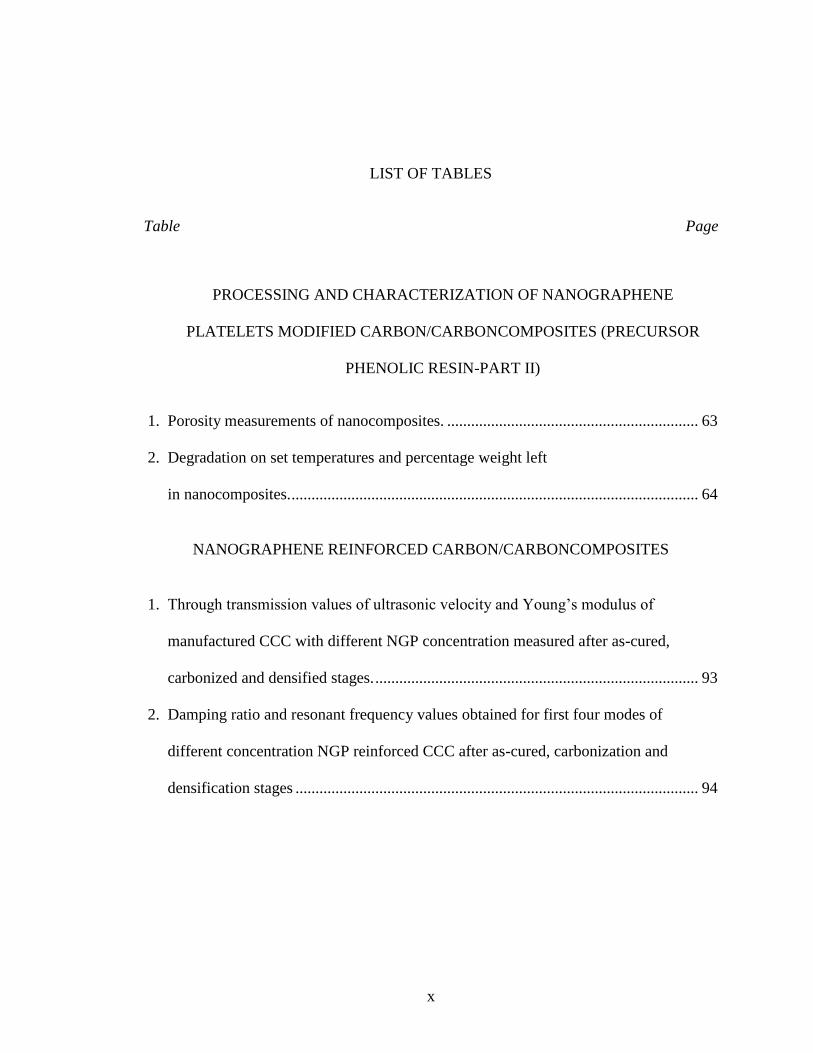
1. Porosity measurements of nanocomposites. ............................................................... 63
2. Degradation on set temperatures and percentage weight left
in nanocomposites. ...................................................................................................... 64
NANOGRAPHENE REINFORCED CARBON/CARBONCOMPOSITES
1. Through transmission values of ultrasonic velocity and Young’s modulus of
manufactured CCC with different NGP concentration measured after as-cured,
carbonized and densified stages. ................................................................................. 93
2. Damping ratio and resonant frequency values obtained for first four modes of
different concentration NGP reinforced CCC after as-cured, carbonization and
densification stages ..................................................................................................... 94
xi
LIST OF FIGURES
Figure Page
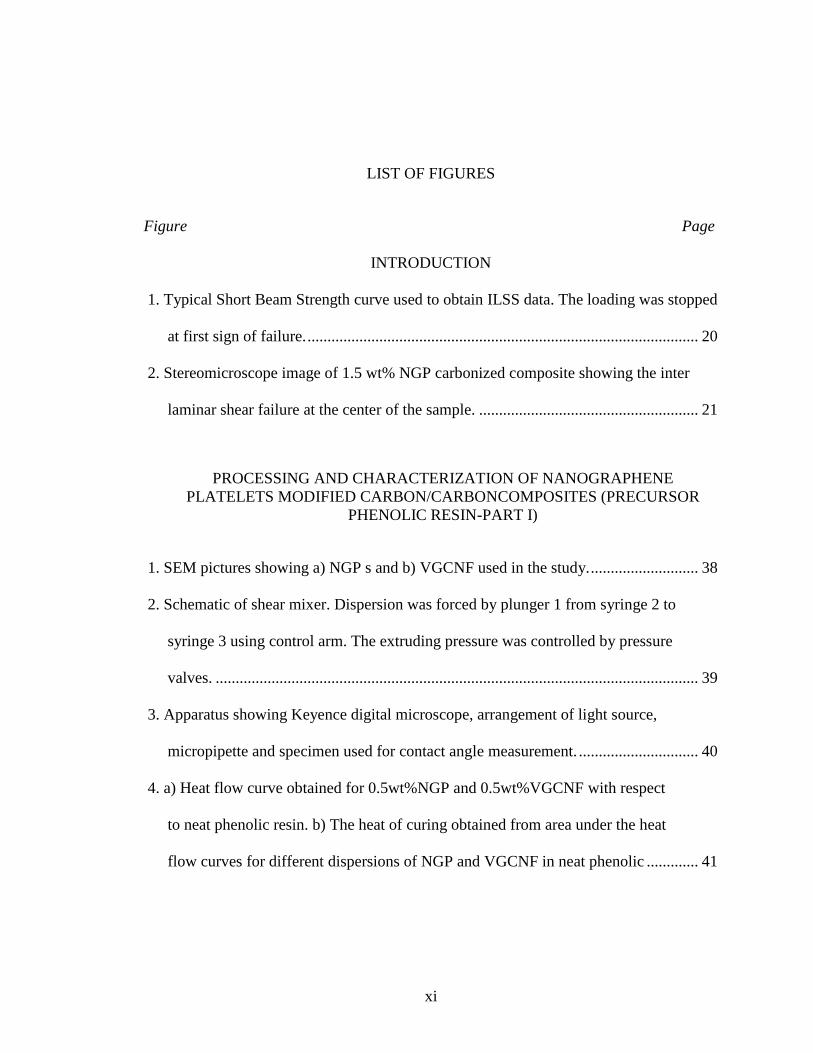
INTRODUCTION
1. Typical Short Beam Strength curve used to obtain ILSS data. The loading was stopped
at first sign of failure. .................................................................................................. 20
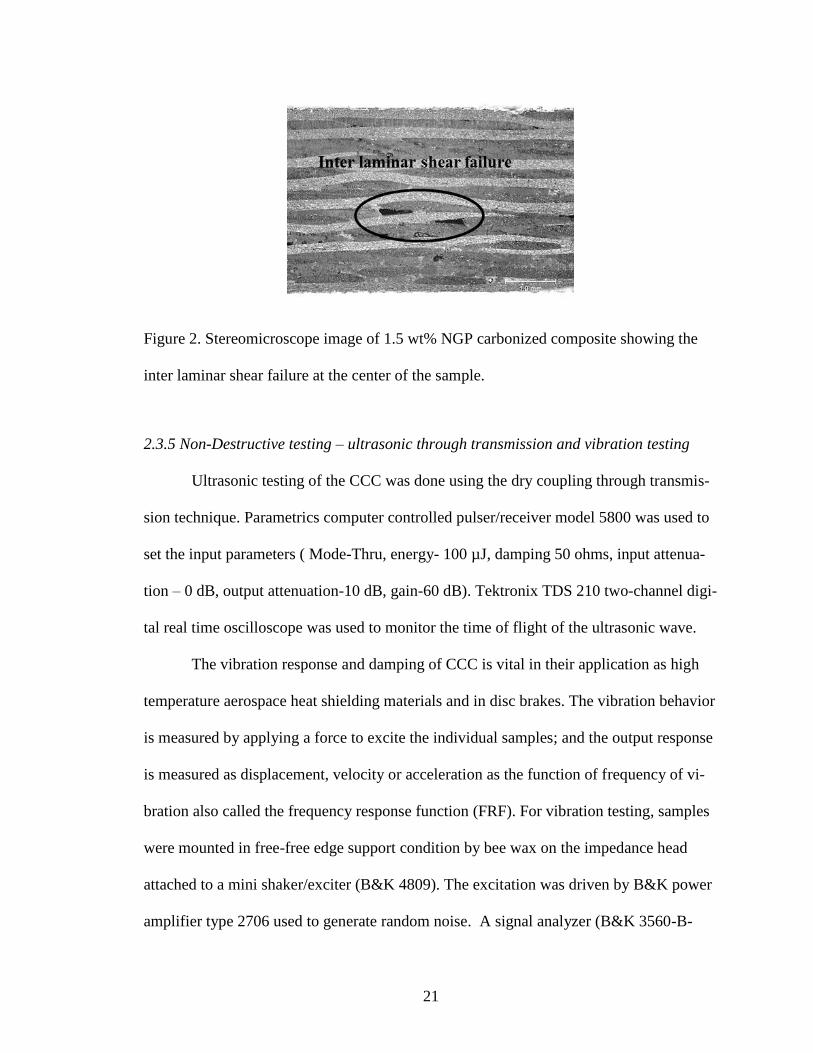
2. Stereomicroscope image of 1.5 wt% NGP carbonized composite showing the inter
laminar shear failure at the center of the sample. ....................................................... 21
PROCESSING AND CHARACTERIZATION OF NANOGRAPHENE
PLATELETS MODIFIED CARBON/CARBONCOMPOSITES (PRECURSOR
PHENOLIC RESIN-PART I)
1. SEM pictures showing a) NGP s and b) VGCNF used in the study. ........................... 38
2. Schematic of shear mixer. Dispersion was forced by plunger 1 from syringe 2 to
syringe 3 using control arm. The extruding pressure was controlled by pressure
valves. ......................................................................................................................... 39
3. Apparatus showing Keyence digital microscope, arrangement of light source,
micropipette and specimen used for contact angle measurement. .............................. 40
4. a) Heat flow curve obtained for 0.5wt%NGP and 0.5wt%VGCNF with respect
to neat phenolic resin. b) The heat of curing obtained from area under the heat
flow curves for different dispersions of NGP and VGCNF in neat phenolic ............. 41
xii
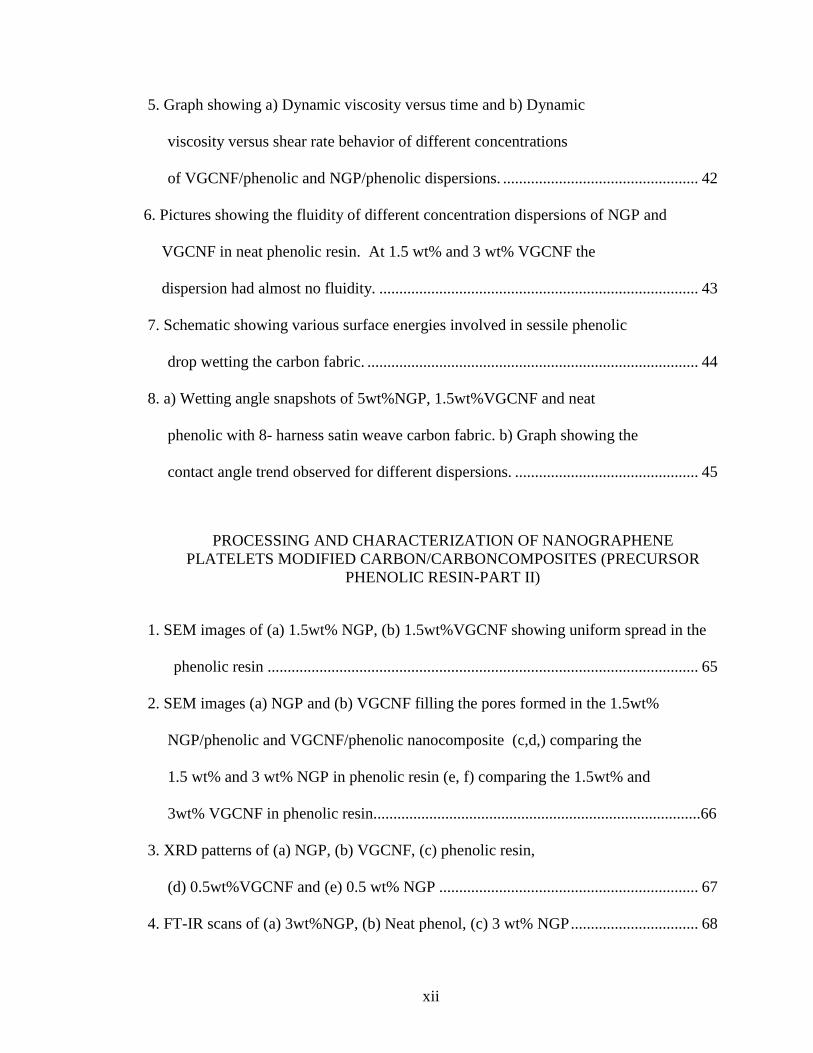
5. Graph showing a) Dynamic viscosity versus time and b) Dynamic
viscosity versus shear rate behavior of different concentrations
of VGCNF/phenolic and NGP/phenolic dispersions. ................................................. 42
6. Pictures showing the fluidity of different concentration dispersions of NGP and
VGCNF in neat phenolic resin. At 1.5 wt% and 3 wt% VGCNF the
dispersion had almost no fluidity. ................................................................................ 43
7. Schematic showing various surface energies involved in sessile phenolic
drop wetting the carbon fabric. ................................................................................... 44
8. a) Wetting angle snapshots of 5wt%NGP, 1.5wt%VGCNF and neat
phenolic with 8- harness satin weave carbon fabric. b) Graph showing the
contact angle trend observed for different dispersions. .............................................. 45
PROCESSING AND CHARACTERIZATION OF NANOGRAPHENE
PLATELETS MODIFIED CARBON/CARBONCOMPOSITES (PRECURSOR
PHENOLIC RESIN-PART II)
1. SEM images of (a) 1.5wt% NGP, (b) 1.5wt%VGCNF showing uniform spread in the
phenolic resin ............................................................................................................ 65
2. SEM images (a) NGP and (b) VGCNF filling the pores formed in the 1.5wt%
NGP/phenolic and VGCNF/phenolic nanocomposite (c,d,) comparing the
1.5 wt% and 3 wt% NGP in phenolic resin (e, f) comparing the 1.5wt% and
3wt% VGCNF in phenolic resin..................................................................................66
3. XRD patterns of (a) NGP, (b) VGCNF, (c) phenolic resin,
(d) 0.5wt%VGCNF and (e) 0.5 wt% NGP ................................................................. 67
4. FT-IR scans of (a) 3wt%NGP, (b) Neat phenol, (c) 3 wt% NGP ................................ 68
xiii
5. CTE of NGP/VGCNF filled phenolic nanocomposites measured from
(a) 600C to 80
0C (b) 100
0C to 120
0C .......................................................................... 69
6. Plot showing TGA weight loss curves for different nanocomposites.......................... 71
7. (a) Flexural strength and (b) Flexural modulus of NGP /phenolic and
VGCNF/phenolic upto the filler content of 3 wt%. ..................................................... 70
NANOGRAPHENE REINFORCED CARBON/CARBONCOMPOSITES
1. Schematic showing processing steps of carbon/carbon composites ............................ 95
2. (a) Stereomicroscope picture of sprayed NGP on satin carbon weave ply.
(b) SEM image of sprayed NGP’s on carbon fabric ................................................... 96
3. Carbonization cycle adopted to carbonize CCC. ........................................................ 97
4. Stereomicroscope pictures of different concentration NGP CCC at as-cured,
carbonized and densified stage. .................................................................................. 98
5. Bar graph showing (a) bulk density and (b) porosity measurements of C/C composites
infused with different concentrations of NGP at three stages of manufacturing ........ 99
6. SEM images of CCC infused with NGP at different stages ...................................... 100
7. Flexural modulus - strength (a,b) and ILSS (c) measurements of C/C composites
infused with different concentrations of nanographene platelets after as-cured,
carbonization and densification stage. ...................................................................... 101
8. Through transmission ultrasonic wave output for 0.5 wt% NGP CCC after as-cured,
carbonized and densified stages. Ultrasonic waves dampened in intensity after
carbonization and reappeared after densification. .................................................... 102
xiv
9. General trend observed in vibration response of manufactured CCC (a) with
processing stages (As-cured, carbonized and Densified). (b) with different NGP
concentrations. ............................................................................................................ 103
10. General trend observed in damping ratio of manufactured CCC with processing
stages (As-cured, carbonized and Densified) ............................................................ 104
11. The effect of increasing NGP concentration on damping ratio/resonance
frequency of the manufactured CCC after (a) As-cured, (b) Carbonized and (c)
Densified stages ........................................................................................................ 105
xv
LIST OF ABBREVATIONS
ADSA Axis Drop Shape Analysis
ACNM Alabama Center for Nanostructured Materials
CCC Carbon/carbonComposite
CNT Carbon Nano Tube
CTE Coefficient of Thermal Expansion
CVD Chemical Vapor Deposition
DSC Dynamic Scanning Calorimetery
EPSCoR Experimental Program to Stimulate Competitive Research
FRF Frequency Response Function
FRP Fire Retardant Plastics
FT-IR Fourier Transform Infrared spectra
HTHP High Temperature High Pressure
ILSS Inter Laminar Shear Strength
MPAD Material Processing and Applications Development
MWCNT Multi Walled Carbon Nano Tube
NGP Nano Graphene Platelet
QHE Quantum Hall Effect
SEM Scanning Electron Microscope
SWCNT Single Wall Carbon Nano Tube
TGA Thermo Gravimetric Analysis
xvi
TMA Thermal Mechanical Analysis
VARTM Vacuum Assisted Resin Transfer Molding
VGCNF Vapor Grown Carbon Nano Fiber
XRD X-Ray Diffraction
1
1. INTRODUCTION
1.1 Carbon/Carbon composites
Carbon/Carbon composites as the name signifies are made of carbon reinforce-
ment in a carbon matrix. These were initially developed for defense and space application
funded by the USA government [1]. They have unique properties of low density (1.6-2.0
gm cm-3
), low coefficient of thermal expansion, high thermal shock resistance, electric
conductivity, high strength, stiffness, wear, fatigue properties at high, non-oxidizing tem-
peratures (30000C) and bio-compatibility.
Due to their phenomenal properties they are used for high temperature applica-
tions like nose cones, heat shields and nozzles for rocket re-entry vehicles, and disc
brakes for aircrafts [2-4]. They also find use in diesel engine components, high tempera-
ture corrosion resistant fasteners, hot press dies and as guides in the glass industry. Car-
bon/Carbon composites are also used for bio-implants like hip joint replacement as they
are compatible with blood, soft tissues and bones. Electromagnetic, nuclear radiation
shielding and plates for fuel cell are also areas of application[5].
Since, there is a vast array for potential carbon/carbon composite applications the
properties have to be controlled accordingly. This is done by the proper selection of rein-
forcement, matrix and resulting microstructure. The carbon reinforcement could be in the
form of discrete fibers, unidirectional fibers, planar 2D or 3D preforms and multidimen-
sional structures. Similarly the matrix can be obtained by impregnating with thermoset or
thermoplastic precursors or by gas phase impregnation.
2
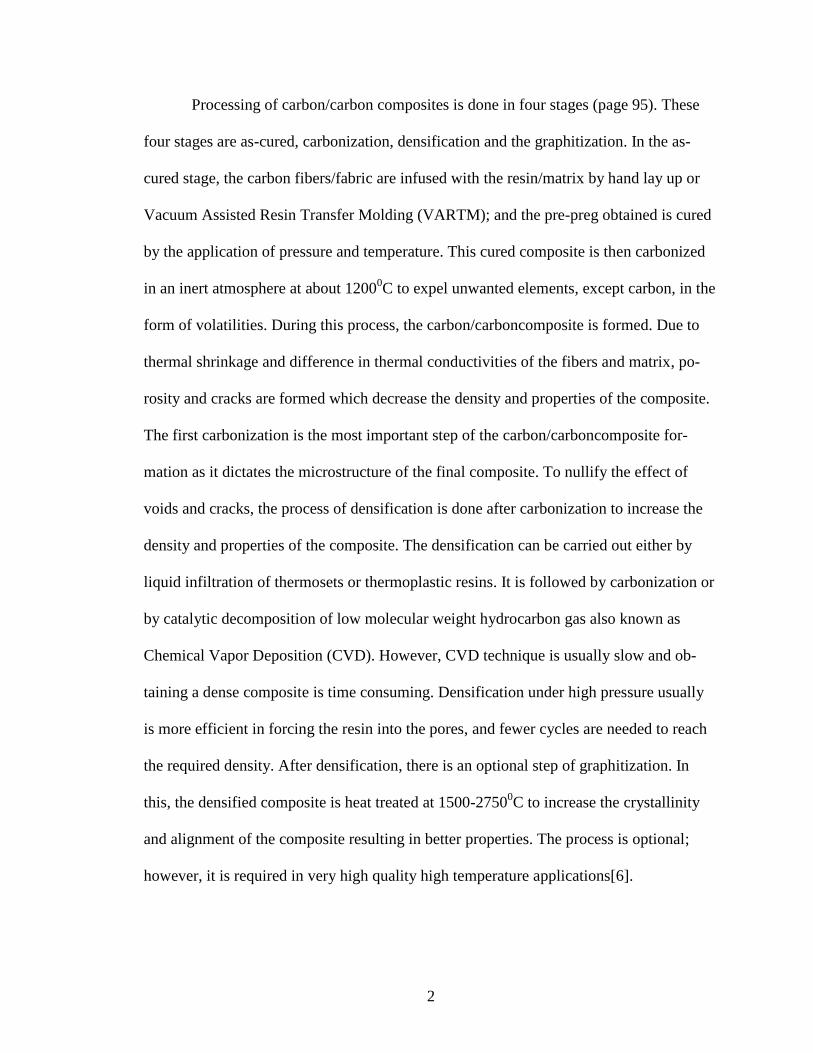
Processing of carbon/carbon composites is done in four stages (page 95). These
four stages are as-cured, carbonization, densification and the graphitization. In the as-
cured stage, the carbon fibers/fabric are infused with the resin/matrix by hand lay up or
Vacuum Assisted Resin Transfer Molding (VARTM); and the pre-preg obtained is cured
by the application of pressure and temperature. This cured composite is then carbonized
in an inert atmosphere at about 12000C to expel unwanted elements, except carbon, in the
form of volatilities. During this process, the carbon/carboncomposite is formed. Due to
thermal shrinkage and difference in thermal conductivities of the fibers and matrix, po-
rosity and cracks are formed which decrease the density and properties of the composite.
The first carbonization is the most important step of the carbon/carboncomposite for-
mation as it dictates the microstructure of the final composite. To nullify the effect of
voids and cracks, the process of densification is done after carbonization to increase the
density and properties of the composite. The densification can be carried out either by
liquid infiltration of thermosets or thermoplastic resins. It is followed by carbonization or
by catalytic decomposition of low molecular weight hydrocarbon gas also known as
Chemical Vapor Deposition (CVD). However, CVD technique is usually slow and ob-
taining a dense composite is time consuming. Densification under high pressure usually
is more efficient in forcing the resin into the pores, and fewer cycles are needed to reach
the required density. After densification, there is an optional step of graphitization. In
this, the densified composite is heat treated at 1500-27500C to increase the crystallinity
and alignment of the composite resulting in better properties. The process is optional;
however, it is required in very high quality high temperature applications[6].
3
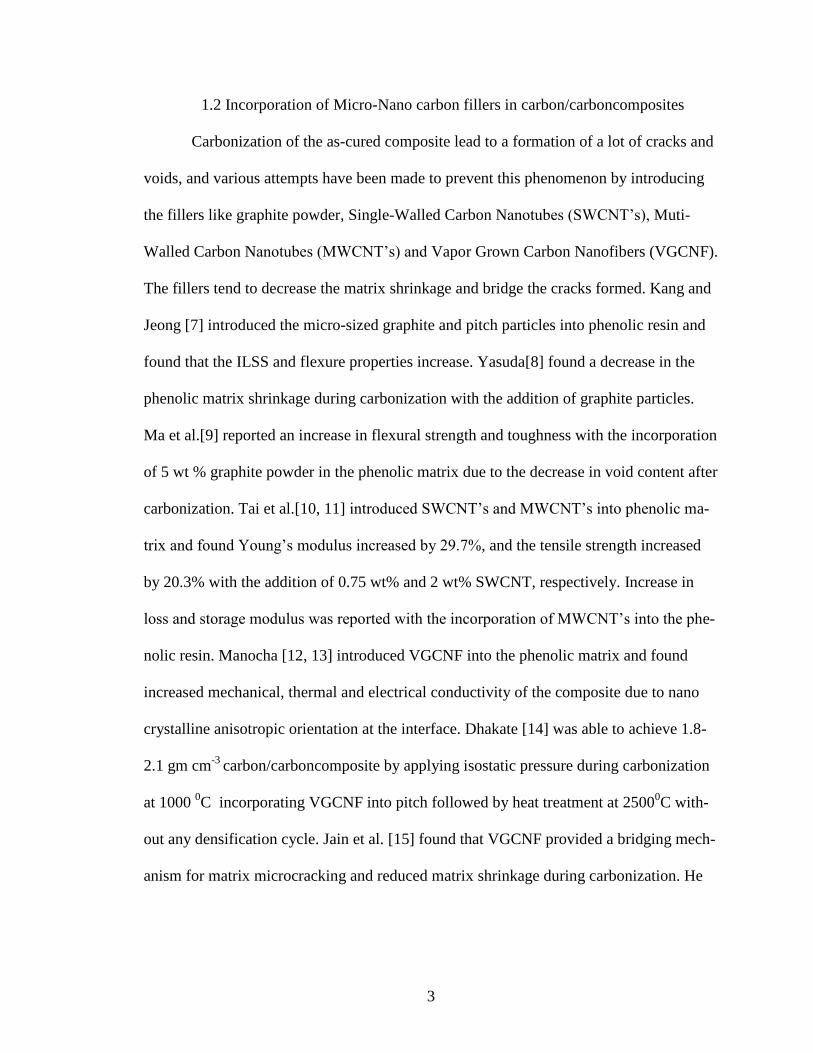
1.2 Incorporation of Micro-Nano carbon fillers in carbon/carboncomposites
Carbonization of the as-cured composite lead to a formation of a lot of cracks and
voids, and various attempts have been made to prevent this phenomenon by introducing
the fillers like graphite powder, Single-Walled Carbon Nanotubes (SWCNT’s), Muti-
Walled Carbon Nanotubes (MWCNT’s) and Vapor Grown Carbon Nanofibers (VGCNF).
The fillers tend to decrease the matrix shrinkage and bridge the cracks formed. Kang and
Jeong [7] introduced the micro-sized graphite and pitch particles into phenolic resin and
found that the ILSS and flexure properties increase. Yasuda[8] found a decrease in the
phenolic matrix shrinkage during carbonization with the addition of graphite particles.
Ma et al.[9] reported an increase in flexural strength and toughness with the incorporation
of 5 wt % graphite powder in the phenolic matrix due to the decrease in void content after
carbonization. Tai et al.[10, 11] introduced SWCNT’s and MWCNT’s into phenolic ma-
trix and found Young’s modulus increased by 29.7%, and the tensile strength increased
by 20.3% with the addition of 0.75 wt% and 2 wt% SWCNT, respectively. Increase in
loss and storage modulus was reported with the incorporation of MWCNT’s into the phe-
nolic resin. Manocha [12, 13] introduced VGCNF into the phenolic matrix and found
increased mechanical, thermal and electrical conductivity of the composite due to nano
crystalline anisotropic orientation at the interface. Dhakate [14] was able to achieve 1.8-
2.1 gm cm-3
carbon/carboncomposite by applying isostatic pressure during carbonization
at 1000 0C incorporating VGCNF into pitch followed by heat treatment at 2500
0C with-
out any densification cycle. Jain et al. [15] found that VGCNF provided a bridging mech-
anism for matrix microcracking and reduced matrix shrinkage during carbonization. He
4
reported the highest ILSS values of ∼40 MPa and 6 MPa at as-cured and carbonized
stages respectively with the addition of 2% VGCNF.
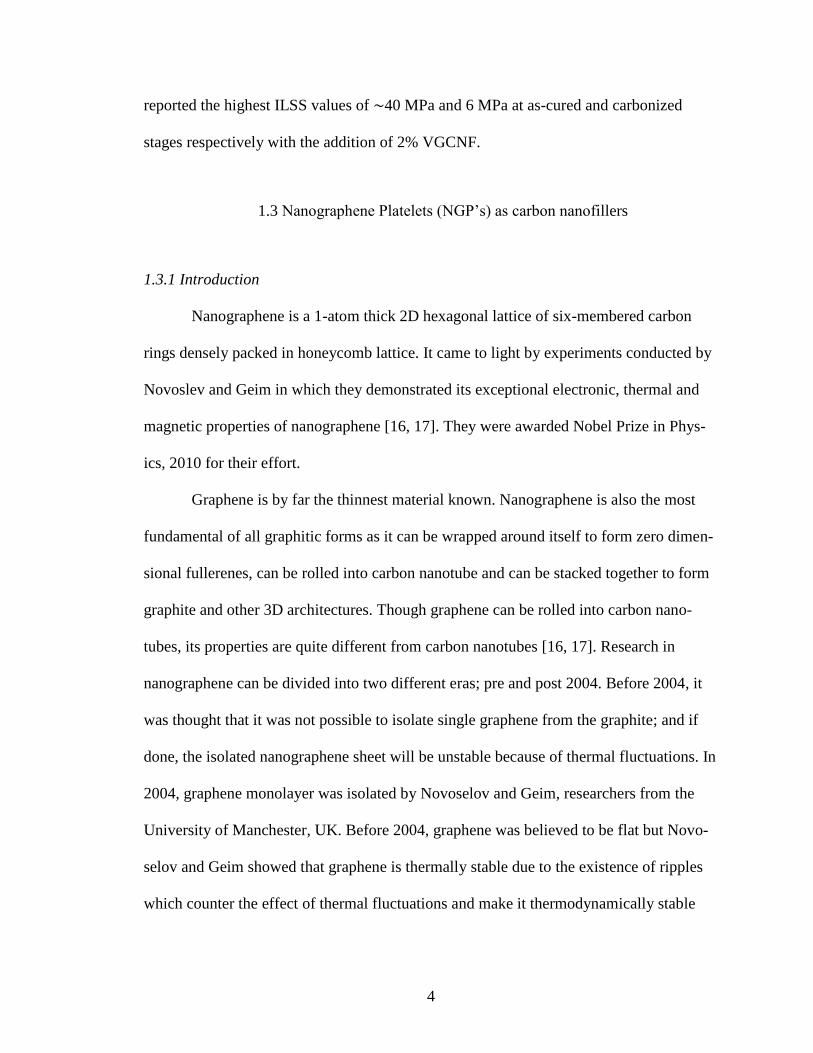
1.3 Nanographene Platelets (NGP’s) as carbon nanofillers
1.3.1 Introduction
Nanographene is a 1-atom thick 2D hexagonal lattice of six-membered carbon
rings densely packed in honeycomb lattice. It came to light by experiments conducted by
Novoslev and Geim in which they demonstrated its exceptional electronic, thermal and
magnetic properties of nanographene [16, 17]. They were awarded Nobel Prize in Phys-
ics, 2010 for their effort.
Graphene is by far the thinnest material known. Nanographene is also the most
fundamental of all graphitic forms as it can be wrapped around itself to form zero dimen-
sional fullerenes, can be rolled into carbon nanotube and can be stacked together to form
graphite and other 3D architectures. Though graphene can be rolled into carbon nano-
tubes, its properties are quite different from carbon nanotubes [16, 17]. Research in
nanographene can be divided into two different eras; pre and post 2004. Before 2004, it
was thought that it was not possible to isolate single graphene from the graphite; and if
done, the isolated nanographene sheet will be unstable because of thermal fluctuations. In
2004, graphene monolayer was isolated by Novoselov and Geim, researchers from the
University of Manchester, UK. Before 2004, graphene was believed to be flat but Novo-
selov and Geim showed that graphene is thermally stable due to the existence of ripples
which counter the effect of thermal fluctuations and make it thermodynamically stable
5
[16-19] . Later, Bernard and Snook also confirmed that the nanographene is thermally
stable[20].
Each single layer graphene has two atoms per unit cell. According to Marcel et
al. [21] nanographene, like CNT’s, exists in zigzag and armchair configuration. Zigzag
exhibit linear voltage current characteristics due to enhanced band gap with increasing
ribbon width. In the armchair configuration, the band gap decreases with increasing rib-
bon width giving it semiconductor-like characteristics.
Nanographene along with nanodiamond is of interest to scientist around the
world. It has high crystal and electronic quality because of its unusual electronic spec-
trum. Novoselov and Walt et al. [22, 23] exhibited room temperature fractional Quantum
Hall Effect (QHE) in graphene. Though mostly in condensed matter physics, the
Schrodinger equation determines the electronic properties of the material; but in the case
of nanographene, Novoselov showed that Dirac equations are applicable[17]. This hap-
pens because the interaction of the carbon atoms in nanographene with the periodic po-
tential of the honeycomb lattice give rise to quasiparticles or the Dirac fermions which at
low energy are described by (2+1) dimensional Dirac equations at low electron energy
and speed of light at 106 m/s. According to Novoselov, the energy of electron in graphene
is linearly dependent on the wave vector near the crossing points in the Brillouin zone.
Single layer nanographene has a surface area of 2600 m2/g and high mobility of charge
carriers. Even at high electric field-induced concentrations, it is unaffected by chemical
doping. This makes it a candidate for ballistic transistor and other multiple potential elec-
trical applications [17-19, 22].
6
1.3.2 Properties of NGPs
Nanographene has a wide array of properties ranging from low density, high spe-
cific strength, modulus, thermal-electrical conductivities and surface area. Another most
important factor is the cost; nanographene is a relatively inexpensive nanocarbon. Zhamu
et al. [24] compared the properties of nanographene platelets with vapor grown carbon
nanofibers and SWNT’s. They found that the nanographene have similar elastic modulus,
strength, in plane resistivity, magnetic susceptibility as SWCNT.
1.3.2.1. Magnetic and electrical properties.Rao et al. [25] reported that by vary-
ing the type and concentration of dopant the V-I characteristics of the nanographene can
be tailored. Electric property varies with the type of interacting molecule. If the interact-
ing molecule is electron donor like aniline or Tetrathiafulvalene (TTF), it will soften the
Raman G-band while electron acceptor molecules like nitrobenzene and tetracyanoeth-
ylene (TCNE) stiffens the G-band. In short, electron donor decreases the conductivity
whereas electron acceptor increases the conductivity of nanographene. Graphene oxide,
which is the intermediate product of producing graphene from graphite, has low thermal
and electrical conductivities compared to nanographene sheets[26].
Beside the dopants, electrical property also depends on nanographene edges.
Enoki et al. [27, 28] found that the zigzag edges of nanographene have nonbonding elec-
trons which give rise to edge states resulting in unpredictable magnetism. This includes
ferromagnetism, spin glass behavior and magnetic switching. They also found that
nanographene shows magnetic hysteresis at low temperature and physical adsorption of
molecules on the nanographene can cause change in electronic and magnetic phenome-
7
non. Thus, the magnetic and electric property on the NGP can be tailored by the nature of
the adsorbed molecule.
1.3.2.2. Mechanical, thermal and wetting properties. Different researchers con-
tributed in determining the mechanical and thermal properties of nanographene. Zhamu et
al. [24] reported 2600 m2/g surface area of single layer graphene. Lee et al. [29] reported
a Young’s modulus of 1 TPa, tensile strength of 130 GPa and termal conductivity be-
tween 3080-5150 W m-1
K-1
of single layer graphene. Balandin et al. [30, 31] found that
nanographene has negative thermal in plane expansion due to mutual cancelation of bond
stretching and bending effects. Wang et al. [32] reported that graphene oxide, which is
formed by oxidation of graphite is hydrophilic, and graphene itself is hydrophobic in na-
ture. Further, isolated graphene sheets are more difficult to wet compared to graphite.
Carpio et al. [33] reported two types of defects that are stable in graphene sheets.
These are glide and shuffle dislocations. Glide dislocation consist of heptagon–pentagon
pairs and shuffle consists of an octagon with a dangling bond. They found that compared
to CNT’s, Stone Wall Defects are unstable in graphene. Moreover, shuffle dislocations
can provide an alternative route to magnetize the graphene.
1.3.3 Manufacturing of NGP
According to Viculis et al. [34], the basic method for mass scale production of
nanographene begins by introducing an intercalant into the graphite followed by exfoliat-
ing the intercalated graphite by mechanical, thermal, electrical or chemical methods to
produce mass graphene layers having the desired morphology and functionalities. NGP
can be manufactured by many methods. First, the micromechanical cleavage or Scotch
8
tape method, was used by Novoselov and Geim to isolate graphene from graphite[18]. In
this method layer by layer of graphene is peeled off by sticking graphite to the tape. Next,
Walt et al. [23] used the vapor phase synthesis or thermal decomposition of SiC, which
evaporates the silicon and leaves behind epitaxial single and bi-layer graphene. Yet an-
other method, chemical vapor decomposition, can be utilized to grow graphene sheets.
Wang et al. [35] decomposed methane gas using cobalt supported magnesium dioxide at
10000C in argon atmosphere. Parvizi et al. [36] showed that high temperature high pres-
sure growth process (HTHP) can also be used to synthesize graphene platelets by dissolv-
ing carbon from natural graphite using molten Fe-Ni catalysts to form graphene mono-
layer. Finally, the most widely preferred method for obtaining mass scale graphene is by
reduction of graphite oxide to graphene layers.
Shen and Geng et al. [37, 38] reported that the most common method to manufac-
ture nanographene is by oxidation of graphene oxide to graphene layers by hydrazine. In
this work, they oxidized the graphite by concentrated nitric acid, sulfuric acid and potas-
sium chlorate for 5 days at room temperature that resulted in graphene oxide. This gra-
phene oxide was further exfoliated by a sudden thermal shock in a quartz tube at 1050 0C
in an argon atmosphere and resulted in graphene monolayers.
1.3.4 Applications of Nanographene
Katsnelson and Hou et al. [39, 40] reported that graphene can be used in making
superconducting Field Effect transistors due to its possession of ballistic charge carriers.
Schwierz [41] proposed that graphene could replace silicon transistors by making gra-
phenium transistors due to its superior heat dissipation properties which enable a larger
number of transistors to operate at higher speed without the risk of overheating. Park and
9
Liang et al. [42, 43] have found its use in organic solar cells and infrared actuators.
Geim[16] also reported that graphene can be used in making conducting plastics with
loading percentage less than 1%. Liang and Liu et al. [44, 45] reported that graphene has
replaced carbon nanotubes in high performance batteries for better efficiency as the nano-
tubes are expensive. Graphene is also used in gas and bio sensors. Geim and Schedin [46]
reported that graphene can detect molecules like H2O, NO2, NH3 and CO just like CNT’s
but can absorb large amounts comparatively owing to its larger surface area. Therefore,
graphene finds its use in gas masks and nanomembranes [47]. According to Anupama et
al. [48], this gas absorption increases with increasing temperature, pressure and surface
area of graphene. Further variation in graphene-based sensor properties can be tailored by
selecting different dopants; as discussed earlier, it affects graphene’s electrical, thermal
and magnetic properties. In the field of fuel cell application, Jafri et al. [49] showed that
graphene helps in the oxygen reduction, hence, increasing the life of the fuel cell.
1.3.4.1. Graphene nanocomposites.It has been shown by various researchers [53-
87] that small concentrations of graphene (< 5%) increased thermal, electrical, mechani-
cal and magnetic properties in graphene-enhanced nanocomposites. It is one of the
cheapest methods to make plastics conductive. Almost all types of thermosets and ther-
moplastics have been studied after incorporating graphene nanoplatelets in them. Accord-
ing to Zhamu [24], there are three different methods to form nanocomposites using
nanographene. The first is to intercalate the monomer into the Graphene oxide sheets
followed by in-situ polymerization. It is easier to intercalate into the graphene oxide than
graphite because graphite has lower inter-layer spacing (0.3nm) compared to 0.6-1.1 nm
in graphene oxide. After the intercalation, the graphene oxide is reduced back to gra-
10
phene to form graphene/polymer composite. Viculis et al. [34] discussed various methods
to intercalate and exfoliate graphite. The second method to form graphene nanocompo-
sites is to dissolve the polymer in the nanographene dispersion; this includes composites
prepared by self-assembly. The third is to mix nanographene using shear in twin a screw
extruder or using ultrasonic energy.
Just like other nanofillers, the dispersion of graphene into the resin/solution is
necessary to obtain the uniform properties. This can be achieved mechanically by solid
state shear pulverization as shown by Katsuyuki et al. [50] or by dissolving in solvents
by covalent and non-covalent functionalization. Graphene can be functionalized by sigma
or pi bonds to tailor its properties or to make it dispersible in different solvents. Parades
et al. [51] found that amide functionalization makes graphene soluble in organic solvent
like carbon tetrachloride, tetrahydo furan and dichloromethane. He also found that the
reaction of graphite with concentrated nitric and sulfuric acid gives water soluble gra-
phene which is stable for a few months. Further, nanographene can be made water solu-
ble, for example, by wrapping graphene in polymers like polyethylene glycol by pi bond
interaction. Pramoda et al. [52] showed that graphene can be functionalized and covalent-
ly bonded to PMMA. Example of non-covalent bond interaction is with pyrene deriva-
tives; this enables graphene to be soluble in dimethylformamide. Many surfactants like
Igepal CO-890 (polyoxyethylene (40) nonylphenylether, IGP), Sodium Dodecylsulfate
(SDS) and Cetyltrimethylammoniumbromide (CTAB) gives water-soluble graphene by
non-covalent or pi–pi interactions. Dispersion of graphene has been investigated in many
organic solvents. Graphene oxide was found to be soluble in N-N Dimethylformamide,
N-Methyl-2-pyrrolidone, THF and ethylene glycol. Nanographene itself can also be used
11
as a dispersing agent. It can mechanically entrap the metal nanoparticles and can facilitate
in their bonding or contact with the polymer[26].
Several polymers have been used to make nanocomposites by in-situ polymeriza-
tion technique. This includes PVA, polyacrylamide, polyacrylic acid and polyvinyl ace-
tate [53-55]. Those manufactured by self-assembly technique include poly (ethylene ox-
ide), polyelectrolyte and polydiallyldimethylammonium chloride (PDDA) [56-59]. The
most widely researched graphene/polymer systems include polystyrene [60-62], Poly-
methylmethacrylate [63-65], high and low density polyethylene[66-69], nylon [70],vinyl
ester [71], polypropylene [72-76], epoxy [77-82], paraffin [83], poly(vinylidene fluo-
ride)[84], ethylene vinylacetate [85] and poly (arylene disulfide)[86]. The basic principle
followed in these studies was to intercalate the polymer into the graphene oxide followed
by exfoliation. The percolation threshold observed for electrical conductivity in these
studies was < 0.5wt% in PMMA, <1wt% in nylon and <1-2.5wt% in polystyrene. Mo-
hammad [79] found that thermosets, like epoxy systems, graphene/epoxy nanocomposites
completely outperform SWCNT’s-MWCNT’s/epoxy nanocomposites in terms of me-
chanical properties like Young’s modulus, tensile strength, fracture toughness and fatigue
resistance. He attributes this behavior to graphene’s larger specific surface area, enhanced
epoxy-graphene adhesion due to graphene’s rough surface and its 2D planar geometry.
However, Yu [81, 82] found that with 25 vol% addition of graphene into epoxy the ther-
mal conductivity raised about 3000% to 6.44 W/mK, which is much higher compared to
the conductivity obtained by incorporating graphitic microparticles, SWCNT’s and car-
bon black. The reason cited was the decrease in the thermal interface resistance because
of high aspect ratio, stiffness, 2-D flat geometry of the nanographene. Asma [77] also
12
reported the increase in mechanical properties including increase in storage and glass
transition temperature but decrease in co-efficient of thermal expansion due to rigidity of
graphene. Wang [80] also reported an increase in thermal conductivity and decrease in
thermal expansion co-efficient with increasing nanographene content. In thermoplastics
like Low and high molecular weight polyethylene, Drzal et al. [66-69] found that I-Zod
impact strength of NGP/HDPE (High Density Polyethylene) composites was 250% more
than nanocomposites formed by using carbon fibers, glass fibers and carbon black. In
Low Density Polyethylene (LDPE), increase in mechanical properties and thermal stabil-
ity was reported. Also, decrease in thermal expansion co-efficient with increasing nanog-
raphene content and a percolation threshold of around 12-15wt% for mechanical proper-
ties was reported. They further added that better dispersion and thermal stability was ob-
tained by using counter rotating twin screws. Similar findings were observed by Kalaitzi-
dou [73-76, 87] in polypropylene/nanographene system.
In the present work, Nanographene Platelets (NGP) were compared with Vapor
Grown Carbon Nanofibers (VGCNF) as a nanofiller for resol type phenolic resin. For
comparison, NGP and VGCNF were dispersed (0.5 wt%, 1.5 wt% and 3 wt%) in resole
type phenolic resin and were studied for their corresponding effect on curing, rheological
and wetting properties of neat phenolic resin. Subsequently, nanocomposites were manu-
factured by curing the dispersions and were characterized for microstructure and thermo-
mechanical properties.
Finally, CCC were manufactured with different concentrations (0.5 wt%,
1.5 wt%, 3 wt%, 5 wt%) of NGP to explore their suitability for crack filling and densifi-
cation. NGP were introduced first by spraying on desized/surfactant treated 8-harness
13
satin weave carbon fabric and later by immersing the carbonized composites in respective
NGP/phenolic resin dispersions under vacuum. The manufactured CCC were character-
ized for microstructure, porosity, Inter Laminar Shear Strength (ILSS), flexural, ultrason-
ic and damping behavior.
In general, the present work focuses on understanding the interaction of NGP with
phenolic/carbon fabric during the three stages (As-Cured, Carbonization and Densifica-
tion) of carbon/carboncomposite manufacturing. The effect of different concentrations of
NGP’s on microstructure at each stage of the composite formation will lead to optimizing
the mechanical properties of CCC with minimum NGP content and cost -efficient pro-
cessing technique.
14
1.4 Objectives
1.4.1 Objective 1
To explore NGP as potential nanofiller for CCC by comparing their dispersions in
resole type phenolic resin with the corresponding dispersions of VGCNF for effect on
curing, rheological and wetting properties of neat phenolic resin.
1.4.2 Objective 2
To compare nanocomposites of NGP/ Phenolic with corresponding nanocompo-
sites of VGCNF/Phenolic for the effect of nanofillers on the morphology, mechanical and
thermal behavior of neat phenolic resin.
1.4.3 Objective 3
To manufacture NGP reinforced CCC and characterize them for microstructure,
density and mechanical properties
15
2. EXPERIMENTAL
2.1 Materials
Resole type phenolic resin (GP 486G34) with catalyst (GP 4826C) (Supplier:
Georgia Pacific Resins, Inc.) was used as the matrix. 8-Harness satin weave carbon fabric
(Supplier: U.S Composites) with tow size of 6k and 0.44 mm thickness was used as the
reinforcement. Trition X-100(t-Octylphenoxypolyethoxyethanol) from Sigma Aldrich
was used as a surfactant. Commercial grade acetone was used to desize the fabric. N-N
Dimethlyformamide (DMF) anhydrous 99.8% from Sigma Aldrich used as a dispersing
medium. Nanographene platelets (N008-100-P-10) from Angstron Materials, Ohio with
1.4% atomic percentage of oxygen were used as filler having average x - y dimensions
less than 10 micrometer and z dimension between 50-100 nanometers. Pyrograf III-PR-
24-PS type VGCNF were obtained from Applied Sciences Inc., Ohio. The diameter of
VGCNF ranged from 60 to 150 nanometer and length from 30 to 100 micrometer.
2.2 Methods
2.2.1 Dispersion of VGCNF/NGP in phenolic resin
Different concentrations of NGP (0.5wt%, 1.5wt%, 3wt% and 5wt% ) and
VGCNF (0.5wt%, 1.5wt % and 3wt%) were dispersed in neat phenolic resin using an
ultrasonic processor and probe (GE750, serial number 32778C, 750 watts, 20 kHz) at
25% amplitude for 5 minutes each. The dispersions were maintained under a water bath
to keep the temperature below 450C to avoid premature curing. The nanofillers were fur-
ther dispersed with a high shear mixer by the extrusion process (page 39). The shearing
16
action took place when the dispersion was forced from a top syringe to the bottom sy-
ringe using the plunger. This process was repeated 50 times to ensure proper dispersion.
2.2.2 Materials and manufacturing of nanocomposites
The prepared dispersions were cured in a silicone mold to form 101.6 mm × 101.6
mm × 4mm nanocomposite plates. The curing was conducted from 500C to 90
0C at a rate
of 100C per hour for a total of 5 hours under 125 psi pressure using a Caver laboratory
press (Model C, serial number 31000-711).The temperature was raised to 1200C for 1
hour at 125 psi pressure for post curing. After post curing, the nanocomposite plates were
allowed to cool at room temperature under 125 psi pressure.
2.2.3 NGP sprayed pre-preg formation
Eight plies measuring 0.1524m × 0.1524m of 8-harness carbon satin fabric were
cut and desized using acetone (completely immersed) for 15 hours. This was followed by
12.5% v/v surfactant (Triton X-100) treatment in acetone for 24 hours. Surface-treated
fabrics were dried in air. The required weight of NGP per the desired concentration was
dispersed in DMF using Cole Palmer ultrasonic bath (Model 8852-34) for two intervals
of 7 minutes each. The dispersion ratio of 0.5 grams of NGP per 75 ml of DMF was
maintained. The prepared dispersion was sprayed on the eight fabric layers by means of
an air spray gun resulting in a fine uniform layer of NGP on the fabric plies. After spray-
ing, the wet sheets were dried in a recirculating air oven for 30 min at 1600C to evaporate
the DMF from the plies (boiling point of DMF is 1530C). NGP sprayed plies were used to
prepare a pre-preg by infusing the phenolic resin mixed with catalyst (ratio 100:8) using
17
the vacuum-assisted resin transfer molding (VARTM) technique. The composite was left
under vacuum for 24 hours to precure.
2.2.4 Curing of pre-preg by applying pressure and heat/As-cured stage
The prepreg formed was cured in a heated press by applying a pressure of 40 psi
and the temperature was varied from 600C to 90
0C at a rate of 10
0C per 2 hours. The cur-
ing was done slowly to avoid formation of large pores caused by the release of water
molecules.
2.2.5 Carbonization or formation of carbon/carboncomposite
The test specimens were cut into 80mm× 10mm× 4mm for flexure, 24mm × 8
mm × 4mm for ILSS and 150mm× 27mm× 4mm for ultrasonic and vibration testing.
The cut specimens were then carbonized in a tube furnace at a maximum temperature of
800 0C under inert conditions for a cycle time of approximately 18 hours. The carboniza-
tion step was necessary to remove the volatiles from the phenolic resin.
2.2.6 Densification with dispersions of different concentrations of NGP/Phenolic disper-
sions
Varying concentration dispersions of NGP (0.5 wt%, 1.5 wt%, 3 wt% and 5 wt%)
in phenolic were prepared using an ultrasonic probe and shear mixer. The prepared dis-
persions were then used to densify the respective NGP concentration carbonized compo-
site. The densification was done for 24 hours and CCC were cured under 25 mm Hg
vacuum at a heating rate of 400C to 140
0C with increments of 50
0C / 2 hours for a total of
4 hours.
18
2.3 Testing
2.3.1 DSC, Rheometery and Contact Angle Measurement of the Dispersions
As mentioned in objective 1, the curing behavior of dispersions with different
concentration of NGP/VGCNF in phenolic was obtained by conducting Dynamic Scan-
ning Calorimetery (DSC) scans using Q100 DSC (TA Instruments Inc, Delaware). The
temperature was ramped from 250C to 140
0C at the rate of 10
0C/min. The heat of curing
of dispersions was obtained by calculating the area under the corresponding curve. The
scans were carried in hermetically sealed aluminum pans with 50 mL/min nitrogen flow
rate.
Dynamic viscosity of the dispersions was measured at 250C using an AR2000
Rheometer (TA Instruments Inc. Delaware). Parallel plate geometry was used with
1000µm gap between the plates. A fixed weight of 1.25 grams was used for all the dis-
persions. Dynamic viscosity was measured in the oscillation mode and stepped flow
mode. In oscillation mode, the dynamic viscosity was measured as a function of time.
The control variables were 1% strain and 1 Hz angular frequency at 250C for 2 hours. In
the stepped flow mode, the dynamic viscosity was measured as a function of shear rate
ranging from 0.01 to100 s-1
.
Contact angle was measured between the formed dispersions and 8-harness sur-
factant treated (Trition-X-100), satin weave fabric (6k Tow size, 0.44mm thickness) us-
ing the apparatus shown on page 40. An Axis Symmetric Drop Shape Analysis (ADSA)
technique was used to measure contact angle by using a sessile drop. Images of the dis-
persion drop wetting the carbon fabric at different times were taken by Keyence VHX
600 series fully integrated digital microscope and contact angle measurements were done
19
by using the VHX series measuring software. The drop volume was 5µL and the drop
height was 5mm.
2.3.2 TMA, TGA and Porosity testing
Porosity was evaluated according to ASTM C20 using Mettler Toledo (Model
AG204) weighing balance, equipped with immersion density apparatus. Thermal Expan-
sion Coefficients of the cured nanocomposites was measured by Thermal Mechanical
Analyzer Q400 (TA Instruments Inc, Delaware). The specimens were cut to the size
10mm ×10mm × 4mm from the plates. The temperature was ramped from 250C to 150
0C
at 50C/min against a 0.8N force. They were then cooled from 150
0C to 25
0C at 5
0C/min
under liquid nitrogen to obtain the cooling curve.
The slope of the cooling curve was used to determine the thermal expansion coef-
ficient. The weight loss in the nanocomposites with increasing temperature was measured
by Thermogravimetric Analyzer (TGA 2950, TA Instruments Inc, Delaware). The tem-
perature ramp rate was 100C/min from 25
0C to 800
0C in nitrogen atmosphere purged at
50 mL/min.
2.3.3 Microscopy, Scanning Electron Microscopy (SEM), X-Ray Diffraction (XRD) and
Fourier Transform Infra-Red Spectra (FT-IR)
Stereo micrographs of the CCC at stages of as-cured, carbonization and densifica-
tion were taken using a Olympus Stemi SV II stereomicroscope. A Field Emission Scan-
ning Electron Microscope FEI-FEG 650 with 20 kV accelerating voltage was used to
study the morphology of the fractured nanocomposites. The fractured samples of nano-
composites were first sputter coated with gold-palladium to make them conductive. An
20
X-Ray Diffractometer SIEMENS –D500 with Copper tube (Cu Kα, λ= 0.154056 nm) and
graphite monochromater was used to do the diffraction studies on the nanocomposites.
The 2 Theta range was from 2.0 to 40.00 with step size of 0.02 and dwell time of 6 se-
conds. Fourier transform infra-red spectra with a resolution of 4cm-1
was carried out with
Nicolet 4700 in transmission mode at room temperature.
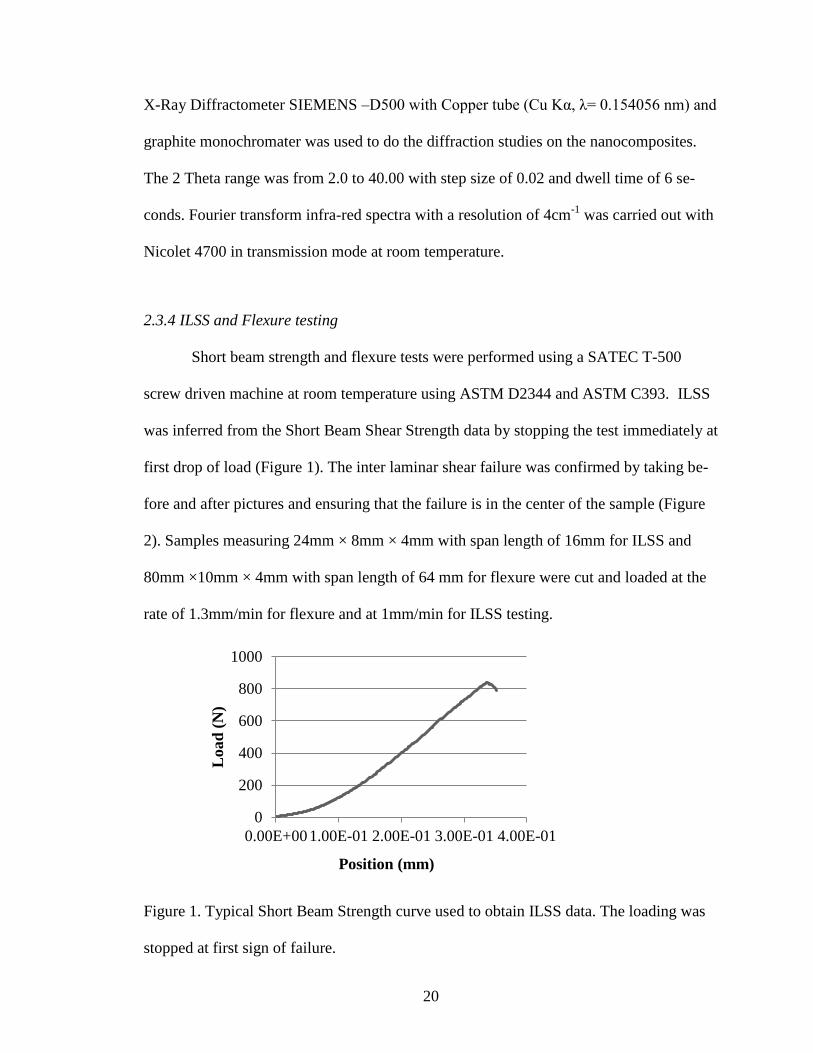
2.3.4 ILSS and Flexure testing
Short beam strength and flexure tests were performed using a SATEC T-500
screw driven machine at room temperature using ASTM D2344 and ASTM C393. ILSS
was inferred from the Short Beam Shear Strength data by stopping the test immediately at
first drop of load (Figure 1). The inter laminar shear failure was confirmed by taking be-
fore and after pictures and ensuring that the failure is in the center of the sample (Figure
2). Samples measuring 24mm × 8mm × 4mm with span length of 16mm for ILSS and
80mm ×10mm × 4mm with span length of 64 mm for flexure were cut and loaded at the
rate of 1.3mm/min for flexure and at 1mm/min for ILSS testing.
Figure 1. Typical Short Beam Strength curve used to obtain ILSS data. The loading was
stopped at first sign of failure.
0
200
400
600
800
1000
0.00E+001.00E-01 2.00E-01 3.00E-01 4.00E-01
Load
(N
)
Position (mm)
21
Figure 2. Stereomicroscope image of 1.5 wt% NGP carbonized composite showing the
inter laminar shear failure at the center of the sample.
2.3.5 Non-Destructive testing – ultrasonic through transmission and vibration testing
Ultrasonic testing of the CCC was done using the dry coupling through transmis-
sion technique. Parametrics computer controlled pulser/receiver model 5800 was used to
set the input parameters ( Mode-Thru, energy- 100 µJ, damping 50 ohms, input attenua-
tion – 0 dB, output attenuation-10 dB, gain-60 dB). Tektronix TDS 210 two-channel digi-
tal real time oscilloscope was used to monitor the time of flight of the ultrasonic wave.
The vibration response and damping of CCC is vital in their application as high
temperature aerospace heat shielding materials and in disc brakes. The vibration behavior
is measured by applying a force to excite the individual samples; and the output response
is measured as displacement, velocity or acceleration as the function of frequency of vi-
bration also called the frequency response function (FRF). For vibration testing, samples
were mounted in free-free edge support condition by bee wax on the impedance head
attached to a mini shaker/exciter (B&K 4809). The excitation was driven by B&K power
amplifier type 2706 used to generate random noise. A signal analyzer (B&K 3560-B-
22
140) was used to obtain a frequency response function from the measured force and ac-
celeration signals from the impedance head. The damping ratio was calculated using the
half power method.
3. ORGANIZATION OF WORK
The work in this dissertation is organized in three inter-related manuscripts consistent
with the three objectives mentioned in section 1.4.
A general introduction and literature review introduces the subject material and a
general summary and conclusion summarises the entire body of work.
Manuscript 1 compares the NGP with VGCNF as nanofillers for resole type phenolic
resin. Comparison is done by forming the dispersions of NGP and VGCNF in phenolic
resin in different concentrations by using the high shear mixer and ultrasonic probe. Later
these dispersions are tested for the effect on curing, rheological and wetting properties of
neat phenolic resin.
Manuscript 2 describes the formation of nanocomposites by curing the dispersions
made in manuscript 1 and characterizing them for the effect of nanofillers (NGP and
VGCNF) on the morphology, thermal and mechanical properties of neat phenolic resin.
Manuscript 3 lists the processing steps used for manufacturing NGP reinforced CCC
and the techniques used for their characterization.
23
PROCESSING AND CHARACTERIZATION OF NANOGRAPHENE
PLATELETS MODIFIED CARBON/CARBONCOMPOSITES (PRECURSOR
PHENOLIC RESIN-PART I)
by
DHRUV BANSAL, SELVUM PILLAY, AND UDAY VAIDYA
Submitted to Reinforced Plastics and Composites
Format adapted for dissertation
24
ABSTRACT
Nanographene platelets (NGP) have been explored as nanofillers for resole type
phenolic resin (GP 486G34) with catalyst (GP 4826C) supplied by Georgia Pacific Res-
ins. Previous studies have shown carbon nanofillers including single-walled carbon
nanotubes (SWCNT), vapor grown carbon nanofibers (VGCNF) and graphite powder are
shown to increase dimensional stability, carbon content and thermomechanical proper-
ties. In the present study, 0.5%, 1.5%, 3% and 5% by weight dispersions of NGP in phe-
nolic were compared to corresponding dispersions of vapor grown carbon nanofibers
(VGCNF) in phenolic resin to investigate the effect on curing reaction, rheological and
wetting behavior. A 0.5wt% NGP increased the heat of curing of neat phenolic by 33%
compared to 26% increase in 0.5wt% VGCNF. Due to the mechanism of inter-platelet
sliding of NGP, 0.5wt% NGP reduced the dynamic viscosity of phenolic resin by 48%
compared to that of neat resin after 1.5 hours at 1% strain rate. The lower viscosity of
0.5wt% NGP dispersion led to lower (200) contact angle compared to neat phenolic
(29.570) with 8- harness satin weave carbon fabric after 10 seconds of contact with the
fabric. Due to lower viscosity of NGP/phenolic dispersions and higher heat of curing,
NGP could be potential carbon nanofiller for densifying carbon/carboncomposites (CCC)
during manufacture.
1. INTRODUCTION
Nanographene is a 1 atom thick, two-dimensional (2D) hexagonal lattice of six
membered carbon rings densely packed in a honeycomb lattice1. It is the thinnest and
most fundamental of all graphitic forms. It can be wrapped around itself to form zero
25
dimensional fullerenes, can be rolled into carbon nanotube and can be stacked together to
form graphite and other 3 dimensional architectures1-5
. Nanographene with the desired
morphology and functionalities can be mass produced by introducing an intercalant into
the graphite followed by exfoliating the intercalated graphite by mechanical, thermal,
electrical or chemical methods6. Chemical vapor deposition
7, high temperature high pres-
sure growth process8 and reduction of graphene oxide
9 are other methods to obtain
nanographene platelets. Nanographene has a wide array of superior electrical and ther-
momechanical properties10, 11
and are comparable to the mechanical, thermal and electri-
cal properties of SWCNT12
. The extraordinary electrical, thermomechanical and gas bar-
rier properties of nanographene platelets are utilized in a variety of applications13
that
range from superconducting field effect transistors14
, actuators15
, high performance bat-
teries16
, gas/bio sensors17
to graphene nanocomposites18
.
Carbon/carboncomposites (CCC) are high temperature composite materials
known for their exceptional mechanical and thermal properties and are used in heat
shields for aircrafts, disc brakes and other areas of high performance high temperature
applications. The manufacturing process usually consists of four steps: as-cured, carboni-
zation, densification and graphitization. In the as–cured stage, a carbon/polymer prepreg
is cured to form a composite plate. This composite plate is then carbonized in an inert
atmosphere to drive off all elements from the system except for carbon, and thus form
CCC. The carbonized composite formed usually has poor mechanical properties because
of pores and voids formed due to the escape of volatiles. Thermal cracking also occurs
due to the difference in the expansion coefficient between the carbon reinforcement and
polymer. The material has to be densified with high char yield (pitch, phenol, or furfuryl
26
alcohol) resin due to the microcracking after carbonization. Subsequent carbonization is
conducted repeatedly to obtain desired density and mechanical properties19
. This repeated
densification and carbonization makes the manufacturing of CCC expensive.
Various researchers have added second phase carbon nanofillers (SWCNT, VGCNF) to
the phenolic resin for increasing thermo-mechanical properties, char yield and to fill
pores/cracks formed during carbonization20-22
. Since nanographene platelets have been
reported to have superior electrical and thermo-mechanical properties12
of all carbon
nanofillers, they have the potential to be used as nanofillers in the manufacturing CCC.
The high surface area of nanoplatelets can facilitate load transfer to the carbon rein-
forcement.
In this two-part study, nanographene platelets (NGP) were explored as nanofiller
for CCC by comparing them with vapor grown carbon nanofibers (VGCNF). In manu-
script one, dispersions (0.5 wt%, 1.5 wt% and 3 wt%) of NGP and VGCNF were made in
resole type phenolic resin. These compositions were studied for their corresponding ef-
fect on curing, rheological and wetting properties of neat phenolic resin. In manuscript
two, these dispersions were cured to form nanocomposites and characterized for micro-
structure and thermo-mechanical properties. The rationale of the two-part study was to
decipher the potential of NGP as carbon nanofillers for uncured and cured phenolic resin
used in manufacturing CCC.
27
2. EXPERIMENTAL
2.1 Materials
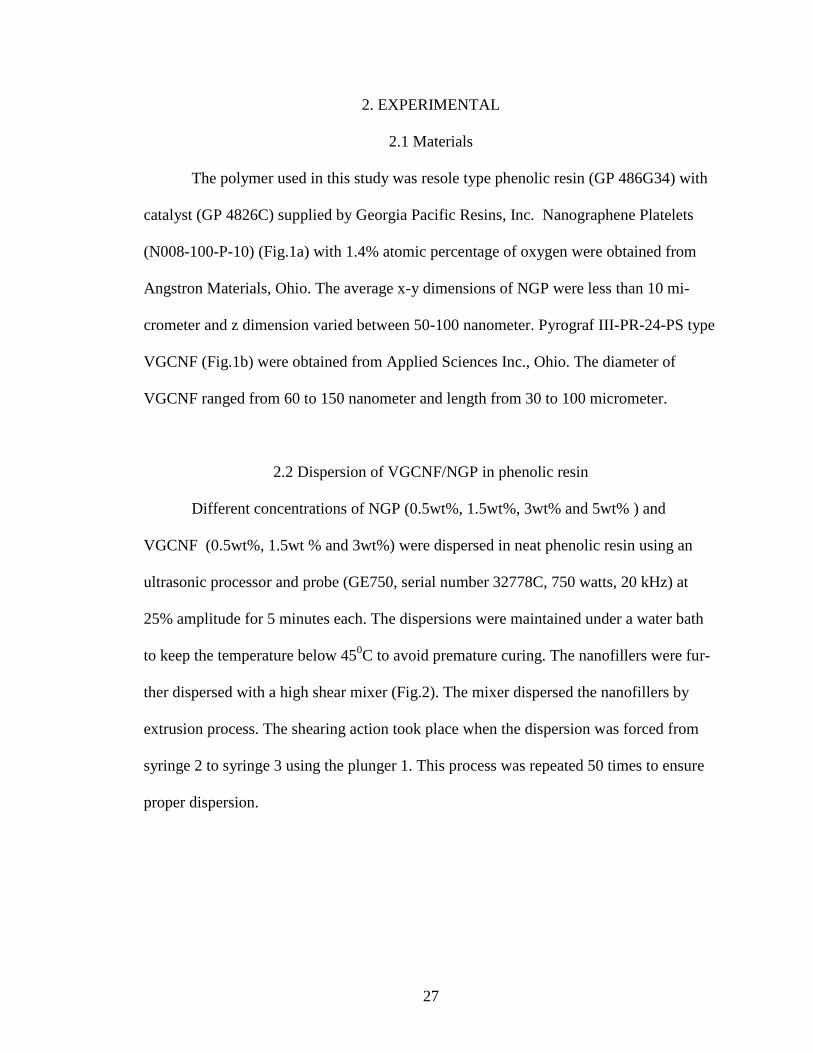
The polymer used in this study was resole type phenolic resin (GP 486G34) with
catalyst (GP 4826C) supplied by Georgia Pacific Resins, Inc. Nanographene Platelets
(N008-100-P-10) (Fig.1a) with 1.4% atomic percentage of oxygen were obtained from
Angstron Materials, Ohio. The average x-y dimensions of NGP were less than 10 mi-
crometer and z dimension varied between 50-100 nanometer. Pyrograf III-PR-24-PS type
VGCNF (Fig.1b) were obtained from Applied Sciences Inc., Ohio. The diameter of
VGCNF ranged from 60 to 150 nanometer and length from 30 to 100 micrometer.
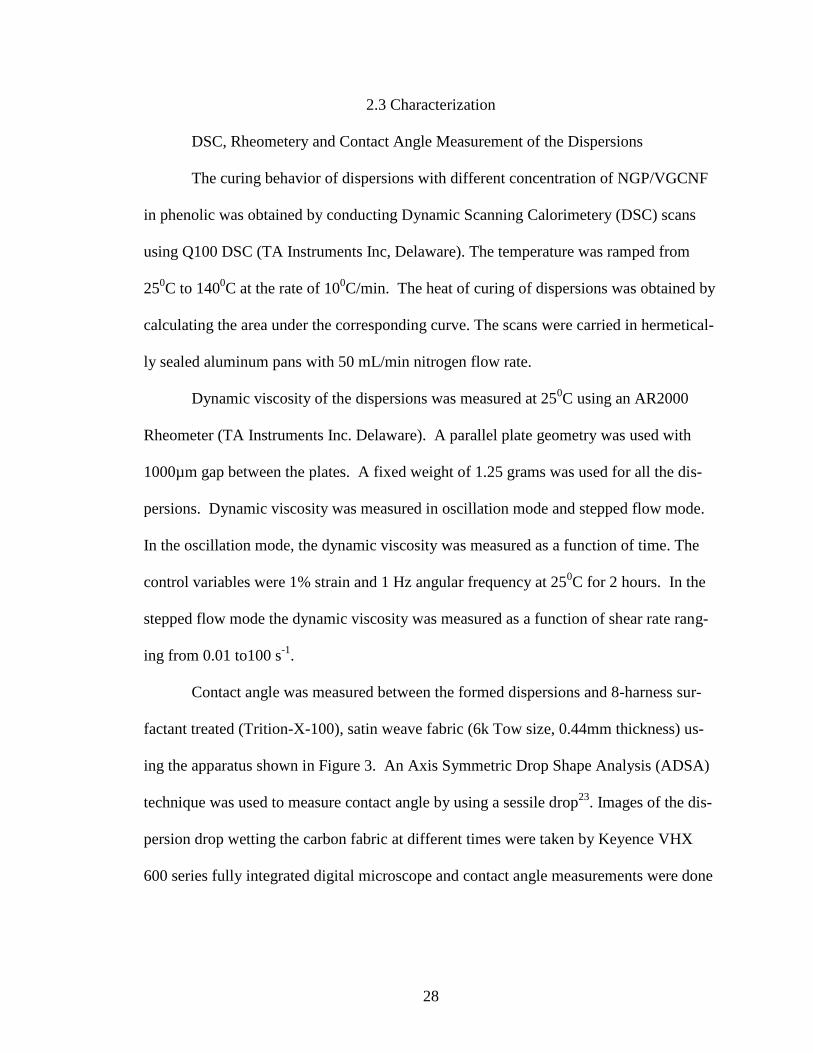
2.2 Dispersion of VGCNF/NGP in phenolic resin
Different concentrations of NGP (0.5wt%, 1.5wt%, 3wt% and 5wt% ) and
VGCNF (0.5wt%, 1.5wt % and 3wt%) were dispersed in neat phenolic resin using an
ultrasonic processor and probe (GE750, serial number 32778C, 750 watts, 20 kHz) at
25% amplitude for 5 minutes each. The dispersions were maintained under a water bath
to keep the temperature below 450C to avoid premature curing. The nanofillers were fur-
ther dispersed with a high shear mixer (Fig.2). The mixer dispersed the nanofillers by
extrusion process. The shearing action took place when the dispersion was forced from
syringe 2 to syringe 3 using the plunger 1. This process was repeated 50 times to ensure
proper dispersion.
28
2.3 Characterization
DSC, Rheometery and Contact Angle Measurement of the Dispersions
The curing behavior of dispersions with different concentration of NGP/VGCNF
in phenolic was obtained by conducting Dynamic Scanning Calorimetery (DSC) scans
using Q100 DSC (TA Instruments Inc, Delaware). The temperature was ramped from
250C to 140
0C at the rate of 10
0C/min. The heat of curing of dispersions was obtained by
calculating the area under the corresponding curve. The scans were carried in hermetical-
ly sealed aluminum pans with 50 mL/min nitrogen flow rate.
Dynamic viscosity of the dispersions was measured at 250C using an AR2000
Rheometer (TA Instruments Inc. Delaware). A parallel plate geometry was used with
1000µm gap between the plates. A fixed weight of 1.25 grams was used for all the dis-
persions. Dynamic viscosity was measured in oscillation mode and stepped flow mode.
In the oscillation mode, the dynamic viscosity was measured as a function of time. The
control variables were 1% strain and 1 Hz angular frequency at 250C for 2 hours. In the
stepped flow mode the dynamic viscosity was measured as a function of shear rate rang-
ing from 0.01 to100 s-1
.
Contact angle was measured between the formed dispersions and 8-harness sur-
factant treated (Trition-X-100), satin weave fabric (6k Tow size, 0.44mm thickness) us-
ing the apparatus shown in Figure 3. An Axis Symmetric Drop Shape Analysis (ADSA)
technique was used to measure contact angle by using a sessile drop23
. Images of the dis-
persion drop wetting the carbon fabric at different times were taken by Keyence VHX
600 series fully integrated digital microscope and contact angle measurements were done
29
by using the VHX series measuring software. The drop volume was 5µL and the drop
height was 5mm.
3. RESULTS AND DISCUSSION
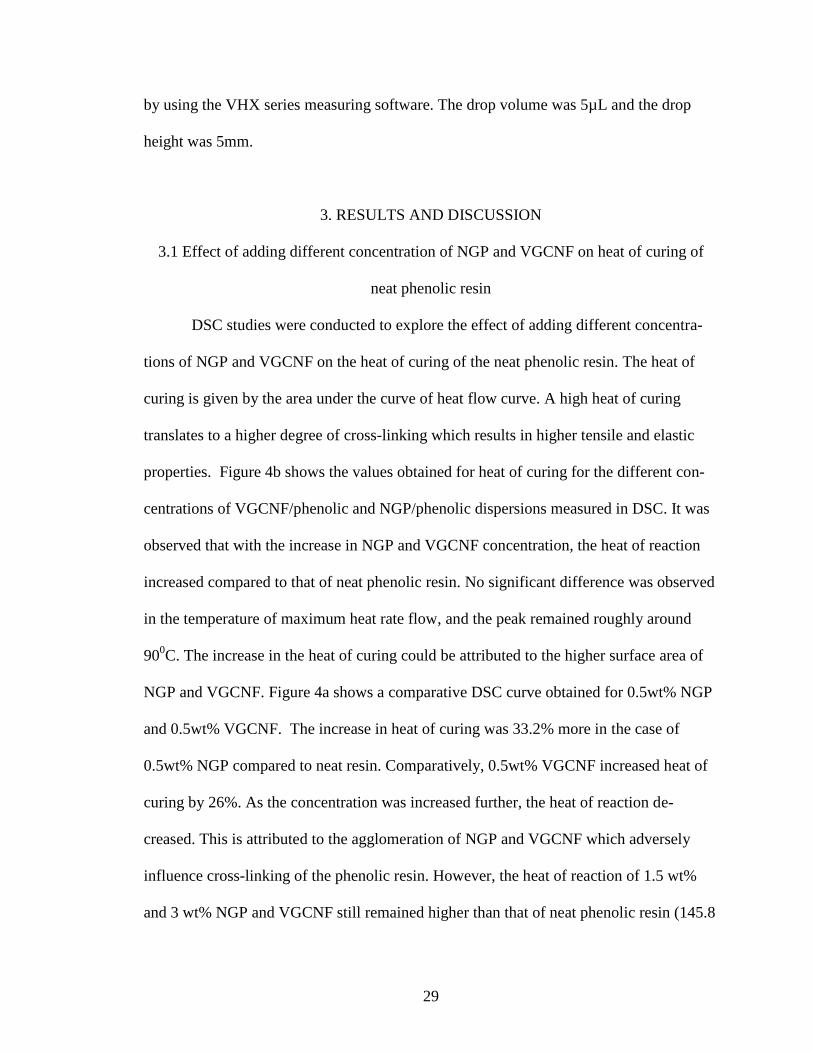
3.1 Effect of adding different concentration of NGP and VGCNF on heat of curing of
neat phenolic resin
DSC studies were conducted to explore the effect of adding different concentra-
tions of NGP and VGCNF on the heat of curing of the neat phenolic resin. The heat of
curing is given by the area under the curve of heat flow curve. A high heat of curing
translates to a higher degree of cross-linking which results in higher tensile and elastic
properties. Figure 4b shows the values obtained for heat of curing for the different con-
centrations of VGCNF/phenolic and NGP/phenolic dispersions measured in DSC. It was
observed that with the increase in NGP and VGCNF concentration, the heat of reaction
increased compared to that of neat phenolic resin. No significant difference was observed
in the temperature of maximum heat rate flow, and the peak remained roughly around
900C. The increase in the heat of curing could be attributed to the higher surface area of
NGP and VGCNF. Figure 4a shows a comparative DSC curve obtained for 0.5wt% NGP
and 0.5wt% VGCNF. The increase in heat of curing was 33.2% more in the case of
0.5wt% NGP compared to neat resin. Comparatively, 0.5wt% VGCNF increased heat of
curing by 26%. As the concentration was increased further, the heat of reaction de-
creased. This is attributed to the agglomeration of NGP and VGCNF which adversely
influence cross-linking of the phenolic resin. However, the heat of reaction of 1.5 wt%
and 3 wt% NGP and VGCNF still remained higher than that of neat phenolic resin (145.8
30
J/g). NGP dispersed phenolic resulted in higher heat of curing compared to VGCNF dis-
persed phenolic because of their higher surface area.
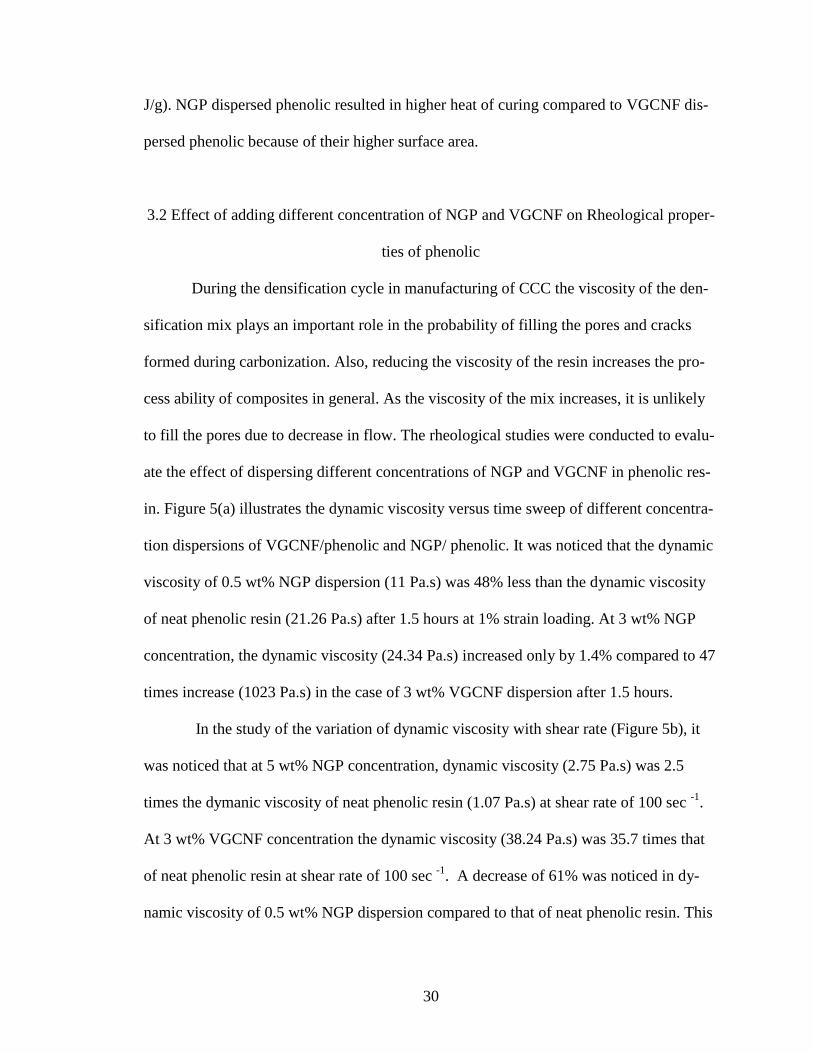
3.2 Effect of adding different concentration of NGP and VGCNF on Rheological proper-
ties of phenolic
During the densification cycle in manufacturing of CCC the viscosity of the den-
sification mix plays an important role in the probability of filling the pores and cracks
formed during carbonization. Also, reducing the viscosity of the resin increases the pro-
cess ability of composites in general. As the viscosity of the mix increases, it is unlikely
to fill the pores due to decrease in flow. The rheological studies were conducted to evalu-
ate the effect of dispersing different concentrations of NGP and VGCNF in phenolic res-
in. Figure 5(a) illustrates the dynamic viscosity versus time sweep of different concentra-
tion dispersions of VGCNF/phenolic and NGP/ phenolic. It was noticed that the dynamic
viscosity of 0.5 wt% NGP dispersion (11 Pa.s) was 48% less than the dynamic viscosity
of neat phenolic resin (21.26 Pa.s) after 1.5 hours at 1% strain loading. At 3 wt% NGP
concentration, the dynamic viscosity (24.34 Pa.s) increased only by 1.4% compared to 47
times increase (1023 Pa.s) in the case of 3 wt% VGCNF dispersion after 1.5 hours.
In the study of the variation of dynamic viscosity with shear rate (Figure 5b), it
was noticed that at 5 wt% NGP concentration, dynamic viscosity (2.75 Pa.s) was 2.5
times the dymanic viscosity of neat phenolic resin (1.07 Pa.s) at shear rate of 100 sec -1
.
At 3 wt% VGCNF concentration the dynamic viscosity (38.24 Pa.s) was 35.7 times that
of neat phenolic resin at shear rate of 100 sec -1
. A decrease of 61% was noticed in dy-
namic viscosity of 0.5 wt% NGP dispersion compared to that of neat phenolic resin. This
31
decrease in dynamic viscosity of 0.5 wt% NGP dispersion is attributed to two dimen-
sional plate like geometry of graphene platelets which enables sliding on each other, lead-
ing to low resistance to shear and stable viscosity with respect to shear rate consistent
with observations by Zhamu 24
. VGCNF at high concentration are reported to entangle
causing increased viscosity forming a “Bird-Nest” like structure as reported by Zhamu
et.al12
. Further increase from 0.5 wt% NGP to 3wt% NGP concentration increased ag-
glomeration and led to the increase in dynamic viscosity of neat phenolic resin. Howev-
er, at 3 wt% NGP concentration, the dispersion was still flowing smoothly compared to
thick viscous appearance of 3wt% VGCNF (Figure 6).
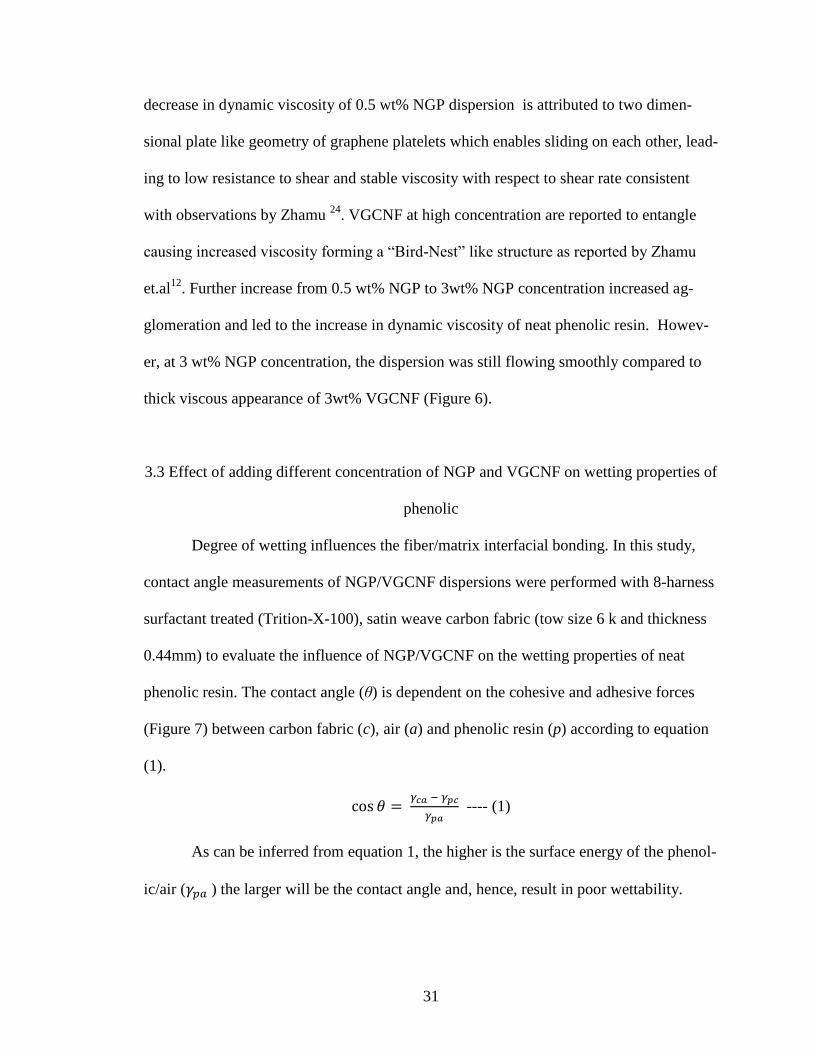
3.3 Effect of adding different concentration of NGP and VGCNF on wetting properties of
phenolic
Degree of wetting influences the fiber/matrix interfacial bonding. In this study,
contact angle measurements of NGP/VGCNF dispersions were performed with 8-harness
surfactant treated (Trition-X-100), satin weave carbon fabric (tow size 6 k and thickness
0.44mm) to evaluate the influence of NGP/VGCNF on the wetting properties of neat
phenolic resin. The contact angle (θ) is dependent on the cohesive and adhesive forces
(Figure 7) between carbon fabric (c), air (a) and phenolic resin (p) according to equation
(1).
---- (1)
As can be inferred from equation 1, the higher is the surface energy of the phenol-
ic/air ( ) the larger will be the contact angle and, hence, result in poor wettability.
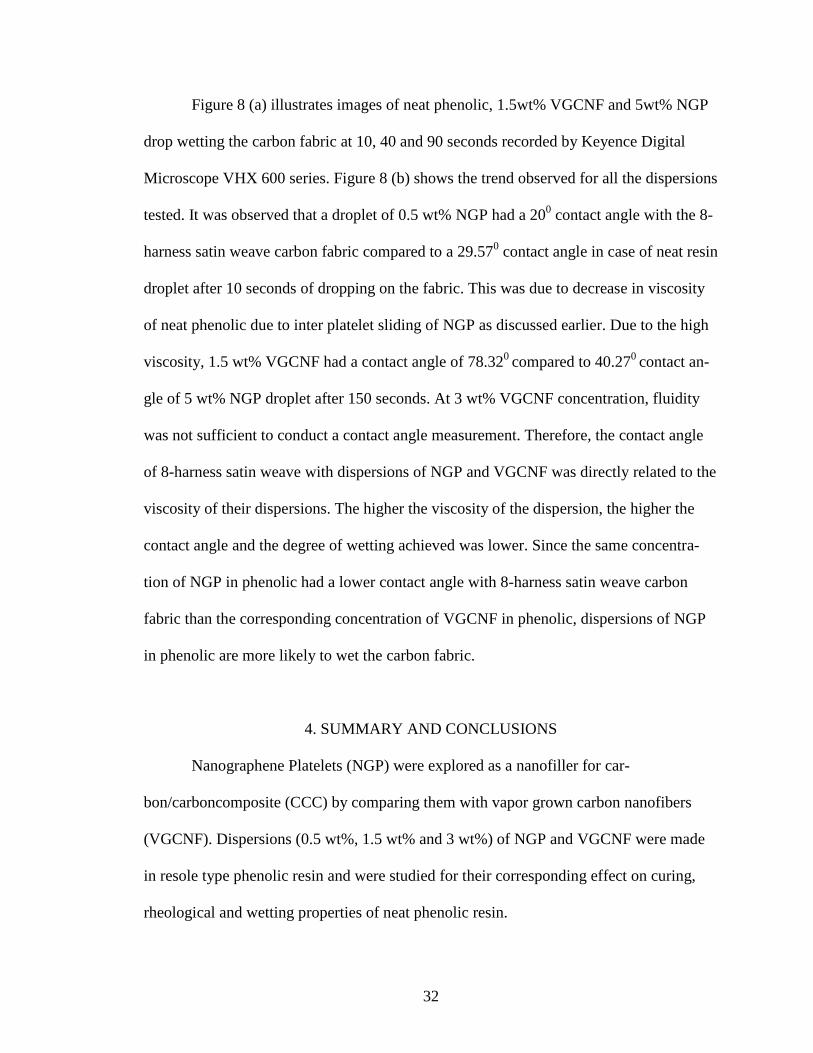
32
Figure 8 (a) illustrates images of neat phenolic, 1.5wt% VGCNF and 5wt% NGP
drop wetting the carbon fabric at 10, 40 and 90 seconds recorded by Keyence Digital
Microscope VHX 600 series. Figure 8 (b) shows the trend observed for all the dispersions
tested. It was observed that a droplet of 0.5 wt% NGP had a 200 contact angle with the 8-
harness satin weave carbon fabric compared to a 29.570 contact angle in case of neat resin
droplet after 10 seconds of dropping on the fabric. This was due to decrease in viscosity
of neat phenolic due to inter platelet sliding of NGP as discussed earlier. Due to the high
viscosity, 1.5 wt% VGCNF had a contact angle of 78.320
compared to 40.270
contact an-
gle of 5 wt% NGP droplet after 150 seconds. At 3 wt% VGCNF concentration, fluidity
was not sufficient to conduct a contact angle measurement. Therefore, the contact angle
of 8-harness satin weave with dispersions of NGP and VGCNF was directly related to the
viscosity of their dispersions. The higher the viscosity of the dispersion, the higher the
contact angle and the degree of wetting achieved was lower. Since the same concentra-
tion of NGP in phenolic had a lower contact angle with 8-harness satin weave carbon
fabric than the corresponding concentration of VGCNF in phenolic, dispersions of NGP
in phenolic are more likely to wet the carbon fabric.
4. SUMMARY AND CONCLUSIONS
Nanographene Platelets (NGP) were explored as a nanofiller for car-
bon/carboncomposite (CCC) by comparing them with vapor grown carbon nanofibers
(VGCNF). Dispersions (0.5 wt%, 1.5 wt% and 3 wt%) of NGP and VGCNF were made
in resole type phenolic resin and were studied for their corresponding effect on curing,
rheological and wetting properties of neat phenolic resin.
33
DSC studies revealed that the heat of curing neat phenolic resin increased with the
addition of NGP and VGCNF. At 0.5wt% NGP heat of curing increased by 33% com-
pared to 26% at 0.5wt% VGCNF. At concentrations higher than 0.5 wt%, the heat of cur-
ing decreased due to agglomeration but still remained higher than the heat of curing of
neat phenolic. NGP dispersed phenolic resulted in a higher heat of curing compared to
VGCNF dispersed phenolic because of the higher surface area of NGP. It is hypothesized
that high heat of curing translates to higher crosslinking which might result in high tensile
and flexure properties of neat phenolic.
The rheological studies showed that the dynamic viscosity of 0.5 wt% NGP dis-
persion was 48% less than the dynamic viscosity of neat phenolic resin after 1.5 hours at
1% strain loading. At 3 wt% NGP concentration, the dynamic viscosity increased by only
1.4% compared to an increase of 4700% increase in case of 3 wt% VGCNF dispersion
after 1.5 hours. The decrease in dynamic viscosity of 0.5 wt% NGP dispersion is attribut-
ed to two-dimensional plate like geometry of graphene which enables sliding on each
other, leading to low resistance to shear. In contrast, dispersions of VGCNF at concen-
tration greater than 0.5wt% had high dynamic viscosity because of their fibrous structure
leading to higher tendency of entanglement and agglomeration. In increasing the concen-
tration of NGP from 0.5 wt% to 3wt% raises the dynamic viscosity of the neat phenolic
resin due to an increased tendency of agglomeration.
In contact angle measurements, a droplet of 0.5 wt% NGP had a 200 contact angle
with the 8-harness satin weave carbon fabric compared to 29.570 of neat resin droplet
after 10 seconds. The lower contact angle at 0.5wt% NGP was due to lower viscosity
than neat phenolic resin. At 1.5 wt% VGCNF, contact angle was found to be 78.320

34
compared to 40.270
at 5 wt% NGP after 150 seconds as viscosity rose more rapidly with
increase in VGCNF concentration compared to NGP.
Due to lower viscosity of NGP/phenolic dispersions and higher heat of curing,
NGP could be an ideal carbon nanofiller for crack filling and densification of CCC.
ACKNOLEDGEMENT
The support from NSF Experimental Program to Stimulate Competitive Research
(EPSCoR) – Alabama Center for Nanostructured Materials (ACNM) is gratefully
acknowledged. NSF EPSCoR RII Grant number 1158862. The author is grateful to Dr.
Derrick R. Dean for insight into polymer characterization techniques, Material Science
and Engineering-University of Alabama at Birmingham; Preston R Beck for helping in
conducting contact angle studies, Department of Prosthodontics- University of Alabama
at Birmingham.
REFERENCES
1. Geim, A. K.; Novoselov, K. S., The rise of graphene. Nature Materials 2007, 6, 183-
191.
2. Novoselov, K. S.; Geim, A. K.; Morozov, S. V.; Jiang, D.; Zhang, Y.; Dubonos, S. V.;
Grigorieva, I. V.; Firsov, A. A., Electric field in atomically thin carbon films. Science
2004, 306, 666-669.
3. Novoselov, K. S.; Geim, A. K.; Morozov, S. V.; Jiang, D.; Katsnelson, M. I.;
Grigorieva, I. V.; Dubonos, S. V.; Firsov, A. A., Two-dimensional gas of massless
Dirac fermions in graphene. Nature 2005, 438, 197-200.
35
4. Novoselov, K. S.; Jiang, Z.; Zhang, Y.; Morozov, S. V.; Stormer, H. L.; Zeitler, U.;
Maan, J. C.; er, G. S.; Kim, P.; Geim, A. K., Room-temperature quantum hall effect in
graphene. Science 2007, 315, 1379.
5. Novoselov, K. S. In Graphene: The magic of flat carbon, 1st International Symposium
on Emerging Materials for Post-CMOS Applications - 215th Meeting of the
Electrochemical Society, May 25, 2009 - May 29, 2009, San Francisco, CA, United
states, Electrochemical Society Inc.: San Francisco, CA, United states, 2009; pp 3-7.
6. Viculis, L. M.; Mack, J. J.; Mayer, O. M.; Hahn, H. T.; Kaner, R. B., Intercalation and
exfoliation routes to graphite nanoplatelets. Journal of Materials Chemistry 2005, 15,
974-978.
7. Wang, X.; You, H.; Liu, F.; Li, M.; Wan, L.; Li, S.; Li, Q.; Xu, Y.; Tian, R.; Yu, Z.;
Xiang, D.; Cheng, J., Large-scale synthesis of few-layered graphene using CVD.
Chemical Vapor Deposition 2009, 15, 53-56.
8. Parvizi, F.; Teweldebrhan, D.; Ghosh, S.; Calizo, I.; Balandin, A. A.; Zhu, H.;
Abbaschian, R., Properties of graphene produced by the high pressure-high
temperature growth process. Micro and Nano Letters 2008, 3, 29-34.
9. Geng, Y.; Wang, S. J.; Kim, J.-K., Preparation of graphite nanoplatelets and graphene
sheets. Journal of Colloid and Interface Science 2009, 336, 592-598.
10. Balandin, A. A.; Ghosh, S.; Bao, W.; Calizo, I.; Teweldebrhan, D.; Miao, F.; Lau, C.
N., Superior thermal conductivity of single-layer graphene. Nano Letters 2008, 8,
902-907.
11. Lee, C.; Wei, X.; Kysar, J. W.; Hone, J., Measurement of the elastic properties and
intrinsic strength of monolayer graphene. Science 2008, 321, 385-388.
36
12. Jang, B. Z.; Zhamu, A., Processing of nanographene platelets (NGP) and NGP
nanocomposites: A review. Journal of Materials Science 2008, 43, 5092-5101.
13. Rao, C. N. R.; Biswas, K.; Subrahmanyam, K. S.; Govindaraj, A., Graphene, the new
nanocarbon. Journal of Materials Chemistry 2009, 19, 2457-2469.
14. Katsnelson, M. I., Graphene: carbon in two dimensions. Materials Today 2007, 10,
20-27.
15. Park, S.; An, J.; Suk, J. W.; Ruoff, R. S., Graphene-based actuators. Small 2010, 6,
210-212.
16. Liang, M.; Zhi, L., Graphene-based electrode materials for rechargeable lithium
batteries. Journal of Materials Chemistry 2009, 19, 5871-5878.
17. Schedin, F.; Geim, A. K.; Morozov, S. V.; Hill, E. W.; Blake, P.; Katsnelson, M. I.;
Novoselov, K. S., Detection of individual gas molecules adsorbed on graphene.
Nature Materials 2007, 6, 652-655.
18. Stankovich, S.; Dikin, D. A.; Dommett, G. H. B.; Kohlhaas, K. M.; Zimney, E. J.;
Stach, E. A.; Piner, R. D.; Nguyen, S. T.; Ruoff, R. S., Graphene-based composite
materials. Nature 2006, 442, 282-286.
19. Windhorst, T.; Blount, G., Carbon/carboncomposites: a summary of recent
developments and applications. Materials and Design 1997, 18, 11-15.
20. Chen, J.; Xiong, X.; Xiao, P., The effect of carbon nanotube growing on carbon
fibers on the microstructure of the pyrolytic carbon and the thermal conductivity of
carbon/carbon composites. Materials Chemistry and Physics 2009, 116, 57-61.
37
21. Yasuda, E.; Tanabe, Y.; Manocha, L. M.; Kimura, S., Matrix modification by
graphite powder additives in carbon fiber/carbon composite with thermosetting resin
precursor as matrix. Carbon 1988, 26, 225-227.
22. Jain, R.; Vaidya, U. K.; Haque, A., Processing and characterization of
carbon/carbonnanofiber composites. Advanced Composite Materials: The Official
Journal of the Japan Society of Composite Materials 2006, 15, 211-241.
23. Duncan, D.; Li, D.; Gaydos, J.; Neumann, A. W., Correlation of Line Tension and
Solid-Liquid Interfacial Tension from the Measurement of Drop Size Dependence of
Contact Angles. Journal of Colloid and Interface Science 1995, 169, 256-261.
24. Zhamu, A.; Jang, B. Z. Nano-graphene modified lubricant. 2011.
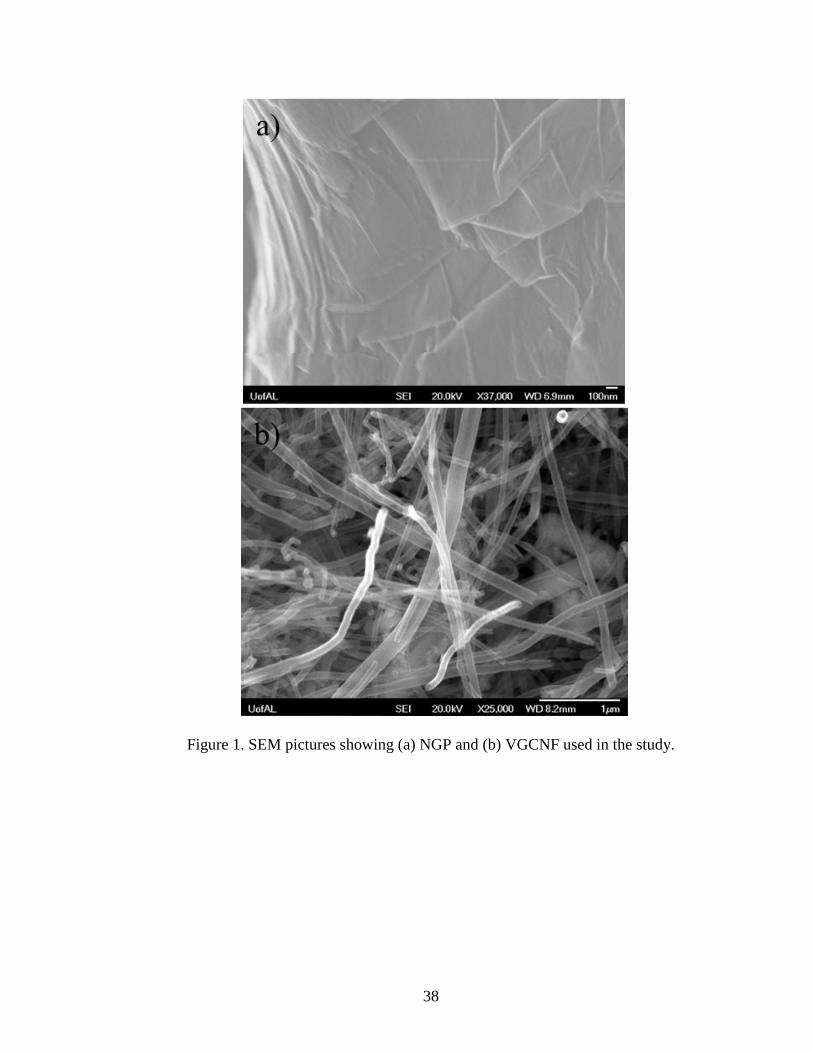
38
Figure 1. SEM pictures showing (a) NGP and (b) VGCNF used in the study.
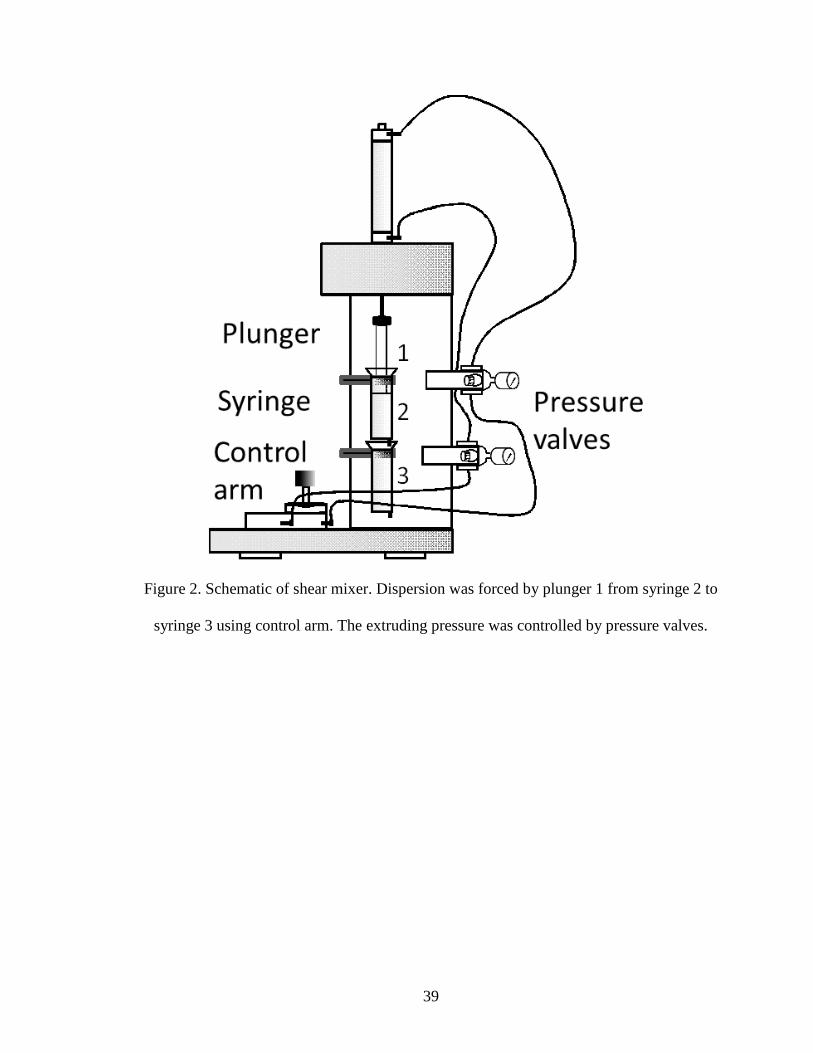
39
Figure 2. Schematic of shear mixer. Dispersion was forced by plunger 1 from syringe 2 to
syringe 3 using control arm. The extruding pressure was controlled by pressure valves.
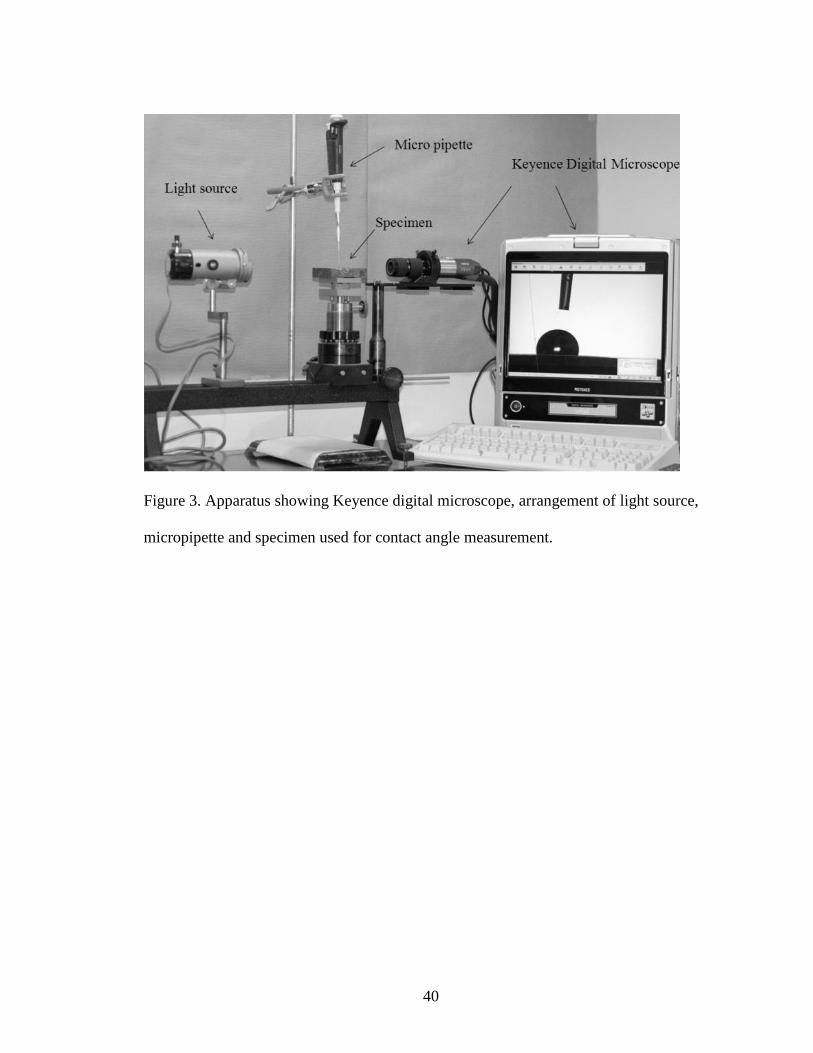
40
Figure 3. Apparatus showing Keyence digital microscope, arrangement of light source,
micropipette and specimen used for contact angle measurement.
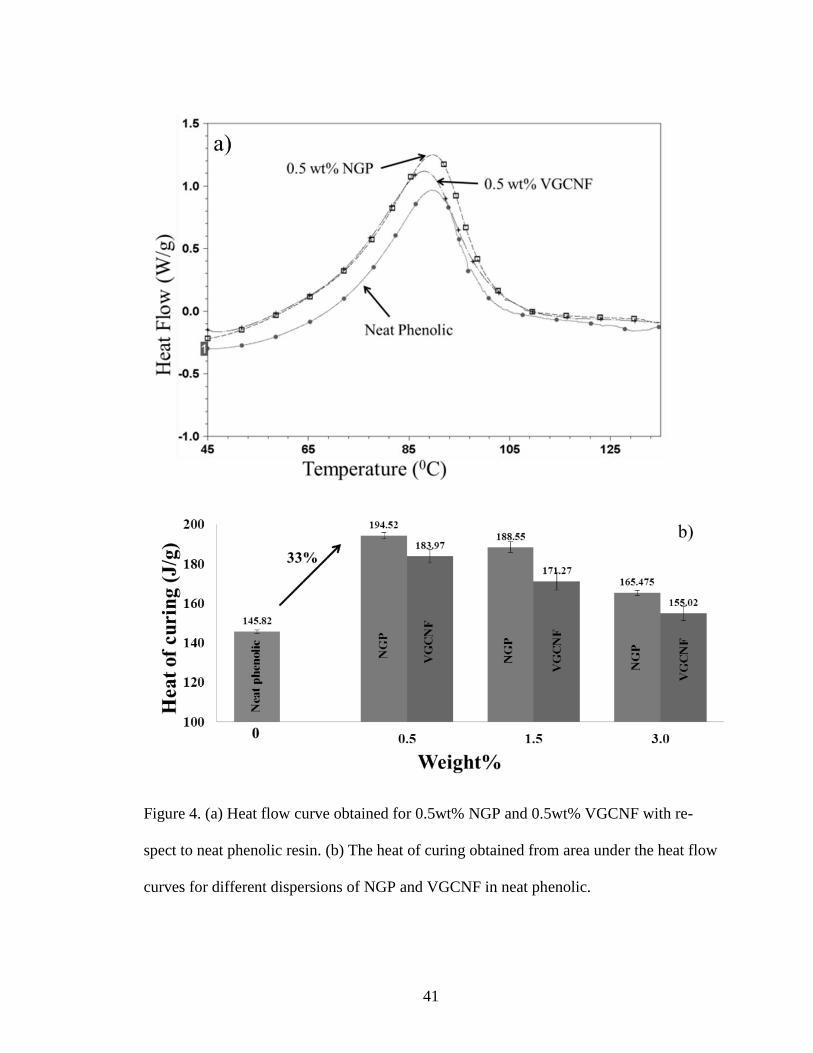
41
Figure 4. (a) Heat flow curve obtained for 0.5wt% NGP and 0.5wt% VGCNF with re-
spect to neat phenolic resin. (b) The heat of curing obtained from area under the heat flow
curves for different dispersions of NGP and VGCNF in neat phenolic.
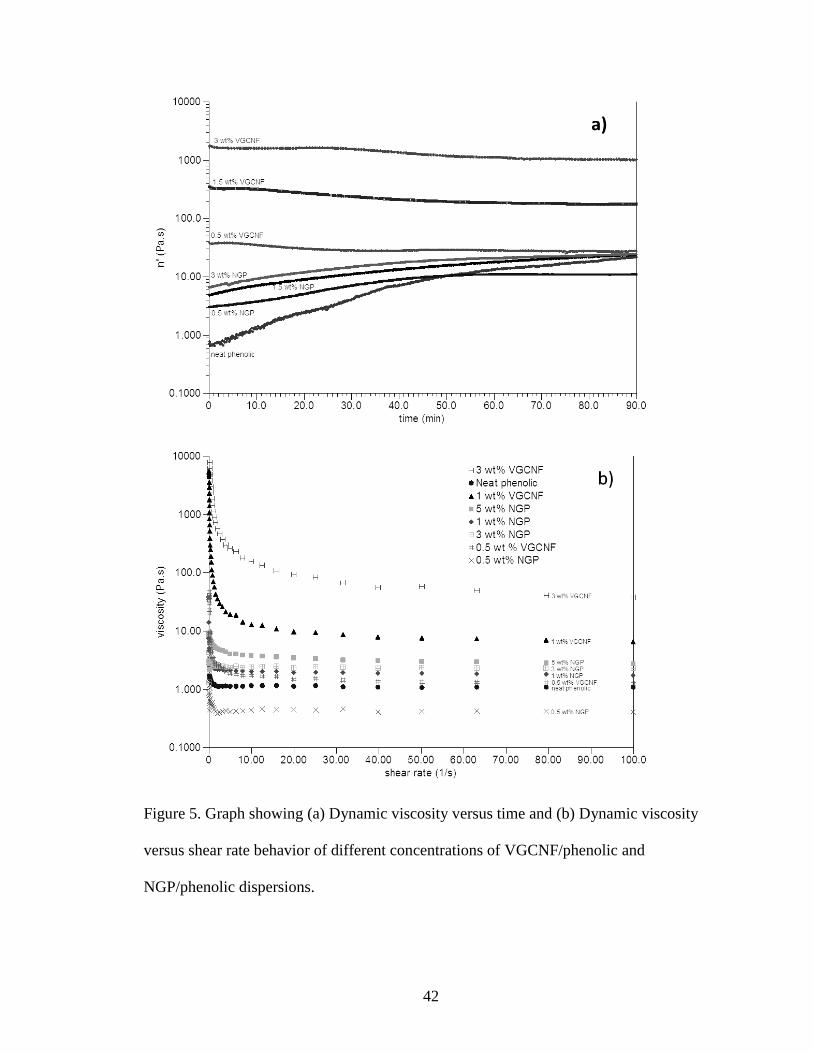
42
Figure 5. Graph showing (a) Dynamic viscosity versus time and (b) Dynamic viscosity
versus shear rate behavior of different concentrations of VGCNF/phenolic and
NGP/phenolic dispersions.
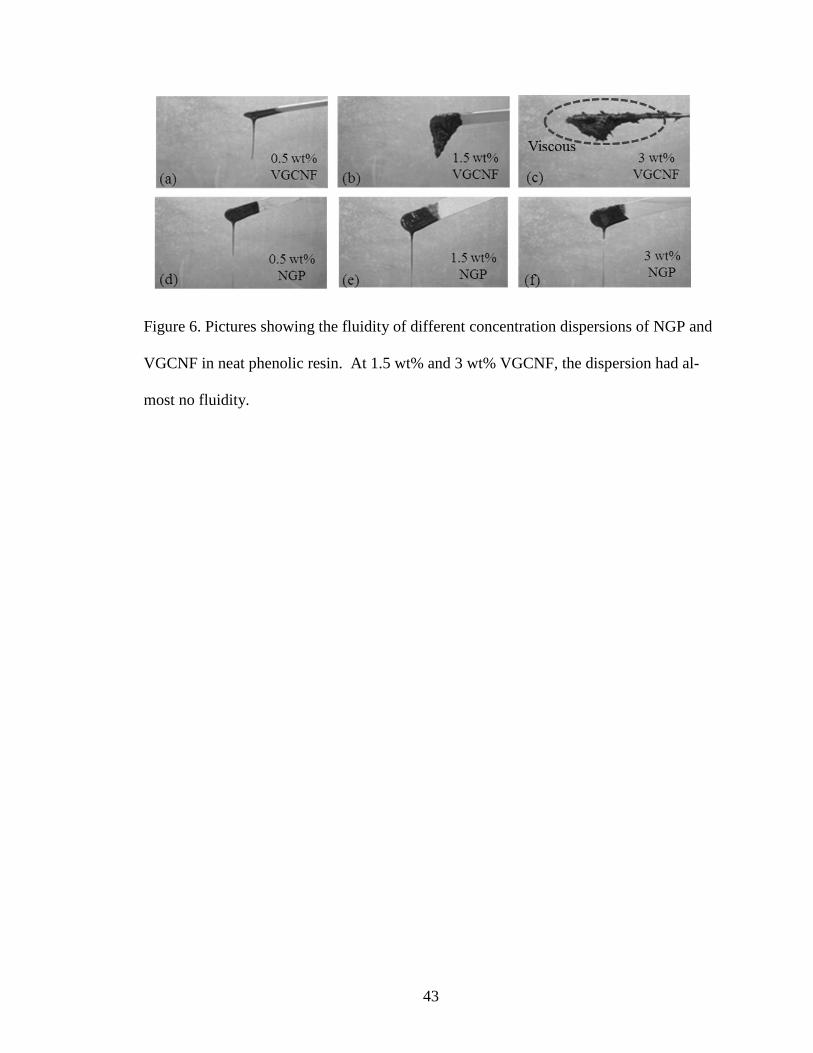
43
Figure 6. Pictures showing the fluidity of different concentration dispersions of NGP and
VGCNF in neat phenolic resin. At 1.5 wt% and 3 wt% VGCNF, the dispersion had al-
most no fluidity.
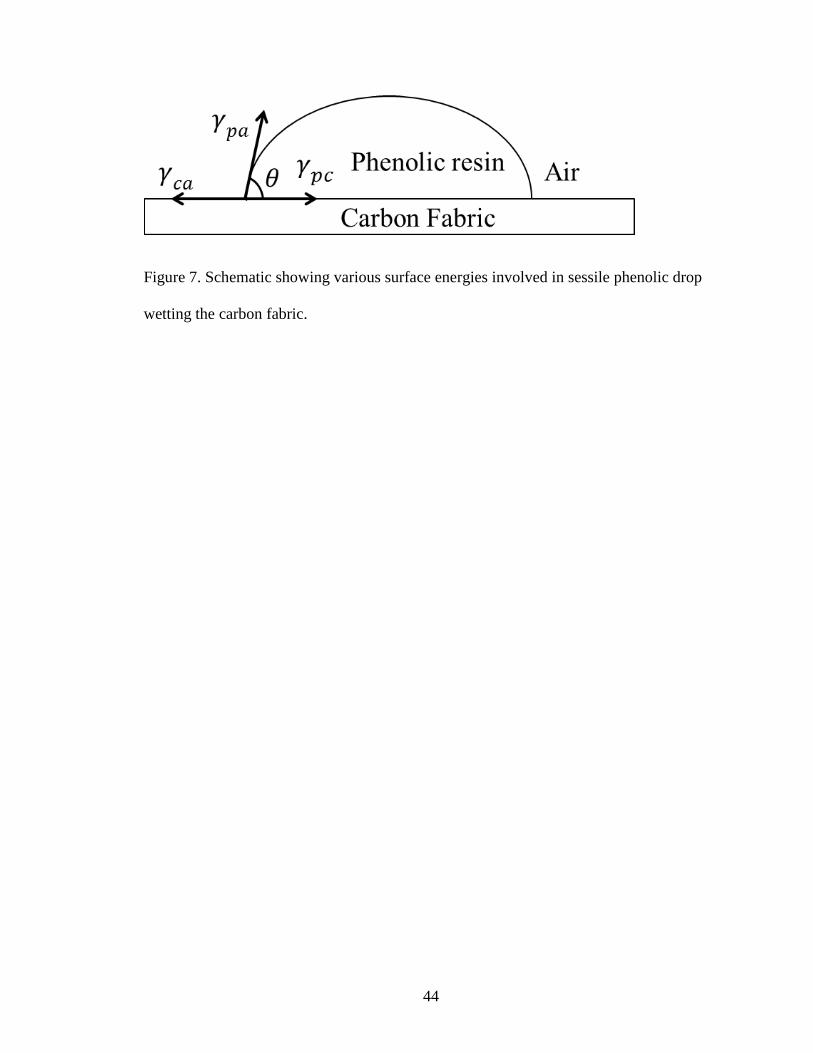
44
Figure 7. Schematic showing various surface energies involved in sessile phenolic drop
wetting the carbon fabric.
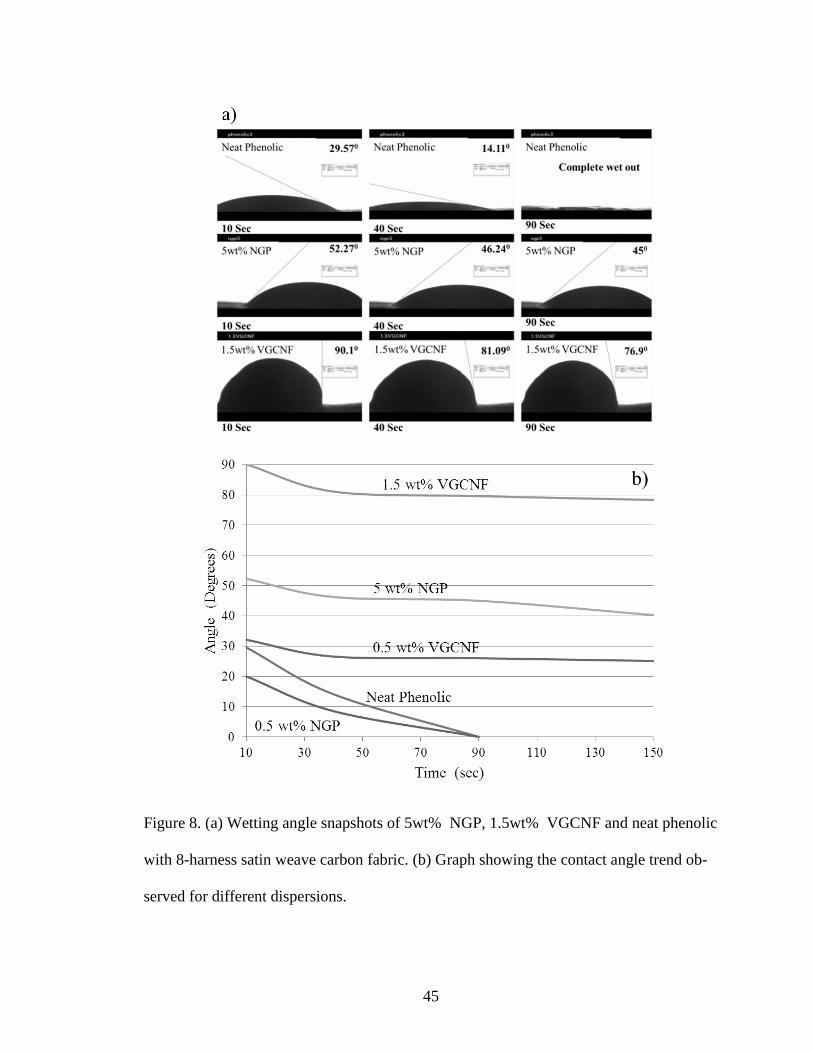
45
Figure 8. (a) Wetting angle snapshots of 5wt% NGP, 1.5wt% VGCNF and neat phenolic
with 8-harness satin weave carbon fabric. (b) Graph showing the contact angle trend ob-
served for different dispersions.
45
PROCESSING AND CHARACTERIZATION OF NANOGRAPHENE
PLATELETS MODIFIED CARBON/CARBONCOMPOSITES (PRECURSOR
PHENOLIC RESIN-PART II)
by
DHRUV BANSAL, SELVUM PILLAY, AND UDAY VAIDYA
Submitted to Reinforced Plastics and Composites
Format adapted for dissertation
46
ABSTRACT
Nanocomposites were formed by curing the dispersion of carbon nanofillers -
nanographene platelets (NGP) and vapor grown carbon nanofibers (VGCNF) in resole
type phenolic resin. X-Ray diffraction, Fourier Transform infrared spectroscopy, scan-
ning electron microscopy, thermal expansion, thermo gravimetric, and flexure testing was
done to study the morphology, thermal and mechanical properties of the manufactured
nanocomposites. The coefficient of thermal expansion (CTE) decreased by 15.36%
(73.83 μm/m0C) and 14.23% (74.81 μm/m
0C) with 1.5wt% NGP and 1.5wt% VGCNF
respectively compared to neat phenolic (87.23 μm/m0C) in the temperature range 60
0 to
800. The flexure strength of neat phenolic resin increased by 31.62% (48.57 MPa) and
flexure modulus by 42.23% (2.9 GPa) at 0.5wt% NGP. Comparatively, VGCNF at 1.5
wt% increased the flexure strength by 14.3% and flexure modulus by 23.5%. NGP and
VGCNF increased the thermal stability of phenolic resin by increasing the degradation
temperature and char yield. The degradation temperature increased by 2.75%, and char
yield by 200% at 8000C in 5wt% NGP nanocomposite. An increase of 1.6% in degrada-
tion temperature, and 75% in char yield was found with 3wt% VGCNF nanocomposite.
NGP were more effective than VGCNF in lowering the coefficient of thermal expansion
(CTE) of neat phenolic, in improving its flexure strength and modulus and in increasing
the char yield. The results indicate that NGP can be effectively used as carbon nanofiller
in the manufacturing of carbon/carboncomposites.
47
1. INTRODUCTION
Phenolic resin has excellent dimensional/thermal stability, chemical/corrosion re-
sistance, low smoke-toxicity and high char yield. Due to these impressive properties phe-
nolic resin finds its use in a wide array of applications ranging from aircraft interiors,
tunnel materials, offshore gratings, deluge pipe, fire retardant plastics (FRP) and car-
bon/carboncomposite (CCC) materials1. The demand for low flammability, better thermal
and mechanical properties has led researchers to modify the phenolic resin with nano
layered silicates2. The research in the modification of phenolic is limited due to complex
and bulky molecular structure of phenolic resin which makes it difficult for nanoparticles
to intercalate or exfoliate in phenolic resin molecules3. The formation of voids/pores in
phenolic resin due to the release of water molecules as a byproduct upon curing, decreas-
es the properties of the phenolic nanocomposites3.
It has been shown by various researchers that small concentrations of nanogra-
phene (less than 5 wt%) increase thermal, electrical, mechanical and magnetic properties
of polymers. Graphene nanocomposites can be formed by three different methods. The
first is to intercalate the monomer into the graphene oxide sheets followed by in-situ
polymerization4. After the intercalation, the graphene oxide is reduced to graphene to
form a graphene/polymer composite. The second method is to dissolve the polymer in the
nanographene dispersion; this includes composites prepared by self-assembly5. The third
is to mix nanographene using shear in a twin screw extruder6 or using ultrasonic energy
7.
A range of thermoset resins have been investigated with nanographene platelets
including vinyl ester8, 9
and epoxy10-14
. Gupta et al. reported 40% improvement in storage
modulus and 125% increase in loss factor of vinyl ester with addition of 2.5 wt% graphite
48
platelet reinforcement8. Yasmin et al. reported an increase of 10% in elastic modulus,
21% increase in tensile strength, 8% increase in storage modulus and 30-40% decrease in
coefficient of thermal expansion of neat epoxy on addition of 2.5wt% graphite platelets.
Improvements in mechanical, electrical and thermal properties have also been reported in
thermoplastic resin systems6, 15-31
. More detailed information on the graphene-based
nanocomposites can be found in published review
articles32-37
.
In this two-part study, Nanographene Platelets (NGP) have been compared
against vapor grown carbon nanofibers (VGCNF) as a nanofiller for resol type phenolic
resin.
In part one of the study39
NGP and VGCNF were dispersed (0.5 wt%, 1.5 wt%
and 3 wt%) in resole type phenolic resin and were studied for their corresponding effect
on curing, rheological and wetting properties of neat phenolic resin39
. It was found that
the heat of curing of neat phenolic resin increased with addition of NGP and VGCNF.
NGP dispersed in phenolic resulted in higher heat of curing compared to VGCNF dis-
persed in phenolic. It was because of higher surface area of NGP (upto 2600 m2/g) com-
pared to VGCNF (10-60 m2/g) as reported by Zhamu
24. The dynamic viscosity of 0.5
wt% NGP dispersion was 48% less than the dynamic viscosity of neat phenolic resin after
1.5 hours at 1% strain loading due to two-dimensional plate like geometry of graphene
which enabled sliding on each other. The lower viscosity of 0.5wt% NGP facilitated in
lowering the contact angle with 8-harness satin weave carbon fabric from 29.570 to 20
0
after 10 seconds. It was deduced that due to lower viscosity of NGP/phenolic dispersions
49
and higher heat of curing, NGP could be an ideal carbon nanofillers to enable crack fill-
ing and densification of carbon/carboncomposites.
In this part 2 of the study, nanocomposites were formed by curing the dispersions
formed in part 1 and were characterized for microstructure and thermo-mechanical prop-
erties. The intent was to investigate the effect of NGP and VGCNF on porosity, thermal
degradation, dimensional stability and flexure properties of cured phenolic resin.
2. EXPERIMENTAL
2.1 Materials and manufacturing of nanocomposites
The materials discussed in part 1 of the study were the same for the part 2 study.
The 0.5 wt%, 1.5 wt% and 3 wt% dispersions of NGP and VGCNF prepared in part 1
were cured in a silicone mold to form 101.6 mm × 101.6 mm × 4mm nanocomposite
plates. The curing was conducted from 50 0C to 90
0C at the rate of 10
0C per hour for a
total of 5 hours under 125 psi pressure using a Caver laboratory press (Model C, serial
number 31000-711).The temperature was raised to 1200C for 1 hour at 125 psi pressure
for post curing. After post curing the nanocomposite plates were allowed to cool to room
temperature under 125 psi pressure.
2.2 Characterization techniques
2.2.1 TMA, TGA, Porosity and Flexure Testing
Porosity was evaluated according to ASTM C20 using Mettler Toledo (Model
AG204) weighing balance, equipped with immersion density apparatus. Thermal Expan-
sion Coefficients of the cured nanocomposites was measured by Thermal Mechanical
50
Analyzer Q400 (TA Instruments Inc, Delaware). The specimens were cut to the size
10mm ×10mm × 4mm from the plates. The temperature was ramped from 250C to 150
0C
at 50C/min against a 0.8N force. They were then cooled from 150
0C to 25
0C at 5
0C/min
under liquid nitrogen to obtain the cooling curve.
The slope of the cooling curve was used to determine the thermal expansion coef-
ficient. The weight loss in the nanocomposites with increasing temperature was measured
by Thermogravimetric Analyzer (TGA 2950, TA Instruments Inc, Delaware). The tem-
perature ramp rate was 100C/min from 25
0C to 800
0C in nitrogen atmosphere purged at
50 mL/min.
The flexure tests were performed using SATEC T-500 screw driven machine at
room temperature using ASTM D790. The sample of dimensions 80 mm × 10 mm × 4
mm were tested in flexure for a span length of 64 mm. Samples were loaded at the rate of
1.3mm/min and were tested to failure. Fracture surfaces were analyzed using scanning
electron microscope.
2.2.2 Scanning Electron Microscopy (SEM), X-Ray Diffraction (XRD) and Fourier
Transform Infra-Red Spectra (FT-IR)
A Field Emission Scanning Electron Microscope FEI-FEG 650 with 20 kV accel-
erating voltage was used to study the morphology of the fractured nanocomposite. The
fractured samples of nanocomposites were first sputter coated with gold-palladium to
make them conductive. An X-Ray Diffractometer SIEMENS –D500 with copper tube
(Cu Kα, λ= 0.154056 nm) and graphite monochromater was used to do the diffraction
studies on the nanocomposites. The 2 Theta range was from 2.0 to 40.00 with step size of
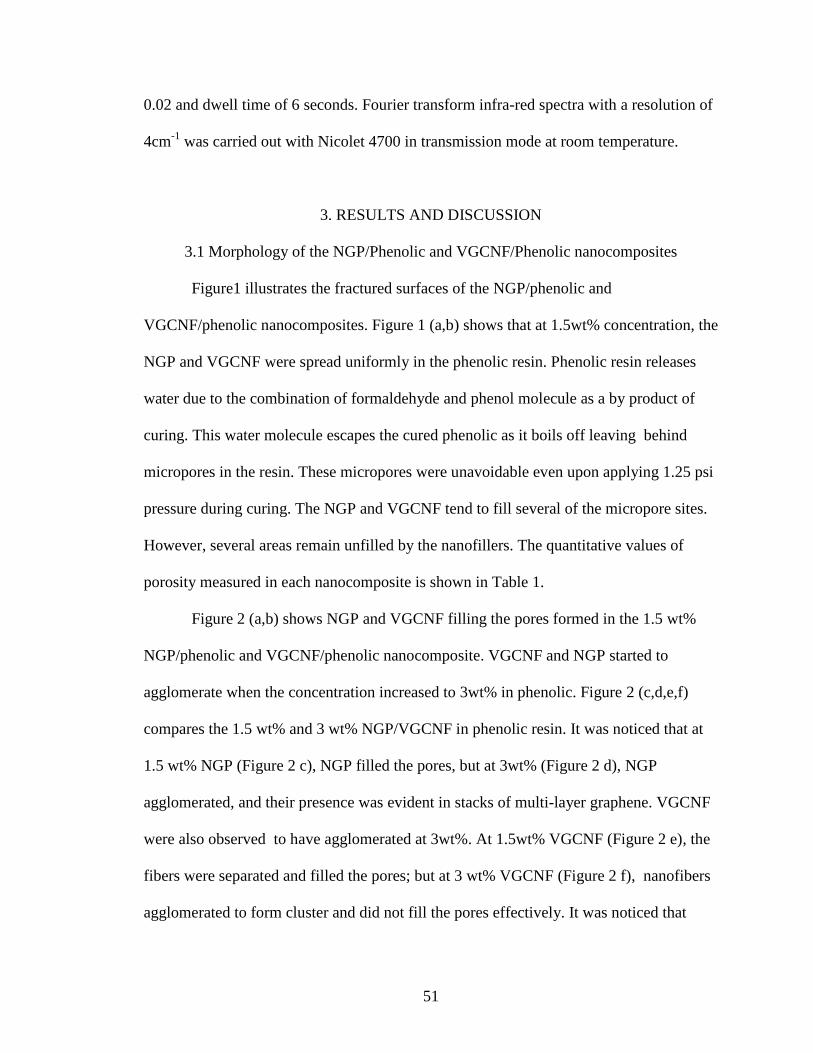
51
0.02 and dwell time of 6 seconds. Fourier transform infra-red spectra with a resolution of
4cm-1
was carried out with Nicolet 4700 in transmission mode at room temperature.
3. RESULTS AND DISCUSSION
3.1 Morphology of the NGP/Phenolic and VGCNF/Phenolic nanocomposites
Figure1 illustrates the fractured surfaces of the NGP/phenolic and
VGCNF/phenolic nanocomposites. Figure 1 (a,b) shows that at 1.5wt% concentration, the
NGP and VGCNF were spread uniformly in the phenolic resin. Phenolic resin releases
water due to the combination of formaldehyde and phenol molecule as a by product of
curing. This water molecule escapes the cured phenolic as it boils off leaving behind
micropores in the resin. These micropores were unavoidable even upon applying 1.25 psi
pressure during curing. The NGP and VGCNF tend to fill several of the micropore sites.
However, several areas remain unfilled by the nanofillers. The quantitative values of
porosity measured in each nanocomposite is shown in Table 1.
Figure 2 (a,b) shows NGP and VGCNF filling the pores formed in the 1.5 wt%
NGP/phenolic and VGCNF/phenolic nanocomposite. VGCNF and NGP started to
agglomerate when the concentration increased to 3wt% in phenolic. Figure 2 (c,d,e,f)
compares the 1.5 wt% and 3 wt% NGP/VGCNF in phenolic resin. It was noticed that at
1.5 wt% NGP (Figure 2 c), NGP filled the pores, but at 3wt% (Figure 2 d), NGP
agglomerated, and their presence was evident in stacks of multi-layer graphene. VGCNF
were also observed to have agglomerated at 3wt%. At 1.5wt% VGCNF (Figure 2 e), the
fibers were separated and filled the pores; but at 3 wt% VGCNF (Figure 2 f), nanofibers
agglomerated to form cluster and did not fill the pores effectively. It was noticed that
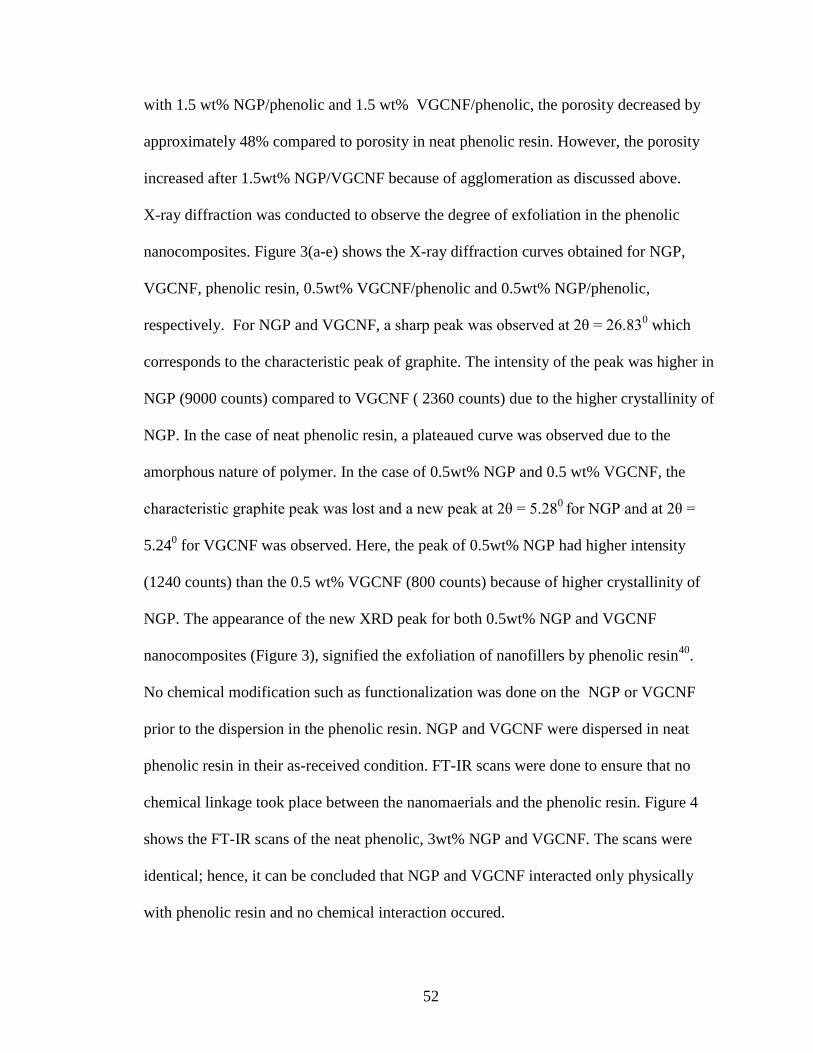
52
with 1.5 wt% NGP/phenolic and 1.5 wt% VGCNF/phenolic, the porosity decreased by
approximately 48% compared to porosity in neat phenolic resin. However, the porosity
increased after 1.5wt% NGP/VGCNF because of agglomeration as discussed above.
X-ray diffraction was conducted to observe the degree of exfoliation in the phenolic
nanocomposites. Figure 3(a-e) shows the X-ray diffraction curves obtained for NGP,
VGCNF, phenolic resin, 0.5wt% VGCNF/phenolic and 0.5wt% NGP/phenolic,
respectively. For NGP and VGCNF, a sharp peak was observed at 2θ = 26.830 which
corresponds to the characteristic peak of graphite. The intensity of the peak was higher in
NGP (9000 counts) compared to VGCNF ( 2360 counts) due to the higher crystallinity of
NGP. In the case of neat phenolic resin, a plateaued curve was observed due to the
amorphous nature of polymer. In the case of 0.5wt% NGP and 0.5 wt% VGCNF, the
characteristic graphite peak was lost and a new peak at 2θ = 5.280
for NGP and at 2θ =
5.240 for VGCNF was observed. Here, the peak of 0.5wt% NGP had higher intensity
(1240 counts) than the 0.5 wt% VGCNF (800 counts) because of higher crystallinity of
NGP. The appearance of the new XRD peak for both 0.5wt% NGP and VGCNF
nanocomposites (Figure 3), signified the exfoliation of nanofillers by phenolic resin40
.
No chemical modification such as functionalization was done on the NGP or VGCNF
prior to the dispersion in the phenolic resin. NGP and VGCNF were dispersed in neat
phenolic resin in their as-received condition. FT-IR scans were done to ensure that no
chemical linkage took place between the nanomaerials and the phenolic resin. Figure 4
shows the FT-IR scans of the neat phenolic, 3wt% NGP and VGCNF. The scans were
identical; hence, it can be concluded that NGP and VGCNF interacted only physically
with phenolic resin and no chemical interaction occured.
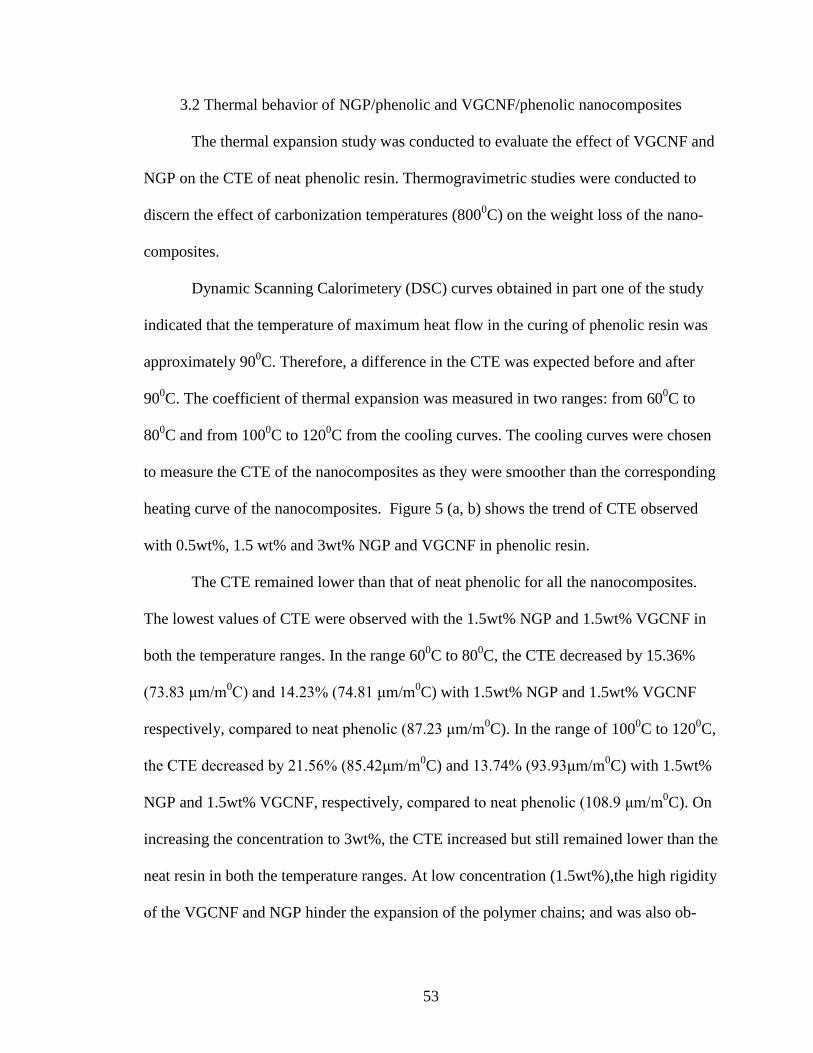
53
3.2 Thermal behavior of NGP/phenolic and VGCNF/phenolic nanocomposites
The thermal expansion study was conducted to evaluate the effect of VGCNF and
NGP on the CTE of neat phenolic resin. Thermogravimetric studies were conducted to
discern the effect of carbonization temperatures (8000C) on the weight loss of the nano-
composites.
Dynamic Scanning Calorimetery (DSC) curves obtained in part one of the study
indicated that the temperature of maximum heat flow in the curing of phenolic resin was
approximately 900C. Therefore, a difference in the CTE was expected before and after
900C. The coefficient of thermal expansion was measured in two ranges: from 60
0C to
800C and from 100
0C to 120
0C from the cooling curves. The cooling curves were chosen
to measure the CTE of the nanocomposites as they were smoother than the corresponding
heating curve of the nanocomposites. Figure 5 (a, b) shows the trend of CTE observed
with 0.5wt%, 1.5 wt% and 3wt% NGP and VGCNF in phenolic resin.
The CTE remained lower than that of neat phenolic for all the nanocomposites.
The lowest values of CTE were observed with the 1.5wt% NGP and 1.5wt% VGCNF in
both the temperature ranges. In the range 600C to 80
0C, the CTE decreased by 15.36%
(73.83 μm/m0C) and 14.23% (74.81 μm/m
0C) with 1.5wt% NGP and 1.5wt% VGCNF
respectively, compared to neat phenolic (87.23 μm/m0C). In the range of 100
0C to 120
0C,
the CTE decreased by 21.56% (85.42μm/m0C) and 13.74% (93.93μm/m
0C) with 1.5wt%
NGP and 1.5wt% VGCNF, respectively, compared to neat phenolic (108.9 μm/m0C). On
increasing the concentration to 3wt%, the CTE increased but still remained lower than the
neat resin in both the temperature ranges. At low concentration (1.5wt%),the high rigidity
of the VGCNF and NGP hinder the expansion of the polymer chains; and was also ob-
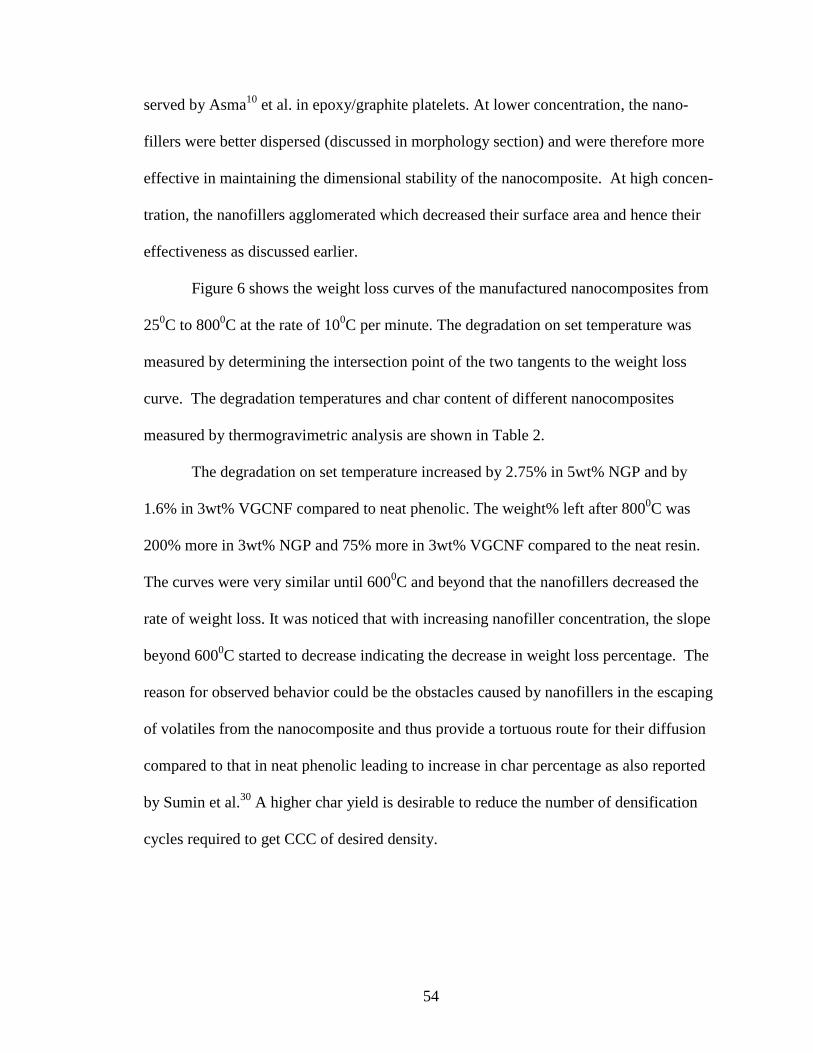
54
served by Asma10
et al. in epoxy/graphite platelets. At lower concentration, the nano-
fillers were better dispersed (discussed in morphology section) and were therefore more
effective in maintaining the dimensional stability of the nanocomposite. At high concen-
tration, the nanofillers agglomerated which decreased their surface area and hence their
effectiveness as discussed earlier.
Figure 6 shows the weight loss curves of the manufactured nanocomposites from
250C to 800
0C at the rate of 10
0C per minute. The degradation on set temperature was
measured by determining the intersection point of the two tangents to the weight loss
curve. The degradation temperatures and char content of different nanocomposites
measured by thermogravimetric analysis are shown in Table 2.
The degradation on set temperature increased by 2.75% in 5wt% NGP and by
1.6% in 3wt% VGCNF compared to neat phenolic. The weight% left after 8000C was
200% more in 3wt% NGP and 75% more in 3wt% VGCNF compared to the neat resin.
The curves were very similar until 6000C and beyond that the nanofillers decreased the
rate of weight loss. It was noticed that with increasing nanofiller concentration, the slope
beyond 6000C started to decrease indicating the decrease in weight loss percentage. The
reason for observed behavior could be the obstacles caused by nanofillers in the escaping
of volatiles from the nanocomposite and thus provide a tortuous route for their diffusion
compared to that in neat phenolic leading to increase in char percentage as also reported
by Sumin et al.30
A higher char yield is desirable to reduce the number of densification
cycles required to get CCC of desired density.
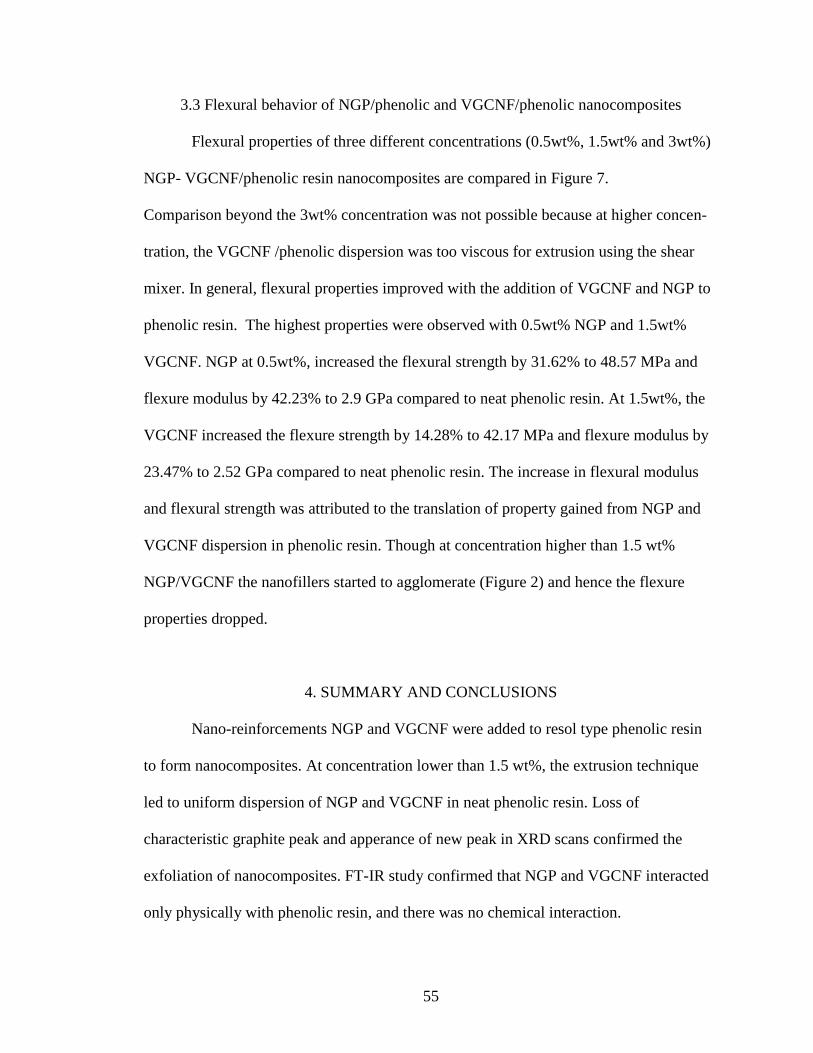
55
3.3 Flexural behavior of NGP/phenolic and VGCNF/phenolic nanocomposites
Flexural properties of three different concentrations (0.5wt%, 1.5wt% and 3wt%)
NGP- VGCNF/phenolic resin nanocomposites are compared in Figure 7.
Comparison beyond the 3wt% concentration was not possible because at higher concen-
tration, the VGCNF /phenolic dispersion was too viscous for extrusion using the shear
mixer. In general, flexural properties improved with the addition of VGCNF and NGP to
phenolic resin. The highest properties were observed with 0.5wt% NGP and 1.5wt%
VGCNF. NGP at 0.5wt%, increased the flexural strength by 31.62% to 48.57 MPa and
flexure modulus by 42.23% to 2.9 GPa compared to neat phenolic resin. At 1.5wt%, the
VGCNF increased the flexure strength by 14.28% to 42.17 MPa and flexure modulus by
23.47% to 2.52 GPa compared to neat phenolic resin. The increase in flexural modulus
and flexural strength was attributed to the translation of property gained from NGP and
VGCNF dispersion in phenolic resin. Though at concentration higher than 1.5 wt%
NGP/VGCNF the nanofillers started to agglomerate (Figure 2) and hence the flexure
properties dropped.
4. SUMMARY AND CONCLUSIONS
Nano-reinforcements NGP and VGCNF were added to resol type phenolic resin
to form nanocomposites. At concentration lower than 1.5 wt%, the extrusion technique
led to uniform dispersion of NGP and VGCNF in neat phenolic resin. Loss of
characteristic graphite peak and apperance of new peak in XRD scans confirmed the
exfoliation of nanocomposites. FT-IR study confirmed that NGP and VGCNF interacted
only physically with phenolic resin, and there was no chemical interaction.
56
NGP and VGCNF filled the pores formed during the curing of phenolic resin. At 1.5wt%
NGP and VGCNF concentration, the porosity decreased by approximately 48%
compared to porosity in neat phenolic resin. At 3wt% concentration NGP/VGCNF started
to agglomerate in phenolic and were not as effective at 1.5 wt%.
NGP at 0.5wt%, increased the flexure strength by 31.62% to 48.57 MPa and flex-
ure modulus by 42.23% to 2.9 GPa compared to neat phenolic resin. In comparison,
VGCNF at 1.5wt% increased the flexure strength by 14.28% to 42.17 MPa and flexure
modulus by 23.47% to 2.52 GPa compared to neat phenolic resin.
The CTE decreased by 15.36% (73.83 μm/m0C) and 14.23% (74.81 μm/m
0C)
with 1.5wt% NGP and 1.5wt% VGCNF, respectively, compared to neat phenolic (87.23
μm/m0C) in the temperature range 60
0 to 80
0. In the range of 100
0C to 120
0C, the CTE
decreased by 21.56% (85.42μm/m0C) and 13.74% (93.93μm/m
0C) with 1.5wt% NGP and
1.5wt% VGCNF, respectively, compared to neat phenolic (108.9 μm/m0C). On increas-
ing the concentration to 3wt% the CTE increased but still remained lower than the neat
resin in both the temperature ranges.
The degradation on set temperature of neat phenolic resin increased by 2.75% in
5wt% NGP and by 1.6% in 3wt%VGCNF compared to neat phenolic. The percentage
weight left after 8000C was 200% more in 3wt% NGP and 75% more in 3wt%VGCNF
compared to the neat phenolic resin. As the addition of NGP decreased the porosity, in-
creased the flexure properties, lowered the coefficient of thermal expansion and increased
the char yield of neat phenolic resin, they are suitable carbon nanofiller for manufacturing
of carbon/carboncomposites.
57
ACKNOLEDGEMENT
The support from NSF Experimental Program to Stimulate Competitive Research
(EPSCoR) – Alabama Center for Nanostructured Materials (ACNM) is gratefully
acknowledged. NSF EPSCoR RII Grant number 1158862. The author is grateful to Dr.
Derrick R. Dean for insight into polymer characterization techniques, Dr. Robin Foley for
helping in conducting SEM studies; Material Science and Engineering-University of Ala-
bama at Birmingham.
REFERENCES
1. Pilato, L. A.; Koo, J. H.; Wissler, G. E.; Lao, S., A review - Phenolic and related
resins and their nanomodification into phenolic resin FRP systems. Journal of
Advanced Materials 2008, 40, 5-16.
2. Kang, S. G.; Hong, J. H.; Kim, C. K., Morphology and mechanical properties of
nanocomposites fabricated from organoclays and a novolac phenolic resin via melt
mixing. Industrial and Engineering Chemistry Research 2010, 49, 11954-11960.
3. Tasan, C. C.; Kaynak, C., Mechanical performance of resol type phenolic
resin/layered silicate nanocomposites. Polymer Composites 2009, 30, 343-350.
4. Xu, Z.; Gao, C., In situ polymerization approach to graphene-reinforced nylon-6
composites. Macromolecules 2010, 43, 6716-6723.
5. Kotov, N. A.; Dekany, I.; Fendler, J. H., Ultrathin graphite oxide-polyelectrolyte
composites prepared by self-assembly: Transition between conductive and non-
conductive states. Advanced Materials 1996, 8, 637-641.
58
6. Kalaitzidou, K.; Fukushima, H.; Drzal, L. T., Multifunctional polypropylene
composites produced by incorporation of exfoliated graphite nanoplatelets. Carbon
2007, 45, 1446-1452.
7. Bansal, D.; Pillay, S.; Vaidya, U. In Addition of Nanographene Platelets (NGP) for
improvement in mechanical properties of carbon/carboncomposites, 2011 SAMPE
Spring Technical Conference and Exhibition - State of the Industry: Advanced
Materials, Applications, and Processing Technology, May 23, 2011 - May 26, 2011,
Long Beach, CA, United States, Soc. for the Advancement of Material and Process
Engineering: Long Beach, CA, United States, 2011; p SAMPE Orange County
Chapter.
8. Gupta, S.; Raju Mantena, P.; Al-Ostaz, A., Dynamic mechanical and impact property
correlation of nanoclay and graphite platelet reinforced vinyl ester nanocomposites.
Journal of Reinforced Plastics and Composites 2010, 29, 2037-2047.
9. Liu, W.; Do, I.; Fukushima, H.; Drzal, L. T. In The effect of exfoliated graphite
nanoplatelet size on the mechanical and electrical properties of vinyl ester
nanocomposites, 2008 SAMPE Fall Technical Conference and Exhibition -
Multifunctional Materials: Working Smarter Together, SAMPE '08, September 8,
2008 - September 11, 2008, Memphis, TN, United States, Soc. for the Advancement
of Material and Process Engineering: Memphis, TN, United States, 2008; p SAMPE's
Great Lakes Chapter.
10. Yasmin, A.; Daniel, I. M., Mechanical and thermal properties of graphite
platelet/epoxy composites. Polymer 2004, 45, 8211-8219.
59
11. Park, J. K.; Do, I.-H.; Askeland, P.; Drzal, L. T., Electrodeposition of exfoliated
graphite nanoplatelets onto carbon fibers and properties of their epoxy composites.
Composites Science and Technology 2008, 68, 1734-1741.
12. Rafiee, M. A.; Rafiee, J.; Wang, Z.; Song, H.; Yu, Z.-Z.; Koratkar, N., Enhanced
mechanical properties of nanocomposites at low graphene content. ACS Nano 2009,
3, 3884-3890.
13. Yu, A.; Ramesh, P.; Itkis, M. E.; Bekyarova, E.; Haddon, R. C., Graphite
nanoplatelet-epoxy composite thermal interface materials. Journal of Physical
Chemistry C 2007, 111, 7565-7569.
14. Yu, A.; Ramesh, P.; Sun, X.; Bekyarova, E.; Itkis, M. E.; Haddon, R. C., Enhanced
thermal conductivity in a hybrid graphite nanoplatelet - Carbon nanotube filler for
epoxy composites. Advanced Materials 2008, 20, 4740-4744.
15. Xiao, P.; Xiao, M.; Gong, K., Preparation of exfoliated graphite/polystyrene
composite by polymerization-filling technique. Polymer 2001, 42, 4813-4816.
16. Xiao, M.; Sun, L.; Liu, J.; Li, Y.; Gong, K., Synthesis and properties of
polystyrene/graphite nanocomposites. Polymer 2002, 43, 2245-2248.
17. Chen, G.; Wu, C.; Weng, W.; Wu, D.; Yan, W., Preparation of polystyrene/graphite
nanosheet composite. Polymer 2003, 44, 1781-1784.
18. Zheng, W.; Wong, S.-C., Electrical conductivity and dielectric properties of
PMMA/expanded graphite composites. Composites Science and Technology 2003,
63, 225-235.
19. Zheng, W.; Wong, S.-C.; Sue, H.-J., Transport behavior of PMMA/expanded graphite
nanocomposites. Polymer 2002, 43, 6767-6773.
60
20. Jiang, X.; Drzal, L. T. In Multifunctional exfoliated graphite nanoplatelets/high
density polyethylene nanocomposites, 2009 SAMPE Fall Technical Conference and
Exhibition - Global Material Technology: Soaring to New Horizons, October 19,
2009 - October 22, 2009, Wichita, KS, United States, Soc. for the Advancement of
Material and Process Engineering: Wichita, KS, United States, 2009; p SAMPE New
Jersey Chapter; SAMPE Wichita Chapter.
21. Kalaitzidou, K.; Fukushima, H.; Drzal, L. T. In Processing, properties and structure
of exfoliated graphite nanoplatelet-polypropylene nanocomposites, 05AIChE: 2005
AIChE Annual Meeting and Fall Showcase, October 30, 2005 - November 4, 2005,
Cincinnati, OH, United states, American Institute of Chemical Engineers: Cincinnati,
OH, United States, 2005; pp 13647-13665.
22. Kalaitzidou, K.; Fukushima, H.; Drzal, L. T., A new compounding method for
exfoliated graphite-polypropylene nanocomposites with enhanced flexural properties
and lower percolation threshold. Composites Science and Technology 2007, 67, 2045-
2051.
23. Kalaitzidou, K.; Fukushima, H.; Miyagawa, H.; Drzal, L. T., Flexural and tensile
moduli of polypropylene nanocomposites and comparison of experimental data to
Halpin-Tsai and Tandon-Weng models. Polymer Engineering and Science 2007, 47,
1796-1803.
24. Kalaitzidou, K.; Fukushima, H.; Drzal, L. T., Mechanical properties and
morphological characterization of exfoliated graphite-polypropylene nanocomposites.
Composites Part A: Applied Science and Manufacturing 2007, 38, 1675-1682.
61
25. Kalaitzidou, K.; Fukushima, H.; Askeland, P.; Drzal, L. T., The nucleating effect of
exfoliated graphite nanoplatelets and their influence on the crystal structure and
electrical conductivity of polypropylene nanocomposites. Journal of Materials
Science 2008, 43, 2895-2907.
26. Kim, S.; Drzal, L. T., Comparison of exfoliated graphite nanoplatelets (xGnP) and
CNTs for reinforcement of EVA nanocomposites fabricated by solution compounding
method and three screw rotating systems. Journal of Adhesion Science and
Technology 2009, 23, 1623-1638.
27. Kim, S.; Drzal, L. T., High latent heat storage and high thermal conductive phase
change materials using exfoliated graphite nanoplatelets. Solar Energy Materials and
Solar Cells 2009, 93, 136-142.
28. Kim, S.; Do, I.; Drzal, L. T., Multifunctional xGnP/LLDPE nanocomposites prepared
by solution compounding using various screw rotating systems. Macromolecular
Materials and Engineering 2009, 294, 196-205.
29. Kim, S.; Seo, J.; Drzal, L. T., Improvement of electric conductivity of LLDPE based
nanocomposite by paraffin coating on exfoliated graphite nanoplatelets. Composites
Part A: Applied Science and Manufacturing 2010, 41, 581-587.
30. Kim, S.; Do, I.; Drzal, L. T., Thermal stability and dynamic mechanical behavior of
exfoliated graphite nanoplatelets-LLDPE nanocomposites. Polymer Composites 2010,
31, 755-761.
31. Shen, J.-W.; Chen, X.-M.; Huang, W.-Y., Structure and electrical properties of
grafted polypropylene/graphite nanocomposites prepared by solution intercalation.
Journal of Applied Polymer Science 2003, 88, 1864-1869.
62
32. Jang, B. Z.; Zhamu, A., Processing of nanographene platelets (NGP) and NGP
nanocomposites: A review. Journal of Materials Science 2008, 43, 5092-5101.
33. Verdejo, R.; Bernal, M. M.; Romasanta, L. J.; Lopez-Manchado, M. A., Graphene
filled polymer nanocomposites. Journal of Materials Chemistry 2011, 21, 3301-3310.
34. Frazier, R. M.; Daly, D. T.; Swatloski, R. P.; Hathcock, K. W.; South, C. R., Recent
progress in graphene-related nanotechnologies. Recent Patents on Nanotechnology
2009, 3, 164-176.
35. Potts, J. R.; Dreyer, D. R.; Bielawski, C. W.; Ruoff, R. S., Graphene-based polymer
nanocomposites. Polymer 2011, 52, 5-25.
36. Kim, H.; Abdala, A. A.; MacOsko, C. W., Graphene/polymer nanocomposites.
Macromolecules 2010, 43, 6515-6530.
37. Cai, D.; Song, M., Recent advance in functionalized graphene/polymer
nanocomposites. Journal of Materials Chemistry 2010, 20, 7906-7915.
38. Wang, S.; Tambraparni, M.; Qiu, J.; Tipton, J.; Dean, D., Thermal expansion of
graphene composites. Macromolecules 2009, 42, 5251-5255.
39. Bansal Dhruv, Pillay Selvum., and Vaidya Uday, Processing and characterization of
nanographene platelets modified carbon/carboncomposites- Part I. 2012.
40. Toyoda, M.; Shimizu, A.; Iwata, H.; Inagaki, M., Exfoliation of carbon fibers through
intercalation compounds synthesized electrochemically. Carbon 2001, 39, 1697-
1707.
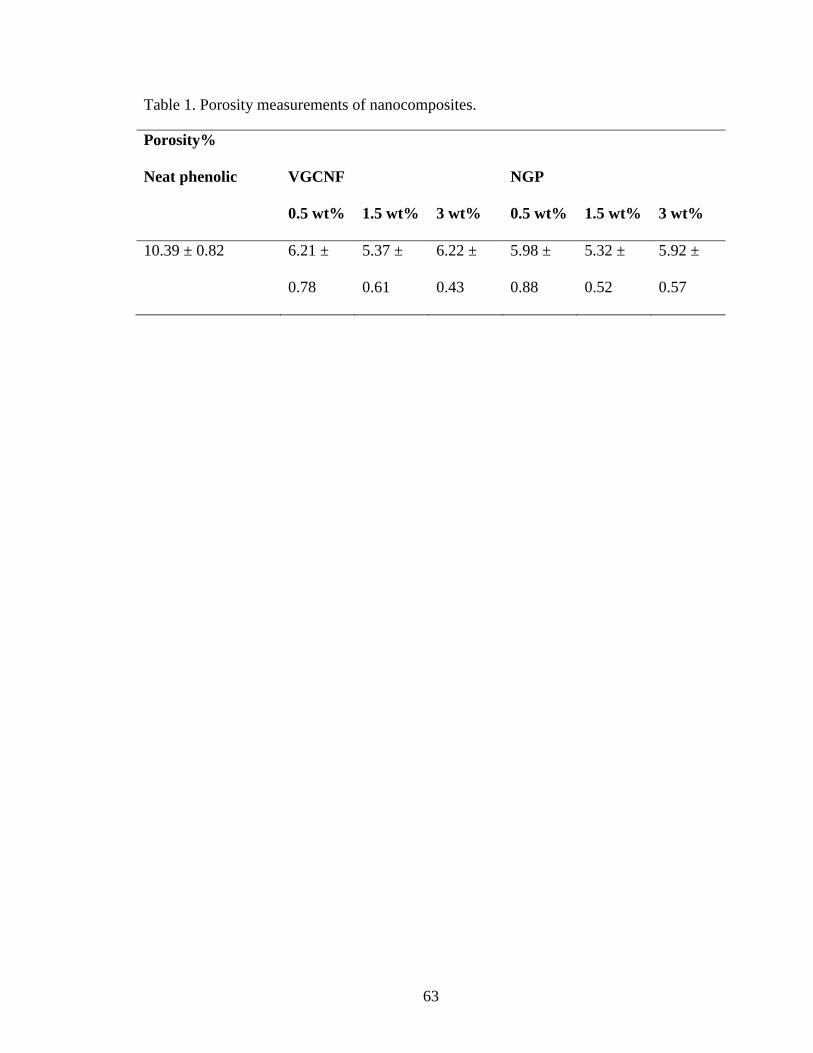
63
Table 1. Porosity measurements of nanocomposites.
Porosity%
Neat phenolic VGCNF NGP
0.5 wt% 1.5 wt% 3 wt% 0.5 wt% 1.5 wt% 3 wt%
10.39 ± 0.82 6.21 ±
0.78
5.37 ±
0.61
6.22 ±
0.43
5.98 ±
0.88
5.32 ±
0.52
5.92 ±
0.57
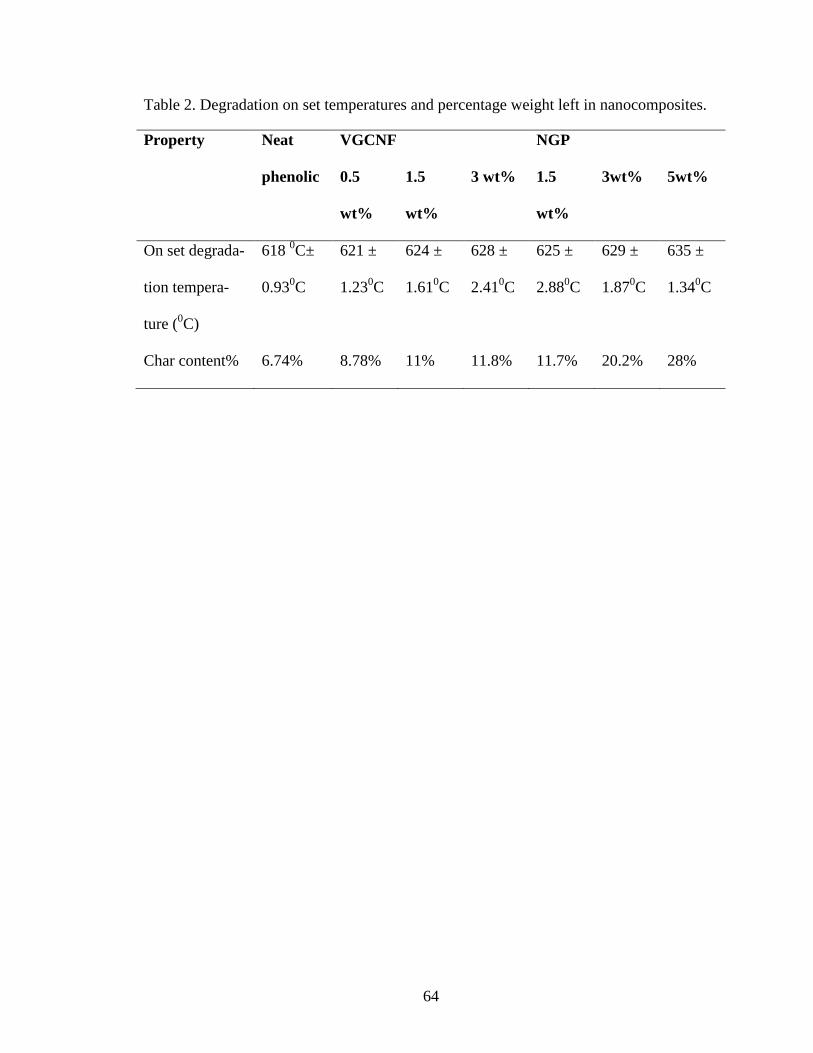
64
Table 2. Degradation on set temperatures and percentage weight left in nanocomposites.
Property Neat
phenolic
VGCNF NGP
0.5
wt%
1.5
wt%
3 wt% 1.5
wt%
3wt% 5wt%
On set degrada-
tion tempera-
ture (0C)
618 0C±
0.930C
621 ±
1.230C
624 ±
1.610C
628 ±
2.410C
625 ±
2.880C
629 ±
1.870C
635 ±
1.340C
Char content% 6.74% 8.78% 11% 11.8% 11.7% 20.2% 28%
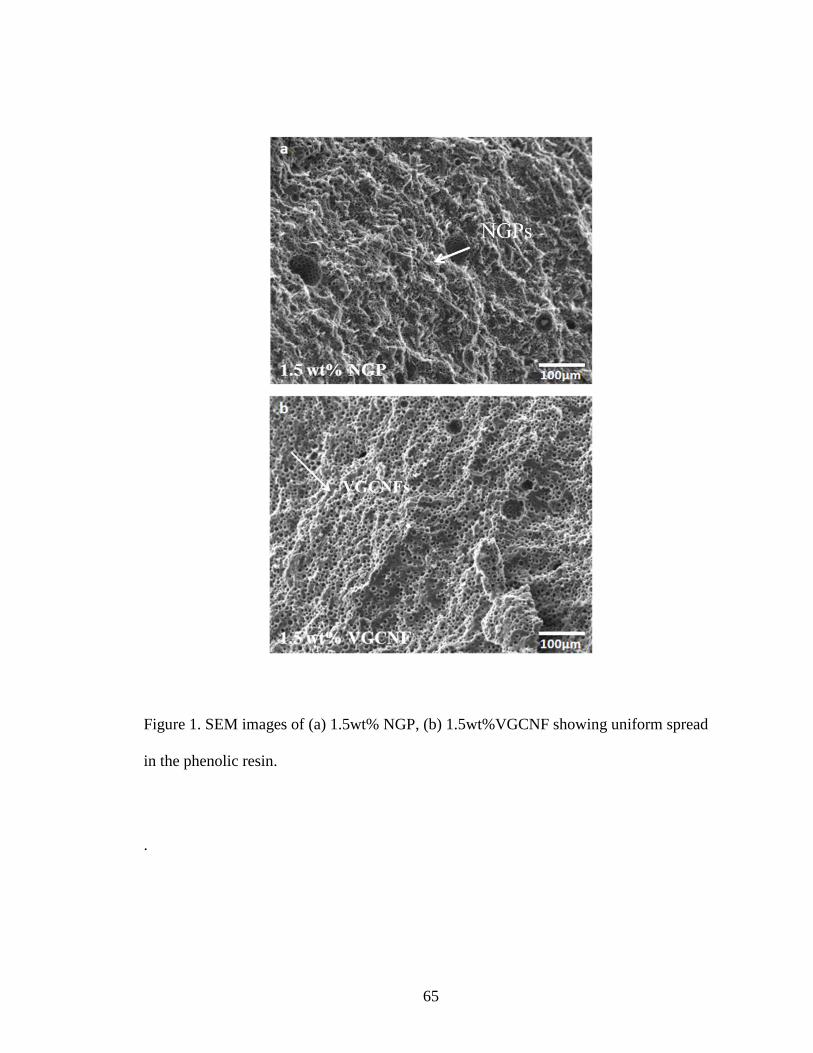
65
Figure 1. SEM images of (a) 1.5wt% NGP, (b) 1.5wt%VGCNF showing uniform spread
in the phenolic resin.
.
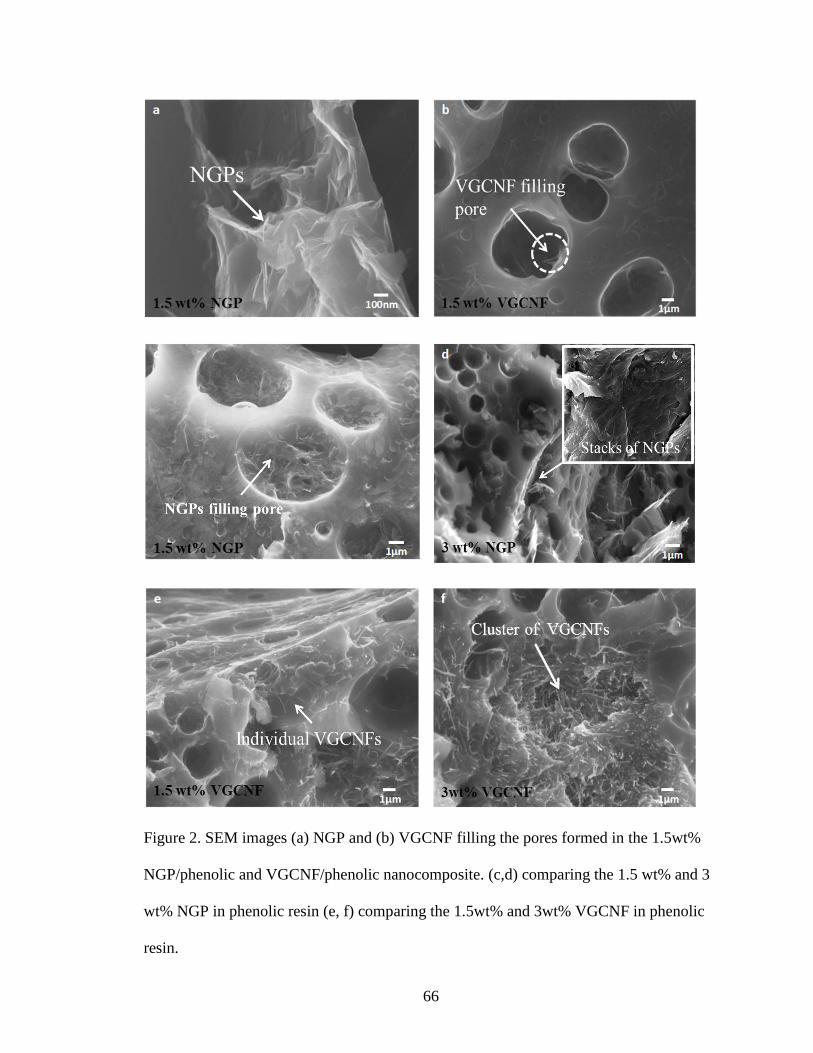
66
Figure 2. SEM images (a) NGP and (b) VGCNF filling the pores formed in the 1.5wt%
NGP/phenolic and VGCNF/phenolic nanocomposite. (c,d) comparing the 1.5 wt% and 3
wt% NGP in phenolic resin (e, f) comparing the 1.5wt% and 3wt% VGCNF in phenolic
resin.
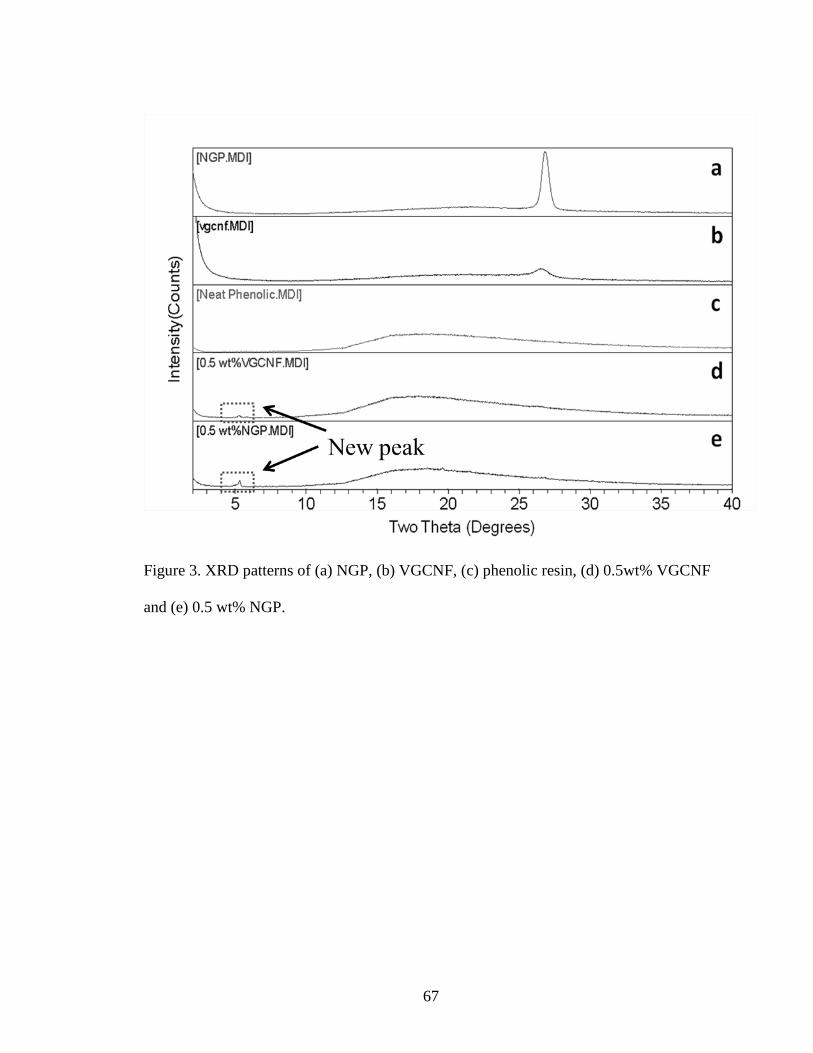
67
Figure 3. XRD patterns of (a) NGP, (b) VGCNF, (c) phenolic resin, (d) 0.5wt% VGCNF
and (e) 0.5 wt% NGP.
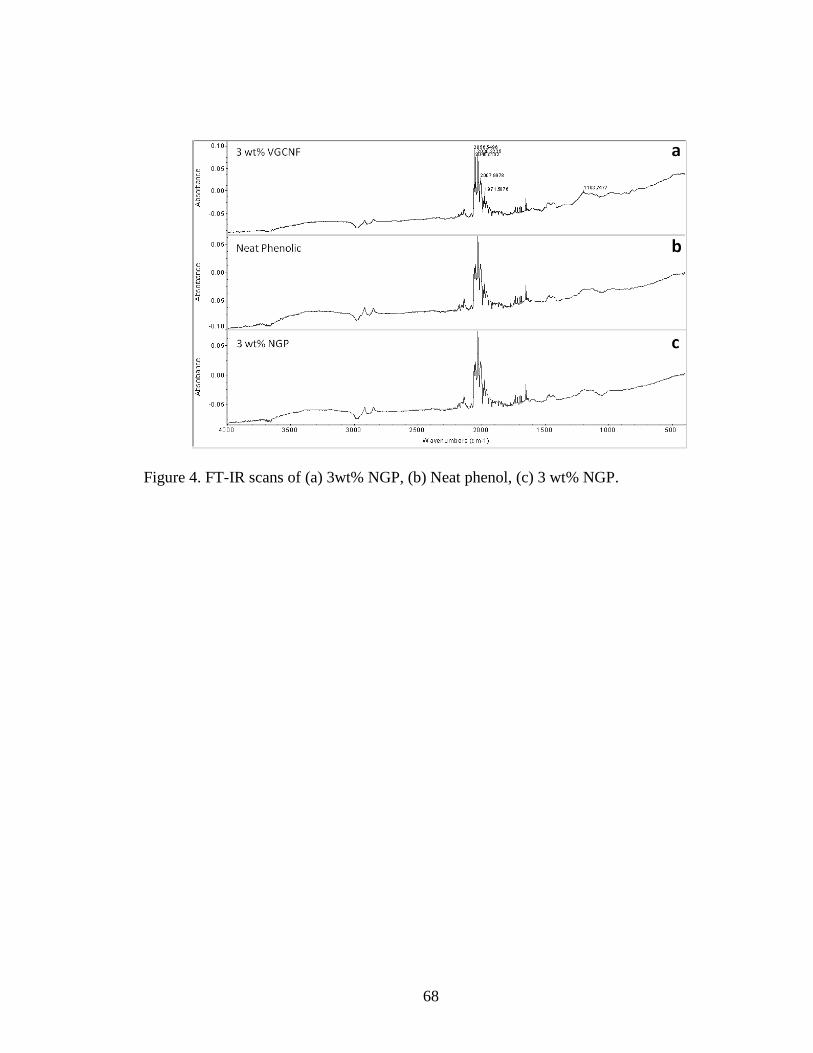
68
Figure 4. FT-IR scans of (a) 3wt% NGP, (b) Neat phenol, (c) 3 wt% NGP.
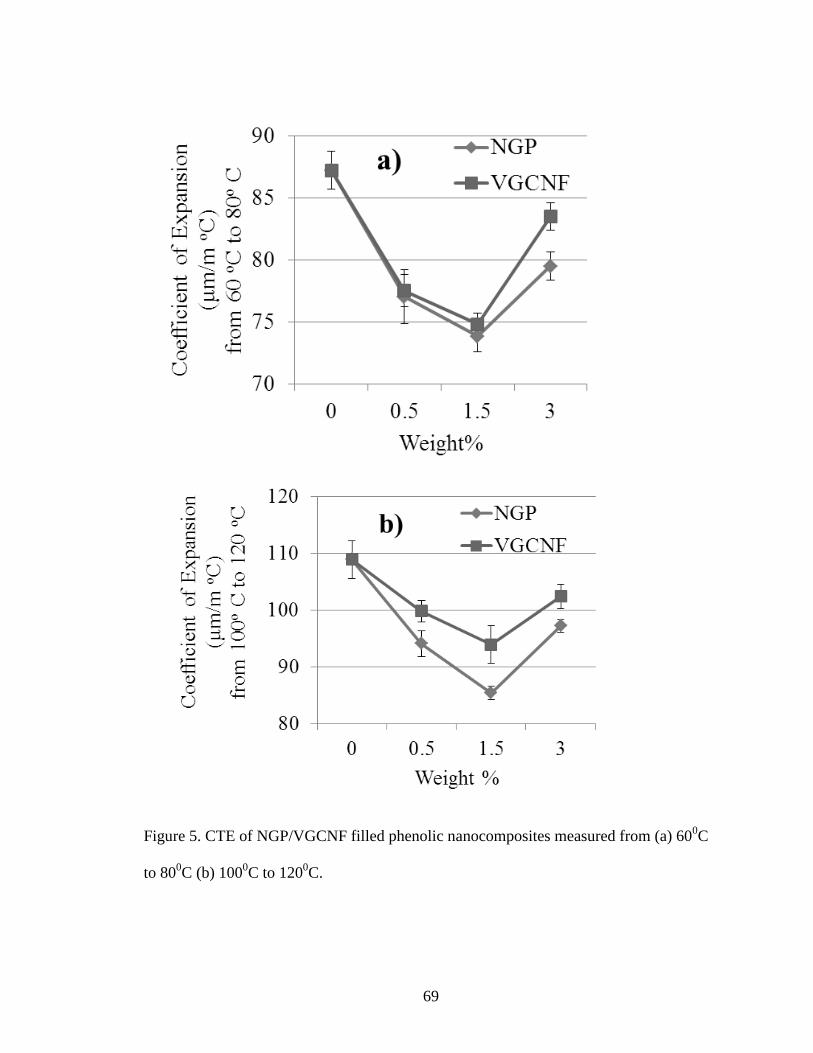
69
Figure 5. CTE of NGP/VGCNF filled phenolic nanocomposites measured from (a) 600C
to 800C (b) 100
0C to 120
0C.
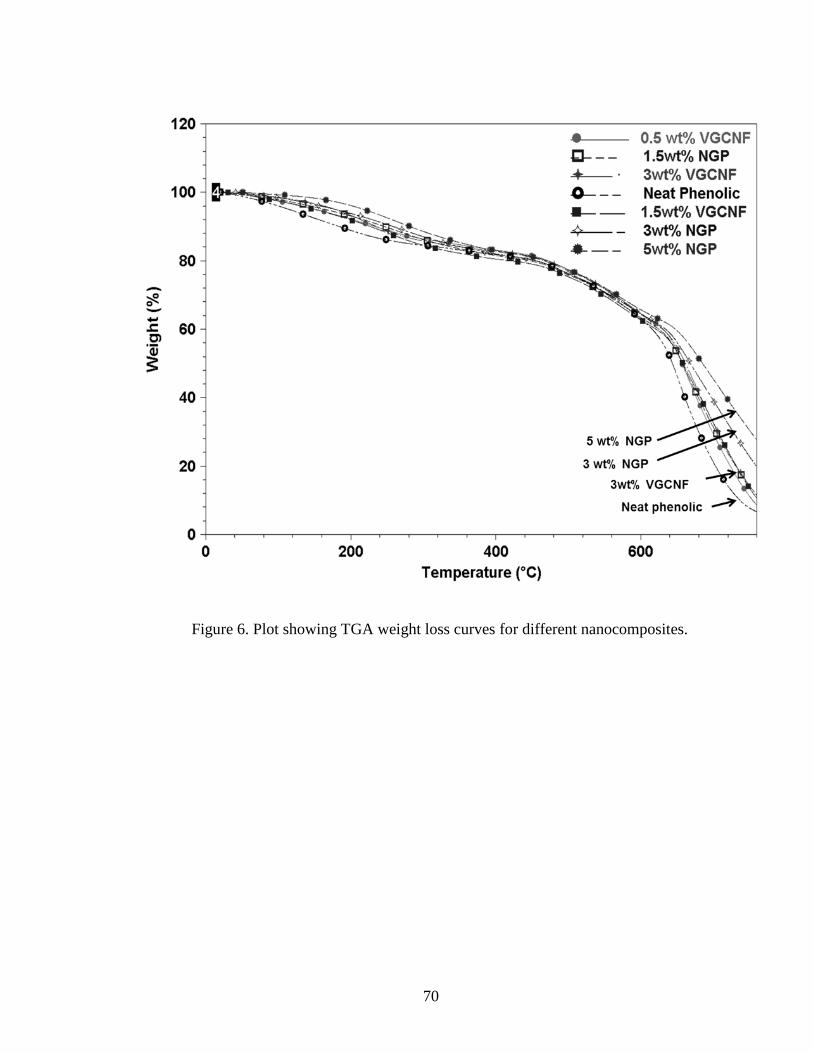
70
Figure 6. Plot showing TGA weight loss curves for different nanocomposites.
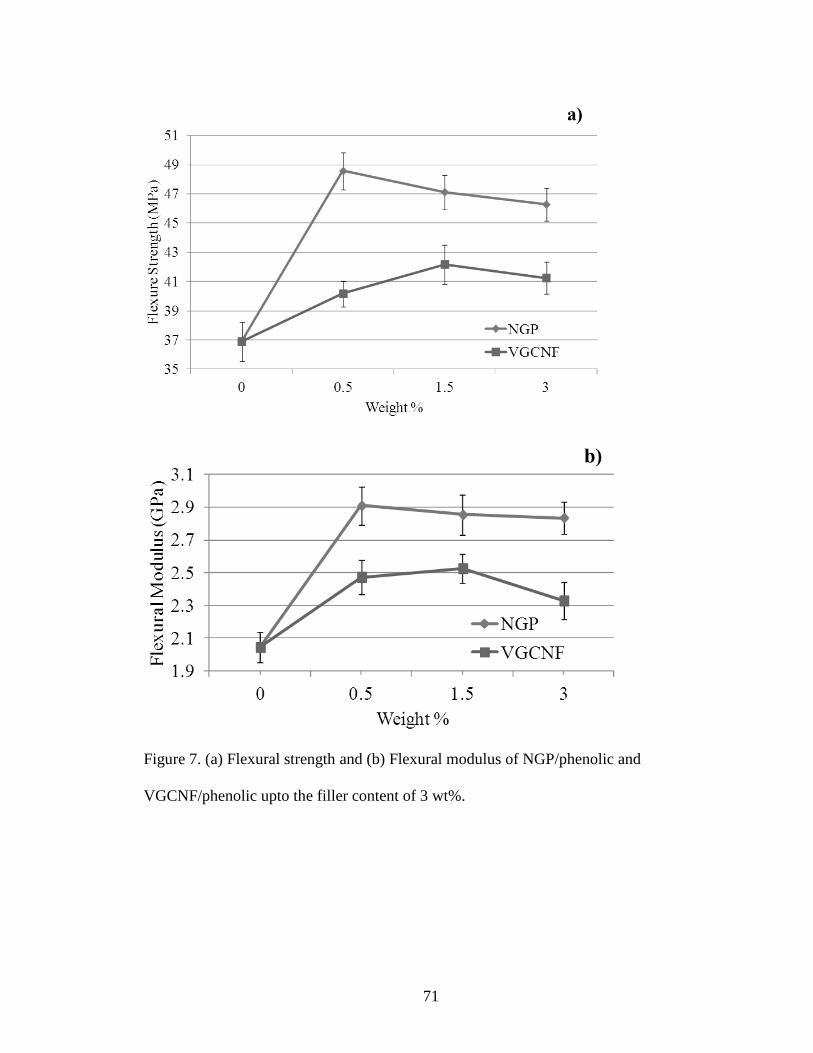
71
Figure 7. (a) Flexural strength and (b) Flexural modulus of NGP/phenolic and
VGCNF/phenolic upto the filler content of 3 wt%.
72
NANOGRAPHENE REINFORCED CARBON/CARBONCOMPOSITES
by
DHRUV BANSAL, SELVUM PILLAY, AND UDAY VAIDYA
Submitted to Carbon
Format adapted for dissertation
73
ABSTRACT
Phenolic resin based carbon – carbon composites (CCC) were produced by using
nanographene platelets (NGP) as nanofillers. Different weight concentration (0.5 wt%,
1.5 wt%, 3 wt%, 5 wt%) NGP were introduced by spraying the NGP during the prepreg
formation. The nanographene reinforced CCC were characterized for effect of NGP con-
centration on microstructure, porosity, inter laminar shear strength (ILSS), flexural, ultra-
sonic and vibration damping behavior. It was found that flexural properties and ILSS
increased whereas porosity and damping decreased with addition of NGP. At 1.5 wt%
NGP CCC, the highest values of ILSS observed was 10.5 MPa (increased by 22%), flex-
ure strength of 142.4 MPa (increased by 27%), flexural modulus of 59.2 GPa (increased
by 68%) and porosity of 18.8% (reduced by 17.5%) in comparison to neat (without NGP)
densified CCC. Ultrasonic testing revealed an average increase of 15% through the thick-
ness Young’s modulus of NGP- CCC; (3.12 GPa at 1.5 wt% NGP). Vibration analysis
showed a decrease in the damping ratio of CCC with the addition of NGP due to an in-
crease in stiffness and decrease in porosity. A 20% average decrease in the damping ratio
of the first four modes of vibration was observed in 1.5 wt% NGP densified CCC. At
low concentration (≤ 1.5 wt%) the NGP filled in the pores, cracks and debonded interface
but at concentration higher than 1.5 wt% NGP lost their effectiveness due to agglomera-
tion. The number of required cycles for desired density/properties is projected to be less
compared to neat CCC due to less porosity observed in ≤ 1.5 wt% NGP concentration
CCC.
74
1. INTRODUCTION
Carbon/carboncomposites (CCC) are known for their unique properties of low
density (1.6-2.0 gcm-3
), low coefficient of thermal expansion, high thermal shock re-
sistance, electrical conductivity, high strength, stiffness, wear, fatigue properties at high,
non-oxidizing temperatures (30000C). Due to their superior properties, they are used for
high temperature applications such as nose cones, heat shields, nozzles for rocket re-entry
vehicles, disc brakes for aircrafts, diesel engine components, high temperature corrosion
resistant fasteners, hot press dies , guides in glass industry, electromagnetic-nuclear radia-
tion shielding and plates for fuel cell1-5
. The properties of CCC can be tailored by proper
selection of reinforcement, matrix, and processing conditions resulting in desired micro-
structure.
Processing of CCC is done in four stages (Figure1) .These four stages are as-
cured, carbonization, densification and an optional graphitization step 6. In the as-cured
stage, the carbon fiber reinforcement is infused with vacuum assisted resin transfer meth-
od (VARTM) and the pre-preg obtained is cured by applying pressure and temperature.
This cured composite is then carbonized in an inert atmosphere at 800-10000C to remove
all elements except carbon which forms a carbon/carboncomposite. Porosity and cracks
are generated during carbonization due to thermal shrinkage and difference in thermal
conductivities of the carbon reinforcement and matrix which decrease the density and
properties of the manufactured CCC. Densification is done to increase the carbon content
and to eliminate porosity and microcracks by liquid infiltration of a high char yield resin
or by catalytic decomposition of low molecular weight hydrocarbon gas also known as
chemical vapor densification (CVD) followed by carbonization. Repeated densification
75
and carbonization cycles are required to achieve the target density and desired properties
making the manufacturing of CCC very expensive.
Carbon nanofillers like graphite powder, single-walled carbon nanotubes
(SWCNTs), muti-walled carbon nanotubes (MWCNTs) and vapor grown carbon nano-
fibers (VGCNF) have been introduced into CCC by various researchers. Carbon nano-
fillers help to tailor electrical, mechanical and thermal properties of CCC, decrease the
matrix shrinkage, bridge the cracks formation and increase the carbon content of the car-
bonized matrix. Kang and Jeong 7 introduced micro-sized graphite and pitch particles into
the phenolic resin and reported that the ILSS and flexure properties increase. Yasuda8
found a decrease in the phenolic matrix shrinkage during carbonization with the addition
of graphite particles. Ma et al.9 reported an increase in flexural strength and toughness
with the incorporation of 5 wt % graphite powder in phenolic matrix due to the decrease
in void content after carbonization. Tai et al.10, 11
introduced SWCNT’s and MWCNT’s
into the phenolic matrix and reported that Young’s modulus increased by 29.7% and the
tensile strength increased by 20.3% with the addition of 0.75 wt% and 2 wt% SWCNT
respectively. An increase in loss and storage modulus was reported with the incorporation
of MWCNTs into the phenolic resin. Manocha12, 13
introduced VGCNF into a phenolic
matrix and reported increased mechanical, thermal and electrical conductivity due to
nano crystalline anisotropic orientation at the interface. Dhakate14
was able to achieve
1.8-2.1 gm cm-3
CCC by applying isostatic pressure during carbonization at 1000 0C in-
corporating VGCNF into pitch followed by heat treatment at 2500 0C without any densi-
fication. Jain et al.15
found that VGCNF provided a bridging mechanism for matrix mi-
crocracking and reduced matrix shrinkage during carbonization. They reported the high-
76
est ILSS values of ∼40 MPa and 6 MPa at the as-cured and carbonized stages respective-
ly with the addition of 2% VGCNF.
These nanofillers are difficult to disperse in resin and offer processing challenges
associated with viscosity. In previous studies16, 17
, NGP were compared against VGCNF
in phenolic resin. It was concluded that NGP help in increasing the heat of curing, reduce
viscosity, increase wetting and carbon content of phenolic resin and thus may be used as
nanofillers for CCC.
In the present study, phenolic resin based CCC were fabricated by using NGP as
nanofillers. Different weight concentration (0.5 wt%, 1.5 wt%, 3 wt%, 5 wt%) NGP were
introduced in two stages. First, by spraying NGP on desized/surfactant treated 8- harness
satin weave carbon fabric. Later, NGP were introduced during densification by immers-
ing the carbonized composites in respective NGP/ phenolic resin dispersions under vacu-
um. The nanographene reinforced CCC were characterized for effects of NGP concentra-
tion on microstructure, porosity, inter laminar shear strength (ILSS), flexural, ultrasonic
and damping behavior.
2. EXPERIMENTAL
2.1. Materials
Resole type phenolic resin (GP 486G34) with catalyst (GP 4826C) (Supplier:
Georgia Pacific Resins, Inc.) was used as matrix. 8-Harness satin weave carbon fabric
(Supplier: U.S Composites) with tow size of 6k and 0.44 mm thickness was used as rein-
forcement. Trition X-100(t-Octylphenoxypolyethoxyethanol) from Sigma Aldrich was
used as a surfactant. Commercial grade acetone was used to desize the fabric. N-N Di-
77
methlyformamide anhydrous 99.8% from Sigma Aldrich used as a dispersing medium.
Nanographene platelets (N008-100-P-10) from Angstron Materials, Ohio with 1.4%
atomic percentage of oxygen were used as filler having average x - y dimensions less
than 10 micrometer and z dimension between 50-100 nanometers.
2.2. Methods
2.2.1 NGP sprayed pre-preg formation
Eight plies measuring 0.1524m × 0.1524m of 8-harness carbon satin fabric were
cut and desized using acetone (completely immersed) for 15 hours. This was followed by
12.5% v/v surfactant (Triton X-100) treatment in acetone for 24 hours. Surface-treated
fabrics were dried in air. The required weight of NGP per the desired concentration was
dispersed in DMF using Cole Palmer ultrasonic bath (Model 8852-34) for two intervals
of 7 minutes each. The dispersion ratio of 0.5 grams of NGP per 75 ml of DMF was
maintained. The prepared dispersion was sprayed on the eight fabric layers by means of
an air spray gun resulting in a fine uniform layer of NGP on the fabric plies (Figure 2).
After spraying, the wet sheets were dried in a recirculating air oven for 30 min at 1600C
to evaporate the DMF from the plies (boiling point of DMF is 1530C). NGP sprayed plies
were used to prepare a pre-preg by infusing the phenolic resin mixed with catalyst (ratio
100:8) using the vacuum assisted resin transfer molding (VARTM)18
technique. The
composite was left under vacuum for 24 hours to precure.
78
2.2.2 Curing of pre-preg by applying pressure and heat/As-cured stage.
The prepreg formed was cured in a heated press by applying a pressure of 40 psi,
and the temperature was varied from 60 0C to 90
0C at a rate of 10
0C per 2 hours.
2.2.3 Carbonization or formation of carbon/carboncomposite.
The test specimens were cut into 80mm× 10mm× 4mm for flexure, 24mm × 8
mm × 4mm for ILSS and 150mm× 27mm× 4mm for ultrasonic and vibration testing.
The cut specimens were then carbonized in a tube furnace at maximum 800 0C under
inert conditions for a cycle time of approximately 18 hours (Figure 3). The carbonization
step was necessary to remove the volatiles from the phenolic resin.
2.2.4 Densification with dispersions of different concentrations of NGP/Phenolic disper-
sions
Varying concentration dispersions of NGP (0.5 wt%, 1.5 wt%, 3 wt% and 5 wt%)
in phenolic were prepared using ultrasonic probe and shear mixer as reported in previous
work16
. The prepared dispersions were then used to densify the respective NGP concen-
tration carbonized composite. The densification was done for 24 hours and CCC were
cured under 25 mm Hg vacuum at a heating rate of 400C to 140
0C with increments of 50
0C / 2 hours for a total of 4 hours.
79
2.3. Characterization
2.3.1 Microscopic and SEM characterization
Stereo micrographs of the CCC at stages of as-cured, carbonization and densifica-
tion were taken using Olympus Stemi SV II stereomicroscope. A Field Emission Scan-
ning Electron Microscope FEI-FEG 650 with 20 kV accelerating voltage was used to
study the morphology of manufactured CCC. The samples were first sputter coated with
gold-palladium to make them conductive.
2.3.2 Bulk density and porosity testing
Dry weight, suspended weight and wet weight were measured using a Mettler To-
ledo balance (Model AG204, equipped with immersion density apparatus). Testing and
calculations were done according to ASTM C20.
2.3.3 ILSS and flexure testing
ILSS and flexure tests were performed using SATEC T-500 screw driven ma-
chine at room temperature using ASTM D2344 and ASTM C393. Samples measuring
24mm × 8mm × 4mm with span length of 16mm for ILSS and 80mm ×10mm × 4mm
with span length of 64 mm for flexure were cut and loaded at the rate of 1.3mm/min for
flexure and at 1mm/min for ILSS testing.
2.3.4 Non-Destructive testing – ultrasonic through transmission and vibration testing
Ultrasonic testing of the CCC was done using the dry coupling through transmis-
sion technique19
. Parametrics computer-controlled pulser/receiver model 5800 was used
80
to set the input parameters ( Mode-Thru, energy- 100 µJ, damping 50 ohms, input attenu-
ation – 0 dB, output attenuation- 10 dB, gain -60 dB). Tektronix TDS 210 two channel
digital real time oscilloscope was used to monitor the time of flight of the ultrasonic
wave.
The vibration response and damping of CCC is vital in their application as high
temperature aerospace heat shielding materials and in disc brakes. The vibration behavior
is measured by applying a force to excite the individual samples and the output response
is measured as displacement, velocity or acceleration as the function of frequency of vi-
bration also called the frequency response function (FRF). Vibration testing samples were
mounted in free-free edge support condition by bee wax on the impedance head attached
to a mini shaker/exciter (B&K 4809). The excitation was driven by B&K power amplifier
type 2706 used to generate random noise. A signal analyzer (B&K 3560-B-140) was
used to obtain a frequency response function from the measured force and acceleration
signals from the impedance head. The damping ratio was calculated using the half power
method20
. A detailed description of the testing method used can be found in
[Reference 21
].
3. RESULTS AND DISCUSSIONS
3.1. Microstructure, morphology, porosity and bulk density
The composites were observed under a stereomicroscope and field emission scan-
ning electron microscope for changes in microstructure and morphology after the stages
of as-cured, carbonization and densification. Figure 4 shows the gradual effect of pro-
81
cessing with respect to defects at the various stages in neat, 0.5 wt%, 1.5 wt%, 3 wt% and
5wt% NGP reinforced CCC.
A representative sample from each NGP concentration CCC was observed under
a stereomicroscope as it went through the processing stages. The measurement of porosi-
ty and bulk density was done according to ASTM C20, and the values are shown in
Figure 5.
At the as-cured stage, the least porosity of 3.2% was observed at 1.5 wt% NGP,
followed by 3.9% porosity at 0.5 wt% NGP. The bulk density increased by 6% at 1.5
wt% NGP compared to the neat CCC. The stereomicroscope images confirmed the de-
crease in porosity at 0.5wt% NGP and 1.5 wt% NGP. It was also noticed (Figure 4) that
the size of the pores decreased at 0.5wt% and 1.5wt% NGP as compared to neat as-cured
composite. However, as the concentration of NGP was increased to 3wt% and 5wt% po-
rosity increased to 4.3% and 4.9%, respectively. The size of pores also increased at 3wt%
and 5 wt% (Figure 4).
The decrease in porosity at lower NGP concentration (≤ 1.5wt %) was due to fill-
ing of pores by NGP as they were less likely to get agglomerated. Figure 6a shows NGP
filling the pores at 1.5wt% NGP as-cured composite. At concentration greater than
1.5wt%, the NGP had a tendency to get agglomerated in the phenolic resin, as also ob-
served in earlier studies16, 17
. Agglomeration of NGP may have also created dry areas and
increased porosity. Increase in porosity of phenolic due to creation of dry areas caused
by agglomeration of VGCNF at high concentration (5% wt/wt), has also been reported by
Jain et al.15
.
82
During the carbonization stage, the porosity increased for all the cases due to
thermally induced matrix shrinkage and microcracking, creating microporosity in the
material (Figure 4). Interfacial debonding was also observed due to thermal mismatch
(Figure 4). In case of the 0.5wt% and 1.5 wt% NGP carbonized CCC, less matrix crack-
ing was observed compared to neat, 3wt% and 5 wt% NGP carbonized CCC.
This can be explained as follows. The rigid NGP provide the tortuous route for
the volatiles to escape resulting in less porosity and increase in char yield22
. The least
porosity of -19% and highest density of 1.3 g cm-3
was observed in the case of the 1.5
wt% carbonized CCC. The behavior was governed by two counter acting mechanisms.
At lower concentration (≤ 1.5 wt%), NGP were small enough to fill in the pores and slip
into the cracks and debonded interface. However, at higher concentration (>1.5 wt%)
NGP had higher tendency to agglomerate and were not small enough to penetrate into
cracks and voids. Figure 6b shows agglomerated NGP in the proximity of the surface of
the debonded area; on the other hand, comparatively less agglomerated NGP sheets pene-
trated inside to fill the empty space. Figure 6c, d & e indicate the micro cracks filled by
NGP in 3 wt% NGP carbonized CCC.
At the densification stage, some of the pores formed during the carbonization
were filled (Figure 4). In general, the area of large pores formed during carbonization was
reduced. The microstructure of each sample was governed by the carbonization process
where as densification reduced the damage by filling voids and cracks to some degree.
After densification, the porosity decreased to 12.2% and bulk density increased by 6.3%
in 1.5 wt% NGP densified CCC as compared to neat CCC. Although more number of
densification and carbonization cycles will be required to obtain the desired void and

83
crack free microstructure, due to less porosity in ≤ 1.5 wt% NGP CCC compared to neat
CCC, it is expected that the number of required cycles will be less.
3.2 Inter Laminar Shear Strength (ILSS) and Flexure Testing
ILSS and flexure testing of the CCC with different concentrations of NGP was
conducted. A general trend of an increase in properties at all three stages (as-cured, car-
bonization and densification) with NGP addition was observed (Figure 7). At the as-
cured stage the highest interlaminar shear strength observed was 36.4 MPa with 0.5 wt%
NGP addition, an increase of 36.5% compared to the neat composite. The flexural modu-
lus increased by 45% to 61GPa in the 1.5 wt% NGP composite and the flexural strength
increased by 8.8 % to 548 MPa in 5 wt% NGP as-cured composite. This increase could
be attributed to the benefits of NGP which translate to increased properties of the as-
cured composites.
After the carbonization, the ILSS and flexure properties of all the CCC samples
decreased due to the increase in porosity, transverse thermal cracking and matrix shrink-
age. The flexure and ILSS behavior could be explained by the microstructure observed.
As the porosity reduced at ≤ 1.5 wt% NGP, flexure and ILSS increased. As the porosity
started to increase at concentration > 1.5 wt%, the ILSS and flexure properties plateaued
and then started to decrease.
The highest properties were observed at 1.5 wt% NGP, flexure strength of 94
MPa, flexure modulus of 41.8 GPa and ILSS of 7.33 MPa. Though there was a reduction
in ILSS and flexure properties after carbonization, it was observed that with NGP addi-
tion higher residual inter laminar and flexure strength were retained in the CCC.
84
Flexure and ILSS properties after densification increased from the corresponding carbon-
ized composites. In general, the increase was more with addition of NGP with maximum
ILSS and flexure properties observed at 1.5 wt%. The increase could be attributed to the
filling of pores generated during carbonization by the char generated from carbonization
of phenolic resin or by NGP. The highest ILSS observed was 10.5 MPa (increase of 22%
compared to neat CCC), flexure strength of 142.4 MPa (increase of 27%) and flexural
modulus of 59.2 GPa increase of 68%.
In summary, the ILSS and flexure properties at all three stages (as-cured, carbon-
ized and densified) increased with addition of NGP as they filled the pores and increased
the carbon content in the CCC. At higher concentrations (> 1.5 wt% NGP), although a
decrease in ILSS and flexure properties of the CCC was observed due to agglomeration
of NGP, the properties were still higher than the CCC without any NGP.
3.3 Ultrasonic and vibration damping measurements
Ultrasonic through transmission and vibration response of the manufactured CCC
were measured to discern the effect of NGP concentration on the three processing stages.
Ultrasonic measurements were done in through transmission mode using a Ultran 2.25
MHz ultrasonic frequency sensor pair along the thickness direction of the manufactured
CCC. The dry coupling probe approach avoids the use of a wet ultrasonic couplant,
which can enter the microcracks, which is undesirable. Figure 8 shows the ultrasonic
signals observed for the 0.5 wt% NGP CCC after as-cured, carbonization and densifica-
tion stages. It can be noticed that after carbonization the maximum attenuation of ultra-
sonic waves occurs due to matrix shrinkage leading to transverse cracks and porosity.
85
After densification, the intensity of the ultrasonic waves increased again proving success-
ful filling of pores and voids during densification.
Table 1 summarizes the thickness, time of flight, ultrasonic velocity, density and
Young’s modulus of the CCC for different concentrations of NGP for the as-cured, car-
bonized and densified stage. Young’s modulus was calculated using the equations:
---- (1)
------ (2)
where is Young’s modulus, is velocity of the ultrasonic wave during through the
thickness transmission, is density of the CCC, is the thickness of CCC and is the
time taken by ultrasonic wave to travel from one tranducer to the other. The through the
thickness modulus of the CCC decreased after carbonization due to matrix shrinkage, but
the ultrasonic velocity decreased due to the formation of pores and cracks. The highest
values of Young’s modulus based on ultrasonic tests were observed at 1.5 wt% NGP
CCC at all three stages. The value of Young’s modulus in the thickness direction is de-
pendent on the interfacial condition between the polymer matrix and the carbon fabric
reinforcement. As the debonded interface, pores and cracks were filled by NGP at ≤ 1.5
wt% concentration (Figure 6); the value of Young’s modulus was high and thereafter it
started to decrease because of agglomeration of NGP at concentration greater than 1.5
wt%. The average decrease in Young’s modulus in CCC from after carbonization was
49% and average increase after densification was 15%.
Figure 9a and 9b show the effect of processing stages on vibration response of 1.5
wt% NGP CCC and effect of NGP concentration on vibration response of the as-cured
stage in CCC. The same trend was observed for other concentrations and after carboniza-
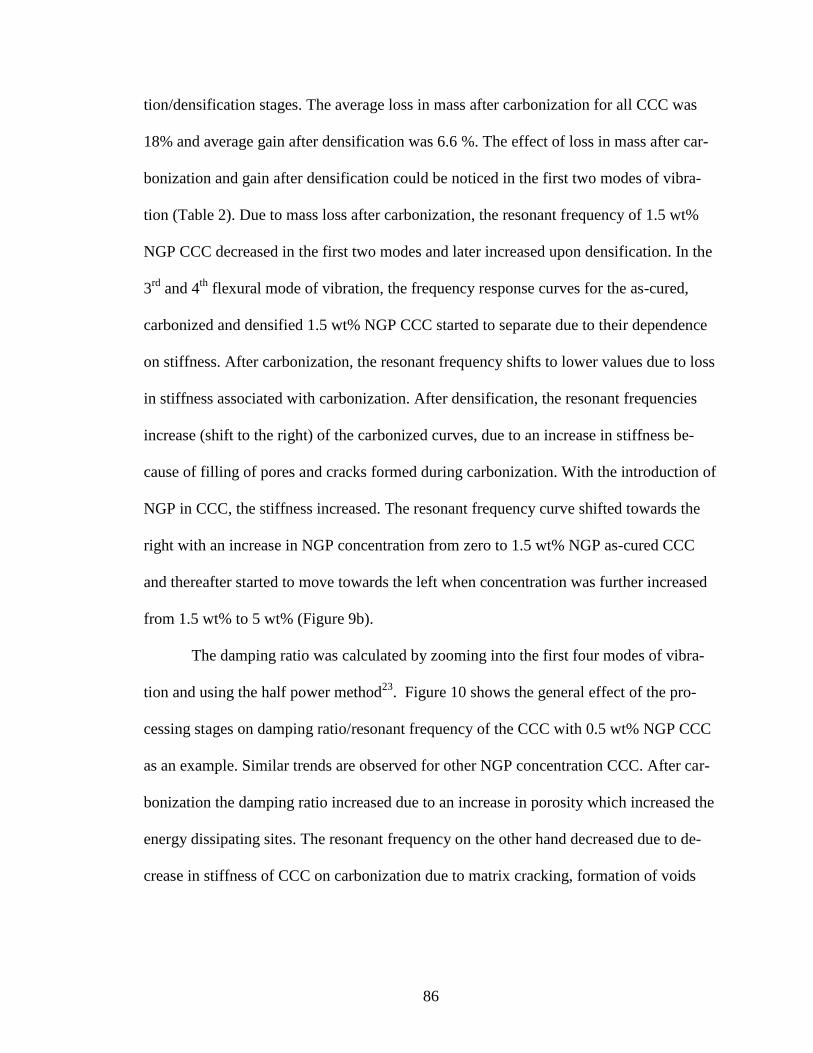
86
tion/densification stages. The average loss in mass after carbonization for all CCC was
18% and average gain after densification was 6.6 %. The effect of loss in mass after car-
bonization and gain after densification could be noticed in the first two modes of vibra-
tion (Table 2). Due to mass loss after carbonization, the resonant frequency of 1.5 wt%
NGP CCC decreased in the first two modes and later increased upon densification. In the
3rd
and 4th
flexural mode of vibration, the frequency response curves for the as-cured,
carbonized and densified 1.5 wt% NGP CCC started to separate due to their dependence
on stiffness. After carbonization, the resonant frequency shifts to lower values due to loss
in stiffness associated with carbonization. After densification, the resonant frequencies
increase (shift to the right) of the carbonized curves, due to an increase in stiffness be-
cause of filling of pores and cracks formed during carbonization. With the introduction of
NGP in CCC, the stiffness increased. The resonant frequency curve shifted towards the
right with an increase in NGP concentration from zero to 1.5 wt% NGP as-cured CCC
and thereafter started to move towards the left when concentration was further increased
from 1.5 wt% to 5 wt% (Figure 9b).
The damping ratio was calculated by zooming into the first four modes of vibra-
tion and using the half power method23
. Figure 10 shows the general effect of the pro-
cessing stages on damping ratio/resonant frequency of the CCC with 0.5 wt% NGP CCC
as an example. Similar trends are observed for other NGP concentration CCC. After car-
bonization the damping ratio increased due to an increase in porosity which increased the
energy dissipating sites. The resonant frequency on the other hand decreased due to de-
crease in stiffness of CCC on carbonization due to matrix cracking, formation of voids
87
and interface debonding. Upon densification, the damping ratio decreased due to filling
of pores and the resonant frequency increased due to an increase in stiffness.
The effect of increasing NGP concentration on the damping ratio/resonance
frequency of the CCC after the as-cured, carbonized and densified stages are shown in
Figure 11. Table 2 lists the damping ratio and resonant frequency values obtained for the
first four flexural modes after the as-cured, carbonization and densification stages of the
manufactured CCC. In general, the damping ratio decreased and resonant frequency
increased with the introduction of NGP into CCC in all three stages. The reduction in
damping could be because of the filling of cracks and voids by NGP which also led to an
increase in stiffness and hence the resonant frequency.
At the as-cured stage, except for the 4th mode 1.5 wt% NGP, CCC had the lowest
damping ratio. The highest average reduction in the damping ratio of all the four modes
was about 19% in 1.5 wt% NGP CCC compared to the neat as-cured CCC. The reduction
in damping could be attributed to the lowest porosity observed in the 1.5 wt% NGP CCC
(Figure 5 b). A similar trend was also observed after the carbonization and densification
stage with 25% and 20% average reduction in the damping ratio of the four modes in 1.5
wt% NGP CCC. After 1.5 wt% NGP concentration, damping ratio started to increase due
to an increased tendency of agglomeration leading to an increase in porosity. However,
the damping ratio still remained lower than that of neat CCC.
4. SUMMARY AND CONCLUSIONS
Carbon/carboncomposites (CCC) were fabricated by introducing nanographene
platelets (NGP) as nanofillers by the spraying technique. NGP were introduced in con-
88
centrations of 0.5 wt%, 1.5 wt%, 3 wt% and 5wt% to see the effect of concentration on
the microstructure, flexural properties, inter laminar shear strength and damping proper-
ties of CCC. The following observations were made:
At 1.5 wt% NGP densified CCC, the highest ILSS observed was 10.5 MPa (increased by
22%), flexure strength of 142.4 MPa (increased by 27%), flexural modulus of 59.2 GPa
(increased by 68%) and porosity of 18.8% (reduced by 17.5%) compared to neat densi-
fied CCC. The increase in mechanical properties was attributed to NGP filling the pores
generated after carbonization which led to an increase in stiffness and density.
Ultrasonic testing revealed an average increase of 15% in through the thickness
Young’s modulus of densified CCC reinforced with NGP; highest being 3.12 GPa at 1.5
wt% densified NGP CCC. NGP filled the debonded interface between carbonized matrix
and carbon fibers to increase the through the thickness Young’s modulus. The observa-
tion also backed the ILSS results as more force was needed to cause inter lamina failure
due to NGP reinforcement.
Vibration analysis showed a decrease in the damping ratio of CCC with the addi-
tion of NGP because of an increase in stiffness and decrease in porosity and hence the
energy dissipating sites. The average decrease in damping ratio of the first four modes of
vibration was 20% in 1.5 wt% NGP densified CCC.
At low concentrations (≤ 1.5 wt%), NGP filled in the pores, cracks and debonded
interface; but at concentration higher than 1.5 wt%, NGP lost their effectiveness due to
agglomeration. This led to plateauing of the properties after 1.5 wt% followed by a de-
crease on further NGP addition.
89
The required number of densification-carbonization cycles for desired densi-
ty/properties CCC will be reduced due to better mechanical properties observed in NGP
reinforced CCC compared to neat CCC.
ACKNOLEDGEMENT
The support from NSF Experimental Program to Stimulate Competitive Research
(EPSCoR) – Alabama Center for Nanostructured Materials (ACNM) is gratefully
acknowledged. NSF EPSCoR RII Grant number 1158862. Author is grateful to Dr. Robin
Foley for helping in conducting SEM studies; Ahmed Arabi Hassan for helping in con-
ducting Ultrasonic testing, Material Science and Engineering-University of Alabama at
Birmingham.
REFERENCES
1.Windhorst, T.; Blount, G., Carbon/carboncomposites: a summary of recent
developments and applications. Materials and Design 1997, 18, 11-15.
2. Manocha, L. M., High performance carbon/carboncomposites. Sadhana - Academy
Proceedings in Engineering Sciences 2003, 28, 349-358.
3. Fitzer, E., FUTURE OF CARBON/CARBONCOMPOSITES. Carbon 1987, 25, 163-
190.
4. Klein, A. J., CARBON/CARBON COMPOSITES. Advanced Materials and Processes
1986, 130, 64-68.
5. Schmidt, D. L.; Davidson, K. E.; Theibert, L. S. In Applications of
carbon/carboncomposites, Proceedings of the 1997 42nd International SAMPE
90
Symposium and Exhibition. Part 1 (of 2), May 4, 1997 - May 8, 1997, Anaheim, CA,
USA, SAMPE: Anaheim, CA, USA, 1997; pp 1482-1493.
6. Stoller, H. M.; Frye, E. R., PROCESSING OF CARBON/CARBON COMPOSITES-
AN OVERVIEW. SAMPE Quarterly 1972, 3, 10-22.
7. Kang, T. J.; Jeong, Y. W., Mechanical properties of matrix-modified carbon/carbon
composites. Polymers and Polymer Composites 1997, 5, 469-475.
8. Yasuda, E.; Tanabe, Y.; Manocha, L. M.; Kimura, S., MATRIX MODIFICATION BY
GRAPHITE POWDER ADDITIVES IN CARBON FIBER/CARBON COMPOSITE
WITH THERMOSETTING RESIN PRECURSOR AS A MATRIX. Carbon 1988, 26,
225-227.
9. Ma, C.-C. M.; Chen, C.-B.; Chang, W.-C. In Processability and morphology of
phenolic matrix carbon/carbon composites (I), 37th International SAMPE Symposium
and Exhibition, March 9, 1992 - March 12, 1992, Anaheim, CA, USA, Publ by
SAMPE: Anaheim, CA, USA, 1992; pp 521-530.
10. Tai, N.-H.; Yeh, M.-K.; Peng, T.-H., Experimental study and theoretical analysis on
the mechanical properties of SWNTs/phenolic composites. Composites Part B:
Engineering 2008, 39, 926-932.
11.Yeh, M.-K.; Tai, N.-H.; Liu, J.-H. In Dynamic mechanical properties of
MWNTs/phenolic nanocomposites, Fracture and Strength of Solids VI, Trans Tech
Publications Ltd: 2006; pp 1073-1078.
12. Manocha, L. M., Introduction of nanostructures in carbon/carboncomposites.
Materials Science and Engineering A 2005, 412, 27-30.
91
13. Manocha, L. M.; Warrier, A.; Manocha, S.; Edie, D. D.; Ogale, A. A. In
Microstructure of carbon/carbon composites reinforced with pitch-based ribbon-
shape carbon fibers, Elsevier Ltd: 2003; pp 1425-1436.
14. Dhakate, S. R.; Mathur, R. B.; Dhami, T. L. In Development of vapor grown carbon
fibers (VGCF) reinforced carbon/carbon composites, Kluwer Academic Publishers:
2006; pp 4123-4131.
15. Jain, R.; Vaidya, U. K.; Haque, A., Processing and characterization of
carbon/carbonnanofiber composites. Advanced Composite Materials: The Official
Journal of the Japan Society of Composite Materials 2006, 15, 211-241.
16. Bansal Dhruv, P. S., and Vaidya Uday, Processing and characterization of
nanographene platelets modified carbon/carboncomposites- Part I. 2012.
17. Dhruv, B.; Selvum, P.; Uday, V., Processing and characterization of nanographene
platelets modified carbon/carboncomposites- Part II. 2012.
18. Pike, T.; McArthur, M.; Schade, D. In Vacuum assisted resin transfer molding of a
layered structural laminate for application on ground combat vehicles, Proceedings
of the 1996 28th International SAMPE Technical Conference, November 4, 1996 -
November 7, 1996, Seattle, WA, USA, SAMPE: Seattle, WA, USA, 1996; pp 374-
380.
19. M.C., B., Ultrasonic Charaterization of Ceramics. Supplement to Interceram: Ceramic
Monographs, 1992; Vol. 41 [7/8].
20. Vaidya, U. K.; Raju, P. K.; Kowbel, W., Material damping studies on
carbon/carboncomposites. Carbon 1992, 30, 925-929.
92
21. K, V. U.; K, R. P., Monitoring processing stages of carbon/carboncomposites using
vibration based nondestructive evaluation. Materials Evaluation, June 1994; pp pp.
682-688.
22. Kim, S.; Do, I.; Drzal, L. T., Thermal stability and dynamic mechanical behavior of
exfoliated graphite nanoplatelets-LLDPE nanocomposites. Polymer Composites 2010,
31, 755-761.
23. Vaidya, U. K.; Mahfuz, H.; Jeelani, S., Ultrasonic and vibration characterization of
hybrid and sandwich carbon/carboncomposites. Ceramic Engineering and Science
Proceedings 1995, 16, 289-298.
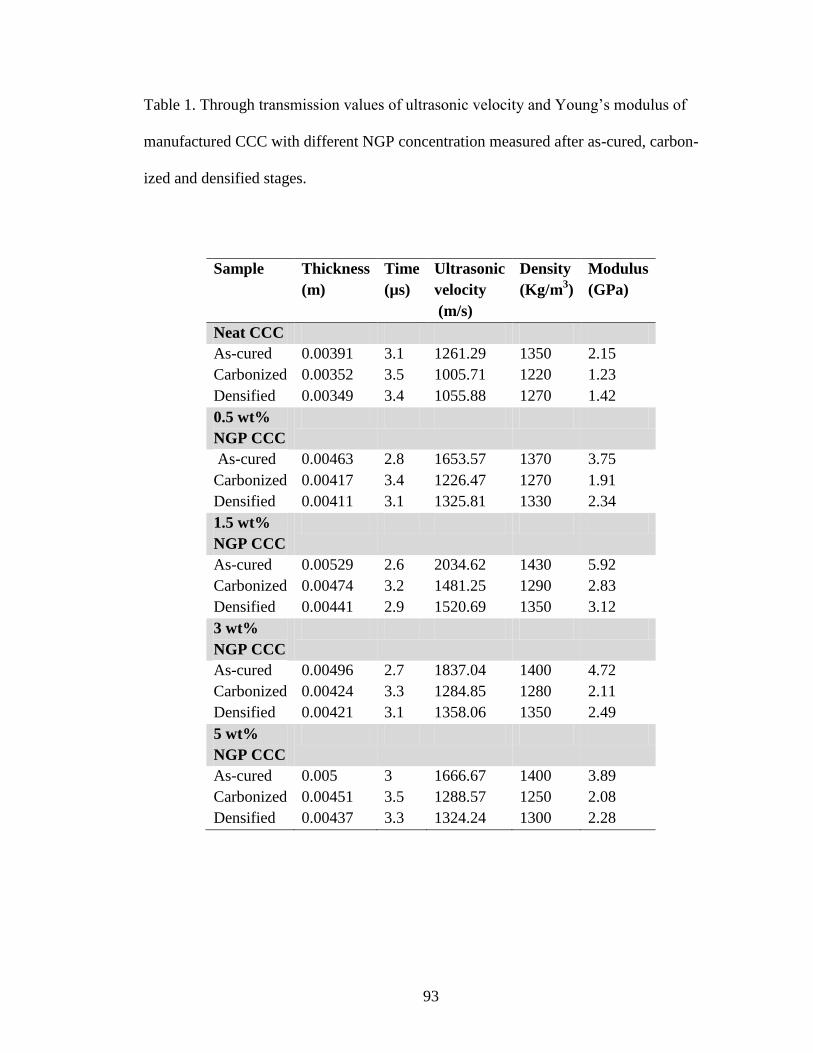
93
Table 1. Through transmission values of ultrasonic velocity and Young’s modulus of
manufactured CCC with different NGP concentration measured after as-cured, carbon-
ized and densified stages.
Sample Thickness
(m)
Time
(µs)
Ultrasonic
velocity
(m/s)
Density
(Kg/m3)
Modulus
(GPa)
Neat CCC
As-cured 0.00391 3.1 1261.29 1350 2.15
Carbonized 0.00352 3.5 1005.71 1220 1.23
Densified 0.00349 3.4 1055.88 1270 1.42
0.5 wt%
NGP CCC
As-cured 0.00463 2.8 1653.57 1370 3.75
Carbonized 0.00417 3.4 1226.47 1270 1.91
Densified 0.00411 3.1 1325.81 1330 2.34
1.5 wt%
NGP CCC
As-cured 0.00529 2.6 2034.62 1430 5.92
Carbonized 0.00474 3.2 1481.25 1290 2.83
Densified 0.00441 2.9 1520.69 1350 3.12
3 wt%
NGP CCC
As-cured 0.00496 2.7 1837.04 1400 4.72
Carbonized 0.00424 3.3 1284.85 1280 2.11
Densified 0.00421 3.1 1358.06 1350 2.49
5 wt%
NGP CCC
As-cured 0.005 3 1666.67 1400 3.89
Carbonized 0.00451 3.5 1288.57 1250 2.08
Densified 0.00437 3.3 1324.24 1300 2.28
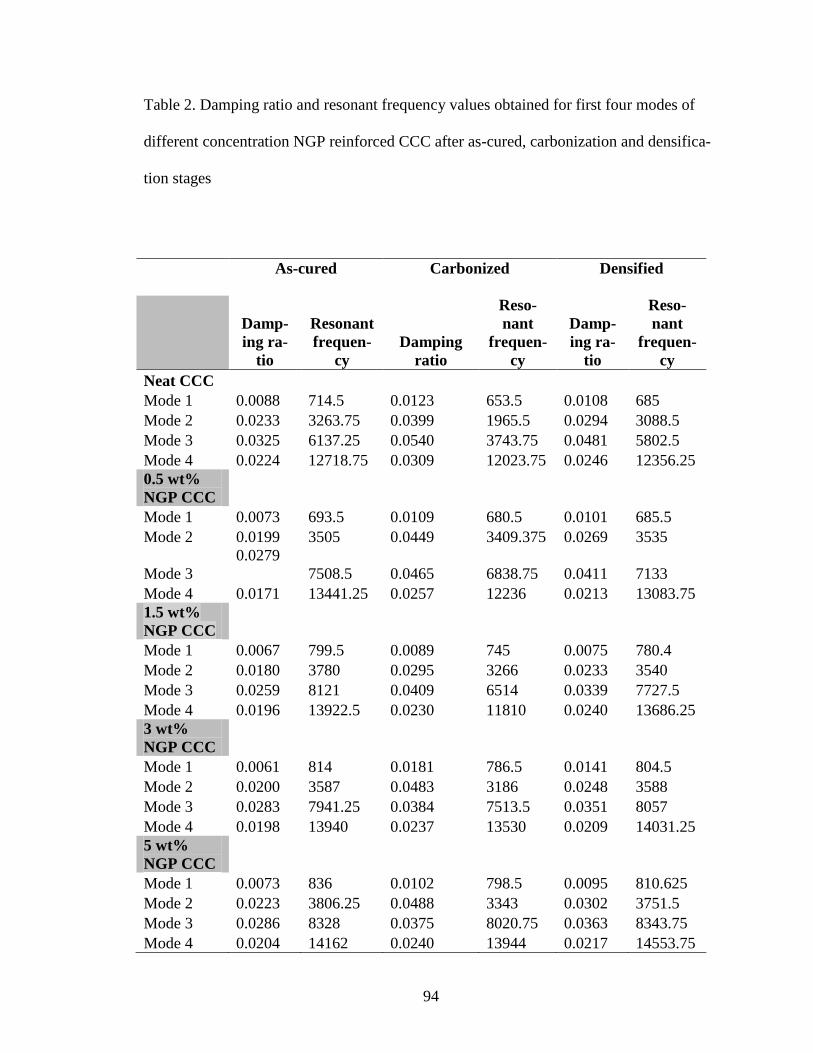
94
Table 2. Damping ratio and resonant frequency values obtained for first four modes of
different concentration NGP reinforced CCC after as-cured, carbonization and densifica-
tion stages
As-cured
Carbonized
Densified
Damp-
ing ra-
tio
Resonant
frequen-
cy
Damping
ratio
Reso-
nant
frequen-
cy
Damp-
ing ra-
tio
Reso-
nant
frequen-
cy
Neat CCC
Mode 1 0.0088 714.5 0.0123 653.5 0.0108 685
Mode 2 0.0233 3263.75 0.0399 1965.5 0.0294 3088.5
Mode 3 0.0325 6137.25 0.0540 3743.75 0.0481 5802.5
Mode 4 0.0224 12718.75 0.0309 12023.75 0.0246 12356.25
0.5 wt%
NGP CCC
Mode 1 0.0073 693.5 0.0109 680.5 0.0101 685.5
Mode 2 0.0199 3505 0.0449 3409.375 0.0269 3535
Mode 3
0.0279
7508.5 0.0465 6838.75 0.0411 7133
Mode 4 0.0171 13441.25 0.0257 12236 0.0213 13083.75
1.5 wt%
NGP CCC Mode 1 0.0067 799.5 0.0089 745 0.0075 780.4
Mode 2 0.0180 3780 0.0295 3266 0.0233 3540
Mode 3 0.0259 8121 0.0409 6514 0.0339 7727.5
Mode 4 0.0196 13922.5 0.0230 11810 0.0240 13686.25
3 wt%
NGP CCC Mode 1 0.0061 814 0.0181 786.5 0.0141 804.5
Mode 2 0.0200 3587 0.0483 3186 0.0248 3588
Mode 3 0.0283 7941.25 0.0384 7513.5 0.0351 8057
Mode 4 0.0198 13940 0.0237 13530 0.0209 14031.25
5 wt%
NGP CCC Mode 1 0.0073 836 0.0102 798.5 0.0095 810.625
Mode 2 0.0223 3806.25 0.0488 3343 0.0302 3751.5
Mode 3 0.0286 8328 0.0375 8020.75 0.0363 8343.75
Mode 4 0.0204 14162 0.0240 13944 0.0217 14553.75
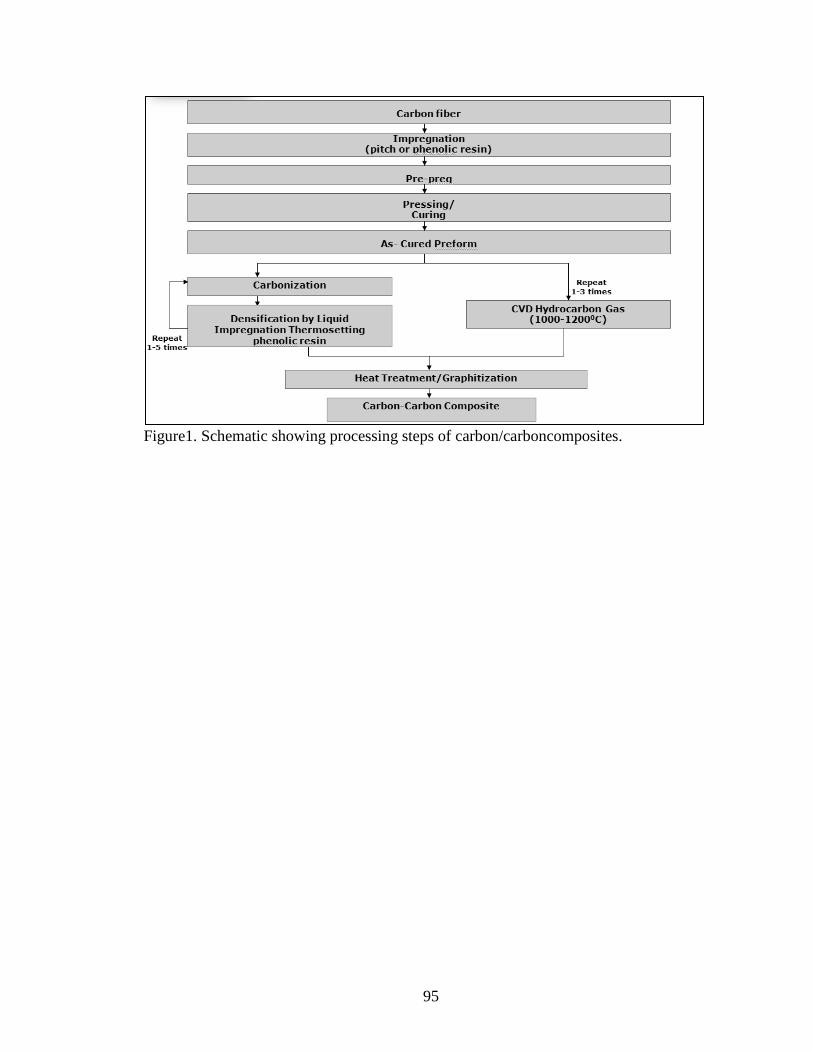
95
Figure1. Schematic showing processing steps of carbon/carboncomposites.
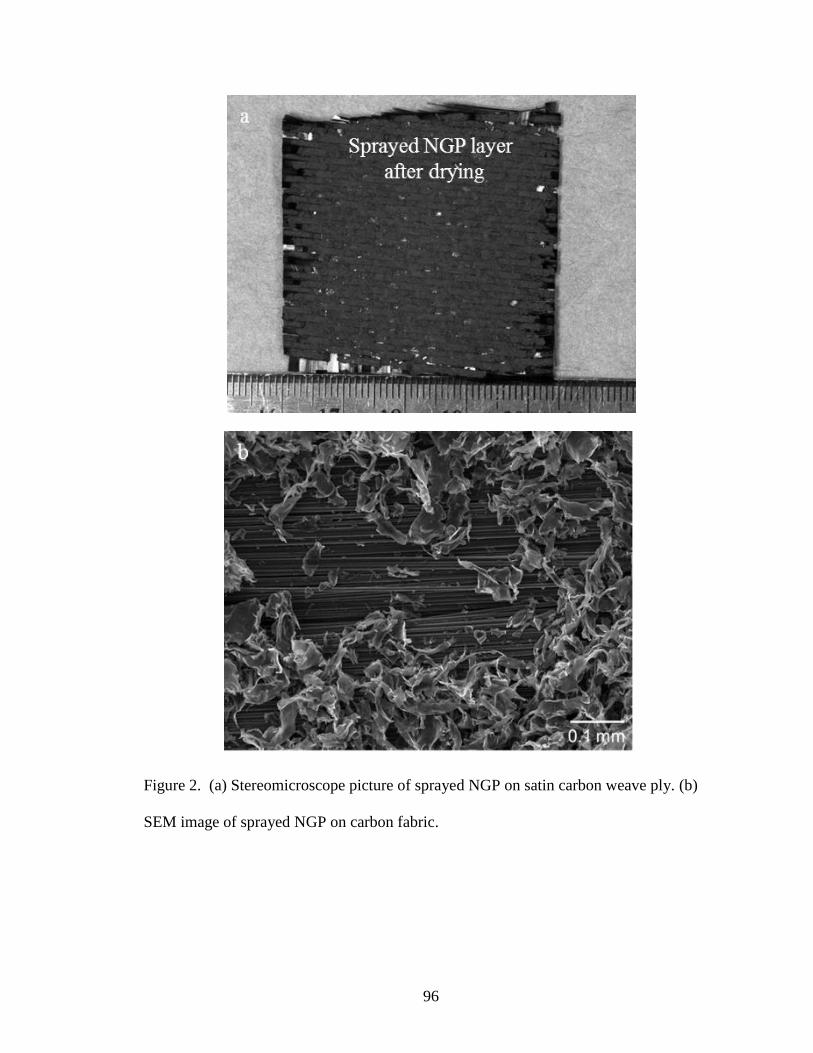
96
Figure 2. (a) Stereomicroscope picture of sprayed NGP on satin carbon weave ply. (b)
SEM image of sprayed NGP on carbon fabric.

97
Figure 3. Carbonization cycle adopted to carbonize CCC.
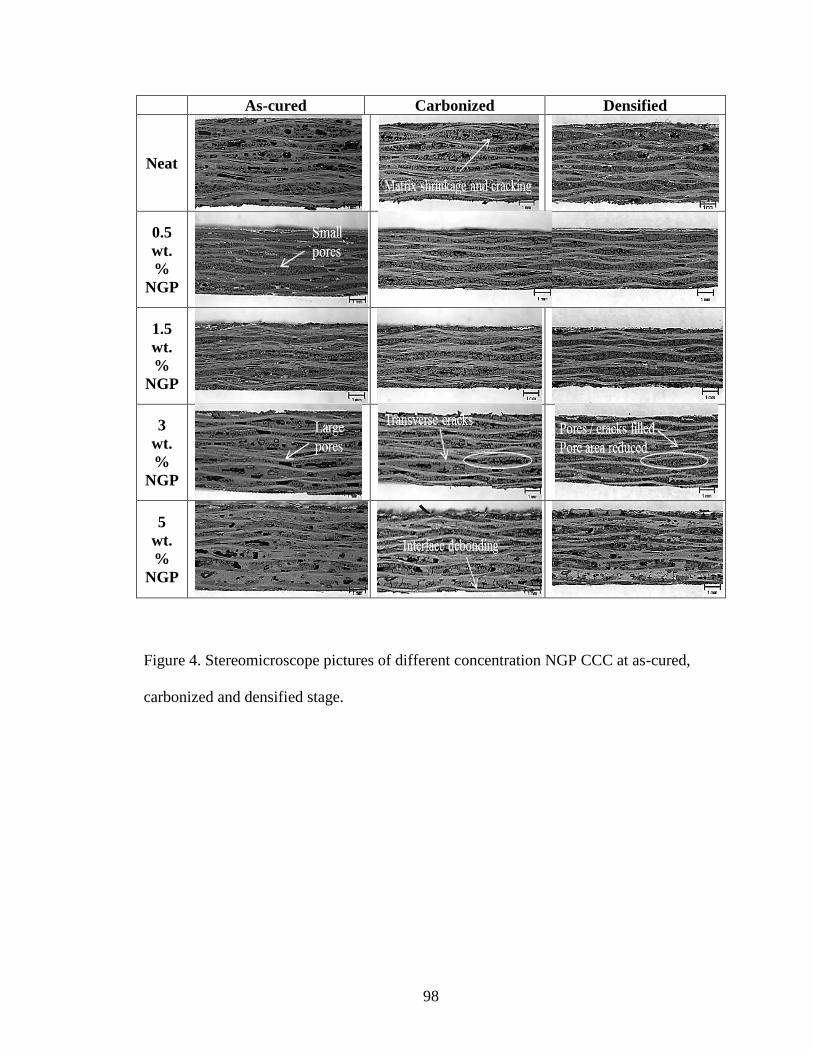
98
As-cured Carbonized Densified
Neat
0.5
wt.
%
NGP
1.5
wt.
%
NGP
3
wt.
%
NGP
5
wt.
%
NGP
Figure 4. Stereomicroscope pictures of different concentration NGP CCC at as-cured,
carbonized and densified stage.
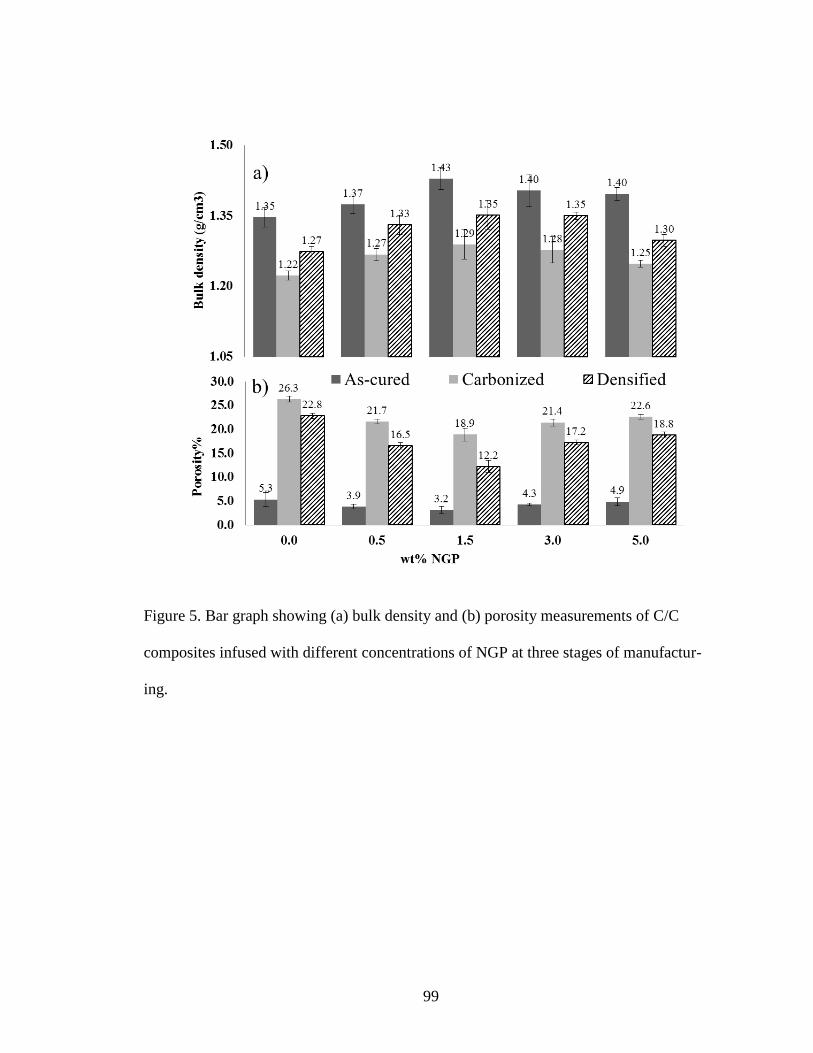
99
Figure 5. Bar graph showing (a) bulk density and (b) porosity measurements of C/C
composites infused with different concentrations of NGP at three stages of manufactur-
ing.
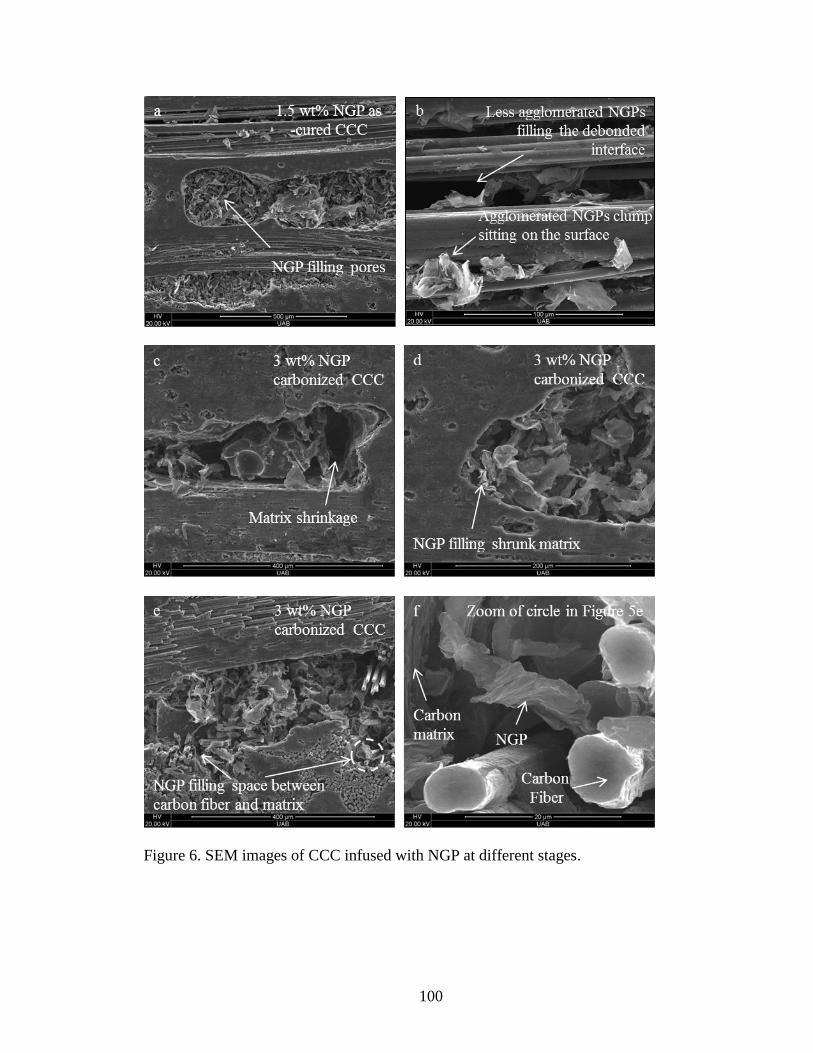
100
Figure 6. SEM images of CCC infused with NGP at different stages.
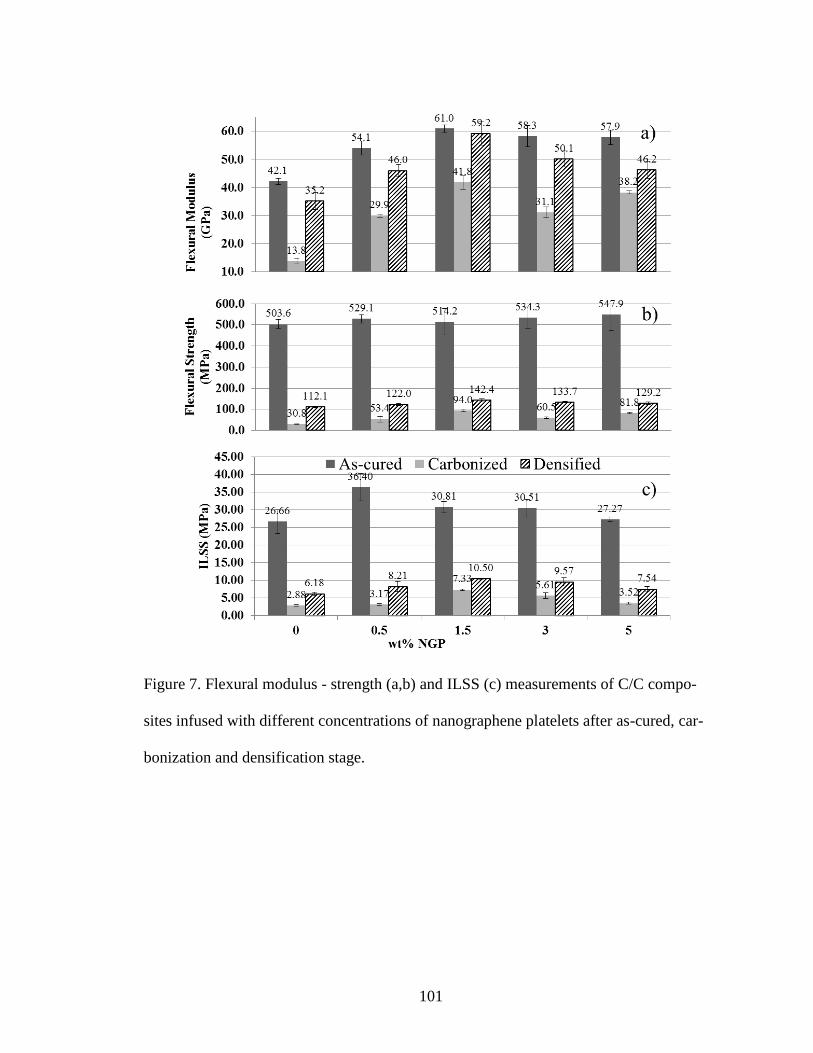
101
Figure 7. Flexural modulus - strength (a,b) and ILSS (c) measurements of C/C compo-
sites infused with different concentrations of nanographene platelets after as-cured, car-
bonization and densification stage.
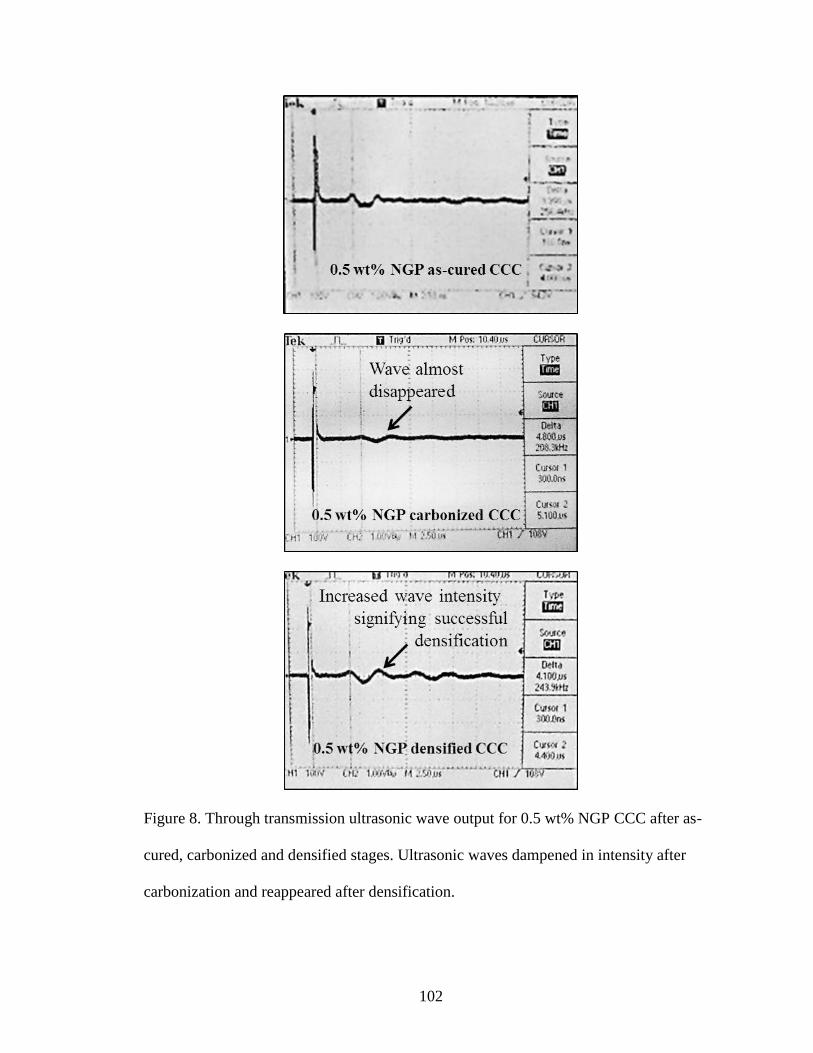
102
Figure 8. Through transmission ultrasonic wave output for 0.5 wt% NGP CCC after as-
cured, carbonized and densified stages. Ultrasonic waves dampened in intensity after
carbonization and reappeared after densification.
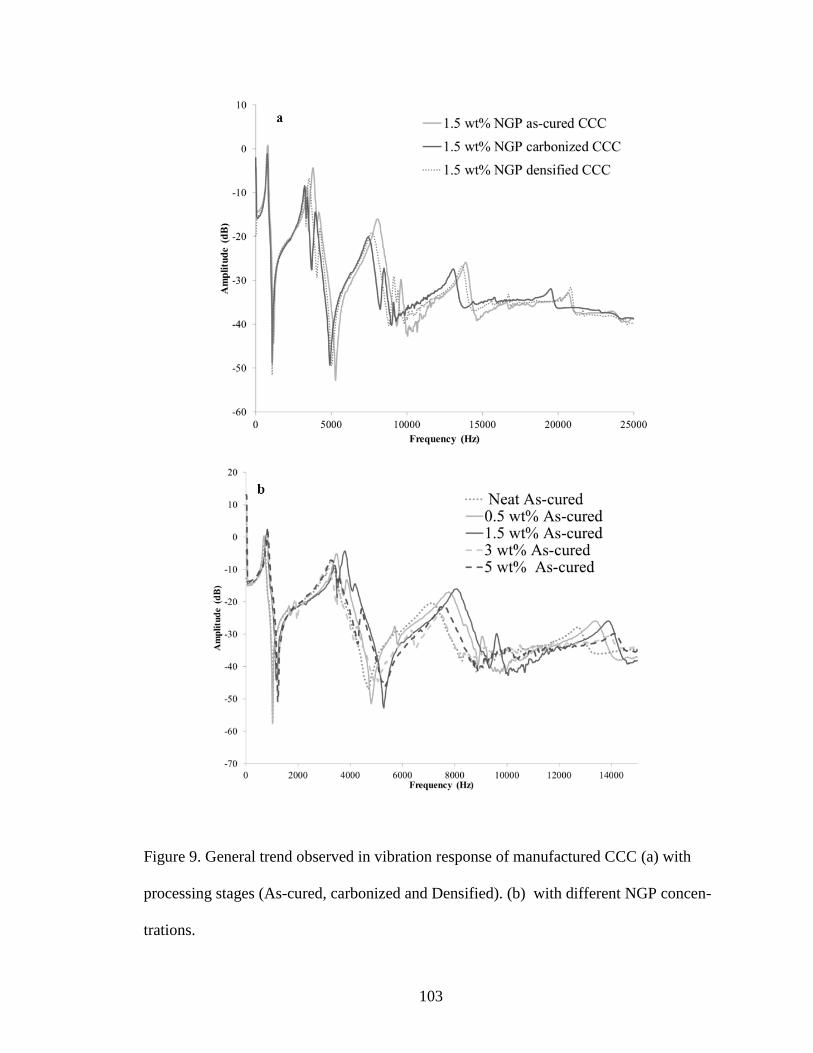
103
Figure 9. General trend observed in vibration response of manufactured CCC (a) with
processing stages (As-cured, carbonized and Densified). (b) with different NGP concen-
trations.
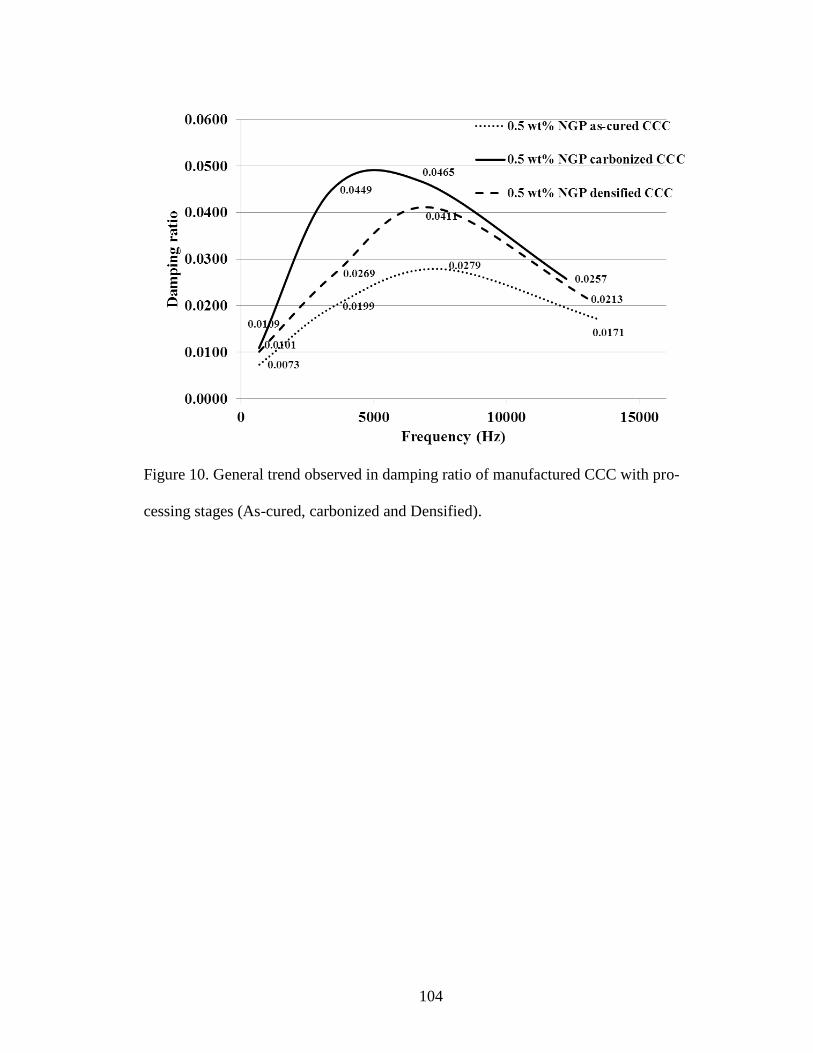
104
Figure 10. General trend observed in damping ratio of manufactured CCC with pro-
cessing stages (As-cured, carbonized and Densified).
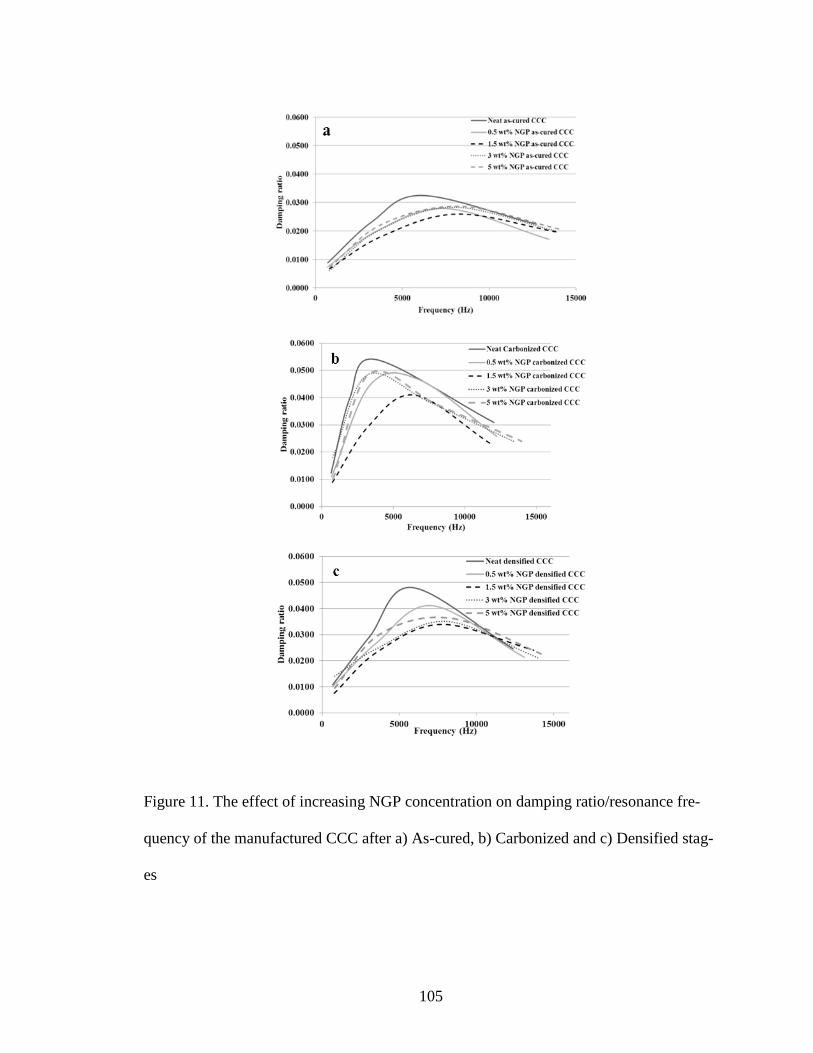
105
Figure 11. The effect of increasing NGP concentration on damping ratio/resonance fre-
quency of the manufactured CCC after a) As-cured, b) Carbonized and c) Densified stag-
es
106
GENERAL SUMMARY AND CONCLUSIONS
DSC studies revealed that the heat of curing of neat phenolic resin increased with
addition of NGP and VGCNF. At 0.5wt% NGP heat of curing increased by 33%
compared to 26% at 0.5wt% VGCNF. At concentrations higher than 0.5 wt%, the
heat of curing decreased due to agglomeration but still remained higher than the heat
of curing of neat phenolic resin. NGP dispersed in phenolic resulted in higher heat of
curing compared to VGCNF dispersed in phenolic because of higher surface area of
NGP. It is hypothesized that the high heat of curing translates to higher crosslinking
in phenolic resin.
Rheological studies showed that the dynamic viscosity of 0.5 wt% NGP dispersion
was 48% less than the dynamic viscosity of neat phenolic resin after 1.5 hours at 1%
strain loading. At 3 wt% NGP concentration, the dynamic viscosity increased only by
1.4% compared to 47 times increase in case of 3 wt% VGCNF dispersion after 1.5
hours. The decrease in dynamic viscosity of 0.5 wt% NGP dispersion is attributed to
two dimensional plate-like geometry of graphene which enables sliding on each other,
leading to low resistance to shear. In contrast, dispersions of VGCNF at concentra-
tion greater than 0.5wt% had high dynamic viscosity because of their fibrous struc-
ture leading to higher tendency of entanglement and agglomeration. On increasing the
concentration of NGP from 0.5 wt% to 3wt%, the rise in dynamic viscosity of the
neat phenolic resin was noticed due to the increased tendency for agglomeration.
In contact angle measurements, a droplet of 0.5 wt% NGP had a 200 contact angle
with the 8-harness satin weave carbon fabric compared to 29.570 of neat resin droplet
after 10 seconds. The lower contact angle at 0.5wt% NGP was due to the lower vis-
cosity than neat phenolic resin. At 1.5 wt% VGCNF, the contact angle was found to
107
be 78.320
compared to 40.270
at 5 wt% NGP after 150 seconds as viscosity rose more
rapidly with increase in VGCNF concentration compared to NGP.
Nano-reinforcements, NGP and VGCNF, were added to resol type phenolic resin to
form nanocomposites. At concentration lower than 1.5 wt%, the extrusion technique
led to uniform dispersion of NGP and VGCNF in neat phenolic resin. Loss of the
characteristic graphite peak and the apperance of a new peak in XRD scans confirmed
the exfoliation of nanocomposites. FT-IR study confirmed that NGP and VGCNF
interacted only physically with the phenolic resin and there was no chemical
interaction.
NGP and VGCNF filled the pores formed during the curing of the phenolic resin. At
1.5wt% NGP and VGCNF concentration, the porosity decreased by approximately
48% compared to porosity in neat phenolic resin. At 3wt% concentration
NGP/VGCNF started to agglomerate in the phenolic and were not as effective as at
1.5 wt%.
NGP at 0.5wt%, increased the flexure strength by 31.62% to 48.57 MPa and flexure
modulus by 42.23% to 2.9 GPa compared to neat phenolic resin. However, at
1.5wt%, VGCNF increased the flexure strength by 14.28% to 42.17 MPa and flexure
modulus by 23.47% to 2.52 GPa compared to neat phenolic resin.
The CTE decreased by 15.36% (73.83 μm/m0C) and 14.23% (74.81 μm/m
0C) with
1.5wt% NGP and 1.5wt% VGCNF, respectively, compared to neat phenolic (87.23
μm/m0C) in the temperature range 60
0 to 80
0. In the range of 100
0C to 120
0C, the
CTE decreased by 21.56% (85.42μm/m0C) and 13.74% (93.93μm/m
0C) with 1.5wt%
NGP and 1.5wt% VGCNF respectively compared to neat phenolic (108.9 μm/m0C).
108
On increasing the concentration to 3wt% the CTE increased but still remained lower
than the neat resin in both the temperature ranges.
The degradation on set temperature of neat phenolic resin increased by 2.75% in
5wt% NGP and by 1.6% in 3wt% VGCNF compared to neat phenolic. The residual
weight percentage left after 8000C was 200% more in 3wt% NGP and 75% more in
3wt%VGCNF compared to the neat phenolic resin. As NGP decreased the porosity,
increased the flexure properties, lowered the coefficient of thermal expansion and in-
creased the char yield of neat phenolic resin, they can be a suitable carbon nanofiller
for manufacturing of carbon/carboncomposites.
Carbon/carboncomposites (CCC) were fabricated by introducing nanographene plate-
lets (NGP) as nanofillers by the spraying technique. NGP were introduced in concen-
tration of 0.5 wt%, 1.5 wt%, 3 wt% and 5wt% to see the effect of concentration on
microstructure, flexure properties, inter laminar shear strength and damping proper-
ties of CCC. The following observations were made:
At 1.5 wt% NGP densified CCC, the highest ILSS observed was 10.5 MPa (in-
creased by 22%), flexure strength of 142.4 MPa (increased by 27%), flexural
modulus of 59.2 GPa (increased by 68%) and porosity of 18.8% (reduced by
17.5%) compared to neat densified CCC. The increase in mechanical properties
was attributed to NGP filling the pores generated after carbonization which led to
an increase in stiffness and density.
Ultrasonic testing revealed an average increase of 15%, in through the thickness
Young’s modulus of the densified CCC reinforced with NGP; the highest being
3.12 GPa at 1.5 wt% densified NGP CCC. NGP filled the debonded interface be-
109
tween the carbonized matrix and carbon fibers to increase the through the thick-
ness Young’s modulus. The observation also backed the ILSS results as more
force was needed to cause inter lamina failure due to NGP reinforcement.
Vibration analysis showed a decrease in the damping ratio of CCC with the addi-
tion of NGP because of an increase in stiffness and decrease in porosity and hence
the energy dissipating sites. Average decrease in the damping ratio of the first
four modes of vibration was 20% in 1.5 wt% NGP densified CCC.
At low concentration (≤ 1.5 wt%), NGP filled in the pores, cracks and debonded
interface but at concentration higher than 1.5 wt%, NGP lost their effectiveness
due to agglomeration. This led to plateauing of the properties after 1.5 wt% fol-
lowed by a decrease on further NGP addition.
Due to better mechanical properties observed in NGP reinforced CCC compared
to neat CCC, the required number of densification-carbonization cycles for de-
sired density/properties CCC may reduce.
110
GENERAL LIST OF REFERENCES
1. Windhorst, T. and G. Blount, Carbon/carboncomposites: a summary of recent
developments and applications. Materials and Design, 1997. 18(Compendex): p.
11-15.
2. Manocha, L.M., High performance carbon/carboncomposites. Sadhana -
Academy Proceedings in Engineering Sciences, 2003. 28(Compendex): p. 349-
358.
3. Fitzer, E., Future of Carbon/carbonComposites. Carbon, 1987. 25(Compendex):
p. 163-190.
4. Klein, A.J., Carbon/carboncomposites. Advanced Materials and Processes, 1986.
130(Compendex): p. 64-68.
5. Schmidt, D.L., K.E. Davidson, and L.S. Theibert. Applications of
carbon/carboncomposites. in Proceedings of the 1997 42nd International SAMPE
Symposium and Exhibition. Part 1 (of 2), May 4, 1997 - May 8, 1997. 1997.
Anaheim, CA, USA: SAMPE.
6. Stoller, H.M. and E.R. Frye, Processing of Carbon/carboncomposites-An
overview. SAMPE Quarterly, 1972. 3(Compendex): p. 10-22.
7. Kang, T.J. and Y.W. Jeong, Mechanical properties of matrix-modified
carbon/carbon composites. Polymers and Polymer Composites, 1997.
5(Compendex): p. 469-475.
8. Yasuda, E., et al., Matrix modification by graphite powder additives in carbon
fiber/carbon composite with thermosetting resin precursor as matrix. Carbon,
1988. 26(Compendex): p. 225-227.
111
9. Ma, C.-C.M., C.-B. Chen, and W.-C. Chang. Processability and morphology of
phenolic matrix carbon/carbon composites (I). in 37th International SAMPE
Symposium and Exhibition, March 9, 1992 - March 12, 1992. 1992. Anaheim,
CA, USA: Publ by SAMPE.
10. Tai, N.-H., M.-K. Yeh, and T.-H. Peng, Experimental study and theoretical
analysis on the mechanical properties of SWNTs/phenolic composites.
Composites Part B: Engineering, 2008. 39(Compendex): p. 926-932.
11. Yeh, M.-K., N.-H. Tai, and J.-H. Liu. Dynamic mechanical properties of
MWNTs/phenolic nanocomposites. in Fracture and Strength of Solids VI. 2006.
Trans Tech Publications Ltd.
12. Manocha, L.M., Introduction of nanostructures in carbon/carboncomposites.
Materials Science and Engineering A, 2005. 412(Compendex): p. 27-30.
13. Manocha, L.M., et al. Microstructure of carbon/carbon composites reinforced
with pitch-based ribbon-shape carbon fibers. 2003. Elsevier Ltd.
14. Dhakate, S.R., R.B. Mathur, and T.L. Dhami. Development of vapor grown
carbon fibers (VGCF) reinforced carbon/carbon composites. 2006. Kluwer
Academic Publishers.
15. Jain, R., U.K. Vaidya, and A. Haque, Processing and characterization of
carbon/carbonnanofiber composites. Advanced Composite Materials: The
Official Journal of the Japan Society of Composite Materials, 2006.
15(Compendex): p. 211-241.
16. Geim, A.K. and K.S. Novoselov, The rise of graphene. Nature Materials, 2007.
6(Compendex): p. 183-191.
112
17. Novoselov, K.S., et al., Two-dimensional gas of massless Dirac fermions in
graphene. Nature, 2005. 438(Compendex): p. 197-200.
18. Novoselov, K.S., et al., Electric field in atomically thin carbon films. Science,
2004. 306(GEOBASE): p. 666-669.
19. Novoselov, K.S. Graphene: The magic of flat carbon. in 1st International
Symposium on Emerging Materials for Post-CMOS Applications - 215th Meeting
of the Electrochemical Society, May 25, 2009 - May 29, 2009. 2009. San
Francisco, CA, United states: Electrochemical Society Inc.
20. Barnard, A.S. and I.K. Snook, Thermal stability of graphene edge structure and
graphene nanoflakes. Journal of Chemical Physics, 2008. 128(Compendex).
21. Kastler, M., et al., From armchair to zigzag peripheries in nanographenes.
Journal of the American Chemical Society, 2006. 128(Compendex): p. 9526-
9534.
22. Novoselov, K.S., et al., Room-temperature quantum hall effect in graphene.
Science, 2007. 315(GEOBASE): p. 1379.
23. de Heer, W.A., et al., Epitaxial graphene. Solid State Communications, 2007.
143(Compendex): p. 92-100.
24. Jang, B.Z. and A. Zhamu, Processing of nanographene platelets (NGP) and NGP
nanocomposites: A review. Journal of Materials Science, 2008. 43(Compendex):
p. 5092-5101.
25. Panchakarla, L.S., et al., Synthesis, structure, and properties of boron- and
nitrogen-doped graphene. Advanced Materials, 2009. 21(Compendex): p. 4726-
4730.
113
26. Rao, C.N.R., et al., Graphene, the new nanocarbon. Journal of Materials
Chemistry, 2009. 19(Compendex): p. 2457-2469.
27. Enoki, T., et al., Structures and electronic properties of surface/edges of
nanodiamond and nanographite. Diamond and Related Materials, 2007.
16(Compendex): p. 2029-2034.
28. Enoki, T. and K. Takai, The edge state of nanographene and the magnetism of the
edge-state spins. Solid State Communications, 2009. 149(Compendex): p. 1144-
1150.
29. Lee, C., et al., Measurement of the elastic properties and intrinsic strength of
monolayer graphene. Science, 2008. 321(GEOBASE): p. 385-388.
30. Balandin, A.A., et al., Superior thermal conductivity of single-layer graphene.
Nano Letters, 2008. 8(Compendex): p. 902-907.
31. Balandin, A.A., et al. Thermal conductivity of graphene: The first measurements
and theoretical analysis. in 30th International Thermal Conductivity Conference
and the 18th International Thermal Expansion Symposium, Thermal Conductivity
30/Thermal Expansion 18, August 29, 2009 - September 2, 2009. 2010.
Pittsburgh, PA, United states: DEStech Publications Inc.
32. Wang, S., et al., Wettability and surface free energy of graphene films. Langmuir,
2009. 25(Compendex): p. 11078-11081.
33. Carpio, A., et al., Dislocations in graphene. New Journal of Physics, 2008.
10(Compendex).
34. Viculis, L.M., et al., Intercalation and exfoliation routes to graphite
nanoplatelets. Journal of Materials Chemistry, 2005. 15(Compendex): p. 974-978.
114
35. Wang, X., et al., Large-scale synthesis of few-layered graphene using CVD.
Chemical Vapor Deposition, 2009. 15(Compendex): p. 53-56.
36. Parvizi, F., et al., Properties of graphene produced by the high pressure-high
temperature growth process. Micro and Nano Letters, 2008. 3(Compendex): p.
29-34.
37. Shen, J., et al., Fast and facile preparation of graphene oxide and reduced
graphene oxide nanoplatelets. Chemistry of Materials, 2009. 21(Compendex): p.
3514-3520.
38. Geng, Y., S.J. Wang, and J.-K. Kim, Preparation of graphite nanoplatelets and
graphene sheets. Journal of Colloid and Interface Science, 2009.
336(Compendex): p. 592-598.
39. Katsnelson, M.I., Graphene: carbon in two dimensions. Materials Today, 2007.
10(Compendex): p. 20-27.
40. Hou, Z. and M. Yee. Electronic and transport properties of graphene
nanoribbons. in 2007 7th IEEE International Conference on Nanotechnology -
IEEE-NANO 2007, August 2, 2007 - August 5, 2007. 2007. Hong Kong, China:
Inst. of Elec. and Elec. Eng. Computer Society.
41. Schwierz, F., Graphene transistors. Nat Nano, 2010. 5(7): p. 487-496.
42. Park, S., et al., Graphene-based actuators. Small, 2010. 6(Compendex): p. 210-
212.
43. Liang, J., et al., Infrared-triggered actuators from graphene-based
nanocomposites. Journal of Physical Chemistry C, 2009. 113(Compendex): p.
9921-9927.
115
44. Liu, C., et al., Graphene-based supercapacitor with an ultrahigh energy density.
Nano Letters, 2010. 10(Compendex): p. 4863-4868.
45. Liang, M. and L. Zhi, Graphene-based electrode materials for rechargeable
lithium batteries. Journal of Materials Chemistry, 2009. 19(Compendex): p. 5871-
5878.
46. Schedin, F., et al., Detection of individual gas molecules adsorbed on graphene.
Nature Materials, 2007. 6(Compendex): p. 652-655.
47. Leenaerts, O., B. Partoens, and F.M. Peeters, Graphene: A perfect nanoballoon.
Applied Physics Letters, 2008. 93(Compendex).
48. Ghosh, A., et al., Uptake of H2 and CO2 by Graphene. The Journal of Physical
Chemistry C, 2008. 112(40): p. 15704-15707.
49. Imran Jafri, R., N. Rajalakshmi, and S. Ramaprabhu, Nitrogen doped graphene
nanoplatelets as catalyst support for oxygen reduction reaction in proton
exchange membrane fuel cell. Journal of Materials Chemistry, 2010.
20(Compendex): p. 7114-7117.
50. Wakabayashi, K., et al., Polymer - Graphite nanocomposites: Effective dispersion
and major property enhancement via solid-state shear pulverization.
Macromolecules, 2008. 41(Compendex): p. 1905-1908.
51. Parades, J.I., et al., Graphene oxide dispersions in organic solvents. Langmuir,
2008. 24(Compendex): p. 10560-10564.
52. Pramoda, K.P., et al., Covalent bonded polymer-graphene nanocomposites.
Journal of Polymer Science, Part A: Polymer Chemistry, 2010. 48(Compendex):
p. 4262-4267.
116
53. Matsuo, Y., K. Hatase, and Y. Sugie, Preparation and Characterization of
Poly(vinyl alcohol)- and Cu(OH)2−Poly(vinyl alcohol)-Intercalated Graphite
Oxides. Chemistry of Materials, 1998. 10(8): p. 2266-2269.
54. Xu, J., et al., Preparation and characterization of polyacrylamide-intercalated
graphite oxide. Materials Research Bulletin, 2001. 36(10): p. 1833-1836.
55. Xu, J., et al., Thermal analysis of poly(vinyl alcohol)/graphite oxide intercalated
composites. Polymer Degradation and Stability, 2001. 73(1): p. 29-31.
56. Matsuo, Y., K. Tahara, and Y. Sugie, Synthesis of poly(ethylene oxide)-
intercalated graphite oxide. Carbon, 1996. 34(5): p. 672-674.
57. Kotov, N.A., I. Dekany, and J.H. Fendler, Ultrathin graphite oxide-
polyelectrolyte composites prepared by self-assembly: transition between
conductive and non-conductive states. Advanced Materials, 1996. 8(Compendex):
p. 637-641.
58. Kovtyukhova, N.I., et al., Layer-by-Layer Assembly of Ultrathin Composite Films
from Micron-Sized Graphite Oxide Sheets and Polycations. Chemistry of
Materials, 1999. 11(3): p. 771-778.
59. Szabó, T., A. Szeri, and I. Dékány, Composite graphitic nanolayers prepared by
self-assembly between finely dispersed graphite oxide and a cationic polymer.
Carbon, 2005. 43(1): p. 87-94.
60. Xiao, P., M. Xiao, and K. Gong, Preparation of exfoliated graphite/polystyrene
composite by polymerization-filling technique. Polymer, 2001. 42(11): p. 4813-
4816.
117
61. Xiao, M., et al., Synthesis and properties of polystyrene/graphite nanocomposites.
Polymer, 2002. 43(8): p. 2245-2248.
62. Chen, G., et al., Preparation of polystyrene/graphite nanosheet composite.
Polymer, 2003. 44(6): p. 1781-1784.
63. Chen, G., et al., PMMA/graphite nanosheets composite and its conducting
properties. European Polymer Journal, 2003. 39(12): p. 2329-2335.
64. Zheng, W., S.-C. Wong, and H.-J. Sue, Transport behavior of PMMA/expanded
graphite nanocomposites. Polymer, 2002. 43(25): p. 6767-6773.
65. Zheng, W. and S.-C. Wong, Electrical conductivity and dielectric properties of
PMMA/expanded graphite composites. Composites Science and Technology,
2003. 63(2): p. 225-235.
66. Jiang, X. and L.T. Drzal. Multifunctional exfoliated graphite nanoplatelets/high
density polyethylene nanocomposites. in 2009 SAMPE Fall Technical Conference
and Exhibition - Global Material Technology: Soaring to New Horizons, October
19, 2009 - October 22, 2009. 2009. Wichita, KS, United states: Soc. for the
Advancement of Material and Process Engineering.
67. Kim, S., I. Do, and L.T. Drzal, Multifunctional xGnP/LLDPE nanocomposites
prepared by solution compounding using various screw rotating systems.
Macromolecular Materials and Engineering, 2009. 294(Compendex): p. 196-205.
68. Kim, S., J. Seo, and L.T. Drzal, Improvement of electric conductivity of LLDPE
based nanocomposite by paraffin coating on exfoliated graphite nanoplatelets.
Composites Part A: Applied Science and Manufacturing, 2010. 41(Compendex):
p. 581-587.
118
69. Kim, S., I. Do, and L.T. Drzal, Thermal stability and dynamic mechanical
behavior of exfoliated graphite nanoplatelets-LLDPE nanocomposites. Polymer
Composites, 2010. 31(Compendex): p. 755-761.
70. Xu, Z. and C. Gao, In situ polymerization approach to graphene-reinforced
nylon-6 composites. Macromolecules, 2010. 43(Compendex): p. 6716-6723.
71. Gupta, S., P. Raju Mantena, and A. Al-Ostaz, Dynamic mechanical and impact
property correlation of nanoclay and graphite platelet reinforced vinyl ester
nanocomposites. Journal of Reinforced Plastics and Composites, 2010.
29(Compendex): p. 2037-2047.
72. Shen, J.-W., X.-M. Chen, and W.-Y. Huang, Structure and electrical properties of
grafted polypropylene/graphite nanocomposites prepared by solution
intercalation. Journal of Applied Polymer Science, 2003. 88(Compendex): p.
1864-1869.
73. Kalaitzidou, K., H. Fukushima, and L.T. Drzal. Processing, properties and
structure of exfoliated graphite nanoplatelet-polypropylene nanocomposites. in
05AIChE: 2005 AIChE Annual Meeting and Fall Showcase, October 30, 2005 -
November 4, 2005. 2005. Cincinnati, OH, United states: American Institute of
Chemical Engineers.
74. Kalaitzidou, K., H. Fukushima, and L.T. Drzal, A new compounding method for
exfoliated graphite-polypropylene nanocomposites with enhanced flexural
properties and lower percolation threshold. Composites Science and Technology,
2007. 67(Compendex): p. 2045-2051.
119
75. Kalaitzidou, K., et al., Flexural and tensile moduli of polypropylene
nanocomposites and comparison of experimental data to Halpin-Tsai and
Tandon-Weng models. Polymer Engineering and Science, 2007. 47(Compendex):
p. 1796-1803.
76. Kalaitzidou, K., H. Fukushima, and L.T. Drzal, Mechanical properties and
morphological characterization of exfoliated graphite-polypropylene
nanocomposites. Composites Part A: Applied Science and Manufacturing, 2007.
38(Compendex): p. 1675-1682.
77. Yasmin, A. and I.M. Daniel, Mechanical and thermal properties of graphite
platelet/epoxy composites. Polymer, 2004. 45(Compendex): p. 8211-8219.
78. Park, J.K., et al., Electrodeposition of exfoliated graphite nanoplatelets onto
carbon fibers and properties of their epoxy composites. Composites Science and
Technology, 2008. 68(Compendex): p. 1734-1741.
79. Rafiee, M.A., et al., Enhanced mechanical properties of nanocomposites at low
graphene content. ACS Nano, 2009. 3(Compendex): p. 3884-3890.
80. Wang, S., et al., Thermal expansion of graphene composites. Macromolecules,
2009. 42(Compendex): p. 5251-5255.
81. Yu, A., et al., Graphite nanoplatelet-epoxy composite thermal interface materials.
Journal of Physical Chemistry C, 2007. 111(Compendex): p. 7565-7569.
82. Yu, A., et al., Enhanced thermal conductivity in a hybrid graphite nanoplatelet -
Carbon nanotube filler for epoxy composites. Advanced Materials, 2008.
20(Compendex): p. 4740-4744.
120
83. Kim, S. and L.T. Drzal, High latent heat storage and high thermal conductive
phase change materials using exfoliated graphite nanoplatelets. Solar Energy
Materials and Solar Cells, 2009. 93(Compendex): p. 136-142.
84. He, F., et al., High dielectric permittivity and low percolation threshold in
nanocomposites based on poly(vinylidene fluoride) and exfoliated graphite
nanoplates. Advanced Materials, 2009. 21(Compendex): p. 710-715.
85. Kim, S. and L.T. Drzal, Comparison of exfoliated graphite nanoplatelets (xGnP)
and CNTs for reinforcement of EVA nanocomposites fabricated by solution
compounding method and three screw rotating systems. Journal of Adhesion
Science and Technology, 2009. 23(Compendex): p. 1623-1638.
86. Du, X.S., et al., Novel synthesis of conductive poly(arylene disulfide)/graphite
nanocomposite. Synthetic Metals, 2004. 143(1): p. 129-132.
87. Kalaitzidou, K., H. Fukushima, and L.T. Drzal, Multifunctional polypropylene
composites produced by incorporation of exfoliated graphite nanoplatelets.
Carbon, 2007. 45(Compendex): p. 1446-1452.
88. Miloaga, D.G., et al., Crystallization of poly(3-hydroxybutyrate) by exfoliated
graphite nanoplatelets. Journal of Applied Polymer Science, 2007.
106(Compendex): p. 2548-2558.