Nanoclays reinforced glass ionomer cements: dispersion and interaction of polymer grade (PG)...
9
Nanoclays reinforced glass ionomer cements: dispersion and interaction of polymer grade (PG) montmorillonite with poly(acrylic acid) Muhammad A. Fareed • Artemis Stamboulis Received: 11 March 2013 / Accepted: 19 September 2013 / Published online: 29 September 2013 Ó Springer Science+Business Media New York 2013 Abstract Montmorillonite nanoclays (PGV and PGN) were dispersed in poly(acrylic acid) (PAA) for utilization as reinforcing filler in glass ionomer cements (GICs). Chemical and physical interaction of PAA and nanoclay (PGV and PGN) was studied. PAA–PGV and PAA–PGN solutions were prepared in different weight percent load- ings of PGV and PGN nanoclay (0.5–8.0 wt%) via exfo- liation-adsorption method. Characterization was carried out by X-ray diffraction (XRD), X-ray photoelectron spec- troscopy (XPS) and fourier transform infrared (FTIR) spectroscopy. XRD results of PAA–PGN demonstrated that the interlayer space expanded from 12.83 to 16.03 A ˚ indicating intercalation whereas the absence of the peak at d 001 in PAA–PGV indicated exfoliation. XPS scans of PGV and PGN nanoclays depicted the main peak of O 1s pho- toelectron due to Si–O–M (M = Mg, Al, Fe) whereas, Si– O–Al linkages were identified by Si 2p or Si 2s and Al 2p or Al 2s peaks. The disappearance of the Na peak con- firmed that PAA molecules exchanged sodium ions present on surface of silicate layers and significantly reduced the electrostatic van-der-Waals forces between silicate plates resulting in intercalation or exfoliation. FTIR spectra of PAA–nanoclay suspensions demonstrated the presence of a new peak at 1,019 cm -1 associated with Si–O– stretching vibrations which increased with increasing nanoclays concentration. Information concerning the dispersion of nanoclay in PAA aqueous solutions, chemical reaction and increase interlayer space in montmorillonite nanoclay is particularly useful regarding dispersion and reinforcement of nanoclay in PAA. 1 Introduction Polymer nanocomposites, especially polymer-layered-sili- cate nanocomposites with fully-exfoliated platelet structure of organo-modified montmorillonite (MMT) (commonly known as nanoclay) when dispersed in a polymer matrix greatly improves its mechanical properties [1]. The incor- poration of low concentrations of nanoclay (1–5 %) has been a popular strategy to improve polymer materials in recent years [1–13]. The high aspect ratio of layered-sili- cates (Mica, Talc, MMT and Hectorite) is ideal for polymer reinforcement but they are generally not easily dispersed in polymers due to the preferred face-to-face stacking [1–3]. The reinforcement effect of nanoclay dispersions has lar- gely been reported in polymers such as epoxy resins [2], nylon [3], polystyrene [4], polymethyl methacrylate [5], polycaprolactone [6], polyethylene [7], polyurethane [8], polyamide [9], chitosan [10, 11] and poly(acrylic acid) (PAA) based composites [12, 13]. Polymer grade (PG) montmorillonites (PGV and PGN) are alumina–silicate minerals of high purity and are frequently used as additives in hydrophilic polymers such as polyvinyl-alcohols, poly- saccharides and PAA. In the structure of MMT, single layer nanoclay has a central alumina octahedral sheet sandwiched between two silica tetrahedral sheets by shar- ing their apex oxygen to form a single clay sheet of 0.96 nm thickness (Fig. 1). The face-to-face stacking of clay layers leads to van-der-Waals forces between the layers and the gap is called the interlayer space or clay M. A. Fareed (&) Á A. Stamboulis Biomaterials Group, School of Metallurgy and Materials, University of Birmingham, Edgbaston, Birmingham B15 2TT, UK e-mail: [email protected] M. A. Fareed FMH College of Medicine and Dentistry, University of Health Sciences, Lahore, Pakistan 123 J Mater Sci: Mater Med (2014) 25:91–99 DOI 10.1007/s10856-013-5058-3
Transcript of Nanoclays reinforced glass ionomer cements: dispersion and interaction of polymer grade (PG)...

Nanoclays reinforced glass ionomer cements: dispersionand interaction of polymer grade (PG) montmorillonitewith poly(acrylic acid)
Muhammad A. Fareed • Artemis Stamboulis
Received: 11 March 2013 / Accepted: 19 September 2013 / Published online: 29 September 2013
� Springer Science+Business Media New York 2013
Abstract Montmorillonite nanoclays (PGV and PGN)
were dispersed in poly(acrylic acid) (PAA) for utilization
as reinforcing filler in glass ionomer cements (GICs).
Chemical and physical interaction of PAA and nanoclay
(PGV and PGN) was studied. PAA–PGV and PAA–PGN
solutions were prepared in different weight percent load-
ings of PGV and PGN nanoclay (0.5–8.0 wt%) via exfo-
liation-adsorption method. Characterization was carried out
by X-ray diffraction (XRD), X-ray photoelectron spec-
troscopy (XPS) and fourier transform infrared (FTIR)
spectroscopy. XRD results of PAA–PGN demonstrated that
the interlayer space expanded from 12.83 to 16.03 A
indicating intercalation whereas the absence of the peak at
d001 in PAA–PGV indicated exfoliation. XPS scans of PGV
and PGN nanoclays depicted the main peak of O 1s pho-
toelectron due to Si–O–M (M = Mg, Al, Fe) whereas, Si–
O–Al linkages were identified by Si 2p or Si 2s and Al 2p
or Al 2s peaks. The disappearance of the Na peak con-
firmed that PAA molecules exchanged sodium ions present
on surface of silicate layers and significantly reduced the
electrostatic van-der-Waals forces between silicate plates
resulting in intercalation or exfoliation. FTIR spectra of
PAA–nanoclay suspensions demonstrated the presence of a
new peak at 1,019 cm-1 associated with Si–O– stretching
vibrations which increased with increasing nanoclays
concentration. Information concerning the dispersion of
nanoclay in PAA aqueous solutions, chemical reaction and
increase interlayer space in montmorillonite nanoclay is
particularly useful regarding dispersion and reinforcement
of nanoclay in PAA.
1 Introduction
Polymer nanocomposites, especially polymer-layered-sili-
cate nanocomposites with fully-exfoliated platelet structure
of organo-modified montmorillonite (MMT) (commonly
known as nanoclay) when dispersed in a polymer matrix
greatly improves its mechanical properties [1]. The incor-
poration of low concentrations of nanoclay (1–5 %) has
been a popular strategy to improve polymer materials in
recent years [1–13]. The high aspect ratio of layered-sili-
cates (Mica, Talc, MMT and Hectorite) is ideal for polymer
reinforcement but they are generally not easily dispersed in
polymers due to the preferred face-to-face stacking [1–3].
The reinforcement effect of nanoclay dispersions has lar-
gely been reported in polymers such as epoxy resins [2],
nylon [3], polystyrene [4], polymethyl methacrylate [5],
polycaprolactone [6], polyethylene [7], polyurethane [8],
polyamide [9], chitosan [10, 11] and poly(acrylic acid)
(PAA) based composites [12, 13]. Polymer grade (PG)
montmorillonites (PGV and PGN) are alumina–silicate
minerals of high purity and are frequently used as additives
in hydrophilic polymers such as polyvinyl-alcohols, poly-
saccharides and PAA. In the structure of MMT, single
layer nanoclay has a central alumina octahedral sheet
sandwiched between two silica tetrahedral sheets by shar-
ing their apex oxygen to form a single clay sheet of
0.96 nm thickness (Fig. 1). The face-to-face stacking of
clay layers leads to van-der-Waals forces between the
layers and the gap is called the interlayer space or clay
M. A. Fareed (&) � A. Stamboulis
Biomaterials Group, School of Metallurgy and Materials,
University of Birmingham, Edgbaston, Birmingham B15 2TT,
UK
e-mail: [email protected]
M. A. Fareed
FMH College of Medicine and Dentistry, University of Health
Sciences, Lahore, Pakistan
123
J Mater Sci: Mater Med (2014) 25:91–99
DOI 10.1007/s10856-013-5058-3

gallery which can trap polymer molecules during the pro-
cess of nanocomposite formation [14].
Conventional glass ionomer cement (GIC) is a popular
dental restorative material since its discovery by Wilson
and Kent [15]. It is used in restorative dentistry extensively
for luting, lining, as a base material and for dental fillings.
The liquid component of GIC is an aqueous solution of
(PAA) stabilized with 5 % tartaric acid copolymers. The
powder component of GIC is a fluoro-aluminosilicate
glass. GIC is formed by acid–base reaction between PAA
solution and ion-leachable basic glass powder in the pre-
sence of water. Dentists prefer GIC due to chemical bond
to the tooth structure, anti cariogenic properties and
excellent biocompatibility [15]. However, GIC exhibits
some limitations such as low abrasion and wear resistance,
poor mechanical strength and desiccation in dry conditions.
The mechanical properties of GICs are influenced by the
composition of polyacid and glass powder [16]. The
strength of GIC can be further improved by dispersion of
nanoclay particles in the polymeric matrix. To achieve
maximum polymer–nanoclay interaction, the choice of
suitable nanoclay for PAA is imperative in the develop-
ment of nanoclay-reinforced glass ionomer dental cement.
A uniform dispersion and controlled association of nano-
particles with PAA matrix is required to improve the
properties of the set material. The incorporation of
nanoclays in aqueous solutions of PAA has been reported
to increase the interlayer d-spacing of the nanoclays [17,
18]. Use of nanoclay reinforced GIC as posterior dental
filling material has also been reported previously [19]. The
present paper characterizes the nanoclay interaction with
PAA matrix and investigates the reinforcement effect of
nanoclays as a function of their concentration and
dispersion.
2 Materials and methods
Purified nanomer/polymer-grade nanoclay (PGV and
PGN) were generously supplied by Nanocor Inc. (Chicago
IL, USA) through NRC Nordmann, Rassmann GmbH
(Hamburg, Germany). The chemical analysis of PGV
nanoclay and PGN nanoclay reported by Nanocor is given
in Table 1. The nanoclay was purified to a level greater
than 98 % montmorillonite and the degree of cations
exchange capacity for PGV was 145 meq/100 mg and for
PGN was 120 meq/100 mg. Different weight percentages
of PGV nanoclay and PGN nanoclay (0.5, 1.0, 2.0, 4.0,
6.0 and 8 wt%) were dispersed in aqueous solution of
PAA. Sokalan PA-110 (PAA solution) Mw * 110,000,
water content 65 wt% and pH * 2 was supplied by
BASF plc, Cheshire, UK. The suspensions of PAA solu-
tion–PGV nanoclay (PAA–PGV) and PAA solution–PGN
nanoclay (PAA–PGN) were formed by mixing and heat-
ing procedure similar to the exfoliation-adsorption
method. However, no solvent was used for dispersion of
nanoclay in PAA. PGV nanoclay and PGN nanoclay
powders weighing 0.25 g (0.5 wt%), 0.50 g (1.0 wt%),
1.0 g (2.0 wt%), 2.0 g (4.0 wt%), 3.0 g (6.0 wt%) and
4.0 g (8.0 wt%) on a balance accurate to 0.001 g
(TS4000, Ohaus, Pine Brook, NJ, USA) were added to
50 g of 65 % solution of PAA (PA-110). After hand
Fig. 1 The crystalline layered
nanoclay has a central alumina
octahedral sheet sandwiched
between two silica tetrahedral
sheets in the structure of MMT
[14]
92 J Mater Sci: Mater Med (2014) 25:91–99
123
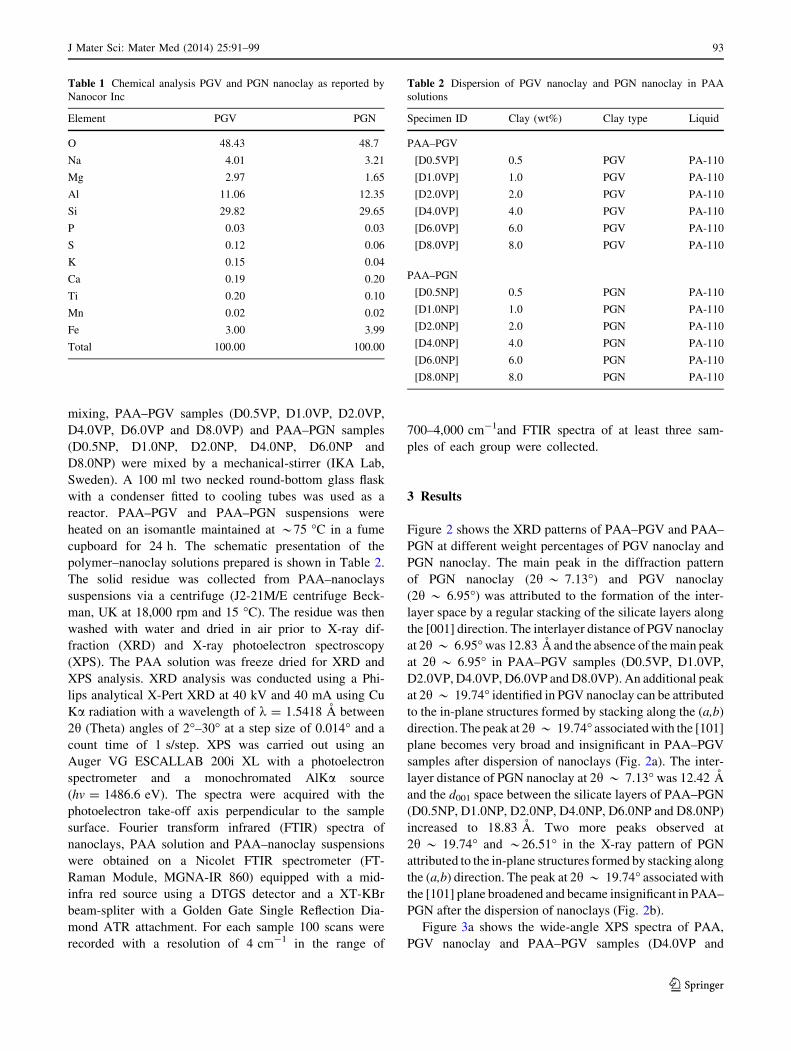
mixing, PAA–PGV samples (D0.5VP, D1.0VP, D2.0VP,
D4.0VP, D6.0VP and D8.0VP) and PAA–PGN samples
(D0.5NP, D1.0NP, D2.0NP, D4.0NP, D6.0NP and
D8.0NP) were mixed by a mechanical-stirrer (IKA Lab,
Sweden). A 100 ml two necked round-bottom glass flask
with a condenser fitted to cooling tubes was used as a
reactor. PAA–PGV and PAA–PGN suspensions were
heated on an isomantle maintained at *75 �C in a fume
cupboard for 24 h. The schematic presentation of the
polymer–nanoclay solutions prepared is shown in Table 2.
The solid residue was collected from PAA–nanoclays
suspensions via a centrifuge (J2-21M/E centrifuge Beck-
man, UK at 18,000 rpm and 15 �C). The residue was then
washed with water and dried in air prior to X-ray dif-
fraction (XRD) and X-ray photoelectron spectroscopy
(XPS). The PAA solution was freeze dried for XRD and
XPS analysis. XRD analysis was conducted using a Phi-
lips analytical X-Pert XRD at 40 kV and 40 mA using Cu
Ka radiation with a wavelength of k = 1.5418 A between
2h (Theta) angles of 2�–30� at a step size of 0.014� and a
count time of 1 s/step. XPS was carried out using an
Auger VG ESCALLAB 200i XL with a photoelectron
spectrometer and a monochromated AlKa source
(hv = 1486.6 eV). The spectra were acquired with the
photoelectron take-off axis perpendicular to the sample
surface. Fourier transform infrared (FTIR) spectra of
nanoclays, PAA solution and PAA–nanoclay suspensions
were obtained on a Nicolet FTIR spectrometer (FT-
Raman Module, MGNA-IR 860) equipped with a mid-
infra red source using a DTGS detector and a XT-KBr
beam-spliter with a Golden Gate Single Reflection Dia-
mond ATR attachment. For each sample 100 scans were
recorded with a resolution of 4 cm-1 in the range of
700–4,000 cm-1and FTIR spectra of at least three sam-
ples of each group were collected.
3 Results
Figure 2 shows the XRD patterns of PAA–PGV and PAA–
PGN at different weight percentages of PGV nanoclay and
PGN nanoclay. The main peak in the diffraction pattern
of PGN nanoclay (2h * 7.13�) and PGV nanoclay
(2h * 6.95�) was attributed to the formation of the inter-
layer space by a regular stacking of the silicate layers along
the [001] direction. The interlayer distance of PGV nanoclay
at 2h * 6.95� was 12.83 A and the absence of the main peak
at 2h * 6.95� in PAA–PGV samples (D0.5VP, D1.0VP,
D2.0VP, D4.0VP, D6.0VP and D8.0VP). An additional peak
at 2h * 19.74� identified in PGV nanoclay can be attributed
to the in-plane structures formed by stacking along the (a,b)
direction. The peak at 2h * 19.74� associated with the [101]
plane becomes very broad and insignificant in PAA–PGV
samples after dispersion of nanoclays (Fig. 2a). The inter-
layer distance of PGN nanoclay at 2h * 7.13� was 12.42 A
and the d001 space between the silicate layers of PAA–PGN
(D0.5NP, D1.0NP, D2.0NP, D4.0NP, D6.0NP and D8.0NP)
increased to 18.83 A. Two more peaks observed at
2h * 19.74� and *26.51� in the X-ray pattern of PGN
attributed to the in-plane structures formed by stacking along
the (a,b) direction. The peak at 2h * 19.74� associated with
the [101] plane broadened and became insignificant in PAA–
PGN after the dispersion of nanoclays (Fig. 2b).
Figure 3a shows the wide-angle XPS spectra of PAA,
PGV nanoclay and PAA–PGV samples (D4.0VP and
Table 1 Chemical analysis PGV and PGN nanoclay as reported by
Nanocor Inc
Element PGV PGN
O 48.43 48.7
Na 4.01 3.21
Mg 2.97 1.65
Al 11.06 12.35
Si 29.82 29.65
P 0.03 0.03
S 0.12 0.06
K 0.15 0.04
Ca 0.19 0.20
Ti 0.20 0.10
Mn 0.02 0.02
Fe 3.00 3.99
Total 100.00 100.00
Table 2 Dispersion of PGV nanoclay and PGN nanoclay in PAA
solutions
Specimen ID Clay (wt%) Clay type Liquid
PAA–PGV
[D0.5VP] 0.5 PGV PA-110
[D1.0VP] 1.0 PGV PA-110
[D2.0VP] 2.0 PGV PA-110
[D4.0VP] 4.0 PGV PA-110
[D6.0VP] 6.0 PGV PA-110
[D8.0VP] 8.0 PGV PA-110
PAA–PGN
[D0.5NP] 0.5 PGN PA-110
[D1.0NP] 1.0 PGN PA-110
[D2.0NP] 2.0 PGN PA-110
[D4.0NP] 4.0 PGN PA-110
[D6.0NP] 6.0 PGN PA-110
[D8.0NP] 8.0 PGN PA-110
J Mater Sci: Mater Med (2014) 25:91–99 93
123

D6.0VP) and Fig. 3b presents the XPS spectra of PAA,
PGN nanoclay and PAA–PGV samples (D4.0NP and
D6.0NP). In the wide scan of PGV and PGN nanoclays, the
main peak of O 1s photoelectron was attributed to various
oxygen containing species such as Si–O–M (M: Mg, Al,
Fe, etc.) within the two layers of the silicate plate, whereas
Si–O–Al linkages can be identified by the Si 2p or Si 2s
and Al 2p or Al 2s peaks. The minor peaks of Mg KLL and
Fe 2p were attributed to the presence of a small amount of
Si–O–Mg and Si–O–Fe species. The Auger Na KLL (Na
1s) photoelectron peak in nanoclays spectra was due to the
Na ions on the surface of silicate plates. The main O 1s and
C 1s peak in the wide scan of PAA was attributed to the
presence of oxygen and carbon in –COOH and C–C
groups. In the wide scan XPS of PAA–PGV (D4.0VP and
D6.0VP) and PAA–PGN (D4.0NP and D6.0NP) C 1s peak
was due to the presence of PAA whereas other peaks e.g. Si
2p, Al 2p and Fe 2p were due to the presence of nanoclays.
The Na 1s and the Na KLL peaks were not detected in the
wide scan of D4.0VP, D6.0VP, D4.0NP and D6.0NP
(Fig. 3). The high resolution narrow-angle XPS spectra of
C 1s and O 1s are shown in Fig. 4. In Fig. 4a narrow-angle
C 1s XPS spectra of PAA, the peak at 287 eV was attrib-
uted to C–C and the peak at 293 eV was attributed to
C–COOH of PAA backbone. In addition to the broadening
and shifting of the C–C peak in the C 1s spectrum of PAA–
PGV there was shifting of –COOH peak in the C 1s spectra
for both D4.0VP and D6.0NP. Specifically for the latter,
the peak is so small that it could be considered absent. The
C 1s narrow-angle scans of PAA–PGN depicted C–C and
–COOH peaks shifted towards higher binding energies.
The presence of C 1s peak at the binding energy 290 eV in
the spectrum of nanoclays was unexpected and can be
attributed to the presence of surface adventitious carbon
Fig. 2 XRD graphs of PAA–PGV and PGV nanoclay (a), and PAA–PGN and PGN nanoclay (b)
Fig. 3 Wide-angle XPS spectra of PAA, PGV nanoclays and PAA–
PGV (a), and PAA, PGN nanoclays and PAA–PGV (b)
94 J Mater Sci: Mater Med (2014) 25:91–99
123
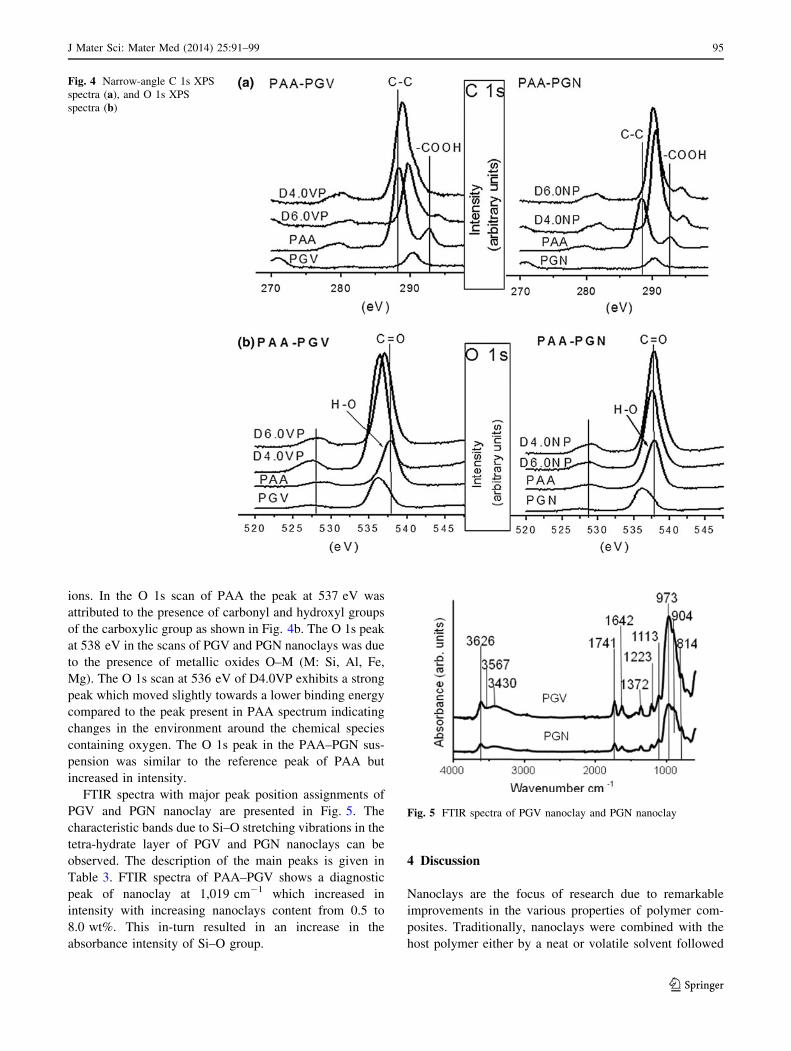
ions. In the O 1s scan of PAA the peak at 537 eV was
attributed to the presence of carbonyl and hydroxyl groups
of the carboxylic group as shown in Fig. 4b. The O 1s peak
at 538 eV in the scans of PGV and PGN nanoclays was due
to the presence of metallic oxides O–M (M: Si, Al, Fe,
Mg). The O 1s scan at 536 eV of D4.0VP exhibits a strong
peak which moved slightly towards a lower binding energy
compared to the peak present in PAA spectrum indicating
changes in the environment around the chemical species
containing oxygen. The O 1s peak in the PAA–PGN sus-
pension was similar to the reference peak of PAA but
increased in intensity.
FTIR spectra with major peak position assignments of
PGV and PGN nanoclay are presented in Fig. 5. The
characteristic bands due to Si–O stretching vibrations in the
tetra-hydrate layer of PGV and PGN nanoclays can be
observed. The description of the main peaks is given in
Table 3. FTIR spectra of PAA–PGV shows a diagnostic
peak of nanoclay at 1,019 cm-1 which increased in
intensity with increasing nanoclays content from 0.5 to
8.0 wt%. This in-turn resulted in an increase in the
absorbance intensity of Si–O group.
4 Discussion
Nanoclays are the focus of research due to remarkable
improvements in the various properties of polymer com-
posites. Traditionally, nanoclays were combined with the
host polymer either by a neat or volatile solvent followed
Fig. 4 Narrow-angle C 1s XPS
spectra (a), and O 1s XPS
spectra (b)
Fig. 5 FTIR spectra of PGV nanoclay and PGN nanoclay
J Mater Sci: Mater Med (2014) 25:91–99 95
123

by extensive mechanical mixing of nanoclay-solvent and a
polymer employing high-shear mixer or 3-roll-mill for
liquid resin, as well as the Brabender mixer for viscous
resin or twin extruder for solid resin [20]. PGV and PGN
nanoclay were shear-mixed in PAA solution at 75 �C for
24 h. The use of high-speed mixing may cause the break-
age of nanoclay sheets and reduced the aspect ratio for
better polymer–nanoclay interactions. Tran et al. reported a
similar technique and suggested that mixing of nanoclays
with polymer resulted in the formation of silicate (Si–O–
M) or silica (Si–O–Si) nano-plates [21]. Previous studies
on PAA–nanoclay interactions [12, 18, 22] showed that
increasing the temperature results in better exfoliation of
nanoclays within polymer matrix. When mixing of poly-
mer–nanoclays takes place at 75 �C, the polymer chains
possibly extend the silicate layers until a thermodynamic
equilibrium is reached between the polymer and the higher
surface energy of silicate-plates of nanoclay. Ngo et al.
studied the effects of temperature, speed, and duration of
mixing on the dispersion of nanoclays (e.g., cloisites) in
epoxy resin and reported that the effect of mixing speed
was more evident than the mixing temperature in terms of
nanoclays dispersion [23]. However, the charge density of
silicate layers, nature of the interlayer exchanged ions;
curing conditions as well as the chemistry of the polymer
determine the intercalation or the exfoliation.
The PAA–nanoclay interaction was identified by a shift
of the XRD diffraction peaks towards lower angle values in
comparison with the original interlayer spacing of PGV
and PGN. It showed that PAA–PGV were exfoliated while
PAA–PGN were intercalated (Fig. 2). The increase in the
interlayer distance was due to the adsorption and segre-
gation of PAA chains into the interlayer space. The lack of
d001 peak in the XRD pattern of PAA–PGV indicates ex-
foliation of PGV in PAA though there is a possibility that
the [001] diffraction peak may have moved to a lower
angle which was not in the detectable range at 2h * 3.5�.
In PAA–PGN samples, the shifting of 2h values to a lower
angle indicates intercalation due to the small increase in the
interlayer space. In PAA–PGN samples it is clear that by
increasing PGN nanoclay content from 0.5 to 8.0 wt% did
not influenced the interlayer space between the silicate
plates of PGN and the d001 peak was present at the similar
2h values for all samples. In intercalated nanoclays, the
interlayer space increased due to the adsorbed PAA chains
on the surface of PGN nanoclay. The XRD graph showed a
broad peak shifted to lower angles associated with the out-
of plane direction of the silicate plates [17]. Similarly, the
XRD pattern of fully exfoliated nanoclays did not exhibit
the d001 peak at low angle values. On the basis of XRD
results, it is evident that in PAA–PGN one or more polymer
chains might have penetrated in between the silicate plates
of PGN and the lamellar structure of nanoclays remained
intact resulting in intercalation. On the other hand, the
separation and random orientation of the silicate plates in
PAA–PGV suggested exfoliation of nanoclays. Further-
more, during the interaction of the hydrophilic nanoclay
platelet with PAA, their natural interstitial metal cations
(K?, Na?, Li?, Mg2?, Ca2?, etc.) were exchanged with
protons and/or released within the organic PAA solution
[22]. A possible exchange of Na? ions by H? ions can form
surface hydroxyl groups leading to hydrogen bonding with
Fig. 6 FTIR spectra of PAA and PAA–PGV after dispersion in PAA
solutions
Table 3 Description of FTIR peaks present in spectra shown in
Figs. 5 and 6
Wavenumber (cm-1) Assignment
Nanoclay
3,626 Si–OH stretching vibrations
1,741 H–O–H bending vibration
1,642 H–O–H bending vibration
973 Si–O stretching vibration
904 Al–OH stretching vibration
814 (Al, Mg)–OH vibration mode
797 Si–O–Al vibration
527 Al(Mg)–O–Si
480 Si–O stretching vibration
PAA–nanoclay
3,354 H bonded O–H stretching vibration
1,705 C=O stretching vibration
1,642 C–O vibration
1,642 H–O–H bending vibration
1,453 C–H bending vibration
1,266 C–O stretching vibration
1,019 Si–O stretching vibration
96 J Mater Sci: Mater Med (2014) 25:91–99
123
the carboxyl groups in PAA. This cations exchange created
more organophilic galleries within nanoclays thereby
increasing the d-spacing and simultaneously reducing the
attractive forces between the platelets [17]. Therefore, at
the nanometre scale PAA intercalated more readily and
further expanded the d-spacing in nanoclays for efficient
nanoclay dispersion into the polymer solution.
XPS provided the detailed information about structure
of the materials and specifically the chemical interactions.
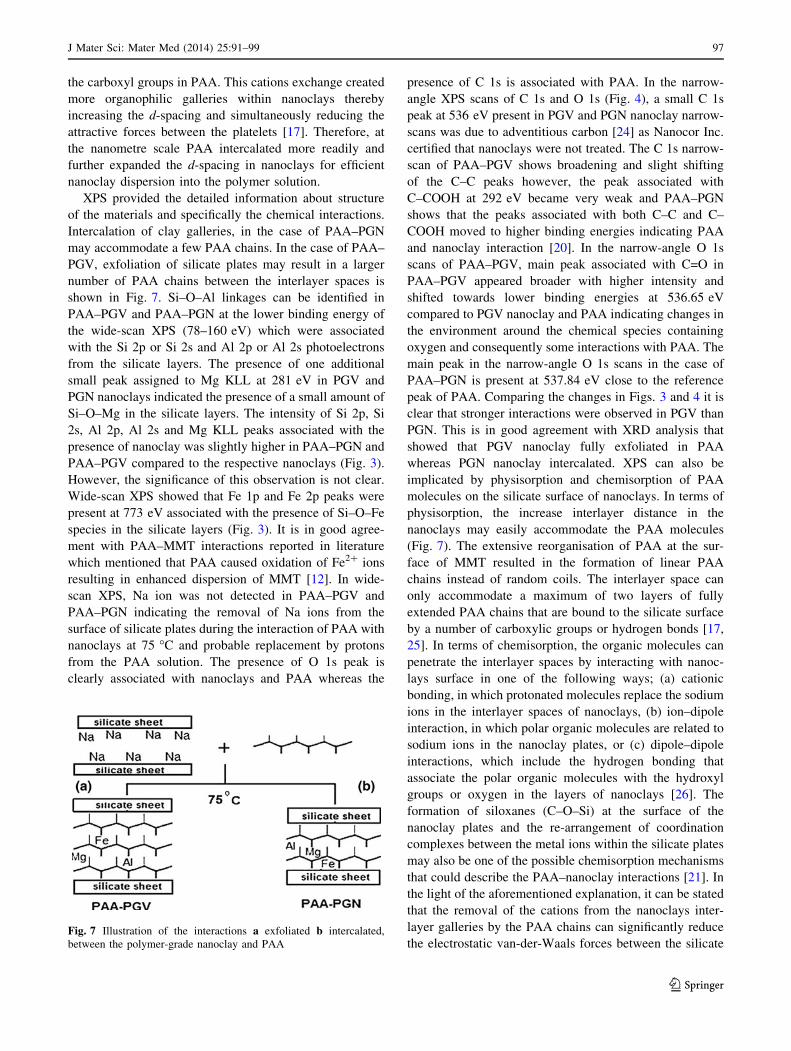
Intercalation of clay galleries, in the case of PAA–PGN
may accommodate a few PAA chains. In the case of PAA–
PGV, exfoliation of silicate plates may result in a larger
number of PAA chains between the interlayer spaces is
shown in Fig. 7. Si–O–Al linkages can be identified in
PAA–PGV and PAA–PGN at the lower binding energy of
the wide-scan XPS (78–160 eV) which were associated
with the Si 2p or Si 2s and Al 2p or Al 2s photoelectrons
from the silicate layers. The presence of one additional
small peak assigned to Mg KLL at 281 eV in PGV and
PGN nanoclays indicated the presence of a small amount of
Si–O–Mg in the silicate layers. The intensity of Si 2p, Si
2s, Al 2p, Al 2s and Mg KLL peaks associated with the
presence of nanoclay was slightly higher in PAA–PGN and
PAA–PGV compared to the respective nanoclays (Fig. 3).
However, the significance of this observation is not clear.
Wide-scan XPS showed that Fe 1p and Fe 2p peaks were
present at 773 eV associated with the presence of Si–O–Fe
species in the silicate layers (Fig. 3). It is in good agree-
ment with PAA–MMT interactions reported in literature
which mentioned that PAA caused oxidation of Fe2? ions
resulting in enhanced dispersion of MMT [12]. In wide-
scan XPS, Na ion was not detected in PAA–PGV and
PAA–PGN indicating the removal of Na ions from the
surface of silicate plates during the interaction of PAA with
nanoclays at 75 �C and probable replacement by protons
from the PAA solution. The presence of O 1s peak is
clearly associated with nanoclays and PAA whereas the
presence of C 1s is associated with PAA. In the narrow-
angle XPS scans of C 1s and O 1s (Fig. 4), a small C 1s
peak at 536 eV present in PGV and PGN nanoclay narrow-
scans was due to adventitious carbon [24] as Nanocor Inc.
certified that nanoclays were not treated. The C 1s narrow-
scan of PAA–PGV shows broadening and slight shifting
of the C–C peaks however, the peak associated with
C–COOH at 292 eV became very weak and PAA–PGN
shows that the peaks associated with both C–C and C–
COOH moved to higher binding energies indicating PAA
and nanoclay interaction [20]. In the narrow-angle O 1s
scans of PAA–PGV, main peak associated with C=O in
PAA–PGV appeared broader with higher intensity and
shifted towards lower binding energies at 536.65 eV
compared to PGV nanoclay and PAA indicating changes in
the environment around the chemical species containing
oxygen and consequently some interactions with PAA. The
main peak in the narrow-angle O 1s scans in the case of
PAA–PGN is present at 537.84 eV close to the reference
peak of PAA. Comparing the changes in Figs. 3 and 4 it is
clear that stronger interactions were observed in PGV than
PGN. This is in good agreement with XRD analysis that
showed that PGV nanoclay fully exfoliated in PAA
whereas PGN nanoclay intercalated. XPS can also be
implicated by physisorption and chemisorption of PAA
molecules on the silicate surface of nanoclays. In terms of
physisorption, the increase interlayer distance in the
nanoclays may easily accommodate the PAA molecules
(Fig. 7). The extensive reorganisation of PAA at the sur-
face of MMT resulted in the formation of linear PAA
chains instead of random coils. The interlayer space can
only accommodate a maximum of two layers of fully
extended PAA chains that are bound to the silicate surface
by a number of carboxylic groups or hydrogen bonds [17,
25]. In terms of chemisorption, the organic molecules can
penetrate the interlayer spaces by interacting with nanoc-
lays surface in one of the following ways; (a) cationic
bonding, in which protonated molecules replace the sodium
ions in the interlayer spaces of nanoclays, (b) ion–dipole
interaction, in which polar organic molecules are related to
sodium ions in the nanoclay plates, or (c) dipole–dipole
interactions, which include the hydrogen bonding that
associate the polar organic molecules with the hydroxyl
groups or oxygen in the layers of nanoclays [26]. The
formation of siloxanes (C–O–Si) at the surface of the
nanoclay plates and the re-arrangement of coordination
complexes between the metal ions within the silicate plates
may also be one of the possible chemisorption mechanisms
that could describe the PAA–nanoclay interactions [21]. In
the light of the aforementioned explanation, it can be stated
that the removal of the cations from the nanoclays inter-
layer galleries by the PAA chains can significantly reduce
the electrostatic van-der-Waals forces between the silicateFig. 7 Illustration of the interactions a exfoliated b intercalated,
between the polymer-grade nanoclay and PAA
J Mater Sci: Mater Med (2014) 25:91–99 97
123

plates. Additionally, the steric effect created by the PAA
chains on the silicon plates may also prevent the face-to-
face interaction of nanoclay plates, which resulted in
intercalation or exfoliation. The detailed analysis of the
peaks at lower binding energy using narrow-angle XPS
would be interesting in order to study the influence of
cations in the chemisorption of nanoclay and PAA.
In the FTIR studies of nanoclays, –OH and Si–O groups
play an important role in the differentiation of nanoclays
from each other and from the host polymer. FTIR spectra
of PGV and PGN nanoclay showed characteristic bands at
3,626 cm-1 due to O–H stretching vibrations, at
1,642 cm-1 due to H–O–H bending vibrations and at
973 cm-1 due to Si–O stretching vibrations. The sharp
peak centred at 973 cm -1 in PGV and PGN nanoclay was
attributed to the distinctive nanoplates of the tetra-hydrate
layers of silicon. The absorbance at 3,620 cm-1 in the
spectrum of PGV and PGN is typical for montmorillonite
with high Al content in the octahedral layer of nanoclay. In
2:1 family of smectite montmorillonite, the main peak at
3,620 cm-1 is associated with the high Al content in the
octahedral layer, whereas any peak at around 3,567 cm-1
is associated with the Fe2OH groups in the octahedral
sheets in Fe rich nontronites [27]. However, in our case,
this peak was not present in any of the nanoclays spectra
and therefore, it is well confirmed that the clays belong to a
typical high aluminium content type of montmorillonites.
Despite the fact that PGN contains a higher amount of Fe
than PGV (Table 1), the peak that corresponds to the
Fe2OH group was missing from both nanoclays spectra. A
broad band near 3,430 cm-1 observed in both nanoclays
was due to the H–O–H vibration of adsorbed water but this
band was less prominent in PGN nanoclays. FTIR spectra
PAA–PGV shows the absorbance intensity of the peak
observed at 1,019 cm-1 associated with Si–O– stretching
vibrations increased with increasing the clay loading,
irrespective of the type of the clay used (Fig. 6). It is
noticeable that the Si–O vibrations band present in PGV
nanoclays at 973 cm-1 moved to higher wavenumbers at
1,019 cm-1 in PAA–PGV. The shift of the peak at
973 cm-1 associated with Si–O– stretching vibrations can
be due to the change of the chemical environment indi-
cating a strong interaction between the silicate plates of
PGV and PAA. Madejova et al. reported that the acid
attack (HCl) on nanoclay lead to the successive release of
the central atoms from the octahedral layer and the release
of Al from the Si tetrahedral sheets from dioctahedral
smectites and hectorite clay [28]. In the case of PAA which
is a weak acid compared to HCl, it can be suggested that
the protons from the –COOH groups may enter the nano-
clay layers and attack the structural –OH groups resulting
in de-hydroxylation of nanoplates is connected with the
successive release of the central atoms. This can be readily
followed by observing the changes in the characteristic
absorption bands attributed to the vibration of –OH groups
(3,626, 1,642 and 904 cm-1) and octahedral cations
(814 cm-1). In addition, a gradual transformation of the
tetrahedral sheets to protonated amorphous silica can also
be observed in the region of the stretching vibrations of the
Si–O groups at 973 cm-1 which shifted to 1,019 cm-1
with a simultaneous increase in absorbance indicating
interaction of silicate nanoplates in PGV. A diagnostic
peak of nanoclay at 1,019 cm-1 increased in intensity with
increasing the nanoclays content in the polymer–nanoclay
solutions. It is clear that increasing the of nanoclay con-
tents from 0.5 to 8.0 wt% resulted in an increase in the
absorbance intensity of Si–O group at 1,019 cm-1 (Fig. 6).
The shift of the Si–O stretching vibrations from 973 cm-1
in nanoclays to 1,019 cm-1 in nanoclay–PAA solutions
could be an indication of the PAA interaction with the
silicate nanoplates and specifically the formation of an
amorphous silica gel layer on the surface of nanoclays after
PAA attack [29]. A smaller shoulder at 1,086 cm-1 in the
spectra of PAA–PGV especially at contents higher than
2.0 wt% PGV unfortunately could not be identified but it
could be connected with Si–O stretching vibrations. The
peaks associated with the carboxylic group were present at
1,705 cm-1 and at 1,629 cm-1 attributed to the C=O
stretching vibrations and –OH bending vibrations in the
carboxylic group, respectively. The changes in the intensity
of the peaks at 1,629 and 1,705 cm-1 associated with the
carboxylic groups in PAA–PGV may suggest the interac-
tion of protons from PAA with the PGV nanoclay [29].
Furthermore, a significant broadening and decrease in
intensity of the peak associated with C–O stretching
vibrations in PAA at 1,266 cm-1 was observed in the
spectra of D4.0VP, D6.0VP and D8.0VP with the increase
in the nanoclays content. It is not clear, however why an
increase in nanoclays content would have an effect on C–O
stretching . The FTIR spectra of nanoclays and PAA–
nanoclay support the observations of XRD and XPS on the
interactions observed between the nanoclays and PAA.
The mixing of nanoclay with PAA resulted in formation
of exfoliated/intercalated nanoplates of silicates (Si–O–M,
M = Al, Mg etc.) and/or silica (Si–O–Si) when dispersed
in the liquid phase. The increase in the interlayer distance
was due to the adsorption and segregation of PAA chains
into nanoclay gallery or interlayer space. According to the
FTIR and XPS results a chemical bonding at the interface
between PAA matrix and nanoclay is present because
silicon in nanoclay reacted with PAA by carbon and
oxygen, also depletion of sodium ions at the silicate
surface of nanoclay. Therefore, it is revealed that carbon,
silicon and oxygen peak shift are principally due to
chemical (ionic or hydrogen) bonding between PAA and
nanoclays.
98 J Mater Sci: Mater Med (2014) 25:91–99
123
5 Conclusions
The reinforcing capability of nanoclays is due to their high
modulus, high strength and high aspect ratio. PAA–nanoclay
interactions were observed when PGV–nanoclay and PGN–
nanoclay dispersed in the PAA following a suitable pro-
cessing method. It is suggested, that during the PAA–PGN
interactions, one or more polymer chains penetrated in
between the silicate plates of PGN whereas the lamellar
structures of nanoclays remained intact resulting in interca-
lation. On the other hand, the PAA–PGV interaction resulted
in the separation and random orientation of the silicate plates
in nanoclays indicating exfoliation of nanoclays. The dis-
persion of nanoclays and the reinforcement effect of the
dispersed nanoclays were possibly associated with the
chemisorption and physisorption of PAA on the silicate
nanoplates resulted in increasing the interlayer space due to
the segregation and adsorption of PAA molecules in the
interlayer space. The interaction of PAA molecules onto
silicate plates of PGV may be due to possible exchange of
sodium ions by hydrogen ions that leads to the formation of
hydroxyl groups which can form hydrogen bonds with the
carbonyl groups of PAA. The present approach may be
useful to study the potential of the reinforcement of nanoclay.
Acknowledgments The authors gratefully acknowledge the PhD
studentship from School of Metallurgy and Materials, University of
Birmingham and financial assistance from Higher Education Com-
mission Pakistan toward this research work. We also thank Nanocor
and BASF for munificent supply of experimental materials.
References
1. Alexandre M, Dubois P. Polymer-layered silicate nanocompos-
ites: preparation, properties and uses of a new class of materials.
Mater Sci Eng R Rep. 2000;28:1–63.
2. Yoonessi M, Toghiani H, Kingery WL, Pittman CU. Preparation,
characterization, and properties of exfoliated/delaminated
organically modified clay/dicyclopentadiene resin nanocompos-
ites. Macromolecules. 2004;37:2511–8.
3. Usuki A, Kojima Y, Kawasumi M, Okada A, Fukushima Y,
Kurauchi T, et al. Synthesis of nylon 6-clay hybrid. J Mater Res.
1993;8:1179–84.
4. Vaia RA, Jandt KD, Kramer EJ, Giannelis EP. Kinetics of
polymer melt intercalation. Macromolecules. 1995;28:8080–5.
5. Biasci L, Aglietto M, Ruggeri G, Ciardelli F. Functionalization of
montmorillonite by methyl methacrylate polymers containing
side-chain ammonium cations. Polymer. 1994;35:3296–304.
6. Kojima Y, Usuki A, Kawasumi M, Okada A, Kurauchi T, Ka-
migaito O. Synthesis of nylon 6-clay hybrid by montmorillonite
intercalated with ?A-caprolactam. J Polym Sci. 1993;31:983–6.
7. Jeon HG, Jung H-T, Lee SW, Hudson SD. Morphology of
polymer/silicate nanocomposites: high density polyethylene and a
nitrile copolymer. Polym Bull. 1998;41:107–13.
8. Wang Z, Pinnavaia TJ. Nanolayer reinforcement of elastomeric
polyurethane. Chem Mater. 1998;10:3769–71.
9. Fedullo N, Sorlier E, Sclavons M, Bailly C, Lefebvre JM, Devaux
J. Polymer-based nanocomposites: overview, applications and
perspectives. Prog Org Coat. 2007;58:87–95.
10. Gunister E, Pestreli D, Unlu CH, Atici O, Gungor N. Synthesis
and characterization of chitosan–MMT biocomposite systems.
Carbohydr Polym. 2007;67:358–65.
11. Depan D, Kumar AP, Singh RP. Preparation and characterization
of novel hybrid of chitosan-g-lactic acid and montmorillonite.
J Biomed Mater Res. 2006;78:372–82.
12. Tran NH, Wilson MA, Milev AS, Dennis GR, Kannangara GSK,
Lamb RN. Dispersion of silicate nano-plates within poly(acrylic
acid) and their interfacial interactions. Sci Technol Adv Mater.
2006;7:786–91.
13. Billingham J, Breen C, Yarwood J. Adsorption of polyamine,
polyacrylic acid and polyethylene glycol on montmorillonite: an
in situ study using ATR-FTIR. Vib Spectrosc. 1997;14:19–34.
14. G-105 Polymer grade montmorillonite, Product Sheet, Nanocor,
Inc., Arlington Heights, IL 6004 USA. http://www.nanocor.com/
tech_sheets/G105.pdf (2006). Accessed 05 May 2006.
15. Wilson AD, McLean JW. Glass-ionomer cement. Chicago:
Quintessence; 1988.
16. Moshaverinia A, Rohpoor N, Darr JA, Rehman IU. Synthesis and
characterization of a novel N-vinylcaprolactam-containing
acrylic acid terpolymer for applications in glass-ionomer cement.
Acta Biomater. 2009;5:2101–8.
17. Tran NH, Dennis GR, Milev AS, Kannangara GSK, Wilson MA,
Lamb RN. Interactions of sodium montmorillonite with poly
(acrylic acid). J Colloid Interface Sci. 2005;290:392–6.
18. Solhi L, Atai M, Nodehi A, Imani M, Ghaemi A, Khosravi K.
Poly (acrylic acid) grafted montmorillonte as novel fillers for
dental adhesives: synthesis, characterization and properties. Dent
Mater. 2012;28:369–77.
19. Dowling AH, Stamboulis A, Fleming GJP. The influence of
montmorillonite clay reinforcement on the performance of a glass
ionomer restorative. J Dent. 2006;34:802–10.
20. Koo JH. Polymer nanocomposites processing, characterization
and application. USA: McGraw-Hill Companies Inc; 2006.
21. Tran NH, Wilson MA, Milev AS, Dennis GR, McCutcheon AL,
Kannangara GSK, et al. Structural–chemical evolution within
exfoliated clays. Langmuir. 2006;22:6696–700.
22. Lin J, Wu J, Yang Z, Pu M. Synthesis and properties of poly
(acrylic acid)/mica superabsorbent nanocomposite. Macromol
Rapid Commun. 2001;22:422–4.
23. Ngo TD, Ton-That MT, Hoa SV, Cole KC. Effect of temperature,
duration and speed of pre-mixing on the dispersion of clay/epoxy
nanocomposites. Compos Sci Technol. 2009;69:1831–40.
24. Miller ML, Linton RW. X-ray photoelectron spectroscopy of
thermally treated SiO2 surfaces. Anal Chem. 1985;57:2314–9.
25. Taylor TJ, Stivala SS. Small-angle X-ray scattering study
of a weak polyelectrolyte in water. J Polym Sci. 2003;41:
1263–72.
26. Choi YS, Ham HT, Chung IJ. Effect of monomers on the basal
spacing of sodium montmorillonite and the structures of polymer-
clay nanocomposites. Chem Mater. 2004;16:2522–9.
27. Madejova J. FTIR techniques in clay mineral studies. Vib
Spectrosc. 2003;31:1–10.
28. Madejova J, Bujdak J, Janek M, Komadel P. Comparative FT-IR
study of structural modifications during acid treatment of dioc-
tahedral smectites and hectorite. Spectrochim Acta. 1998;54:
1397–406.
29. Feng B, Hong RY, Wu YJ, Liu GH, Zhong LH, Zheng Y, et al.
Synthesis of monodisperse magnetite nanoparticles via chitosan-
poly(acrylic acid) template and their application in MRI. J Alloy
Compd. 2009;473:356–62.
J Mater Sci: Mater Med (2014) 25:91–99 99
123